Article

Monitoring and Assessment of Drought Focused on Its Impact on Sorghum Yield over Sudan by Using Meteorological Drought Indices for the Period 2001–2011

by
Khalid. M. Elhag
1,2 and
Wanchang Zhang
1,*
1
Key Laboratory of Digital Earth, Institute of Remote Sensing and Digital Earth, Chinese Academy of Sciences, No.9 Dengzhuang South Road, Haidian District, Beijing 100094, China
2
University of Chinese Academy of Sciences, Beijing 100049, China
*
Author to whom correspondence should be addressed.
Submission received: 29 June 2018 / Revised: 22 July 2018 / Accepted: 2 August 2018 / Published: 6 August 2018
(This article belongs to the Special Issue Remote Sensing of Drought Monitoring)

Abstract

:
Currently, the high-resolution satellite images in near real-time have gained more popularity for natural disaster detection due to the unavailability and difficulty of acquiring frequent ground observation data over a wide region. In Sudan, the occurrence of drought events is a predominant natural disaster that causes substantial damages to crop production. Therefore, monitoring drought and measuring its impact on the agricultural sector remain major concerns of policymakers. The current study focused on assessing and analyzing drought characteristics based on two meteorological drought indices, namely the Standardized Precipitation Index (SPI) and the Drought Severity Index (DSI), and inferred the impact of drought on sorghum productivity in Sudan from 2001 to 2011. To identify the wet and dry areas, the deviations of tropical rainfall measuring mission (TRMM) precipitation products from the long-term mean from 2001 to 2011 were computed and mapped at a seasonal scale (July–October). Our findings indicated that the dry condition fluctuated over the whole of Sudan at various temporal and spatial scales. The DSI results showed that both the Kordofan and Darfur regions were affected by drought in the period 2001–2005, whereas most regions were affected by drought from 2008 to 2011. The spatial correlation between DSI, SPI-3, and TRMM precipitation products illustrated a significant positive correlation in agricultural lands and negative correlation in mountainous areas. The relationship between DSI and the Standardized variable of crop yield (St. Y) for sorghum yield was also investigated over two main agricultural regions (Central and Eastern regions) for the period 2001–2011, which revealed a good agreement between them, and a huge drop of sorghum yield also occurred in 2008–2011, corresponding to extreme drought indicated by DSI. The present study indicated that DSI can be used for agricultural drought monitoring and served as an alternative indicator for the estimation of crop yield over Sudan in some levels.

Graphical Abstract

1. Introduction

Drought is a common and recurring natural disaster phenomenon that significantly impacts the agriculture and socioeconomic sectors in Sudan. Recently published studies have revealed that drought has caused a substantial decrease in global ecosystem productivity [1]. Droughts develop and intensify over longer periods of time. Conditions are termed as drought conditions when the water resources are depleted to a level that they can no longer sustain the regional demand. Since water has an integral role in the day to day life of humans, shortages affect different aspects of anthropogenic life [2]. In general, droughts are classified into four different categories: meteorological, agricultural, hydrological, and socioeconomic drought [3]. Meteorological drought occurs due to the reduction in precipitation over a region and agricultural drought happens at a critical time during the growing season due to soil moisture deficit, whereas hydrological drought takes place as a result of a shortage of stream flow and reduction in groundwater. Socioeconomic drought is the negative effects of forementioned physical conditions on aspects of the lives of the human population, such as increments in prices of goods and population dislocation [3,4].
Agricultural droughts are water shortages that lead to a drop in crop productivity. Globally, drought reduced the crop yield by about 10% from 1964–2007 [5]. The agricultural productivity damage caused by drought is more than other common disasters. Due to the creeping onset and long duration of droughts, the damage to agricultural productivity is more severe compared to other hazards [6,7]. The Inter-governmental Panel of Climate Change (IPCC) has projected a significant drop in crop productivity in the Sub-Saharan countries, making the already worse food security condition even direr. It is also expected that climate change will further intensify these conditions, by increasing the return frequency of droughts, mainly due to fluctuations in annual precipitation [8,9,10,11,12].
Agricultural drought indices based on remotely sensed data are popular due to the availability of the synoptic coverage of satellite remote sensing data. Although drought is a complicated natural phenomenon, it can be monitored and simulated by a simplified drought index, which is an individual quantitative number for assimilating a huge amount of environmental data [13]. A large variety of indices have been proposed that have allowed researchers to detect anomalies in the intensity, continuity, and spatial extent of droughts. These indices also simplify the communication of valuable information to the managers and policymakers for necessary actions. Various drought indexes for various classes of droughts have been established to monitor and simulate multiple drought statuses at a local and global scale [13,14]. Satellite platforms allow for the acquisition of frequent, and in recent times, high-resolution, near real-time spatial data, which was not possible before. Theoretically, the drought indices based on remote sensing data have been divided into four main categories [15]. Firstly, the indexes are used to monitor vegetation conditions, which are based on reflective data such as the vegetation condition index (VCI). This index was used to estimate the impacts of drought on vegetation [16,17]. Secondly, the indices are employed to monitor and assess environmental conditions based on thermal data such as the temperature condition index (TCI), which is utilized to determine temperature-related vegetation stress [17,18]. Thirdly, drought indices involving soil moisture information were mainly based on microwave remotely sensed soil moisture information, such as the Microwave Integrated Drought Index (MIDI) [19] and the Standardized Soil Moisture Index (SSI) [20], and the Soil Moisture Agricultural Drought Index (SMADI) [21]. Lastly, the environmental stress monitoring indexes are based on the combination of thermal and reflective data, such as the vegetation health index (VHI) [22].
In last seventeen years, many indices for drought detection have been extracted and developed from the Moderate Resolution Imaging Spectroradiometer (MODIS) dataset products, such as the Normalized Difference Drought Index (NDDI) [23] and Vegetation Drought Index (VDI) [24]. Many other drought indices that have been developed, for example, the Drought Severity Index (DSI), are also derived from MODIS, in order to detect and monitor global drought events [25]. This index combines the sensitivity of the ratio between evapotranspiration (ET) and potential evapotranspiration (PET) with NDVI using the simplicity of basic mathematic calculations. The MODIS ET product has shown excellent results in several studies and is in proper validation with daily ET estimations based on tower eddy covariance measurements on a worldwide scale [26]. The ratio of ET/PET can be used as a good indicator for soil moisture [27]. The recent trends in the development of crop production are well explained by rising evapotranspiration (ET) and potential evapotranspiration (PET) [2,28]. The Normalized Difference Vegetation Index (NDVI) likely reflects vegetation responses to dryness conditions [29]. Recently, Zribi et al. (2016) proposed the Vegetation Anomaly Index (VAI) derived from SOPT–VGT and TERRA–MODIS NDVI products to monitor agricultural drought in North Africa [30,31].
Drought is a recurring phenomenon in Sudan, as mentioned earlier. For instance, in 1984, drought caused crop production shortages. Due to this, around 55 thousand people died and the country suffered socio-economic capacity loss, particularly of nomadic tribes that are heavily dependent on local agro-ecosystem services [32]. Similarly, according to the Famine Early Warning Systems Network (FEWS–NET) report, in 2010, around eight million people faced moderate to high levels of food insecurity in Sudan [33]. Globally, there are limited studies available on DSI application. However, no study has yet investigated the agricultural drought of Sudan using DSI. Moreover, most of the drought studies in Sudan used traditional meteorological indexes, and these indices only demonstrated the station-based drought levels [34]. Therefore, this research was conducted with the following specific objectives: firstly, to analyze the severity, duration, and extent of drought using SPI and DSI; secondly, to estimate the capability of DSI for growing season using TRMM precipitation data products and SPI; thirdly, to produce the spatial maps for drought extent at a seasonal and annual scale from 2001 to 2011 using DSI; and finally, to infer the influence of drought on Sorghum yield by using DSI and St. Y.

2. Materials and Methods

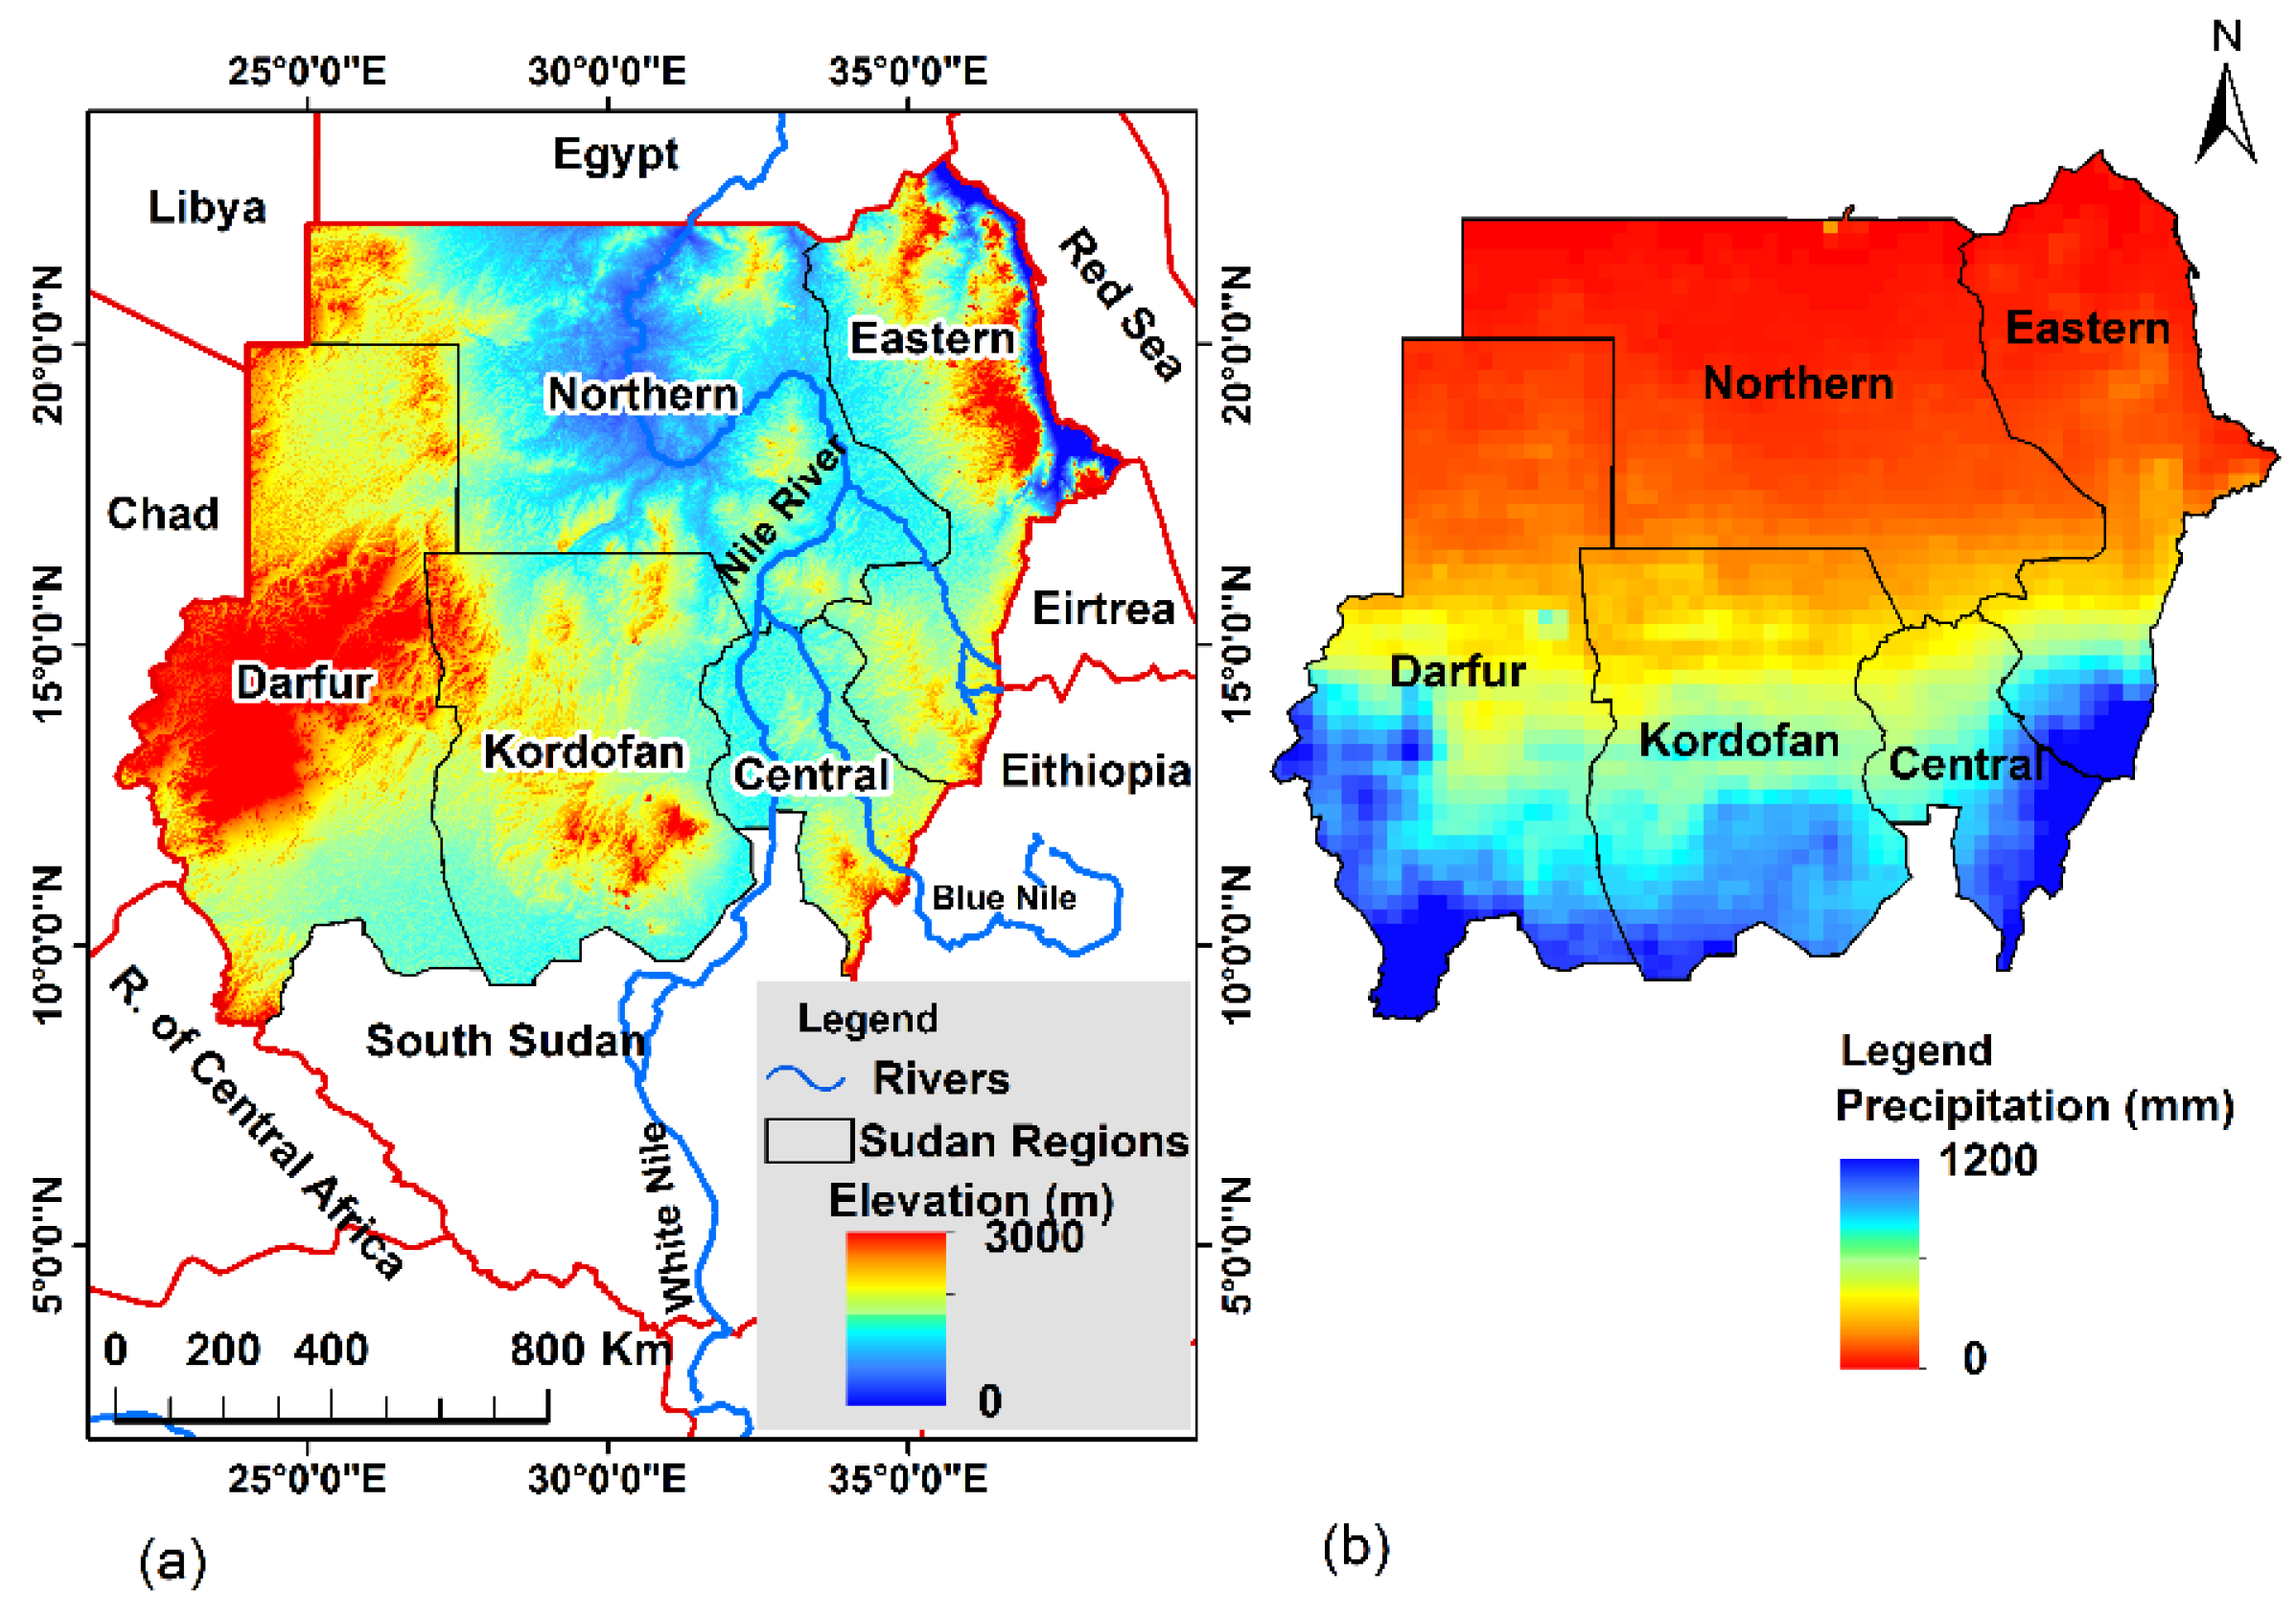
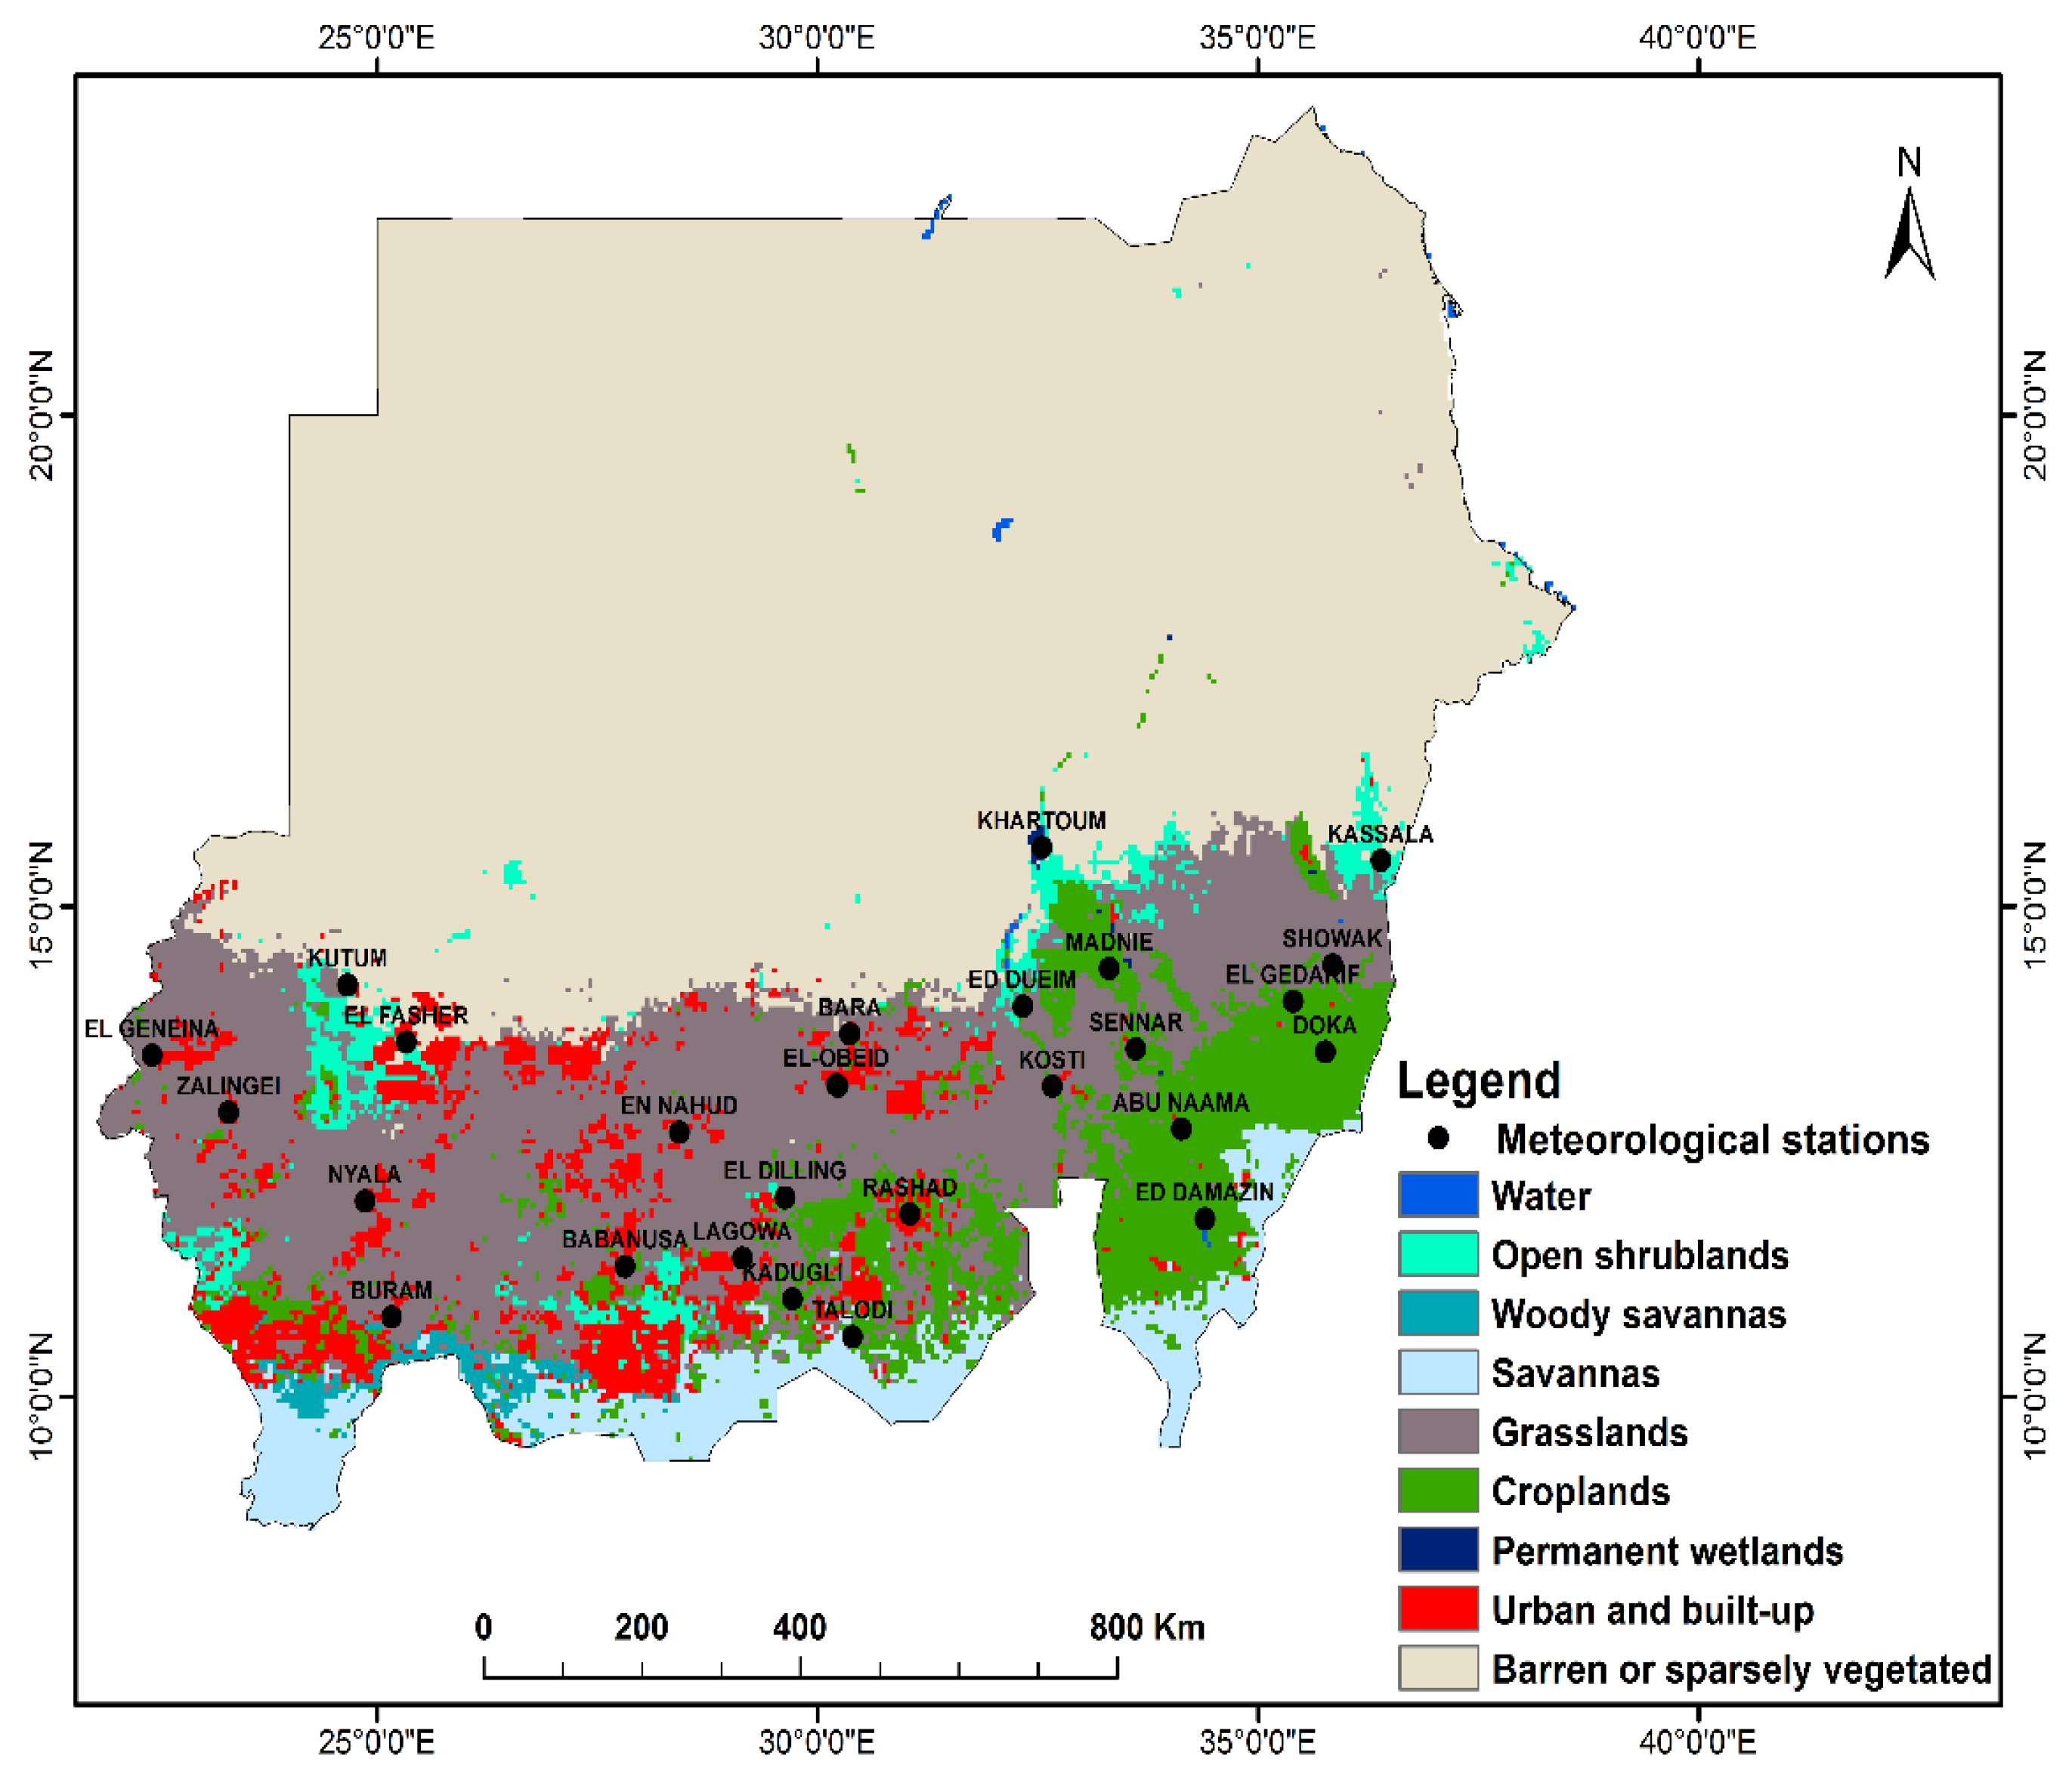
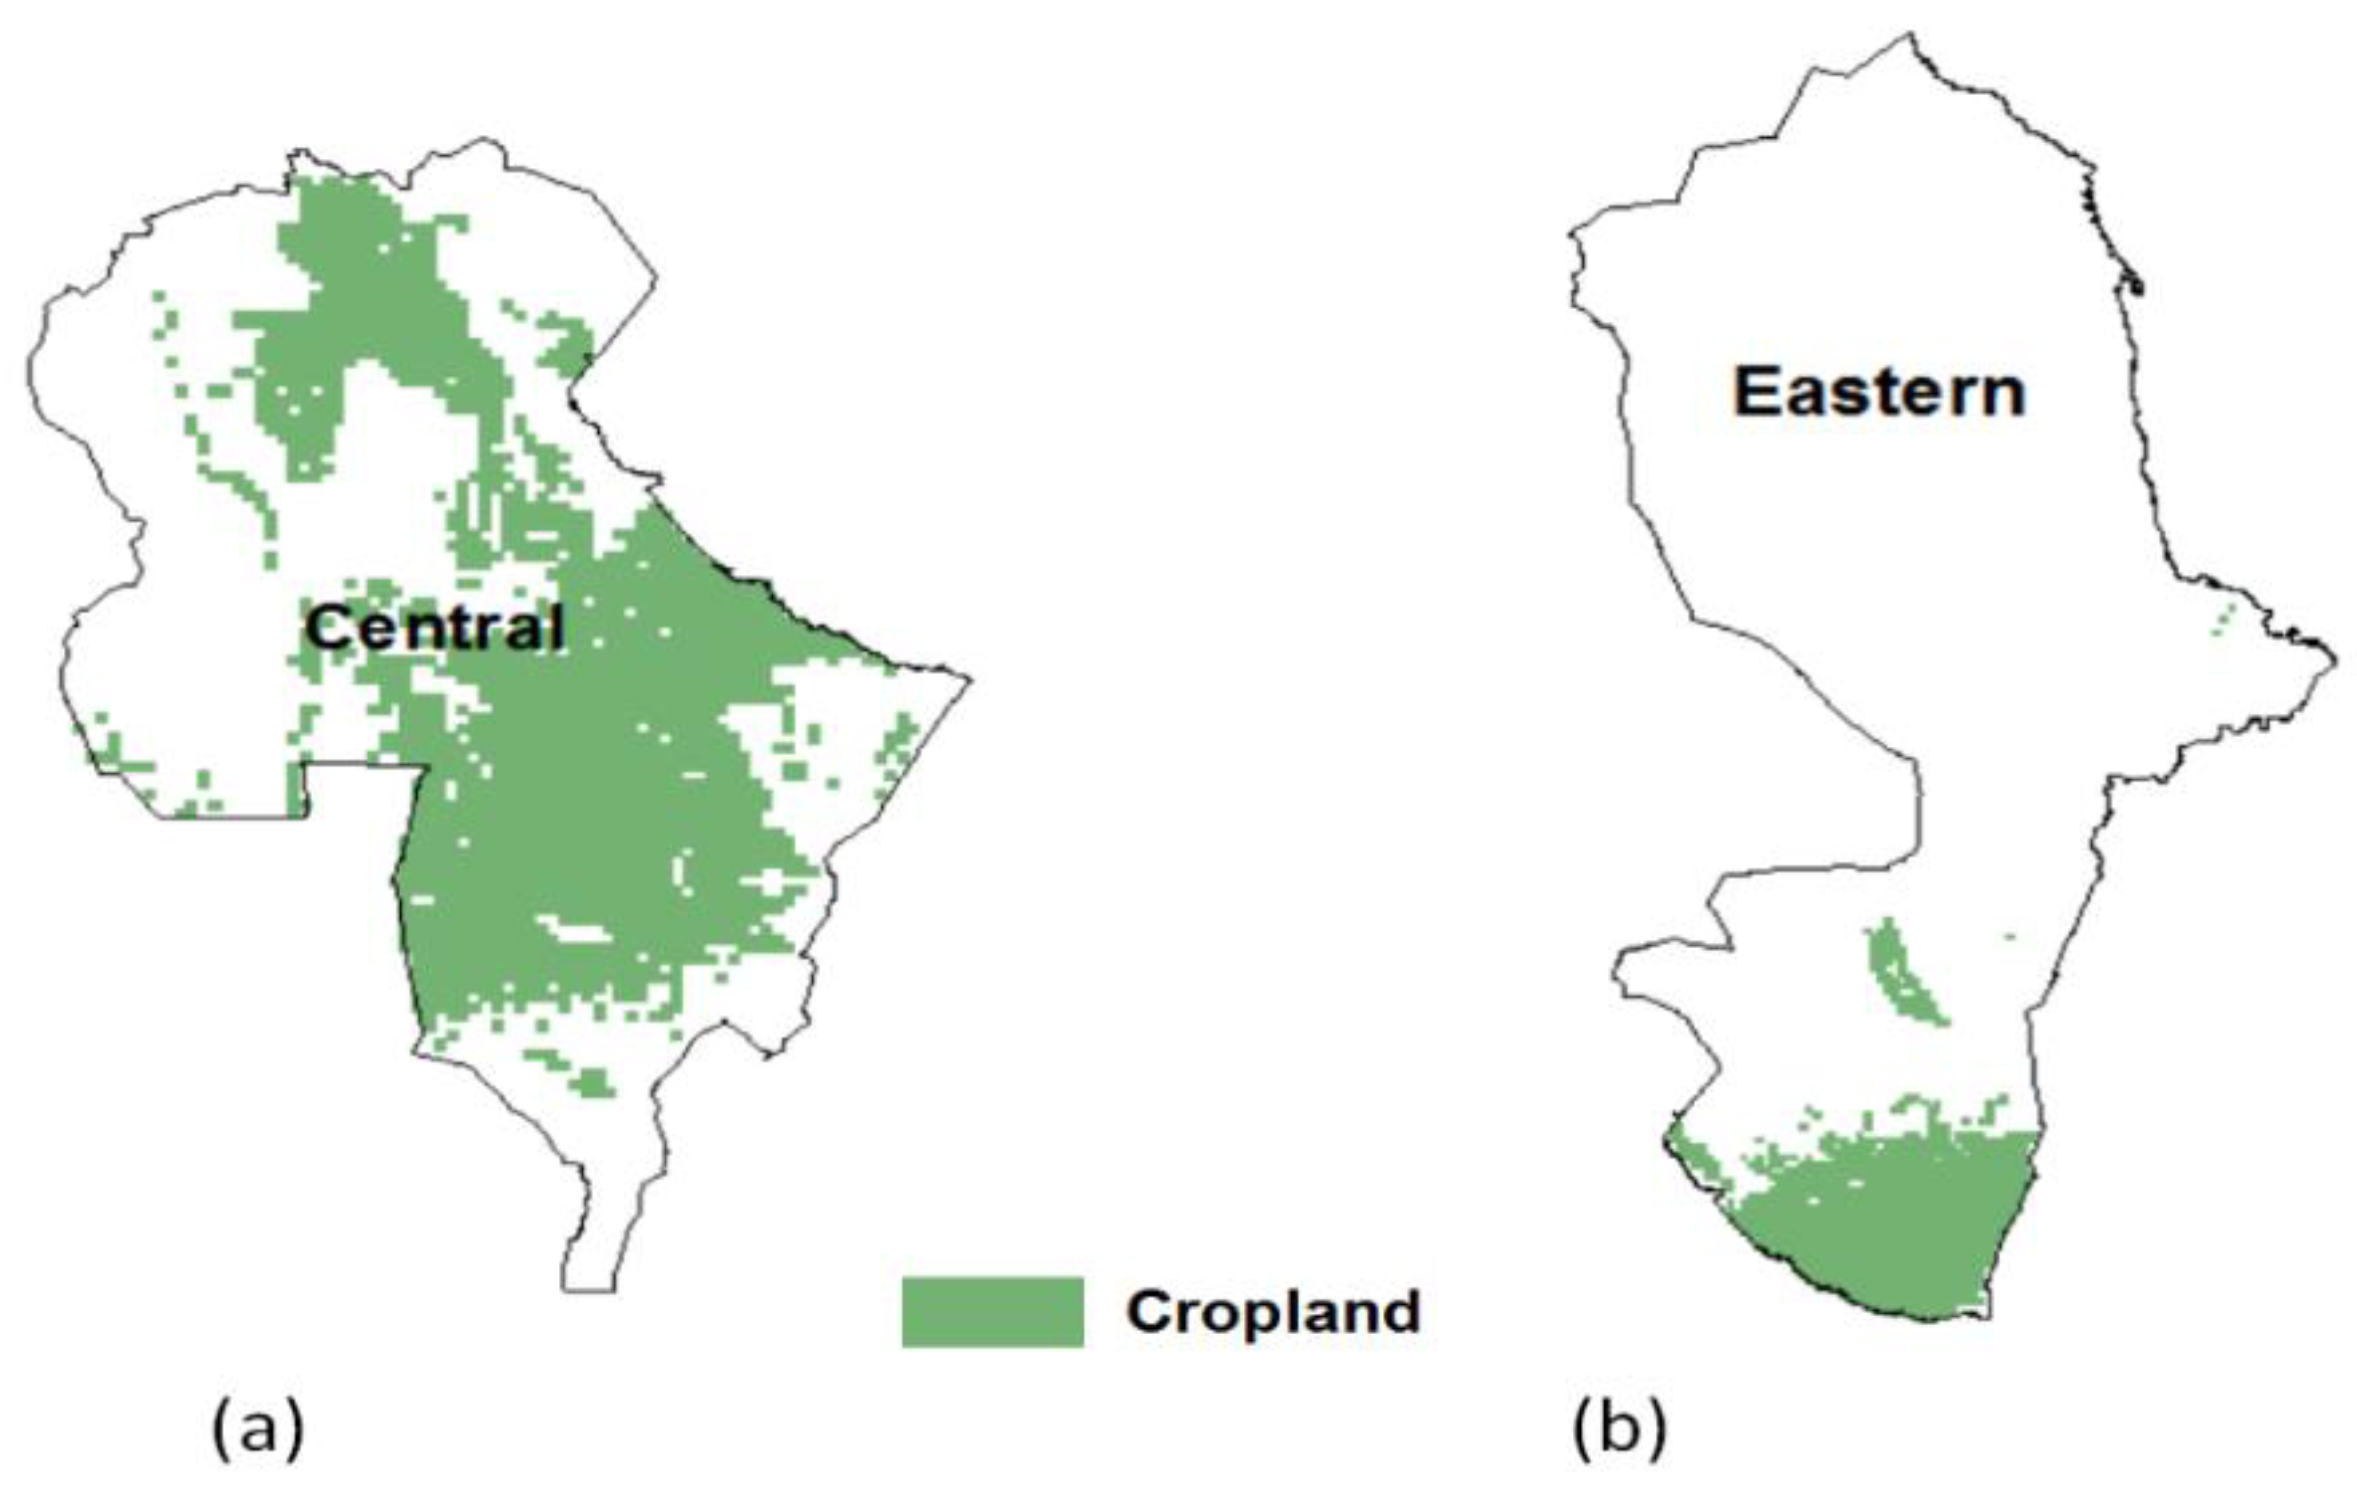
2.1. Study Area and Data

Sudan is located in the northeast of Africa between 8.4°–23.3° North latitude and 21.5°–39.0° East longitude, with elevation ranging from 0 to about 3000 m a. s. l. (Figure 1a). Sudan is mostly characterized by vast plains that are dominated by clay in the Eastern, Central, and Southern regions and by sand in the North, while the Kordofan and Darfur regions have mountainous geography. The southern parts of Sudan have a higher rate of precipitation compared to northern parts (Figure 1b). The land use land cover map of study regions based on MODIS land cover type product (MCD12Q1) with a global vegetation classification scheme (IGBP) is presented in Figure 2. The total land area amounts to 1,886,068 km2 with an irrigated land area of only about 18,630 km2, while desert environment mainly characterizes the northern part. In the areas of Sudan located south of 10° North latitude, the rainy season starts from the middle of June and ends in October, while the sorghum (as a major crop beside millet) growth season extends from late June to October, while July is the peak seeding period, August is the active growing term of sorghum, and September is the early reproductive stage of sorghum. Harvesting of the crop is done at the beginning of November in Sudan.

2.2. In Situ, Meteorological and Agricultural Data

The 44-year historical record (1971–2015) of monthly precipitation data for 26 rain gauges in Sudan was collected from the Sudan Meteorological Authority (SMA) and records with no missing data were selected. The long-term precipitation record was used to compute the SPI values. The sorghum yield available data of each region from 2001 to 2011 was collected from the Sudan Ministry of Agriculture and Forces to calculate St. Y for each study region. These collected data at a regional level, for example, the Darfur region includes three states (North Darfur, West Darfur, and South Darfur states), the Kordofan region two states (North Kordofan and South Kordofan states), the Central region three states (White Nile, Gazera, and Sennar states), and the Eastern region three states (Elgadaref, Kassala, and Red sea states). The Central and Eastern regions represented the main agricultural areas for sorghum crop.

2.3. Remote Sensing Data

In this study, MODIS monthly NDVI (MOD13A3) and ET/PET (MOD16A2) products developed by Mu et al. [35,36,37] with a resolution of 1 km were used. Monthly MODIS NDVI was obtained from the National Aeronautics and Space Administrations (NASA) (http://ladsweb.nascom.nasa.gov) for the period from 2001 to 2011. Monthly ET/PET images were downloaded from the Numerical Terra-dynamic Simulation Group (NTSG) at the University of Montana (http://www.ntsg.umt.edu/) for the same period as that of NDVI data. The nine tiles (h20 v 06, h 20 v 07, h 20 v08, h 21 v06, h 21 v07, h 21 v08, h 22 v06, h 22 v07, and h 22 v08) were mosaicked using the MODIS Reprojection Tool to cover the whole of Sudan.
For precipitation, this study used rainfall production of TRMM. The main goal of TRMM was to measure the precipitation in tropical and subtropical areas [38]. There are many precipitation datasets, such as the climate research unit dataset (CRU), the Global Precipitation Climatology Centre (GPCC) dataset, and the Climate Hazards Group Infrared Precipitation with Stations data (CHIRPS), which have a long-term record (1902–2015) and provide worldwide coverage, except for CHIRPS, which starts in 1981 and extends to the near present. Even though TRMM has a short record from1998 to 2015, it has a significant advantage due to its higher spatial resolution compared to the other precipitation data sets. It has a spatial distribution of 0.25° * 0.25°, with a spatial coverage that extends from 50° S to 50° N latitude. TRMM has different data products (hourly, daily, and monthly). However, this study used TRMM 3B43 V7 downloaded from the Goddard Earth Sciences Data and Information Services (http://disc.sci.gsfc.nasa.gov), which gives the monthly rainfall rates (mm/h) for the period from 2001 to 2011.

2.4. Methods

Two meteorological drought indices were applied in this study: one was calculated based on precipitation data, while the other was calculated using MODIS data. The monthly NDVI, ET, and PET data with the same temporal and spatial resolution of 1-km were used to compute the DSI, whereas the observed rainfall measurements from weather gauges were used to compute SPI values in order to investigate the spatiotemporal variability of the drought phenomenon over the different regions of Sudan. To infer the influence of drought on sorghum, the St. Y was used. The methodology of the study will be further discussed in the following sections.

2.4.1. Standardized Precipitation Index (SPI)

The SPI is an indicator designed to measure and assess meteorological drought, and it can only be computed from precipitation data. McKee et al. [39] first proposed it for describing and monitoring drought status. SPI has many benefits, such as simplicity, spatial consistency, being probabilistic in nature, and the ability to simulate drought levels on both spatial and temporal scales. These advantages led the World Meteorological Organization (WMO) to suggest the standardized precipitation index as the indicator of top choice for drought levels measurement [40,41]. This study employed the SPI index to study the temporal variability of dryness for the duration of 1971 to 2015 in the study regions. The SPI was evaluated for four regions: Eastern Sudan, Central Sudan, Kordofan, and Darfur, whereas the Northern region was discarded due to its location and proximity to the Saharan Desert. The SPI values were calculated at various time scales to measure meteorological drought levels from historical precipitation records for the four regions using monthly precipitation data collected from 26 rain gauges for the period 1971–2015. The SPI calculation method, described later in this section, was used for each station.
The idea of SPI was to convert the precipitation data to a normal distribution using Gamma probability distribution. The algorithm for obtaining SPI, as described by McKee et al. [39], requires data fitting by using gamma probability density function g(x), as shown in the equation below
g ( x ) 1 β Γ x 1       e x / β
where x > 0 is the precipitation, > 0 is the shape parameter, and β > 0 is the scale parameter.
The classification system of SPI shown in Table 1 was used by McKee et al. [39], which defines multiple classes of drought in terms of SPI values and also defines the criteria for drought categories at different timescales.

2.4.2. TRMM Precipitation Deficit Maps

Unevenly distributed meteorological stations over an area might affect the quality of the spatio-temporal drought studies. Therefore, mapping rainfall deficit using near real-time satellite data is supposed to improve the spatial coverage, especially in areas that have data scarcity. For this reason, TRMM rainfall estimates were used, which can be considered as the most accurate rainfall data derived from satellite measurements and a valuable source in regions with scarce weather-stations [42]. In fact, TRMM data have been used widely to measure and monitor rainfall for a different purpose. The precipitation data extracted from the TRMM was used to categorize the drought-prone areas during the early growing season. Thus, the TRMM-3B43 monthly average rainfall (mm/h) data that were aggregated to precipitation (mm/month) over the whole of Sudan were resampled to a 1-km spatial distribution. Then, the deviations of the TRMM precipitation data product from 2001–2011 were calculated and mapped at a seasonal scale (July–October).

2.4.3. MODIS Drought Severity Index (DSI)

DSI, as was proposed by Mu et al. [25], is a new index which only uses two remotely-sensed datasets available from MODIS for detecting global drought. Initially, a cropland mask was created from the MODIS (MCD12Q1) data set with an IGBP scheme, which was then used to mask out non-agricultural areas (urban and built up areas) from the study regions. The cropland mask is presented in Figure 3. This was done so that the DSI values (July–October), to be calculated, were only extracted from the cropland areas, as required, for Eastern and Central regions from 2001 to 2011, before being compared with St. Y. Therefore, the MODIS NDVI monthly product and the pixel by pixel ratio between MODIS ET and MODIS PET at a 1-km resolution were used to calculate DSI monthly/seasonal values of DSI. The ratio of ET/PET was calculated as:
Ratio = E T   P E T ,
The temporal mean (Ratio) and standard deviation (σ Ratio) were also calculated from 2001 to 2011 and the Ratio is normalized as presented in Equation (3):
z R a t i o = R a t i o R a t i o ¯ σ R a i o
N D V I values at each grid cell were also normalized by the mean ( N D V I ) and standard deviation ( σ   N D V I ) to get z N D V I as shown in Equation (4):
z N D V I = N D V I N D V I ¯ σ   N D V I
The summation of both z R a t i o and z N D V I   values was carried out to calculate the Z value as:
Z = z R a t i o + z N D V I
The normalized Z values that are called DSI values were finally calculated as:
DSI = Z Z ¯ σ Z .
The DSI categories theoretically (at a global scale) range from less than or equal to −1.5 to greater than or equal to 1.5, and the positive values indicate wetness and negative values indicate dryness conditions. The DSI categories and discerption system were shown in Table 1, as defined by Mu et al. [25].

2.5. The Standardized Variable of Crop Yield

One of the major aims of this study was to infer the impact of drought on crop yield. Therefore, we used the yield per hectare of sorghum crop to compare the results of DSI with St. Y. The research regions have different fertilities, soil types, climates, diseases, and insects. Therefore, there were some difficulties in comparing the sorghum yield from different regions. The crop yield loss ratio (YLR) was also used. The St. Y of each region was calculated as follows:
St .   Y   =   Y j Y ¯ σ ,
YLR = Y ¯ Y j Y ¯ 100 % ,
where Y j is the crop yield in j year of one region, Y ¯ is the average, and σ is the standard deviation of crop yield during 2000–2011. The (St. Y) is categorized in Table 1.

2.6. Spatial Correlation Analysis

Interpolation methods such as the Inverse Distance Weighting (IDW), kriging, and spline have been established based on the hypothesis that points closer to each other have more associations and similarities than those located farther away from each. In the IDW method, it is substantially assumed that the rate of correlations and similarities between neighbors is proportional to the distance between them that can be defined as a distance reverse function of each point from the nearest points. Like IDW interpolation, kriging forms weights from surrounding measured values to predict values at unmeasured locations. IDW uses a simple algorithm based on distance, but kriging weights come from covariance functions; while spline estimates values using a mathematical function. When the sample points have extreme differences in value, spline interpolation does not work as well. This is because spline uses slope calculations (change over distance), whilst kriging does not pass through any of the point values and causes interpolated values to be higher or lower then real values. Therefore, IDW was chosen as SPI3 time series have extreme differences in value (positive and negative values). Many studies have found that the IDW method was easy and the best for the quick interpolation of sparse observed data of both regular and irregular spaced samples [43,44]. TRMM precipitation was aggregated as mentioned in Section 2.4.2, and was resampled to match DSI spatial distribution for validating the DSI. The difference between SPI-3, TRMM products at 1-km, and DSI resolutions is very small. The Pearson correlation coefficient ( r ) values were used to quantitatively evaluate the capability of DSI in the early growing season by estimating the correlations of DSI, SPI, and TRMM precipitation. The ( r ) values of p < 0.05 were defined as:
r = i = 1 n ( x x ¯ ) ( y y ¯ ) i = 1 n ( x x ¯ ) 2 i = 1 n ( y y ¯ ) 2
where x represents the DSI at different time scales, y represents SPI3 or TRMM precipitation, and n is the number of samples. The ( r ) values ranging from −1 to 0 imply that sets are negatively correlated, while values from 0 to 1 indicate that they are positively correlated.

3. Results and Discussion

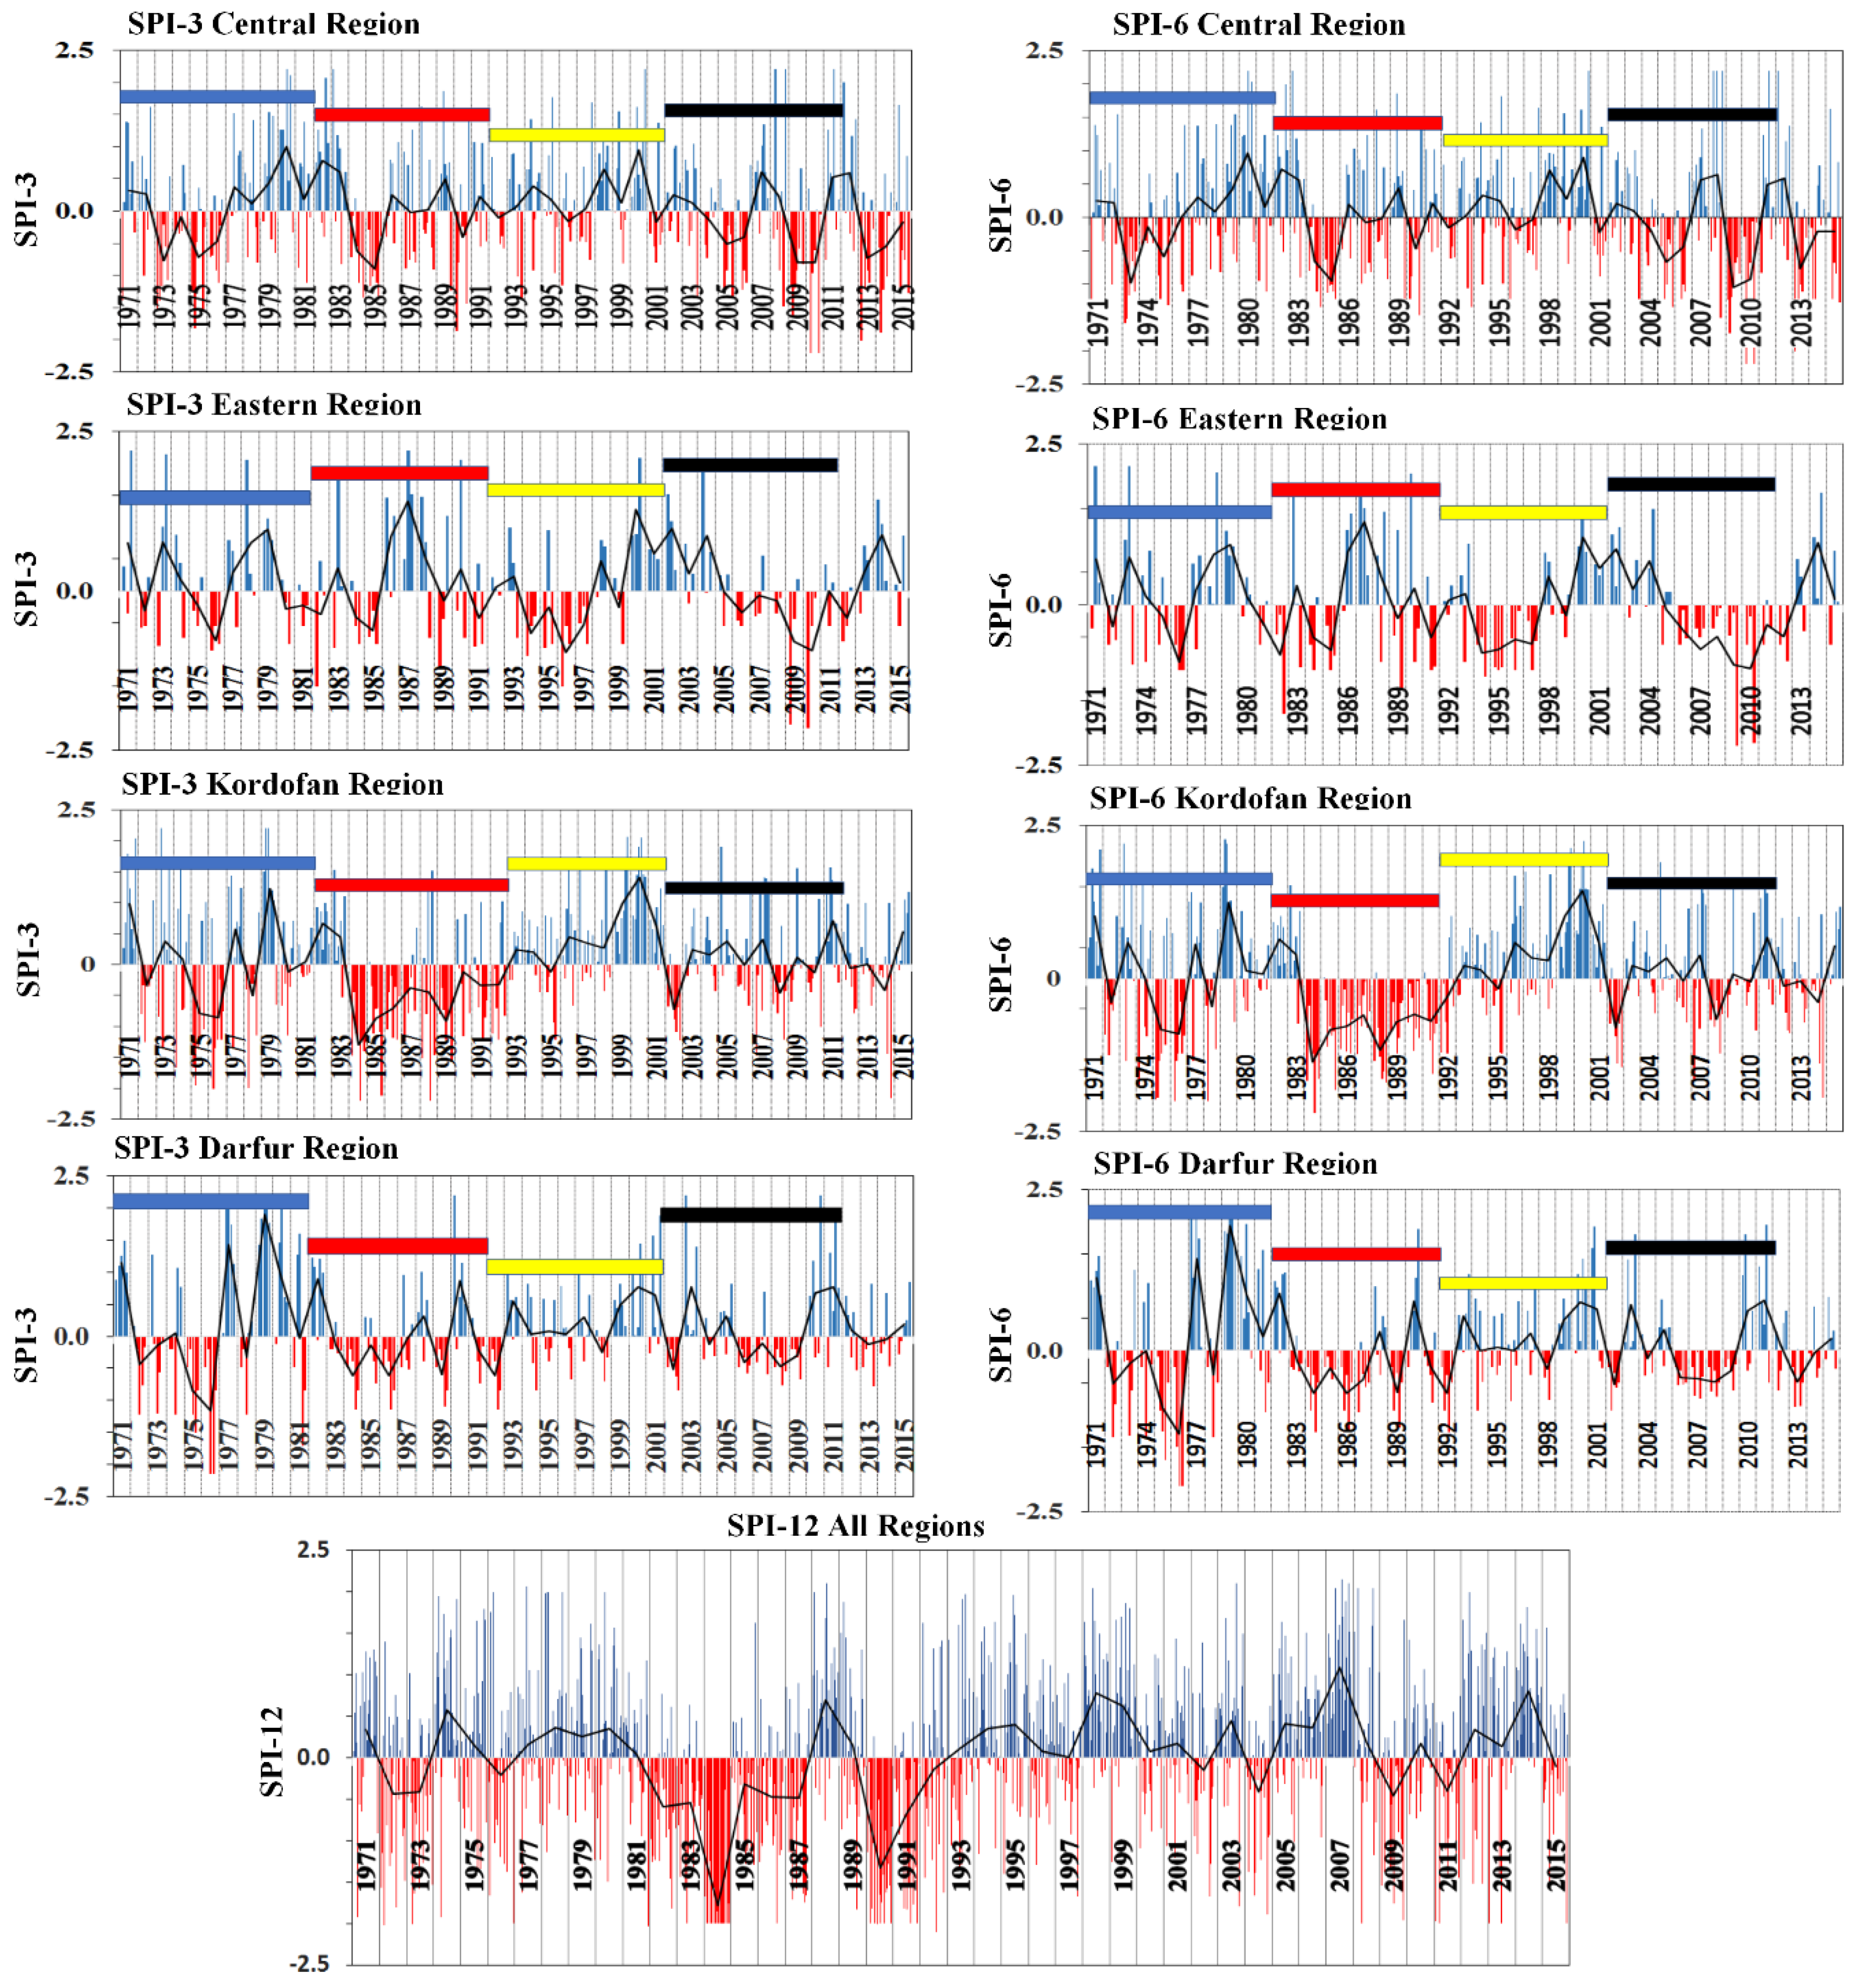
3.1. Temporal Characteristics of the Drought Using SPI

Drought occurrences with severity were analyzed based on three-month and six-month timescales. SPI-3 provides a comparison of the precipitation over a specific three-month period with the precipitation totals from the same three-month period for all the years included in the historical record. Therefore, it is essential to compare the SPI-3 with longer time scales. The SPI-6 compares the precipitation for that period with the same six-month period over the historical record. SPI-6 can be very effective for showing the precipitation over distinct seasons.
The analysis showed the existence of normal and drought status in terms of positive and negative SPI values. The results are displayed in Figure 4. Even though the wet and drought statuses were present in the SPI time series, only drought events were investigated. Figure 4 presents the drought occurrences and duration in terms of each region at different SPI time scales. The average SPI time series was computed from the precipitation data to detect the dryness and wetness status for each study region.
The analysis of short-term and medium-term SPI values (for example, SPI3 and SPI6) demonstrated that the drought is a frequent phenomenon. We divided the historical record into four decades. In the first decade (1971–1981), drought was visible from 1971 to 1976, and all the regions suffered from moderate to extreme drought, except for the Eastern region, which was affected by mild drought in the years 1975 and 1976. The second decade (1981–1991) showed an increase in drought events in all regions. Relatively long droughts took place from 1981 to 1985 in the Eastern region. The Central region faced drought in 1985. Kordofan and Darfur were impacted by severe droughts between the years 1984–1992 and 1984–1987, respectively. Short periods of intermittent droughts were observed again in 1989, in the Eastern, Central, and Darfur regions.
Dry conditions also persisted during the third decade (1991–2001). Severe drought was found in the northern part of the Central region from the years 1993–1997, while the Eastern region faced moderate drought in the same years. In 1995, the Darfur region faced moderate drought.
The fourth decade (2001–2011) displayed a huge fluctuation of SPI values in all regions. In 2002, moderate droughts were noted in the Kordofan and Darfur regions, while the Eastern region was wet. In 2003, the Eastern region showed above normal wet conditions. The drought occurred again in 2004, in the Central region, while the dry condition was observed in the Darfur and Eastern regions in 2005, which ended in 2006 and 2007, in the Central, and Darfur and Eastern regions, respectively. After a short-wet period in the year 2007, the drought returned again in 2008. The Central and Kordofan regions faced moderate to severe drought till 2011. From the SPI result, we can conclude that the drought was frequent and widespread in the study regions of Sudan, even though the SPI values indicated that dry conditions declined in some years, as they eventually returned within a few seasons. Moreover, these results also indicated that drought was also spatially variable in Sudan. For example, in the Darfur and Kordofan regions, drought was spread over large areas, whereas, comparatively, it was spread moderately in the Eastern region and exhibited much less spatial coverage in the Central region. As a consequence of drought recurrence within short periods and huge variations in precipitation events, the studied regions were constantly under stress. The analysis of SPI 12 suggested that 1972, 1973, 1974, 1981, 1982, 1983, 1984, 1985, 1986, 1987, 1989, 1990, 1991, 2004, 2009, and 2011 were the most drought-affected years since 1972, and 1974, 1984, 1990, 2009, and 2011 were the extreme drought years in terms of severity.

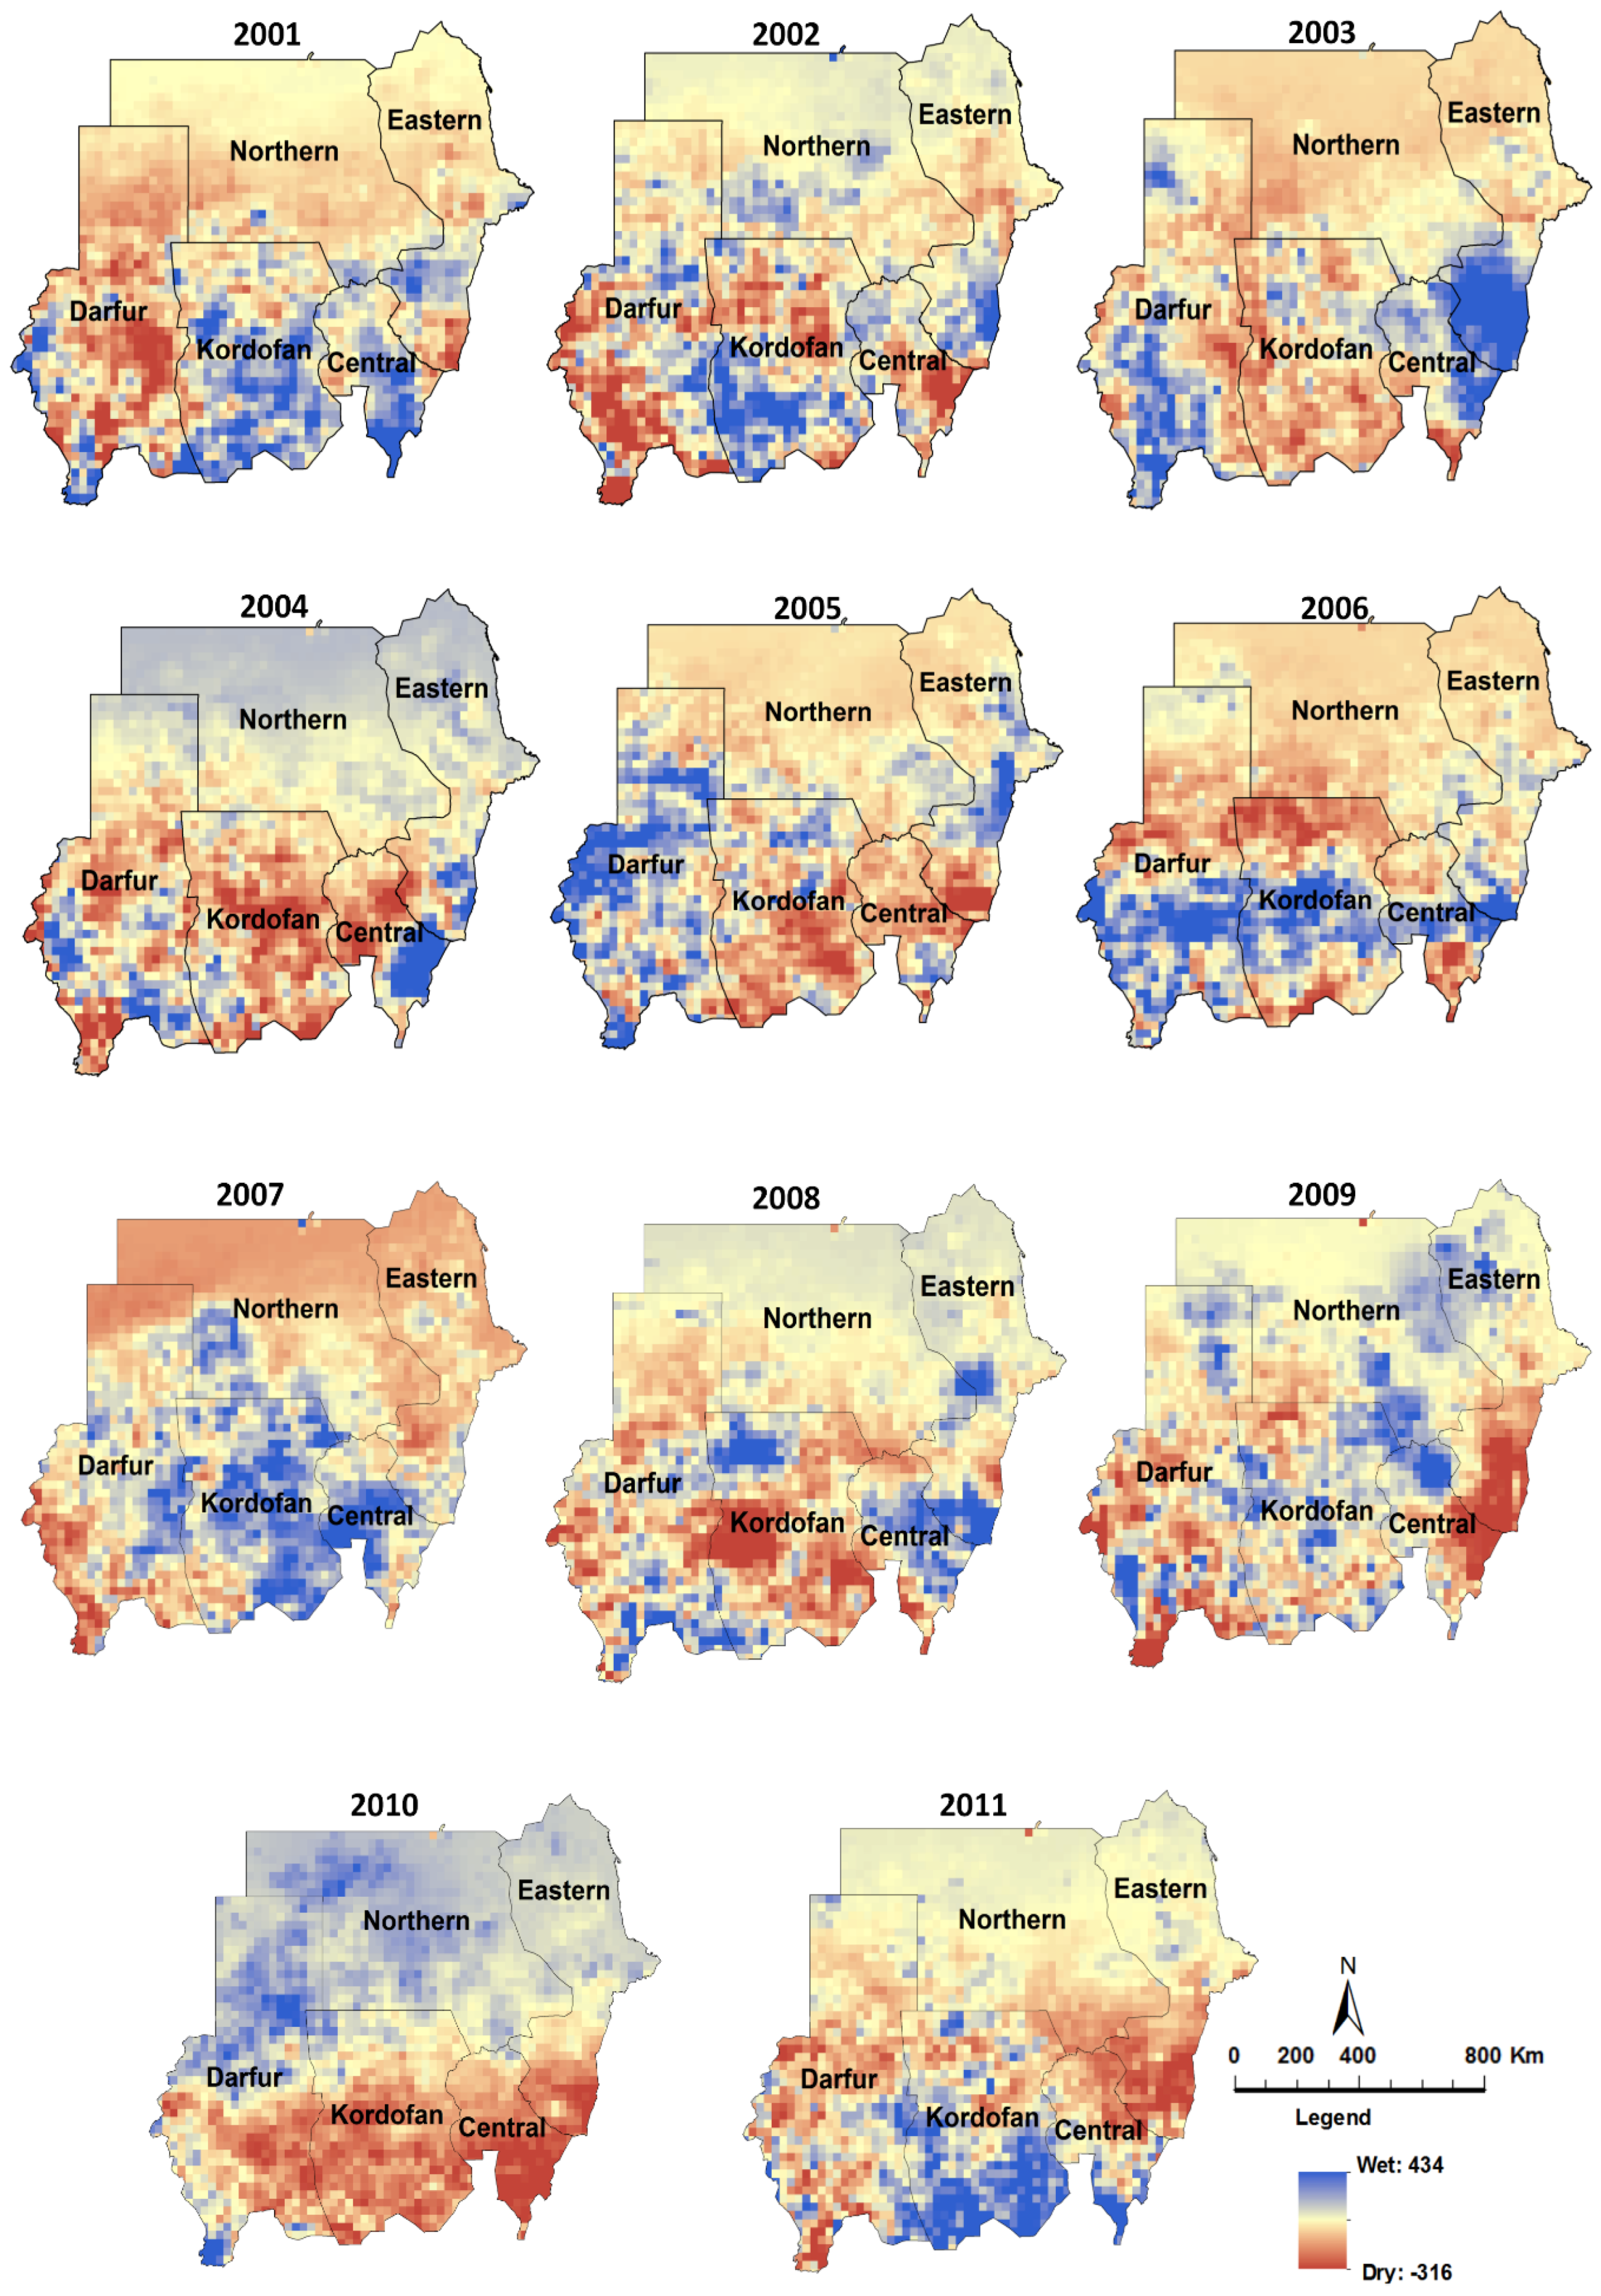
3.2. Drought- Prone Areas Using TRMM Precipitation Deficit

As presented in Figure 5, the deviations of the TRMM precipitation data products from the long-term mean from 2001 to 2011 were calculated and mapped at a seasonal scale (July–October) to determine drought-prone areas. Precipitation deficit maps were developed using TRMM data that were used to define drought regions for different years. The spatial maps calculated for 2001 displayed that the northern part of the Darfur region was very dry and consequently contributed to the intensity of the drought. In 2002, most of the Darfur region, the northern part of Kordofan, and the southern part of the Central region were stressed due to the low rainfall. In 2003, the Eastern region was impacted by a flash flood due to the high rainfall rate [45]. The Central region received normal rainfall, while the Kordofan region was dry in the same year. But in 2007 and 2011, the rainfall amount was above average in the Kordofan region. In 2010, the rainfall amount was below the average in the whole of Sudan. The study results indicated that the rainfall was irregular and varied every year. For instance, the southern part of the Kordofan region received 510 mm of rainfall in 2002, which was higher than the annual average rainfall. But the rainfall amount decreased to 415 mm in 2003 and 2004, and even further, to 320 mm, in 2005. Droughts with a short period of decrease in rainfall during the rainy season were observed to be even more damaging for crop productivity. Therefore, the variations of rainfall were first mapped using TRMM precipitation and were then utilized to evaluate the DSI.

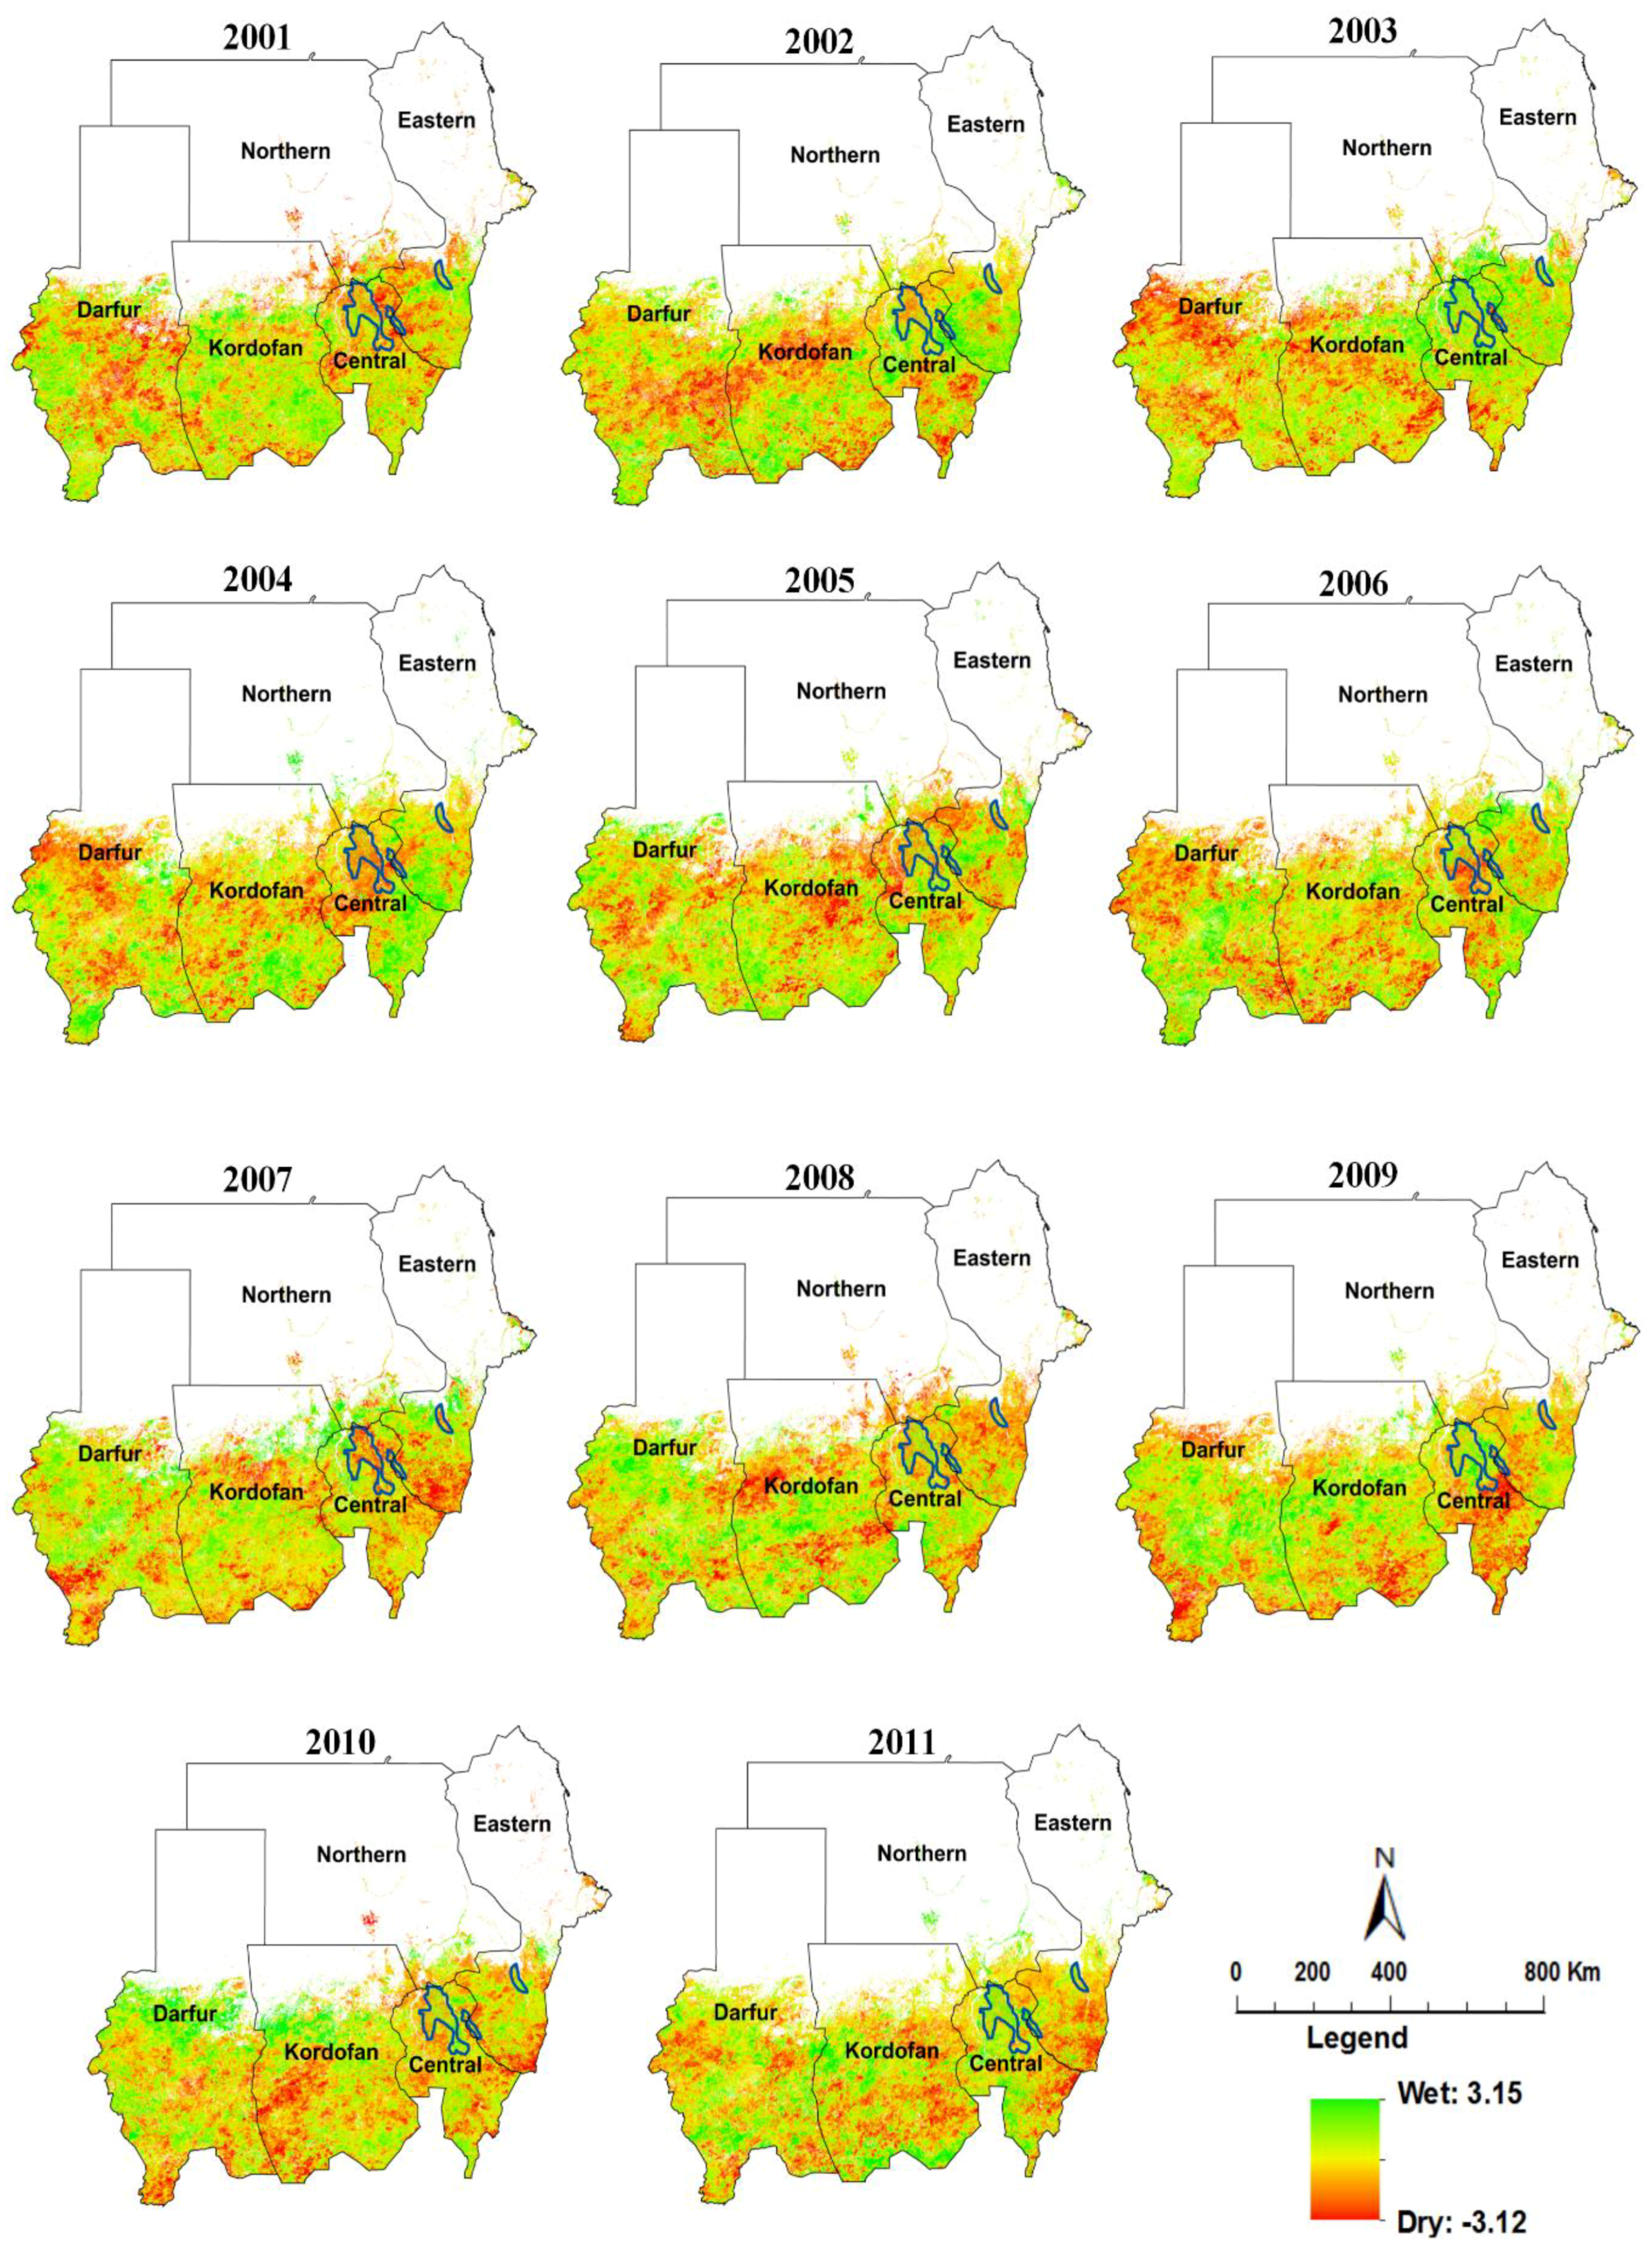
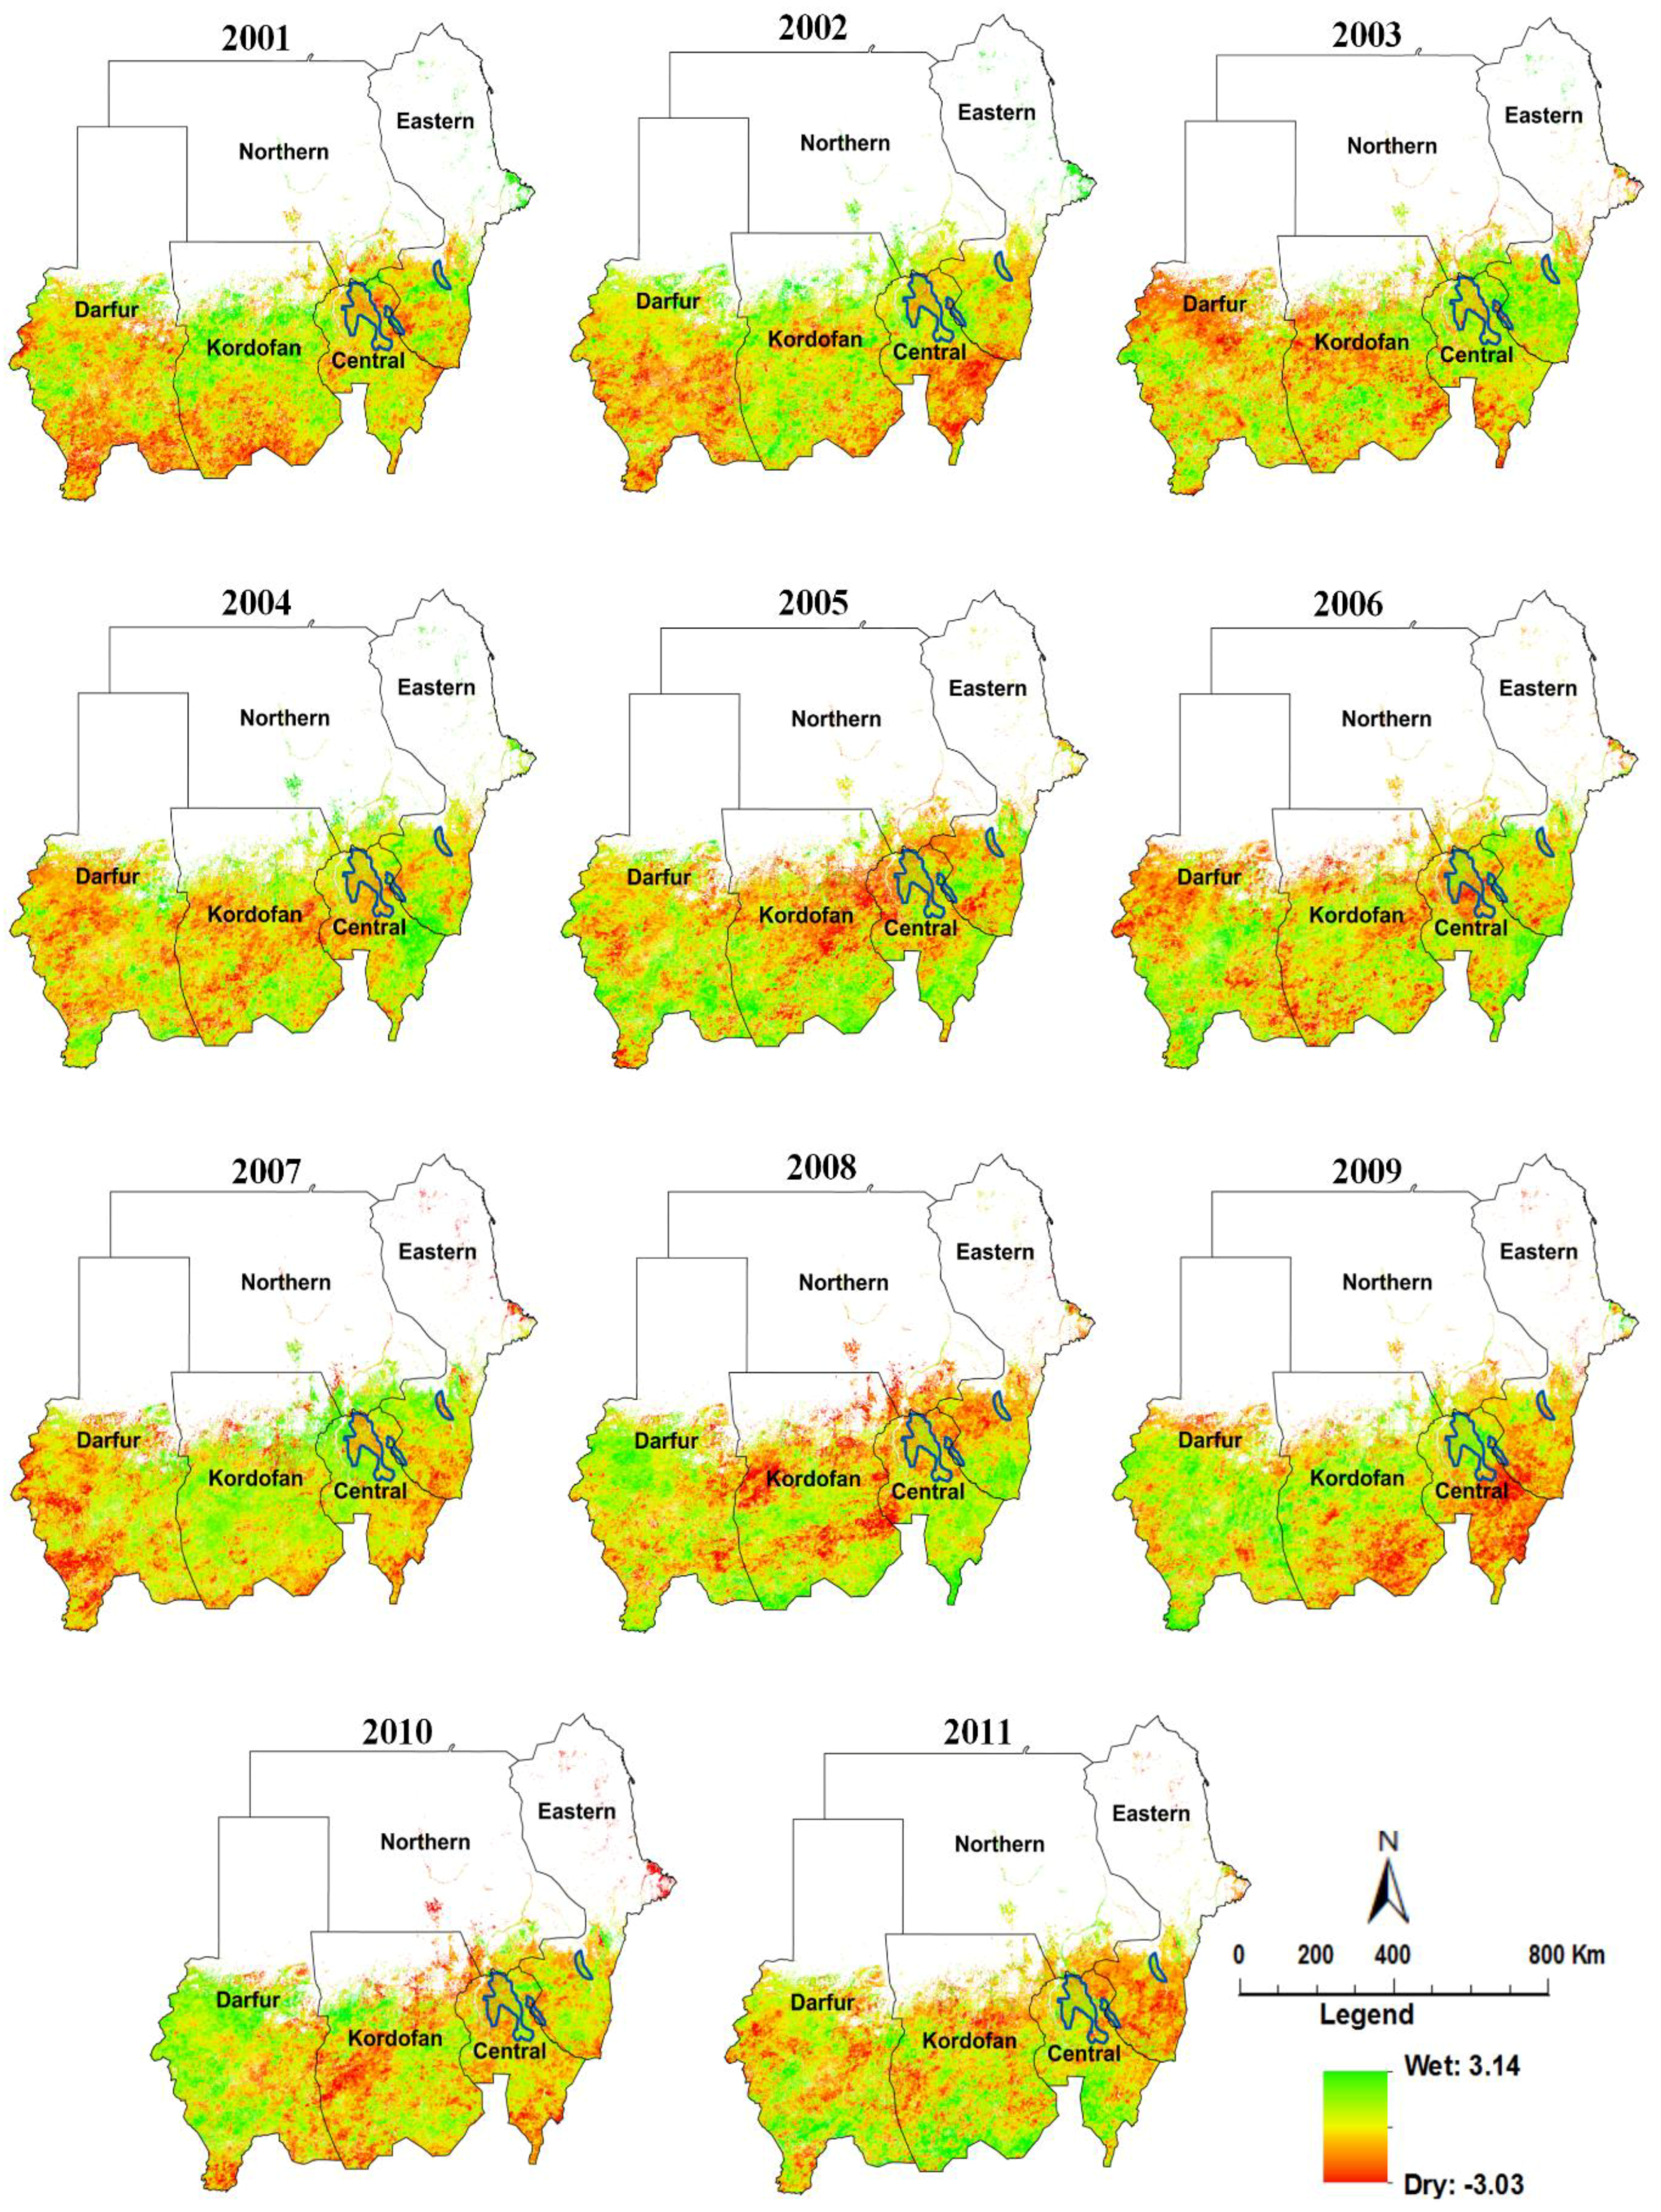
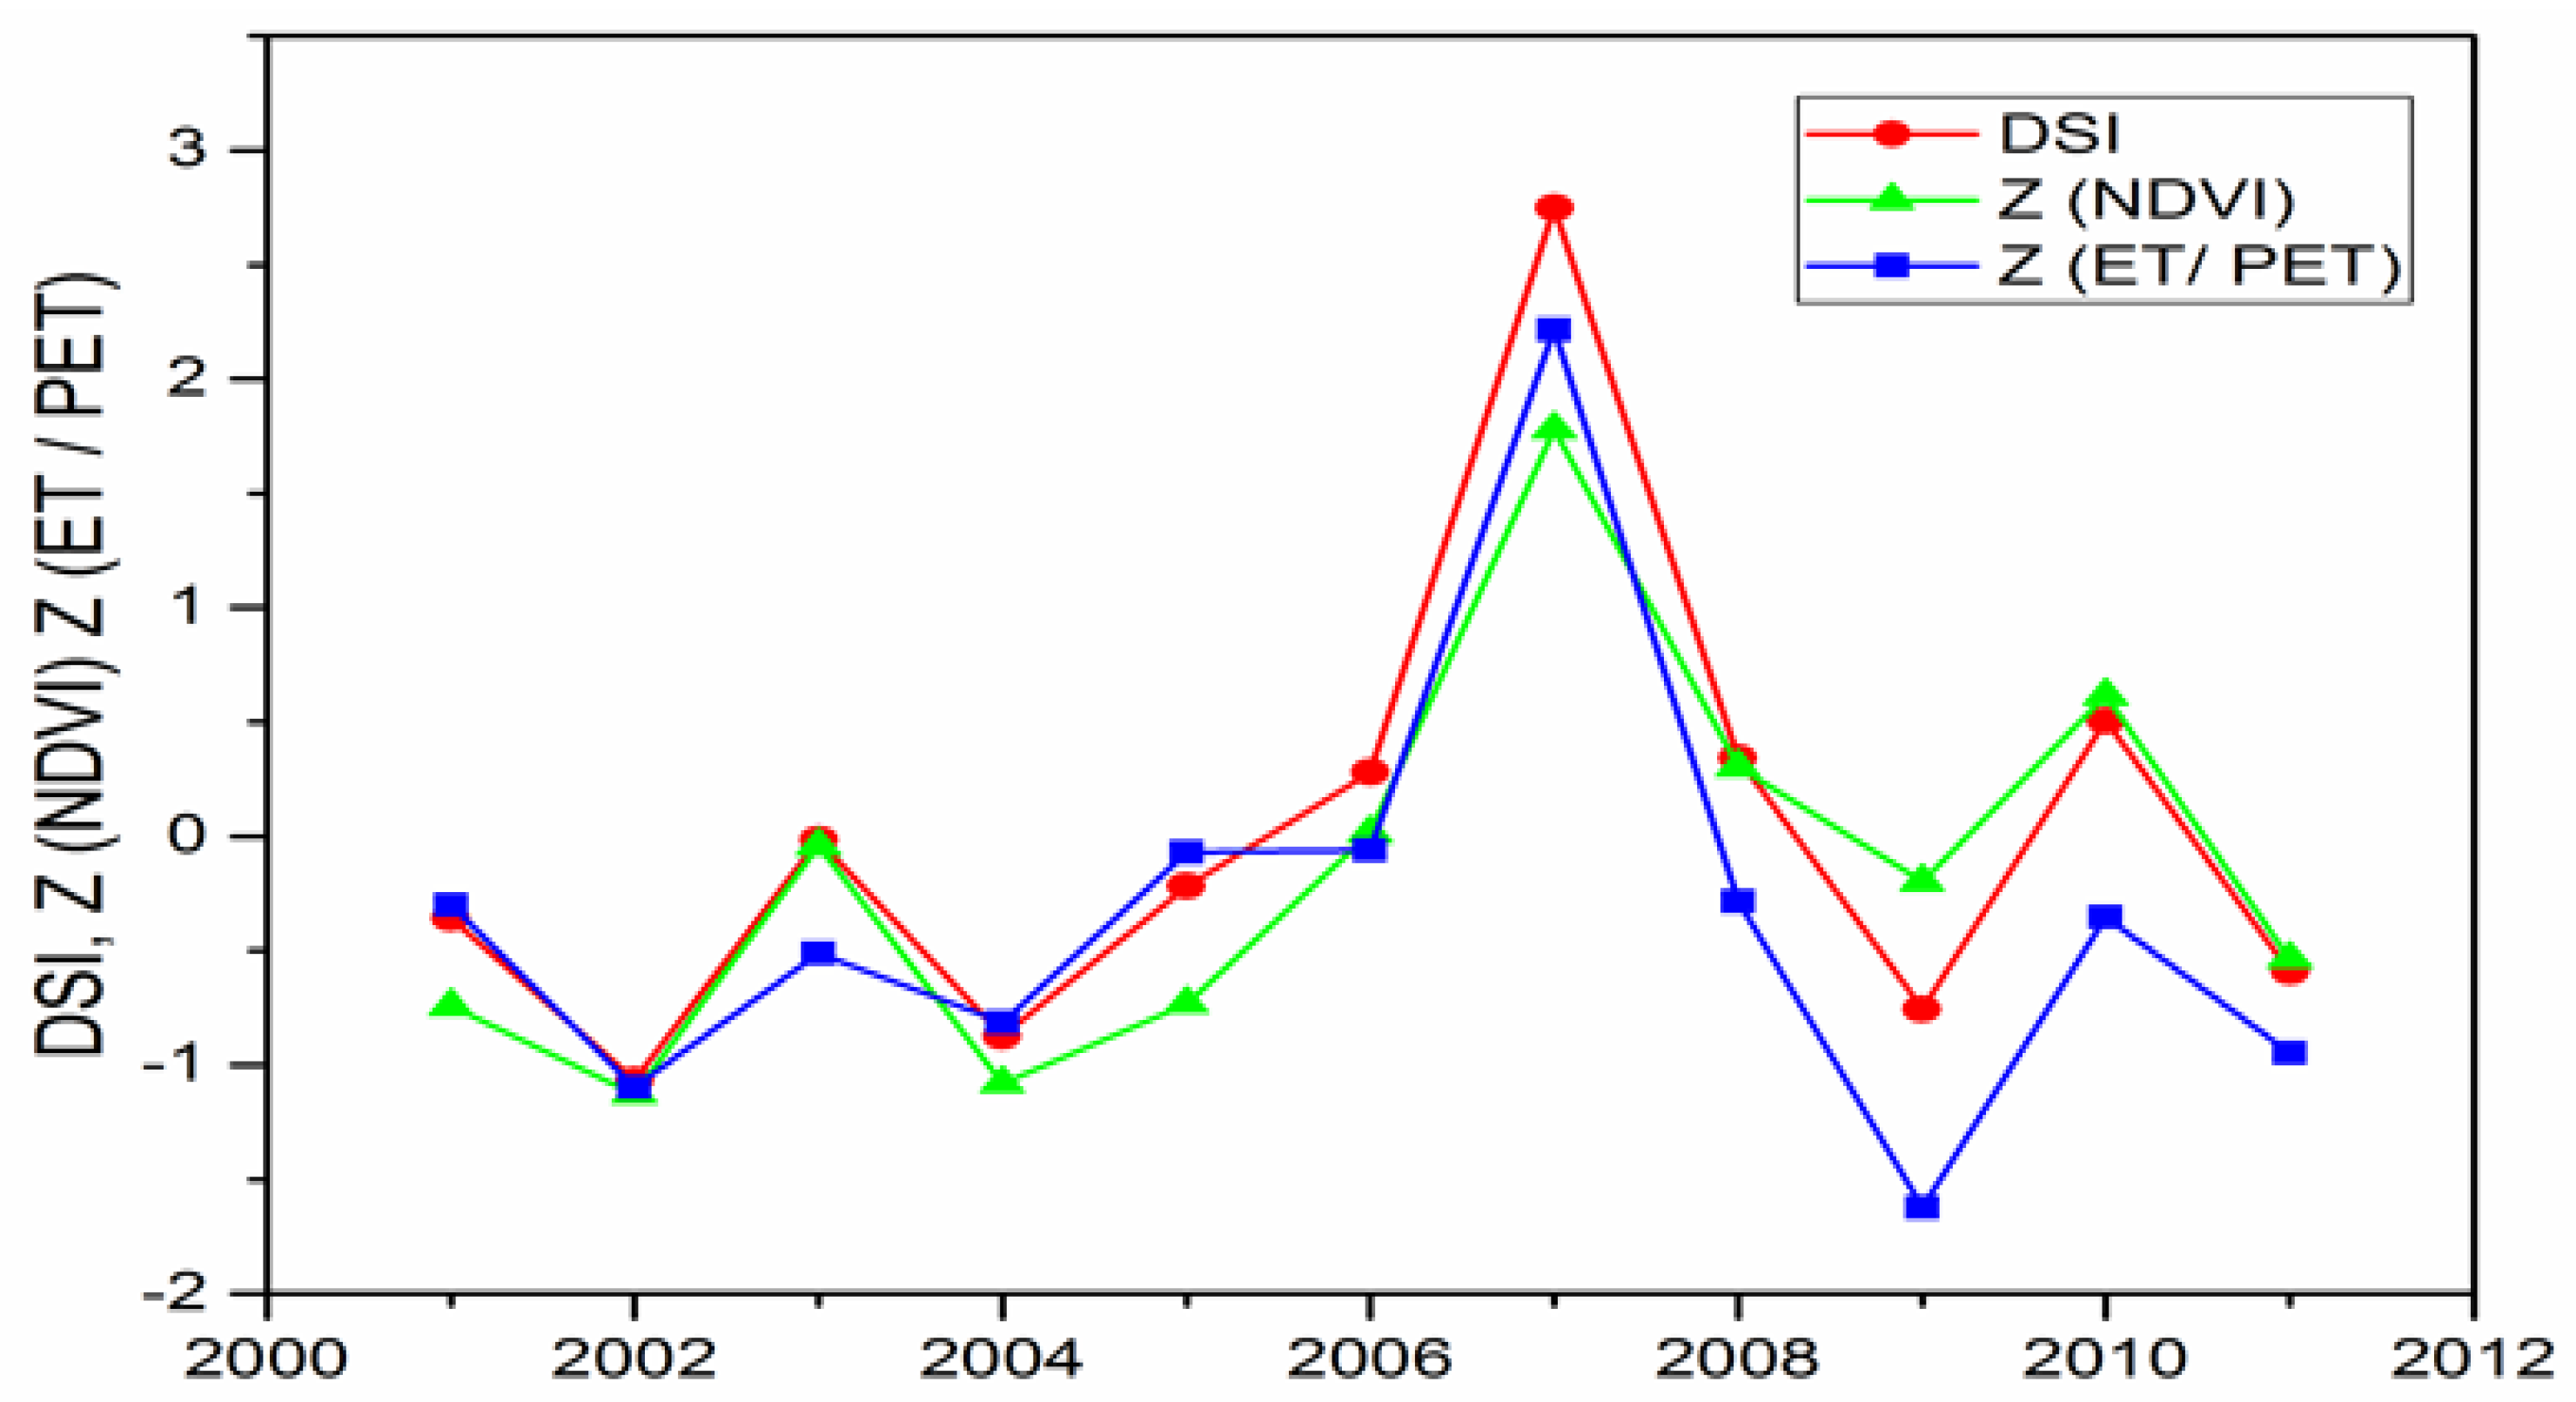
3.3. Spatio-Temporal Assessment of Drought Using DSI

The spatial analysis was performed using the DSI values estimated for various time scales, i.e., seasonal and annual from 2001 to 2011. The average monthly DSI was derived from the MODIS input data (NDVI, ET and PET) by using Equations (2)–(6). The DSI maps were generated and mapped at a seasonal (July–October) and annual scale for each year separately and presented in Figure 6 and Figure 7, respectively. Dimensional Index values (DSI values) were calculated in terms of drought and were mapped for the whole of Sudan. The positive value in DSI maps reflected wetness, while the negative value reflected dryness. The spatial distribution maps of DSI in the growing seasons, as shown in Figure 6, showed that a wide area in the northern and central part of the Darfur region was influenced by an extreme drought in 2001, while few portions in Central and Eastern regions were affected by moderate drought. Larger areas under dry conditions were detected in both Kordofan and Darfur regions during the years 2002 and 2003. The spread and the intensity of drought increased in these regions, whereas agricultural lands such as the Blue Nile state (South of the Central region) were affected by a severe drought. During the season of 2004, all the regions faced severe to extreme historical drought events, except for the southern part of the Central region.
The DSI spatial variations suggested that the intensity of drought decreased in all regions during the years 2005–2007 (from 3.09 to 3.15 maximum positive DSI value), which was likely due to the increased precipitation in the regions, as indicated in the SPI analysis (Figure 4) and TRMM precipitation deficit maps (Figure 5), but extreme drought was still observed in a few parts of some regions. The DSI results exhibited high positive values during 2007, which could be considered as the best season. However, the southern part of the Eastern region (El Gadarif state as a major growing area in Sudan) was affected by moderate drought. In 2008, the drought impacted areas were mostly concentrated in the Eastern region and extended to the southern part of the Central region till 2009. In 2010, the intensity of drought decreased slightly to mild drought in all regions except the western part of the Kordofan region, where an extreme drought occurred. The drought occurred again in 2011, and large areas of all the regions were influenced by severe to extreme droughts. The drought severity varied from moderate to extreme and the most severe and extreme events of dryness status occurred during the years 2009 and 2011.
In Sudan, in terms of severity, drought characteristics varied spatially and temporally. The precipitation pattern regulated drought intensity in Sudan, which in turn was governed by the overall regional climate system and was the result of climate change phenomenon. On the other hand, DSI values (NDVI and ratio ET/PET) likely reflected vegetation responses to drought conditions. In the Sahel region, the relationship between precipitation and NDVI has also been reported to be strong in numerous studies [46,47,48].
The DSI results suggested that the dryness conditions were dynamic across the whole of Sudan. It is clearly visible that from DSI maps (seasonal and annual maps), the DSI has a high ability to detect drought over rain-fed regions and it is also shown that there some limitations of DSI for detecting drought over irrigated areas. For example, both seasonal and annual DSI maps show that the irrigated areas, such as the Gazera agricultural project (as the baggiest irrigated project in Africa, which is delineated in DSI maps by a blue color polygon, as shown in Figure 7 and Figure 8), were not affected by drought in 2005, 2006, and 2010, as presented in the SPI result and TRMM deficit maps. These results are consistent with the result obtained by Zhang et al. (2016) [49].
Short-term drought events can be linked to El Nino/Southern Oscillation (ENSO). For example, a moderate El Nino occurred in 2002/2003 and lasted for ten months. During the same time period, drought affected Senegal, Mali, Burkina Faso, Nigeria, Sudan, and Ethiopia. Another El Nino event that took place in 2004/2005 and lasted for seven months also affected many countries including Mali, Burkina Faso, Sudan, Ethiopia, Tanzania, and Coast Province in Kenya, Uganda, and Somalia. In terms of drought, El Nino 2006/2007 was a weak event, but still caused drought in Morocco, Mali, Burkina Faso, Niger, Nigeria, Somalia, and Uganda. The 2009/2010 El Nino was another moderate event and lasted 10 months, affecting Sierra Leone, Sudan, Ethiopia, Somalia, and Kenya [50].

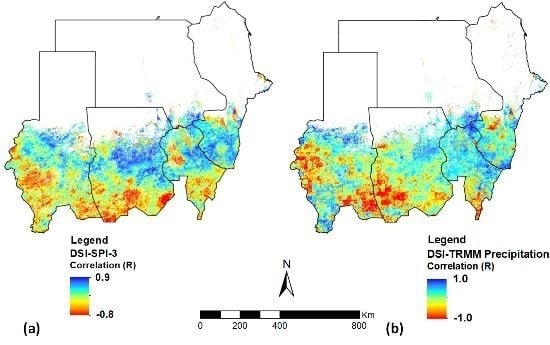
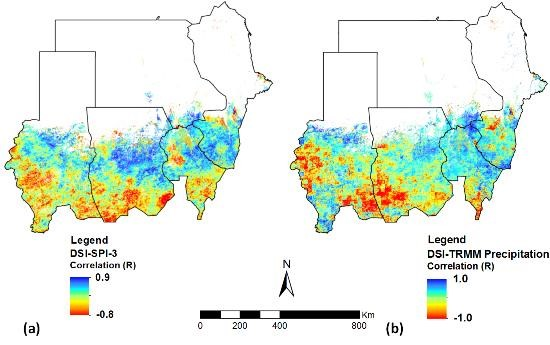
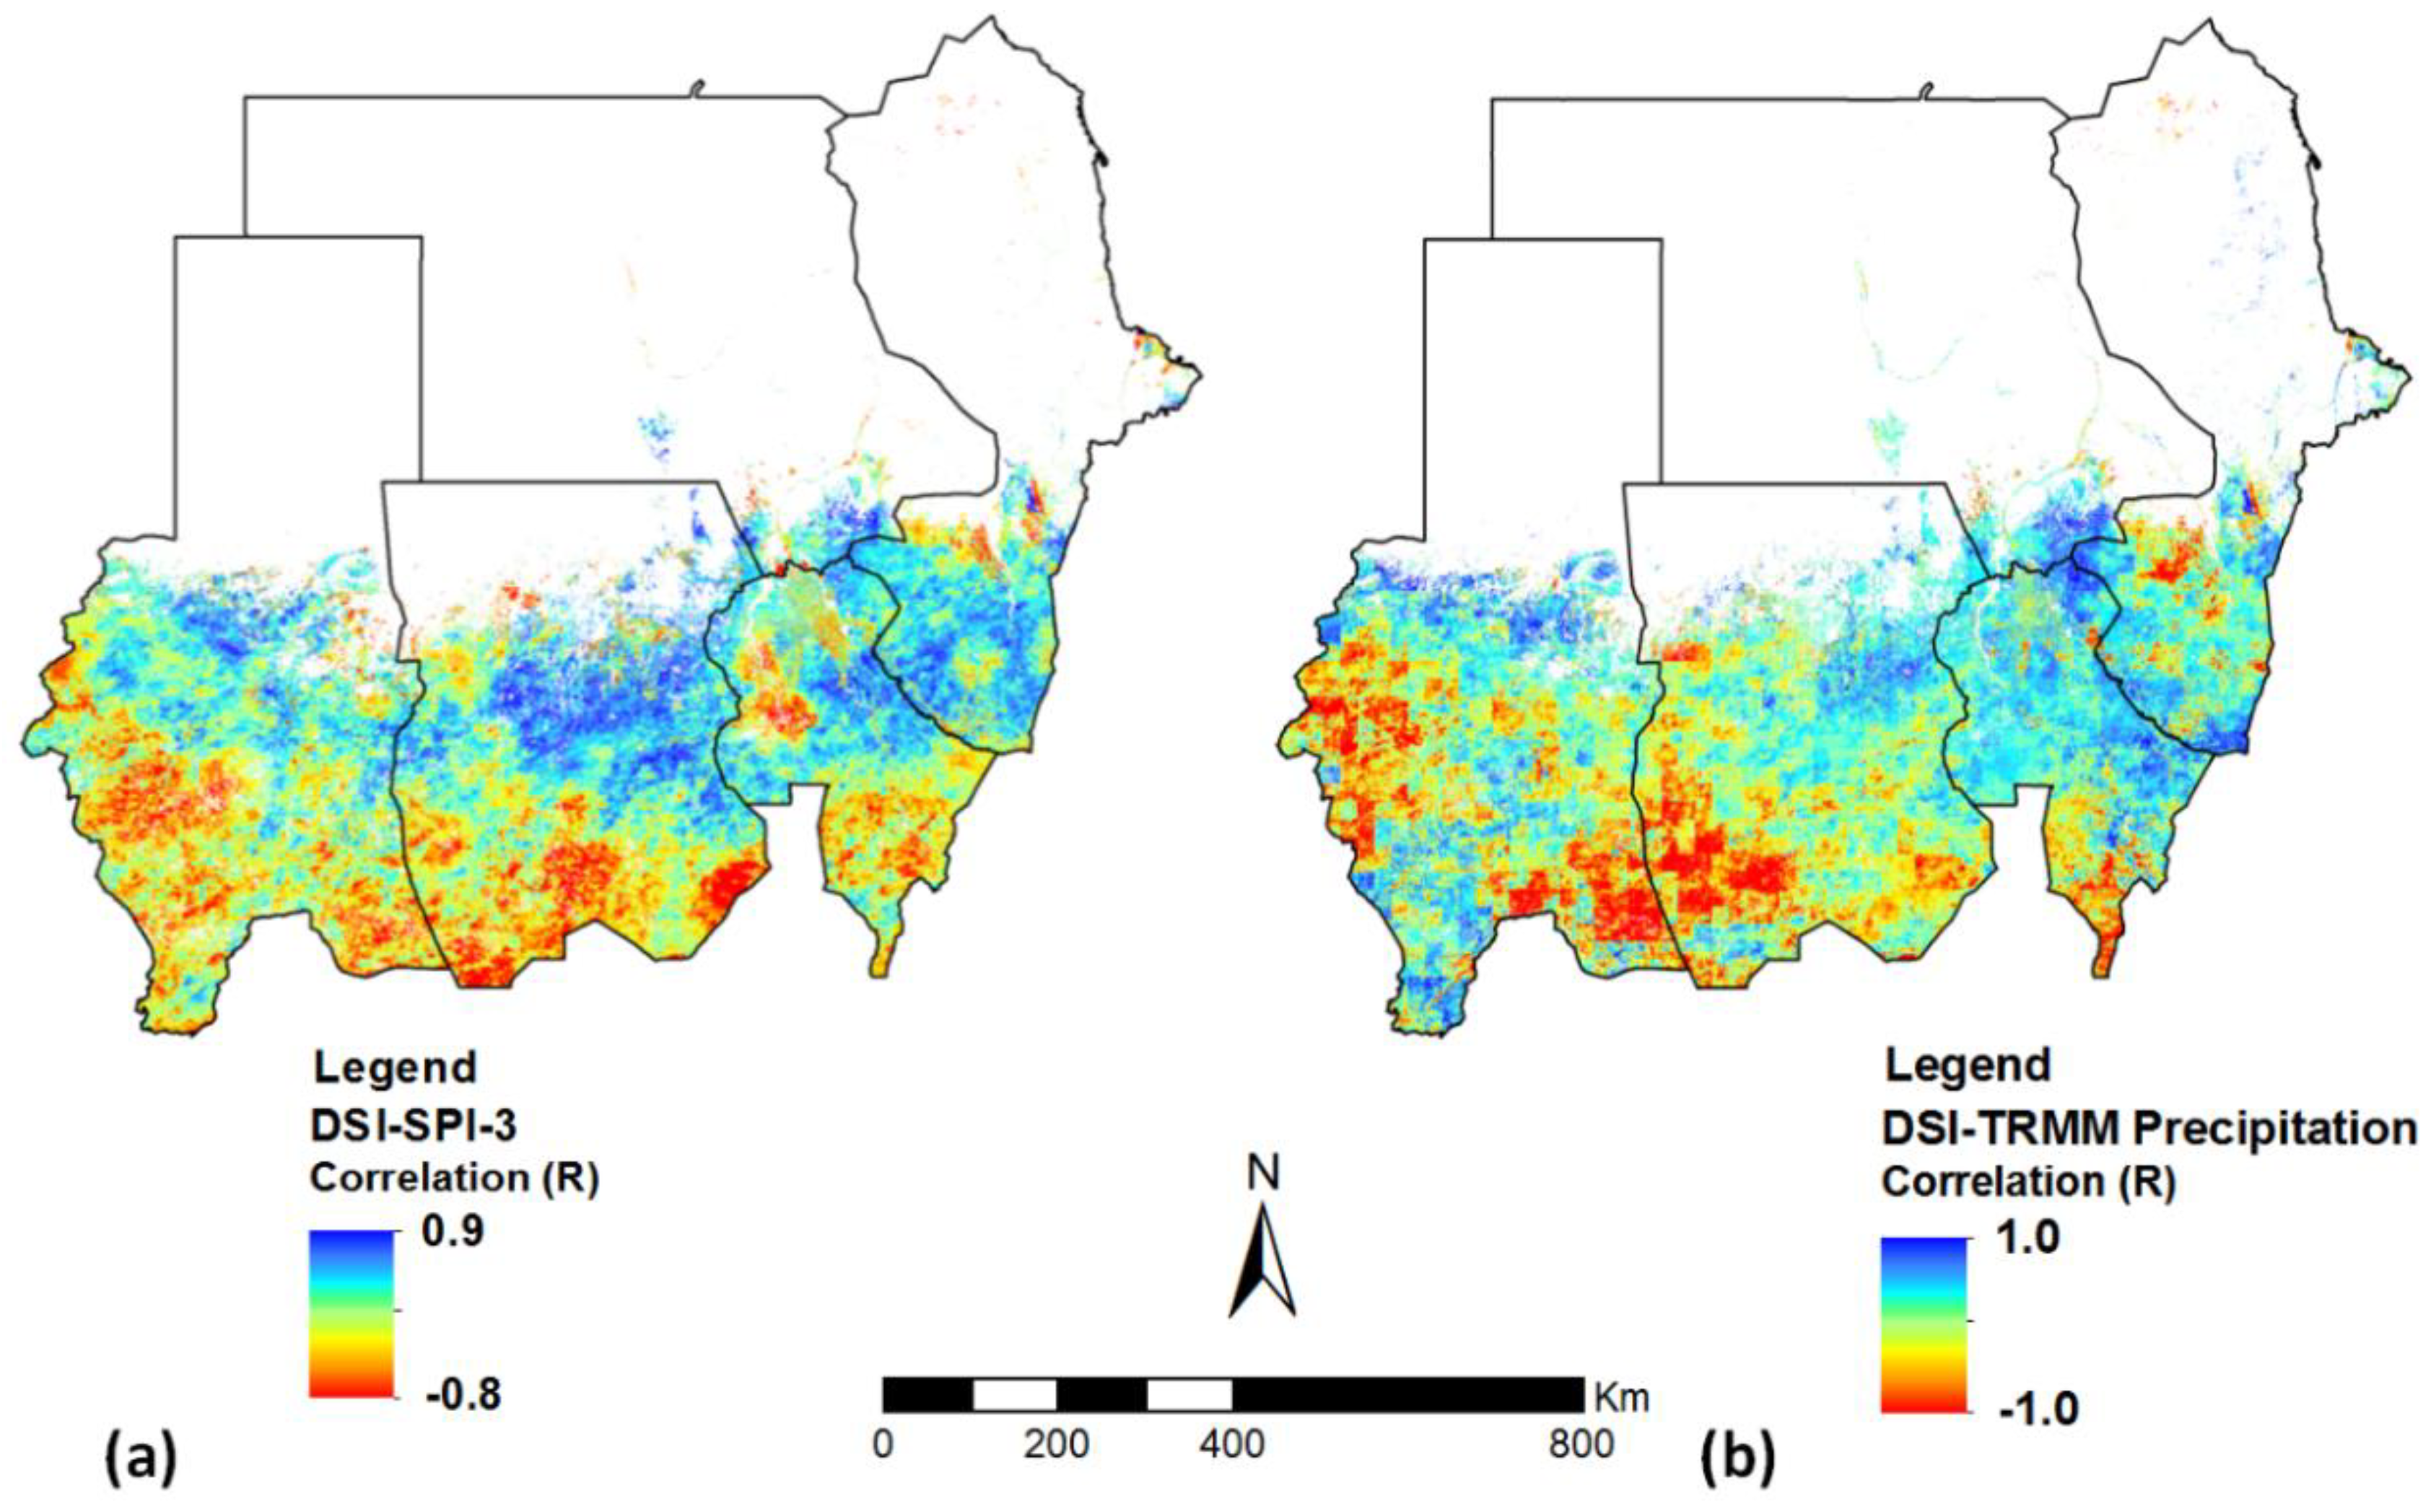
3.4. Spatial Correlation between DSI, SPI3 and TRMM

The core objective of this section was to validate the DSI index among SPI and TRMM estimation. The correlation results of DSI with SPI and TRMM precipitation for July to September are displayed in Figure 8. In general, a significant correlation between the TRMM precipitation and DSI was found with the (r) value close to 1, whereas the good correlation was also investigated between DSI and weather stations-based SPI with correlation coefficients (r) ranging from −0.8 to 0.9, due to unevenly distributed rainfall stations over the area. Significant positive correlation values were mostly present in the Central, Eastern, and the eastern part of Kordofan regions, where agricultural lands take predominate LULC types. Negative correlations appeared in the mountainous areas, such as the southern part of Kordofan region (western and eastern Nuba Mountains) and the west part of the Darfur region (Marrah Mountains). Moreover, negative correlation values appeared in the southern part of the Central region (Ingessana Hills). The negative correlation revealed the importance of other influencing factors like temperature, humidity, soil moisture, etc. Nonetheless, a negative correlation appeared in agricultural land in the southern part of the Kordofan region due to a lag effect between vegetation and DSI (NDVI and ratio ET/EPT). The low correlation values indicate low soil moisture. Soil moisture reflects climate, topography, and the ecosystem, and from the Figure 8, it is clearly visible that all areas that presented a low correlation are closer to mountainous areas. However, Barti et al. (2015) pointed out that the TRMM 3B42V7 product presented a poor overall accuracy in correctly identifying precipitation events above 3100 m in the Himalayan region [51].
In contrast, the significant negative correlation in mountainous areas indicated that the mountain ecosystems are likely to be linked to complex climate-land interactions which may continue under climate change. It can be seen in Figure 8 that the mountain areas were impacted by dryness. The Eastern region of Africa with a mountain ecosystem was also influenced by climate change [9]. Kilimanjaro Mountain Glaciers, for example, have decreased by about 80% during the 20th century. The residual ice parts are likely to disappear by 2020 if current dryness trend persists [52]. These results exhibited a strong indication for accepting DSI as a better indicator for drought monitoring.

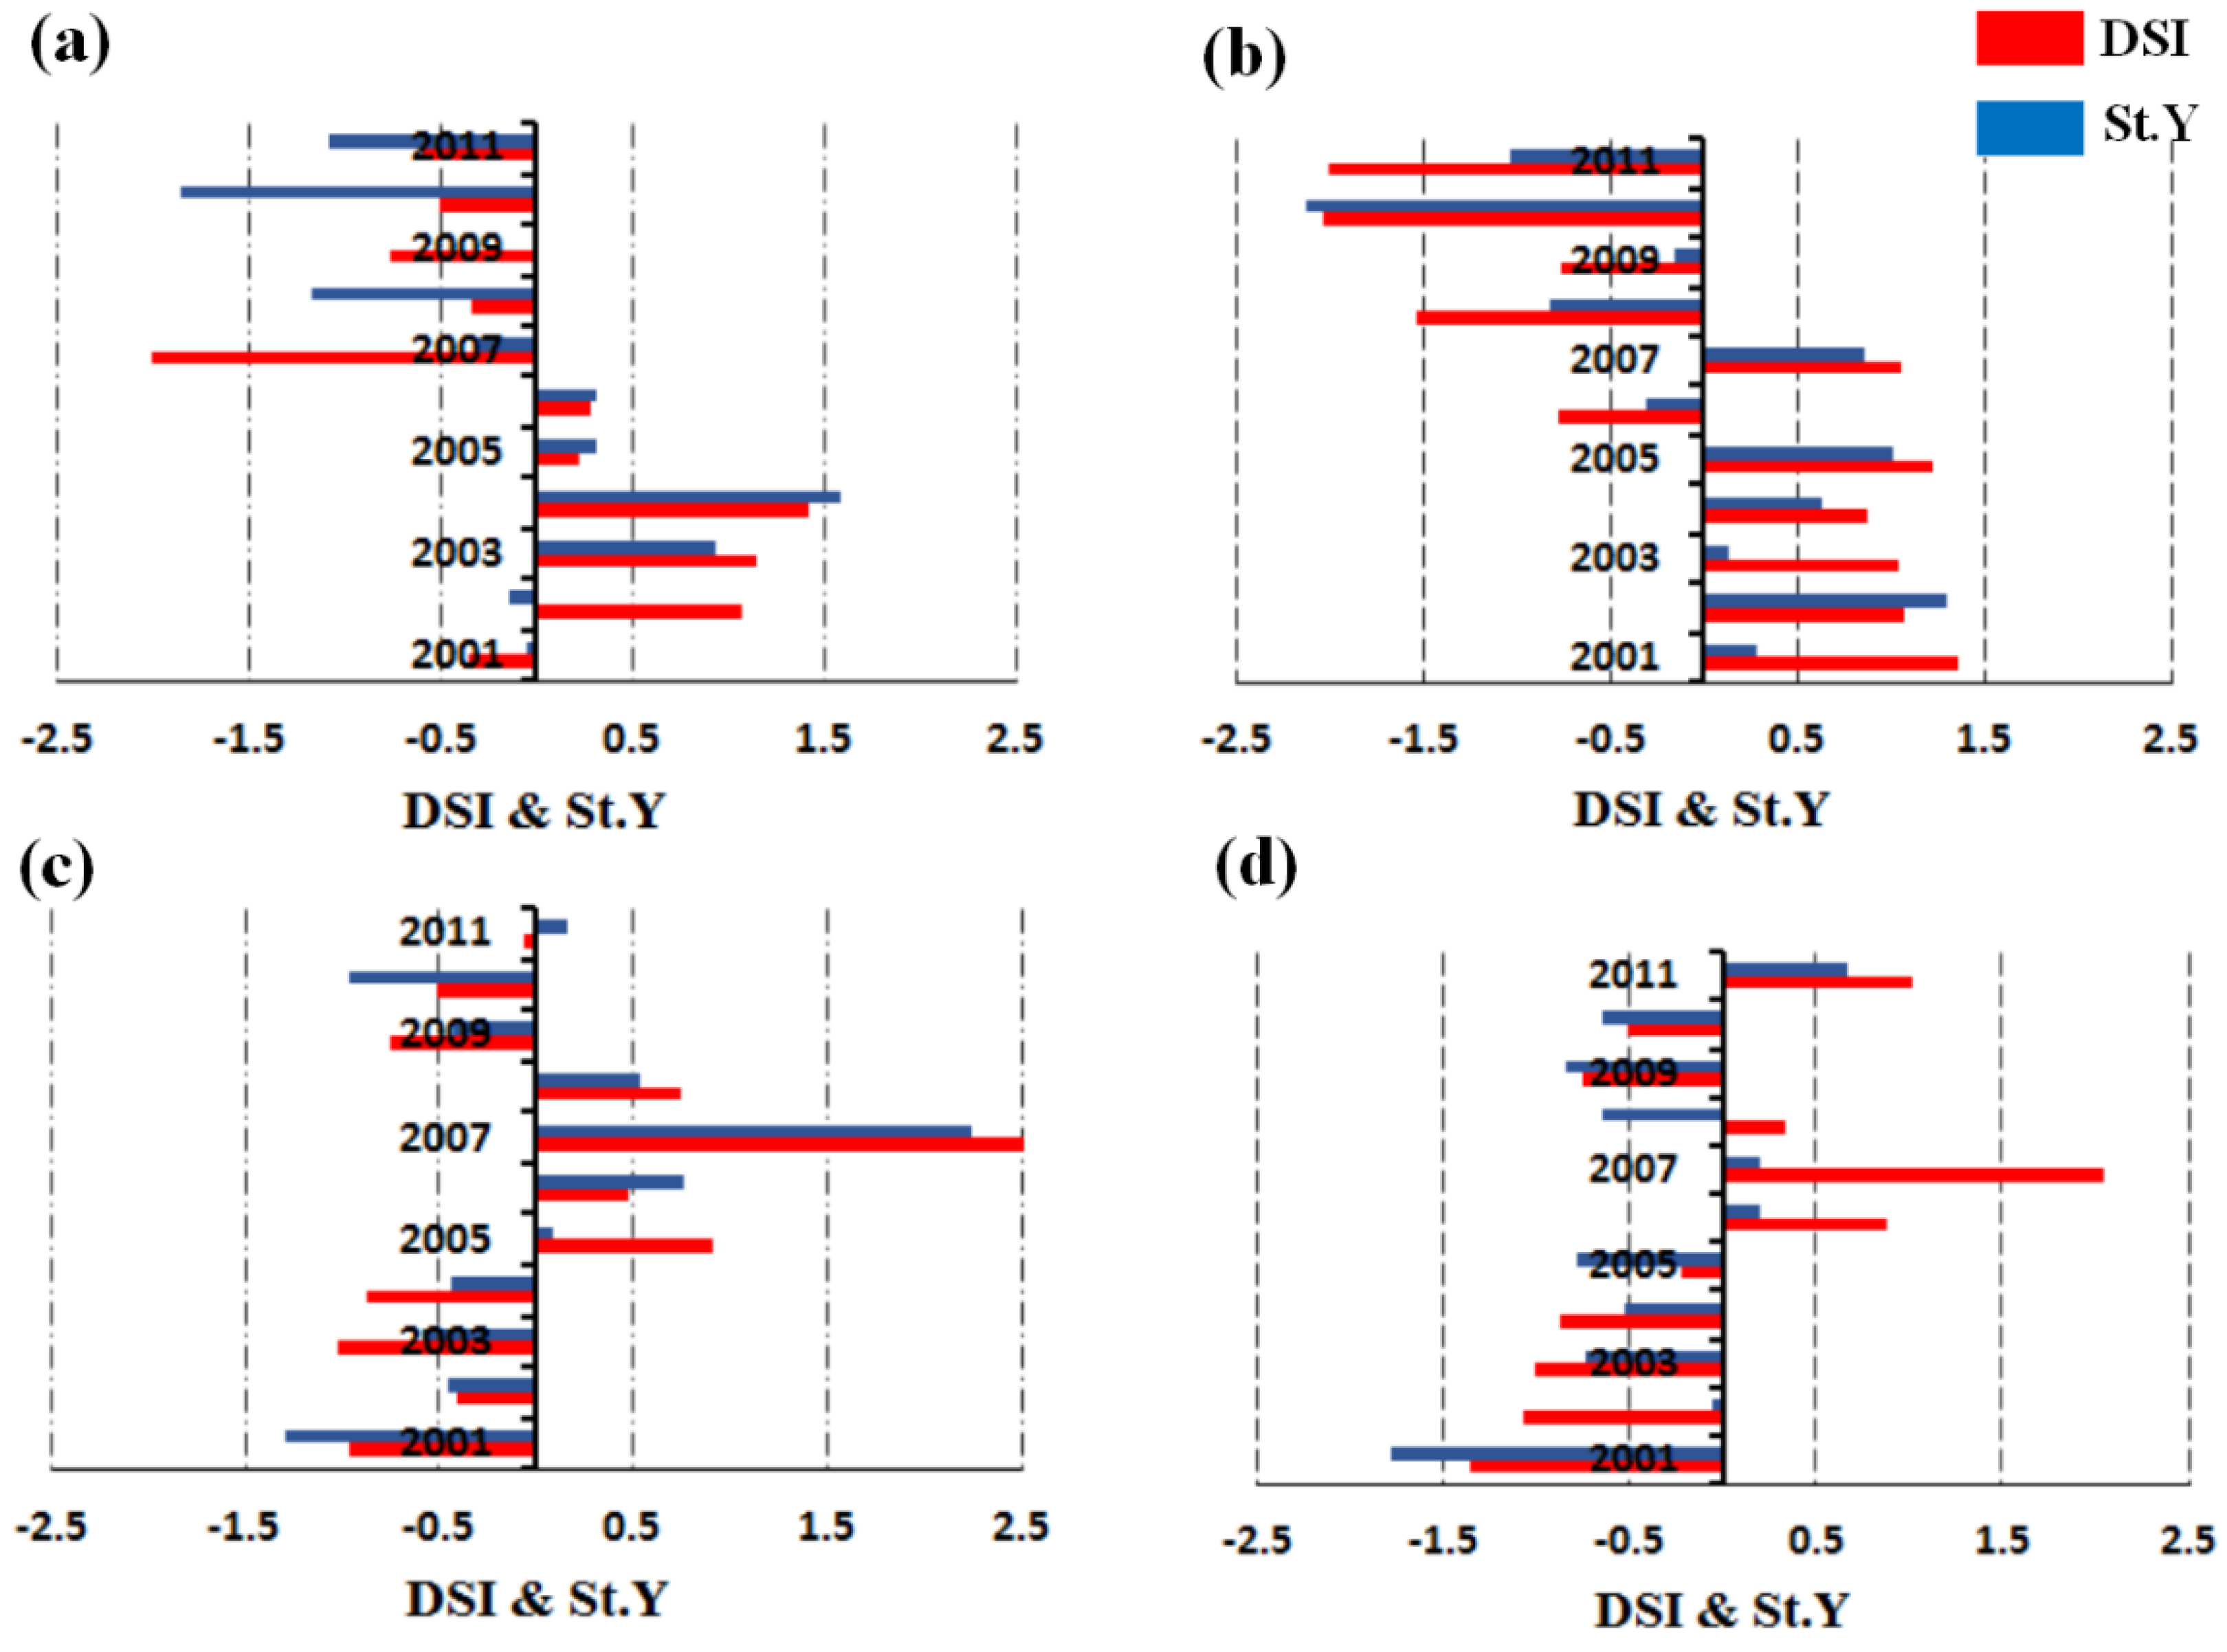
3.5. Drought Impact on Sorghum Yield

Identification of the drought impact on sorghum using St. Y was also one of the primary aims of this study. Droughts with a short duration that decrease in the rainfall during growing season were found to be even more damaging for crop productivity [53]. The climate change was supposed to decrease the crop production in Sudan significantly, and also affected other areas in East Africa, such as Ethiopia [54].
In the present study, the association of DSI among St. Y was used as an indicator to infer the influence of drought on sorghum yield in Sudan. The top sorghum producing areas in the Eastern and Central regions where the main agricultural lands were located experienced severe droughts from 2008 to 2011, which severely damaged the crops over large regions. Consequently, the sorghum yield dropped during these years. However, due to the spatial variability in the severity and extent of droughts, different regions had varied yield reductions. For example, using Equations (7) and (8), in 2009, the sorghum yield in Darfur was 25.1% lower than in 2008 and the 2010 sorghum yield in the Central region was 22.2% lower than that in 2011, but sorghum yield in 2008 in Kordofan was 32.5% higher than that in 2009. The relationship between DSI and St. Y, as shown in Figure 9, clearly revealed that the DSI was matched fairly well with the St. Y. Additionally, the effects of the dryness condition on sorghum yields also appeared in the study regions. For example, both the Darfur and Kordofan regions experienced moderate crop yield losses during 2002–2004 as the regions suffered from drought. Similarly, due to the persistent dryness conditions, the Eastern region experienced severe yield losses from 2008–2010. The results indicated that during the years 2008 to 2010, except for the Kordofan region, all the regions experienced a decrease of crop yield as a result of increasing drought severity.
Monthly drought impacts during the July–October sorghum growth season were evaluated using the monthly DSI values. The monthly DSI values were aggregated using MODIS cropland pixels within the Central and Eastern agricultural regions, which were then computed using Equations (2)–(6) from 2001–2011. The correlation analysis between cropland DSI and sorghum yield from 2001 to 2011 was attempted for each month of the sorghum growth season. Table 2 lists the correlation of DSI and sorghum yield, and from this table, we can see that the overall positive correlation of DSI with St. Y accompanying the higher correlation between DSI and sorghum yield occurred from August to September, with significant positive correlations of 0.39 and 0.57 for August and September, respectively. This result characterized the relationship between cropland DSI and sorghum yield from 2001 to 2011. In general, the DSI demonstrated a good ability to characterize agricultural drought severity in the broad areas in particular, for drought monitoring in rainfed areas, as a significant correlation of DSI among St. Y suggested.
There were large annual variations in precipitation regime over Sudan, exacerbated due to permanent long-term drought since early 1971. Global warming in combination with reduced precipitation was likely accelerating the hydrological cycle, leading to increased instances of droughts [55,56]. Our results suggested an extensive drought frequency, duration, and drought magnitude from 1971–2015 as a consequence of the decrease in precipitation, as indicated by the SPI results. In order to define normal or dry season/year from 2001 to 2011, the annual average of DSI, NDVI anomalies, and ratio ET/PET were calculated using the monthly values, as shown in Figure 10, which illustrated the variations of the annual MODIS DSI (in red) and ratio ET/PET (in black) and NDVI (in green) over Sudan from 2001 to 2011. The DSI results demonstrated its high ability to determine relative wet and drought seasons/years. The results indicated that the years 2002, 2004, 2008, 2009, 2010, and 2011 were the worst years for droughts in Sudan from 2001 to 2011, whereas the SPI approach sometimes presented false indications of drought severity. For example, in the years 2004 and 2009, the SPI values in Kordofan indicated a wet condition, but when it was compared with DSI values, the DSI results displayed mild drought, which suggested that the DSI was more accurate than SPI in terms of discrimination of wet and drought status. Furthermore, DSI results were very consistent with the result reported by Ali and Lebel [57] and their SPI value (equal −0.50) indicated significant dryness in the Sahel region. Crop production that depends primarily on water from precipitation was highly vulnerable to dry conditions and was therefore vulnerable to El Nino events. The rainfed crop yield was highly vulnerable to drought/dryness and was generally influenced by its occurrence [58]. Our findings suggested that the hazard times of drought-prompted yield loss overlapped with the August and September for sorghum.
It is very likely that the changes in temperature and precipitation patterns will affect crop productivity in the Sahel region. Consequently, the food security will also degrade. Climate factors were therefore also investigated to understand the relationship between climate change and droughts. It has been reported in several studies that an increase in the rate of evapotranspiration, as a consequence of high temperature and heatwaves, decreased soil moisture, leading to drought and directly affecting crops [2,59,60,61]. In agricultural rainfed areas, precipitation is a significant factor and therefore precipitation variability is an essential factor for crop production. A lower than average precipitation rate inhibits plant growth and affects crop yield as a result. Average change in temperature and precipitation was calculated for the duration from 1990–2013 for Sudan, as shown in Figure 11. The results suggested that there was an increase of 0.3 °C in 2011 as compared to 1990. The results also showed 2010 as the hottest year in the duration, with an average temperature of 29.2 °C and a maximum value of 49.7 °C observed in some stations. A steady rise in temperature can also be observed during the 2001–2010 decade, rising from 27.6 °C to 29.2 °C.
An increase in the spatial extent of drought was also evident from the results and correlated with changes in temperature and precipitation. For example, a below average precipitation rate and high temperatures during the 2009/2010 period considerably decreased the sorghum yields. These results suggested that variations in temperature and precipitation were also likely to affect sorghum productivity in the Sudan regions [5,54].

4. Conclusions

This study investigated the spatio-temporal extent of drought over Sudan during the early growing season of sorghum crop using two meteorological drought indices, including the Drought Severity Index (DSI) based on remotely-sensed data and the Standardized Precipitation Index (SPI) based on precipitation data. Moreover, the study assessed the capability of DSI using meteorological station-based SPI and TRMM precipitation products. Using DSI, SPI, and TRMM precipitation deficit maps in the Sudan, this study was able to identify the major drought years within the study period and drought-prone areas with drought severity. Moreover, the results of different SPI timescales show different dryness periods, which are very important for seasonal drought analysis. The temporal assessment of meteorological drought showed the occurrence of mild to extreme historical drought episodes in the different regions of Sudan. The different drought maps (TRMM precipitation deficit, DSI) illustrating drought-prone areas clearly presented the distribution of drought and areas likely to be affected in different timescales (seasonally and annually) and by different magnitudes. Moreover, this was conducted on the basis of drought occurrence, severity, and spatial pattern. The spatial correlation between DSI, SPI-3, and TRMM on growing season presented a significant positive correlation in agricultural lands and a negative correlation in mountainous areas. The DSI maps showed that large areas of Sudan from 2001–2011 experienced drought-related stress and sorghum yields were affected by heatwaves in 2009 and 2010. The DSI index was demonstrated to be a powerful tool not only in precisely determining the dryness and wetness status, but also for monitoring the onset, duration, and spatio-temporal extent of drought in rainfed agricultural areas. However, the result showed that the DSI has some limitations in terms of detecting drought in irrigated areas.
The relation between DSI and crop yield based on the Standardized variable of crop yield Index (St.Y) for sorghum yields over two main growing regions in Sudan for the 2001–2011 farming years was investigated, and the result revealed a good agreement between them. In general, drought exhibited increasing impacts on sorghum across the growing season from July to October. Little effect was found in July (green-up stage), and significant impacts were seen in August and September. Sorghum yield is likely going to face increased stress in Sudan, as a consequence of variations in climate factors, such as precipitation and temperature. Future work should focus on monthly drought at a state level and investigate the relationship between crop yields and soil moisture in semi-arid areas.
This study is comprehensive concerning application of the MODIS DSI index for spatial drought monitoring in Sudan. It could help to recognize the drought in study regions of Sudan using the MODIS DSI index and SPI. Overall, it may assist decision makers in planning actions for management of the regional drought and reducing the impact of drought/dryness across Sudan.

Author Contributions

K.M.E. and W.Z. had the original idea for the study. K.M.E. was responsible for data collecting, data analysis, and writing of the article. W.Z. supervised the study and reviewed the final version of the manuscript.

Funding

This research was funded by the [National Key R&D Program of China] grant numbers [2016YFA0602302, 2016YFB0502502].

Acknowledgments

The authors would like to thank the CAS-TWAS Fellowship Program.

Conflicts of Interest

The authors declare no conflict of interest.

References

  1. Zhao, M.; Running, S.W. Drought-induced reduction in global terrestrial net primary production from 2000 through 2009. Science 2010, 329, 940–943. [Google Scholar] [CrossRef] [PubMed]
  2. Vicente-Serrano, S.M.; Beguería, S.; López-Moreno, J.I. A multiscalar drought index sensitive to global warming: The standardized precipitation evapotranspiration index. J. Clim. 2010, 23, 1696–1718. [Google Scholar] [CrossRef]
  3. Heim, R.R., Jr. A review of twentieth-century drought indices used in the United States. Bull. Am. Meteorol. Soc. 2002, 83, 1149–1165. [Google Scholar] [CrossRef]
  4. Keyantash, J.; Dracup, J.A. The quantification of drought: An evaluation of drought indices. Bull. Am. Meteorol. Soc. 2002, 83, 1167–1180. [Google Scholar] [CrossRef]
  5. Lesk, C.; Rowhani, P.; Ramankutty, N. Influence of extreme weather disasters on global crop production. Nature 2016, 529, 84–87. [Google Scholar] [CrossRef] [PubMed]
  6. Potop, V.; Možný, M. The application a new drought index–standardized precipitation evapotranspiration index in the czech republic. Mikroklima a mezoklima krajinných structur a antropogenních prostředí 2011, 2, 2–14. [Google Scholar]
  7. Yang, M.; Yan, D.; Yu, Y.; Yang, Z. Spei-based spatiotemporal analysis of drought in haihe river basin from 1961 to 2010. Adv. Meteorol. 2016. [Google Scholar] [CrossRef]
  8. IPOC. Climate Change 2014 Impacts, Adaptation and Vulnerability: Regional Aspects; Cambridge University Press: Cambridge, UK, 2014. [Google Scholar]
  9. Parry, M.; Canziani, O.; Palutikof, J.; van der Linden, P.J.; Hanson, C.E. Climate Change 2007: Impacts, Adaptation and Vulnerability; Cambridge University Press: Cambridge, UK, 2007; Volume 4. [Google Scholar]
  10. IPOC. Report of the Nineteenth Session of the Intergovernmental Panel on Climate Change (IPCC) Geneva, 17–20 (AM Only) April 2002. 2007. Available online: www.ipcc.ch/meetings/session19/final-report.pdf (accessed on 3 August 2018).
  11. Boko, M.; Niang, I.; Nyong, A.; Vogel, C.; Githeko, A.; Medany, M.; Osman-Elasha, B.; Tabo, R.; Yanda, P. Africa; Cambridge University Press: Cambridge, UK, 2007. [Google Scholar]
  12. Wilhelmi, O.V.; Wilhite, D.A. Assessing vulnerability to agricultural drought: A nebraska case study. Nat. Hazards 2002, 25, 37–58. [Google Scholar] [CrossRef]
  13. Wilhite, D.A.; Hayes, M.J.; Knutson, C.; Smith, K.H. Planning for drought: Moving from crisis to risk management. J. Am. Water Resour. Assoc. 2000, 36, 697–710. [Google Scholar] [CrossRef]
  14. Zargar, A.; Sadiq, R.; Naser, B.; Khan, F.I. A review of drought indices. Environ. Rev. 2011, 19, 333–349. [Google Scholar] [CrossRef]
  15. Zhang, X.; Yamaguchi, Y. Characterization and evaluation of MODIS-derived drought severity index (DSI) for monitoring the 2009/2010 drought over southwestern China. Nat. Hazards 2014, 74, 2129–2145. [Google Scholar] [CrossRef]
  16. Kogan, F. Application of vegetation index and brightness temperature for drought detection. Adv. Space Res. 1995, 15, 91–100. [Google Scholar] [CrossRef]
  17. Kogan, F.N. Global drought watch from space. Bull. Am. Meteorol. Soc. 1997, 78, 621–636. [Google Scholar] [CrossRef]
  18. Kogan, F.N. Droughts of the late 1980s in the United States as derived from NOAA polar-orbiting satellite data. Bull. Am. Meteorol. Soc. 1995, 76, 655–668. [Google Scholar] [CrossRef]
  19. Zhang, A.; Jia, G. Monitoring meteorological drought in semiarid regions using multi-sensor microwave remote sensing data. Remote Sens. Environ. 2013, 134, 12–23. [Google Scholar] [CrossRef]
  20. Xu, Y.; Wang, L.; Ross, K.; Liu, C.; Berry, K. Standardized soil moisture index for drought monitoring based on soil moisture active passive observations and 36 years of north American land data assimilation system data: A case study in the southeast United States. Remote Sens. 2018, 10, 301. [Google Scholar] [CrossRef]
  21. Sánchez, N.; González-Zamora, Á.; Piles, M.; Martínez-Fernández, J. A new soil moisture agricultural drought index (SMADI) integrating MODIS and SMOS products: A case of study over the Iberian Peninsula. Remote Sens. 2016, 8, 287. [Google Scholar] [CrossRef]
  22. Kogan, F. World droughts in the new millennium from AVHRR-based vegetation health indices. Eos Trans. Am. Geophys. Union 2002, 83, 557–563. [Google Scholar] [CrossRef]
  23. Gu, Y.; Brown, J.F.; Verdin, J.P.; Wardlow, B. A five-year analysis of MODIS NDVI and NDWI for grassland drought assessment over the central great plains of the United States. Geophys. Res. Lett. 2007, 34, 34. [Google Scholar] [CrossRef]
  24. Sun, H.; Zhao, X.; Chen, Y.; Gong, A.; Yang, J. A new agricultural drought monitoring index combining modis ndwi and day–night land surface temperatures: A case study in China. Int. J. Remote Sens. 2013, 34, 8986–9001. [Google Scholar] [CrossRef]
  25. Mu, Q.; Zhao, M.; Kimball, J.S.; McDowell, N.G.; Running, S.W. A remotely sensed global terrestrial drought severity index. Bull. Am. Meteorol. Soc. 2013, 94, 83–98. [Google Scholar] [CrossRef]
  26. Jung, M.; Reichstein, M.; Ciais, P.; Seneviratne, S.I.; Sheffield, J.; Goulden, M.L.; Bonan, G.; Cescatti, A.; Chen, J.; de Jeu, R.; et al. Recent decline in the global land evapotranspiration trend due to limited moisture supply. Nature 2010, 467, 951–954. [Google Scholar] [CrossRef] [PubMed] [Green Version]
  27. Anderson, M.C.; Norman, J.M.; Mecikalski, J.R.; Otkin, J.A.; Kustas, W.P. A climatological study of evapotranspiration and moisture stress across the continental United States based on thermal remote sensing: 2. Surface moisture climatology. J. Geophys. Res. Atmos. 2007, 112. [Google Scholar] [CrossRef]
  28. Gerten, D.; Rost, S.; von Bloh, W.; Lucht, W. Causes of change in 20th century global river discharge. Geophys. Res. Lett. 2008, 35. [Google Scholar] [CrossRef] [Green Version]
  29. Xu, L.; Samanta, A.; Costa, M.H.; Ganguly, S.; Nemani, R.R.; Myneni, R.B. Widespread decline in greenness of Amazonian vegetation due to the 2010 drought. Geophys. Res. Lett. 2011, 38. [Google Scholar] [CrossRef] [Green Version]
  30. Amri, R.; Zribi, M.; Lili-Chabaane, Z.; Duchemin, B.; Gruhier, C.; Chehbouni, A. Analysis of vegetation behavior in a north African semi-arid region, using spot-vegetation NDVI data. Remote Sens. 2011, 3, 2568–2590. [Google Scholar] [CrossRef] [Green Version]
  31. Zribi, M.; Dridi, G.; Amri, R.; Lili-Chabaane, Z. Analysis of the effects of drought on vegetation cover in a Mediterranean region through the use of SPOT-VGT and TERRA-MODIS long time series. Remote Sens. 2016, 8, 992. [Google Scholar] [CrossRef]
  32. Osman, Y.Z.; Shamseldin, A.Y. Qualitative rainfall prediction models for central and southern Sudan using el niño–southern oscillation and Indian ocean sea surface temperature indices. Int. J. Climatol. 2002, 22, 1861–1878. [Google Scholar] [CrossRef]
  33. Funk, C.C.; Eilerts, G.; Verdin, J.; Rowland, J.; Marshall, M. A Climate Trend Analysis of Sudan; US Geological Survey: Reston, VA, USA, 2011; pp. 2327–6932.
  34. Elagib, N.A.; Elhag, M.M. Major climate indicators of ongoing drought in Sudan. J. Hydrol. 2011, 409, 612–625. [Google Scholar] [CrossRef]
  35. Mu, Q.; Heinsch, F.A.; Zhao, M.; Running, S.W. Development of a global evapotranspiration algorithm based on MODIS and global meteorology data. Remote Sens. Environ. 2007, 111, 519–536. [Google Scholar] [CrossRef]
  36. Mu, Q.; Jones, L.A.; Kimball, J.S.; McDonald, K.C.; Running, S.W. Satellite assessment of land surface evapotranspiration for the pan-arctic domain. Water Resour. Res. 2009, 45. [Google Scholar] [CrossRef]
  37. Mu, Q.; Zhao, M.; Running, S.W.; Kimball, J.S.; McDowell, N.G. Using MODIS weekly evapotranspiration to monitor drought. SPIE Opt. Eng. Appl. 2016. [Google Scholar] [CrossRef]
  38. Almazroui, M. Calibration of TRMM rainfall climatology over Saudi Arabia during 1998–2009. Atmos. Res. 2010, 99, 400–414. [Google Scholar] [CrossRef]
  39. McKee, T.B.; Doesken, N.J.; Kleist, J. The relationship of drought frequency and duration to time scales. In Proceedings of the 8th Conference on Applied Climatology, Boston, MA, USA, 17–22 January 1933; Meteorological Society: Boston, MA, USA, 1933; pp. 179–183. [Google Scholar]
  40. Hayes, M.; Svoboda, M.; Wall, N.; Widhalm, M. The lincoln declaration on drought indices: Universal meteorological drought index recommended. Bull. Am. Meteorol. Soc. 2011, 92, 485–488. [Google Scholar] [CrossRef]
  41. Svoboda, M.; Hayes, M.; Wood, D. Standardized Precipitation Index User Guide; World Meteorological Organization: Geneva, Switzerland, 2012. [Google Scholar]
  42. Naumann, G.; Barbosa, P.; Carrao, H.; Singleton, A.; Vogt, J. Monitoring drought conditions and their uncertainties in Africa using TRMM data. J. Appl. Meteorol. Climatol. 2012, 51, 1867–1874. [Google Scholar] [CrossRef]
  43. Lu, G.Y.; Wong, D.W. An adaptive inverse-distance weighting spatial interpolation technique. Comput. Geosci. 2008, 34, 1044–1055. [Google Scholar] [CrossRef]
  44. Legates, D.R.; Willmott, C.J. Mean seasonal and spatial variability in gauge-corrected, global precipitation. Int. J. Climatol. 1990, 10, 111–127. [Google Scholar] [CrossRef]
  45. Artan, G.; Gadain, H.; Smith, J.L.; Asante, K.; Bandaragoda, C.J.; Verdin, J.P. Adequacy of satellite derived rainfall data for stream flow modeling. Nat. Hazards 2007, 43, 167–185. [Google Scholar] [CrossRef]
  46. Salim, H.A.; Chen, X.; Gong, J. Analysis of sudan vegetation dynamics using noaa-avhrr ndvi data from 1993–2003. In Geological Engineering: Proceedings of the 1st International Conference (ICGE 2007); Ma, B., Ed.; ASME: New York, NY, USA, 2009; pp. 163–169. [Google Scholar]
  47. Anyamba, A.; Small, J.; Tucker, C.; Pak, E. Thirty-two years of sahelian zone growing season non-stationary ndvi3g patterns and trends. Remote Sens. 2014, 6, 3101–3122. [Google Scholar] [CrossRef]
  48. Mohamed, N.; Abdou, B. The relationship between vegetation and rainfall in central Sudan. Int. J. Remote Sens. Appl. 2016, 6, 30–40. [Google Scholar] [CrossRef]
  49. Zhang, J.; Mu, Q.; Huang, J. Assessing the remotely sensed drought severity index for agricultural drought monitoring and impact analysis in north china. Ecol. Indic. 2016, 63, 296–309. [Google Scholar] [CrossRef]
  50. Rojas, O.; Yanyun, L.; Cumani, R. Understanding the Drought Impact of EL Niño on the Global Agricultural Areas: An Assessment Using FAO’s Agricultural Stress Index (ASI); FAO: Rome, Italy, 2014. [Google Scholar]
  51. Vidhi, B.; Charu, S. Evaluation of error in TRMM 3b42v7 precipitation estimates over the Himalayan region. J. Geophys. Res. Atmos. 2015, 120, 12458–12473. [Google Scholar]
  52. Thompson, L.G.; Mosley-Thompson, E.; Davis, M.E.; Henderson, K.A.; Brecher, H.H.; Zagorodnov, V.S.; Mashiotta, T.A.; Lin, P.-N.; Mikhalenko, V.N.; Hardy, D.R.; et al. Kilimanjaro ice core records: Evidence of holocene climate change in tropical Africa. Science 2002, 298, 589–593. [Google Scholar] [CrossRef] [PubMed]
  53. Potopová, V.; Boroneanţ, C.; Boincean, B.; Soukup, J. Impact of agricultural drought on main crop yields in the republic of Moldova. Int. J. Climatol. 2016, 36, 2063–2082. [Google Scholar] [CrossRef]
  54. Hope Sr, K.R. Climate change and poverty in Africa. Int. J. Sustain. Dev. World Ecol. 2009, 16, 451–461. [Google Scholar] [CrossRef]
  55. Oki, T.; Kanae, S. Global hydrological cycles and world water resources. Science 2006, 313, 1068–1072. [Google Scholar] [CrossRef] [PubMed]
  56. Huntington, T.G. Evidence for intensification of the global water cycle: Review and synthesis. J. Hydrol. 2006, 319, 83–95. [Google Scholar] [CrossRef]
  57. Ali, A.; Lebel, T. The sahelian standardized rainfall index revisited. Int. J. Climatol. 2009, 29, 1705–1714. [Google Scholar] [CrossRef]
  58. Bannayan, M.; Sanjani, S.; Alizadeh, A.; Lotfabadi, S.S.; Mohamadian, A. Association between climate indices, aridity index, and rainfed crop yield in northeast of Iran. Field Crops Res. 2010, 118, 105–114. [Google Scholar] [CrossRef]
  59. Park, S.; Im, J.; Jang, E.; Rhee, J. Drought assessment and monitoring through blending of multi-sensor indices using machine learning approaches for different climate regions. Agric. For. Meteorol. 2016, 216, 157–169. [Google Scholar] [CrossRef]
  60. Li, B.; Liang, Z.; Yu, Z.; Acharya, K. Evaluation of drought and wetness episodes in a cold region (northeast China) since 1898 with different drought indices. Nat. Hazards 2014, 71, 2063–2085. [Google Scholar] [CrossRef]
  61. McVicar, T.R.; Roderick, M.L.; Donohue, R.J.; Li, L.T.; Van Niel, T.G.; Thomas, A.; Grieser, J.; Jhajharia, D.; Himri, Y.; Mahowald, N.M. Global review and synthesis of trends in observed terrestrial near-surface wind speeds: Implications for evaporation. J. Hydrol. 2012, 416, 182–205. [Google Scholar] [CrossRef]
Figure 1. (a) Location map and DEM (SRTM) of Sudan, (b) Distribution of TRMM average annual rainfall (mm) over Sudan for 2001–2011.
Remotesensing 10 01231 g001
Figure 2. Land use and land cover map of Sudan based on MODIS land cover type product (MCD12Q1) with a global vegetation classification scheme (IGBP) and the location of meteorological stations within Sudan.
Remotesensing 10 01231 g002
Figure 3. The MODIS cropland used for two main agricultural regions: (a) Central region and (b) Eastern region.
Remotesensing 10 01231 g003
Figure 4. The standardized precipitation index values at different spatio-temporal scales over Sudan. The blue rectangle indicates the first decade, the red rectangle indicates the second decade, the yellow rectangle indicates third decade, and the black rectangle indicates the fourth decade. The black line indicates the average of SPI.
Remotesensing 10 01231 g004
Figure 5. Spatial distribution of TRMM deficit estimates (mm/month) for the growing season over Sudan within the study period of 2001–2011.
Remotesensing 10 01231 g005
Figure 6. Seasonal DSI distribution maps from 2001 to 2011. The blue color polygon indicates the irrigated areas.
Remotesensing 10 01231 g006
Figure 7. Annual DSI maps over Sudan from 2001 to 2011. The blue color polygon indicates the irrigated areas.
Remotesensing 10 01231 g007
Figure 8. Spatial correlation coefficient values of growing seasons during the study period: (a) SPI3 and DSI for 2001–2011 and (b) TRMM and DSI for 2001–2011. The white color shows unavailability of the data (Saharan Desert).
Remotesensing 10 01231 g008
Figure 9. Average DSI and St.Y of sorghum yield of four regions from 2001–2011 in Sudan: (a) Eastern region, (b) Central region, (c) Kordofan region, and (d) Darfur region.
Remotesensing 10 01231 g009
Figure 10. Average annual DSI, standardized ET/PET, and standardized NDVI over 2001–2011 in Sudan.
Remotesensing 10 01231 g010
Figure 11. Average annual precipitation and temperature for the period 1990–2013.
Remotesensing 10 01231 g011
Table 1. The DSI, SPI, and St. Y categories and discerption system.
St. YSt. Y CategoriesDSIDSI-CategorySPIDrought Level
0 to −0.49Normal0.29 to −0.29Near normal0.50 to 0.99Slightly wet
−0.5 to −0.99Low yield losses−0.3 to −0.59Incipient drought0 to −0.99Normal
−1.0 to −1.49Moderate yield losses−0.6 to −0.89Mild drought−1.0 to −1.49Moderate drought
−1.5 to −1.99Severe yield losses−0.9 to −1.19Moderate drought−1.5 to −1.99Severe drought
≤−2.0Extreme yield losses−1.2 to −1.49
−1.5 or less
Severe drought
Extreme drought
≤−2.0Extreme drought
Table 2. Correlation of the monthly DSI, series (July–October), and sorghum yield in two regions from 2001–2011.
RegionDSI-EasternDSI-Central
July0.250.22
August0.37 *0.39 *
September0.57 **0.54 **
October0.110.19
Note: * p < 0.05, ** p < 0.01.

