Article

Current Activity of the Long Point Fault in Houston, Texas Constrained by Continuous GPS Measurements (2013–2018)

1
Department of Earth and Atmospheric Sciences, University of Houston, Houston, TX 77204, USA
2
School of Civil Engineering, Tianjin Chengjian University, Tianjin 300384, China
3
Harris-Galveston Subsidence District, Houston, TX 77456, USA
4
The Key Laboratory of Urban Security and Disaster Engineering, Beijing University of Technology, Beijing 100124, China
5
School of Geology and Geomatics, Tianjin Chengjian University, Tianjin 300384, China
6
Department of Civil and Environmental Engineering, College of Engineering, Shantou University, Shantou 515063, China
*
Author to whom correspondence should be addressed.
Remote Sens. 2019, 11(10), 1213; https://0-doi-org.brum.beds.ac.uk/10.3390/rs11101213
Submission received: 26 April 2019 / Revised: 15 May 2019 / Accepted: 20 May 2019 / Published: 22 May 2019

Abstract

:
The Long Point Fault is one of the most active urban faults in Houston, Texas, which belong to a complex system of normal growth faults along the Texas Gulf Coast. To assess the activity of the Long Point Fault, a GPS array with 12 permanent stations was installed along the two sides of the 16-km-long fault scarp in 2013. GPS datasets were processed with the Precise Point Positioning (PPP) and Double-Difference (DD) methods. The daily PPP solutions with respect to the International Global Navigation Satellite System (GNSS) Reference Frame 2014 (IGS14) were converted to the Stable Houston Reference Frame (Houston16). The six-year continuous GPS observations indicate that the Long Point Fault is currently inactive, with the rates of down-dip-slip and along-strike-slip being below 1 mm/year. The Long Point Fault area is experiencing moderate subsidence varying from 5 to 11 mm/year and a coherent horizontal movement towards the northwest at a rate of approximately 2 to 4 mm/year. The horizontal movement is induced by the subsidence bowl that has been developing since the 1980s in the Jersey Village area. Current surficial damages in the Long Point Fault area are more likely caused by ongoing uneven subsidence and its induced horizontal strains, as well as the significant seasonal ground deformation, rather than deep-seated or tectonic-controlled fault movements. The results from this study suggest a cause-and-effect relationship between groundwater withdrawals and local faulting, which is pertinent to plans for future urban development, use of groundwater resources, and minimization of urban geological hazards.

Graphical Abstract

1. Introduction

The Houston metropolitan area, more broadly the Gulf Coast region, has numerous gravitationally induced “down-to-the-coast” faults that represent slow sliding of the land mass towards the Gulf of Mexico. Some of these faults have resulted in costly damages to private and public surface infrastructure including buildings, roadways, parking lots, drainage structures, utility systems, and building foundations. The damages require constant repairs that burden private citizens, businesses, and government agencies. Active faults in Houston were first recognized as early as 1926 [1]. By 1973, about 52 historically active faults had been recognized in the Houston area with an aggregate length of 220 km [2,3,4,5]. By 1979, the number of identified historically active faults had increased to over 150 and the total length was over 500 km [6,7,8]. Recently, more urban faults have been identified based on high-resolution digital elevation models (DEMs) derived from airborne Light Detection and Ranging (LiDAR) and Interferometric Synthetic Aperture Radar (InSAR) datasets in the Houston metropolitan area [9,10,11]. Figure 1 illustrates the principal faults in the Houston metropolitan area mapped by the US Geological Survey (USGS) using high-resolution airborne LiDAR data collected in October 2001 [12]. These faults have been documented at depths from 1000 to 4000 m based on extensive investigations using geophysical well logs and deep seismic surveys. The growth fault systems that cut the Pre-Miocene-age sediments (Holocene-, Pleistocene-, and Pliocene-age sediments) were formed millions of years ago during the formation of the Gulf of Mexico [8].
Previous studies reported that many of the Houston faults moved on average at downward rates of 0.5 to 3 cm/year during the periods that they studied [5,8,13,14]. These investigations also realized the variations of the movements of Houston faults in space and time. Verbeek et al. [8] pointed out that the movements of many Houston faults were episodic. Sections of some faults that had been dormant for years could suddenly become active, as illustrated dramatically by the fault at Goose Creek oil field [1]. Conversely, other faults with a long history of damage to manmade structures may become inactive [3]. No significant earthquakes have occurred on these faults in historic times, but recurring infrastructure damages have been frequently observed in the vicinity of the fault areas since the 1960s.
The Long Point Fault is one of the growth faults that have offset the present land surface, which can be clearly recognized from the high-resolution DEM map derived from airborne LiDAR data as shown in Figure 2. The LiDAR data was collected in October 2001 by the Harris County Flood Control District (HCFCD, http://www.hcfcd.org). The length of the fault scarp that can be traced on the DEM map is approximately 16 km. However, it is difficult to determine the fault scarp in the field because the original fault scarp has been modified by erosion or human activities (Figure 3a). Luckily, the fault scarp between HCC1 and HCC2 has been preserved and can be identified in the field (Figure 3b,c). Figure 3d shows the randomly tilted utility poles and the recurring cracks on the parking lot near the fault scarp. The parking lot of the Houston Community College at Spring Branch needs to be repaved approximately every five years because of the damages from cracking. Parking lots and some neighborhood roads adjacent to the Long Point Fault are often made of asphalt rather than concrete in an attempt to accommodate fault creeping. Pavement cracks in roads and parking lots and offset street curbs are primary aids in identifying fault traces in the field.
Figure 4 depicts three 5-km-long topographic profiles along HCC2 and HCC1, SPBH and CSTE, and RDCT, and HSMN. The locations of these three topographic profiles are shown in Figure 2. The elevation difference between the footwall (upthrown) and hangingwall (downthrown) sides can be clearly identified. The height of the surface scarp is approximately one to two meters. Although it is difficult to trace the fault scarp in the field continuously, the coherent elevation difference between the hangingwall and footwall sides exhibited in Figure 2 remains to suggest the approximate location of the fault scarp. The surface fault scarp had been evaluated and confirmed as the surface offset of the Long Point Fault by previous studies [5,12]. Reid (1973) [5] traced the Long Point Fault to a depth of approximately 3000 m by use of electric logs. The present-day surface scarp reflects only the most recent vertical displacements of the fault. The fault was active long before the present land surface of the area was formed. Figure 5 illustrates a sketch of the geologic cross-section of the Long Point Fault near the Addicks extensometer site. The location of the cross-section is shown in Figure 2. As a growth fault, the principal mechanism causing structural damages is the sinking of the hangingwall (downthrown side) relative to the footwall (upthrown side), although fault damages may take a variety of forms depending on specific structures and the distance and direction to the fault trace.
As a destructive fault striking through the densely populated urban area, the Long Point Fault is of particular interest to the Harris–Galveston Subsidence District (HGSD) (https://hgsubsidence.org/), urban planners, civil engineers, and the research community. It is crucial for residents, property, and business owners, local and state government agencies to understand the kinematics and causes of the Long Point Fault and wisely estimate the risk of future property damages. This study aims to quantify the current activity of the Long Point Fault and analyze the correlations among groundwater withdrawals, subsidence, and faulting.

2. Data and Methods

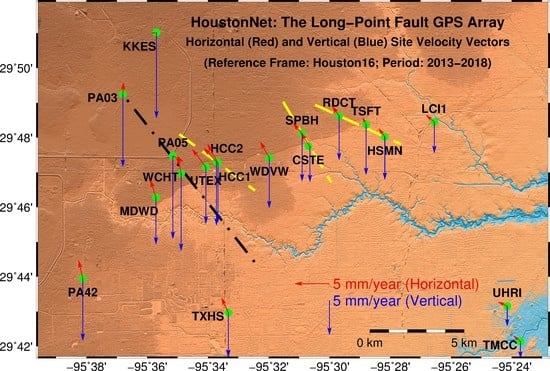
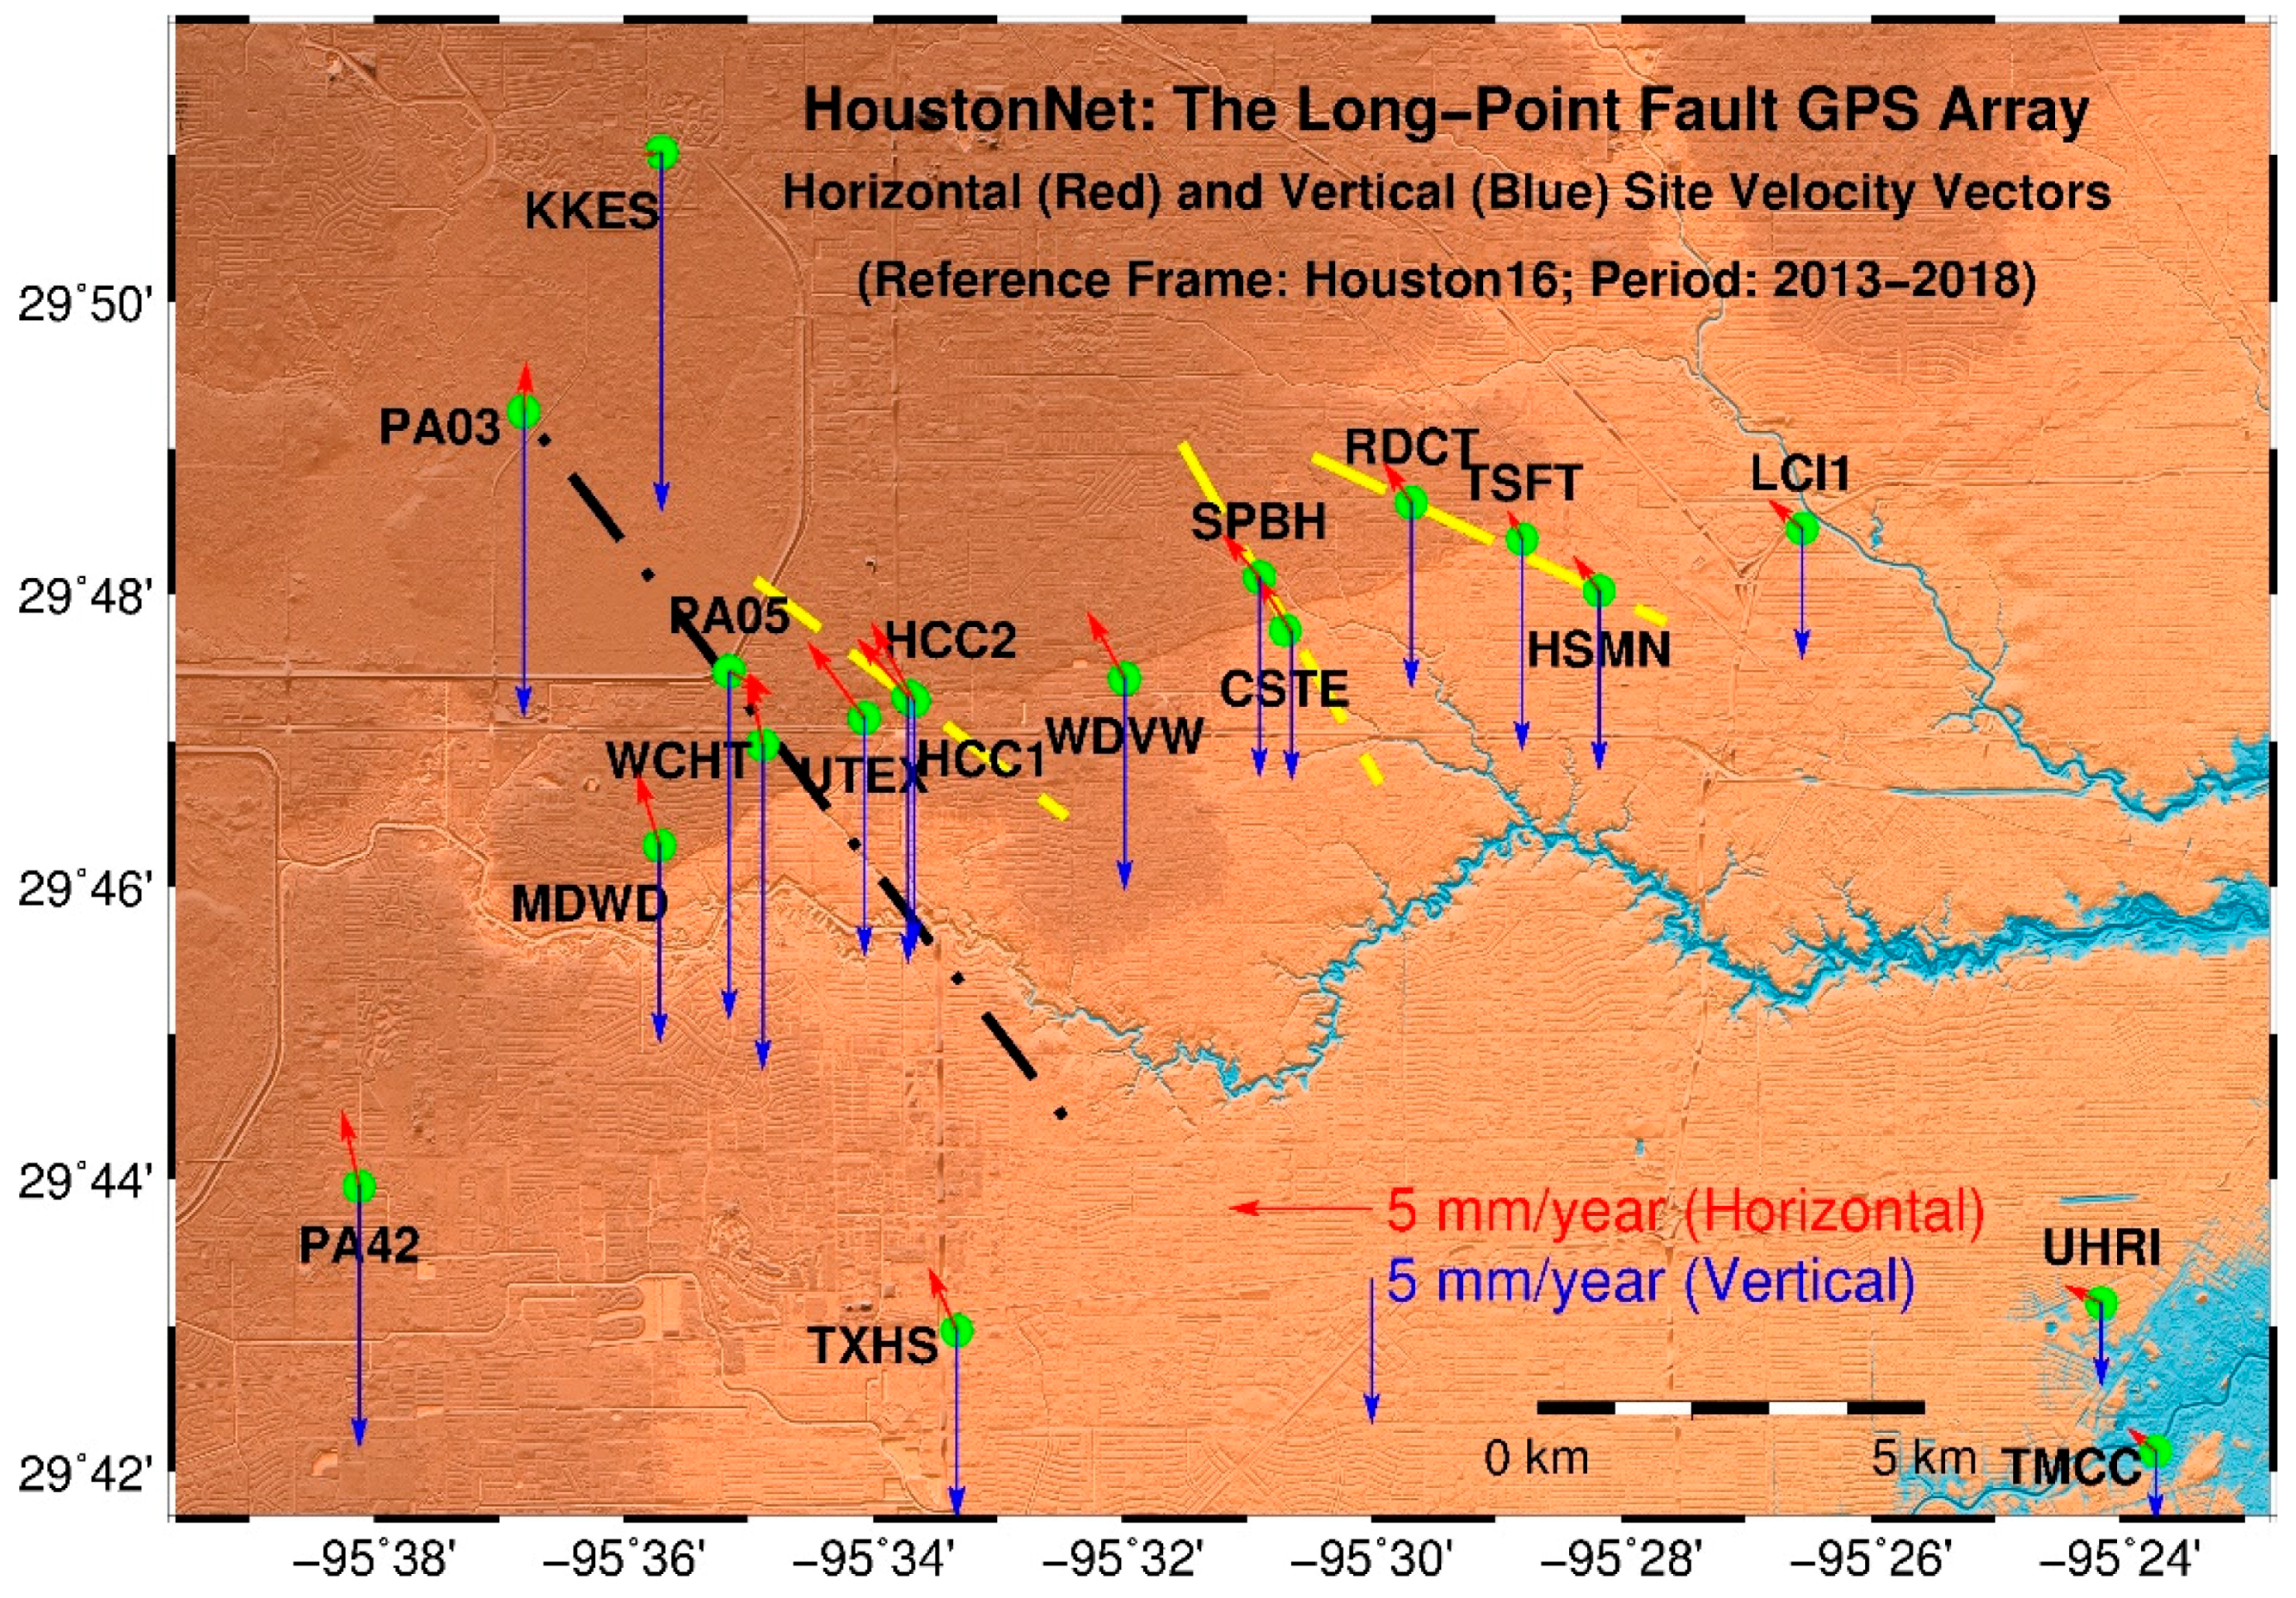
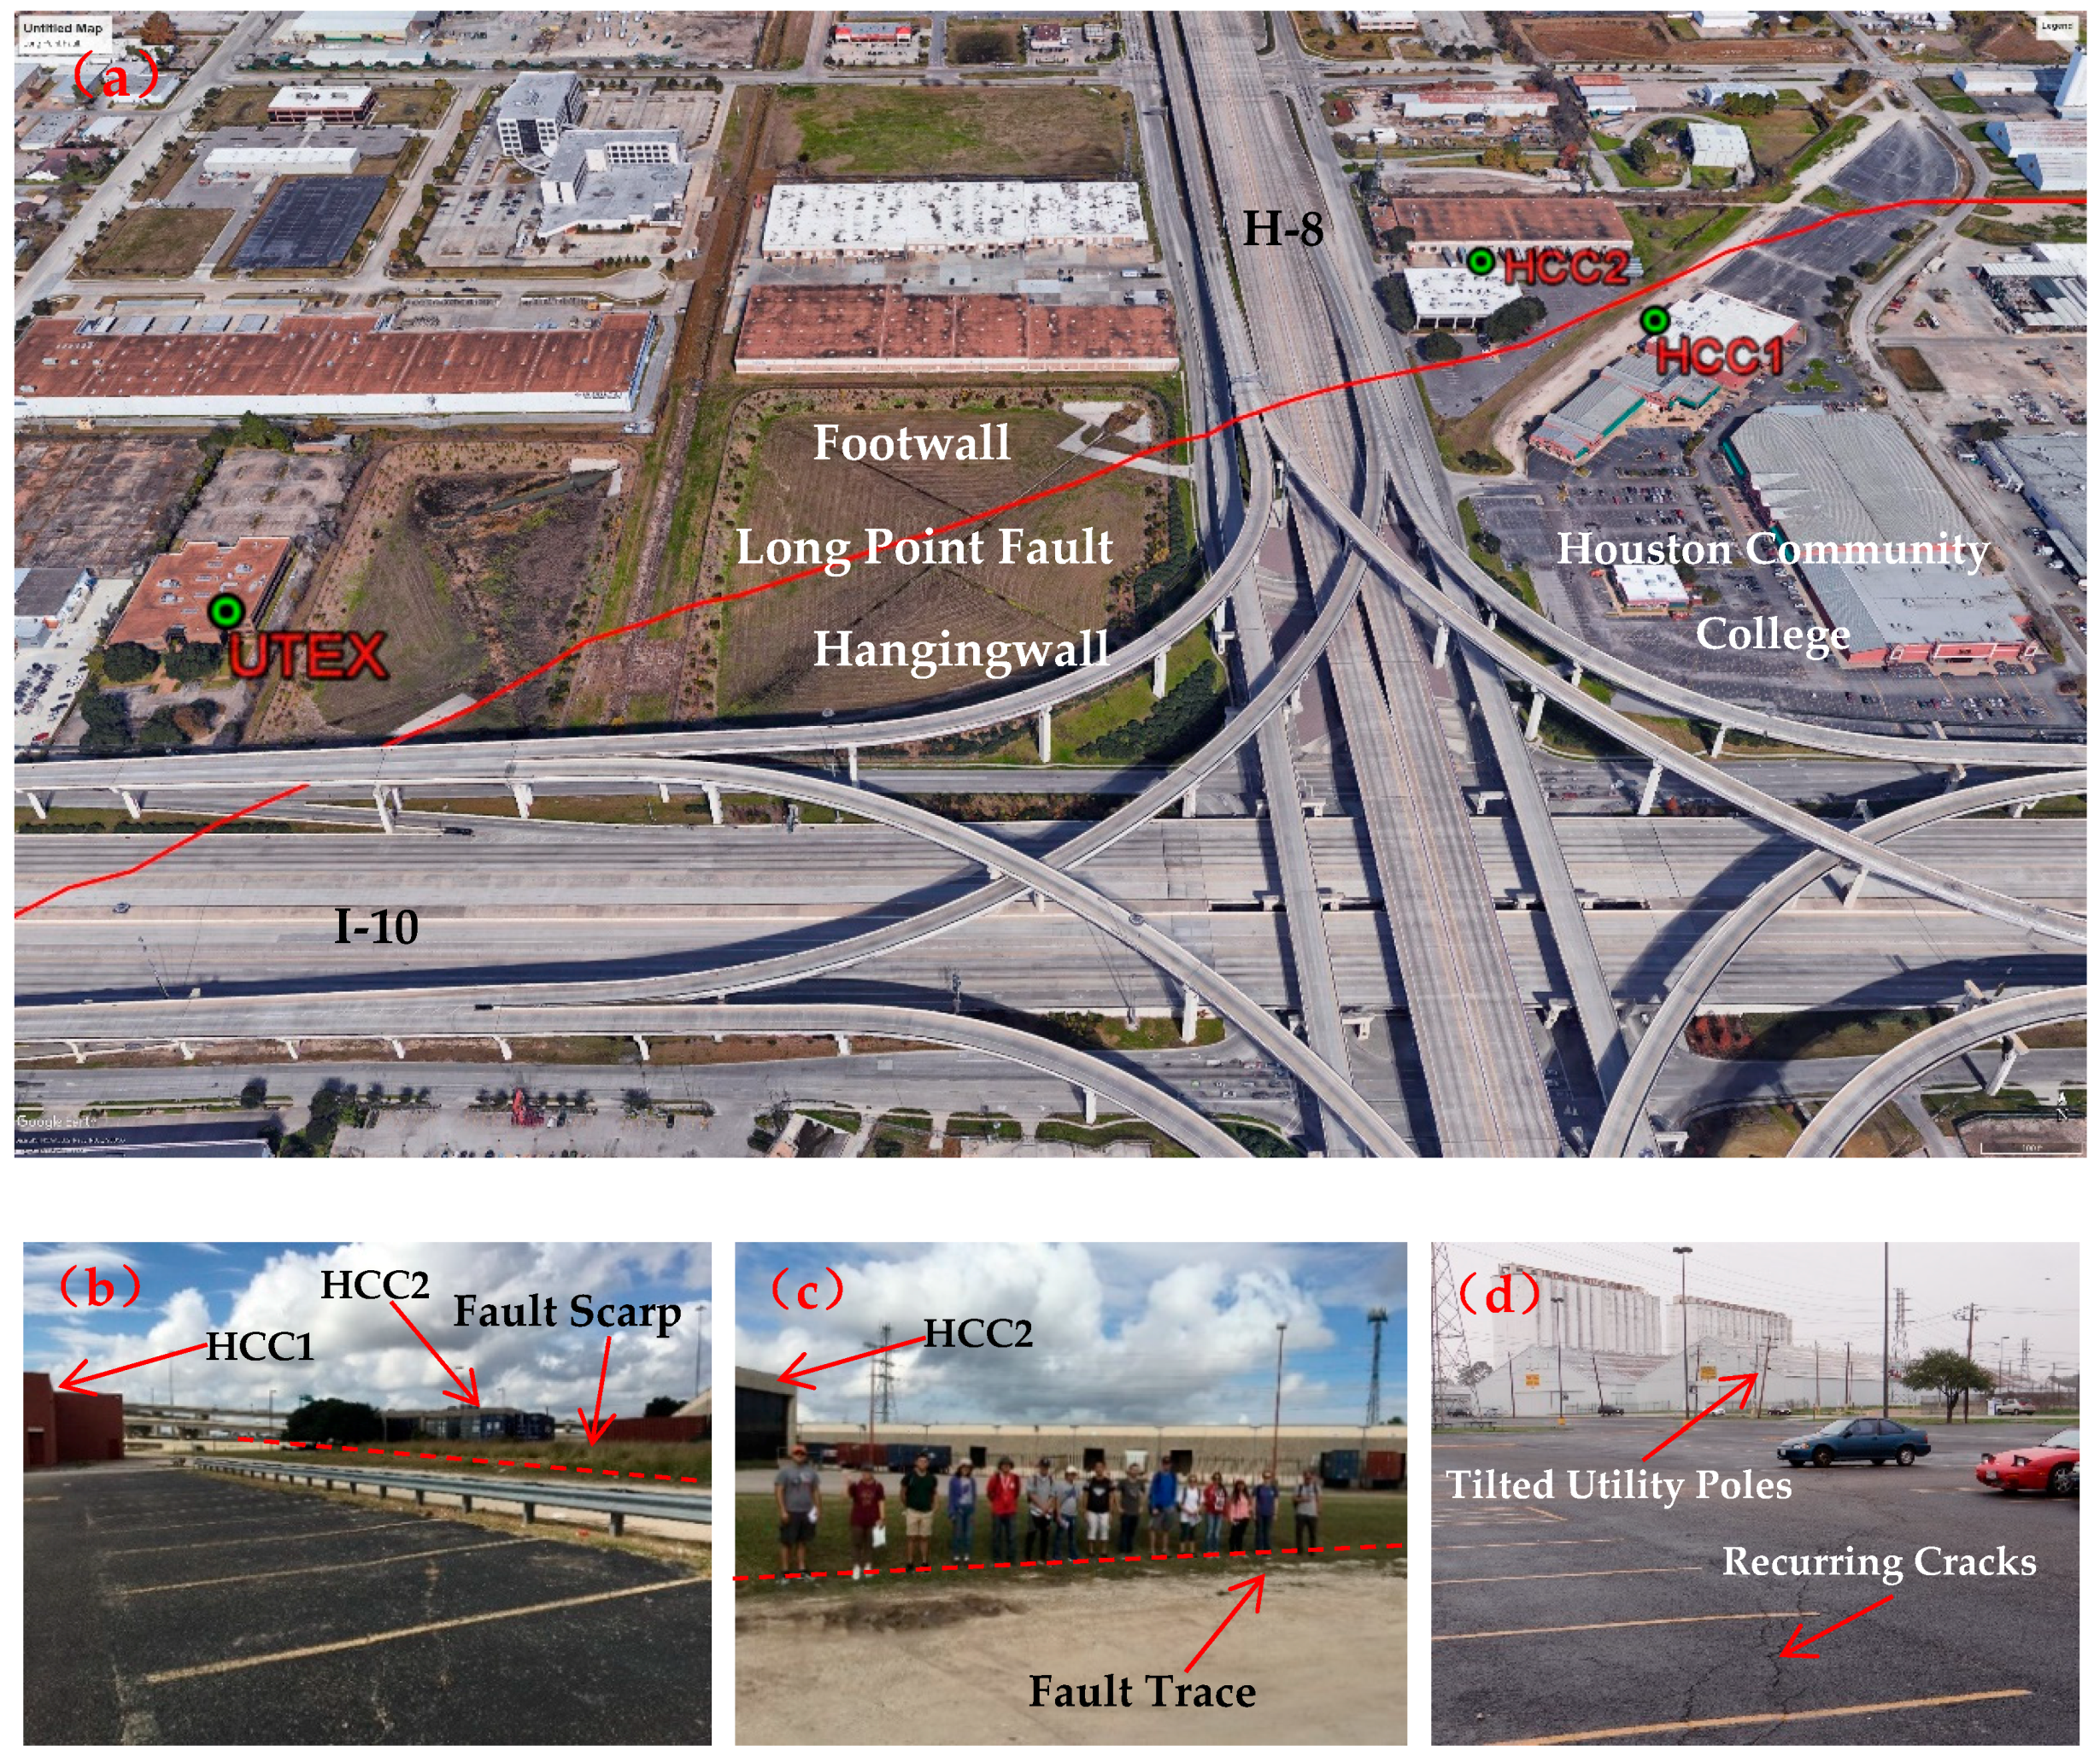
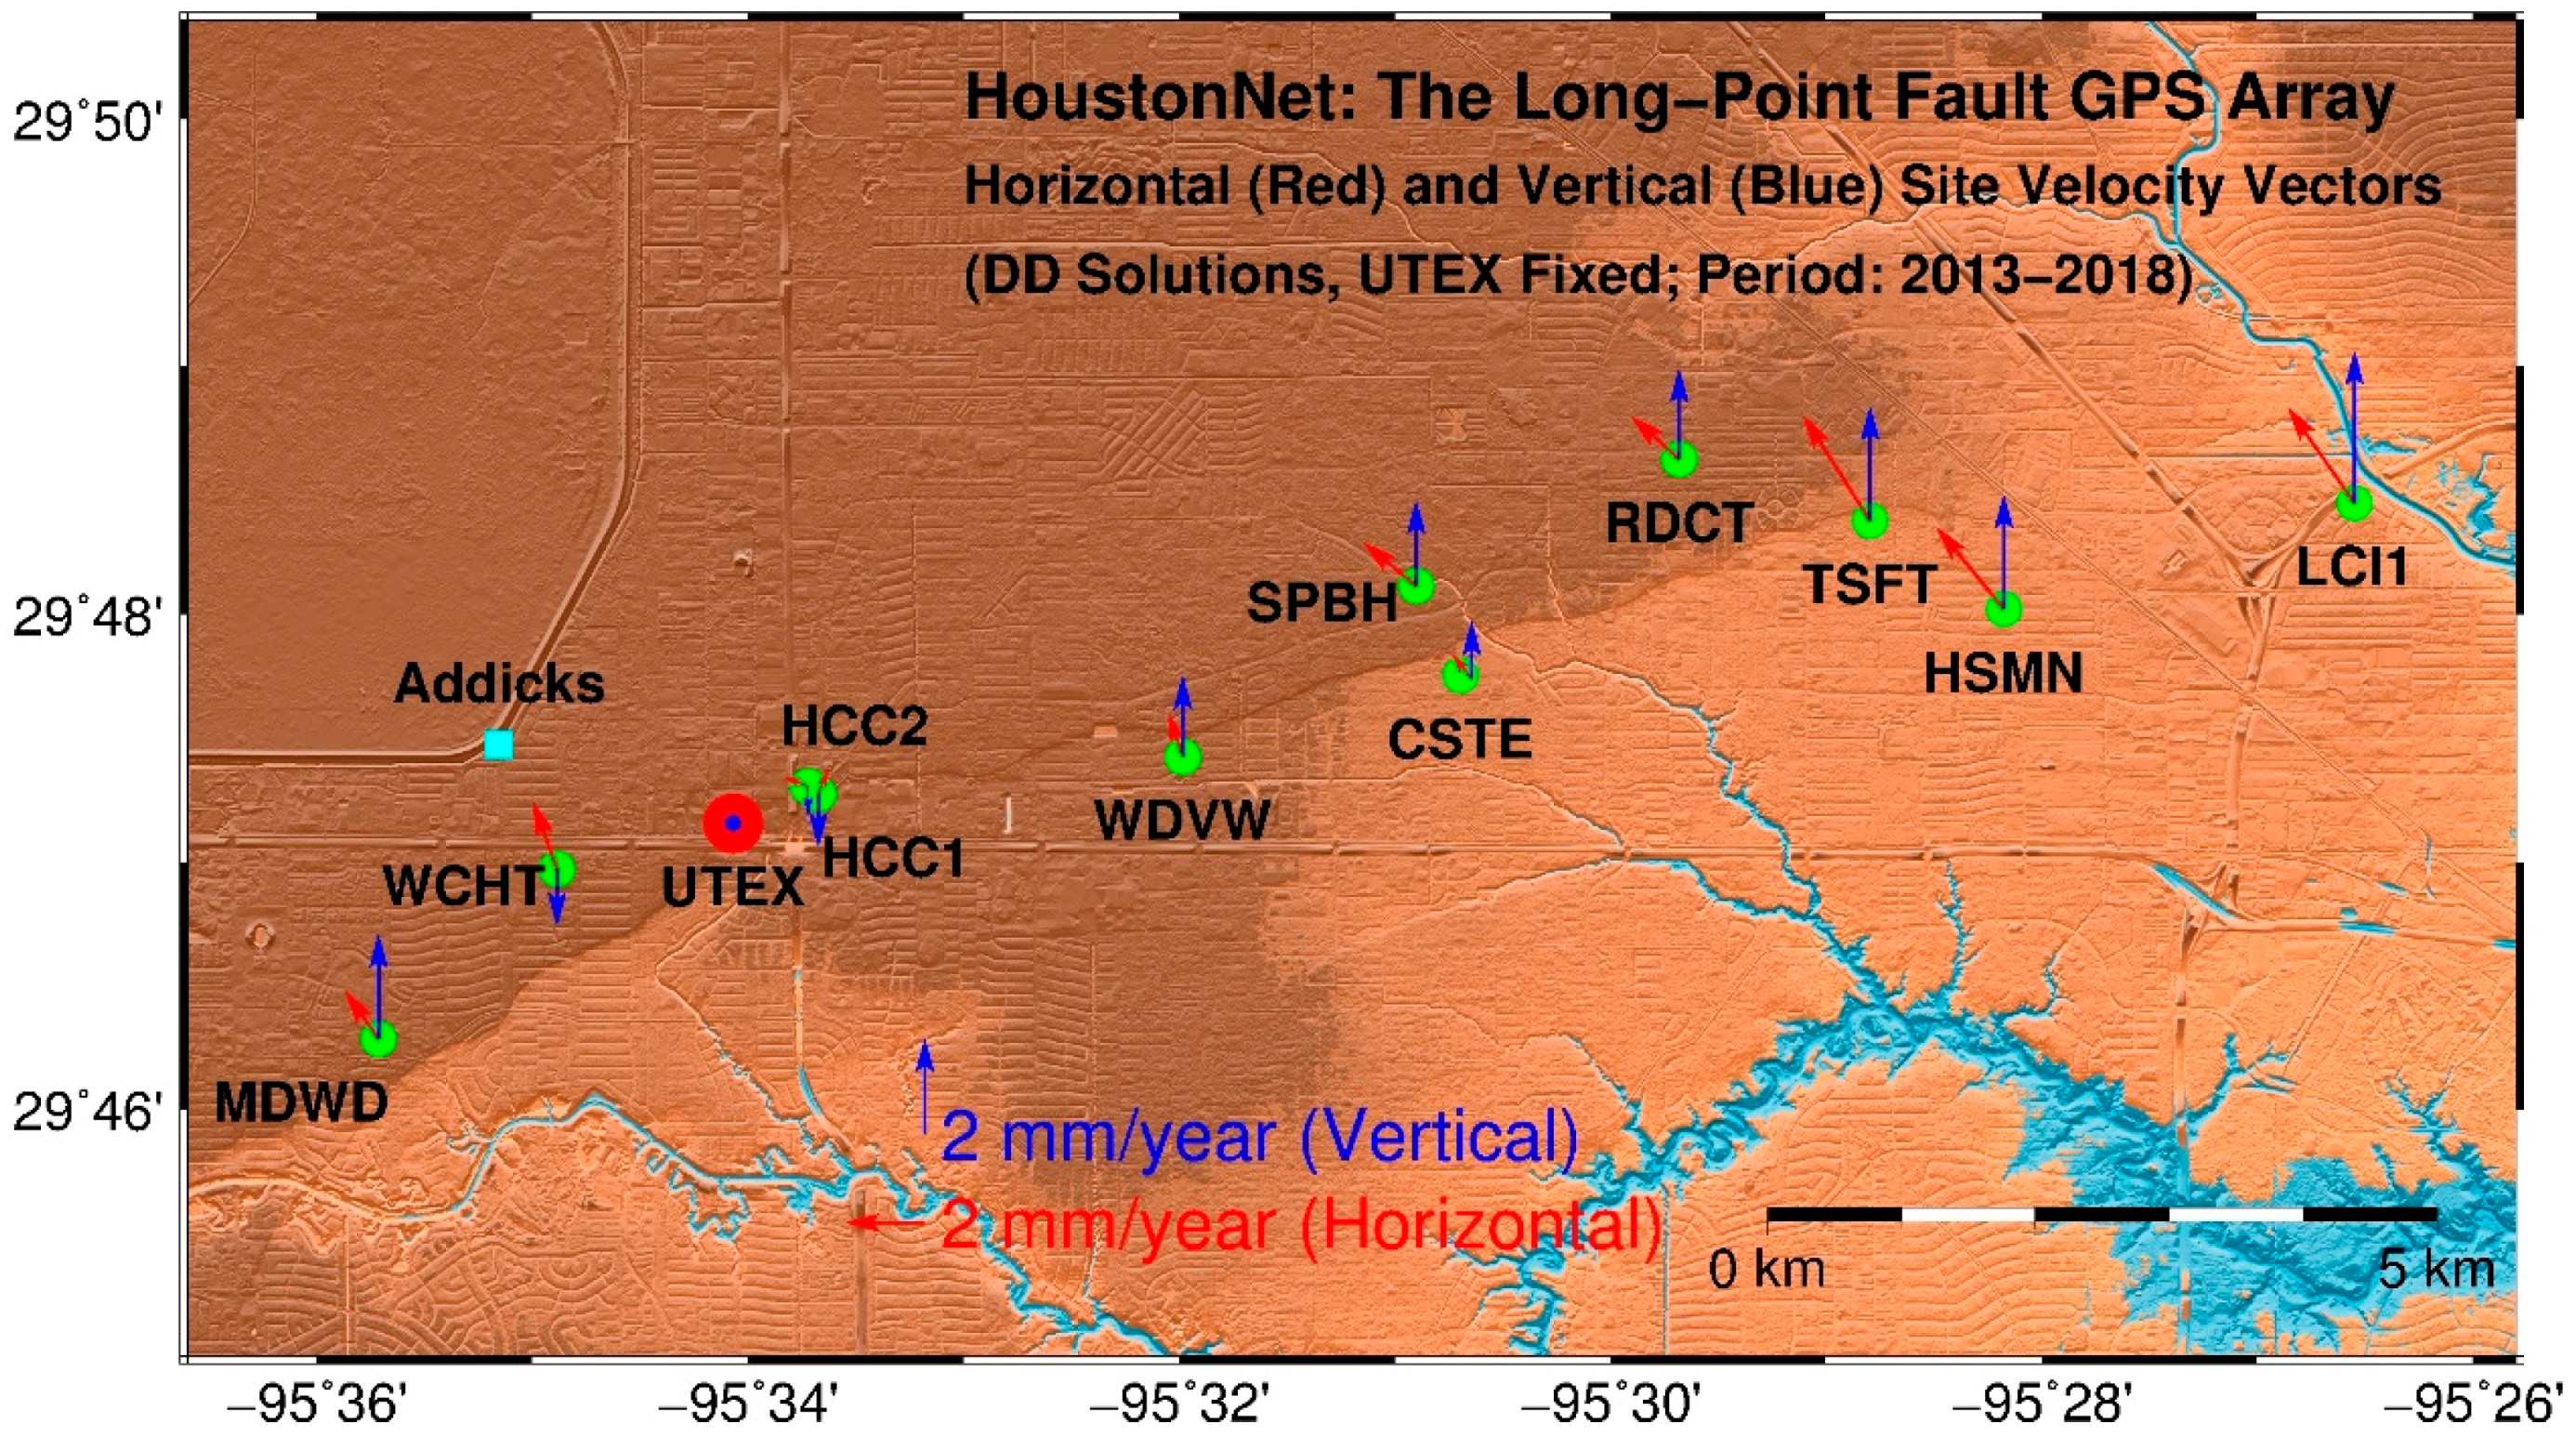
2.1. Long Point Fault GPS Array

Houston is one of the urban areas that use a dense GPS network to monitor land subsidence and faulting. The earliest continuous permanent GPS stations were installed in the early 1990s and have a history of approximately three decades [16]. As of 2018, there are about 200 GPS stations with a minimum history of three years in the Houston metropolitan area with observational datasets available to the public [17]. Most GPS stations are operated by the Harris–Galveston Subsidence District (HGSD) and the University of Houston. To study the activity of the Long Point Fault, the University of Houston installed a permanent GPS array along the two sides of the fault scarp in 2013 (Figure 2), which comprises 12 continuous GPS stations. MDWD, WCHT, UTEX, HCC2, SPBH, and RDCT are in the north side (footwall) of the fault scarp, HCC1, WDVW, CSTE, TSFT, HSMN, and LCI1 are located in the south side (hangingwall). Topography in the Long Point Fault area is mainly flat. The altitude of the land surface in this area is about 20 to 25 m above the sea level (Figure 4). All these 12 GPS stations are located within 1 km from the fault scarp. Table 1 lists the detailed information about the Long Point Fault GPS Array.
Each Long Point Fault GPS station is equipped with a Trimble NetR9 receiver and a Zephyr Geodetic II antenna except for LCI1, which is equipped with the Leica Grx1200-GG-Pro receiver and the Leica Ax1202GG antenna. LCI1 is jointly operated by the University of Houston and the SmartNet North America (https://www.smartnetna.com). The GPS antennas are mounted on the sidewalls of one- or two-story school buildings as shown in Figure 6. According to Yang et al.’s [18] investigation on several pairs of closely spaced Continuously Operating Reference Stations (CORS), there is no considerable difference between building-based and ground-based GPS observations with regard to the precision or repeatability of daily positions and reliability of long-term site velocities as long as the buildings are stable [18]. Accordingly, the displacement measurements from these building-based GPS antennas can be interpreted as the deformation of the ground surface. Figure 7 illustrates the vertical displacement time series of these 12 GPS stations with respect to a stable local reference frame and a single ground GPS station. The displacement time series depict the data history and continuity of the Long Point Fault GPS Array. The raw GPS datasets are archived at UNAVCO and are available to the public [19].

2.2. Data Processing
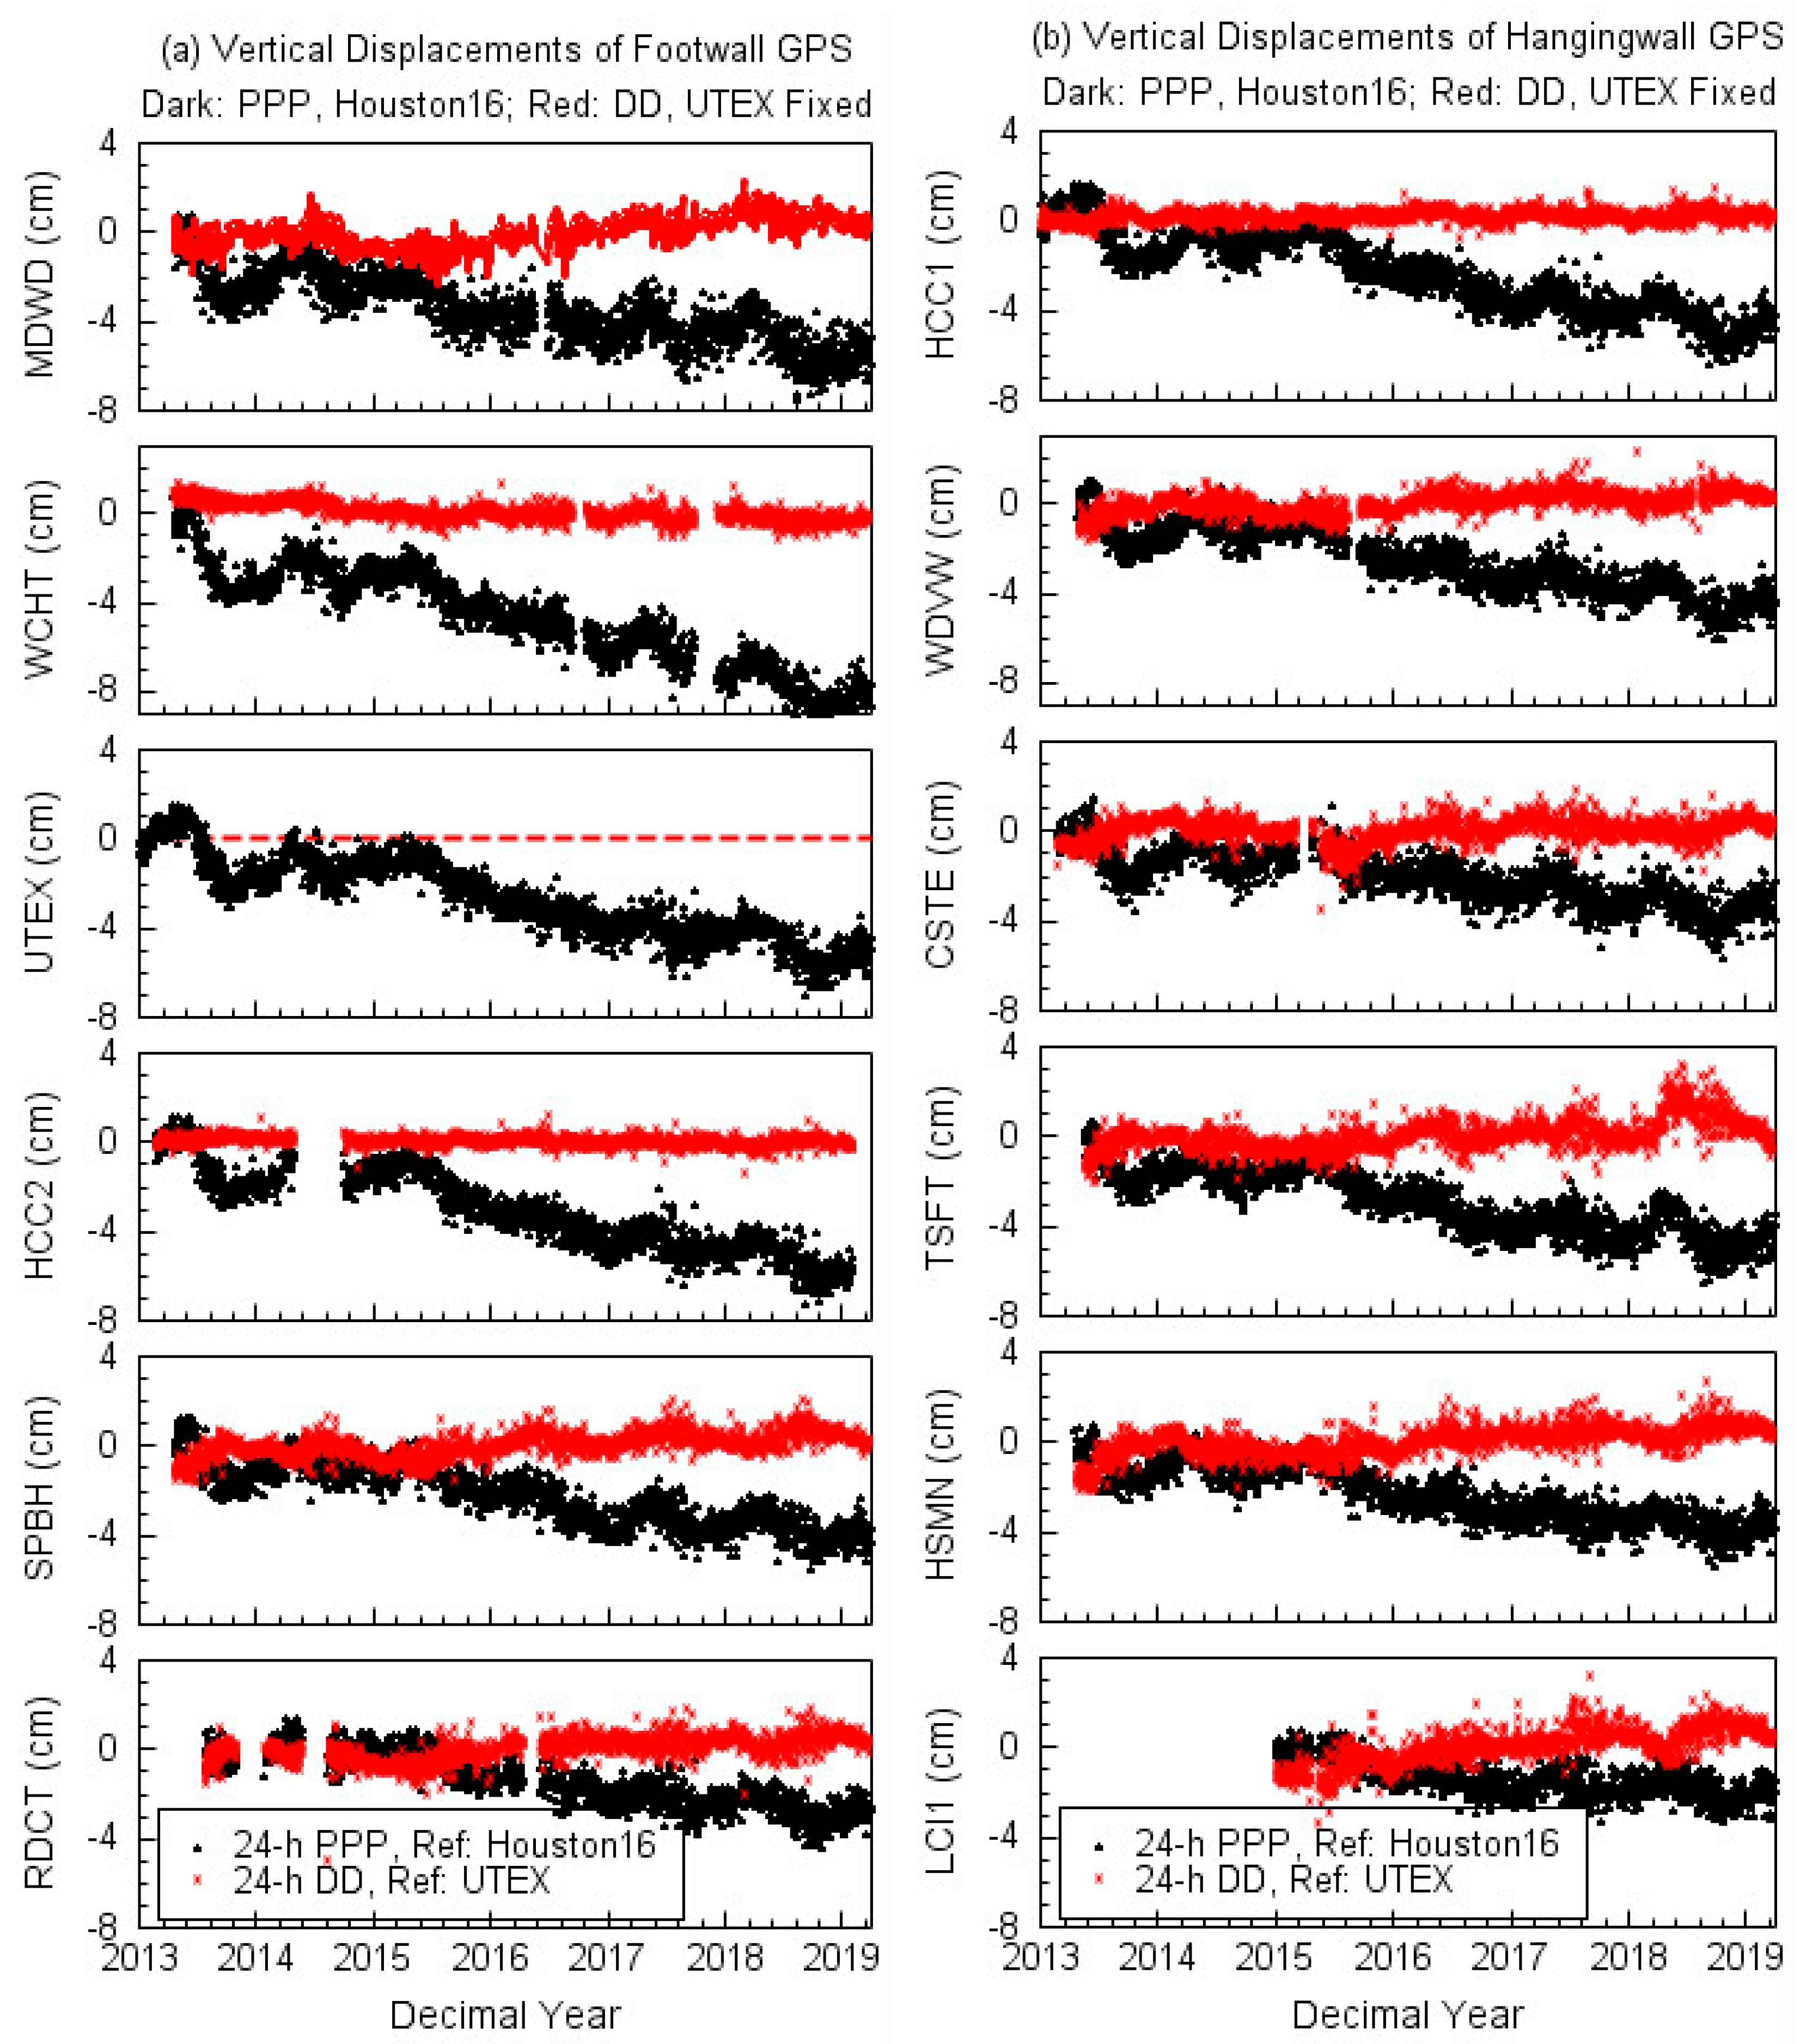
In general, the accuracy and precision of GPS-derived positions have been improved dramatically over the past two decades due to the advances in GPS hardware, software, and reference systems. The accuracy of GPS-derived displacements does not solely rely on GPS equipment (antenna and receiver) but largely depends on how the data are collected in the field and how the data are processed [20,21,22]. For estimating site velocities, the accuracy is primarily dominated by the stability (accuracy) of the reference frame and the length of the observational history rather than the accuracy of the individual positional measurements [23].
Typically, there are two approaches to achieve high-precision GPS positioning solutions: absolute positioning and relative positioning. The absolute positioning method uses a single ground GPS station to achieve high-precision positioning, and in turn, gets high-accuracy displacements and site velocities. Precise point positioning (PPP) is a typical absolute positioning method that has been widely applied in the geodesy community for natural hazards and structural health monitoring due to its operational simplicity and consistent accuracy over time and space [24,25,26]. In contrast, the relative positioning method employs two ground GPS units simultaneously tracking the same satellites (minimum four) to decide relative positions (distances in three dimensions) between these two stations. A commonly used relative positioning geodetic technique is the carrier-phase double-difference (DD) method, which inherits high accuracy from the fact that closely spaced GPS units share significant common errors and biases. Because the number of common errors decreases with the increase of the antenna-to-antenna distance, the performance of the differential method highly depends on the length of the baseline [27,28]. Both the DD and PPP methods are used to derive site velocities in this study. The GAMIT/GLOBK software package (Version 10.7) is employed for the DD processing [29], and the GIPSY-OASIS (V6.4) software package is employed for the PPP processing [30]. The GIPSY-OASIS software package employs the single-receiver phase ambiguity-fixed PPP method for its static positioning [31].
We first calculated the 24-hour average positions (daily solutions) of these GPS antennas, specifically, the phase center of the antenna, with the PPP method. The major parameters used for the PPP processing are the same as those listed in our previous publications [32]. The PPP solutions are defined in an Earth-Centered-Earth-Fixed (ECEF) Cartesian coordinate system that is based on three mutually perpendicular coordinate axes: the x-axis, the y-axis, and the z-axis. The ECEF-XYZ coordinates are referred to the International GNSS reference Frame of 2014 (IGS14) [33]. The changes of site positions over time with respect to the global reference frame are dominated by the long-term drift and rotation of the North American plate [34,35]. Localized minor ground deformation associated with faulting and subsidence can be obscured by the long-term plate drift. A stable local scale reference frame is needed to precisely trace the movements of permanent GPS stations over time and space [36,37,38].
For this study, we used the Stable Houston Reference Frame 2016 (Houston16) as a stable local reference frame to delineate the movements of GPS antennas. Houston16 was realized by over 7 years of continuous observations from 15 permanent GPS stations outside the Houston metropolitan area. Those reference stations were not affected by subsidence and faulting problems. Houston16 was aligned in origin and scale with IGS14. The frame stability of Houston16 is below 1 mm/year in both the horizontal and vertical directions. A detailed introduction of Houston16 is referred to Kearns et al. [17]. The ECEF-XYZ coordinates with respect to IGS14 were transformed to the Houston16 reference frame and then projected to a two-dimensional (2D) horizontal plane to track displacements in the north-south (NS) and east-west (EW) directions. The ellipsoid heights derived from the ECEF-XYZ coordinates (Houston16) referred to the GRS80 ellipsoid were used to track the site displacements (uplift or subsidence) in the vertical direction. For subsidence and uplift monitoring purposes, the vertical displacement derived from the ellipsoid heights retains the same value as those derived from orthometric heights [39].
In general, the DD method can achieve higher precision (repeatability) for measuring relative positions (distances) than the PPP method if the baseline is within a few kilometers [25,40]. Thus, the site velocities derived from the DD solutions may achieve higher precision in delineating the spatial variations of three-component ground deformation in the study area. A comparison of the displacement time series obtained with the DD and PPP methods is demonstrated in Figure 7. Overall, the scatter of the DD solutions is smaller than the scatter of the PPP solutions at all stations, which verified that the DD method achieved a higher accuracy (repeatability) than the PPP method for the case study. For this reason, the DD method is employed to delineate the relative displacements within the Long Point Fault GPS Array. The detailed process for calculating 24-hour average displacements using the DD method is addressed in Wang [22].

3. Results

The horizontal and vertical site velocity vectors for GPS stations with respect to Houston16 along the two sides of the fault scarp are plotted in Figure 2. The velocity vectors indicate that all GPS stations are moving to the northwest direction with a steady rate of 2 to 4 mm/year. The directions of the horizontal velocity vectors along the two sides of the fault scarp are fairly consistent. The vertical velocity vectors vary from 5 mm/year to 11 mm/year. The ratio of the horizontal to vertical ground displacements is approximately one third. The spatial variation of subsidence rates may be associated with the differences among sites in the ratios of sand, silt, and clay and the amount of nearby groundwater withdrawal [41].
Figure 8 illustrates a comparison of the three-component PPP and DD solutions of HCC1 and HCC2. HCC1 is situated on the hangingwall (downthrown) side of the Long Point Fault. HCC2 is situated on the footwall (upthrown) side, just opposite of HCC1 (Figure 3a). The distance between HCC1 and HCC2 is 96 m. Figure 8a depicts the three-component displacement time series (24-h PPP solutions) of HCC1 and HCC2 with respect to the local reference frame Houston16. The PPP solutions attained the root-mean-square (RMS) accuracy of 2 to 4 mm in the horizontal directions and 8 to 9 mm in the vertical direction. The linear trends derived from the displacement time series are approximately 3 mm/year towards the northwest direction and 8 mm/year vertically downward. It is difficult to distinguish the minor difference between the displacements at the two GPS sites. Figure 8b depicts the relative displacement time series (DD solutions) of HCC1 (footwall) with respect to HCC2 (hangingwall). The DD solutions achieved below 2 mm RMS-accuracy in all three components. The RMS-accuracy of the EW component is even at a sub-millimeter level (0.6 mm). The site velocities of HCC1 with respect to HCC2 are below 1 mm/year in both the vertical and horizontal directions.
Figure 9 illustrates the three-component displacement time series (24-hour DD solutions) of two hangingwall stations CSTE and HSMN with respect to their corresponding footwall stations SPBH and RDCT (see Figure 2). The baseline between CSTE and SPBH is 810 m; the baseline between HSMN and RECT is 2670 m. The same comparison for HCC2 with respect to HCC1 is illustrated in Figure 8b. The horizontal RMS-accuracy of the displacements is below 2 mm for all three stations. The vertical RMS-accuracy is approximately 2 to 4 mm. All three hangingwall sites retain velocities below 0.5 ± 0.2 mm/year in all three directions except the vertical component of HCC1, which retains a vertical velocity of 0.7 ± 0.2 mm/year. No considerable (> 1 mm/year) sinking was recorded at the hangingwall stations with respect to the footwall stations in the past six years. Figure 10 depicts the site velocity vectors at these 11 GPS stations with respect to the hangingwall station UTEX. The velocities are derived from 24-hour DD solutions. UTEX was the first station of the Long Point Fault GPS Array. There are considerable velocity variations of up to 2 mm/year in the horizontal directions and up to 3 mm/year in the vertical direction depending on the distance to the base station (UTEX). However, there is no coherent difference between the footwall and hangingwall sides in site velocities. The Long Point Fault belongs to the down-to-the-coast normal fault systems. Downward slip at the hangingwall side is expected if the fault is active.

4. Discussion

The site velocity vectors depicted in Figure 2 and Figure 10 indicate that currently, there is no considerable (>1 mm/year) relative displacements between the two sides of the fault scarp in both the down-dip and along-strike directions, which suggests that the Long Point Fault is currently inactive. A question is raised here: What are the reasons causing the damages of surface structures in the Long Point Fault area?

4.1. Horizontal Displacements Associated With Subsidence

The term land subsidence is principally downward movements of the Earth’s surface. However, subsidence is mostly uneven, thus causing horizontal strains, which have significant damaging effects on surface and near-surface structures [42]. From a natural hazard perspective, land subsidence driven by groundwater withdrawal is of particular interest when the subsidence is long term and leads to accumulated horizontal strains on infrastructures. The Houston area has been suffering from property and infrastructure damages associated with land subsidence since the 1930s [43]. Up to 4 m of subsidence had occurred in southeastern Harris County during the time span from 1915–1917 to 2001 [40]. Land subsidence in the Houston area has been continuously monitored and studied since the 1970s [44]. The land subsidence started at the southeast Houston area along the Houston Ship Channel, and slowly propagated to the northern and western parts with the extent of the greater Houston area [45]. Rapid subsidence began occurring in Jersey Village, located in western Houston, during the 1980s [46].
Figure 11a depicts the subsidence contours derived from 35 GPS stations in the northwest Houston region from 1995 to 2005. A subsidence bowl is apparent in the subsidence contours. The fault scarp overlies on the southern edge of the subsidence bowl. The subsidence rate in the Long Point Fault area varies from 3.5 to 4.5 cm/year during this period. The most rapid subsidence occurred at the bottom of the subsidence bowl with a rate of approximately 5 cm/year in Jersey Village. Similar subsidence patterns were observed from InSAR datasets during this period [47,48,49]. There is no repeated leveling data in this area. Figure 11b depicts the subsidence contours derived from 145 GPS stations during the recent six years from 2013 to 2018. Overall, the current subsidence rate has slowed significantly compared to the subsidence rate during the period from 1995 to 2005. There is a trend that the subsidence is propagating to the north and southwest. The red vectors exhibit the horizontal velocity vectors (2 to 4 mm/year) of the Long Point GPS Array with respect to Houston16, same as the vectors illustrated in Figure 2. It is clear that the coherent horizontal movement is towards the center of the ongoing subsidence bowl.
It is not hard to imagine that the land surface at the margins of the subsidence bowl will be tilted. Thus, certain horizontal strains will be accumulated when a subsidence bowl is developing. Consequently, surface points on the margins of the subsidence bowl may move downward and inward towards the center of the subsidence bowl. This phenomenon had been recorded by continuous GPS stations in other rapid subsidence urban areas, such as Los Angeles in the US [51], Mexico City in Mexico [52] and Tianjin in China [32]. In general, the ground deformation would maintain a minimum horizontal site velocity at the center and a maximum site velocity at approximately half the radius. The Long Point Fault crosses the edge of the subsidence bowl where substantial extension strains could be developed.
Figure 12 depicts the horizontal displacements induced by rapid subsidence at two long-term GPS stations (PA01 and PA03) in the Jersey Village area. Locations of PA01 and PA03 are marked in Figure 1. Both stations are the Port-A-Measure (PAM) campaign-style GPS stations operated by HGSD since 1994 [16]. The distance between PA01 and PA03 is approximately 9.3 km. Both PA01 and PA03 are in the margin area of the 1995–2005 subsidence bowl (Figure 11a). PA01 is close to the center of the ongoing subsidence bowl (2013–2018) (Figure 11b). The NS components of both PA01 and PA03 exhibit considerable horizontal displacements that are coincident with the rapid land subsidence during the 1990s and 2000s. The horizontal movement at PA01 was up to 5 mm/year towards south during the 1990s. The subsidence during the same period was 4.8 cm/year. The horizontal movements decreased to approximately 1.5 mm/year towards north during the 2000s in respect to the slowed subsidence (1.5 cm/year) during this period. It appears that the rate of horizontal movement was about one-tenth of the subsidence rate at these two GPS sites during the 1990s and 2000s.
Although the underlying mechanisms leading to land subsidence are well known, the horizontal strain associated with subsidence and its role in structure damages has not been thoroughly investigated. Several methods had been proposed for quantifying the amount of vertical and horizontal movements in subsidence areas caused by mining [53]. However, so far, very few quantitative studies have been conducted on the relationship between the subsidence induced by groundwater withdrawals and its related horizontal ground deformation. The main reason is that the subsidence induced by groundwater withdrawals usually is much slower compared to the subsidence induced by mining. The horizontal movement is mostly at a level of a few millimeters to sub-millimeter per year, which is difficult to be precisely measured prior to having GPS.
It is beyond the scope of this paper to speculate on how does ground motions associated with subsidence cause structural damages. The results of this study do indicate, however, that long-term subsidence could accumulate substantial horizontal strains over time, which will cause damages on structures on and near the ground surface. The current surficial damages observed in the Long Point Fault area are more likely caused by uneven subsidence and its related horizontal ground deformation rather than deep-seated or tectonic-controlled fault movements. It is important to obtain a better understanding of the relationship between horizontal ground deformation and structural damages, which is vital to assess the risk from the Long Point Fault.

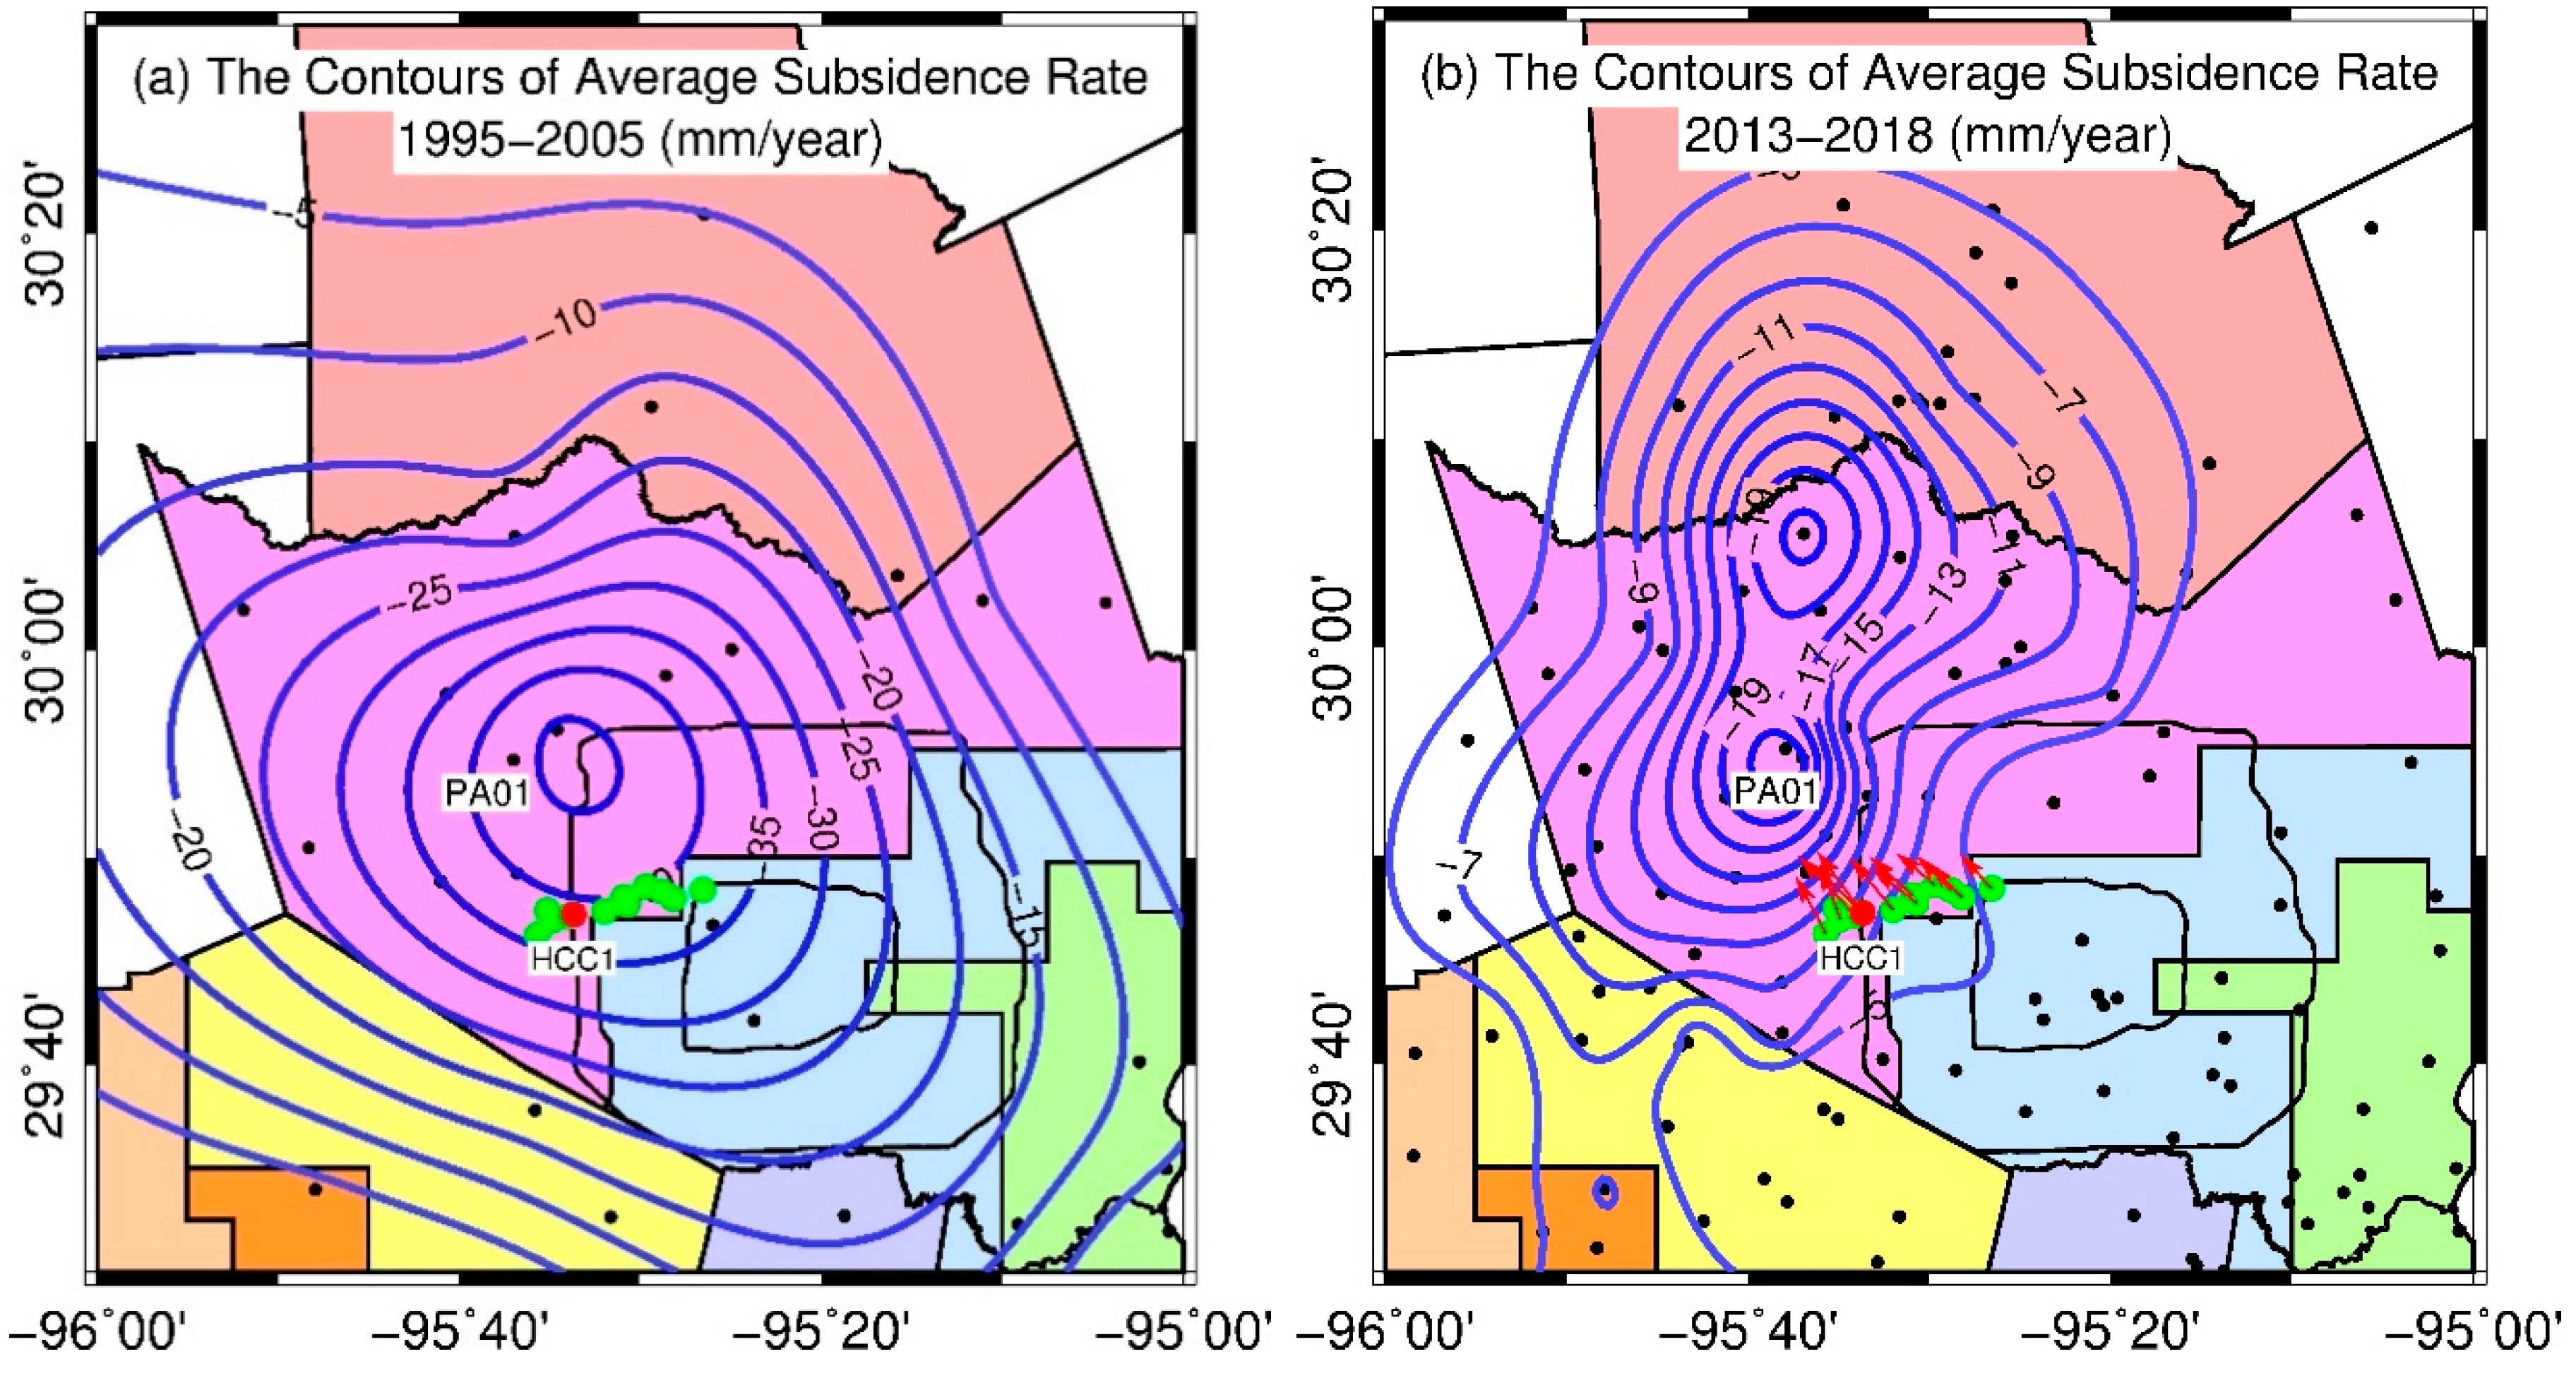
4.2. Groundwater Withdrawal vs. Subsidence and Faulting

The major hydrogeological units composing the aquifer system in the Houston area, from the surface downward, are the Chicot aquifer, the Evangeline aquifer, the Burkeville confining unit, and the Jasper aquifer [54]. The aquifers that underlie the Houston area consist of interbedded clays, silts, sands, and gravels. The Chicot aquifer is Quaternary, and the Evangeline aquifer is Pliocene and Miocene in age. The Chicot and Evangeline aquifers are hydraulically connected. Directly below the Evangeline stratigraphically is the Burkeville confining unit which restricts the flow of fluids [55]. The Evangeline aquifer is currently being the primary source of municipal and industrial use in the Long Point Fault area [44]. Massive groundwater pumping depressures and dewaters the aquifers, and in turn, results in compaction of unconsolidated sediments. Most of the land–surface subsidence in the Houston metropolitan region has occurred as a direct result of groundwater withdrawals for municipal supply, commercial and industrial use, and irrigation [56].
HGSD and USGS installed 13 deep-borehole groundwater and subsidence monitoring stations in Houston during the 1970s to study the correlation between groundwater levels and land–surface subsidence [56]. Figure 13 shows a site view at the Addicks groundwater pumping station operated by the City of Houston. The location of the Addicks site is marked in Figure 10. A borehole extensometer was installed at this site in 1973, which was designed to measure the change in the thickness of sediments [57]. The out casing of the borehole was screened at its bottom with the purpose of allowing groundwater to flow into the center pipe. Thus, the deep well works as a piezometer measuring the hydraulic head altitude in the Evangeline aquifer. The extensometer has been continuously operating by USGS since 1974. A GPS antenna (ADKS) has been installed on the inner pole of the extensometer since 1993 to track the stability of the sediments at the bottom of the inner pole. The inner pole is firmly anchored on the bottom of the Evangeline aquifer located 549 m below the land surface (see Figure 5). PA05 is one of the PAM GPS stations that was mounted on the land surface in 1996. There is a shallower groundwater well at the Addicks site, and it was terminated at 72 m below the ground surface. The shallow well is used to measure the hydraulic level altitude in the Chicot aquifer. The Addicks groundwater wells are only 1.7 km away from the Long Point Fault.
Figure 14a depicts the history of the groundwater-level altitudes in the Chicot and Evangeline aquifers from 1974 to 2018 at the Addicks site. The Chicot groundwater level was relatively stable at approximately 45 to 50 m below the land surface over the past four decades. However, the groundwater level in Evangeline aquifer experienced significant changes, from the highest level of −80 m in 1974 to the lowest −140 m in 2000. The groundwater level declined as fast as 3.5 m/year during the 1970s and reduced to about 1 m/year during the 1980s and 1990s. The decline of the Evangeline groundwater level ceased in 2000 and started to rise with a speed of approximately 2 m/year during the 2000s in response to groundwater regulations enforced by HGSD. By the late 2000s, the Evangeline groundwater-level altitude had recovered to the level of the late 1970s, approximately 100 m below the land surface. The current water levels have generally remained stable since 2010, but with significant annual fluctuations, which are mainly dominated by the annual cycle of groundwater withdrawals. Figure 14b depicts the long history of subsidence measured by the Addicks extensometer during the same period. The accuracy of the Addicks extensometer was investigated by Wang et al. [57]. It was concluded that the accuracy of the monthly compaction measurements is at the level of a couple of millimeters. The long-history extensometer dataset indicates a steady compaction rate of 3.7 cm/year beginning from when the extensometer was installed through about middle 2003. The rapid subsidence (3.7 cm/year) before the 1990s was coincident with the rapid decline (3.5 m/year) of the Evangeline groundwater level. As water levels in the aquifers began to rise and recover since the 2000s, the hydrostatic pressure increased, in turn, the rates of compaction progressively decreased. The current subsidence rate at the Addicks site is approximately 0.8 cm/year, which is much slower than the subsidence rate in the 1970s and 1980s. For both the long-term and short-term components, the vertical ground displacement time series is well matched by hydraulic head variations in the Evangeline aquifer.
According to our previous study, the subsidence will continue until the Evangeline groundwater level approaches the regional preconsolidation head, which is approximately 40 m below the ground surface in the Houston area [45]. Currently, the Evangeline water level is recovering but still about 60 m below the preconsolidation head. It may take a long period for the groundwater level to rise to the preconsolidation head and for subsidence to cease in this area. That is to say, the ongoing subsidence and its induced horizontal ground deformation in the Long Point Fault area will continue to occur for a long period. It is worth noting that most aquifer compaction that occurs as a result of groundwater withdrawals is irreversible. Knowledge of the effects of groundwater withdrawal on ground deformation in both horizontal and vertical directions is pertinent to plans for future urban development and use of water resources.

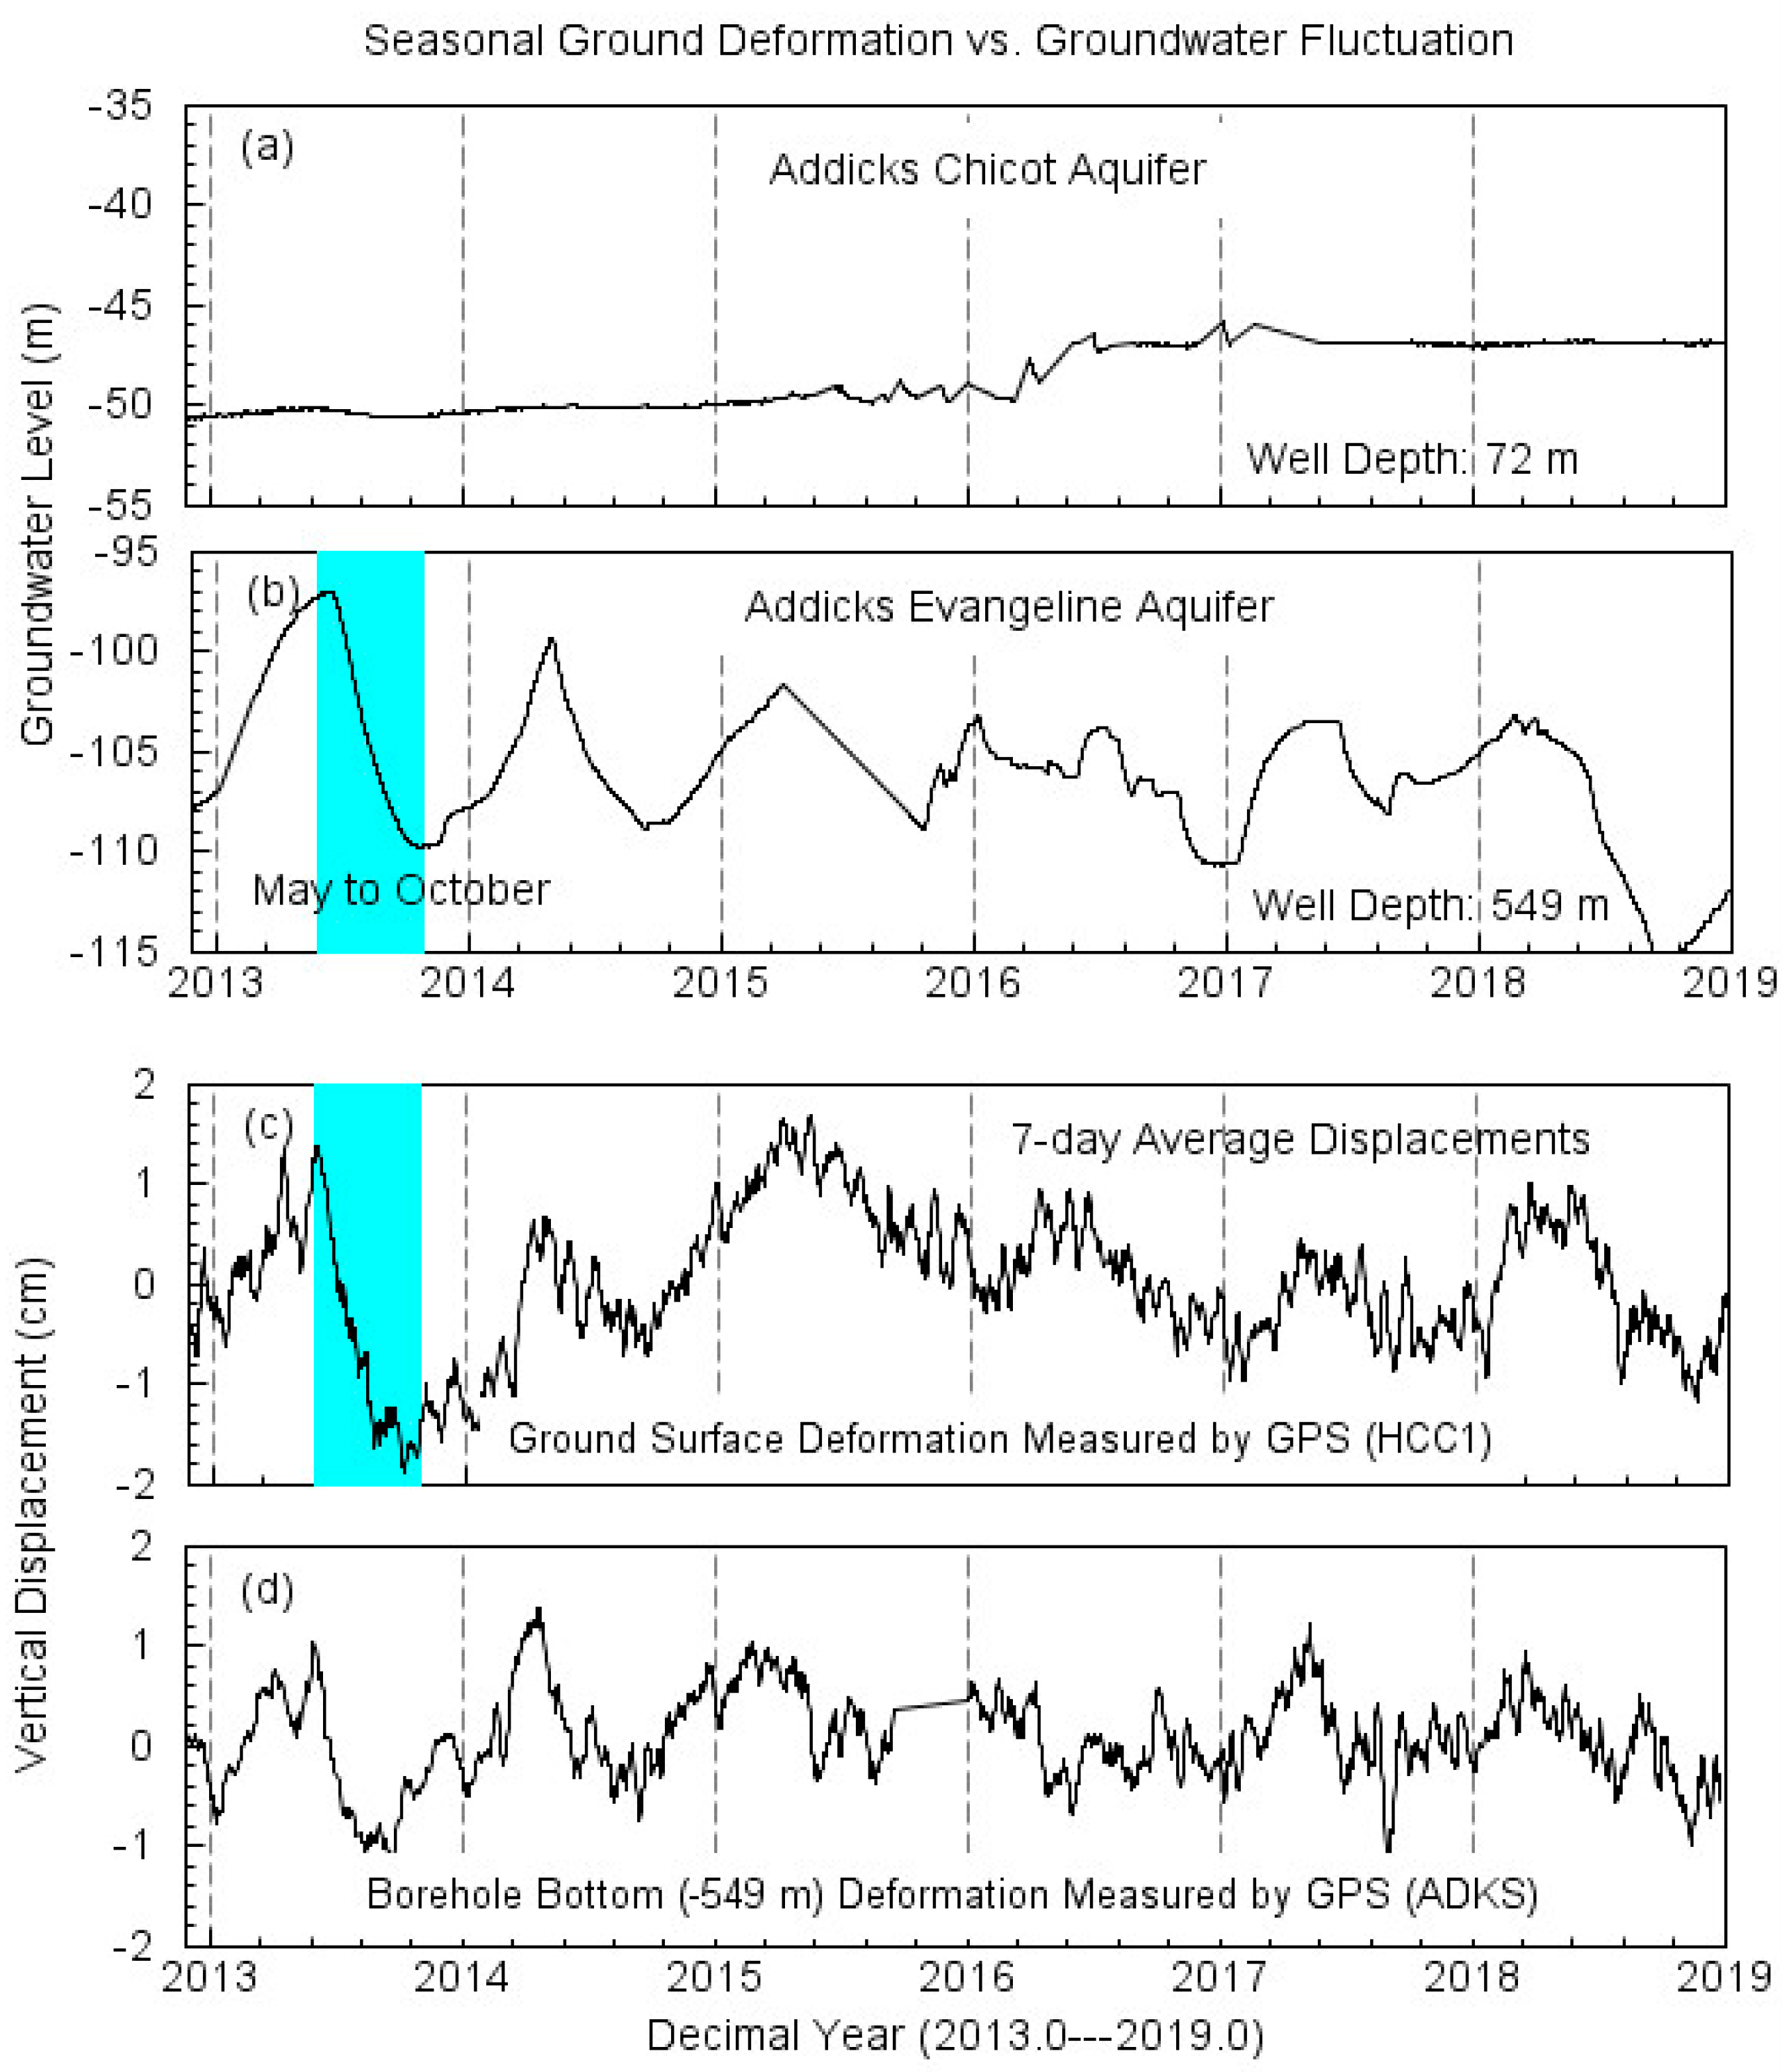
4.3. Seasonal Ground Deformation

Seasonal ground oscillations have been widely observed from GPS-derived displacement time series [58,59,60]. The seasonal uplift and subsidence are believed to be a combination of real ground deformation and certain annual signals associated with GPS data processing. The amplitude of the vertical uplift and subsidence is mostly within a peak-to-trough level of 1.5 cm level at stable sites [32,38]. However, significant vertical oscillations have been recorded in the Long Point Fault area as illustrated in Figure 7.
Figure 15 illustrates the comparison of the detrended displacement time series recorded at a subsiding site (HCC1) in the Long Point Fault area and a stable site (TXLI) in eastern Houston. The displacement time series are derived from daily PPP solutions. TXLI is in West Liberty County, a rural area east of the Houston metropolitan region, where no significant groundwater pumping has been reported, and no considerable land subsidence was observed [27]. The linear trends superimposed into the original displacement time series of HCC1 have been removed by a detrending process. To smooth the original daily solutions, a boxcar filter (moving average) with a width of seven days (the day plus 3 days before and 3 days after) has been applied to the daily displacement time series. HCC1 is located at the margin of the ongoing subsidence bowl as depicted in Figure 11b. The displacement time series of TXLI exhibits little seasonal horizontal movement (peak-to-trough: <5 mm) and moderate seasonal vertical motions (peak-to-trough: <1.5 cm). However, the displacement time series at HCC1 exhibits unprecedented ground oscillations in both the vertical and horizontal directions. The peak-to-trough displacement of the vertical component at HCC1 is up to 4 cm, which is about two to three times larger than the seasonal vertical ground deformation recorded at TXLI during the same period. The undergoing seasonal horizontal motions towards (northwest) and away (southeast) from the center of the subsidence bowl are also significant with an amplitude of peak-to-trough 1.5 cm, which is three times larger than the horizontal seasonal motions at TXLI. Such a seasonal pattern of ground motion with significant horizontal strains can be explained by the response of elastic materials (mostly sand in the aquifers) to seasonal groundwater-level variations.
Further analysis indicates that the significant seasonal deformation is coincident with the fluctuation of the Evangeline groundwater-level changes as illustrated in Figure 16. Compared to the Evangeline aquifer, the fluctuation of the Chicot groundwater level is minor (less than ± 0.5 m) (Figure 16a). Groundwater-level altitudes in the Houston metropolitan region usually rise during the period from November to April and decline from May to October as depicted in Figure 16b. The groundwater level is generally higher during November through March compared to the rest of the year because groundwater withdrawals during these months are generally at an annual minimum. Less groundwater is used for lawn irrigation purposes during the winter months compared to the summer months. The annual variation of the Evangeline groundwater level is approximately 10 m (Figure 16b), which is modulated by seasonal cycles of increased and decreased groundwater withdrawal and, to a much lesser extent, recharge. The GPS antenna (HCC1) fixed on the ground surface recorded the vertical ground oscillations with peak-to-trough amplitudes of up to 4 cm (Figure 16c), which is approximately two times the amplitude recorded by the deep-seated (−549 m) GPS antenna (ADKS) (Figure 16d). These observations imply that the effects of groundwater-level fluctuations are limited to the aquifers within the top 549 m. The vertical displacement time series recorded by PA05 and ADKS (Figure 14b) also verified that the permanent compaction is also limited to the top 549 m. In summary, the significant seasonal ground deformation associated with the elastic compaction and extension of the shallow aquifers within top 549 m may partially be responsible for the recurring damages on the pavements of roads and parking lots.

5. Conclusions

We investigated the spatiotemporal ground deformation in the Long Point Fault area using six years of continuous GPS observations. Results from this study suggest that the Long Point Fault is currently inactive, with the rates of down-dip-slip and along-strike-slip being below 1 mm/year. However, the terms “currently” and “inactive” should be interpreted with caution. The activity of a fault may vary spatially and temporally. According to previous USGS reports [8,43], the Long Point Fault was very active during the 1960s and 1970s; some sections of the Long Point fault had averaged more than 2 cm/year of vertical offset over a 20-year span. The rates of fault movement during the 1960s to 1970s far exceeded average prehistoric rates. According to our field investigations in the past six years, the current surficial damages adjacent to the Long Point Fault are much less frequent and lighter than the damages reported in the 1960s to 1970s.
The active period during the 1960s and 1970s was coincident with the substantial groundwater withdrawals in this area during that time, which caused a rapid decline of groundwater-level altitudes, in turn, resulted in a rapid land subsidence. The current dormancy of the Long Point Fault is coincident with the recovery of groundwater-level altitudes since the 2000s (Figure 14a). The same phenomena were observed at faults in the eastern part of the greater Houston region during the 1970 and 1980s [43,61]. The Chicot and Evangeline groundwater-level recovery began in the east part of the greater Houston region after 1975 due to the delivery of surface water and enforcement of groundwater regulations. Fault creeping stopped or slowed in the areas where the water level was recovering, but continued unabated in the areas where groundwater levels were still declining. The spatiotemporal coincidence of the changes of groundwater levels and activity of faults suggest a cause-and-effect relation between groundwater withdrawals and surface faulting. Massive groundwater withdrawals may accelerate or reinitiate ground movements on historically active faults in the greater Houston region; rising groundwater levels may slow and ultimately cease the surface faulting. However, there are not sufficient datasets to validate this relation. Additionally, it is possible that the Long Point Fault is currently experiencing a slow pace (<1 mm/year) of its natural episodic slipping. Previous investigations based on seismic well-log data, core transects, stratigraphic and radiocarbon chronology datasets show episodic movements of many growth faults in Texas during a historical time frame [8,62]. It is critical to continuously monitor the ground movements and groundwater levels in the Long Point Fault area to clarify the cause-and-effect relationship and or the episodic fault movements.

Author Contributions

Y.L. processed GPS data and plotted most figures. G.W. and X.S. prepared the original draft. All authors edited, reviewed, and improved the manuscript.

Funding

This research was supported by the Harris–Galveston Subsidence District, the Key Laboratory of Soft Soil Engineering Character and Engineering Environment of Tianjin at the Tianjin Chengjian University, the National Science Foundation of China (No. 51829801), and the National Science Foundation (NSF) of the US through the HoustonNet Award (EAR-1229278) and the Geodesy Advancing Geosciences and EarthScope (GAGE) Award (EAR-1261833).

Acknowledgments

The authors thank USGS, HGSD, and UNAVCO for providing groundwater, extensometer and GPS data to the public. G.W. thanks previous UH graduate students Gabe Saenz, John J. Serna, Vasilios Tsibenos, and Timothy J. Kearns for their contributions in installing and operating the Long Point Fault GPS Array.

Conflicts of Interest

The authors declare no conflict of interest.

References

  1. Pratt, W.E.; Johnson, D.W. Local Subsidence of the Goose Creek Oil Field. J. Geol. 1926, 34, 577–590. [Google Scholar] [CrossRef]
  2. Weaver, P.; Sheets, M.M. Active faults, subsidence, and foundation problems in the Houston, Texas, area. In Geology of the Gulf Coast and Central Texas, and Guidebook of Excursions; Rainwater, E.H., Zingula, R.P., Eds.; Houston Geological Society: Houston, TX, USA, 1962; pp. 254–265. [Google Scholar]
  3. Van Siclen, D.C. The Houston fault problem. In Proceedings of the AIPG 3rd Annual Meeting, Texas section, Houston, TX, USA, 16–17 February 1967; American Institute of Professional Geologists: Westminster, CA, USA, 1967; pp. 9–31. [Google Scholar]
  4. Sheets, M.M. Active surface faulting in the Houston area, Texas. HGS Bull. 1971, 13, 24–33. [Google Scholar]
  5. Reid, W.M. Active faults in Houston, Texas. Ph.D. Thesis, University of Texas, Austin, TX, USA, 1973. [Google Scholar]
  6. Clanton, U.S.; Amsbury, D.L. Active faults in southeastern Harris county, texas. Environ. Earth Sci. 1975, 1, 149–154. [Google Scholar] [CrossRef]
  7. Verbeek, E.R.; Clanton, U.S. Map Showing Surface Faults in Southeastern Houston Metropolitan Area, Texas; 78–797; US Geological Survey: Reston, VA, USA, 1978; p. 20.
  8. Verbeek, E.R.; Ratzlaff, K.W.; Clanton, U.S. Faults in parts of north-central and western Houston metropolitan area, Texas. In Faults in Parts of North-Central and Western Houston Metropolitan Area, Texas; US Geological Survey: Reston, VA, USA, 1979. [Google Scholar]
  9. Engelkemeir, R.M.; Khan, S.D. LiDAR mapping of faults in Houston, Texas, USA. Geosphere 2008, 4, 170–182. [Google Scholar] [CrossRef]
  10. Engelkemeir, R.; Khan, S.D.; Burke, K. Surface deformation in Houston, Texas using GPS. Tectonophysics 2010, 490, 47–54. [Google Scholar] [CrossRef]
  11. Qu, F.; Lu, Z.; Kim, J.W. New faults detection by multi-temporal InSAR over Greater Houston, Texas. In Proceedings of the 2017 IEEE International Geoscience and Remote Sensing Symposium, Fort Worth, TX, USA, 23–28 July 2017; IEEE: New York, NY, USA; pp. 2153–7003. [Google Scholar]
  12. Shah, S.; Lanning-Rush, J. Principal Faults in the Houston, Texas, Metropolitan Area; US Department of the Interior: Washington, DC, USA; US Geological Survey: Reston, VA, USA, 2005.
  13. Norman, C.E.; Elsbury, W.R. Active faults in north Harris County and south Central Montgomery County, Texas. In Environmental and Engineering Geology of North Harris and South Montgomery Counties Texas-Guidebook; Houston Geological Society: Houston, TX, USA, 1991; Chapter 19; pp. 13–27. [Google Scholar]
  14. Norman, C.E. Ground subsidence and active faults in the Houston Metropolitan Area. In Proceedings of the Conference on Coastal Subsidence, Sea Level and the Future of the Gulf Coast; Houston Geological Society and Engineering, Science and Technology Council of Houston, Houston, TX, USA, 3–5 November 2005. [Google Scholar]
  15. Huffman, A.C., Jr.; Kinney, S.A.; Biewick, L.; Mitchell, H.R.; Gunther, G.L. Salt Diapirs in the Gulf Coast. From Gulf Coast Geology (GCG) Online—Miocene of Southern Louisiana; Version 1; US Geological Survey: Reston, VA, USA, 2004.
  16. Zilkoski, D.B.; Hall, L.W.; Mitchell, G.J.; Kammula, V.; Singh, A.; Chrismer, W.M.; Neighbors, R.J. The Harris-Galveston Coastal Subsidence District/National Geodetic Survey automated global positioning system subsidence monitoring project. In Proceedings of the U.S. Geological Survey Subsidence Interest Group Conference, Galveston, Texas, USA, 27–29 November 2001; Geological Survey: Galveston, TX, USA; pp. 13–28. [Google Scholar]
  17. Kearns, T.J.; Wang, G.; Turco, M.; Welch, J.; Tsibanos, V.; Liu, H. Houston16: A stable geodetic reference frame for subsidence and faulting study in the Houston metropolitan area, Texas, U.S. Geod. Geodyn. 2018. [Google Scholar] [CrossRef]
  18. Yang, L.; Wang, G.; Bao, Y.; Kearns, T.J.; Yu, J. Comparisons of ground-based and building-based CORS: A case study in the region of Puerto Rico and the Virgin Islands. J. Surv. Eng. 2015, 142, 05015006. [Google Scholar] [CrossRef]
  19. Herring, T.A.; Melbourne, T.I.; Murray, M.H.; Floyd, M.A.; Szeliga, W.M.; King, R.W.; Phillips, D.A.; Puskas, C.M.; Santillan, M.; Wang, L. Plate Boundary Observatory and related networks: GPS data analysis methods and geodetic products. Rev. Geophys. 2016, 54, 759–808. [Google Scholar] [CrossRef]
  20. Geng, J.; Meng, X.; Dodson, A.H.; Teferle, F.N. Integer ambiguity resolution in precise point positioning: Method comparison. J. Geod. 2010, 84, 569–581. [Google Scholar] [CrossRef]
  21. Li, X.X.; Zhan, X.; Ge, M. Regional reference network augmented precise point positioning for instantaneous ambiguity resolution. J. Geod. 2011, 85, 151–158. [Google Scholar] [CrossRef]
  22. Wang, G. GPS Landslide Monitoring: Single Base vs. Network Solutions—A case study based on the Puerto Rico and Virgin Islands Permanent GPS Network. J. Géod. Sci. 2011, 1, 191–203. [Google Scholar] [CrossRef]
  23. Wang, G.; Turco, M.; Soler, T.; Kearns, T.J.; Welch, J. Comparisons of OPUS and PPP Solutions for Subsidence Monitoring in the Greater Houston Area. J. Surv. Eng. 2017, 143, 5017005. [Google Scholar] [CrossRef]
  24. Wang, G.; Bao, Y.; Cuddus, Y.; Jia, X.; Serna, J.J.; Jing, Q. A methodology to derive precise landslide displacements from GPS observations in tectonically active and cold regions: A case study in Alaska. Nat. Hazards 2015, 77, 1939–1961. [Google Scholar] [CrossRef]
  25. Bao, Y.; Guo, W.; Wang, G.; Gan, W.; Zhang, M.; Shen, J.S. Millimeter-accuracy structural deformation monitoring using stand-alone GPS: Case study in Beijing, China. J. Surv. Eng. 2017, 144, 05017007. [Google Scholar] [CrossRef]
  26. Blewitt, G.; Hammond, W.C. Harnessing the GPS Data Explosion for Interdisciplinary Science. Eos Trans. AGU 2018, 99, 99. [Google Scholar] [CrossRef]
  27. Wang, G.; Soler, T. Using OPUS for measuring vertical displacements in Houston, TX. J. Surv. Eng. 2013, 139, 126–134. [Google Scholar] [CrossRef]
  28. Soler, T.; Wang, G. Interpreting OPUS-Static Results Accurately. J. Surv. Eng. 2016, 142, 5016003. [Google Scholar] [CrossRef]
  29. Herring, T.A.; King, R.W.; Floyd, M.A.; Mcclusky, S.C. Introduction to GAMIT/GLOBK, Release 10.7; Massachusetts Institute of Technology: Cambridge, MA, USA, 2018. [Google Scholar]
  30. Zumberge, J.F.; Heflin, M.B.; Jefferson, D.C.; Watkins, M.M.; Webb, F.H. Precise point positioning for the efficient and robust analysis of GPS data from large networks. J. Geophys. Res. Biogeosciences 1997, 102, 5005–5017. [Google Scholar] [CrossRef] [Green Version]
  31. Bertiger, W.; Desai, S.D.; Haines, B.; Harvey, N.; Moore, A.W.; Owen, S.; Weiss, J.P. Single receiver phase ambiguity resolution with GPS data. J. Geod. 2010, 84, 327–337. [Google Scholar] [CrossRef]
  32. Wang, G.; Bao, Y.; Gan, W.; Geng, J.; Xiao, G.; Shen, J.S. NChina16: A stable geodetic reference frame for geological hazard studies in North China. J. Geod. 2018, 115, 10–22. [Google Scholar] [CrossRef]
  33. Rebischung, P.; Altamimi, Z.; Ray, J.; Garayt, B. The IGS contribution to ITRF2014. J. Geod. 2016, 90, 611–630. [Google Scholar] [CrossRef]
  34. Wang, G.; Yu, J.; Ortega, J.; Saenz, G.; Burrough, T.; Neill, R. A stable reference frame for the study of ground deformation in the Houston metropolitan area, Texas. J. Géod. Sci. 2013, 3, 188–202. [Google Scholar] [CrossRef]
  35. Yu, J.; Wang, G. Introduction to the GNSS geodetic infrastructure in the Gulf of Mexico Region. Surv. Rev. 2017, 352, 51–65. [Google Scholar] [CrossRef]
  36. Wang, G.; Kearns, T.J.; Yu, J.; Saenz, G. A stable reference frame for landslide monitoring using GPS in the Puerto Rico and Virgin Islands region. Landslides 2014, 11, 119–129. [Google Scholar] [CrossRef]
  37. Yang, L.; Wang, G.; Huérfano, V.; Von Hillebrandt-Andrade, C.G.; Martínez-Cruzado, J.A.; Liu, H. GPS geodetic infrastructure for natural hazards study in the Puerto Rico and Virgin Islands region. Nat. Hazards 2016, 83, 641–665. [Google Scholar] [CrossRef]
  38. Wang, G.; Liu, H.; Mattioli, G.S.; Miller, M.M.; Feaux, K.; Braun, J. CARIB18: A Stable Geodetic Reference Frame for Geological Hazard Monitoring in the Caribbean Region. Remote Sens. 2019, 11, 680. [Google Scholar] [CrossRef]
  39. Wang, G.; Soler, T. Measuring land subsidence using GPS: Ellipsoid height vs. orthometric height. J. Surv. Eng. 2014, 141, 05014004. [Google Scholar] [CrossRef]
  40. Wang, G. Millimeter-accuracy GPS landslide monitoring using precise point positioning with single receiver phase ambiguity resolution: A case study in Puerto Rico. J. Geod. Sci. 2013, 3, 22–31. [Google Scholar] [CrossRef]
  41. Kasmarek, M.C.; Gabrysch, R.K.; Johnson, M.R. Estimated Land-Surface Subsidence in Harris County, Texas, 1915–1917 to 2001; US Department of the Interior: Washington, DC, USA; US Geological Survey: Reston, VA, USA, 2009.
  42. Galloway, D.L.; Burbey, T.J. Review: Regional land subsidence accompanying groundwater extraction. Hydrogeol. J. 2011, 19, 1459–1486. [Google Scholar] [CrossRef]
  43. Coplin, L.S.; Galloway, D. Houston-Galveston, Texas: Managing coastal subsidence. In Land Subsidence in the United States; Galloway, D., Jones, D.R., Ingebritsen, S.E., Eds.; U.S. Geological Survey: Reston, VA, USA, 1999; Volume 1182, pp. 35–48. [Google Scholar]
  44. Turco, M.J.; Petrov, A. Effects of groundwater regulation on aquifer-system compaction and subsidence in the Houston-Galveston Region, Texas, USA. Proc. Int. Assoc. Hydrol. Sci. 2015, 372, 511–514. [Google Scholar] [CrossRef] [Green Version]
  45. Kearns, T.J.; Wang, G.; Bao, Y.; Jiang, J.; Lee, D. Current Land Subsidence and Groundwater Level Changes in the Houston Metropolitan Area (2005–2012). J. Surv. Eng. 2015, 141, 5015002. [Google Scholar] [CrossRef]
  46. Campbell, M.D.; Campbell, M.D.; Wise, H.M. Growth faulting and Subsidence in the Houston, Texas Area: Guide to the origins, relationships, hazards, potential impacts and methods of investigation: An update. J. Geol. Geosci. 2018, 2, 001–053. [Google Scholar]
  47. Buckley, S.M.; Rosen, P.A.; Hensley, S.; Tapley, B.D. Land subsidence in Houston, Texas, measured by radar interferometry and constrained by extensometers. J. Geophys. Res. Biogeosciences 2003, 108, 2542. [Google Scholar] [CrossRef]
  48. Khan, S.D.; Huang, Z.; Karacay, A. Study of ground subsidence in northwest Harris county using GPS, LiDAR, and InSAR techniques. Nat. Hazards 2014, 73, 1143–1173. [Google Scholar] [CrossRef]
  49. Qu, F.; Lu, Z.; Zhang, Q.; Bawden, G.W.; Kim, J.-W.; Zhao, C.; Qu, W. Mapping ground deformation over Houston–Galveston, Texas using multi-temporal InSAR. Remote Sens. Environ. 2015, 169, 290–306. [Google Scholar] [CrossRef]
  50. Harris-Galveston Subsidence District (HGSD). Harris-Galveston subsidence district regulatory plan. Adopted 9 January 2013; amended 8 May 2013. Available online: http://hgsubsidence.org/wp-content/uploads/2013/07/HGSD-2013-Regulatory-Plan-with-Amendment.pdf (accessed on 15 April 2019).
  51. Bawden, G.W.; Thatcher, W.; Stein, R.S.; Hudnut, K.W.; Peltzer, G. Tectonic contraction across Los Angeles after removal of groundwater pumping effects. Nat. Cell Boil. 2001, 412, 812–815. [Google Scholar] [CrossRef]
  52. Yu, J.; Wang, G. GPS-derived ground deformation (2005–2014) within the Gulf of Mexico region referred to a stable Gulf of Mexico reference frame. Hazards Earth Sci. 2016, 16, 1583–1602. [Google Scholar] [CrossRef]
  53. Tandanand, S.; Powell, R. Determining Horizontal Displacement and Strain Due to Subsidence; No 9358; US Department of the Interior, Bureau of Mines: Washington, DC, USA, 1991. [Google Scholar]
  54. Baker, E.T., Jr. Stratigraphic and Hydrogeologic Framework of Part of the Coastal Plain of Texas; Texas Department of Water Resources: Austin, TX, USA, 1979; Volume 236, p. 43. [Google Scholar]
  55. Kasmarek, M.C.; Ramage, J.K. Water-level altitudes 2017 and water-level changes in the Chicot, Evangeline, and Jasper Aquifers and compaction 1973–2016 in the Chicot and Evangeline Aquifers, Houston-Galveston region, Texas. In Scientific Investigations Report; US Geological Survey: Reston, VA, USA, 2017. [Google Scholar]
  56. Shah, S.D.; Ramage, J.K.; Braun, C.L. Status of groundwater-level altitudes and long-term groundwater-level changes in the Chicot, Evangeline, and Jasper aquifers, Houston-Galveston region, Texas, 2018. In Scientific Investigations Report; US Geological Survey: Reston, VA, USA, 2018. [Google Scholar]
  57. Wang, G.; Yu, J.; Kearns, T.J.; Ortega, J. Assessing the Accuracy of Long-Term Subsidence Derived from Borehole Extensometer Data Using GPS Observations: Case Study in Houston, Texas. J. Surv. Eng. 2014, 140, 5014001. [Google Scholar] [CrossRef]
  58. Tregoning, P.; Watson, C.; Ramillien, G.; McQueen, H.; Zhang, J. Detecting hydrologic deformation using GRACE and GPS. Geophys. Lett. 2009, 36, 15401. [Google Scholar] [CrossRef]
  59. Fu, Y.; Freymueller, J.T. Seasonal and long-term vertical deformation in the Nepal Himalaya constrained by GPS and GRACE measurements. J. Geophys. Res. Biogeosciences 2012, 117, 03407. [Google Scholar] [CrossRef]
  60. Riel, B.; Simons, M.; Ponti, D.; Agram, P.; Jolivet, R. Quantifying Ground Deformation in the Los Angeles and Santa Ana Coastal Basins Due to Groundwater Withdrawal. Water Resour. Res. 2018, 54, 3557–3582. [Google Scholar] [CrossRef] [Green Version]
  61. Holzer, T.L.; Gabrysch, R.K. Effect of Water-Level Recoveries on Fault Creep, Houston, Texas. Ground Water 1987, 25, 392–397. [Google Scholar] [CrossRef]
  62. Yeager, K.M.; Wolfe, P.C.; Feagin, R.A.; Brunner, C.A.; Schindler, K.J. Active near-surface growth faulting and late Holocene history of motion: Matagorda peninsula, Texas. Geomorphology 2019, 327, 159–169. [Google Scholar] [CrossRef]
Figure 1. Permanent GPS stations in the western part of the Houston metropolitan area and their horizontal site velocities derived from continuous GPS observations during the period from 2013 to 2018. The uncertainties (2σ, 95% confidence level) of the horizontal velocities are below ±0.5 mm/year. The blue rectangle indicates the Long Point Fault area. The red lines represent active faults in the Houston Metropolitan area mapped by USGS [12]. The orange filled polygons represent salt domes mapped by USGS [15].
Remotesensing 11 01213 g001
Figure 2. GPS-derived horizontal (red) and vertical (blue) site velocity vectors at permanent GPS sites along the two sides of the surface scarp of the Long Point Fault. The velocities are derived from the GPS-derived displacement time series (2013–2018) with respect to Houston16. The uncertainties (2σ, 95% confidence level) of the velocities are ±0.2 to ±0.3 mm/year in the horizontal direction, and ±0.4 to ±0.6 mm/year in the vertical direction. The hill-shaded digital elevation model (DEM) is derived from airborne LiDAR data collected in October 2001. The yellow lines show the exact locations of three topographic profiles exhibited in Figure 4. The dark line shows the approximate location of the geological cross-section illustrated in Figure 5.
Remotesensing 11 01213 g002
Figure 3. (a) The fault trace of the Long Point Fault near the intersection of Interstate Highway 10 (I-10) and Texas State Highway 8 (H-8) (Google Image); (b) the fault scarp of the Long Point Fault between GPS stations HCC1 (hangingwall side) and HCC2 (footwall side); (c) the height of the fault scarp is approximately 1.5 m at this site; (d) randomly tilted utility poles and recurring cracks on the pavement in the parking lot near the fault scarp. These photos were taken in October 2017.
Remotesensing 11 01213 g003
Figure 4. Topographic profiles extracted from the LiDAR-derived DEM: (a) along HCC2 and HCC1, (b) along SPBH and CSTE, and (c) along RDCT and HSMN. The red lines indicate the location of the fault trace of the Long Point Fault. The length of each profile is 5 km (see Figure 2). The LiDAR data was collected in October 2001.
Remotesensing 11 01213 g004
Figure 5. A schematic sketch illustrating the geologic cross-section of the Long Point Fault near the Addicks extensometer site (Modified from the USGS Report No.1136 [8]). The approximate location of the cross-section is marked in Figure 2.
Remotesensing 11 01213 g005
Figure 6. Photos showing typical field installations of the Long Point Fault GPS antennas.
Remotesensing 11 01213 g006
Figure 7. Plots depicting the data history and continuity of the Long Point GPS Array. The vertical displacement time series are derived from the 24-hour precise point positioning (PPP) solutions with respect to Houston16 and 24-hour carrier-phase double-difference (DD) solutions with respect to UTEX. The linear trends of the time series are listed in Table 1.
Remotesensing 11 01213 g007
Figure 8. (a) The displacement time series of HCC1 and HCC2 (24-hour PPP solutions) with respect to the stable local reference frame Houston16; (b) the three-component displacement time series of HCC1 (24-hour DD solutions) with respect to HCC2. The root-mean-square (RMS) accuracy is calculated from detrended displacement time series.
Remotesensing 11 01213 g008
Figure 9. (a) The three-component displacement time series of the hangingwall station CSTE with respect to the footwall station SPBH; (b) the three-component displacement time series of the hangingwall station HSMN with respect to the footwall station RDCT.
Remotesensing 11 01213 g009
Figure 10. Site velocity vectors (blue: vertical; red: horizontal) of 11 GPS antennas with respect to the antenna of UTEX. The uncertainties (2σ, 95% confidence level) of the velocities are ±0.1 to ±0.3 mm/year in the horizontal direction, and ±0.2 to ±0.6 mm/year in the vertical direction.
Remotesensing 11 01213 g010
Figure 11. Contour maps showing GPS-derived subsidence in the Jersey Village area during two different periods: (a) 1995–2005 and (b) 2013–2018. Dark dots represent the locations of GPS stations that were used to develop the subsidence contours. Green dots represent the Long Point GPS Array. The color zones represent the different groundwater regulation zones [50]. The red vectors depict the horizontal ground motions that are same as the vectors exhibited in Figure 2.
Remotesensing 11 01213 g011
Figure 12. Comparisons of three-component displacement time series recorded by two PAM GPS stations (PA01 and PA03, 9.3-km apart) in the Jersey Village area (see Figure 1). The displacements are derived from the daily PPP solutions with respect to Houston16.
Remotesensing 11 01213 g012
Figure 13. (a) Site view at the Addicks groundwater pumping station (Google Image); (b) the borehole extensometer and the permanent GPS antenna ADKS; (c) the permanent GPS antenna monument of the HGSD PAM station PA05. The distance between these two GPS antennas (ADKS, PA05) is approximately 50 m.
Remotesensing 11 01213 g013
Figure 14. (a) The history of groundwater-level altitudes (1974–2018) in the Chicot and Evangeline aquifers measured at the Addicks extensometer site (Figure 13); (b) the history of the land subsidence recorded by the extensometer (1974–2018) and GPS antenna PA05 (1996–2018). The GPS antenna ADKS is mounted on the top of the inner pole of the extensometer (see Figure 5).
Remotesensing 11 01213 g014
Figure 15. Comparisons of the seasonal horizontal and vertical ground deformation at two sites: HCC1 (subsiding) and TXLI (no subsidence). The detrended displacements are derived from daily PPP solutions.
Remotesensing 11 01213 g015
Figure 16. Plots depicting the coincidence of the seasonal ground surface up and down with the fluctuations of the Evangeline groundwater level. (a) The history of groundwater level in the Chicot aquifer at Addicks site; (b) the history of the groundwater level in the Evangeline aquifer; (c) the vertical displacements at the land surface recorded by HCC1; (d) the vertical displacements at the bottom of the borehole (549 m below the land surface) recorded by the deep-mounted GPS antenna ADKS.
Remotesensing 11 01213 g016
Table 1. Major parameters of the Long Point Fault GPS Array
LongitudeLatitudeAntenna ElevationDistanceSite Velocities (2013-2018) (mm/year)
NAVD88To FaultTo UTEX(PPP Solutions*, Houston16)(DD Solutions**, UTEX-Fixed)
GPS(deg.)(deg.)(m)(km)(km)NSEWUDNS EW UD
MDWD−95.59529.77132.90.363.122.5−0.8−6.8−0.71.02.0
WCHT−95.58129.78338.30.671.352.4−0.5−11.0−0.51.4−1.3
UTEX−95.56829.78637.10.130.002.6−2.0−8.20.00.00.0
HCC2−95.56229.78837.10.070.622.0−1.8−9.3−0.50.2−0.6
SPBH−95.51529.80236.40.635.421.5−1.3−6.9−1.10.91.8
RDCT−95.49529.81036.70.927.601.3−1.0−6.4−1.01.21.8
TSFT−95.48029.80629.10.118.881.0−0.5−7.3−1.42.22.4
HCC1−95.56129.78834.50.020.672.7−1.5−8.60.20.5−0.8
WDVW−95.53329.79031.50.173.412.3−1.3−7.3−0.30.91.7
CSTE−95.51129.79628.50.255.622.0−1.3−5.1−0.40.50.6
HSMN−95.47029.80034.40.739.681.2−0.9−6.2−1.41.72.4
LCI1−95.44329.80748.90.5612.451.0−1.2−4.5−1.52.03.2
Average 0.39 1.9−1.3−7.3
* The uncertainties (2σ, 95% confidence level) of the velocities with respect to Houston16 are ±0.2 to ±0.3 mm/year for the horizontal components, and ±0.4 to ±0.6 mm/year for the vertical component. ** The uncertainties (2σ, 95% confidence level) of the velocities with respect to UTEX are ±0.1 to ±0.3 mm/year for the horizontal components, and ±0.2 to ±0.6 mm/year for the vertical component.

