1. Introduction
Applications of Earth Observation for cultural heritage have rapidly increased in the last years. A review of the available literature indicates a growing interest in the exploitation of active satellite sensors with particular emphasis on the use of synthetic aperture radar (SAR) [
1,
2,
3]. The increase in spatial resolution, as in the case of TerraSAR–X, and in temporal resolution, as in the case of the Sentinel-1 constellation, are two main developments in this domain. The free, full, and open data policy adopted by the Copernicus program, which foresees free access to the Sentinel datasets, can be considered as a milestone for the scientific progress of radar space technology [
4]. The launch of Sentinel-1A in 2014 and Sentinel-1B two years later has made possible the systematic supply of data for multitemporal analyses. Several studies have been carried out on investigating the effectiveness of Differential SAR Interferometry (D-InSAR) on the detection of land movements. D-InSAR has been used successfully for monitoring land subsidence [
5,
6,
7,
8,
9] and uplift, with particular applications such as landslides [
10,
11,
12] and other ground displacements caused by natural occurring phenomena such as earthquakes [
13,
14,
15], volcano eruptions [
16,
17,
18,
19], and also human activities [
20,
21]. D-InSAR can be used to detect and monitor, under certain conditions, ground deformations on a centimetric scale, offering an effective method for assessing land movements over large areas [
22].
In recent years, there has been a growing interest in the use of remote sensing techniques, such as the application of D-InSAR for deformation monitoring, for risk monitoring and assessment of cultural heritage [
23]. This interest was further enhanced by free provision and access to SAR data of various spatial resolutions and temporal coverage. Research interests have often focused on identifying the perspectives of SAR remote sensing for cultural heritage applications [
2,
24]. In other cases, the aim has been to monitor cultural heritage sites and assess the risk of geohazards [
3,
25]. Polarimetric C- and L-band SAR sensitivity has been analyzed with buried archaeological structures [
26], and integration of radar and laser-based remote sensing techniques for monitoring structural deformation of archaeological monuments has also been studied [
27]. Additionally, Persistent Scatterer Interferometry (PSI) techniques such as Permanent Scatterer SAR Interferometry (PSInSAR) and “Squeezed” SAR (SqueeSAR) have proven to be suitable for deformation analyses in cultural heritage sites [
28].
Based on these studies, selection of SAR data should be case-specific and should always be based on the properties and characteristics of the cultural heritage monuments and their surroundings to achieve optimum results. Therefore, SAR acquisitions with a long wavelength (L-band, P-band, etc.), having enhanced capabilities for penetration, are recommended for areas covered with vegetation, whereas in the cases of D-InSAR and MT-InSAR, SAR data with a short wavelength (C-band) are preferred, as there is a need to improve the accuracy of the calculated deformations. In the case of early warning systems and detailed monitoring, high-resolution SAR data are required [
3]. Integration of different SAR interferometry techniques can overcome any obstacles by combining their respective advantages [
23].
The 12 day repeat cycle of the Sentinel sensors can be also used for mapping rapid changes in the landscape such as those in the case of an earthquake. The use of freely distributed datasets, such as those of Sentinel-1, along with the exploitation of open-source software for processing radar images are key characteristics for assessing the impact to cultural heritage worldwide, even in areas with limited budgets. The main goal of the present study is to monitor the vulnerability of built heritage with regards to land movements at the area of Paphos by exploiting free datasets and open software, aiming to demonstrate the capabilities that can be offered by such solutions. The present article is a continuation of a previous study that was carried out on “Earth observation technologies in service to the cultural landscape of Cyprus: risk identification and assessment” [
29].
The paper is organized as follows: first, the case study area is presented, followed by a description of the datasets and software used. Then, the overall methodology is presented. In
Section 4 the methodology applied is described, and in
Section 5, the results of this analysis are highlighted. The paper ends with a discussion and the conclusions.
2. Case Study
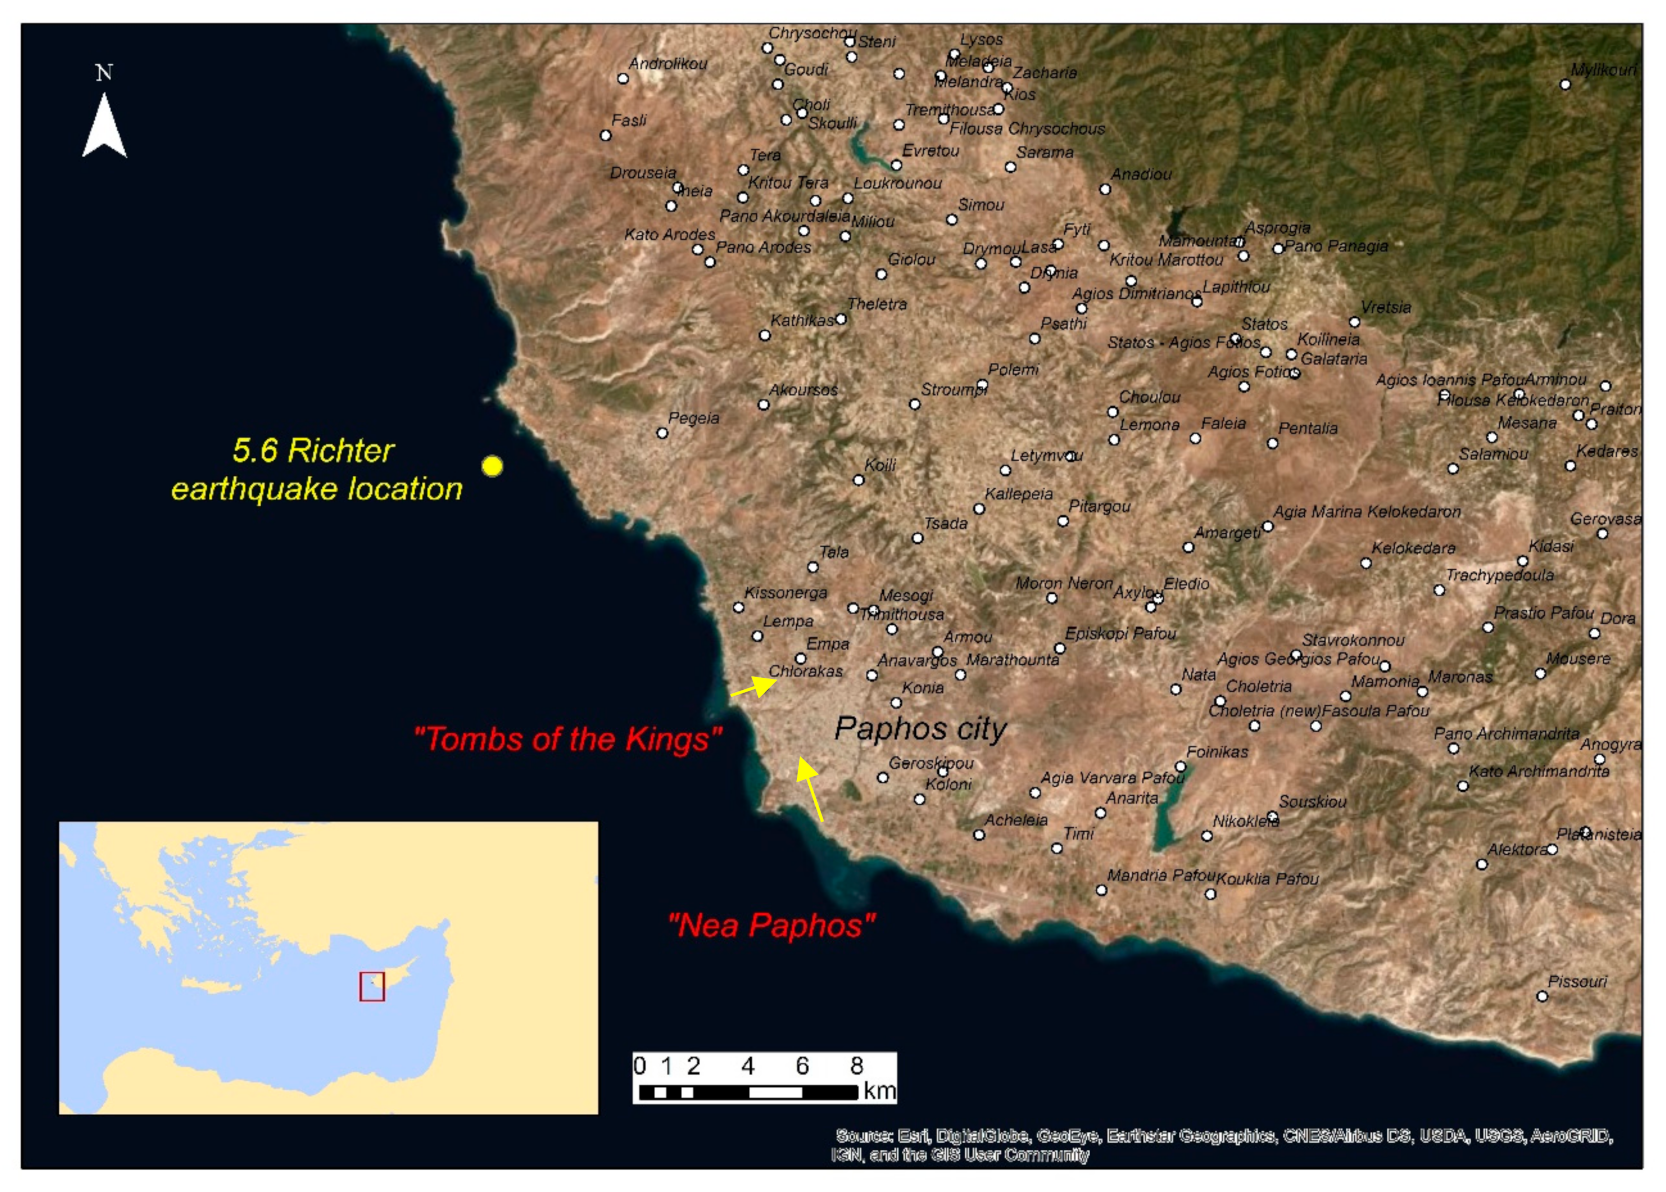
The area of interest is the wider region of the city of Paphos, located in the western part of Cyprus. In this region, important archaeological sites and monuments attract thousands of tourists every year. The historic center of Paphos hosts important heritage buildings, most of them nowadays renovated. The sites are scattered around the wider area of the city, while the main attractions are the sites of “Nea Paphos” and the “Tombs of the Kings”, which were inscribed on the World Heritage List of UNESCO in 1980. These sites, placed in the most western part of Paphos, preserve a unique heritage identity of the island, revealing the rich cultural heritage of the area [
30].
“Nea Paphos” is considered one of the most important sites of the island. It was founded at the end of the 4th century and in the beginning of the 3rd century B.C., when Cyprus became part of the Ptolemaic kingdom. Nea Paphos became the center of Ptolemaic administration on the island. Until the end of the 2nd century B.C., Nea Paphos was the capital of the whole island and remained as such until the 4th century A.D. The remains that can be visited today are mainly dated to the Hellenistic and Roman periods. The city seems to have already been fortified by Nicocles, and the city walls formed a considerable work of defense. Most of their superstructure has disappeared or quarried, but the course of the city wall can be traced over most of its length by the rock cut foundations. Systematic excavations at Nea Paphos started in 1962 by the Department of Antiquities, during which many of the ancient town´s administrative buildings as well as private houses and ecclesiastical buildings came to light. Some of the most important monuments of the site are the Roman villas decorated with impressive floor mosaics, such as the “House of Dionysos”, the “House of Aion”, and the “House of Orpheus”. Apart from the villas, the civic center of Nea Paphos was situated in the northwestern part of the city and included the important public buildings of the town, such as the Agora, the theatre, and the Asklepieion, parts of which can be visited today [
31].
The “Tombs of the Kings” site is an impressive necropolis that is located just outside the walls, to the north and east of Paphos city. It was built during the Hellenistic period (3rd century B.C.) to satisfy the needs of the newly founded Nea Paphos. Its name is connected with the impressive character of its burial monuments. It was the place where the higher administrative officers and distinguished Ptolemaic personalities as well as the members of their families were buried. In 1977, systematic excavations were carried out by the Department of Antiquities, which brought to light eight large tomb complexes. Most of the tombs are characterized by an underground, open aired, peristyled rectangular atrium completely carved into the natural rock. Columns or pillars of the Doric style support the porticoes, which surround the atrium [
32].
It is possible that these monuments were built over unstable underlying ground conditions, thus increasing the risk for severe damages or even their collapse. Cyprus is located within a seismically active zone, a fact that further enhances the importance of monitoring cultural heritage sites located in Cyprus. Paphos is situated in the most tectonic region of Cyprus, and several earthquakes have been reported in the past. One of the most devastating earthquakes in the area was the 6.5 Richter earthquake in 1953, which had a result of 40 people killed, 100 people injured, and 4000 people becoming homeless.
On 15 April 2015, at 8:25 AM UTC, Cyprus was hit by a new earthquake. The earthquake had a magnitude 5.6 on the Richter scale with an epicenter 3 km offshore, west of Kissonerga, and 8 km northwest of Paphos as shown in
Figure 1 [
33]. The earthquake was strongly felt throughout Cyprus. Many minor earthquakes occurred in the vicinity during the day raising concern to citizens and local authorities. In total, the post-seismic sequence consisted of around 60 smaller scale earthquakes in the same epicentral area.
3. Datasets
In order to study the deformation caused by the earthquake and its effects to the wider area of Paphos, SAR images before and after the event were obtained to apply D-InSAR methodology. Therefore, two Sentinel-1 SAR images were acquired, one on 14 April 2015 (i.e., one day before the earthquake) and one on 26 April 2015. A detailed list of the characteristics of the acquired images is presented in
Table 1.
The image pair was processed using the open-source software Sentinel Applications Platform (SNAP) [
34]. The open source policy and the great number of capabilities make it an ideal candidate software for SAR as well as optical imagery processing. SNAPHU v1.4.2 software [
35], a statistical-cost network-flow algorithm for phase unwrapping developed at Stanford University, was used for the phase unwrapping process of the methodology.
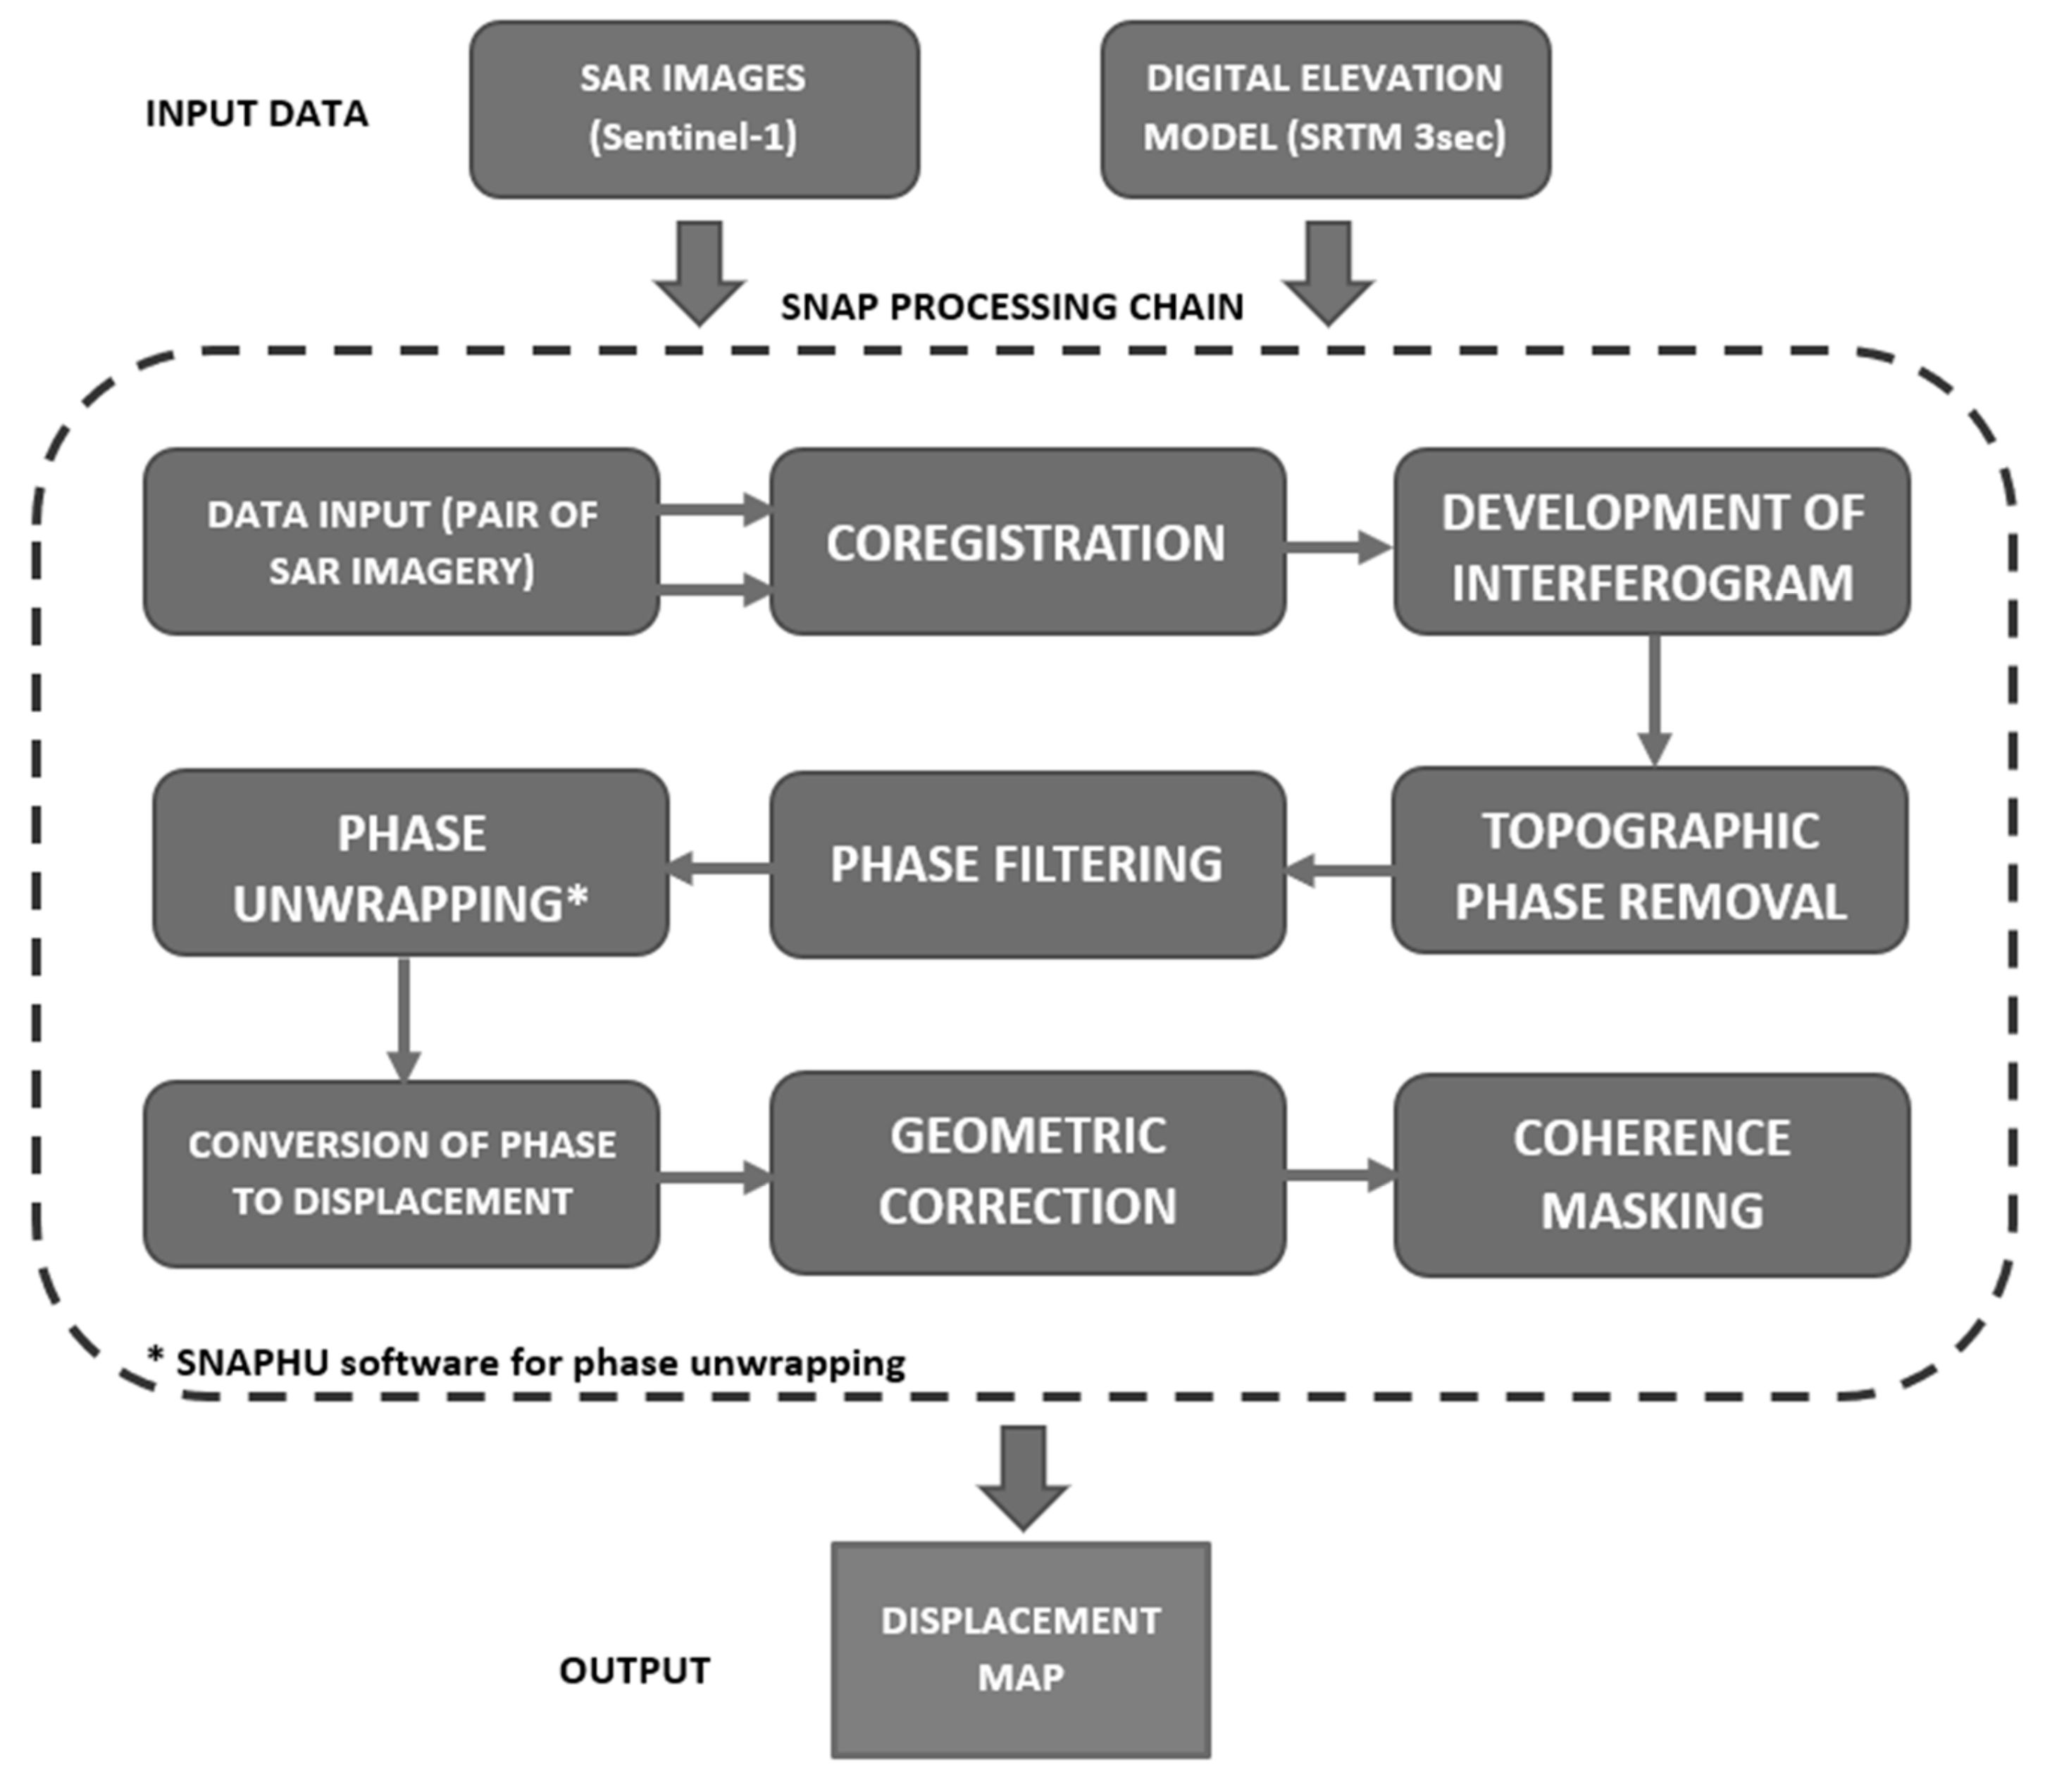
4. Methodology
This section presents the overall methodology followed. An overview of the methodology steps that were carried out is presented in
Figure 2.
As described in the previous section, two SAR acquisitions were downloaded from the European Space Agency (ESA) Copernicus Open Access Hub [
36] to study the earthquake’s effects in the Paphos area. For the needs of the interferometric analysis it is very important to have a high coherence between the two image acquisitions. Coherence is used as a quantitative indicator of the quality of the associated interferogram and is an indication of any significant radar signal changes between acquisitions. Surface cover changes, such as vegetation growth, often exhibit and introduce sudden changes in coherence in SAR imagery. Thus, for higher accuracy of results, it is suggested that the final displacement maps are masked according to high coherence for land cover such as urban areas. Therefore, it is recommended that the acquisition times for the pair of SAR images are temporally close in order to minimize the loss of coherence. Small perpendicular baseline interferograms are preferable, as these do not suffer from geometric decorrelation, show good fringes, and are usually easy to unwrap [
37]. For D-InSAR, the limit of their perpendicular baselines was set to 200 m [
38]. In general, D-InSAR favors short baselines (less than 200 m) for C-band systems. Due to the high revisit frequency and the excellent orbital accuracy of Sentinel-1, the perpendicular baseline is usually not a limiting factor, facilitating the application of InSAR in many countries [
39]. The perpendicular baseline aspect, though, can be used to select the optimal pair of images [
40].
After downloading the pair of Sentinel-1 images, these were inserted into the SNAP software. The coregistration step followed, and then the interferogram was developed. Images were aligned and matched using coarse followed by DEM-assisted fine coregistration of subpixel accuracy. The derived original interferogram was used to remove the topographic phase using the digital elevation model (DEM) that was automatically acquired by the SNAP software in order to produce a differential interferogram. The Goldstein phase filter was also applied to enhance the developed interferogram and make the interferometric fringes visually clearer. Then, phase unwrapping was carried out using the SNAPHU software. After importing the results back in SNAP, the phase values were converted to displacement values. In order to obtain accurate results, geometric correction and coherence masking were applied to lead to the final output, which was the displacement map.
5. Results
5.1. Synthetic Aperture Radar (SAR) Processing
The images were initially imported to SNAP software. After checking that the pair of images were suitable for the task in hand, the two images were coregistered in the SNAP environment into a stack, selecting the image prior to the earthquake (14f April) as the master and the SAR image after the earthquake (26 April) as the slave. During this process, the pixels in the slave image were aligned with the master image to subpixel accuracy. Coregistration ensured that each ground target contributed to the same (range, azimuth) pixel in both the master and the slave images [
41]. In order to achieve fine azimuth coregistration accuracy, the enhanced spectral diversity (ESD) method was applied [
42]. ESD exploits the overlapping area between two consecutive bursts to estimate the mis-registration with the required sensitivity. During this process, the “Sentinel Precise Orbits” file, which contains information about the position of the satellite during the acquisition of SAR data, was used. Additionally, a digital elevation model (DEM), SRTM (Shuttle Radar Topography Mission) 3 s, was used, and the cubic convolution resampling method was chosen to achieve more accurate results of the subpixel coregistration. When available, DEMs of higher resolution, such as SRTM 1, ASTER GDEM (Global Digital Elevation Model), and so on, can be used instead to improve the results even further. The coregistration result can be manually assessed by vertically displaying both images at the same time. Coherence was also very high in both images, being a good indicator for the successful completion of the coregistration step, as a higher coherence area indicates a better coregistration location [
43]. The quality of the results from interferometric processing is greatly affected by the quality of the coregistration.
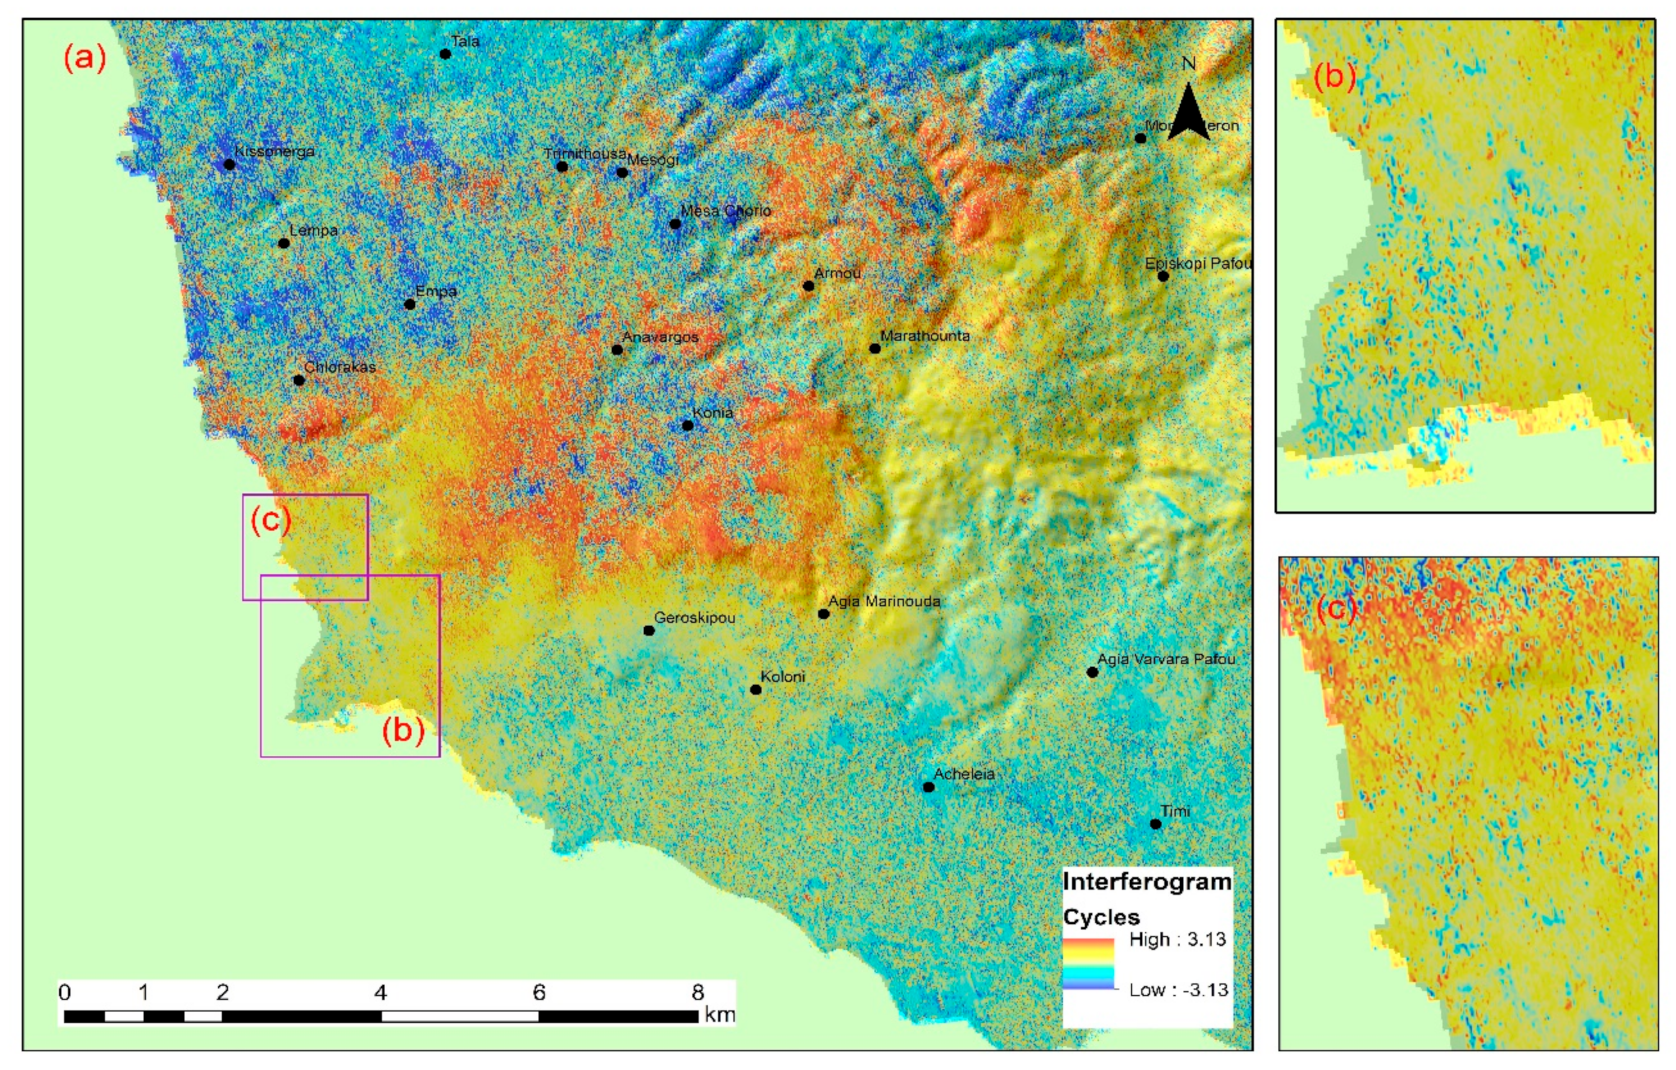
The next step leads both to the development of the interferogram and the derivation of the coherence. The synthesized interferogram from the DEM used at the previous step was combined with the interferogram from the input interferometric pair to create the differential interferogram. The fringes represent the changes in phase between the two images in terms of radians of a full 2π cycle. Each cycle of colors represents half the sensor’s wavelength. In the case of Sentinel-1, each cycle represents a line-of-sight phase displacement of approximately 2.7 cm. In general, the closer the distance between the fringes, the greater is the shift in position of the surface. Where no clear colors are visible, this is the result of phase noise, which in turn is due to temporal change of the scatterers. This is also an indicator of low coherence regions.
The derived interferogram, essentially being the difference between the phases of two SAR images, is influenced by the topography as it is highly correlated to elevation. In order to derive a SAR interferogram without the influence of surface elevation, a DEM was used to simulate the topographic fringes (topographic phase), which were then removed from the produced interferogram. Goldstein phase filtering was then carried out prior to unwrapping as a preparatory step for increasing the signal-to-noise ratio. The differential interferogram (
Figure 3) produced in the previous step contains information regarding elevation displacement.
The process of converting the interferogram from a cyclical to a linear format is called interferogram phase "unwrapping". This step was carried out in order to calculate the absolute phase, which can then be transformed into height or displacement. Phase unwrapping was carried out in SNAPHU software plugin, and the results were then used as an input to SNAP software.
One of the final steps of the process in the conversion of phase to displacement, leading to the calculation of vertical land movements/displacement, indicates the impact of the earthquake on the cultural heritage sites under study in terms of displacement in millimeters. Firstly, the location of a pixel of a known displacement was identified. Such information can be acquired from Global Navigation Satellite System (GNSS) receivers. The value of the pixel of known displacement was then used to convert relative displacement values to absolute ones. This was achieved by subtracting the value of the specific pixel from all the pixels in the areas of interest. If more than one pixel with such information was available, it could be used to validate the final output of the displacement map. To convert the unwrapped phase φ to vertical displacement in millimetres, the following equation was used:
At this stage, the displacement values are relative. Further processing is required to calculate the absolute displacement values. As aforementioned, in order to achieve this, a reference point of known displacement is to be incorporated into the procedure, that is, a point or location that has remained stable between the two SAR image acquisitions.
In Paphos, the department of Civil Engineering and Geomatics of the Cyprus University of Technology conducted an analysis on the deformation introduced at the continuously operating reference station (CORS) PAFO. PAFO is located in the area of interest and is one of the stations of the Cyprus Positioning System (CYPOS)—the National Reference Station Network operated by the Department of Lands and Surveys. Deformation analysis was conducted by processing daily GNSS observation files for the timespan 14–16 April 2015 (i.e., before and after the earthquake of Paphos). GNSS processing was carried out using Leica Geo Office v.8.40. Specifically, an ionospheric-free linear combination was used using precise ephemeris and clock products and the Hopfield tropospheric model. An elevation cutoff angle of 15° was further imposed to exclude low-elevation satellites from the final solution. Reference data were obtained by the IGS (International GNSS Service) station NICO for the same period. Furthermore, the observations were inspected, both automatically and manually, for cycle slips to enhance the quality of the observations and the accuracy of the final solution. The results indicated that the specific station did not show any statistically significant displacement (a vertical displacement of 0.5 mm was observed); thus, PAFO was considered stable and was set as “Zero Point Reference.” It is noted that GNSS performance suffers in the vertical component because of the architecture of the system (only satellites above the horizon are used). However, with proper processing techniques, results at the millimeter level can be obtained. Taking this into account, our result was further supported by the findings of a recent study [
44], which examined daily solutions from PAFO station for a time span of 5 years using the Bernese GNSS v.5.2 software. The later concluded that vertical velocities on the order of 1.6 mm/y occurred at this location. In order to define the exact position of the point, the produced displacement image above needed to be geometrically corrected. The result of this step was the development of a geo-referenced displacement map.
Following completion of the aforementioned steps, the resulting displacement map for our area of interest was produced. The resulting displacement map indicated vertical displacement ranging between −79.43 and 102.92 mm. For a higher accuracy of results, it is suggested that the final displacement map is masked to remove regions of low coherence. For our case study, all areas with coherence less than 0.6 were chosen as the mask. This allowed us to exclude all vegetated land cover from the displacement map, which often introduces errors to results because of temporal variations, and allowed us to concentrate on coherent areas such as urban cover.
The final vertical displacement map is shown in
Figure 4. From the legend of the figure, it is clear that during the 12 days between the two SAR acquisitions there was a maximum uplift of 74 mm and a maximum subsidence of 31 mm.
5.2. Displacements and Cultural Heritage Sites
Based on the findings of D-InSAR processing, a further investigation of the displacement characteristics, in sites of cultural interest was performed. As shown in
Figure 5, two important archaeological sites of Cyprus, namely the “Nea Paphos” (
Figure 5a) and “Tombs of the Kings” (
Figure 5b), as well as the broader area of the historic center of Paphos (
Figure 5c) were studied.
The analysis shows that displacement was close to 0 mm in both UNESCO World Heritage sites. Some areas, mainly in the southern part of “Nea Paphos”, indicated minor vertical displacement, which were, however, modern constructions. A similar pattern was also observed in the “Tombs of the Kings” site where hotels and buildings in the eastern part of the site showed some small displacement in contrast to the archaeological site in the west. On the contrary, in the wider area of the historic center of Paphos, a negative vertical displacement (subsidence) was recorded in the eastern and northern parts. The western part of that region seemed to be unaffected from the event.
6. Discussion
In the last years, the Earth Observation sector has provided remarkable opportunities for monitoring cultural heritage sites. This paper aimed to present a case study to evaluate the impact of a specific event (earthquake) in a wider heritage landscape. For this aim, the use of freely distributed Sentinel-1 datasets as well as the use of open-source software were exploited. The Sentinel-1 sensors, due to their high temporal resolution, enabled us to acquire radar images before and after the event, which were then processed and analyzed.
D-InSAR investigation is the first step to map the displacement pattern over large areas, as those of Paphos district, which includes cultural heritage sites, thus providing fast and reliable information to local stakeholders and policy makers about the hazard. Based on this evaluation, and taking into account the structural stability of standing and/or buried monuments, vulnerability maps can be developed. D-InSAR processing can, therefore, be part of a continuous updated risk management plan of cultural heritage sites and landscapes, aligned with state-of-the-art geoinformation technologies such as those provided under the Copernicus umbrella.
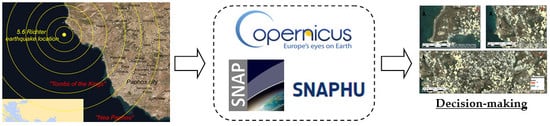
Indeed, the contributions of the Copernicus program through the freely available Sentinel-1 satellite data along with the open-source software SNAP provided freely by ESA, as well as SNAPHU plugin/software developed at Stanford university, which can be used to process the Copernicus data, can lead to the collection of valuable information in a timely manner due to the high temporal resolution of Sentinels (
Figure 6). Geographic information systems (GISs) were employed in order to provide a valuable mapping representation of all the different parameters and collected data, enabling the spatial representation of the various findings.
This information in the form of displacement maps can be utilized in the decision-making process of local stakeholders and responsible authorities, and it can be used for the on-time activation of disaster/emergency management services for the protection of the environment and citizens. Such a kind of solution will allow stakeholders to observe, moFnitor, and model hazards such as earthquakes in minimum time. This hazard-related information combined with vulnerability maps that will present the condition of the cultural heritage monuments of interest can enable authorities to apply specialized protective measures for the respective monuments based on their characteristics and residing risks on each specific site.
However, certain limitations exist mostly because of the spatial resolution of Sentinel-1 images and the C-band wavelength. As presented in the literature review, areas covered with vegetation cannot be monitored very efficiently with Sentinel-1 images; thus, P-band SAR images, which have enhanced capabilities for penetration, are preferred instead. Last but not least, higher resolution SAR data, such as COSMO-SkyMed and TerraSAR-X are required in the case of early warning systems and detailed monitoring.
7. Conclusions
In our example of the Paphos area, major vertical displacement was observed in the northern part of the city of Paphos, whereas in the historic center, some smaller displacements were observed. The findings recorded, from 14 April 2015 until 26 April 2015, a maximum uplift of 74 mm and a maximum subsidence of 31 mm. This displacement was visualized as a thematic map, and further interpretation was conducted. As shown, both archaeological sites in the eastern part of the area showed nearly zero displacement. The results were also confirmed with a GNSS study, used as a ground truth of this analysis.
The proposed methodology implemented in this study as well as the overall outcomes of the study allow the exploitation of this opportunity to develop a system for the systematic monitoring of sites and monuments covering wide areas of interest, which can offer support to local stakeholders and responsible local authorities. This can be included in decision-making processes to identify risks and adopt mitigation measures to eliminate residing risks and protect cultural heritage monuments. However, this requires strong interactions and synergies among experts in the fields of archaeology and remote sensing. Cultural heritage managers need to improve traditional methodology for the monitoring and protection of cultural heritage as well. This can be achieved by raising awareness to the public authorities and local stakeholders regarding the use of such innovative techniques.
The use of open-source software and freely distributed images is also highlighted in this paper. Freely distributed Earth Observation datasets supported by national and international space agencies, such as those of the Copernicus space program and Landsat series, will continue to provide optical and radar images with a high temporal resolution around the world. The need to provide tangible end-products and services to nonexperts in remote sensing, thus addressing societal challenges both on a local and a regional level, is essential to the scientific community.
The Sentinel-1 constellation benefits its users with its very short revisit times and continuity of a wide area coverage; however, it has a low spatial resolution compared with other SAR satellites such as COSMO-SkyMed or TerraSAR-X. For Cyprus, Interferometric Wide swath Sentinel-1 products are only available with a resolution of 2.7 × 22 m to 3.5 × 22 m. This can be a constraint for smaller scale studies where more detailed monitoring is required.
In the future, the authors will continue to investigate ways of how Copernicus sensors can be exploited further for noninvasive monitoring and management of cultural heritage. The exploitation of the Copernicus program in its full capacity, including all other sensors, is expected to enhance research in new directions and methodologies. In the present study, a pair of Sentinel-1 images was used to map landscape changes after a 5.6 magnitude earthquake in Paphos area. More systematic monitoring through a time-series of SAR images is planned to be carried out on a long-term basis, which is expected to help us derive information regarding rates and velocities of displacement.
As a future step, interferometric stacking techniques, such as the analysis of persistent scatterers, will be tested for different combinations of SAR image pairs, such as pairs of ascending or descending images, for the temporal monitoring of ground deformation in the vicinity of cultural heritage sites. The application of interferometric stacking methods will help to study the vulnerability of exposed and/or buried cultural heritage monuments to the residing site-specific risks, and it will aid in the development of appropriate vulnerability maps that will assist local authorities in adopting protective measures to conserve cultural and archaeologic heritage.
Author Contributions
Conceptualization, M.T. and A.A.; methodology, M.T and D.K..; software, M.T. and D.K; validation, M.T., A.A., and C.D.; formal analysis, M.T.; investigation, M.T.; resources, D.G.H.; data curation, M.T.; writing—original draft preparation, M.T.; writing—review and editing, M.T., D.K., C.D., A.A., and D.G.H.; visualization, M.T and A.A.; supervision, D.G.H.; project administration, M.T. and D.G.H.; funding acquisition, D.G.H.
Funding
Part of this research was funded by JPI-Cultural Heritage under CLIMA project “Cultural Landscape risk Identification, Management and Assessment” with grant number JPI HERITAGE PLUS/0314/07.
Acknowledgments
The authors would like to acknowledge the use of free open-access Copernicus Sentinel-1 data [2015] and the use of SNAP—ESA Sentinel Application Platform v6.0.0,
http://step.esa.int and SNAPHU (Copyright 2002-2019 Board of Trustees, Leland Stanford Jr. University) software,
https://web.stanford.edu/group/radar/softwareandlinks/sw/snaphu/ for the processing of the SAR acquisitions. The authors would like also to acknowledge the Eratosthenes Research Centre of the Department of Civil Engineering and Geomatics, Cyprus University of Technology. The present study is part of M.T.s PhD thesis.
Conflicts of Interest
The authors declare no conflict of interest.
References
- Agapiou, A.; Lysandrou, V. Remote sensing archaeology: Tracking and mapping evolution in European scientific literature from 1999 to 2015. J. Archaeol. Sci. Rep. 2015, 4, 192–200. [Google Scholar] [CrossRef]
- Tapete, D.; Cigna, F. Trends and perspectives of space-borne SAR remote sensing for archaeological landscape and cultural heritage applications. J. Archaeol. Sci. Rep. 2017, 14, 716–726. [Google Scholar] [CrossRef] [Green Version]
- Chen, F.; Lasaponara, R.; Masini, N. An overview of satellite synthetic aperture radar remote sensing in archaeology: From site detection to monitoring. J. Cult. Herit. 2017, 23, 5–11. [Google Scholar] [CrossRef]
- Sentinel Data Access Overview—Sentinel Online. Available online: https://sentinel.esa.int/web/sentinel/sentinel-data-access (accessed on 26 June 2019).
- Liosis, N.; Marpu, P.R.; Pavlopoulos, K.; Ouarda, T.B.M.J. Ground subsidence monitoring with SAR interferometry techniques in the rural area of Al Wagan, UAE. Remote Sens. Environ. 2018, 216, 276–288. [Google Scholar] [CrossRef]
- Mullissa, A.G.; Tolpekin, V.; Stein, A.; Perissin, D. Polarimetric differential SAR interferometry in an arid natural environment. Int. J. Appl. Earth Obs. Geoinf. 2017, 59, 9–18. [Google Scholar] [CrossRef]
- Bhattacharya, A.; Arora, M.K.; Sharma, M.L.; Vöge, M.; Bhasin, R. Surface displacement estimation using space-borne SAR interferometry in a small portion along Himalayan Frontal Fault. Opt. Lasers Eng. 2014, 53, 164–178. [Google Scholar] [CrossRef]
- Dammann, D.O.; Eicken, H.; Mahoney, A.R.; Meyer, F.J.; Freymueller, J.T.; Kaufman, A.M. Evaluating landfast sea ice stress and fracture in support of operations on sea ice using SAR interferometry. Cold Reg. Sci. Technol. 2018, 149, 51–64. [Google Scholar] [CrossRef]
- Da Lio, C.; Tosi, L. Land subsidence in the Friuli Venezia Giulia coastal plain, Italy: 1992–2010 results from SAR-based interferometry. Sci. Total Environ. 2018, 633, 752–764. [Google Scholar] [CrossRef]
- Strozzi, T.; Klimeš, J.; Frey, H.; Caduff, R.; Huggel, C.; Wegmüller, U.; Rapre, A.C. Satellite SAR interferometry for the improved assessment of the state of activity of landslides: A case study from the Cordilleras of Peru. Remote Sens. Environ. 2018, 217, 111–125. [Google Scholar] [CrossRef] [Green Version]
- Bovenga, F.; Pasquariello, G.; Pellicani, R.; Refice, A.; Spilotro, G. Landslide monitoring for risk mitigation by using corner reflector and satellite SAR interferometry: The large landslide of Carlantino (Italy). Catena 2017, 151, 49–62. [Google Scholar] [CrossRef]
- Di Martire, D.; Tessitore, S.; Brancato, D.; Ciminelli, M.G.; Costabile, S.; Costantini, M.; Graziano, G.V.; Minati, F.; Ramondini, M.; Calcaterra, D. Landslide detection integrated system (LaDIS) based on in-situ and satellite SAR interferometry measurements. Catena 2016, 137, 406–421. [Google Scholar] [CrossRef]
- Dong, Y.; Li, Q.; Dou, A.; Wang, X. Extracting damages caused by the 2008 Ms 8.0 Wenchuan earthquake from SAR remote sensing data. J. Asian Earth Sci. 2011, 40, 907–914. [Google Scholar] [CrossRef]
- Lin-Lin, G.; Cheng, E.; Polonska, D.; Rizos, C.; Collins, C.; Smith, C. Earthquake monitoring in Australia using satellite radar interferometry. Wuhan Univ. J. Nat. Sci. 2003, 8, 649–658. [Google Scholar] [CrossRef]
- Pieraccini, M.; Mecatti, D.; Noferini, L.; Luzi, G.; Franchioni, G.; Atzeni, C. SAR interferometry for detecting the effects of earthquakes on buildings. NDT E Int. 2002, 35, 615–625. [Google Scholar] [CrossRef]
- Schaefer, L.N.; Di Traglia, F.; Chaussard, E.; Lu, Z.; Nolesini, T.; Casagli, N. Monitoring volcano slope instability with Synthetic Aperture Radar: A review and new data from Pacaya (Guatemala) and Stromboli (Italy) volcanoes. Earth-Sci. Rev. 2019, 192, 236–257. [Google Scholar] [CrossRef]
- Meyer, F.J.; McAlpin, D.B.; Gong, W.; Ajadi, O.; Arko, S.; Webley, P.W.; Dehn, J. Integrating SAR and derived products into operational volcano monitoring and decision support systems. ISPRS J. Photogramm. Remote Sens. 2015, 100, 106–117. [Google Scholar] [CrossRef]
- Pavez, A.; Remy, D.; Bonvalota, S.; Diament, M.; Gabalda, G.; Frogera, J.-L.; Julien, P.; Legrand, D.; Moisset, D. Insight into ground deformations at Lascar volcano (Chile) from SAR interferometry, photogrammetry and GPS data: Implications on volcano dynamics and future space monitoring. Remote Sens. Environ. 2006, 100, 307–320. [Google Scholar] [CrossRef] [Green Version]
- Pritchard, M.E.; Simons, M. A satellite geodetic survey of large scale deformation of volcanic centers in the central Andes. Nature 2002, 418, 167–171. [Google Scholar] [CrossRef]
- Hsieh, C.; Shih, T.; Hu, J.; Tung, H.; Huang, M.; Angelier, J. Using differential SAR interferometry to map land subsidence: A case study in the Pingtung Plain of SW Taiwan. Nat. Hazards 2011, 58, 1311–1332. [Google Scholar] [CrossRef]
- Bitelli, G.; Bonsignore, F.; Carbognin, L.; Ferretti, A.; Strozzi, T.; Teatini, P.; Tosi, L.; Vittuari, L. Radar interferometry-based mapping of the present land subsidence along the low-lying northern Adriatic coast of Italy. In Proceedings of the EISOLS, Queretaro, Mexico, 17–22 October 2010. IAHS Publ. 339. [Google Scholar]
- Raucoules, D.; Bourgine, B.; de Michele, M.; Le Cozannet, G.; Bremmer, C.; Veldkamp, J.G.; Tragheim, D.; Bateson, L.; Crosetto, M.; Agudo, M.; et al. Validation and intercomparison of Persistent Scatterers Interferometry: PSIC4 project results. J. Appl. Geophys. 2009, 68, 335–347. [Google Scholar] [CrossRef] [Green Version]
- Zhou, W.; Chen, F.; Guo, H. Differential Radar Interferometry for Structural and Ground Deformation Monitoring: A New Tool for the Conservation and Sustainability of Cultural Heritage Sites. Sustainability 2015, 7, 1712–1729. [Google Scholar] [CrossRef] [Green Version]
- Lasaponara, R.; Masini, N. Satellite remote sensing in archaeology: Past, present and future perspectives. J. Archaeol. Sci. 2011, 38, 1995–2002. [Google Scholar] [CrossRef]
- Tapete, D.; Cigna, F. InSAR data for geohazard assessment in UNESCO World Heritage sites: State-of-the-art and perspectives in the Copernicus era. Int. J. Appl. Earth Obs. Geoinf. 2017, 63, 24–32. [Google Scholar] [CrossRef]
- Stewart, C.; Lasaponara, R.; Schiavon, G. Multi-frequency, polarimetric SAR analysis for archaeological prospection. Int. J. Appl. Earth Obs. Geoinf. 2014, 28, 211–219. [Google Scholar] [CrossRef]
- Tapete, D.; Casagli, N.; Luzi, G.; Fanti, R.; Gigli, G.; Leva, D. Integrating radar and laser-based remote sensing techniques for monitoring structural deformation of archaeological monuments. J. Archaeol. Sci. 2013, 40, 176–189. [Google Scholar] [CrossRef] [Green Version]
- Tapete, D.; Fanti, R.; Cecchi, R.; Petrangeli, P.; Casagli, N. Satellite radar interferometry for monitoring and early-stage warning of structural instability in archaeological sites. J. Geophys. Eng. 2012, 9, S10–S25. [Google Scholar] [CrossRef]
- Cuca, B.; Tzouvaras, M.; Agapiou, A.; Lysandrou, V.; Themistocleous, K.; Nisantzi, A.; Hadjimitsis, D.G. Earth observation technologies in service to the cultural landscape of Cyprus: Risk identification and assessment. In Proceedings of the Fourth International Conference on Remote Sensing and Geoinformation of the Environment (RSCy2016), Paphos, Cyprus, 4–8 April 2016; Volume 9688, p. 96880. [Google Scholar] [CrossRef]
- Department of Antiquities—Homepage, Republic of Cyprus. Available online: http://www.mcw.gov.cy/mcw/da/da.nsf/DMLindex_en/DMLindex_en (accessed on 26 June 2019).
- Department of Antiquities—Archaeological Sites. Available online: http://www.mcw.gov.cy/mcw/DA/DA.nsf/All/59FFC9310818070EC225719B003A2EB8?OpenDocument (accessed on 17 July 2019).
- Department of Antiquities—Archaeological Sites. Available online: http://www.mcw.gov.cy/mcw/DA/DA.nsf/All/238DE8D409BF6077C225719B0039F785?OpenDocument (accessed on 17 July 2019).
- Geological Survey Department. Available online: http://www.moa.gov.cy/moa/gsd/gsd.nsf/dmlindex_gr/dmlindex_gr?OpenDocument (accessed on 25 June 2019).
- SNAP. Available online: https://step.esa.int/main/toolboxes/snap/ (accessed on 17 July 2019).
- SNAPHU. Available online: https://web.stanford.edu/group/radar/softwareandlinks/sw/snaphu/ (accessed on 17 July 2019).
- Copernicus Open Access Hub. Available online: https://scihub.copernicus.eu/ (accessed on 28 June 2019).
- Ferretti, A.; Monti-Guarnieri, A.; Prati, C.; Rocca, F.; Massonnet, D. InSAR Principles: Guidelines for SAR Interferometry Processing and Interpretation; ESA Publications TM-19; ESA Publications: Noordwijk, The Netherlands, 2007. [Google Scholar]
- Le Mouélic, S.; Raucoules, D.; Carnec, C.; King, C. A least squares adjustment of multi-temporal InSAR data: Application to the ground deformation of Paris. Photogramm. Eng. Remote Sens. 2005, 71, 197–204. [Google Scholar] [CrossRef]
- Kovács, I.P.; Bugya, T.; Czigány, S.; Defilippi, M.; Lóczy, D.; Riccardi, P.; Ronczyk, L.; Pasquali, P. How to avoid false interpretations of Sentinel-1A TOPSAR interferometric data in landslide mapping? A case study: Recent landslides in Transdanubia, Hungary. Nat. Hazards 2019, 96, 693–712. [Google Scholar] [CrossRef]
- Höser, T. Analysing the Capabilities and Limitations of InSAR using Sentinel-1 Data for Landslide Detection and Monitoring. Master’s Thesis, University of Bonn, Bonn, Germany, 2018. [Google Scholar] [CrossRef]
- Veci, L. Sentinel-1 Toolbox—TOPS Interferometry Tutorial; ESA Publications: Auckland, New Zealand, 2015. [Google Scholar]
- Martinez, N.Y.; Israola, P.P.; Gonzalez, F.R.; Brcic, R.; Shau, R.; Geudtner, D.; Eineder, M.; Bamler, R. Interferometric Processing of Sentinel-1 TOPS Data. IEEE Trans. Geosci. Remote Sens. 2016, 54, 2220–2234. [Google Scholar] [CrossRef] [Green Version]
- Li, Z.; Bethel, J. Image coregistration in SAR interferometry. Int. Arch. Photogramm. Remote Sens. Spat. Inf. Sci. 2008, 37, 433–438. [Google Scholar]
- Danezis, C.; Chatzinikos, M.; Kotsakis, C. Linear and nonlinear deformation effects in the permanent GNSS network of Cyprus. In Proceedings of the 4th Joint International Symposium on Deformation Monitoring (JISDM), Athens, Greece, 15–17 May 2019. [Google Scholar]
© 2019 by the authors. Licensee MDPI, Basel, Switzerland. This article is an open access article distributed under the terms and conditions of the Creative Commons Attribution (CC BY) license (http://creativecommons.org/licenses/by/4.0/).

 ,
, 


