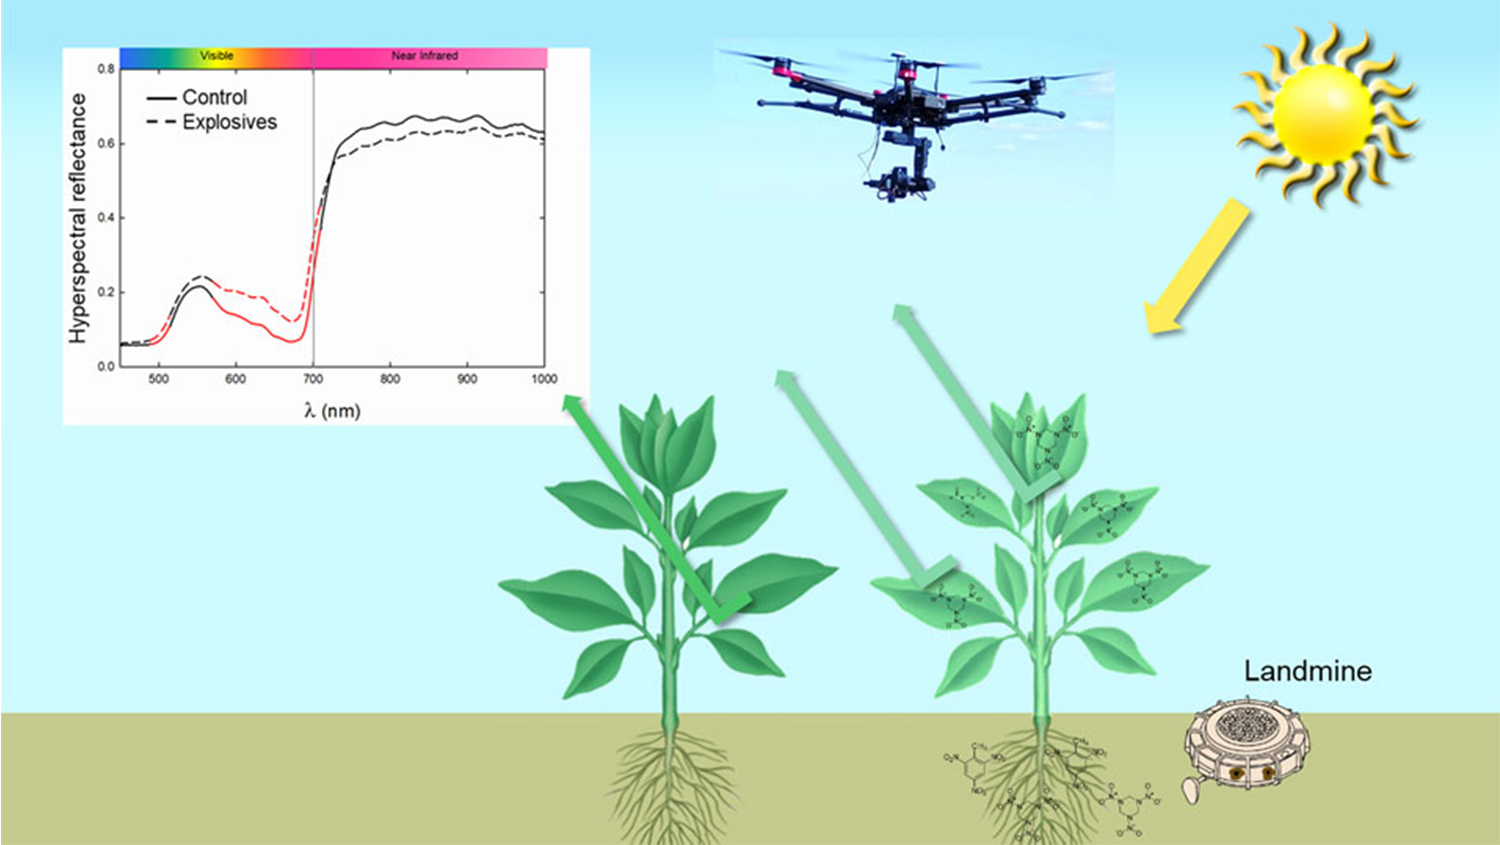
Remote Sensing of Explosives-Induced Stress in Plants: Hyperspectral Imaging Analysis for Remote Detection of Unexploded Threats


Abstract
:
1. Introduction
2. Materials and Methods
2.1. Plants
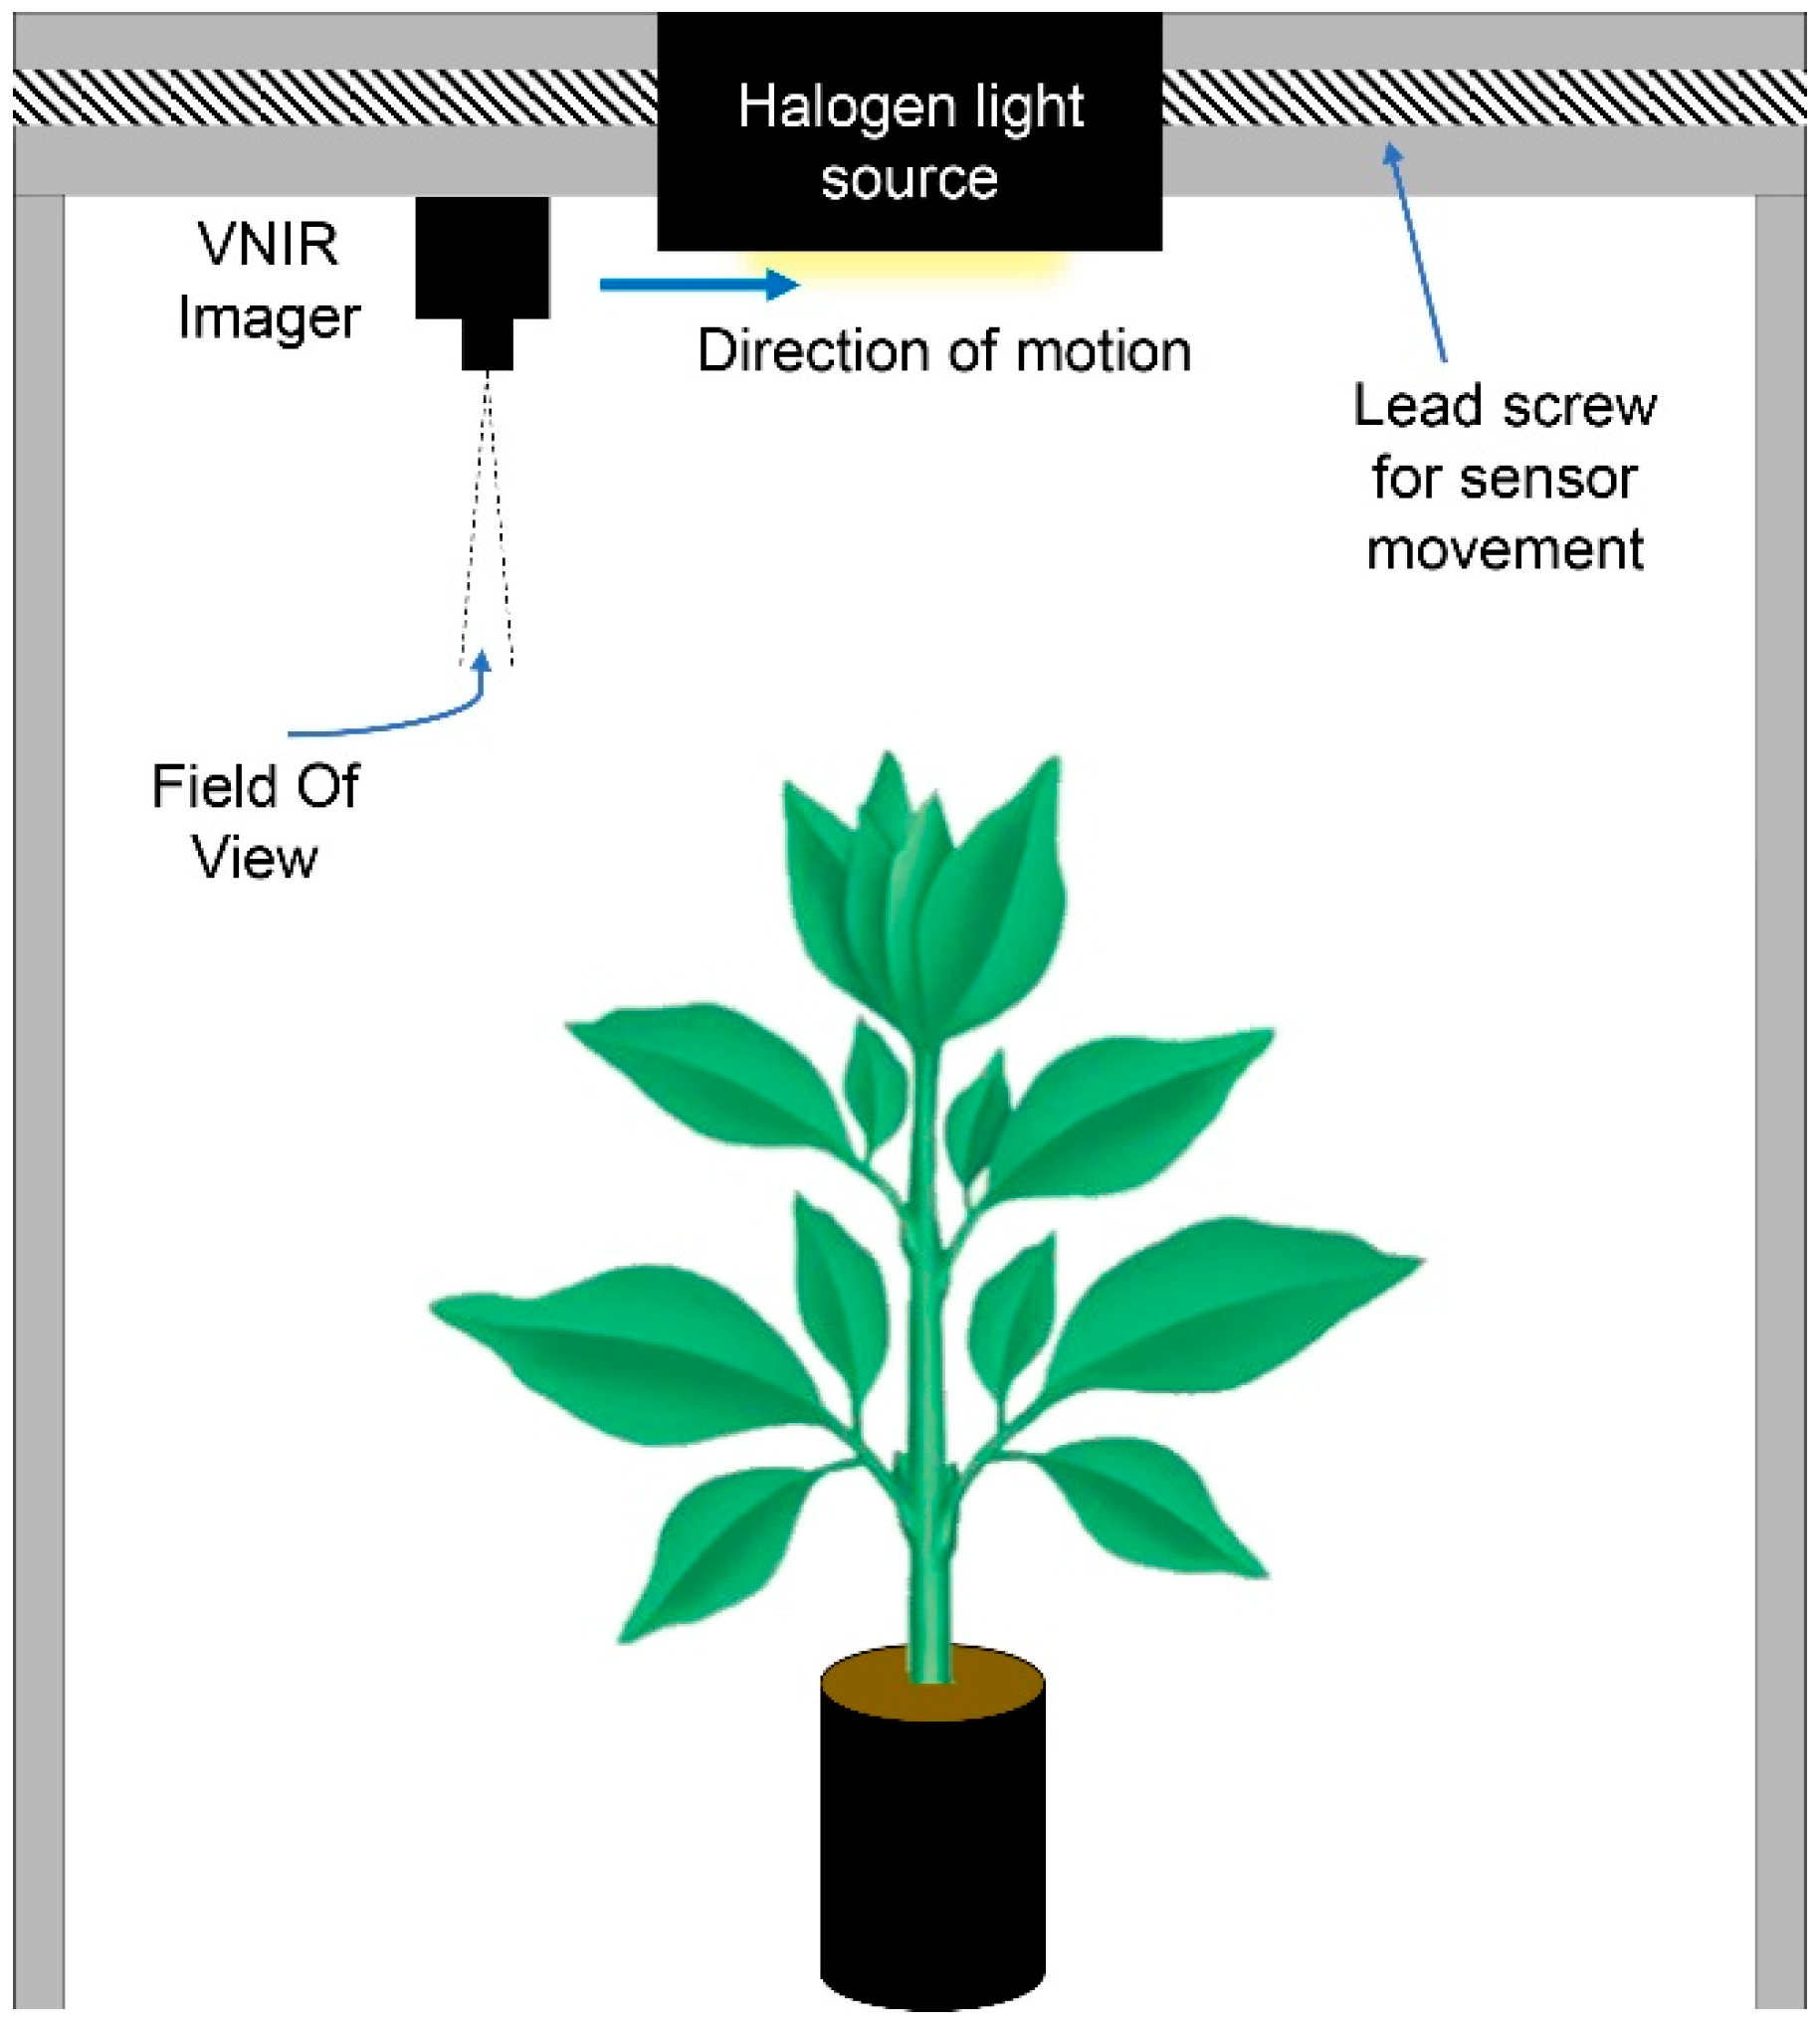
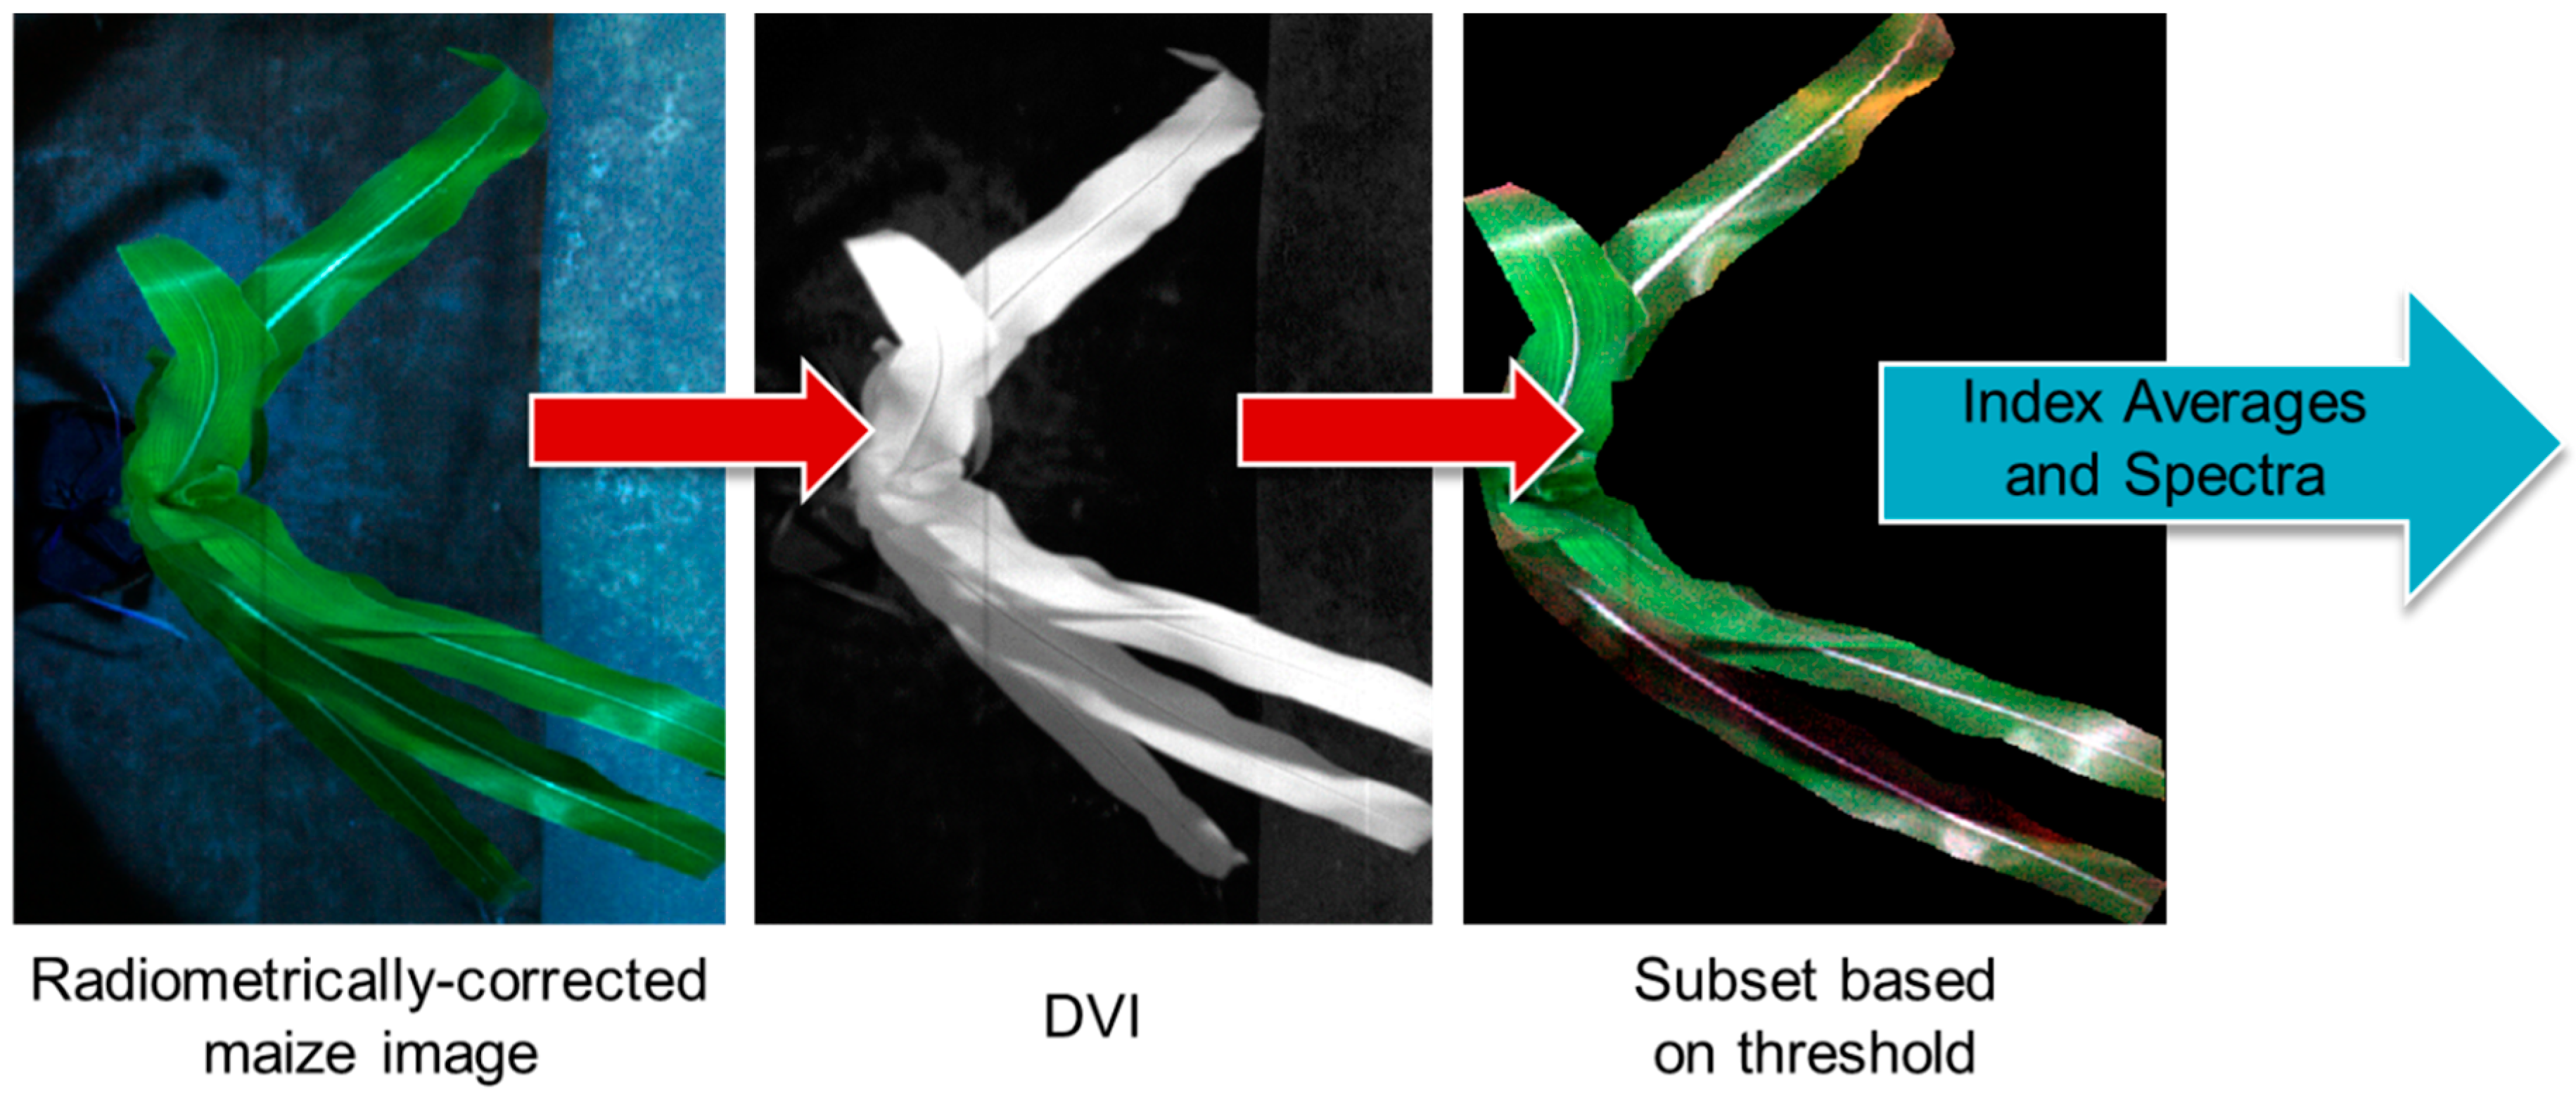
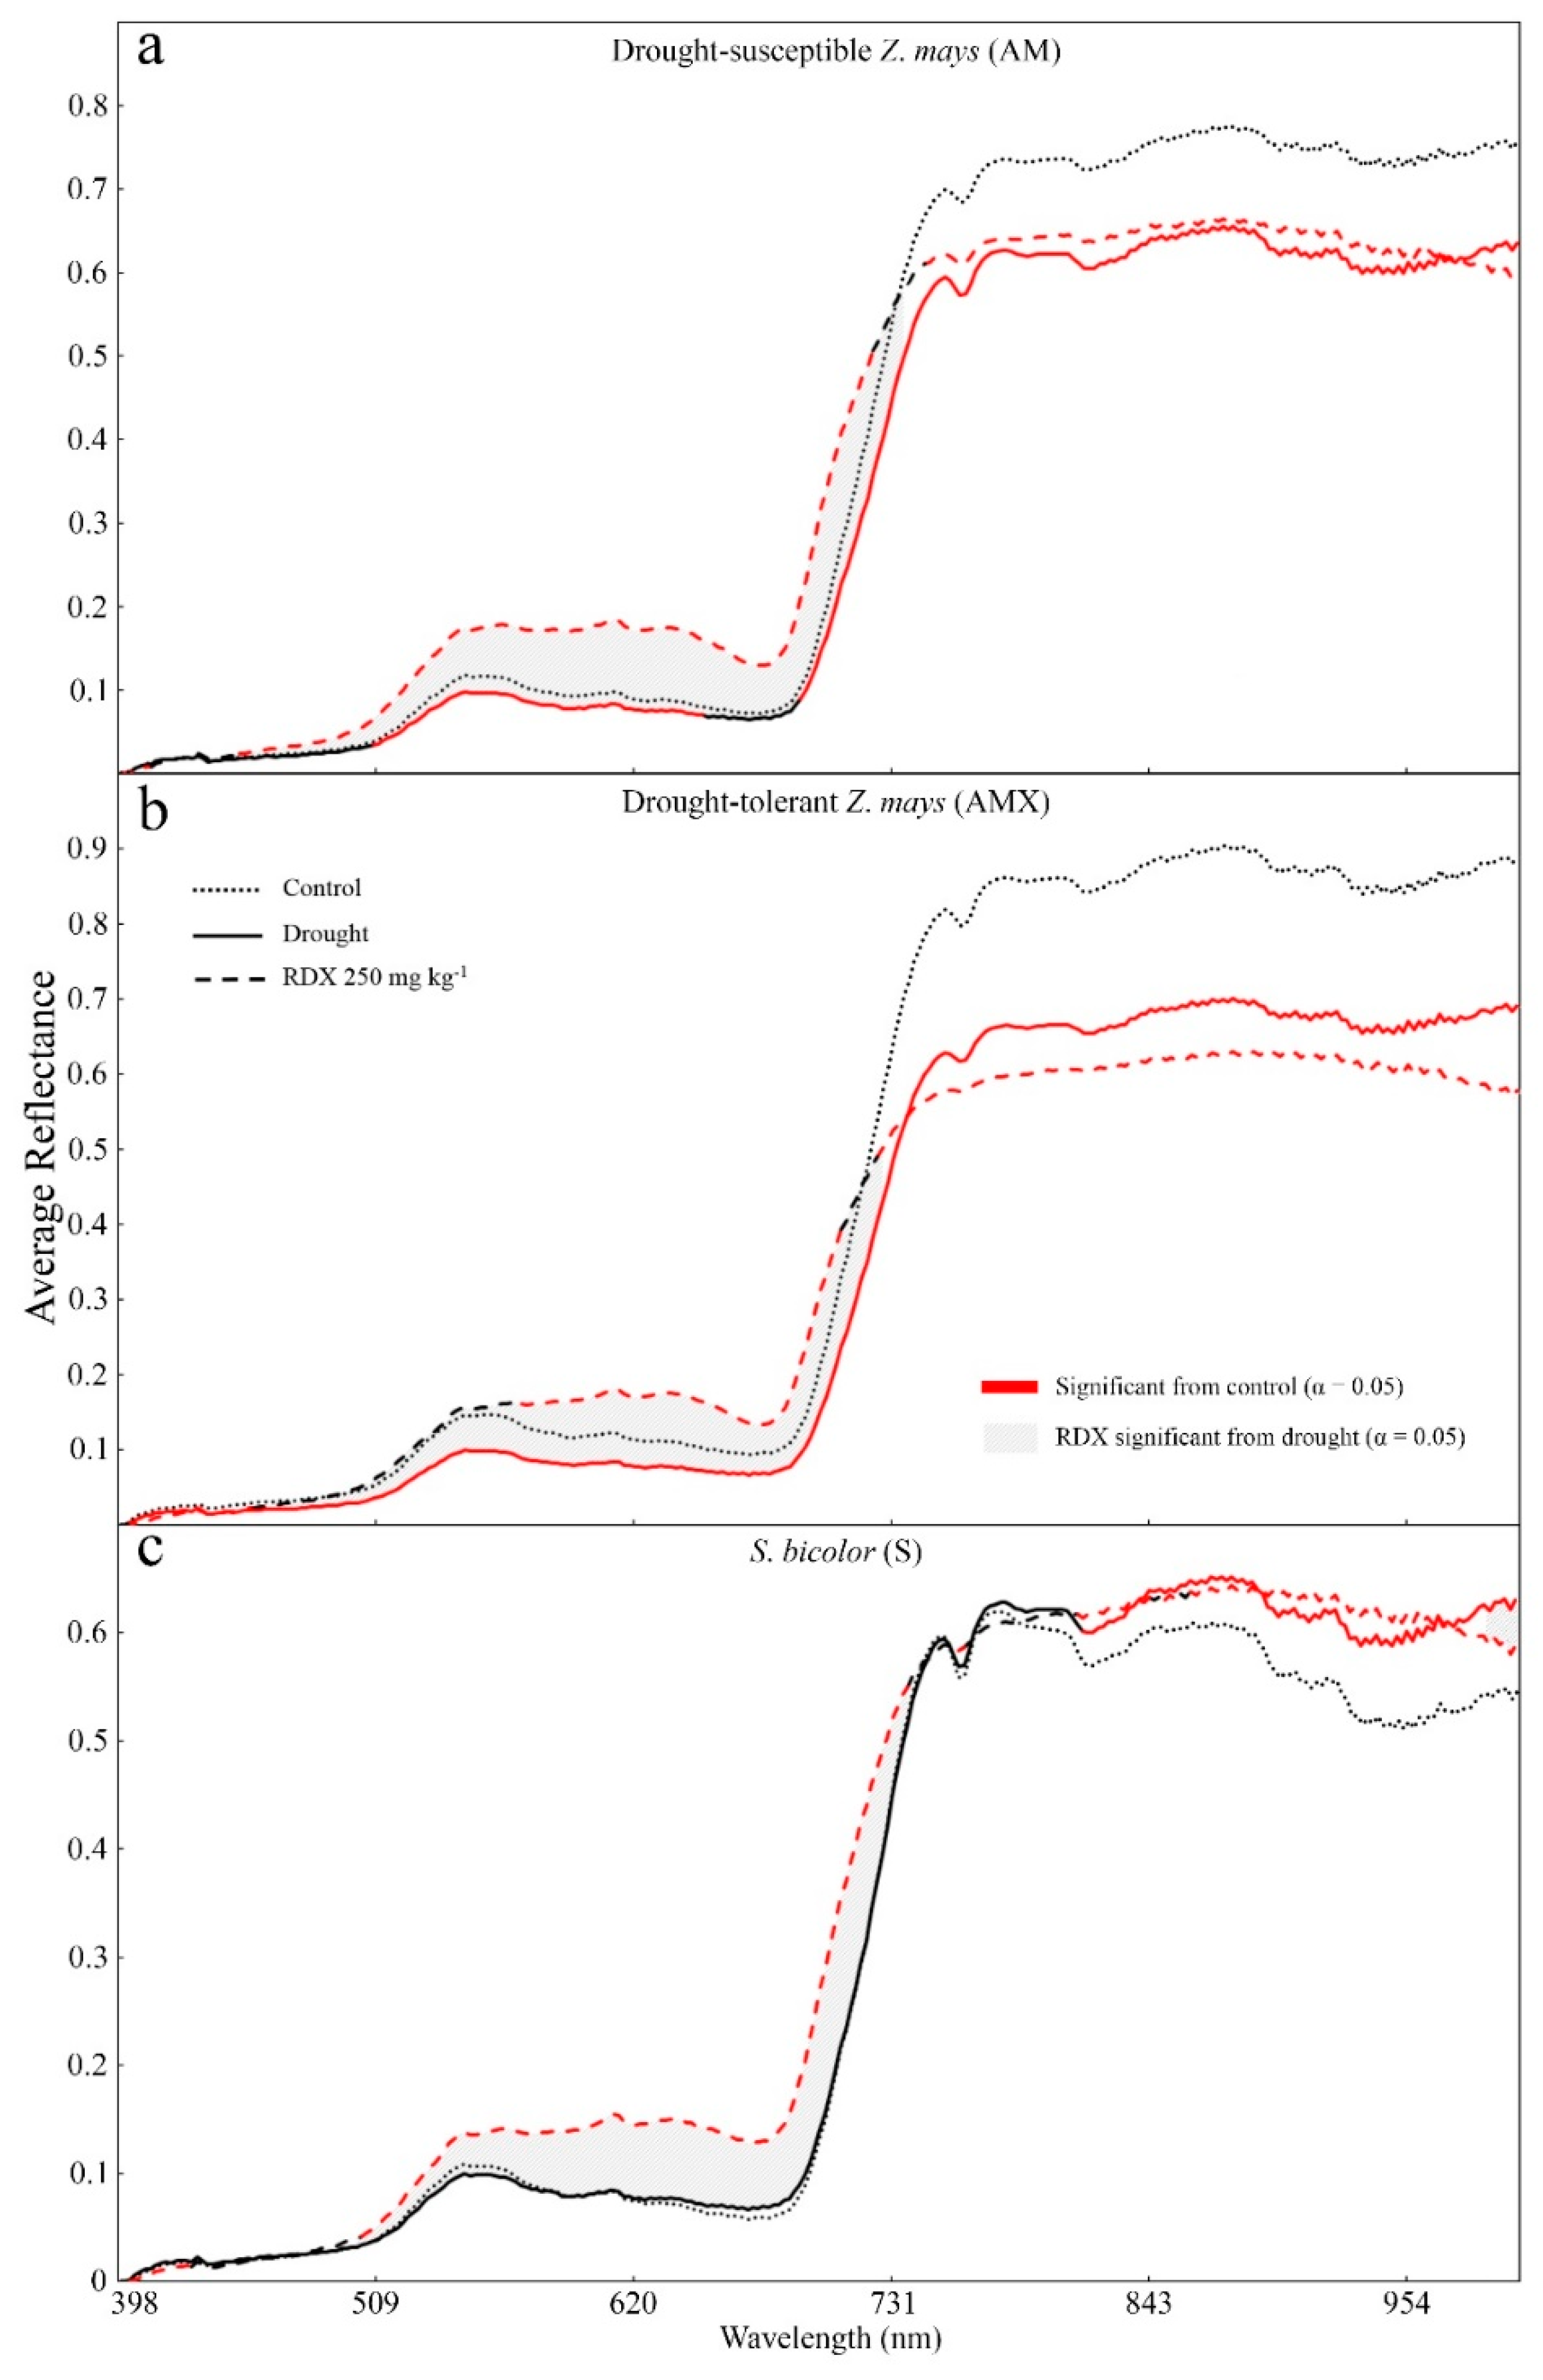
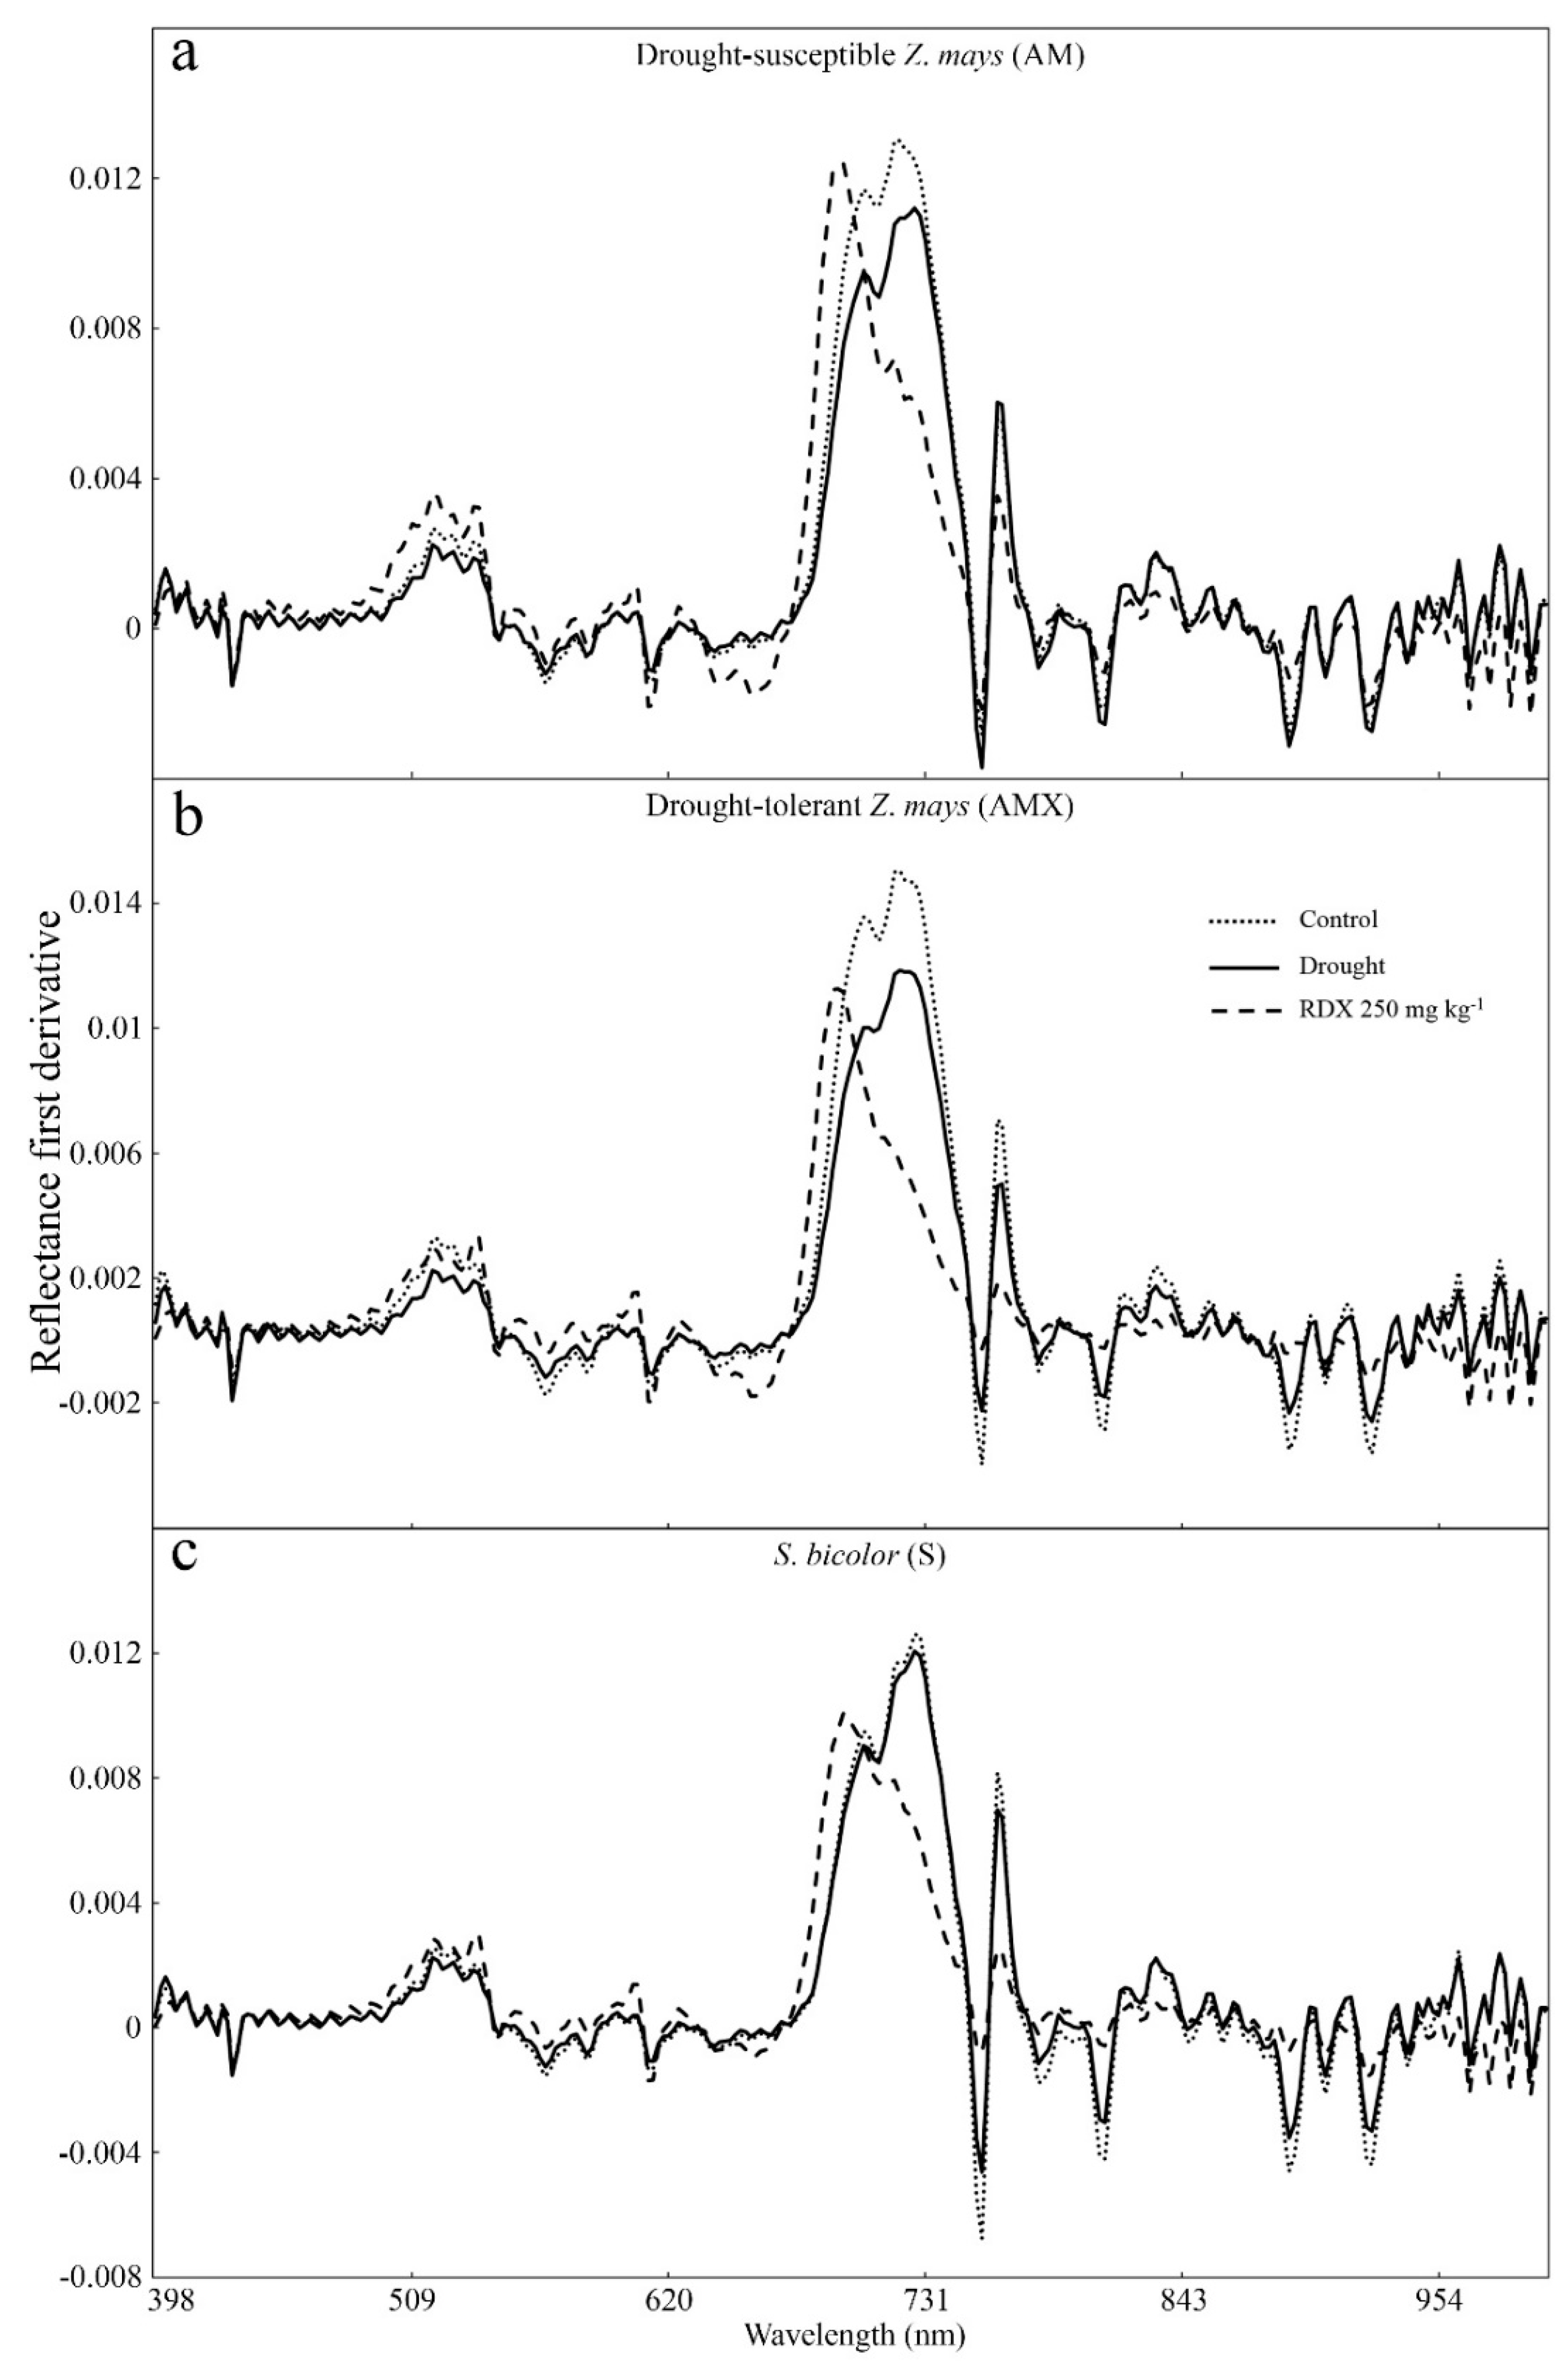
2.2. Hyperspectral Imaging
2.3. Statistics
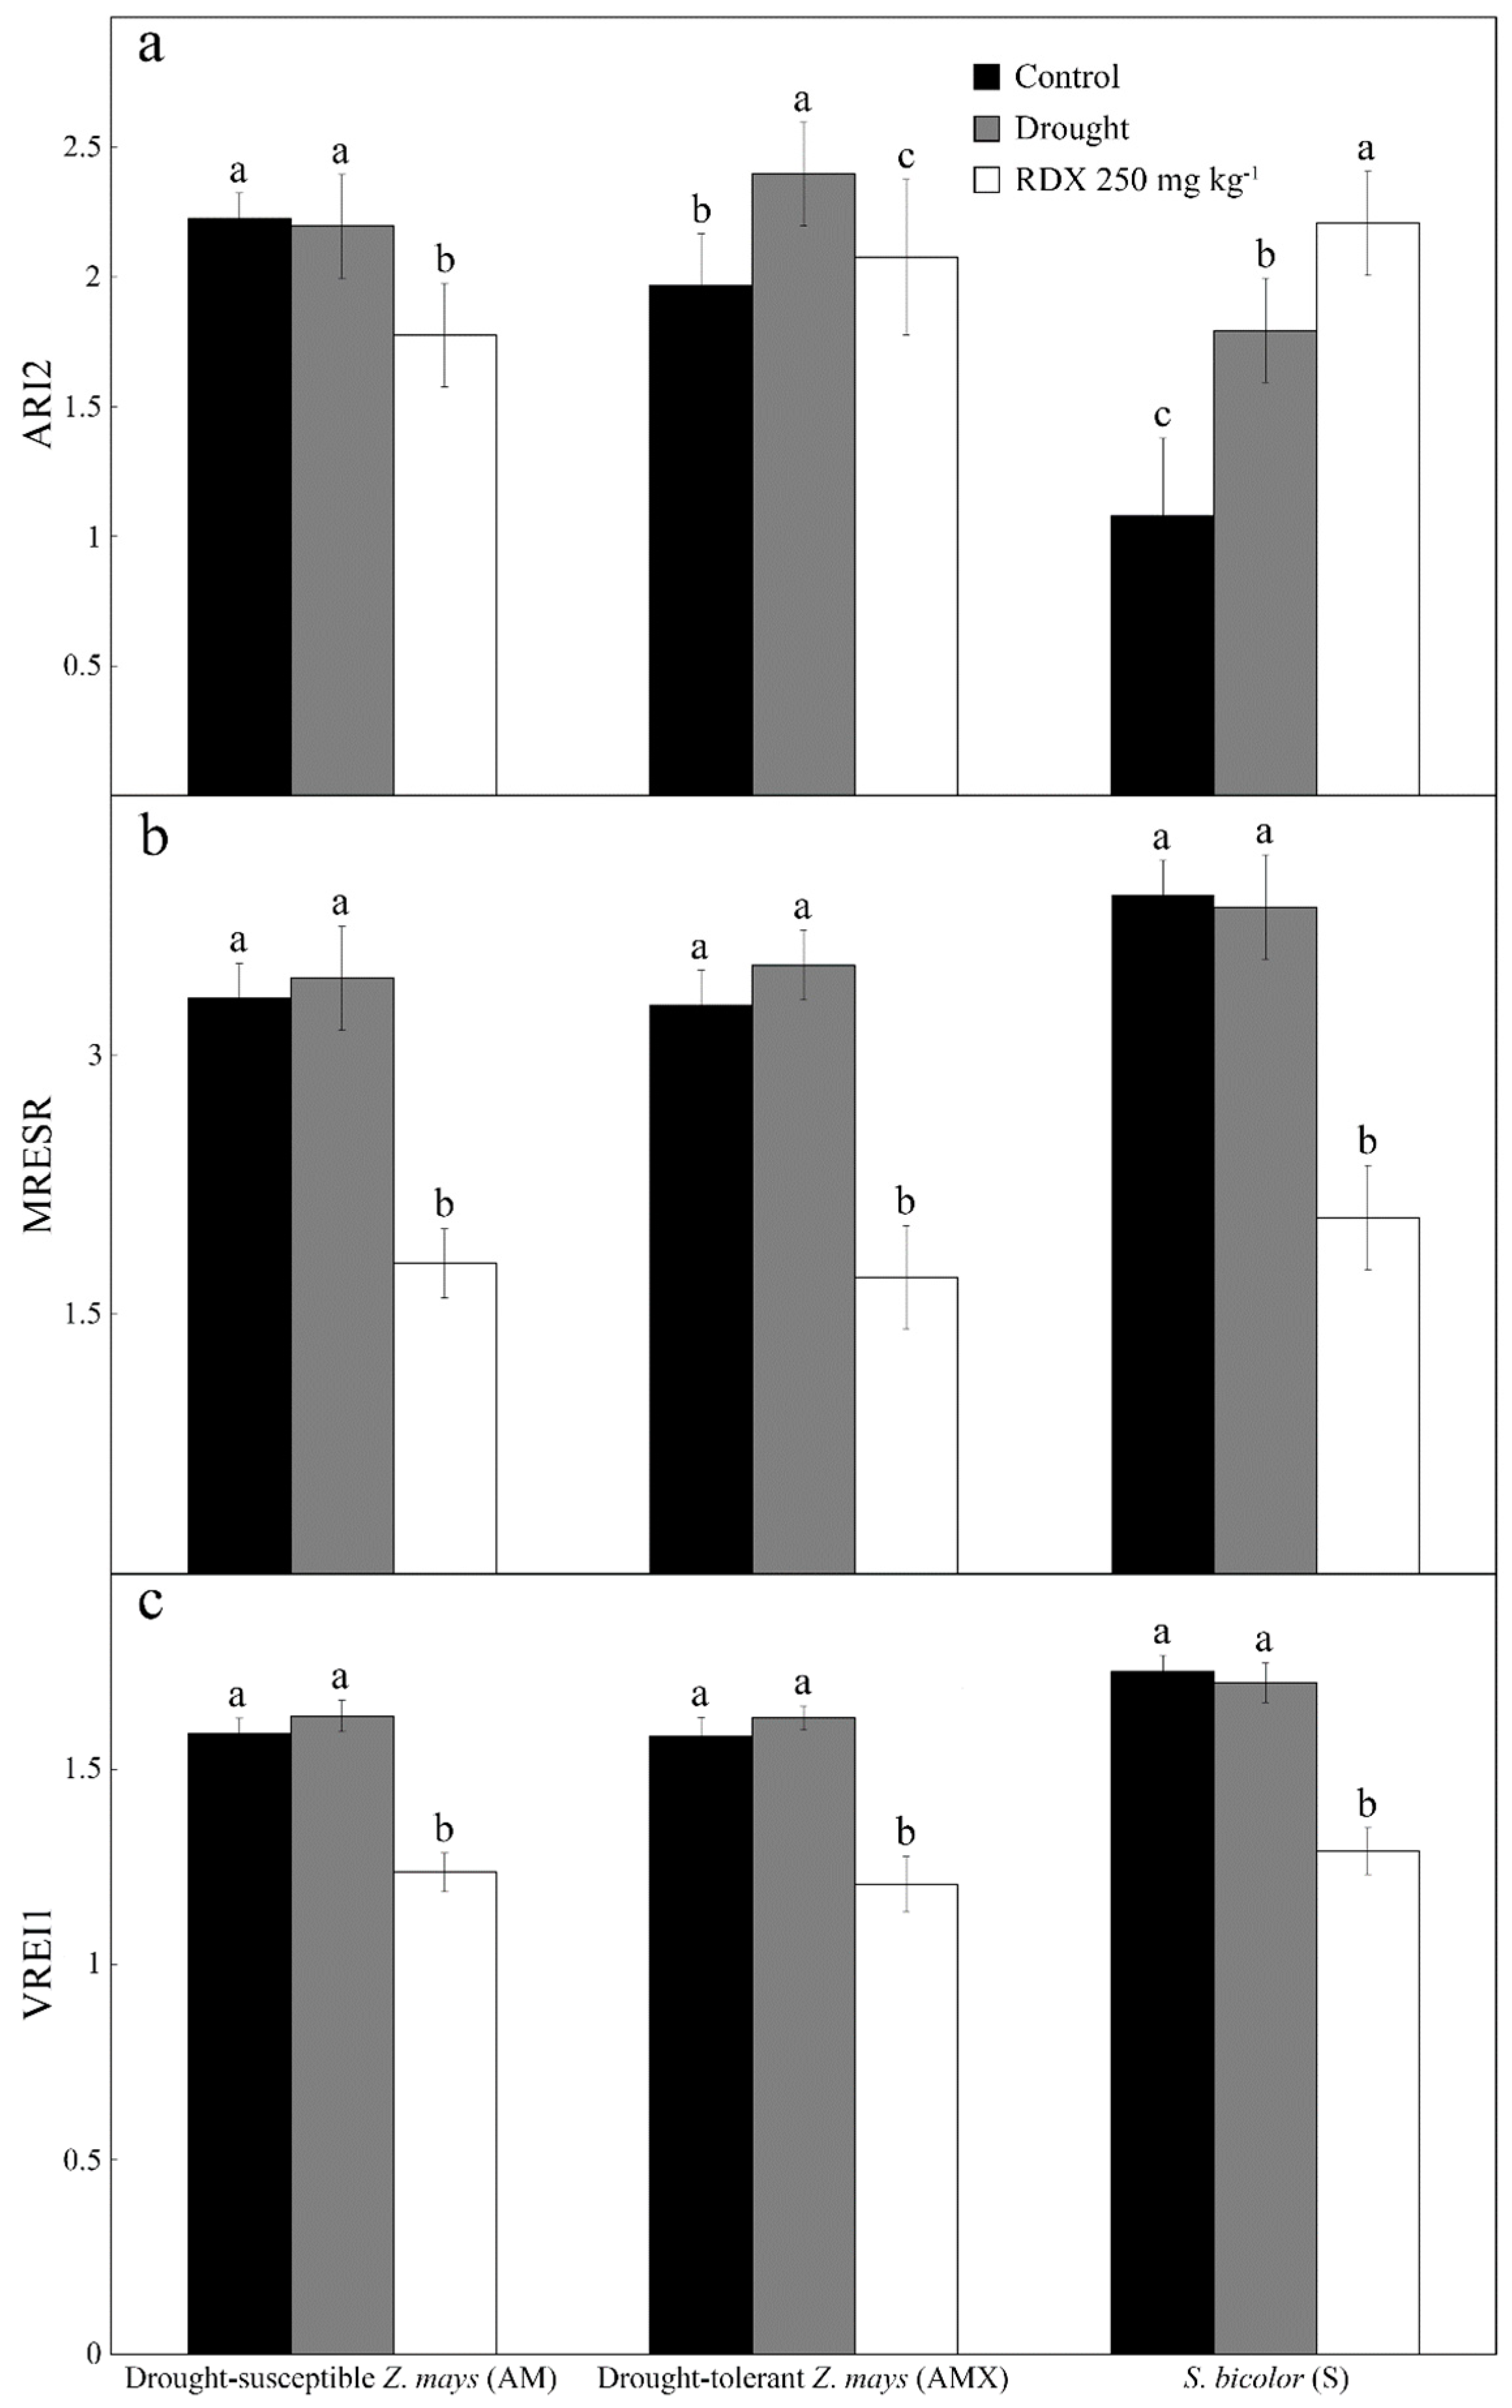
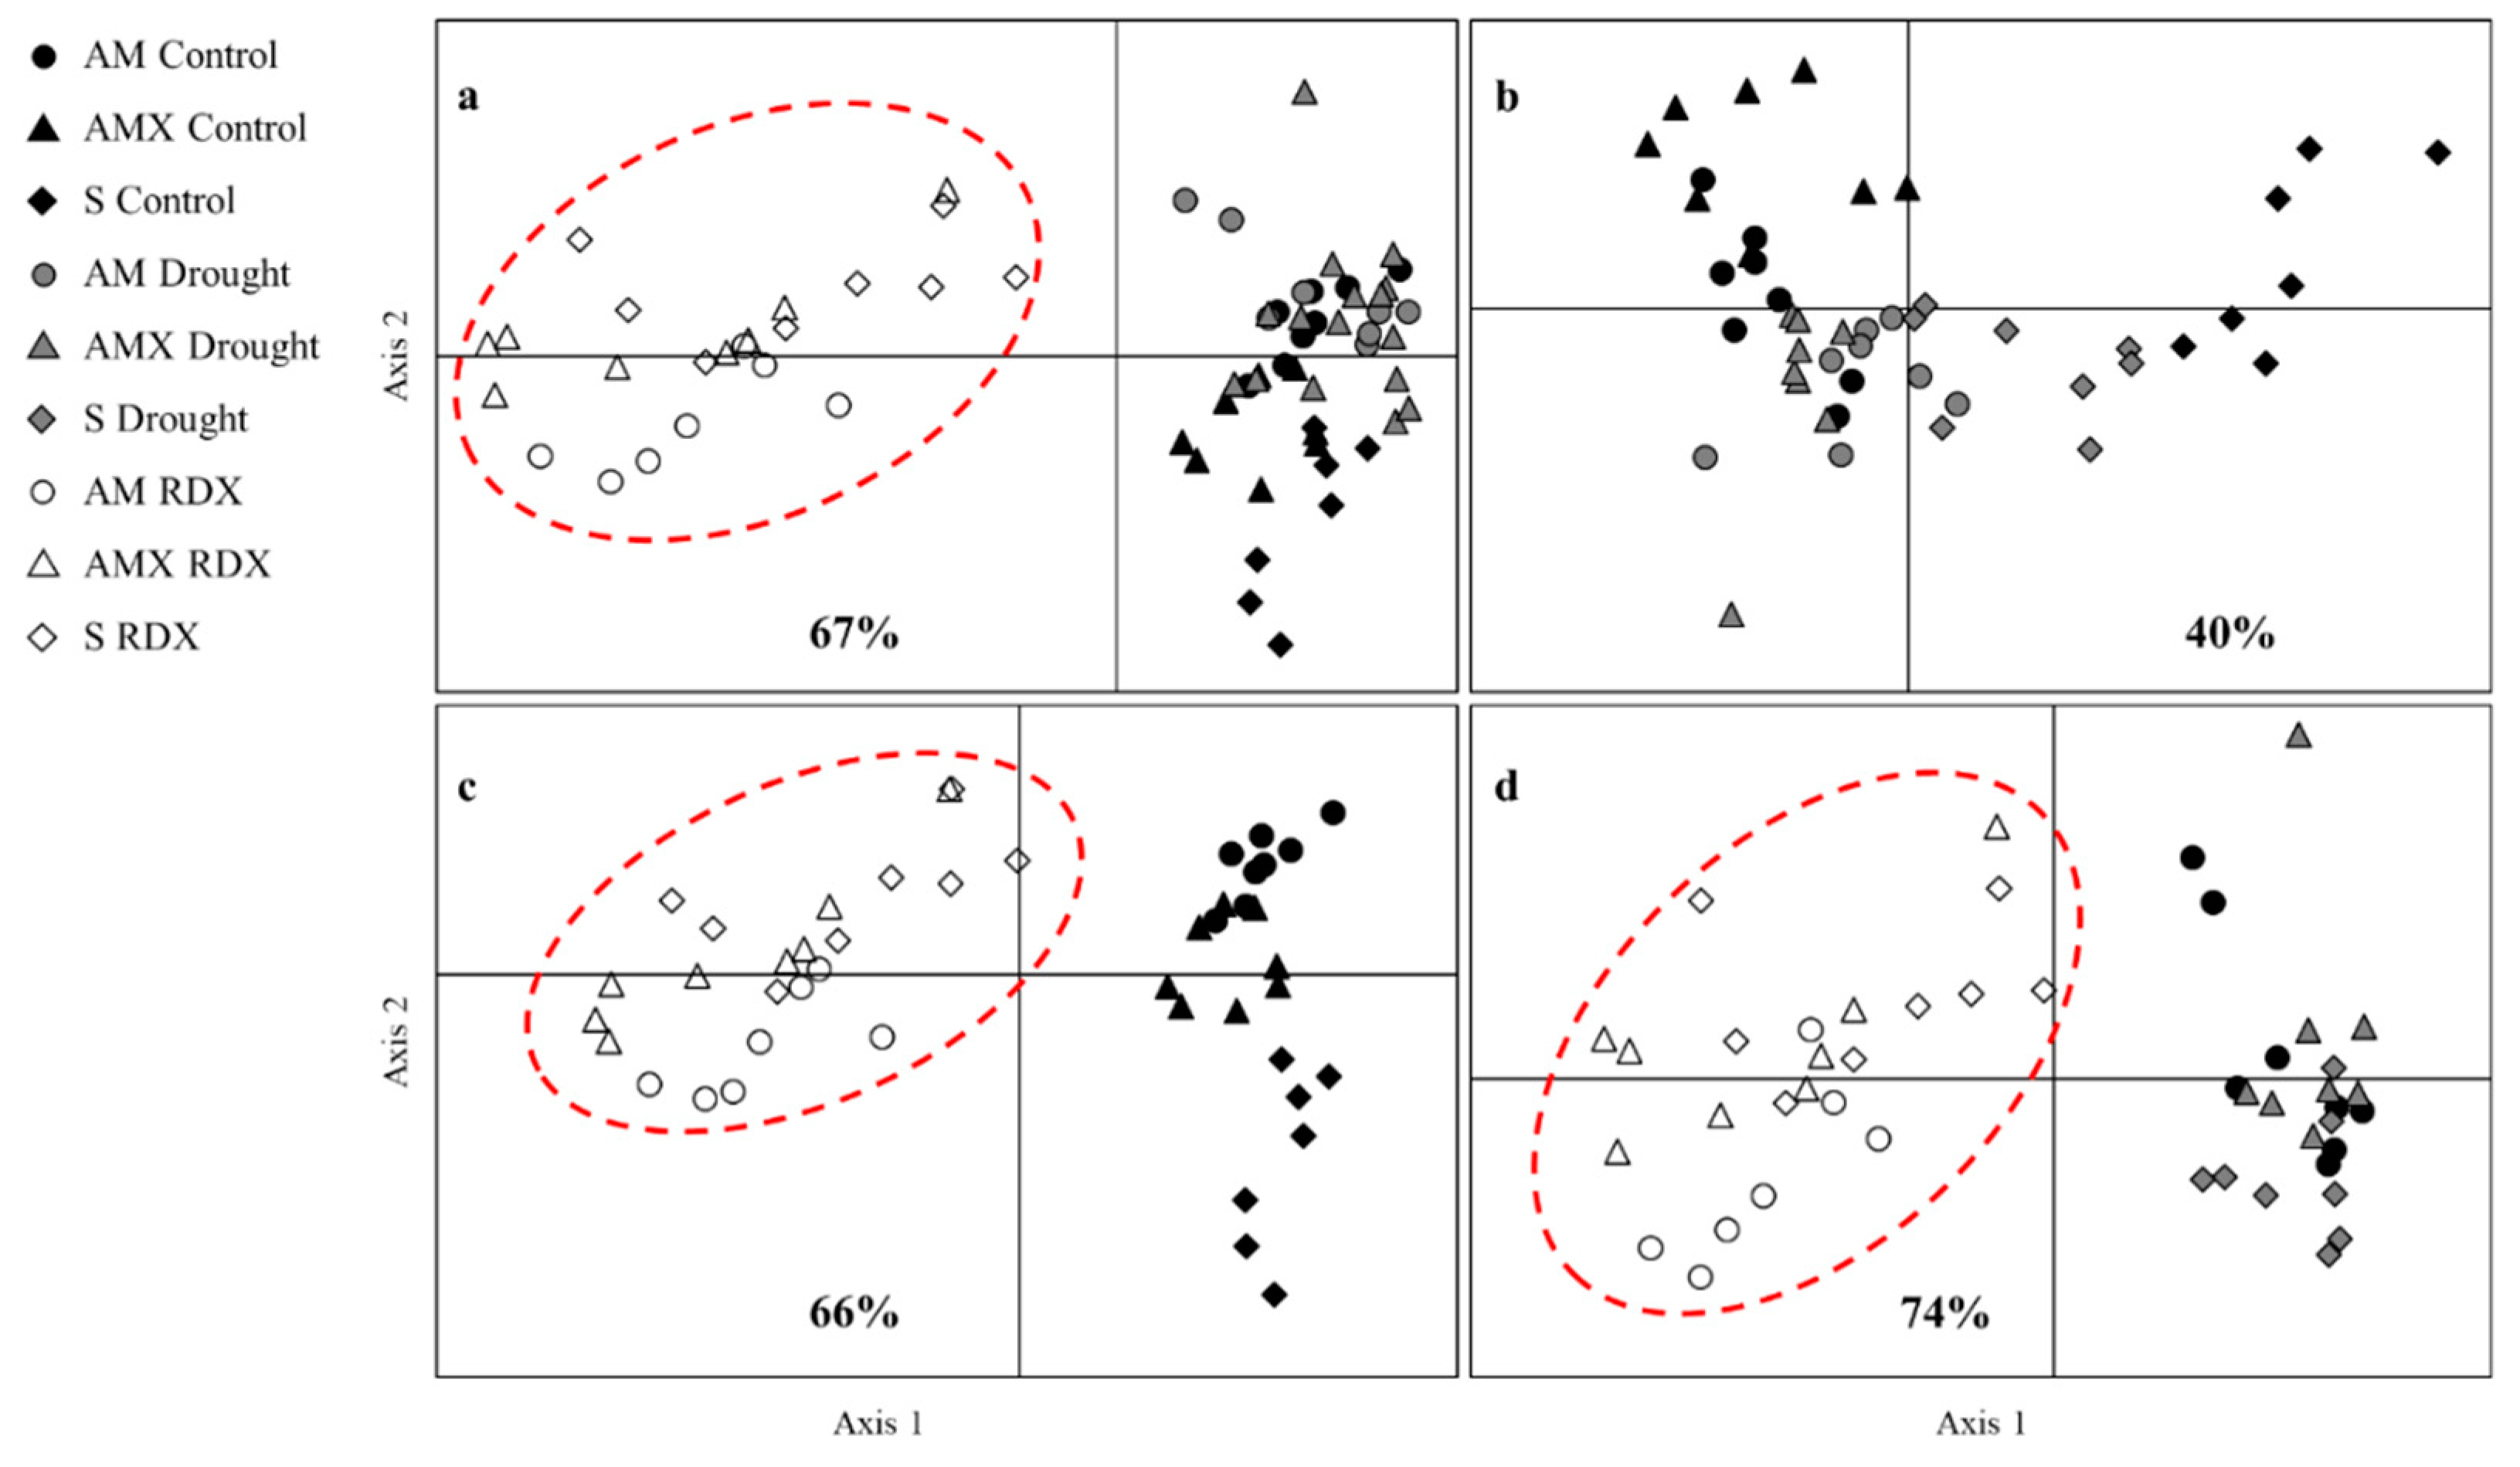
3. Results
4. Discussion
5. Conclusions
Author Contributions
Funding
Acknowledgments
Conflicts of Interest
References
- U.S. Environmental Protection Agency. Available online: https://cfpub.epa.gov/ncea/iris/iris_documents/documents/toxreviews/0313tr.pdf (accessed on 23 March 2019).
- Walsh, N.E.; Walsh, W.S. Rehabilitation of landmine victims—The ultimate challenge. Bull. World Health Organ. 2003, 81, 665–670. [Google Scholar] [PubMed]
- Strada, G. The horror of land mines. Sci. Am. 1996, 274, 40–45. [Google Scholar] [CrossRef]
- Rylott, E.L.; Bruce, N.C. Plants disarm soil: Engineering plants for the phytoremediation of explosives. Trends Biotechnol. 2009, 27, 73–81. [Google Scholar] [CrossRef] [PubMed]
- Rylott, E.L.; Budarina, M.V.; Barker, A.; Lorenz, A.; Strand, S.E.; Bruce, N.C. Engineering plants for the phytoremediation of RDX in the presence of the co-contaminating explosive TNT. New Phytol. 2011, 192, 405–413. [Google Scholar] [CrossRef] [PubMed]
- U.S. Environmental Protection Agency. Available online: https://www.epa.gov/sites/production/files/documents/ifuxoctthandbook.pdf (accessed on 7 February 2019).
- MacDonald, J.A.; Small, M.J.; Granger Morgan, M. Quantifying the risks of unexploded ordnance at closed military bases. Environ. Sci. Technol. 2009, 43, 259–265. [Google Scholar] [CrossRef] [PubMed]
- Taylor, S.; Bigl, S.; Packer, B. Condition of in situ unexploded ordnance. Sci. Total Environ. 2015, 505, 762–769. [Google Scholar] [CrossRef] [PubMed]
- Limmer, M.; Burken, J. Phytovolatilization of organic contaminants. Environ. Sci. Technol. 2016, 50, 6632–6643. [Google Scholar] [CrossRef] [PubMed]
- Burken, J.G.; Vroblesky, D.A.; Balouet, J.C. Phytoforensics, dendrochemistry, and phytoscreening: New green tools for delineating contaminants from past and present. Environ. Sci. Technol. 2011, 45, 6218–6226. [Google Scholar] [CrossRef] [PubMed]
- Ghosh, M.; Singh, S.P. A review on phytoremediation of heavy metals and utilization of it’s by products. Asian J. Energy Environ. 2005, 6, 214–231. [Google Scholar]
- Singh, S.N.; Mishra, S. Phytoremediation of TNT and RDX. In Biological Remediation of Explosive Residues; Springer: Cham, Switzerland; New York, NY, USA, 2014; pp. 371–392. [Google Scholar] [CrossRef]
- Vila, M.; Lorber-Pascal, S.; Laurent, F. Fate of RDX and TNT in agronomic plants. Environ. Pollut. 2007, 148, 148–154. [Google Scholar] [CrossRef] [PubMed]
- Zinnert, J.C. Plants as phytosensors: Physiological responses of a woody plant in response to RDX exposure and potential for remote detection. Int. J. Plant Sci. 2012, 173, 1005–1014. [Google Scholar] [CrossRef]
- Barton, C.V.M. Advances in remote sensing of plant stress. Plant Soil 2012, 354, 41–44. [Google Scholar] [CrossRef]
- Zinnert, J.C.; Via, S.M.; Young, D.R. Distinguishing natural from anthropogenic stress in plants: Physiology, fluorescence and hyperspectral reflectance. Plant Soil 2013, 366, 133–141. [Google Scholar] [CrossRef]
- Chen, D.; Liu, Z.L.; Banwart, W. Concentration-dependent RDX uptake and remediation by crop plants. Environ. Sci. Pollut. Res. 2011, 18, 908–917. [Google Scholar] [CrossRef] [PubMed]
- Naumann, J.C.; Anderson, J.E.; Young, D.R. Remote detection of plant physiological responses to TNT soil contamination. Plant Soil 2010, 329, 239–248. [Google Scholar] [CrossRef]
- Horler, D.N.H.; Barber, J.; Darch, J.P.; Ferns, D.C.; Barringer, A.R. Approaches to detention of geochemical stress in vegetation. Adv. Space Res. 1983, 3, 175–179. [Google Scholar] [CrossRef]
- Naumann, J.C.; Anderson, J.E.; Young, D.R. Linking physiological responses, chlorophyll fluorescence and hyperspectral imagery to detect salinity stress using the physiological reflectance index in the coastal shrub, Myrica cerifera. Remote Sens. Environ. 2008, 112, 3865–3875. [Google Scholar] [CrossRef]
- Sripada, R.P.; Heiniger, R.W.; White, J.G.; Meijer, A.D. Aerial color infrared photography for determining early in-season nitrogen requirements in corn. Agron. J. 2006, 98, 968–977. [Google Scholar] [CrossRef]
- Boegh, E.; Soegaard, H.; Broge, N.; Hasager, C.; Jensen, N.; Schelde, K.; Thomsen, A. Airborne multi-spectral data for quantifying leaf area index, nitrogen concentration and photosynthetic efficiency in agriculture. Remote Sens. Environ. 2002, 81, 179–193. [Google Scholar] [CrossRef]
- Rouse, J.; Haas, R.; Schell, J.; Deering, D. Monitoring vegetation systems in the Great Plains with ERTS. In Proceedings of the Third ERTS Symposium, NASA, Washington, DC, USA, 10–14 December 1973; pp. 309–317. [Google Scholar]
- Sims, D.A.; Gamon, J.A. Relationships between leaf pigment content and spectral reflectance across a wide range of species, leaf structures and developmental stages. Remote Sens. Environ. 2002, 81, 337–354. [Google Scholar] [CrossRef]
- Gamon, J.A.; Peñuelas, J.; Field, C.B. A narrow-waveband spectral index that tracks diurnal changes in photosynthetic efficiency. Remote Sens. Environ. 1992, 41, 35–44. [Google Scholar] [CrossRef]
- Gitelson, A.; Merzlyak, M.N.; Chivkunova, O.B. Optical properties and nondestructive estimation of anthocyanin content in plant leaves. Photochem. Photobiol. 2001, 71, 38–45. [Google Scholar] [CrossRef]
- Gitelson, A.A.; Zur, Y.; Chivkunova, O.B.; Merzlyak, M.N. Assessing carotenoid content in plant leaves with reflectance spectroscopy. Photochem. Photobiol. 2002, 75, 272–281. [Google Scholar] [CrossRef]
- Gitelson, A.A.; Merzlyak, M.N. Remote estimation of chlorophyll content in higher plant leaves. Int. J. Remote Sens. 1997, 18, 2691–2697. [Google Scholar] [CrossRef]
- Daughtry, C.S.T.; Walthall, C.L.; Kim, M.S.; Brown de Colstoun, E.; McMurtry, J.E., III. Estimating corn leaf chlorophyll concentration from leaf and canopy reflectance. Remote Sens. Environ. 2000, 74, 229–239. [Google Scholar] [CrossRef]
- Peñuelas, J.; Baret, F.; Filella, I. Semi-empirical indices to assess carotenoids/chlorophyll-a ratio from leaf spectral reflectance. Photosynthetica 1995, 31, 221–230. [Google Scholar]
- Vogelmann, J.E.; Rock, B.N.; Moss, D.M. Red edge spectral measurements from sugar maple leaves. Int. J. Remote Sens. 1993, 14, 1887–1905. [Google Scholar] [CrossRef]
- Merzlyak, M.N.; Gitelson, A.A.; Chivkunova, O.B.; Rakitin, V.Y. Non-destructive optical detection of pigment changes during leaf senescence and fruit ripening. Physiol. Plant. 1999, 106, 135–141. [Google Scholar] [CrossRef] [Green Version]
- Curran, P.; Windham, W.; Gholz, H. Exploring the relationship between reflectance red edge and chlorophyll concentration in slash pine leaves. Tree Physiol. 1995, 15, 203–206. [Google Scholar] [CrossRef]
- Peñuelas, J.; Filella, I.; Biel, C.; Serrano, L.; Savé, R. The reflectance at the 950-970 nm region as an indicator of plant water status. Int. J. Remote Sens. 1993, 14, 1887–1905. [Google Scholar] [CrossRef]
- Via, S.M.; Zinnert, J.C.; Young, D.R. Differential effects of two explosive compounds on seed germination and seedling morphology of a woody shrub, Morella cerifera. Ecotoxicology 2015, 24, 194–201. [Google Scholar] [CrossRef]
- Hallik, L.; Kazantsev, T.; Kuusk, A.; Galmes, J.; Tomas, M.; Niinemets, U. Generality of relationships between leaf pigment contents and spectral vegetation indices in Mallorca (Spain). Reg. Environ. Chang. 2017, 17, 2097–2109. [Google Scholar] [CrossRef]
- Gates, D.M.; Keegan, H.J.; Schleter, J.C.; Weidner, V.R. Spectral properties of plants. Appl. Opt. 1965, 4, 11–20. [Google Scholar] [CrossRef]
- Zagajewski, B.; Tommervik, H.; Bjerke, J.W.; Raczko, E.; Bochenek, Z.; Klos, A.; Jarocinska, A.; Lavender, S.; Ziolgkowski, D. Intraspecific differences in spectral reflectance curves as indicators of reduced vitality in high-arctic plants. Remote Sens. 2017, 9, 1289. [Google Scholar] [CrossRef]
- Chappelle, E.W.; Kim, M.S.; McMurtrey, J.E. The red edge shift: An explanation of its relationship to stress and the concentration of chlorophyll a. In Proceedings of the IGARSS’91 Remote Sensing: Global Monitoring for Earth Management, Espoo, Finland, 3–6 June 1991. [Google Scholar] [CrossRef]
- Sanches, I.D.; Souza Filho, C.R.; Magalhaes, L.A.; Quiterio, G.C.M.; Alves, M.N.; Oliveira, W.J. Assessing the impact of hydrocarbon leakages on vegetation using reflectance spectroscopy. ISPRS J. Photogramm. Remote Sens. 2013, 78, 85–101. [Google Scholar] [CrossRef]
- Colwell, J.E. Vegetation canopy reflectance. Remote Sens. Environ. 1974, 3, 175–183. [Google Scholar] [CrossRef]
- Curran, P.J. Remote sensing of foliar chemistry. Remote Sens. Environ. 1989, 30, 271–278. [Google Scholar] [CrossRef]
- Best, E.P.H.; Smith, T.; Hagen, F.L. Candidate Herbaceous Plants for Phytoremediation of Energetics on Ranges; Technical Report ERDC TR-07-11; U.S. Army Engineer Research and Development Center: Vicksburg, MS, USA, 2007. [Google Scholar]
- Taylor, S.; Lever, J.H.; Bostick, B.; Walsh, M.R.; Walsh, M.E.; Packer, B. Underground UXO: Are They a Significant Source of Explosives in Soil Compared to Low- and High-Order Detonation; ERDC/CRREL Technical Report TR-04-23; Cold Regions Research and Engineering Laboratory: Hanover, NH, USA, 2004. [Google Scholar]
- Rylott, E.L.; Jackson, R.G.; Edwards, J.; Womack, G.L.; Seth-Smith, H.M.B.; Rathbone, D.A.; Strand, S.E.; Bruce, N.C. An explosive-degrading cytochrome P450 activity and its targeted application for the phytoremediation of RDX. Nat. Biotechnol. 2006, 24, 216–219. [Google Scholar] [CrossRef] [PubMed]
- Panz, K.; Miksch, K.; Sojka, T. Synergetic toxic effect of an explosive material mixture in soil. Bull. Environ. Contam. Toxicol. 2013, 91, 555–559. [Google Scholar] [CrossRef] [PubMed]
- Haboudane, D.; Miller, J.R.; Pattev, E.; Zarco-Tejada, P.J.; Stachan, I.B. Hyperspectral vegetation indices and novel algorithms for predicting green LAI of crop canopies: Modeling and validation in the context of precision agriculture. Remote Sens. Environ. 2004, 90, 337–352. [Google Scholar] [CrossRef]
- Slonecker, T.; Fisher, G.B.; Aiello, D.P.; Haack, B. Visible and infrared remote imaging of hazardous waste: A review. Remote Sens. 2010, 2, 2474–2508. [Google Scholar] [CrossRef]
- Leeneer, I.; Pastijn, H. Selecting land mine detection strategies by means of outranking MCDM techniques. Eur. J. Oper. Res. 2002, 139, 327–338. [Google Scholar] [CrossRef]
- Habib, M.K. Controlled biological and biomimetic systems for landmine detection. Biosens. Bioelectron. 2007, 23, 1–18. [Google Scholar] [CrossRef] [PubMed]


| Control – Drought | Plant Type | |||||
|---|---|---|---|---|---|---|
| Index | Acronym | Relates to | References | AM | AMX | S |
| Green Difference Vegetation Index | GDVI | Biomass | [21] | 0.0157 | 0.0001 | 0.0057 |
| Leaf Area Index | LAI | [22] | 0.0711 | 0.0415 | 0.8420 | |
| Normalized Difference Vegetation Index | NDVI | [23] | 0.6455 | 0.8991 | 0.9290 | |
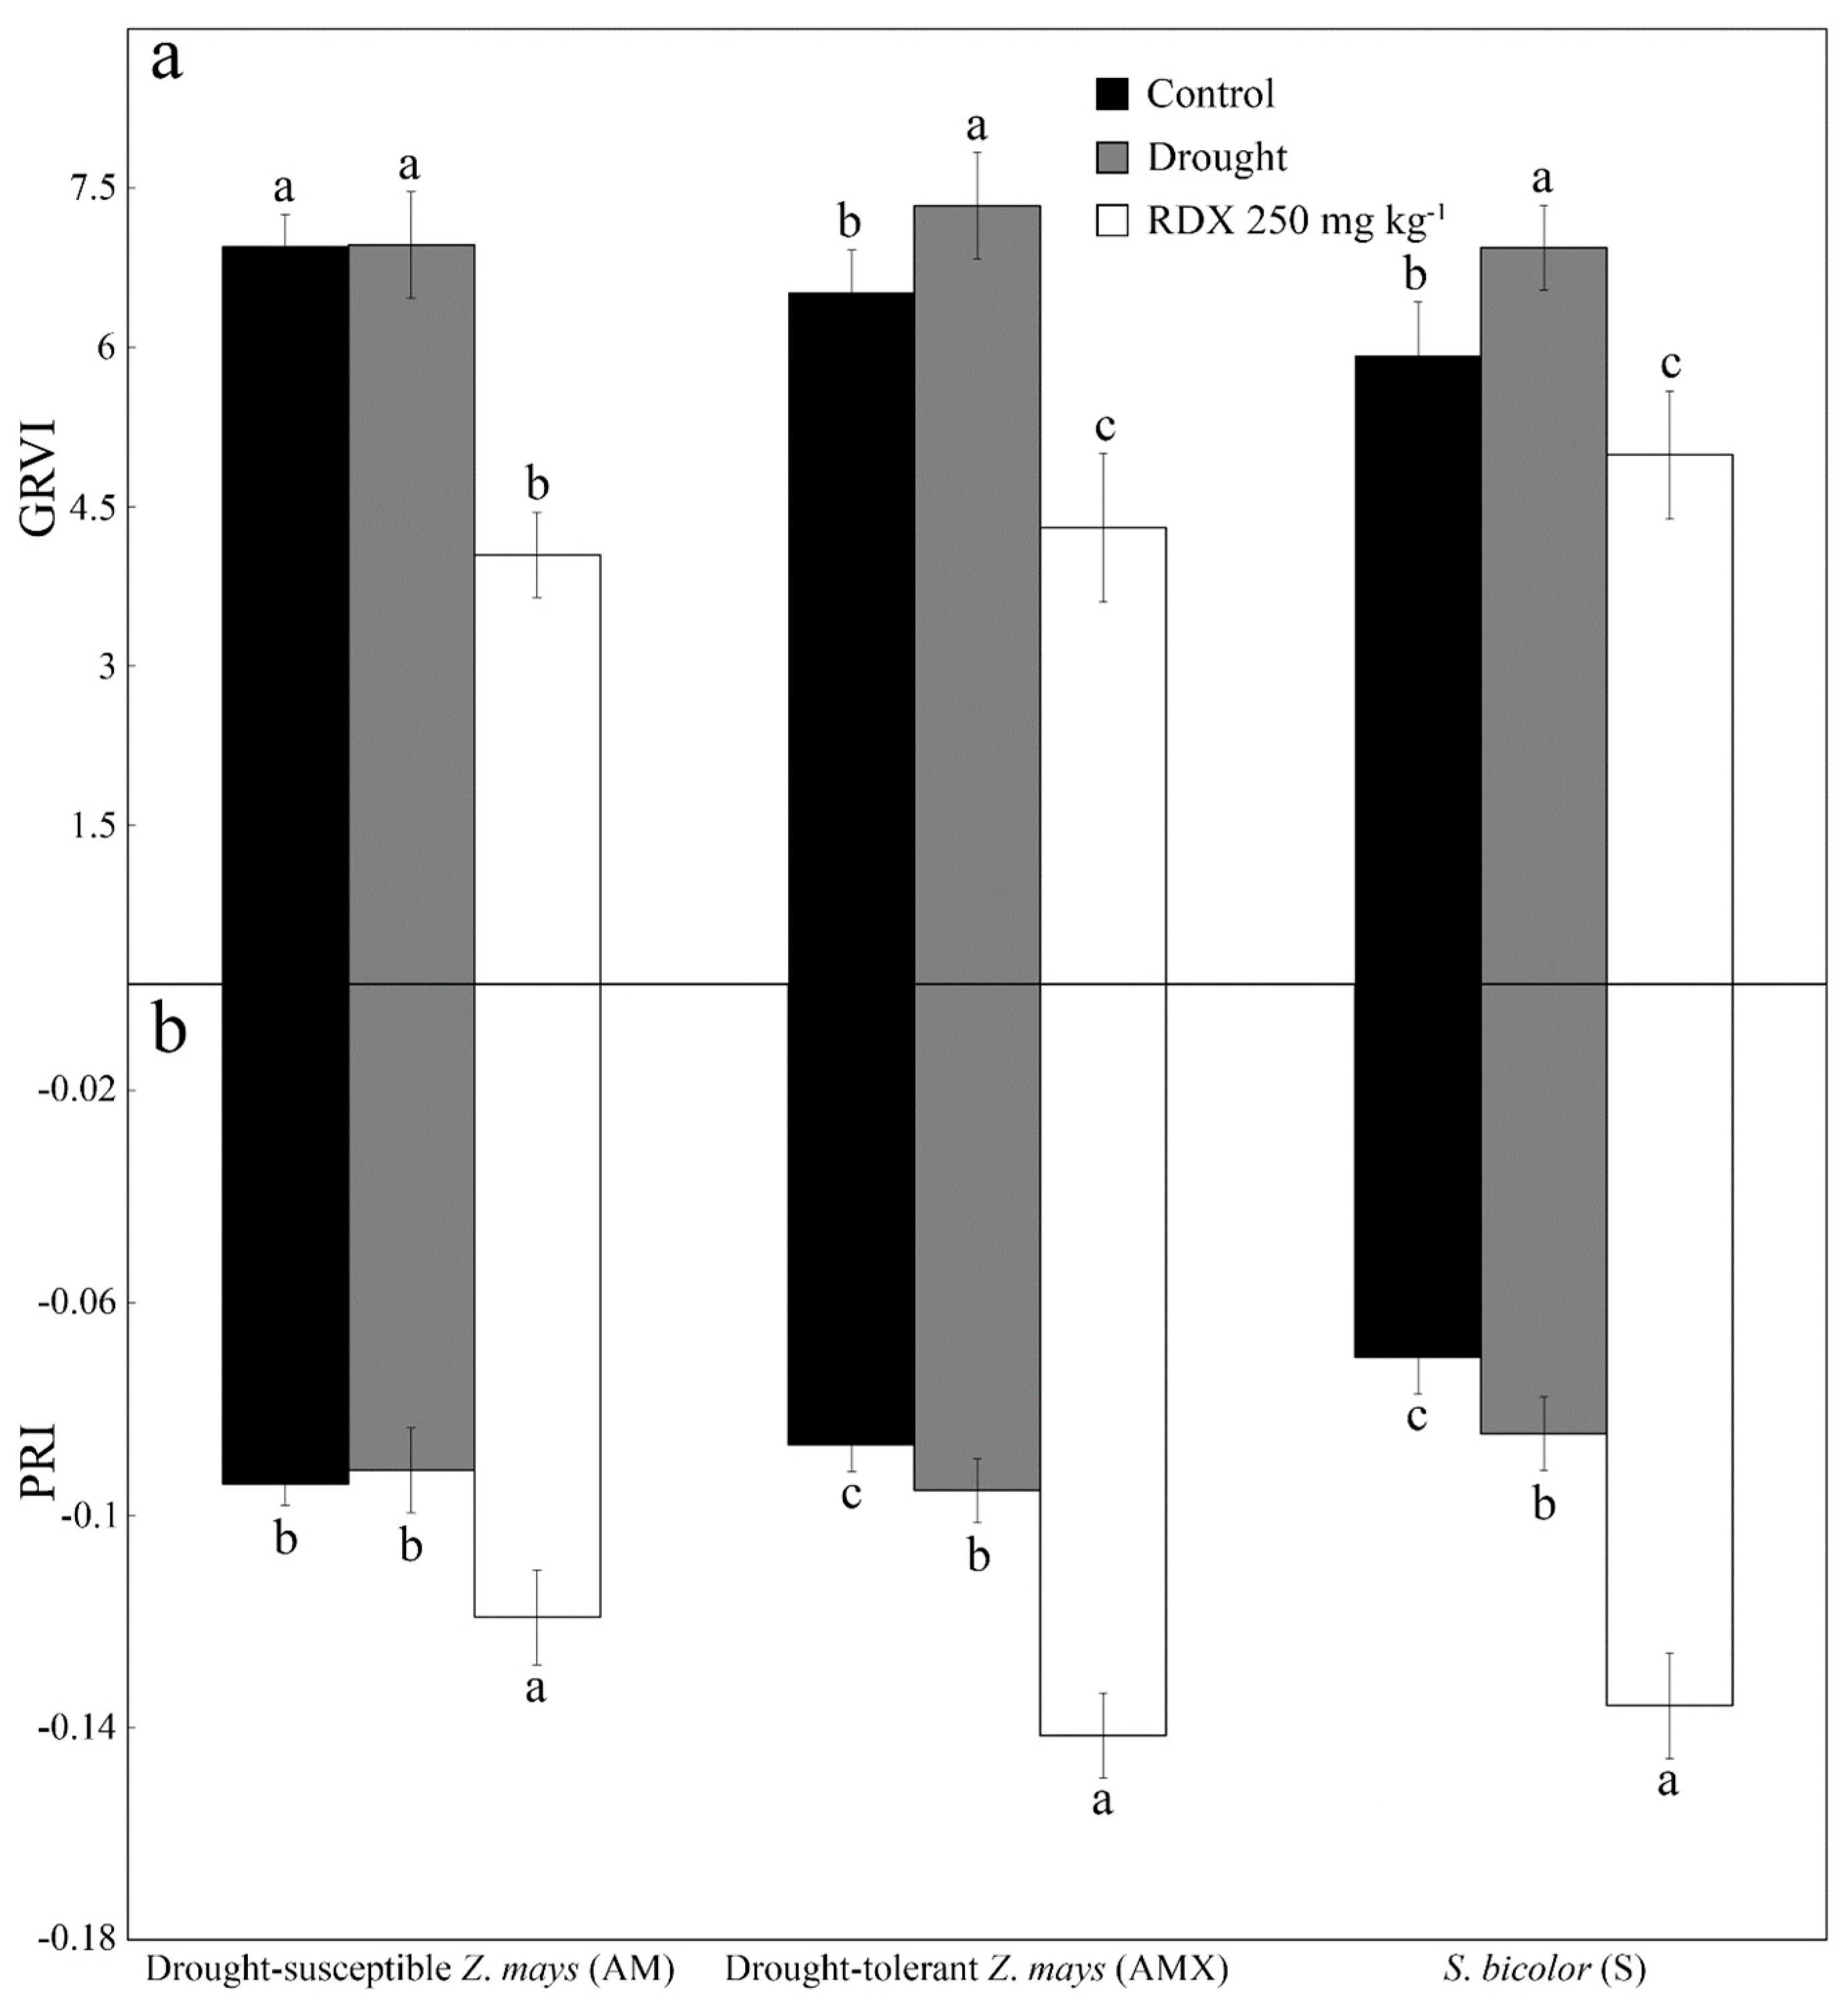
| Green Ratio Vegetation Index | GRVI | Photosynthesis | [21] | 0.9968 | 0.0176 | 0.0027 |
| Modified Red Edge Simple Ratio | MRESR | [24] | 0.5161 | 0.1252 | 0.8249 | |
| Photochemical Reflectance Index | PRI | [25] | 0.7440 | 0.0340 | 0.0070 | |
| Anthocyanin Reflectance Index 1 | ARI1 | Pigments | [26] | 0.1553 | 0.0008 | 0.0002 |
| Anthocyanin Reflectance Index 2 | ARI2 | [26] | 0.9573 | 0.0056 | <0.0001 | |
| Carotenoid Reflectance Index 1 | CRI1 | [27] | 0.9999 | 0.0002 | 0.9985 | |
| Carotenoid Reflectance Index 2 | CRI2 | [27] | 0.9219 | 0.0002 | 0.7921 | |
| Green Normalized Difference Vegetation Index | GNDVI | [28] | 0.9999 | 0.1213 | 0.0396 | |
| Modified Chlorophyll Absorption Ratio Index | MCARI | [29] | 0.0994 | 0.0080 | 0.5899 | |
| Structure-Insensitive Pigment Index | SIPI | [30] | 0.9933 | 0.8080 | 0.9129 | |
| Vogelmann Red Edge Index 1 | VREI1 | [31] | 0.1114 | 0.1947 | 0.4924 | |
| Vogelmann Red Edge Index 2 | VREI2 | [31] | 0.0039 | 0.0602 | 0.9844 | |
| Plant Senescence Reflectance Index | PSRI | Stress | [32] | 0.4803 | 0.9719 | 0.5158 |
| Red Edge Position Index | REPI | [33] | 0.3607 | 0.6276 | 0.7286 | |
| Water Band Index | WBI | Water Content | [34] | 0.9125 | 0.8755 | <0.0001 |
| Control – RDX | Plant Type | |||||
|---|---|---|---|---|---|---|
| Index | Acronym | Relates to | References | AM | AMX | S |
| Green Difference Vegetation Index | GDVI | Biomass | [21] | 0.0002 | <0.0001 | 0.9979 |
| Leaf Area Index | LAI | [22] | <0.0001 | <0.0001 | <0.0001 | |
| Normalized Difference Vegetation Index | NDVI | [23] | <0.0001 | <0.0001 | <0.0001 | |
| Green Ratio Vegetation Index | GRVI | Photosynthesis | [21] | <0.0001 | <0.0001 | 0.0048 |
| Modified Red Edge Simple Ratio | MRESR | [24] | <0.0001 | <0.0001 | <0.0001 | |
| Photochemical Reflectance Index | PRI | [25] | <0.0001 | <0.0001 | <0.0001 | |
| Anthocyanin Reflectance Index 1 | ARI1 | Pigments | [26] | 0.5534 | 0.0054 | <0.0001 |
| Anthocyanin Reflectance Index 2 | ARI2 | [26] | 0.0008 | 0.6521 | <0.0001 | |
| Carotenoid Reflectance Index 1 | CRI1 | [27] | <0.0001 | 0.0525 | 0.0953 | |
| Carotenoid Reflectance Index 2 | CRI2 | [27] | <0.0001 | 0.4028 | 0.5756 | |
| Green Normalized Difference Vegetation Index | GNDVI | [28] | <0.0001 | <0.0001 | 0.0040 | |
| Modified Chlorophyll Absorption Ratio Index | MCARI | [29] | 0.0008 | 0.0322 | <0.0001 | |
| Structure-Insensitive Pigment Index | SIPI | [30] | 0.0017 | 0.0009 | 0.0012 | |
| Vogelmann Red Edge Index 1 | VREI1 | [31] | <0.0001 | <0.0001 | <0.0001 | |
| Vogelmann Red Edge Index 2 | VREI2 | [31] | <0.0001 | <0.0001 | <0.0001 | |
| Plant Senescence Reflectance Index | PSRI | Stress | [32] | <0.0001 | <0.0001 | <0.0001 |
| Red Edge Position Index | REPI | [33] | <0.0001 | <0.0001 | <0.0001 | |
| Water Band Index | WBI | Water Content | [34] | <0.0001 | <0.0001 | <0.0001 |
| Drought – RDX | Plant Type | |||||
|---|---|---|---|---|---|---|
| Index | Acronym | Relates to | References | AM | AMX | S |
| Green Difference Vegetation Index | GDVI | Biomass | [21] | 0.1478 | 0.0015 | 0.0050 |
| Leaf Area Index | LAI | [22] | <0.0001 | <0.0001 | <0.0001 | |
| Normalized Difference Vegetation Index | NDVI | [23] | <0.0001 | <0.0001 | <0.0001 | |
| Green Ratio Vegetation Index | GRVI | Photosynthesis | [21] | <0.0001 | <0.0001 | <0.0001 |
| Modified Red Edge Simple Ratio | MRESR | [24] | <0.0001 | <0.0001 | <0.0001 | |
| Photochemical Reflectance Index | PRI | [25] | <0.0001 | <0.0001 | <0.0001 | |
| Anthocyanin Reflectance Index 1 | ARI1 | Pigments | [26] | 0.0220 | 0.7118 | 0.0093 |
| Anthocyanin Reflectance Index 2 | ARI2 | [26] | 0.0016 | 0.0406 | 0.0064 | |
| Carotenoid Reflectance Index 1 | CRI1 | [27] | <0.0001 | <0.0001 | 0.0740 | |
| Carotenoid Reflectance Index 2 | CRI2 | [27] | <0.0001 | <0.0001 | 0.2193 | |
| Green Normalized Difference Vegetation Index | GNDVI | [28] | <0.0001 | <0.0001 | <0.0001 | |
| Modified Chlorophyll Absorption Ratio Index | MCARI | [29] | <0.0001 | <0.0001 | <0.0001 | |
| Structure-Insensitive Pigment Index | SIPI | [30] | <0.0001 | 0.0002 | 0.0022 | |
| Vogelmann Red Edge Index 1 | VREI1 | [31] | <0.0001 | <0.0001 | <0.0001 | |
| Vogelmann Red Edge Index 2 | VREI2 | [31] | <0.0001 | <0.0001 | <0.0001 | |
| Plant Senescence Reflectance Index | PSRI | Stress | [32] | <0.0001 | <0.0001 | 0.0002 |
| Red Edge Position Index | REPI | [33] | <0.0001 | <0.0001 | <0.0001 | |
| Water Band Index | WBI | Water Content | [34] | 0.1478 | 0.0015 | 0.0050 |
© 2019 by the authors. Licensee MDPI, Basel, Switzerland. This article is an open access article distributed under the terms and conditions of the Creative Commons Attribution (CC BY) license (http://creativecommons.org/licenses/by/4.0/).
Share and Cite
Manley, P.V.; Sagan, V.; Fritschi, F.B.; Burken, J.G. Remote Sensing of Explosives-Induced Stress in Plants: Hyperspectral Imaging Analysis for Remote Detection of Unexploded Threats. Remote Sens. 2019, 11, 1827. https://0-doi-org.brum.beds.ac.uk/10.3390/rs11151827
Manley PV, Sagan V, Fritschi FB, Burken JG. Remote Sensing of Explosives-Induced Stress in Plants: Hyperspectral Imaging Analysis for Remote Detection of Unexploded Threats. Remote Sensing. 2019; 11(15):1827. https://0-doi-org.brum.beds.ac.uk/10.3390/rs11151827
Chicago/Turabian StyleManley, Paul V., Vasit Sagan, Felix B. Fritschi, and Joel G. Burken. 2019. "Remote Sensing of Explosives-Induced Stress in Plants: Hyperspectral Imaging Analysis for Remote Detection of Unexploded Threats" Remote Sensing 11, no. 15: 1827. https://0-doi-org.brum.beds.ac.uk/10.3390/rs11151827