Detection of Liquefaction Phenomena from the 2017 Pohang (Korea) Earthquake Using Remote Sensing Data


1
Department of Geophysical Exploration, KIGAM campus, Korea University of Science and Technology (UST), Daejeon 34114, Korea
2
Korea Institute of Geoscience and Mineral Resources (KIGAM), Daejeon 34132, Korea
*
Author to whom correspondence should be addressed.
Remote Sens. 2019, 11(18), 2184; https://doi.org/10.3390/rs11182184
Submission received: 24 July 2019
/
Revised: 6 September 2019
/
Accepted: 17 September 2019
/
Published: 19 September 2019
(This article belongs to the Special Issue Recent Advances in Remote Sensing Applied to Geohazards, Vulnerability and Risk Studies)
Abstract
:On 15 November 2017, liquefaction phenomena were observed around the epicenter after a 5.4 magnitude earthquake occurred in Pohang in southeast Korea. In this study, we attempted to detect areas of sudden water content increase by using SAR (synthetic aperture radar) and optical satellite images. We analyzed coherence changes using Sentinel-1 SAR coseismic image pairs and analyzed NDWI (normalized difference water index) changes using Landsat 8 and Sentinel-2 optical satellite images from before and after the earthquake. Coherence analysis showed no liquefaction-induced surface changes. The NDWI time series analysis models using Landsat 8 and Sentinel-2 optical images confirmed liquefaction phenomena close to the epicenter but could not detect liquefaction phenomena far from the epicenter. We proposed and evaluated the TDLI (temporal difference liquefaction index), which uses only one SWIR (short-wave infrared) band at 2200 nm, which is sensitive to soil moisture content. The Sentinel-2 TDLI was most consistent with field observations where sand blow from liquefaction was confirmed. We found that Sentinel-2, with its relatively shorter revisit period compared to that of Landsat 8 (5 days vs. 16 days), was more effective for detecting traces of short-lived liquefaction phenomena on the surface. The Sentinel-2 TDLI could help facilitate rapid investigations and responses to liquefaction damage.
1. Introduction
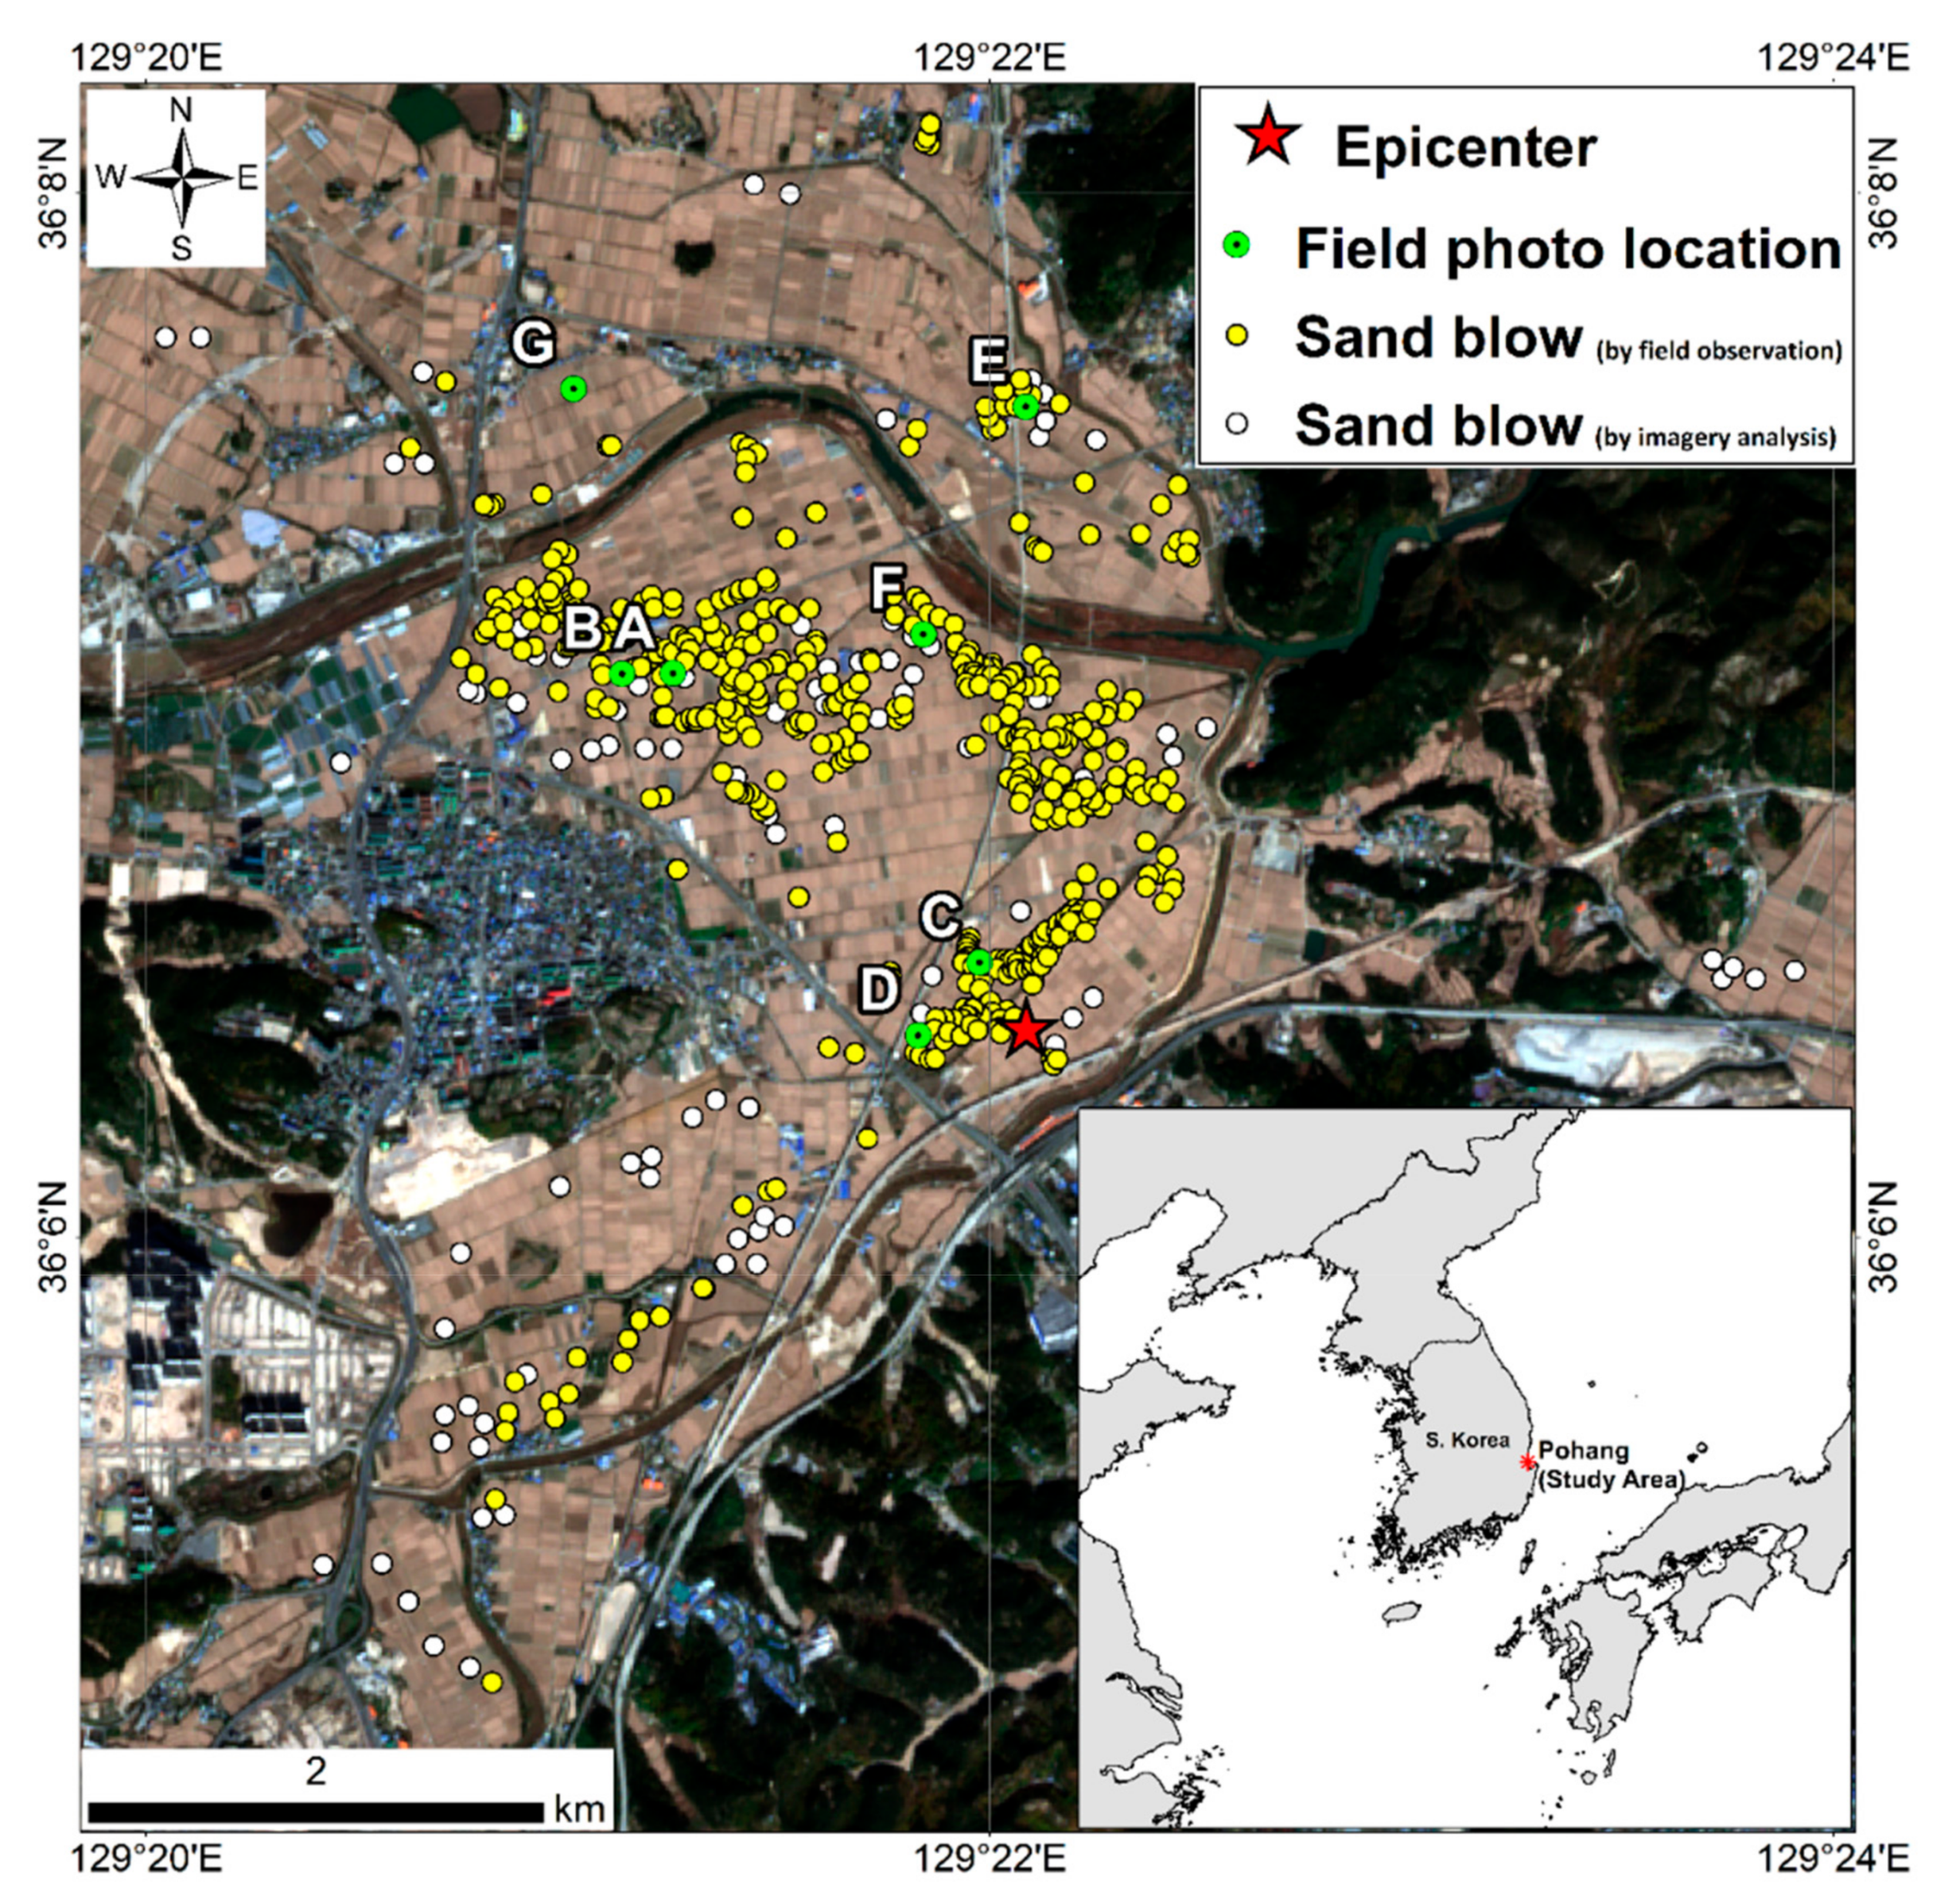
On 15 November 2017, a magnitude 5.4 earthquake occurred in Pohang in southeast Korea (Figure 1). It is the second largest earthquake in the modern history of South Korea [1]. Earthquakes change the arrangement of soil particles and increase the pore water pressure, often causing ground liquefaction [2,3]. Liquefaction can cause subsidence or weakening of the ground, resulting in damage to buildings or underground facilities (e.g., water, sewerage, and gas pipes). An accurate analysis of the area where liquefaction occurs is important for establishing damage recovery measures and preventing damage. Direct field surveys are less efficient in terms of cost and safety when the liquefaction area is too large, or access is limited due to earthquake damage. In addition, unlike other earthquake damage, such as surface rupture, liquefaction phenomena only remain on the surface for a short time. Remote sensing technology using satellite imagery can quickly detect liquefaction phenomena related to earthquakes and can help to establish a site investigation plan [1,3]. Previous studies used satellite and unmanned aerial photographs to investigate various surface deformation phenomena, prior to field surveys, after the Pohang earthquake. They confirmed secondary ground deformations, such as ground cracks and rock falls around the epicenter, as well as about 600 sand blows related to soil liquefaction (Figure 1). However, these studies only used images from after the earthquake for liquefaction investigation. Furthermore, only visual analysis of the images was performed, and remote sensing analysis to detect changes in the physical properties of the surface due to liquefaction was not performed.
Detection of liquefaction phenomena using synthetic aperture radar (SAR) images is mainly based on coherence values that show variation when comparing images from before and after an earthquake [2,4]. SAR is highly sensitive to various surface changes without being affected by atmospheric conditions and is effective at mapping earthquake-induced surface deformation. However, SAR images have a relatively low spatial resolution compared to optical images, and as such, it can be difficult to isolate the liquefaction-induced coherence changes from those caused by various other types of surface deformation. Liquefaction detection using optical satellite imagery (e.g., Landsat, LISS-III) detects surface changes due to liquefaction using spectral bands, such as visible and SWIR (short wavelength infrared) rays sensitive to soil moisture [5,6,7,8,9,10,11]. Since optical satellite images are sensitive to atmospheric conditions, there are some limitations on their use. However, optical satellite images have a relatively high spatial resolution compared to SAR images and can directly detect liquefaction phenomena caused by the earthquake.
This study evaluates the use of optical and SAR images for detecting earth surface liquefaction caused by the Pohang earthquake, as well as the performance of analytical techniques. SAR coherence changes were analyzed using Sentinel-1 coseismic image pairs. Additionally, NDWI (normalized difference water index) and SWIR (short wave infrared) time series analyses were performed using Landsat 8 and Sentinel-2 optical images from before and after the earthquake. Landsat 8’s revisit period is 16 days, while Sentinel-2’s revisit period is 5 days, resulting in a high temporal resolution that is advantageous for quick responses to earthquake liquefaction. In addition, no seismic liquefaction studies have used Sentinel-2 data at the time of publication.
2. Data and Methodology
2.1. SAR Data Analysis
Earthquake-induced changes in the ground surface cause a decrease in the coherence value due to a signal mismatch between SAR pair images from before and after the earthquake [4,12,13,14]. This is called decorrelation. We calculated the coherence of the coseismic Sentinel-1B SAR image pair and the coherence of the preseismic Sentinel-1B SAR image pair to detect liquefaction caused by the Pohang earthquake. Images from 23 October and 4 November 2017 were used for the preseismic dataset, and images of 4 November and 16 November 2017 were used for the coseismic dataset.
2.2. Optical Data Analysis
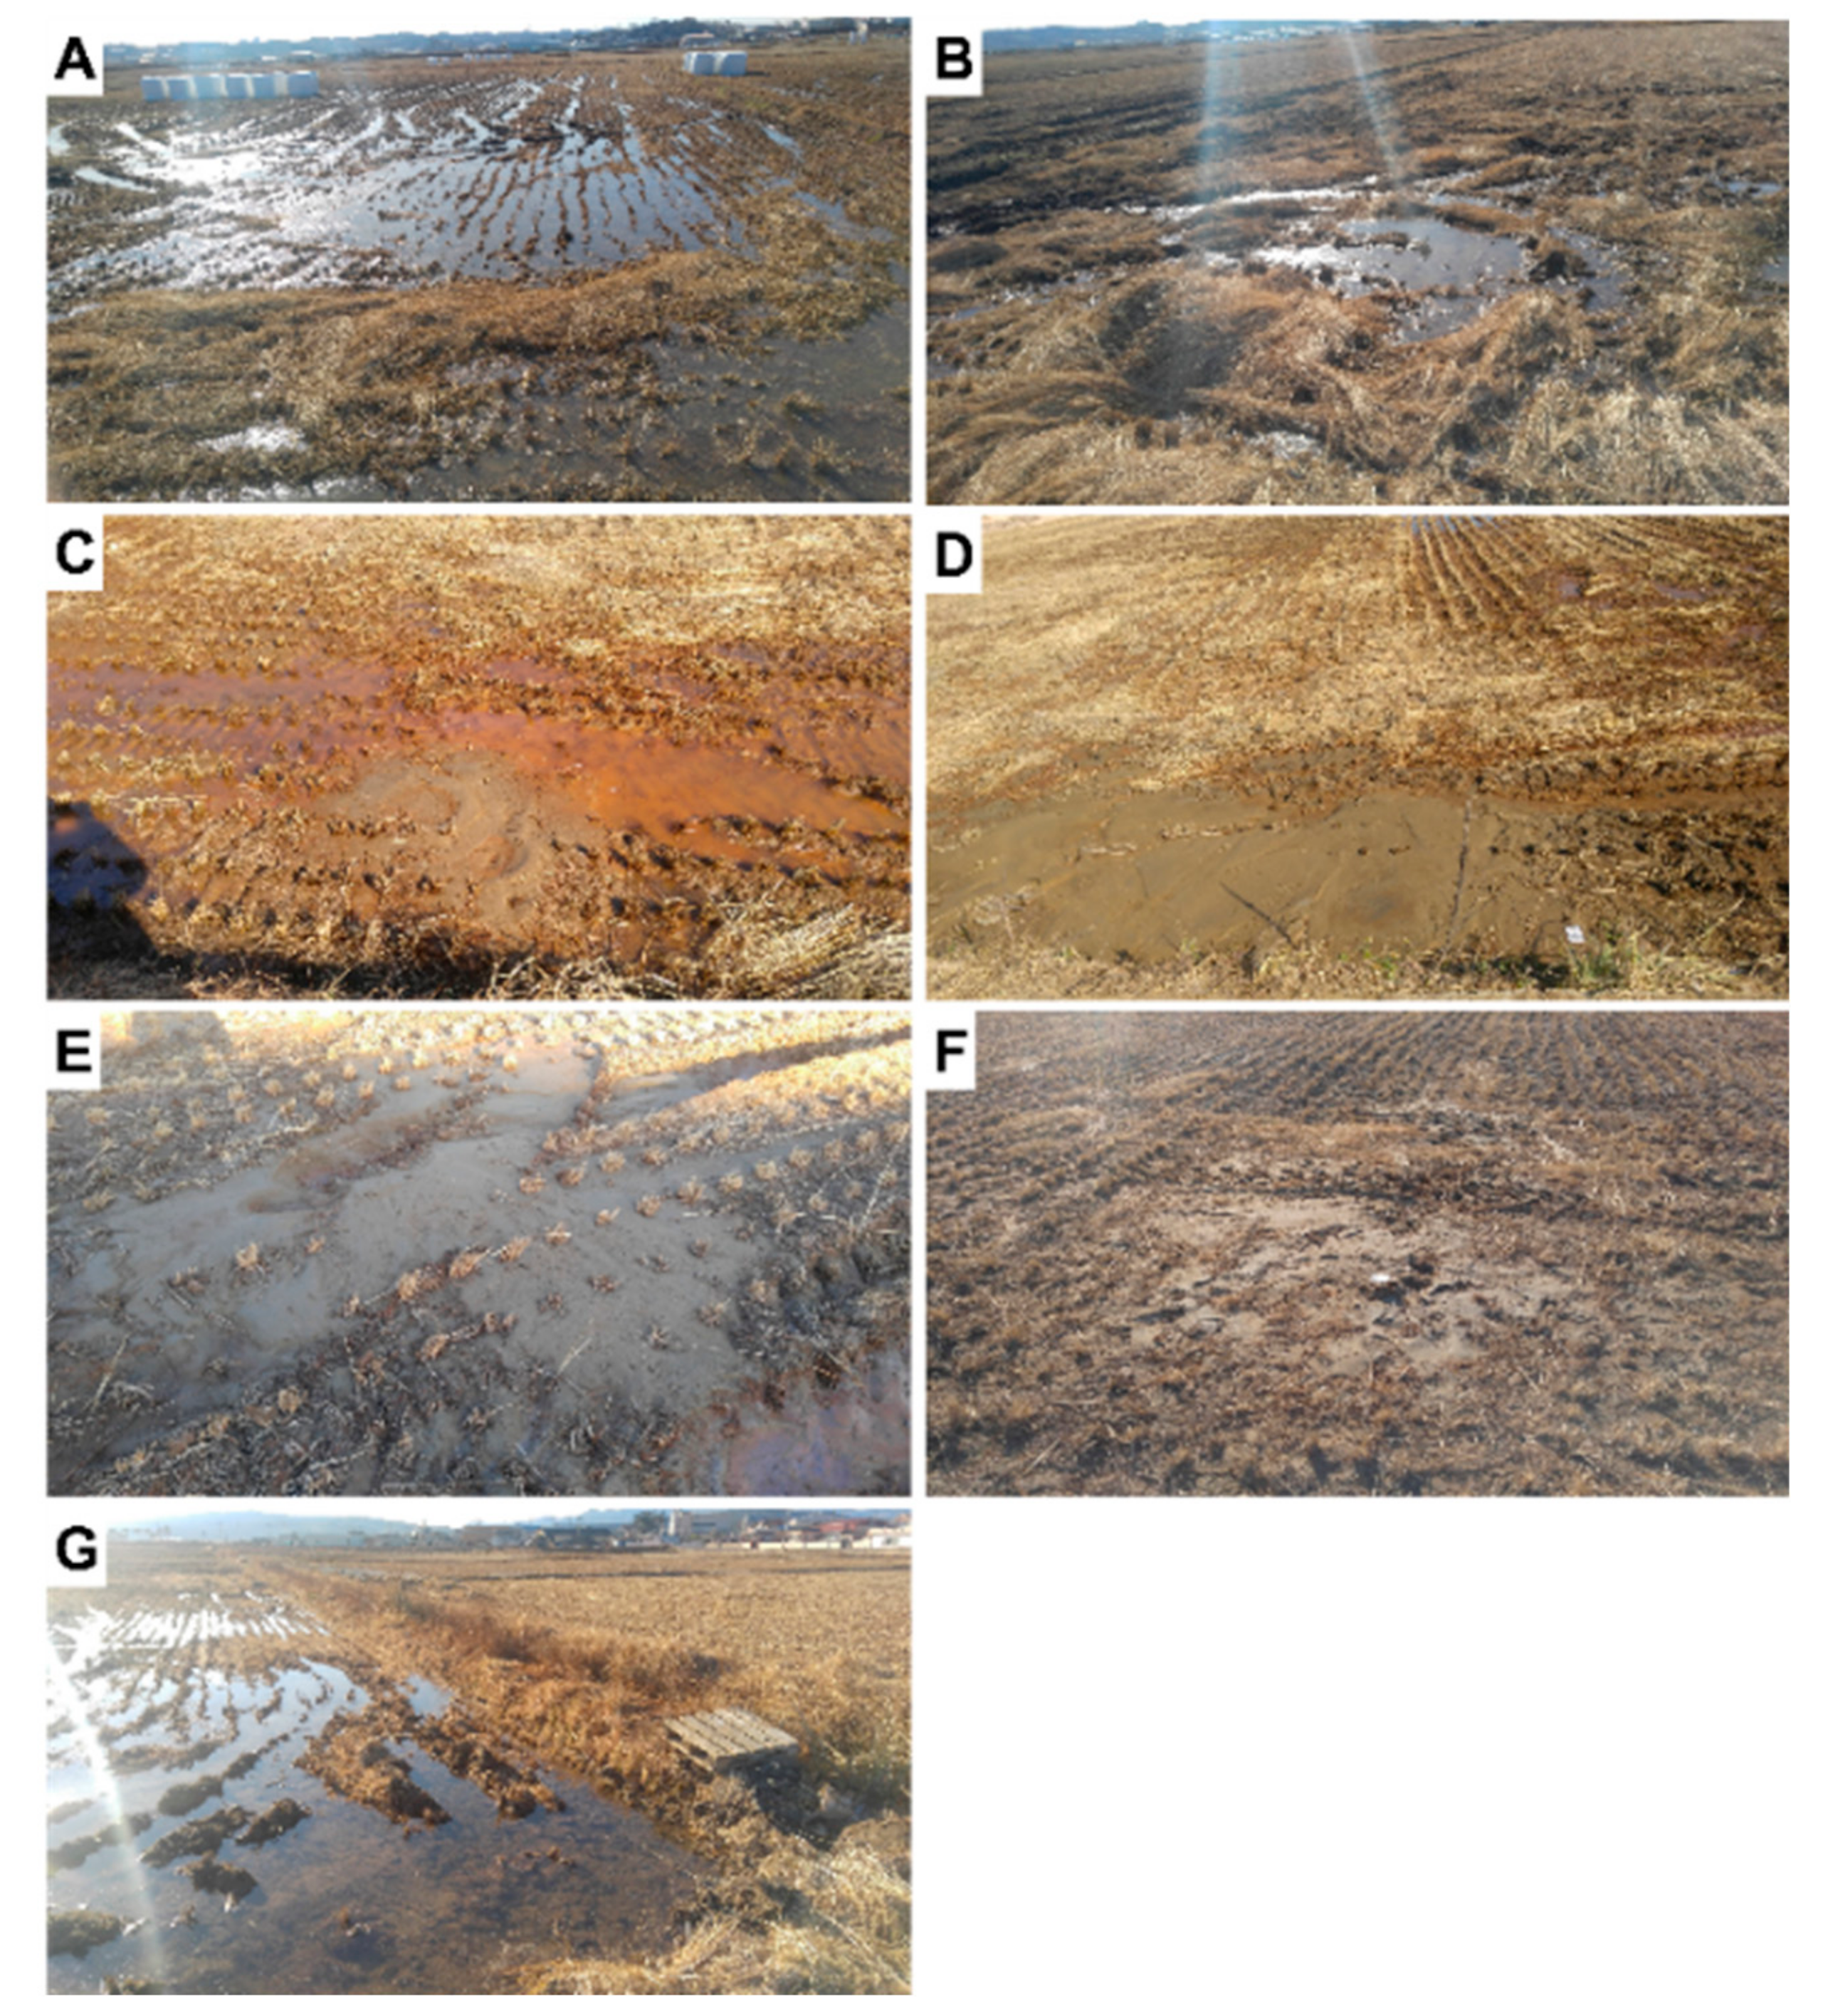
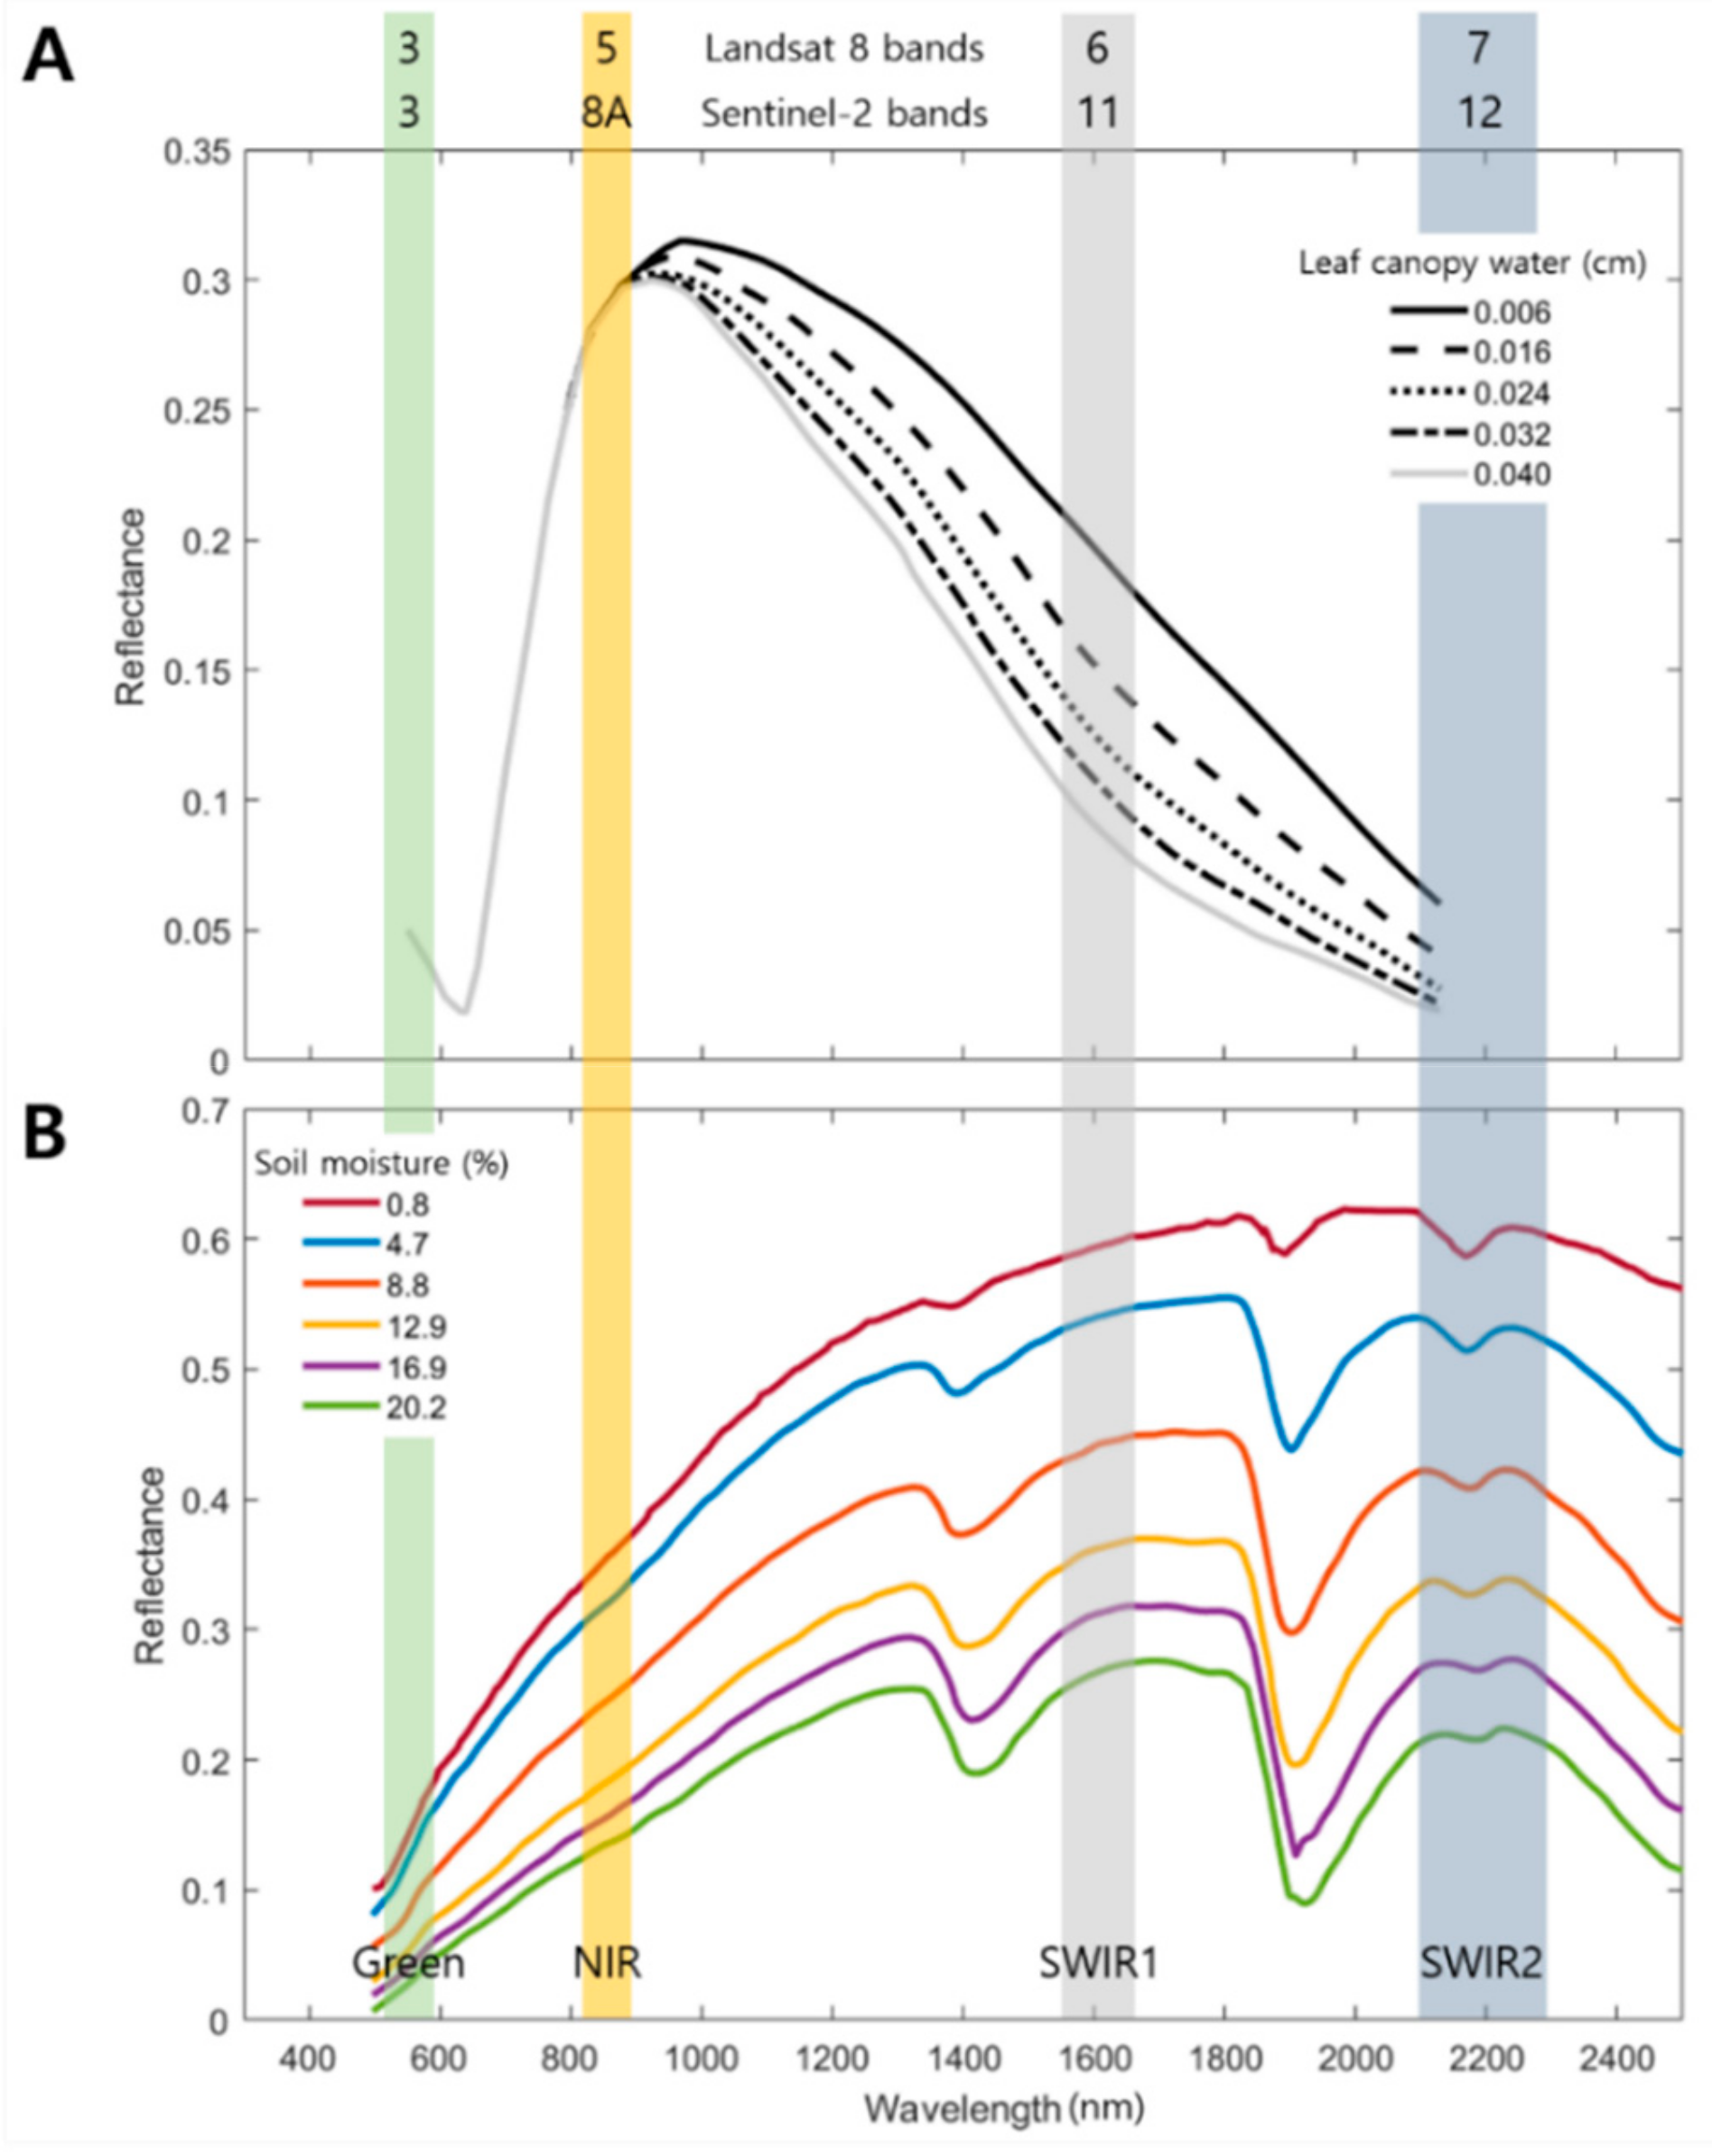
Due to the Pohang Earthquake in 2017, water and sand below the surface of the earth were discharged to the surface (Figure 2). According to field surveys, liquefaction is mostly observed in Quaternary sediments [3], generally in rice paddies and farmland areas. Because spectral reflectance values of soil and vegetation change according to water content [15,16,17] (Figure 3), the spectral reflectance of the liquefied and unliquefied surfaces will be different. We used this principle to map the distribution of surface liquefaction. However, changes in the water content of the surface can occur due to weather effects (e.g., precipitation, solar radiation, humidity) or agricultural activities (e.g., artificial watering). According to the Korea Meteorological Agency, precipitation was 0.0 mm and humidity and solar radiation did not significantly change between 31 October and 23 November 2017. In addition, at the time of the liquefaction phenomena, agricultural activities had already been completed. Therefore, we assume that the change of surface water content by other factors was negligible relative to the liquefaction phenomena.
Landsat 8 and Sentinel-2 images, from before and after the earthquake, were used to detect the liquefaction areas (Table 1). Landsat 8 and Sentinel 2 have spectral bands that are effective for detecting changes in reflectance associated with the moisture content of the surface (Table 2; Figure 3). First, radiometric and atmospheric calibration was performed to obtain reflectance images. The Landsat 8 images were calibrated using the dark object subtraction method [18] in MATLAB, and the Sentinel-2 images were calibrated using Sen2Cor [19], provided by the German Aerospace Center (DLR; Cologne, Germany). Subsequently, co-registration was performed based on the pre-earthquake images in order to reduce the geometrical errors between each image pair before and after the earthquake.
NDWI was developed to measure water in the vegetation and to detect open water [16,20,21]. It was also used to detect liquefaction-damaged soil [9]. The NDWI proposed by Gao [16] uses the NIR and SWIR bands (1240-nm wavelength) and is sensitive to changes in vegetation water content. In this study, since Landsat 8 and Sentinel-2 do not have a 1240-nm wavelength band, it was replaced with a 1600-nm band (Equation (1)). Previous studies have shown that the SWIR band around 1600 nm can be used effectively for the detection of vegetation and soil moisture [22,23,24]. McFeeters [20] proposed an NDWI for open water detection using the high reflectance of water in the green band and low reflectance in the NIR band (Formula 2). This index emphasizes the spectral characteristics of water while minimizing the effects of soil and vegetation. Xu [21] proposed a modified NDWI (mNDWI, Equation (3)) that uses the SWIR in the 1600-nm wavelength band instead of the NIR band to compensate for the problem that occurs in built-up areas where the NDWI of McFeeters [20] is affected by noise. The following three NDWIs were used in this study:
Landsat 8 band 3 and Sentinel-2 band 3 were used as the green bands, Landsat 8 band 5 and Sentinel-2 band 8a were used as the NIR bands, and Landsat 8 band 6 and Sentinel-2 band 11 were used as the SWIR1600nm bands (Table 2; Figure 3). We calculated the three NDWIs for before and after the earthquake (Indexpre_earthquake and Indexpost-earthquake) using Landsat 8 and Sentinel-2 images. Using the differences found for each value, earthquake-induced liquefaction area was detected, and the results were compared (Equation (4)).
A positive ∆Index means that the surface water content increased after the occurrence of the earthquake, while a negative value means the surface water decreased.
Typical NDWIs use a combination of bands, including those sensitive to soil and vegetation moisture (one or two), as well as non-sensitive bands. These methods allow for a more accurate interpretation of moisture changes in the soil and vegetation than those that use only one sensitive band [17]. However, it has not been verified that methods using both sensitive and non-sensitive bands are more effective in detecting surface changes due to liquefaction. In this study area, liquefaction induced groundwater eruptions or the wetting of soil (Figure 2). Here, we propose the temporal difference liquefaction index (TDLI; Equation (5)), which is the result of a time series analysis method using only one SWIR band. The SWIR-1 band (1600-nm center wavelength) is used in NDWIs because it is more sensitive to the moisture content in the vegetation than the SWIR-2 band (Figure 3). However, most of the liquefaction areas consisted of more soil than vegetation due to the harvest (Figure 2). SWIR-2 band (2200-nm center wavelength) was used to find the TDLI since it is the band most sensitive to increases in soil moisture content [15,17,25,26,27,28] (Figure 3); the TDLI was then compared with the time series analysis method using the difference of three NDWIs.
When TDLI is positive, the water content in the pixel area has increased; therefore, the larger the value, the larger the possibility of liquefaction. On the other hand, when the TDLI is negative, the water content has decreased; therefore, the smaller the value, the lower the possibility of the liquefaction phenomenon. Landsat 8 band 7 and Sentinel-2 band 12, which have center wavelengths of about 2200 nm, were used for the SWIR2 band (Table 2).
3. Results and Discussion
3.1. SAR Data Analysis
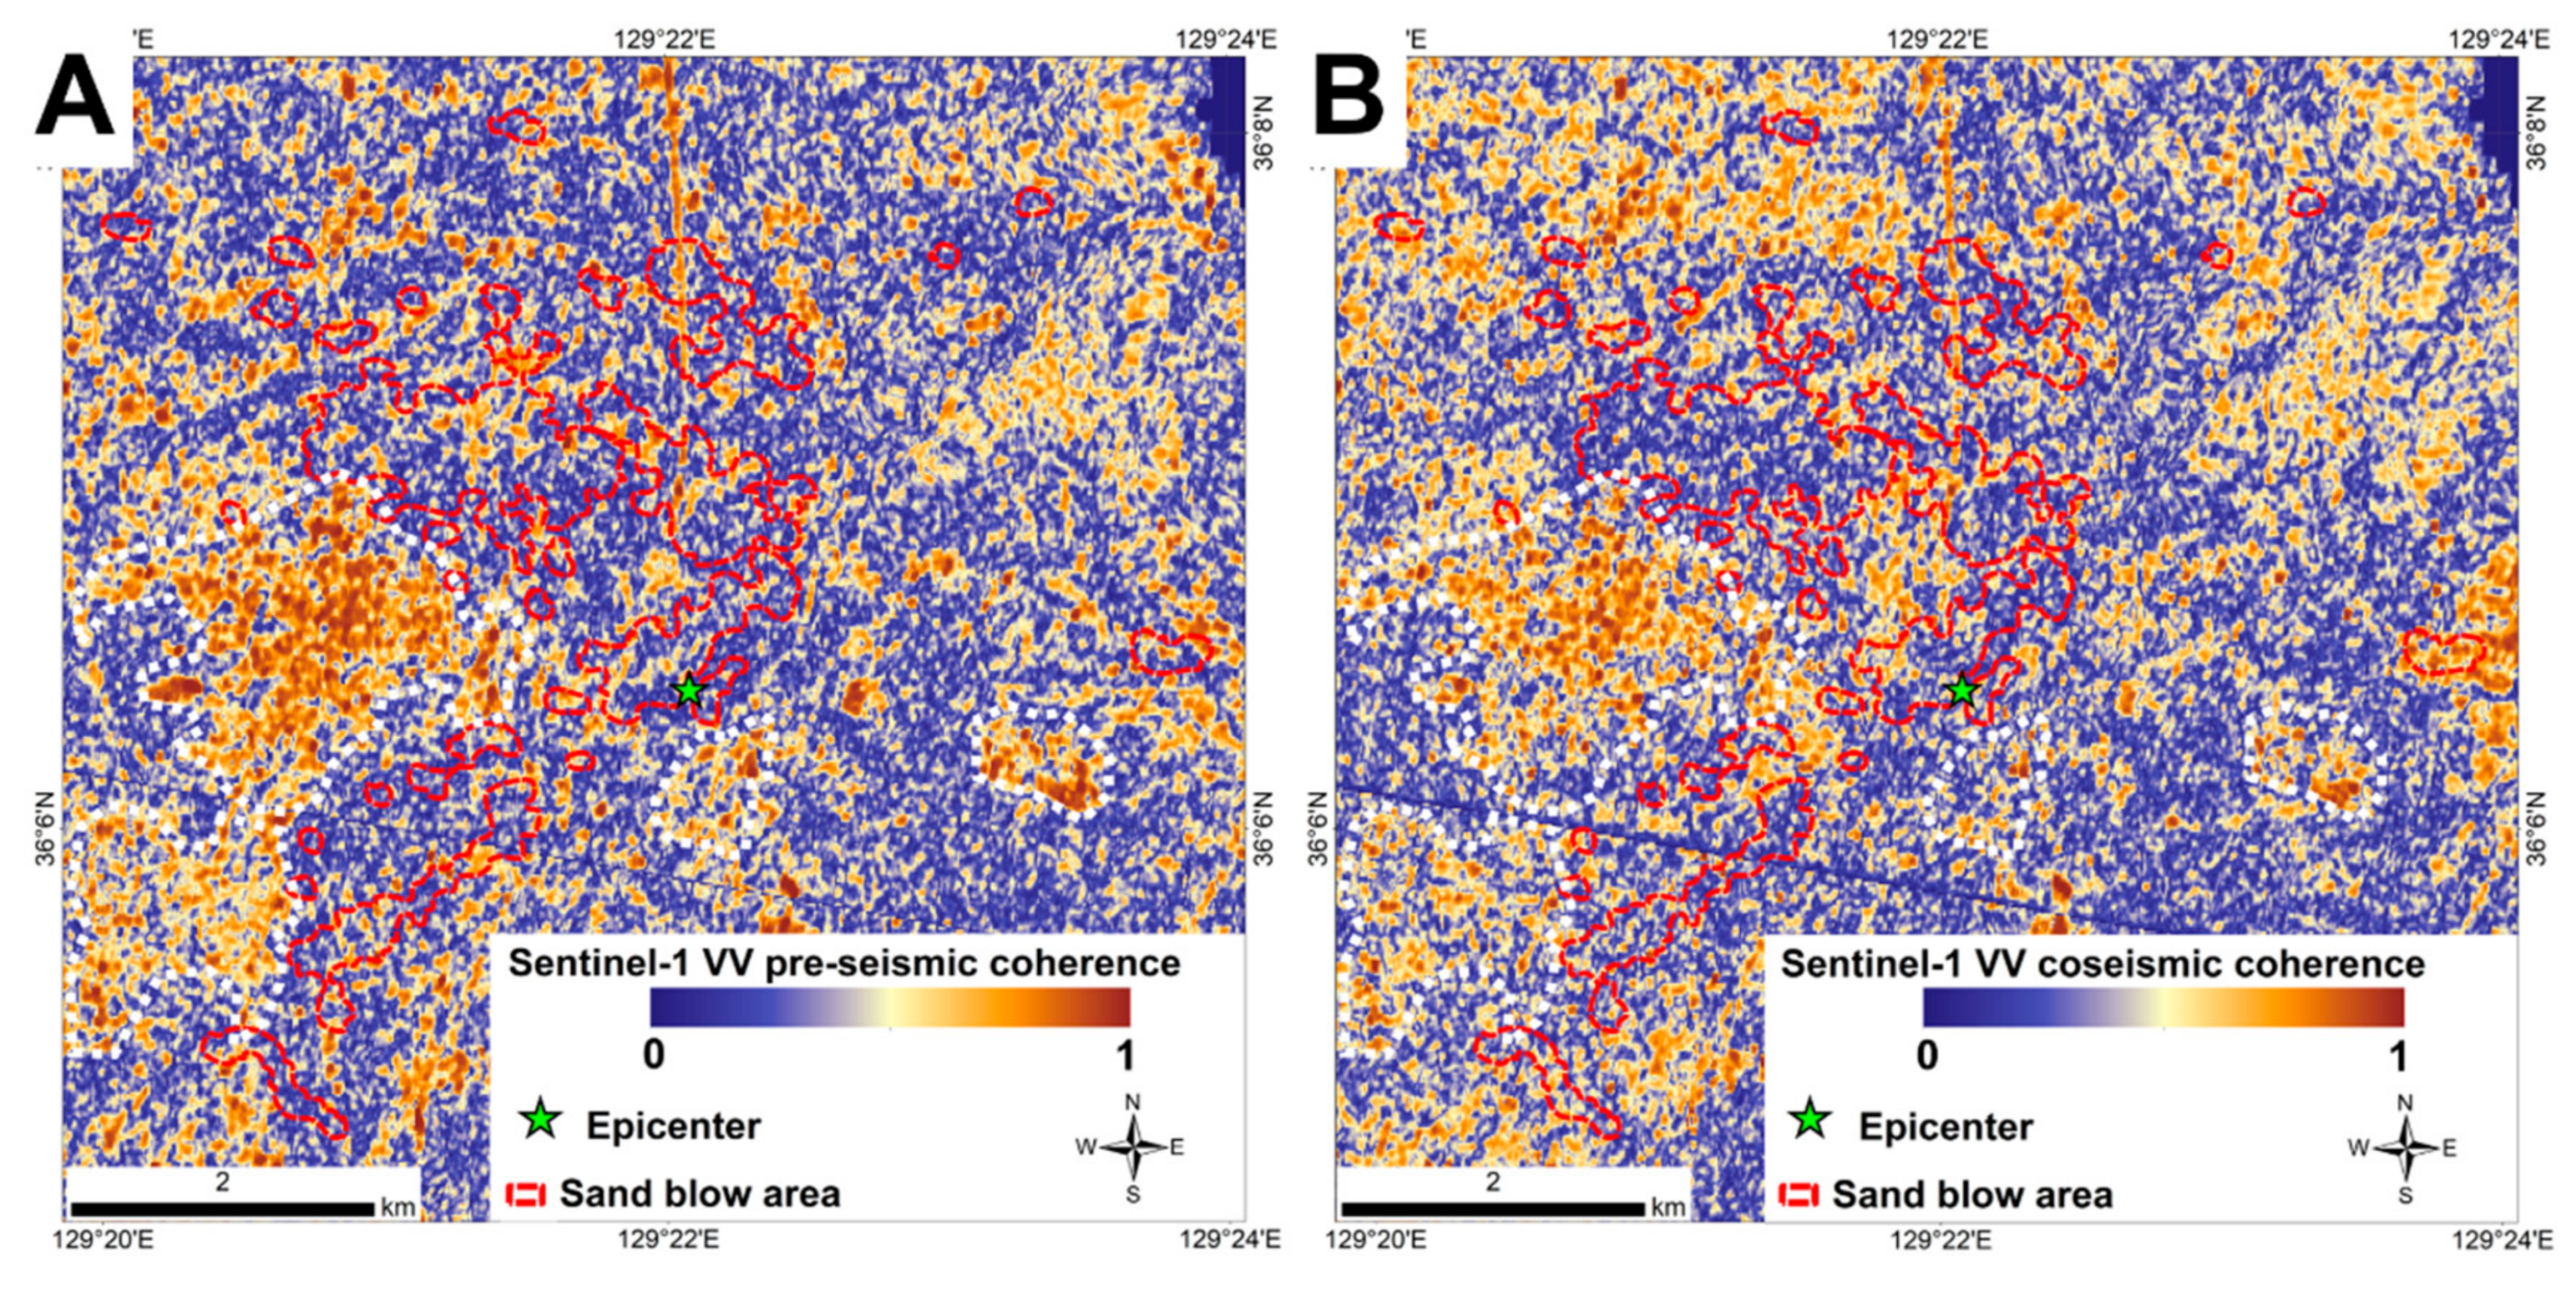
Figure 4 shows the coherence value between the Sentinel-1B SAR image pairs before and after the Pohang earthquake. The coseismic coherence (Figure 4b) decreased significantly compared to the preseismic coherence (Figure 4a) in most urban areas (west of the epicenter). The areas where the decrease of coherence was remarkable generally corresponded to areas where the buildings were damaged by the earthquake (Figure 4, white dashed line). Some buildings in the area were greatly tilted by the earthquake [1]. Damage to structures can be caused not only by seismic ground motion, but also by differential settlement induced by liquefaction. Therefore, part of the coherence reduction that appears in this area could be related to the liquefaction phenomena. However, in the sand blow region where field observations of liquefaction were made, it was difficult to find a particular change in coherence (Figure 4, inside the red broken line). The SAR decorrelation related to building damage in urban areas was caused by the displacement of the observed surface. Therefore, it was concluded that the change in surface water content due to liquefaction indicated on farmland did not greatly affect the decorrelation. Meanwhile, in the northern part of the study area, the coherence was increased in the SAR image pair due to the earthquake. This region had little liquefaction damage [1], and most of it is arable land. The coherence increase in this field is due to the agricultural activities up until the end of October.
3.2. Optical Data Analysis
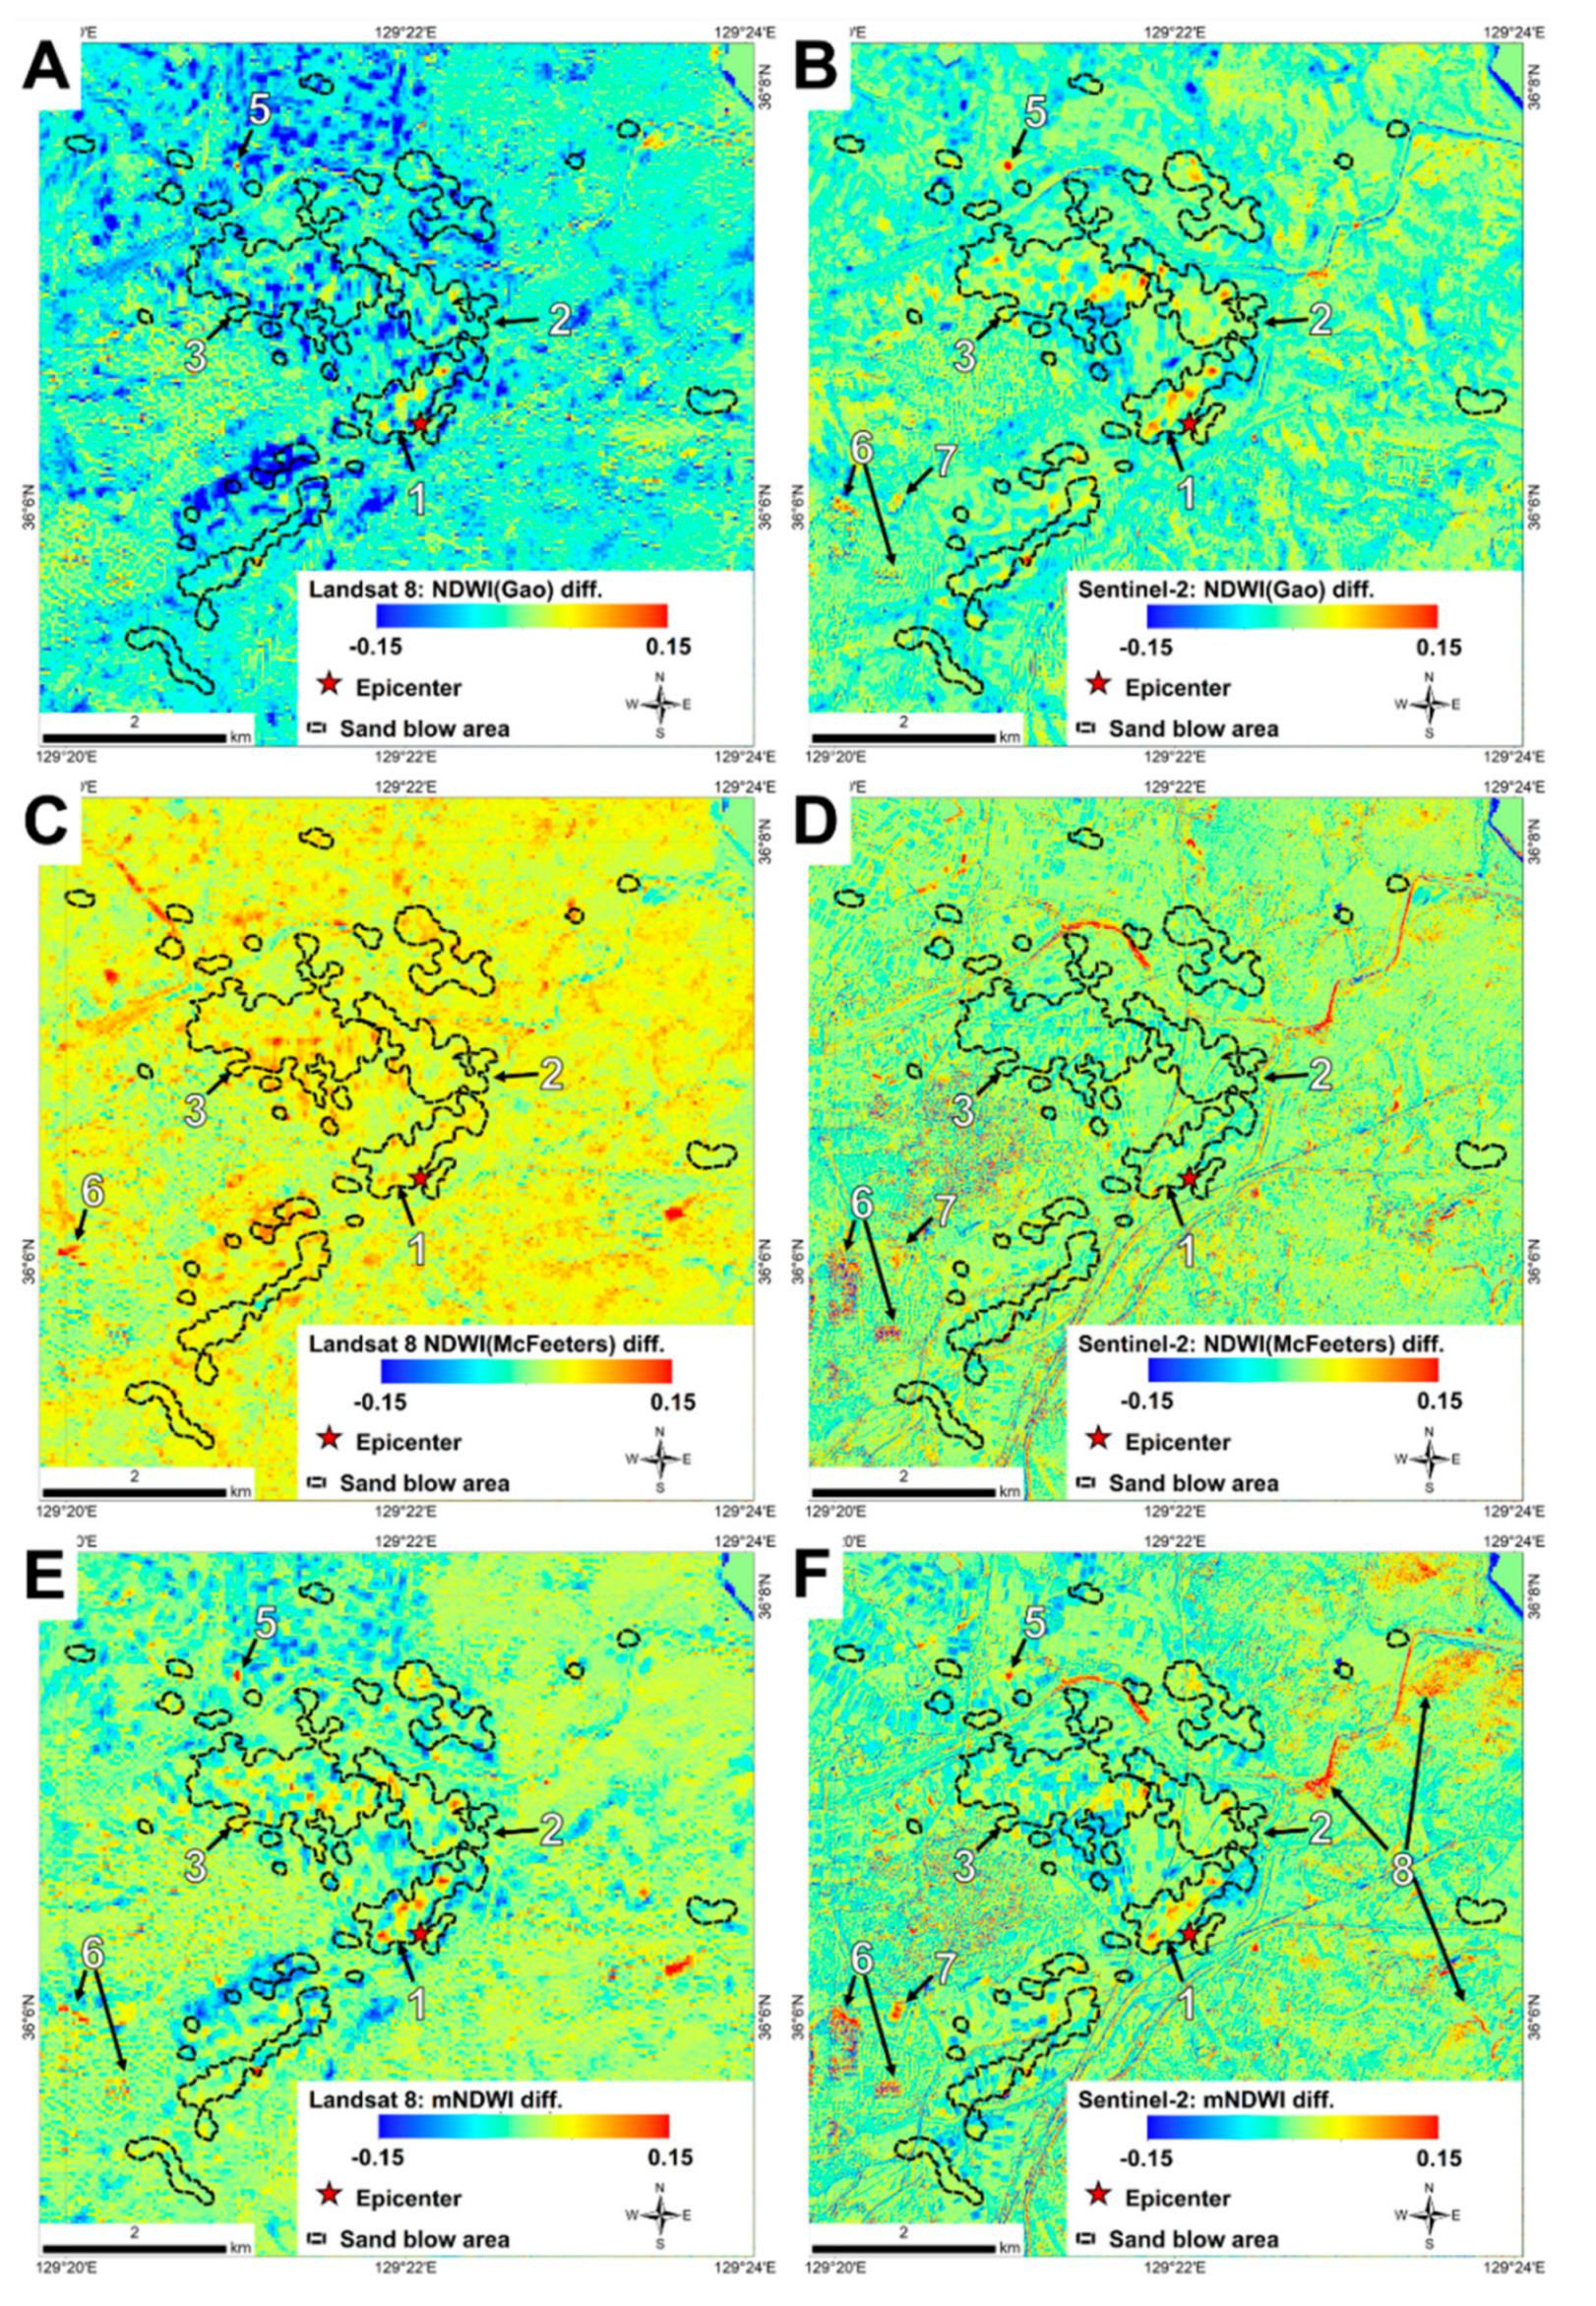
Figure 5 shows the NDWI difference before and after the Pohang earthquake. A larger difference in the index value (red pixels) indicates a greater increase in the moisture content on the surface. NDWIGao using Landsat 8 (Figure 5a) showed the highest value in the sand blow area at the epicenter (No. 1). This means that the water content increased in this area. NDWI both increased and decreased in the sand blow regions located to the north (No. 2) and northwest (No. 3) of the epicenter, but overall water content seemed to decrease. In other farmland areas, there was a remarkable decrease in water content (decrease in NDWI value). This reduction is presumed to be due to the temporal resolution of the Landsat image (16 days). The pre-earthquake sensing date of Landsat 8 was close to the harvesting time, and the Landsat 8 image after the earthquake observed the surface after the harvest was completed. Therefore, it seems that the water content of the farmland had decreased during the sensing interval. The NDWIGao difference using Sentinel-2 (Figure 5b), as in Landsat 8 NDWIGao, was most obvious in the sand blow area at the epicenter (No. 1). An increase in the NDWI value was also observed at some locations within the Nos. 2 and 3 sand blow regions. Site No. 5 was confirmed using field surveys as being an artificially watered area not related to liquefaction (Figure 2g). Figure 5c shows the result of calculating the NDWIMcFeeters difference using Landsat 8. In the areas not related to liquefaction, the NDWI values generally increased and there were no distinct features in the sand blow areas associated with liquefaction. Figure 5d shows the NDWIMcFeeters difference calculated with Sentinel-2. Similar to the NDWIMcFeeters calculated with Landsat 8, no specific increase in moisture content was visible in sand blow areas related to liquefaction. Figure 5e shows the mNDWIXu difference using Landsat 8. Among the NDWI results using Landsat 8, liquefaction traces were most evident in the sand blow region. However, in some areas, including urban areas (Figure 5e; Nos. 6 and 7), a high index increase was observed, which could be confused with liquefaction. The result of the mNDWIXu difference using Sentinel-2 (Figure 5f) showed a clear increase in the mNDWI value in the sand blow areas, but no significant increase in the index value was observed in the remaining sand blow main areas (Nos. 2 and 3). Furthermore, in some areas (No. 8) that were not related to the sand blow, the index increased significantly. This appears to be noise that was not related to liquefaction.
The NDWIGao and mNDWIXu results show that the index increased significantly in the sand blow region (No. 1) closest to the epicenter. This suggests that this area was most affected by seismic liquefaction. On the other hand, the index values did not show any significant difference in the other sand blow areas. This implies that the area was not significantly affected by liquefaction or the NDWI time series analysis technique was not able to detect seismic liquefaction phenomena in this area. However, a clear liquefaction phenomenon was observed on the surface at the Nos. 2 and 3 sand blow areas (Figure 2a–c) through field survey. Therefore, it was confirmed that the existing NDWI analysis methods have limitations in the detection of surface liquefaction phenomena due to earthquakes. The NDWI techniques used in this study were not sensitive to changes in soil water content due to liquefaction, because they were developed for detecting water in vegetation or open water.
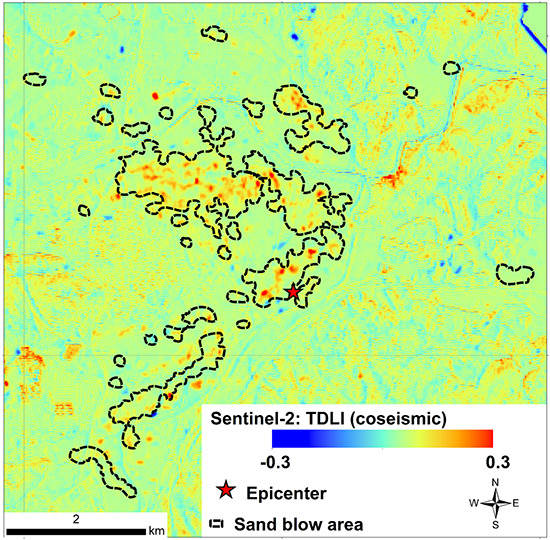
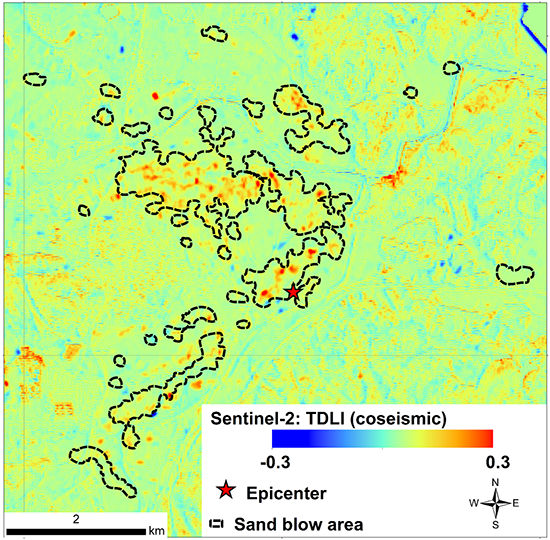
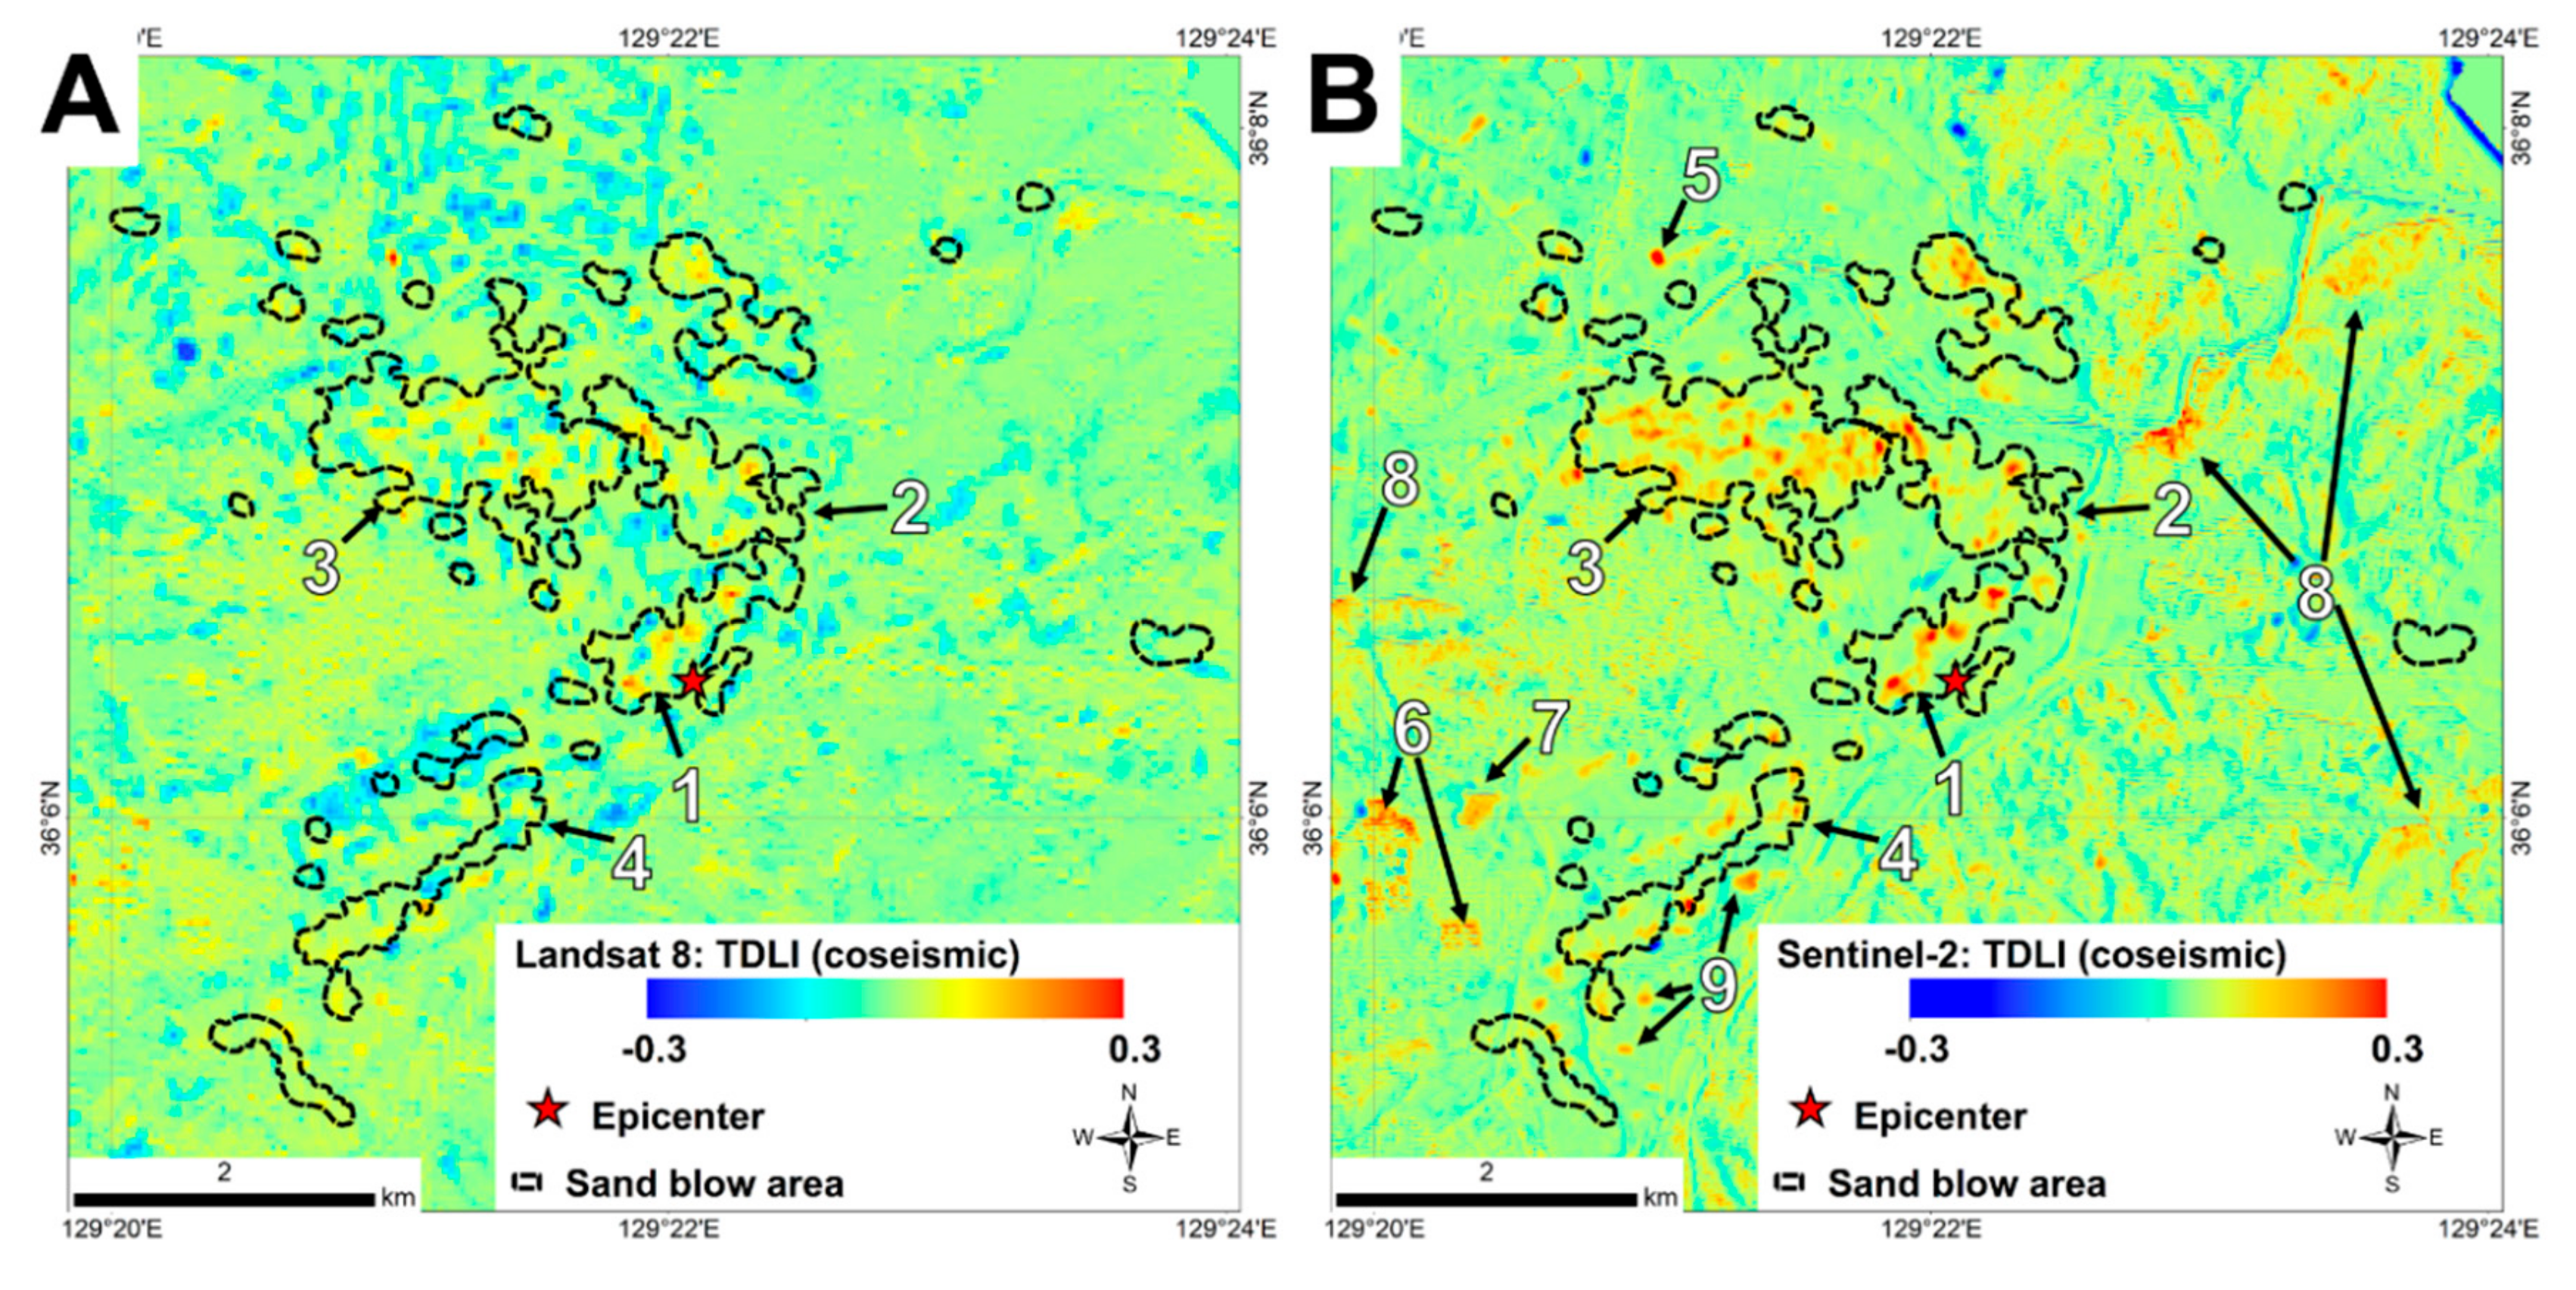
Figure 6 shows the results of the TDLI mapping. A higher index value (red pixels) indicates a larger increase in moisture content on the surface. The TDLI of Landsat 8 (Figure 6a) shows a high index value in the sand blow region (Nos. 1–3) due to liquefaction phenomena. The TDLI of Landsat 8 seemed to be similar to the mNDWI difference of Landsat 8 (Figure 5e) but shows a clearer change in water content due to liquefaction in the sand blow zone (Nos. 2 and 3). Figure 6b shows the TDLI of Sentinel-2, displaying an increase in water content due to liquefaction in the sand blow areas (Nos. 1–3) more clearly than the NDWI differences from Sentinel-2 (Figure 5b,d,f). In the TDLI of Landsat 8, the water content decreased in some parts of the liquefaction-derived sand blow region. This was also seen in the NDWI difference using Landsat 8 (Figure 5a,c,e), and this was likely due to the 16-day temporal resolution. The temporal resolution of Landsat 8 made it difficult to accurately detect surface liquefaction due to the earthquake. On the other hand, since the Sentinel-2 image pair had a 5-day interval, it had a great advantage in detecting liquefaction phenomena, which only remain on the surface for a short time. From a spatial point of view, Ghim et al. [3] found that the subcircular-type sand blow of the Pohang earthquake had diameters of 0.3–22 m and the linear type sand blow had lengths of 0.2–70 m (average 5.44 m). Thus, most of the sand blows corresponded to having a subpixel size in Landsat 8 images (30-m resolution), which were mixed with other signals from the surface, resulting in a low detection rate for the TDLI. On the other hand, Sentinel-2 has a higher resolution (20 m), which reduced signal mixing and increased the detection quality. In the TDLI of Sentinel-2, high index values appeared in the shadow area due to high-rise apartments (No. 6) or forest terrain (No. 8). It is considered that noise was caused by a change in the sun’s azimuth angle or geometric correction errors between the Sentinel-2 A/B image pairs, which may lead to a high rate of false alarms for liquefaction detection.
Table 3 shows the detection accuracy at field-observed sand blow points (Figure 1, yellow circles). The detection accuracy is the ratio of the pixels detected as sand blows (pixel values bigger than the threshold) among the sand blows identified through the field survey. The NDWIMcFeeters difference method in Landsat 8 showed the highest detection accuracies of 99.387 and 82.822% for thresholds 0 and 0.025, respectively, but it showed the low detection accuracy from thresholds 0.050 to 0.150. As shown in Figure 5c, these results overestimated the detection accuracy because the pixel value of the entire study area was mostly positive. TDLI showed the highest liquefaction detection accuracy in both Landsat 8 and Sentinel-2 images compared with the NDWI difference methods. In addition, the Sentinel-2 TDLI had a higher detection accuracy than the Landsat 8 TDLI, which was the result of Sentinel-2’s higher temporal and spatial resolution. We also applied TDLI using the Sentinel-2 SWIR-1 band that is used in typical NDWIs as an alternative TDLI. Its detection accuracy was 88.344% (threshold 0) to 7.566% (threshold 0.150), which was lower than the proposed SWIR-2 band TDLI (95.501% to 11.247%, respectively). This result is thought to be due to the surface environment in which soil was more dominant over vegetation.
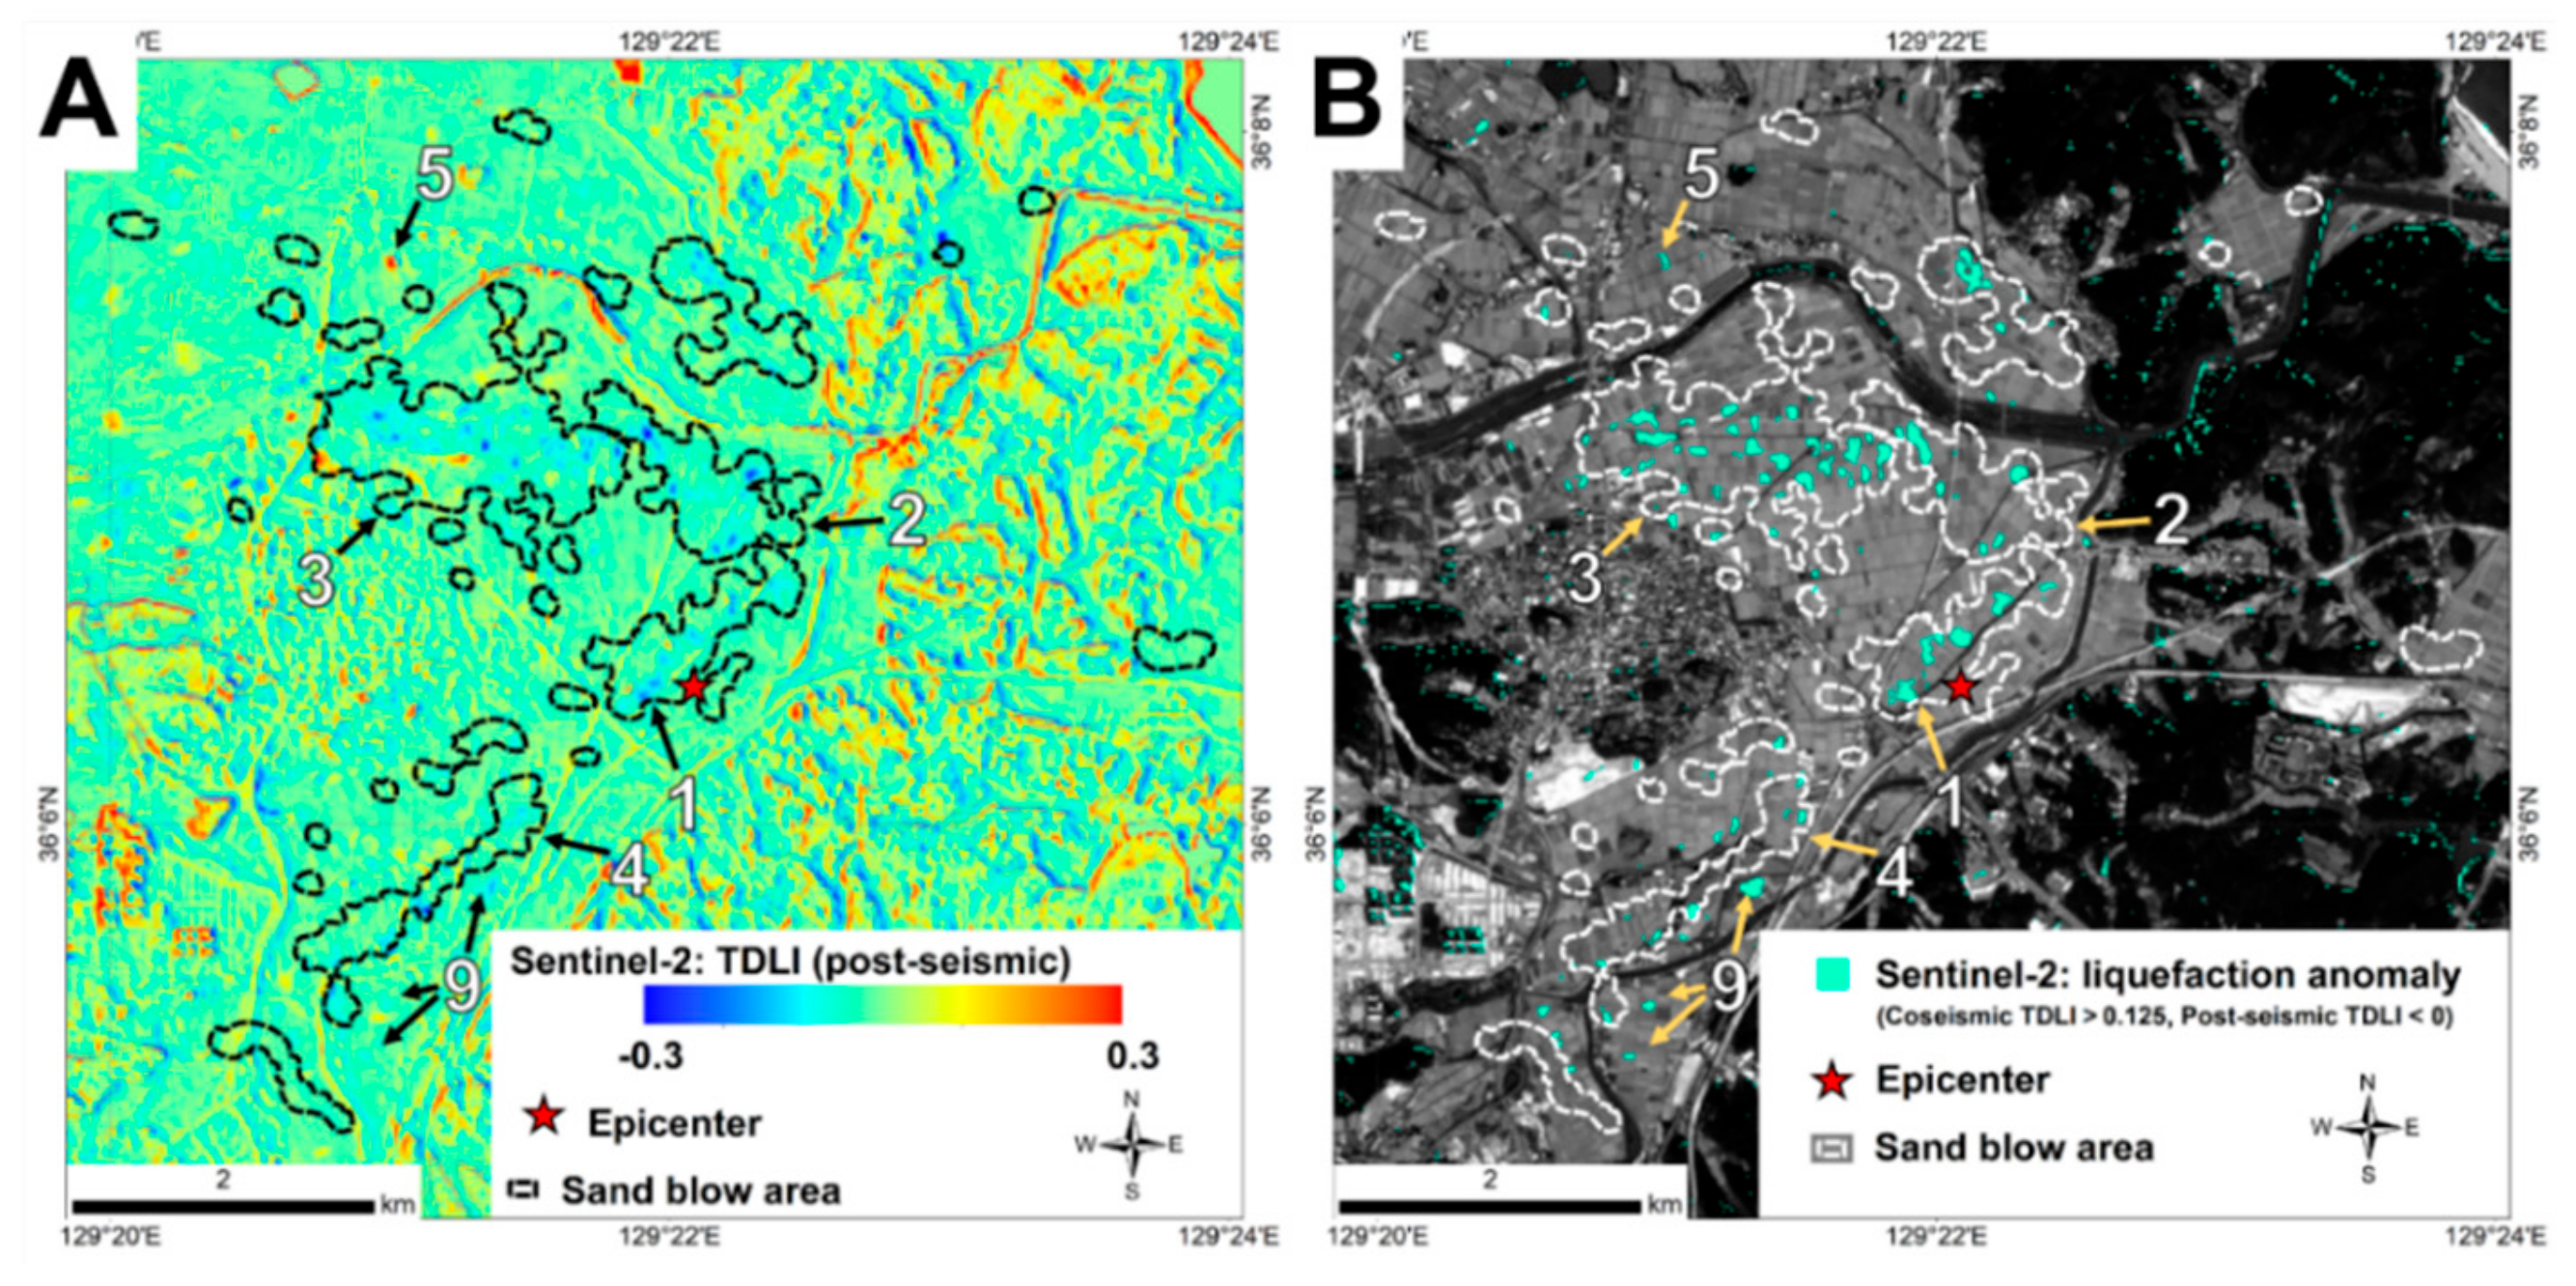
Figure 7 shows the TDLI of Sentinel-2 images from 16 and 21 November after the Pohang earthquake. The TDLI values were low (blue pixels) in the areas that showed high index values in the coseismic TDLI of the Sentinel-2 images (Figure 6b; Nos. 1–4). This indicated that where the water content was increased during the coseismic observation, it became significantly reduced. In other words, surface water drained rapidly from the liquefaction-damaged sites. On the other hand, the index value increased continuously at site No. 5, which was confirmed as an artificially watered rice paddy. As for the TDLI of the post-seismic Sentinel-2 pair, the high-rise apartment (No. 6) and shadow areas (No. 8) due to the forest topography still had high index values, similar to the noise in the coseismic Sentinel-2 TDLI (Figure 6b). In order to detect accurate liquefaction phenomena and reduce the shadow noise, we extracted pixels that showed both an increase in the coseismic Sentinel-2 TDLI, and a decrease in the post-seismic Sentinel-2 TDLI (Figure 7b). Although this did not completely remove all noise, it is clear that most of the liquefaction anomaly pixels appeared in the sand blow region. Some liquefaction anomalies that appeared at site No. 9, which had a circular pattern similar to the actual liquefaction anomalies, which was different to the straight-line pattern of noise. This feature likely represented a liquefaction area not confirmed by the field survey.
4. Conclusions
In this study, we applied SAR and optical image analysis techniques to provide liquefaction detection and evaluated the performance. Coherence analysis using Sentinel-1 SAR did not show the characteristics of the liquefaction surface. The NDWI time series analysis models using Landsat 8 and Sentinel-2 optical images confirmed liquefaction phenomena in areas nearest to the epicenter but could not accurately detect other liquefaction-affected areas. Conventional NDWI techniques have been developed for the detection of water in vegetation or open water, which is limited to detecting changes to surfaces that underwent liquefaction. We proposed and evaluated the TDLI, a time series analysis method using only one SWIR band at 2200 nm, which is the most sensitive band to the increase of soil and vegetation water content. TDLI outperformed other techniques that detected the major sand blow areas derived from liquefaction (Nos. 1–3), and Sentinel-2 TDLI showed more accurate results than Landsat 8 TDLI. Sentinel-2 has a higher spatial and temporal resolutions than Landsat 8, which was advantageous for detecting liquefaction phenomena with a short retention time. The short revisit period was also important for TDLI to prevent the intervention of other factors, such as precipitation during the sensing interval that limited application of the proposed method. In addition, since Sentinel-2 has a higher spatial resolution than Landsat 8, the detection accuracy was improved by reducing the signal mixing of sand blow, which was mostly sub-pixel size. The results of the TDLI analysis using Sentinel-2 images confirmed that the false detection of liquefaction may occur close to high-rise buildings or areas of steep slope shadow. Additional studies to remove this noise and further experiments on other liquefaction areas and weather conditions will be needed. Nevertheless, the liquefaction detection technique using Sentinel-2 images with a high temporal and spatial resolution can help to quickly investigate liquefaction damage and provide relief.
Author Contributions
Conceptualization, H.B. and Y.-S.S.; methodology, H.B.; validation, H.B. and Y.-S.S.; investigation, H.B.; writing—original draft preparation, H.B.; writing—review and editing, Y.-S.S.; visualization, H.B.; supervision, K.-E.K.; Project administration, K.-E.K.
Funding
This research was supported by the Basic Research Project (Project No. 19-3211-1) of the Korea Institute of Geoscience and Mineral Resources (KIGAM), funded by the Ministry of Science and ICT, Republic of Korea.
Conflicts of Interest
The authors declare no conflict of interest.
References
- Choi, J.H.; Ko, K.; Gihm, Y.S.; Cho, C.S.; Lee, H.; Song, S.G.; Bang, E.S.; Lee, H.J.; Bae, H.K.; Kim, S.W. Surface Deformations and Rupture Processes Associated with the 2017 Mw 5.4 Pohang, Korea, Earthquake. Bull. Seismol. Soc. Am. 2019, 109, 756–769. [Google Scholar] [CrossRef]
- Chini, M.; Albano, M.; Saroli, M.; Pulvirenti, L.; Moro, M.; Bignami, C.; Falcucci, E.; Gori, S.; Modoni, G.; Pierdicca, N. Coseismic liquefaction phenomenon analysis by COSMO-SkyMed: 2012 Emilia (Italy) earthquake. Int. J. Appl. Earth Obs. Geoinf. 2015, 39, 65–78. [Google Scholar] [CrossRef]
- Gihm, Y.S.; Kim, S.W.; Ko, K.; Choi, J.-H.; Bae, H.; Hong, P.S.; Lee, Y.; Lee, H.; Jin, K.; Choi, S. Paleoseismological implications of liquefaction-induced structures caused by the 2017 Pohang earthquake. Geosci. J. 2018, 871–880. [Google Scholar] [CrossRef]
- Ishitsuka, K.; Tsuji, T.; Matsuoka, T. Detection and mapping of soil liquefaction in the 2011 Tohoku earthquake using SAR interferometry. Earth Planets Space 2012, 64, 22. [Google Scholar] [CrossRef]
- Gupta, R.; Saraf, A.; Chander, R. Cover Discrimination of areas susceptible to earthquake-induced liquefaction from Landsat data. Int. J. Remote Sens. 1998, 19, 569–572. [Google Scholar] [CrossRef]
- Yusuf, Y.; Matsuoka, M.; Yamazaki, F. Damage assessment after 2001 Gujarat earthquake using Landsat-7 satellite images. J. Indian Soc. Remote Sens. 2001, 29, 17–22. [Google Scholar] [CrossRef]
- Saraf, A.; Sinvhal, A.; Sinvhal, H.; Ghosh, P.; Sarma, B. Satellite data reveals 26 January 2001 Kutch earthquake-induced ground changes and appearance of water bodies. Int. J. Remote Sens. 2002, 23, 1749–1756. [Google Scholar] [CrossRef]
- Ramakrishnan, D.; Mohanty, K.; Nayak, S.; Chandran, R.V. Mapping the liquefaction induced soil moisture changes using remote sensing technique: An attempt to map the earthquake induced liquefaction around Bhuj, Gujarat, India. Geotech. Geol. Eng. 2006, 24, 1581–1602. [Google Scholar] [CrossRef]
- Sengar, S.S.; Kumar, A.; Ghosh, S.K.; Wason, H.R.; Roy, P.S. Liquefaction identification using class-based sensor independent approach based on single pixel classification after 2001 Bhuj, India earthquake. J. Appl. Remote Sens. 2012, 6, 063531. [Google Scholar]
- Oommen, T.; Baise, L.G.; Gens, R.; Prakash, A.; Gupta, R.P. Documenting earthquake-induced liquefaction using satellite remote sensing image transformations. Environ. Eng. Geosci. 2013, 19, 303–318. [Google Scholar] [CrossRef]
- Zhu, J.; Baise, L.G.; Koch, M. Mapping earthquake induced liquefaction surface effects from the 2011 Tohoku earthquake using satellite imagery. In Proceedings of the IEEE International Geoscience and Remote Sensing Symposium (IGARSS), Beijing, China, 10–15 July 2016; pp. 2328–2331. [Google Scholar]
- Matsuoka, M.; Yamazaki, F. Use of satellite SAR intensity imagery for detecting building areas damaged due to earthquakes. Earthq. Spectra 2004, 20, 975–994. [Google Scholar] [CrossRef]
- Stramondo, S.; Bignami, C.; Chini, M.; Pierdicca, N.; Tertulliani, A. Satellite radar and optical remote sensing for earthquake damage detection: Results from different case studies. Int. J. Remote Sens. 2006, 27, 4433–4447. [Google Scholar] [CrossRef]
- Chini, M.; Piscini, A.; Cinti, F.R.; Amici, S.; Nappi, R.; DeMartini, P.M. The 2011 Tohoku (Japan) Tsunami Inundation and Liquefaction Investigated Through Optical, Thermal, and SAR Data. IEEE Geosci. Remote Sens. Lett. 2013, 10, 347–351. [Google Scholar] [CrossRef]
- Bowers, S.A.; Hanks, R. Reflection of Radiant Energy from Soils. Ph.D. Thesis, Kansas State University, Manhattan, KS, USA, 1971. [Google Scholar]
- Gao, B.-C. NDWI—A normalized difference water index for remote sensing of vegetation liquid water from space. Remote Sens. Environ. 1996, 58, 257–266. [Google Scholar] [CrossRef]
- Wang, L.; Qu, J.J. NMDI: A normalized multi-band drought index for monitoring soil and vegetation moisture with satellite remote sensing. Geophys. Res. Lett. 2007, 34. [Google Scholar] [CrossRef]
- Chavez, P.S. Image-based atmospheric corrections-revisited and improved. Photogramm. Eng. Remote Sens. 1996, 62, 1025–1035. [Google Scholar]
- Louis, J.; Debaecker, V.; Pflug, B.; Main-Knorn, M.; Bieniarz, J.; Mueller-Wilm, U.; Cadau, E.; Gascon, F. Sentinel-2 sen2cor: L2a processor for users. In Proceedings of the Living Planet Symposium, Prague, Czech Republic, 9–13 May 2016; pp. 9–13. [Google Scholar]
- McFeeters, S.K. The use of the Normalized Difference Water Index (NDWI) in the delineation of open water features. Int. J. Remote Sens. 1996, 17, 1425–1432. [Google Scholar] [CrossRef]
- Xu, H. Modification of normalised difference water index (NDWI) to enhance open water features in remotely sensed imagery. Int. J. Remote Sens. 2006, 27, 3025–3033. [Google Scholar] [CrossRef]
- Tucker, C.J. Remote sensing of leaf water content in the near infrared. Remote Sens. Environ. 1980, 10, 23–32. [Google Scholar] [CrossRef]
- Ceccato, P.; Gobron, N.; Flasse, S.; Pinty, B.; Tarantola, S. Designing a spectral index to estimate vegetation water content from remote sensing data: Part 1: Theoretical approach. Remote Sens. Environ. 2002, 82, 188–197. [Google Scholar] [CrossRef]
- Chen, D.; Jackson, T.; Li, F.; Cosh, M.; Walthall, C.; Anderson, M. Estimation of vegetation water content for corn and soybeans with a normalized difference water index (NDWI) using Landsat Thematic Mapper data. In Proceedings of the IEEE International Geoscience and Remote Sensing Symposium (IGARSS), Toulouse, France, 21–25 July 2003; pp. 2853–2856. [Google Scholar]
- Curcio, J.A.; Petty, C.C. The near infrared absorption spectrum of liquid water. J. Opt. Soc. Am. 1951, 41, 302–304. [Google Scholar] [CrossRef]
- Rollin, E.; Milton, E. Processing of high spectral resolution reflectance data for the retrieval of canopy water content information. Remote Sens. Environ. 1998, 65, 86–92. [Google Scholar] [CrossRef]
- Philpot, W. Spectral reflectance of wetted soils. In Proceedings of the ASD and IEEE GRS, Art, Science and Applications of Reflectance Spectroscopy Symposium, Boulder, CO, USA, 23–25 February 2010. [Google Scholar]
- Oltra-Carrió, R.; Baup, F.; Fabre, S.; Fieuzal, R.; Briottet, X. Improvement of soil moisture retrieval from hyperspectral VNIR-SWIR data using clay content information: From laboratory to field experiments. Remote Sens. 2015, 7, 3184–3205. [Google Scholar] [CrossRef]
Figure 1.
The Sentinel-2 true color image of the Pohang earthquake (magnitude 5.4) epicenter area. The red star is the epicenter, while the white circles show the locations of sand blow identified through visible investigation using drone and satellite images taken after the earthquake, and the yellow circles show the liquefaction sand blow locations identified through a field survey [1,3]. The green circles are the locations where the photos of liquefaction seen in Figure 2 were taken.

Figure 2.
On-site photos taken on 23 November 2017. The location of each photograph is shown in Figure 1. (a)–(f) Surface liquefaction or induced sand blow. (g) Artificially watered rice paddy.
Figure 2.
On-site photos taken on 23 November 2017. The location of each photograph is shown in Figure 1. (a)–(f) Surface liquefaction or induced sand blow. (g) Artificially watered rice paddy.

Figure 3.
Changes in spectral reflectance according to moisture content in the vegetation and soil. (a) Leaf canopy [17]. (b) Newtonia silt loam [15].

Figure 4.
Coherence mapping results of Sentinel-1 C-band SAR images. The green star is the location of the epicenter and the red dashed line shows the approximate area of the sand blow associated with liquefaction. Coherence reduction areas between the pre- and post-earthquake pairs are indicated by white dashed lines. (a) Preseismic coherence (23 October–4 November). (b) Coseismic coherence (4–16 November).

Figure 5.
NDWI change mapping results. The larger the index value (red pixels), the higher the moisture content. The red star is the location of the epicenter and the black dashed lines show the approximate areas of the sand blow associated with liquefaction. (a,c,e) Difference in NDWI using Landsat 8. (b,d,f) NDWI difference using Sentinel-2.

Figure 6.
TDLI mapping results. The larger the index value (red pixels), the higher the moisture content. The red star is the location of the epicenter and the black dashed lines show the approximate areas of the sand blow associated with liquefaction. (a) Landsat 8’s TDLI (band 7). (b) Sentinel-2’s TDLI (band 12).

Figure 7.
Sentinel-2 post-seismic TDLI and detected liquefaction anomaly. (a) TDLI of a Sentinel-2 image pair after the Pohang earthquake (16 and 21 November). The red star shows the epicenter, and the black dashed lines show the liquefaction-related sand blow areas, which were confirmed using a field survey and visual analysis using aerial and satellite imagery. (b) Composite result of coseismic and post-seismic TDLI. Detected liquefaction anomalies are shown as blue-green area. White dashed lines show the field-confirmed sand blow areas.


Table 1.
Optical images used in this study.
| Satellite: Imager | Pre-Earthquake Sensing Date | Post-Earthquake Sensing Date |
|---|---|---|
| Sentinel-2A/B: MSI | 11 November | 16 November |
| Landsat 8: OLI | 31 October | 16 November |
Table 2.
Wavelength (λ) and spatial resolution (Res.) of the Landsat 8 and Sentinel-2 bands.
| Sentinel-2 (MSI) | |||||||
|---|---|---|---|---|---|---|---|
| Band | λ (nm) | Res. (m) | Band | λ (nm) | Res. (m) | ||
| 1 | Coastal aerosol | 433–453 | 30 | 1 | Coastal aerosol | 433–453 | 60 |
| 2 | Blue | 450–515 | 30 | 2 | Blue | 458–523 | 10 |
| 3 | Green | 525–600 | 30 | 3 | Green | 543–578 | 10 |
| 4 | Red | 630–680 | 30 | 4 | Red | 650–680 | 10 |
| - | 5 | Red edge 1 | 698–713 | 20 | |||
| - | 6 | Red edge 2 | 733–748 | 20 | |||
| - | 7 | Red edge 3 | 773–793 | 20 | |||
| 5 | Near infrared (NIR) | 845–885 | 30 | 8 | Near infrared (NIR) | 785–900 | 10 |
| - | 8a | NIR-narrow | 855–875 | 20 | |||
| - | 9 | Water vapor | 935–955 | 60 | |||
| 9 | Cirrus | 1360–1390 | 30 | 10 | Cirrus | 1360–1390 | 60 |
| 6 | SWIR 1 | 1560–1660 | 30 | 11 | SWIR 1 | 1565–1655 | 20 |
| 7 | SWIR 2 | 2100–2300 | 30 | 12 | SWIR 2 | 2100–2280 | 20 |
| 8 | Panchromatic | 500–680 | 15 | - | |||
Table 3.
Detection accuracy of each methodology at pixels of field-observed sand blows.
| Threshold | Detection Accuracy (%) | |||||||
|---|---|---|---|---|---|---|---|---|
| Landsat 8 | Sentinel-2 | |||||||
| NDWI Difference | TDLI | NDWI Difference | TDLI | |||||
| Gao | McFeeters | mNDWI | Gao | McFeeters | mNDWI | |||
| 0.000 | 21.881 | 99.387 | 63.190 | 73.211 | 58.282 | 42.536 | 50.716 | 95.501 |
| 0.025 | 8.793 | 82.822 | 32.106 | 56.237 | 26.380 | 15.542 | 26.789 | 75.665 |
| 0.050 | 2.658 | 36.401 | 14.928 | 35.583 | 10.634 | 3.885 | 8.793 | 53.579 |
| 0.075 | 0.613 | 7.975 | 6.544 | 19.018 | 4.090 | 0.204 | 3.681 | 37.832 |
| 0.100 | 0.000 | 0.818 | 3.272 | 10.634 | 2.658 | 0.000 | 1.227 | 26.789 |
| 0.125 | 0.000 | 0.204 | 1.227 | 5.521 | 0.818 | 0.000 | 0.409 | 18.200 |
| 0.150 | 0.000 | 0.000 | 0.613 | 2.249 | 0.409 | 0.000 | 0.000 | 11.247 |
© 2019 by the authors. Licensee MDPI, Basel, Switzerland. This article is an open access article distributed under the terms and conditions of the Creative Commons Attribution (CC BY) license (http://creativecommons.org/licenses/by/4.0/).
Share and Cite
MDPI and ACS Style
Baik, H.; Son, Y.-S.; Kim, K.-E. Detection of Liquefaction Phenomena from the 2017 Pohang (Korea) Earthquake Using Remote Sensing Data. Remote Sens. 2019, 11, 2184. https://0-doi-org.brum.beds.ac.uk/10.3390/rs11182184
AMA Style
Baik H, Son Y-S, Kim K-E. Detection of Liquefaction Phenomena from the 2017 Pohang (Korea) Earthquake Using Remote Sensing Data. Remote Sensing. 2019; 11(18):2184. https://0-doi-org.brum.beds.ac.uk/10.3390/rs11182184
Chicago/Turabian StyleBaik, Hyunseob, Young-Sun Son, and Kwang-Eun Kim. 2019. "Detection of Liquefaction Phenomena from the 2017 Pohang (Korea) Earthquake Using Remote Sensing Data" Remote Sensing 11, no. 18: 2184. https://0-doi-org.brum.beds.ac.uk/10.3390/rs11182184
Note that from the first issue of 2016, this journal uses article numbers instead of page numbers. See further details here.