Article

Extracting Khmer Rouge Irrigation Networks from Pre-Landsat 4 Satellite Imagery Using Vegetation Indices

1
Department of Geography, Kent State University, Kent, OH 44240, USA
2
Center for Urban Environmental Research and Education, University of Maryland, Baltimore County, Baltimore, MD 21250, USA
3
Department of Geography, College of Arts and Sciences, Kent State University, P.O. Box 5190, Kent, OH 44242-0001, USA
*
Author to whom correspondence should be addressed.
Remote Sens. 2019, 11(20), 2397; https://0-doi-org.brum.beds.ac.uk/10.3390/rs11202397
Submission received: 17 August 2019 / Revised: 24 September 2019 / Accepted: 11 October 2019 / Published: 16 October 2019

Abstract

:
Often discussed, the spatial extent and scope of the Khmer Rouge irrigation network has not been previously mapped on a national scale. Although low resolution, early Landsat images can identify water features accurately when using vegetation indices. We discuss the methods involved in mapping historic irrigation on a national scale, as well as comparing the performance of several vegetation indices at irrigation detection. Irrigation was a critical component of the Communist Part of Kampuchea (CPK)’s plan to transform Cambodia into an ideal communist society, aimed at providing surplus for the nation by tripling rice production. Of the three indices used, normalized difference, corrected transformed, and Thiam’s transformed vegetation indexes, (NDVI, CTVI, and TTVI respectively), the CTVI provided the clearest images of water storage and transport. This method for identifying anthropogenic water features proved highly accurate, despite low spatial resolution. We were successful in locating and identifying both water storage and irrigation canals from the time that the CPK regime was in power. In many areas these canals and reservoirs are no longer visible, even with high resolution modern satellites. Most of the structures built at this time experienced some collapse, either during the CPK regime or soon after, however many have been rehabilitated and are still in use, in at least a partial capacity.

Graphical Abstract

1. Introduction

It is well established that Landsat and other remotely sensed imagery can be used to study land use change [1,2], agriculture [3], the impacts of climate change [4], and many other physical characteristics of the Earth’s surface. Less emphasis has been placed on using older Landsat data to apply remote sensing analyses to historical and political questions. Much as current satellite information can be used to track destruction in Syria and genocide in Myanmar [5,6,7], remote sensing techniques can be applied to older Earth observation data to enhance our understanding of political situations of the past. This paper illustrates the benefits and drawbacks of using older, relatively low-resolution satellite imagery from Landsats 1–3 to fill in gaps in the historical record. The information extracted from these images will enhance our understanding of what was (literally) happening “on the ground” during times when very little information was available to those outside of Cambodia’s borders.
The U.S. Geological Survey (USGS) and National Aeronautics and Space Administration (NASA) have been collecting satellite imagery since the first Landsat (originally named ERTS, for Earth Resources Technology Satellite) was launched in 1972 [8]. Landsats 1–3 differ from more recent satellites in spatial, spectral, and temporal resolution, as well as data quality and bit depth [9,10]. Although this presents challenges for remote sensing applications, the data from earlier Landsats are still useful for many analyses and should not be overlooked. This paper will focus on the nature of the early Landsat data used and the steps taken to prepare it.
The goal of this research was to determine the nature, extent, and relative success of all irrigation features built through forced labor during the Khmer Rouge regime, which existed in Cambodia from 1975 to 1979. We applied vegetation indices to Landsat scenes from Cambodia in 1973 and 1979 to highlight the presence of water over the entire country. By focusing on the low values in the index range, we were able to identify pixels containing canals and reservoirs. By comparing the early and later imagery we identified the water features that were built during the Khmer Rouge period. The goal first and foremost was to provide an estimate of the scale of the Khmer Rouge irrigation development that was as accurate as possible. The purpose of our survey was to answer the following questions:
How many kilometers and dikes were built, and how many new reservoirs were created during the study period?
How large of an increase was this in comparison to pre-Khmer Rouge Cambodian irrigation networks?
What was the relative success or sustainability of these irrigation features?
Our research has uncovered thousands of kilometers of canals and reservoirs that were constructed between late 1975 to 1979 [11]. Many of the smaller canal networks cannot be detected in existing satellite imagery, indicating that this tally is certainly an undercount of the features that were built at the time.

1.1. Historical Background
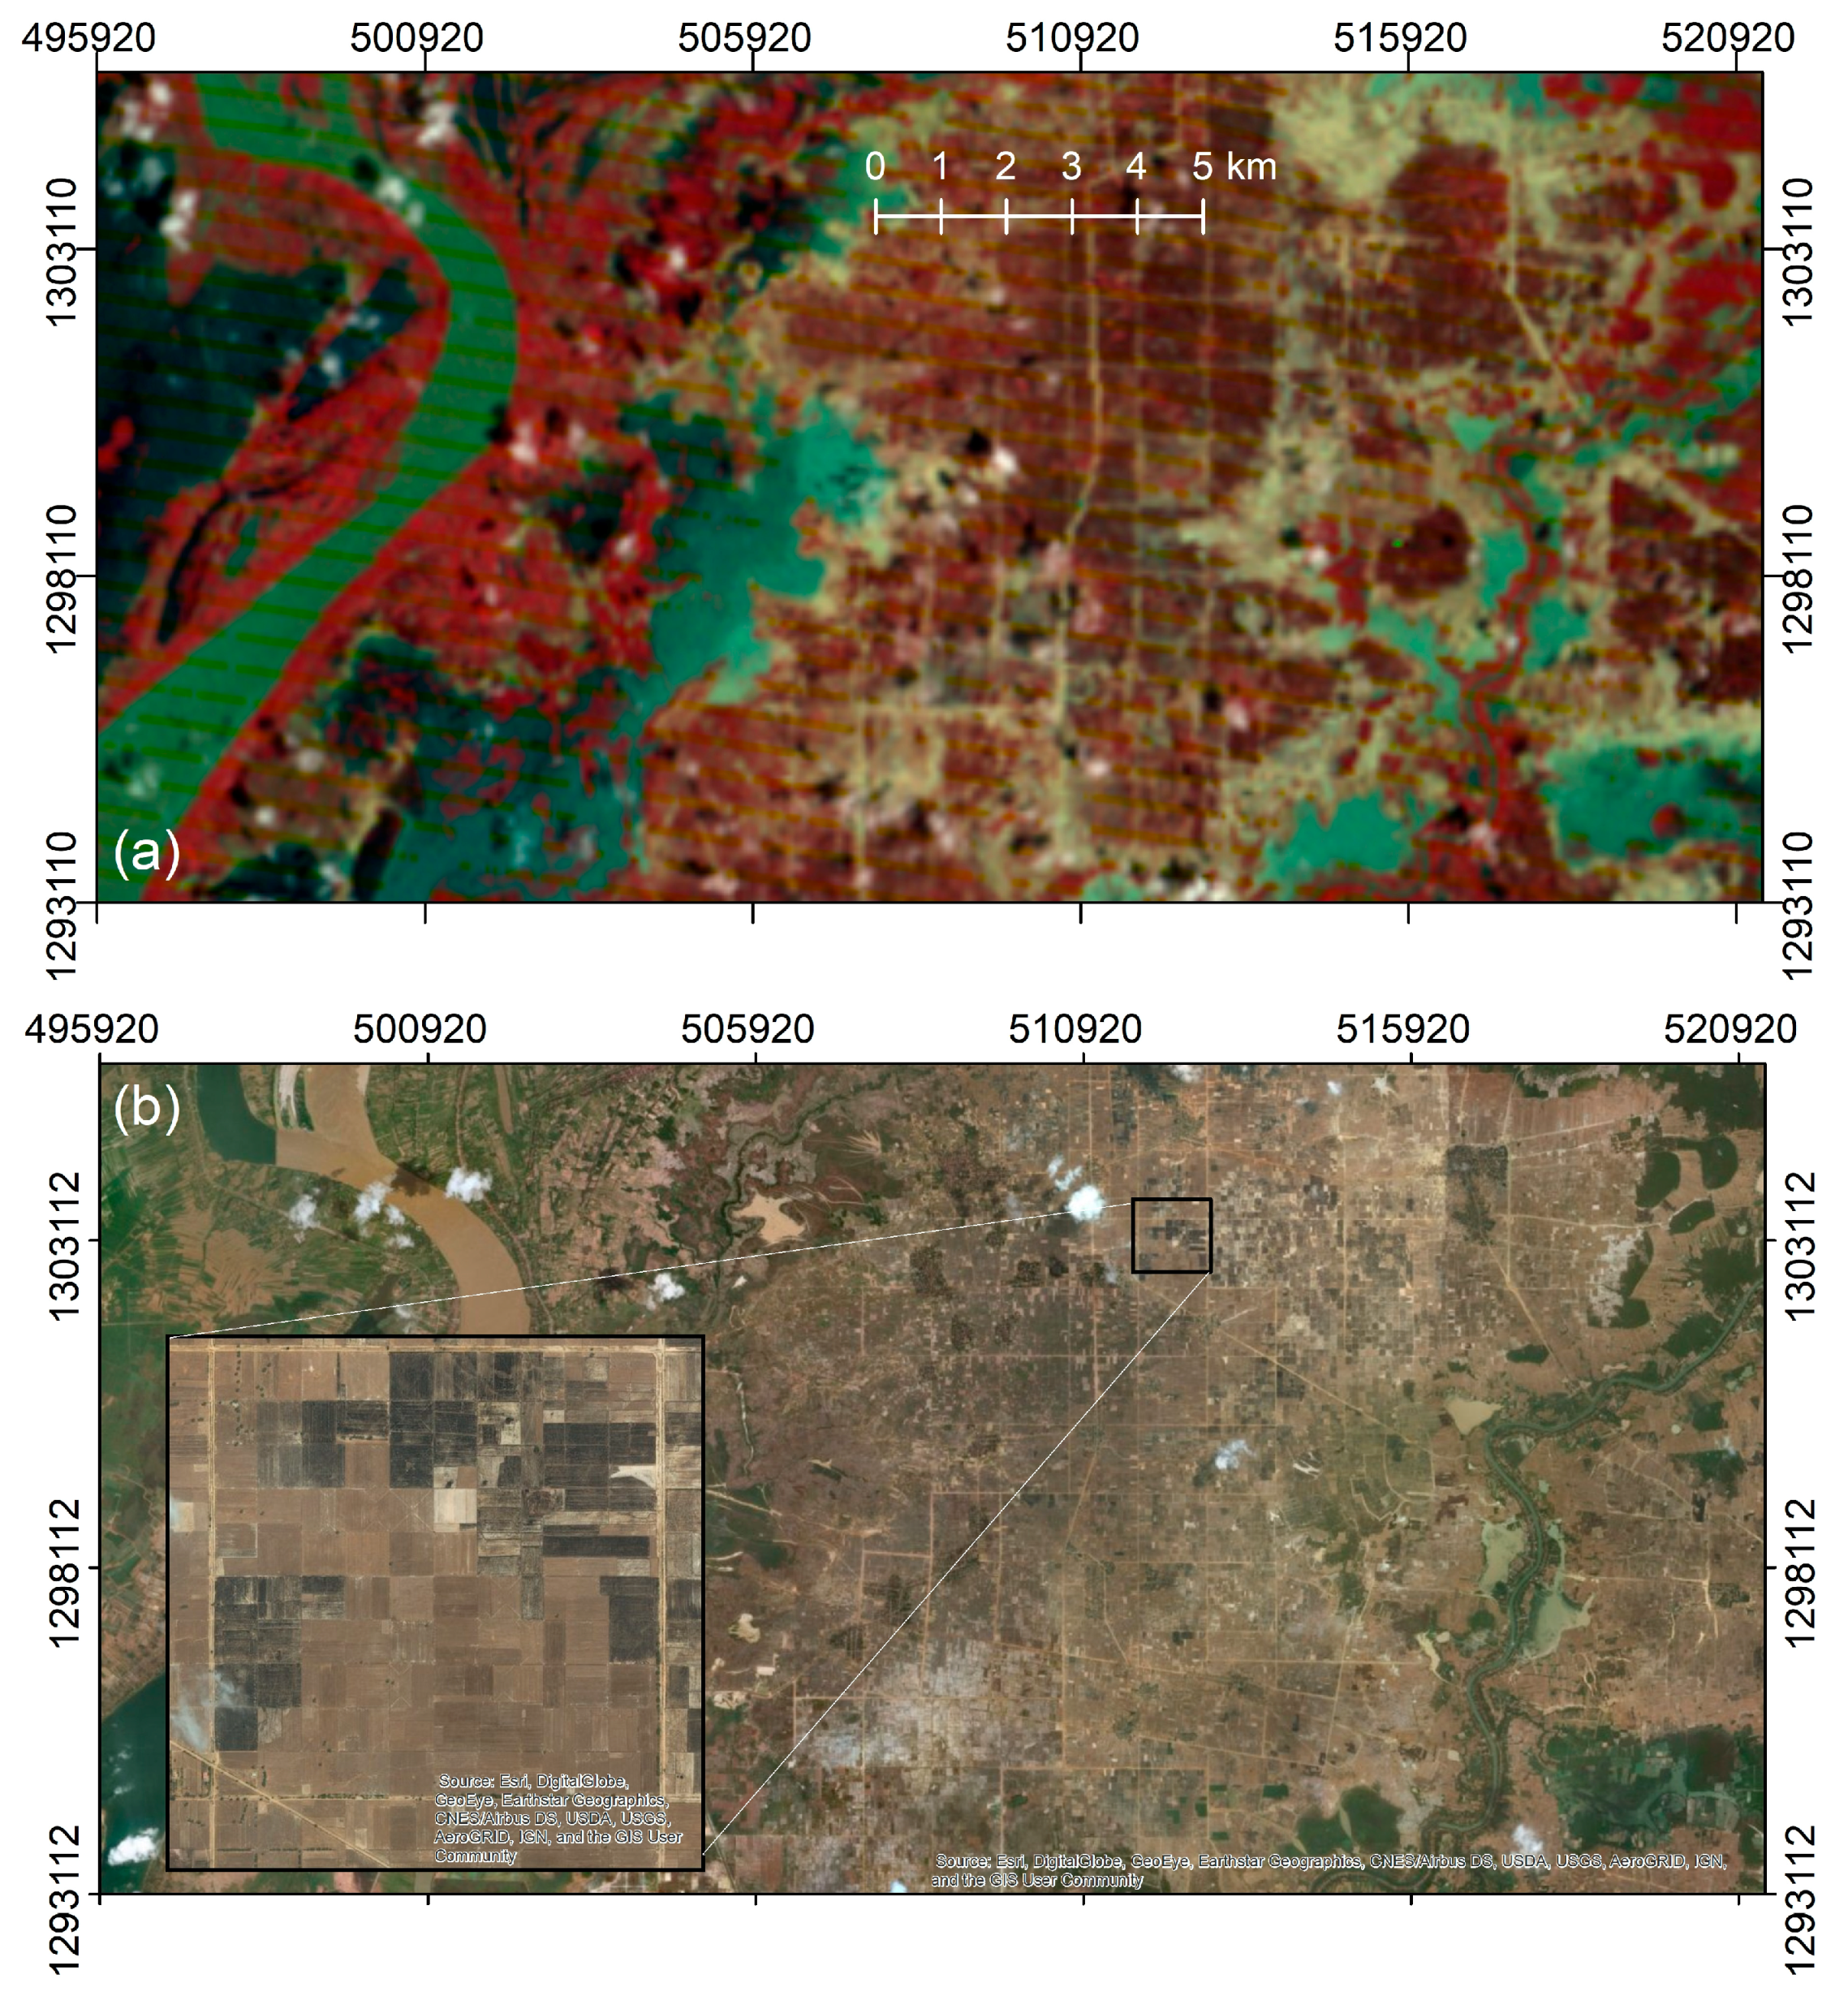
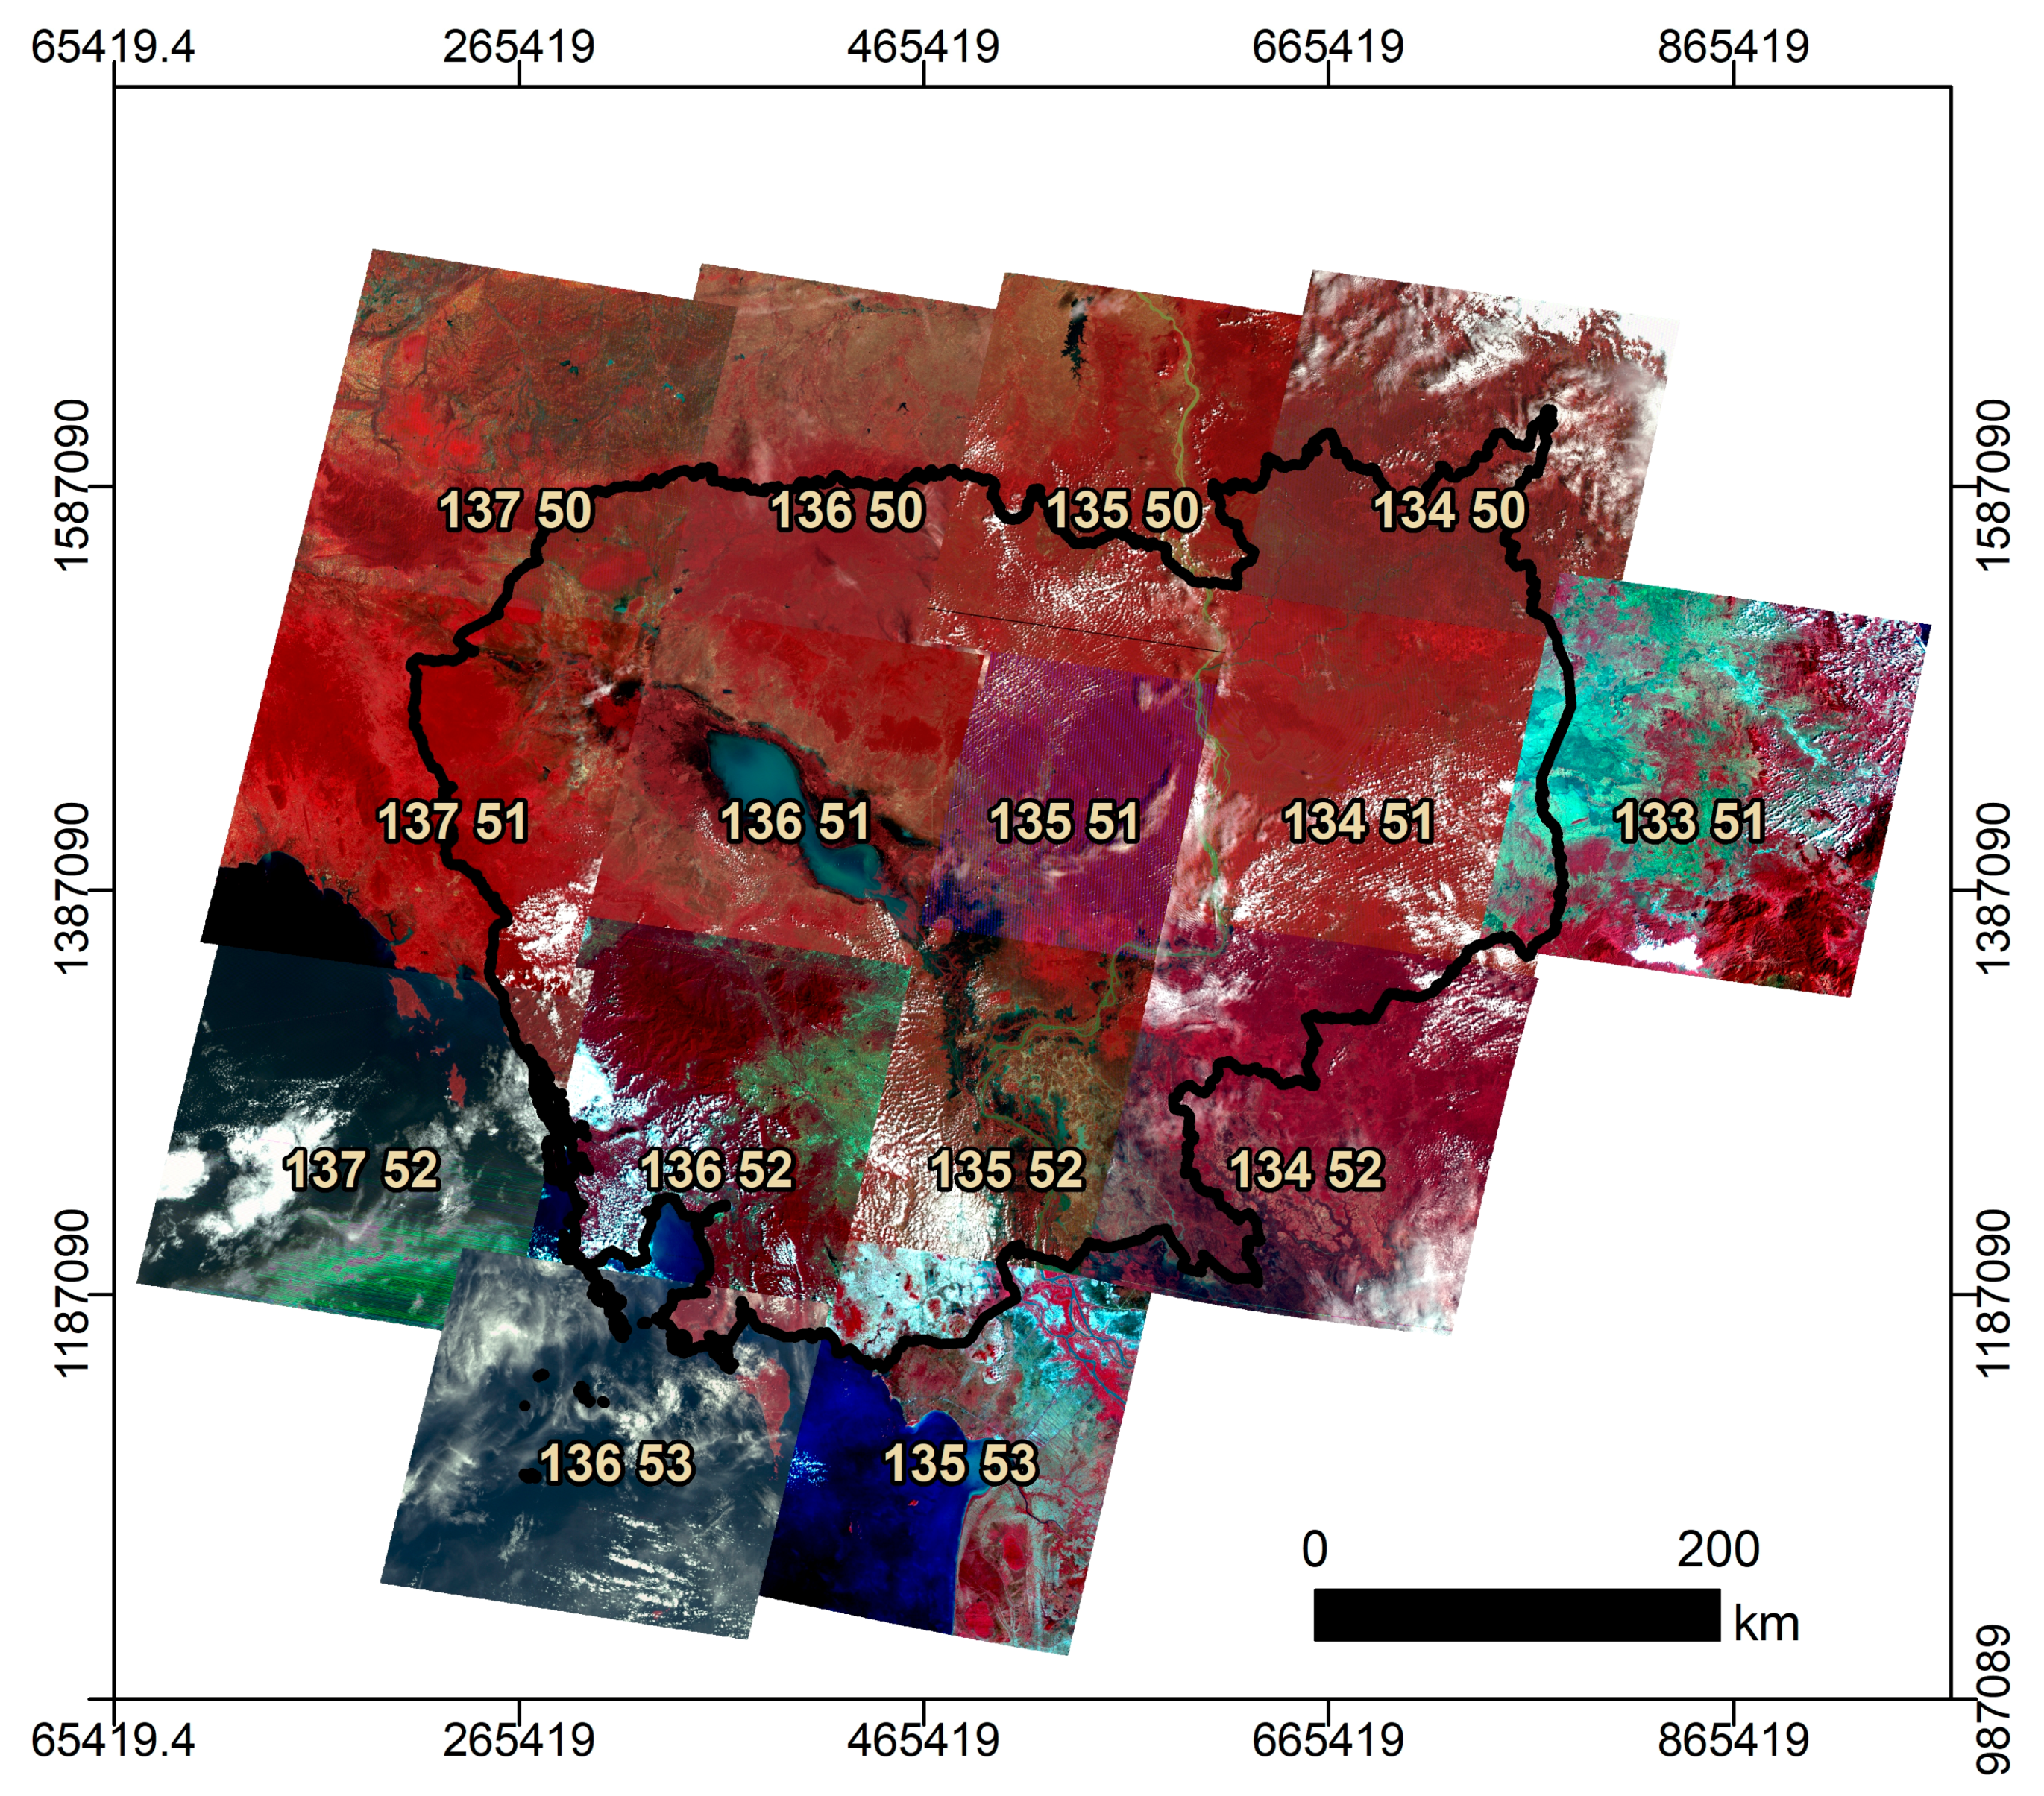
After the capture of Phnom Penh in 1975, the Khmer Rouge, otherwise known as the Communist Party of Kampuchea (CPK) began forcibly relocating the population to rural agricultural areas with the goal of tripling rice production. This would have been accomplished by expanding irrigation systems and increasing to three harvests a year instead of two. Pol Pot, the leader of the CPK, envisioned a canal network arranged in 10-km grids, each with smaller 1 × 1 km canal grids nested inside them (Figure 1a,b) and each again with 100 m × 100 m grids nested inside them. In this way, the entire country could be supplied with water for rice [12,13,14]. This process of canal and dam building was implemented in multiple locations at the same time. Many structures were built quickly, by hand, without heavy equipment or expertise in the field [15].
Many claims about the extent and effectiveness of Khmer Rouge irrigation schemes reiterate the standard total view (STV) put forth by Michael Vickery. This view generalizes the performance of Khmer Rouge government control and of the Khmer Rouge irrigation development as connected symptoms of a poorly managed regime doomed to failure [15,16,17,18]. Repeated flooding of the landscape over the past 40 years has eroded the traces of many canals on the landscape, and continuous agriculture combined with current increases in development and deforestation all work towards erasing the sites that remain. No geospatial inventory of the structures built during that time period has been previously undertaken [11].
The success or failure of these structures and the role their failure played in the overall failure of the CPK regime has until now been a subject of much supposition and debate unsupported by field observation or physical evidence. While previous inventories of the irrigation infrastructure have been conducted by multiple sources [19,20,21], these have focused on repairing and expanding the existing irrigation structures and the nature of water governance [19,22,23,24]. Conclusions about the effectiveness and success of the Khmer Rouge irrigation plan cannot be definitively made without a systematic, country-wide survey of the irrigation projects completed during the Khmer Rouge regime. Satellite remote sensing, although in its infancy at the time, recorded the landscape during this period and provides rich opportunity for analysis of the state of Cambodian irrigation networks both before and after the Khmer Rouge development. While current studies focus on rehabilitating what remains, our study has found that even more dams, dikes, and canals were built that are nearly invisible today, but appear clearly in the 1970s imagery. This study demonstrates that it is well worth putting in the effort to extend analysis back into earlier data sets. Using data collected from Landsats 1–3, combined with ground survey and personal interviews, we created a database of irrigation structures constructed in Cambodia during the time the country was under CPK control.

1.2. Study Area

Cambodia has a tropical climate dominated by two main monsoon seasons, with 88% of the precipitation for the region occurring between May and October. The majority of Cambodia is alluvial plain, with a slope of less than 1%, and sandy well drained soils. As part of the lower Mekong Watershed, the Tonle Sap River and the Tonle Sap Lake are part of a unique hydrological system that changes flow direction with the arrival of the wet monsoon season. During the flood season, the Mekong flow increases such that it forces a reversal in the flow direction of the Tonle Sap River away from the Mekong Delta and back into the Tonle Sap Lake which serves as a collection reservoir for the greater Mekong watershed. Over 50% of the sediment collected in the Upper Mekong Basin finds its way into the Tonle Sap Lake, making it a nutrient rich source for the region’s fisheries. The Tonle Sap’s annual floodwaters also provide an ideal environment for the cultivation of floating rice. Forty percent of Cambodia’s population relies on subsistence farming, mainly of rice. Only 7% of Cambodia’s agriculture relies on irrigation [25,26,27,28].

2. Materials and Methods

2.1. Satellite Data Acquisition

Satellite imagery from Landsats 1–3 was downloaded from the USGS Earth Explorer website. Landsat multispectral scanner (MSS) data was chosen as there are more datasets available than other contemporaneous forms of imagery. Landsat has moderate temporal resolution (18-day revisits for Landsat 1–3), and frequent revisits over the same area give more opportunities to gain cloud-free images.
Scenes were collected from the year 1973 to serve as “before Khmer Rouge” reference images, and scenes from the year 1979 served as the “after”.
Landsat scenes were identified by path and row as opposed to specific latitude and longitude coordinates. Fifteen individual path/row locations were required to cover the entire country of Cambodia (Figure 2). Seven of the 1973 path/row locations and five of the 1979 locations had only one usable scene.

Differences in Satellite Image Data Collection and Format
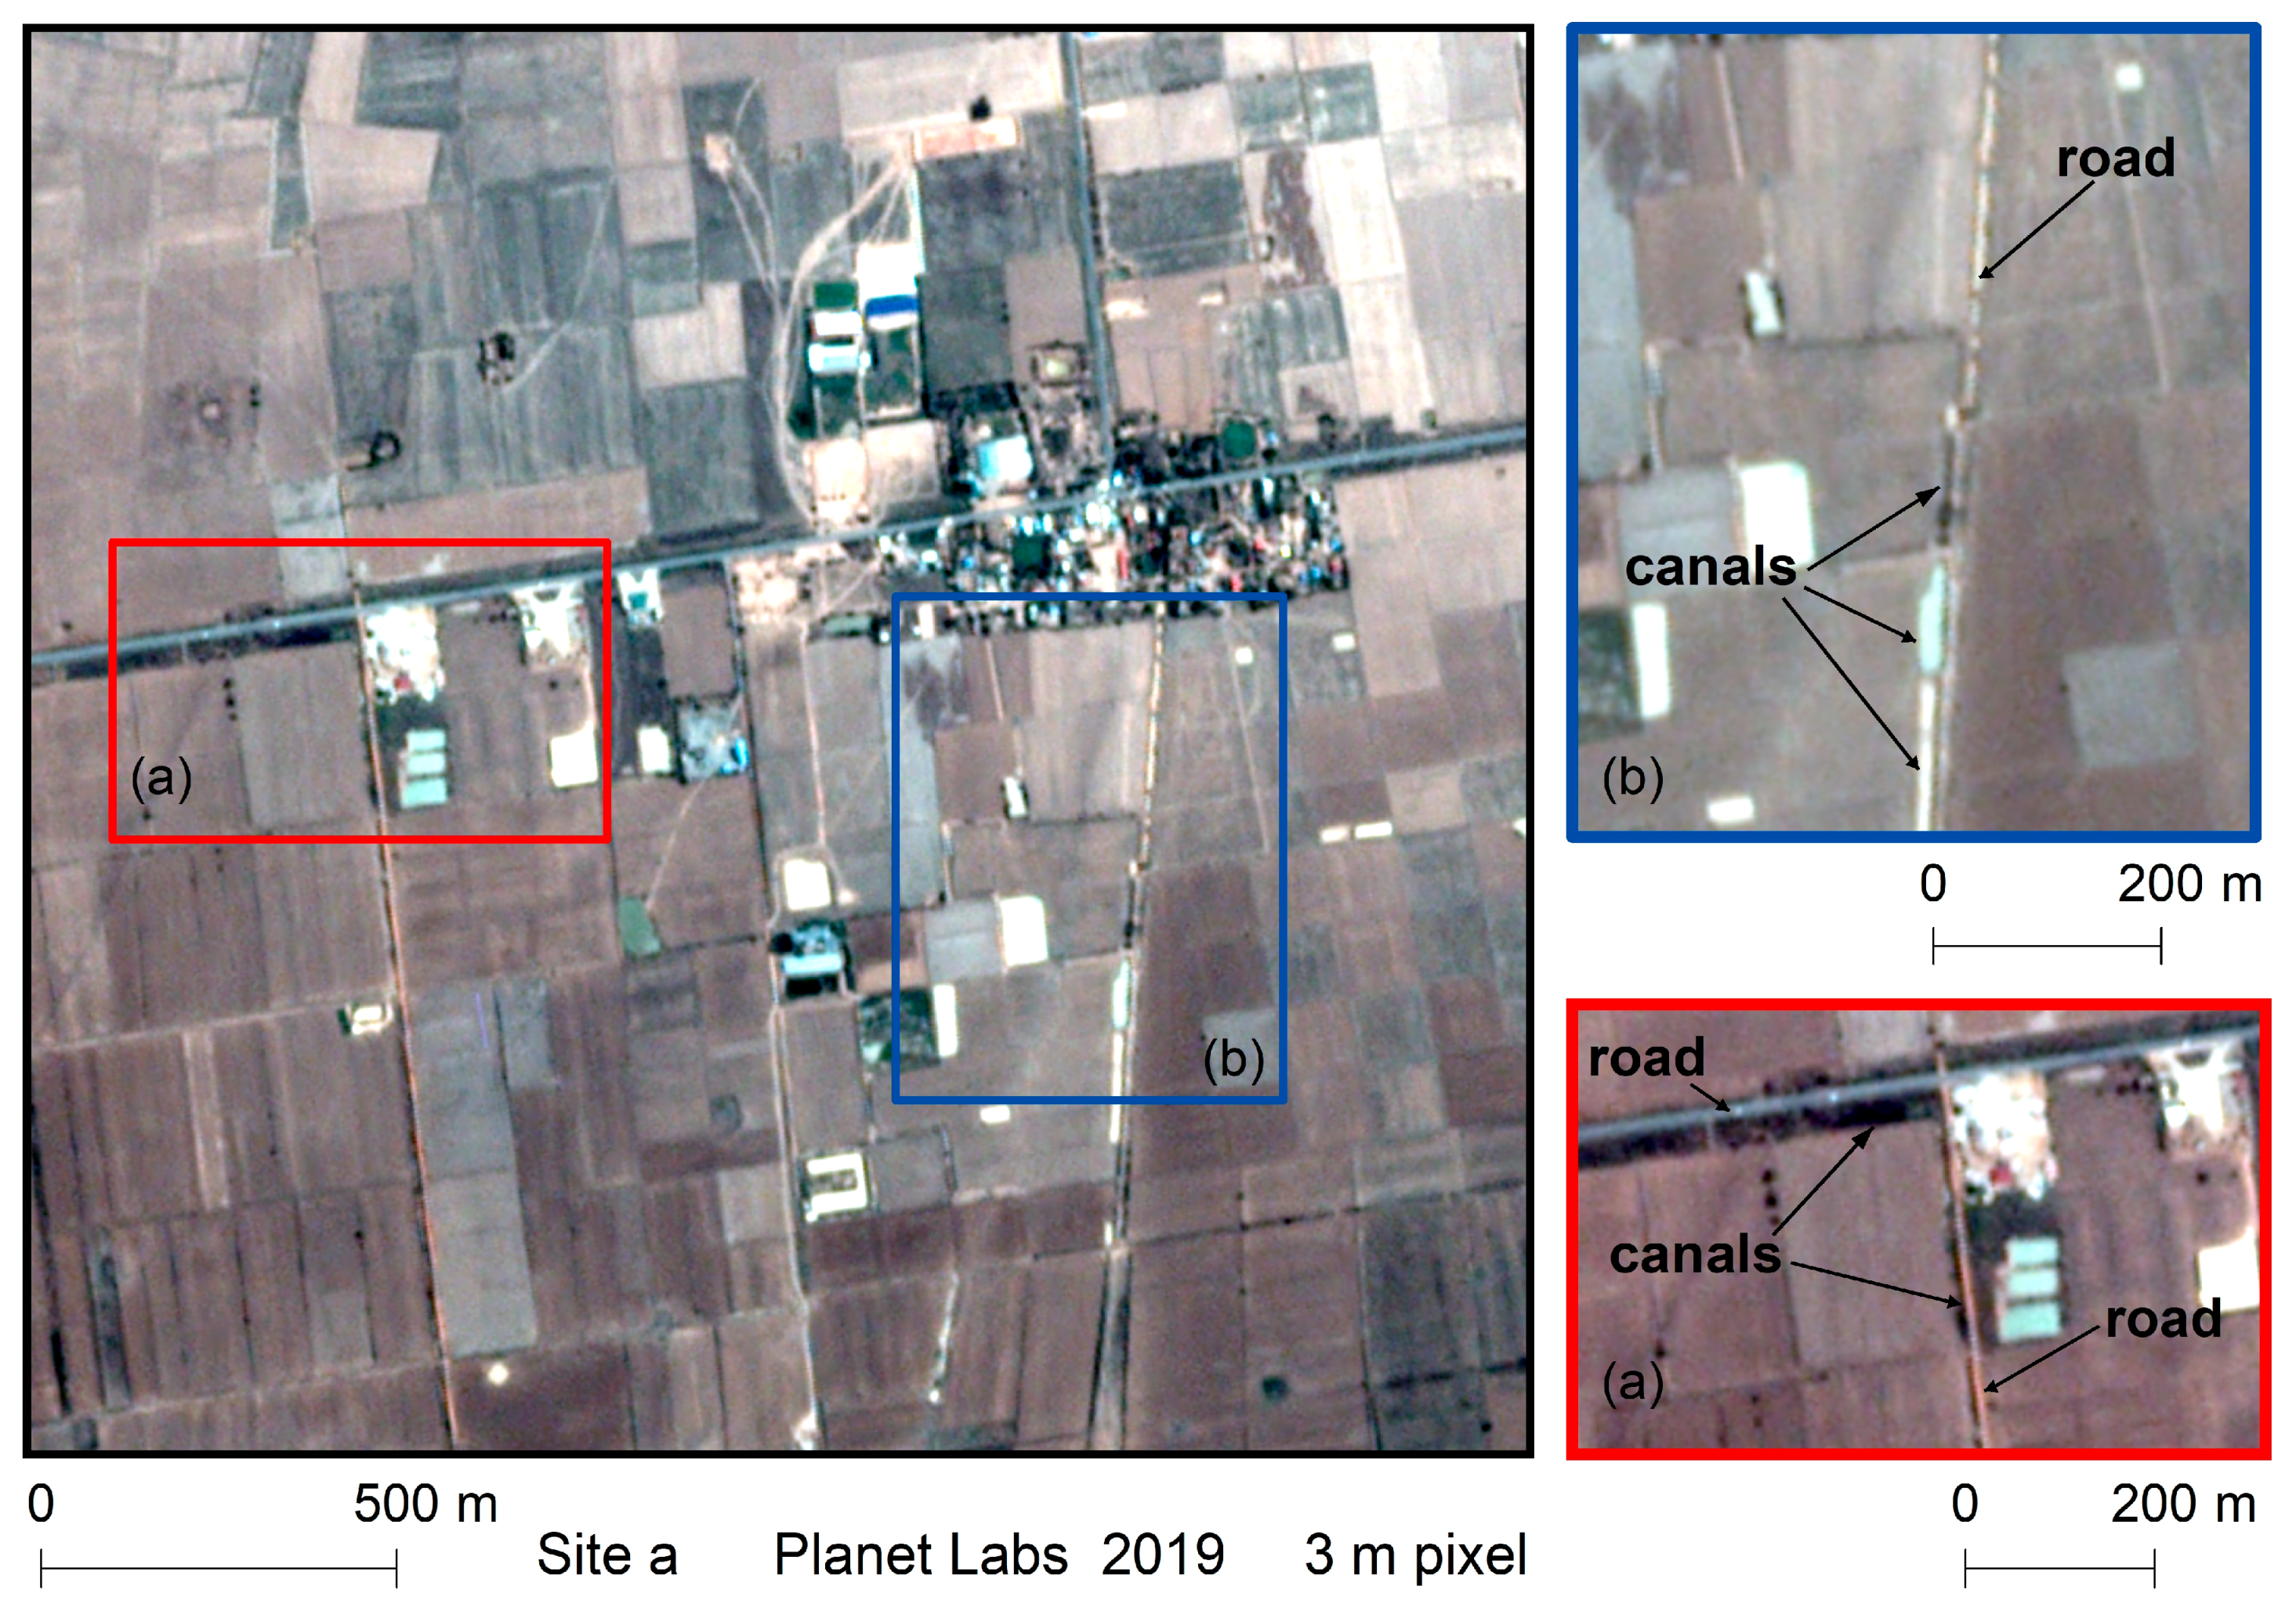
Early Landsat imagery differs from current imagery in several ways. Primarily, lower spatial resolution and the inability to collect data in the 0.45 to 0.52 micrometer bandwidth (the blue band) of the electromagnetic spectrum makes data from Landsats 1–3 incompatible with modern Landsat imagery [29]. Spectrally, the lack of a blue visible light band in the 1970s imagery prohibited true color visualization, so all images discussed were first imported into Clark Lab’s TerrSet and made into false color infrared composites. The spatial extent of Landsat 1–3 pixels also differs from later satellite imagery. Earlier Landsats collected spatial information in a 79 × 57 m pixel format, post-processed to a 60 m pixel, whereas current Landsat imagery is a standard 30 m pixel for most spectral bands. In terms of information, early Landsat scenes suffered from inconsistent data quality: band transmission errors and other causes of striping resulted in poor image quality and data dropout. Earlier imagery was collected in a four-band, eight-bit format [9,10].

2.2. Reference Data

Reference data included Google Earth imagery, ESRI basemap imagery, and primary data collected in the field. During the 2015 and 2016 field seasons a preliminary set of known irrigation locations was collected via ground survey. Points were taken at both surviving canal and dam locations and at the locations of failed, or failing and eroding structures. Interviews with local residents provided rough construction methods and dates, as well as location data for areas where irrigation structures were no longer visible on the surface. Point data and attributes were then imported into ArcMap to aid in visual recognition of irrigation features in the Landsat scenes. Once potential canals and reservoirs were identified, they were then verified by comparison with known structures in both the Landsat data sets and modern satellite imagery. Irrigation development has been a part of Cambodia’s history since before 500 A.D., and large-scale ancient irrigation systems still dominate large parts of the landscape, especially in the Siem Reap Province, home to Angkor Wat. Sources used to eliminate ancient canals from the database included maps derived from French aerial reconnaissance in the 1930s as well as recent work by Evans, Fletcher, Pottier, Kummu, and Penny [26,30,31]. Evans and Moylan’s [32] study comparing historical imagery of Angkor hydraulic networks with their modern remnants and Khmer Rouge alterations was particularly helpful.

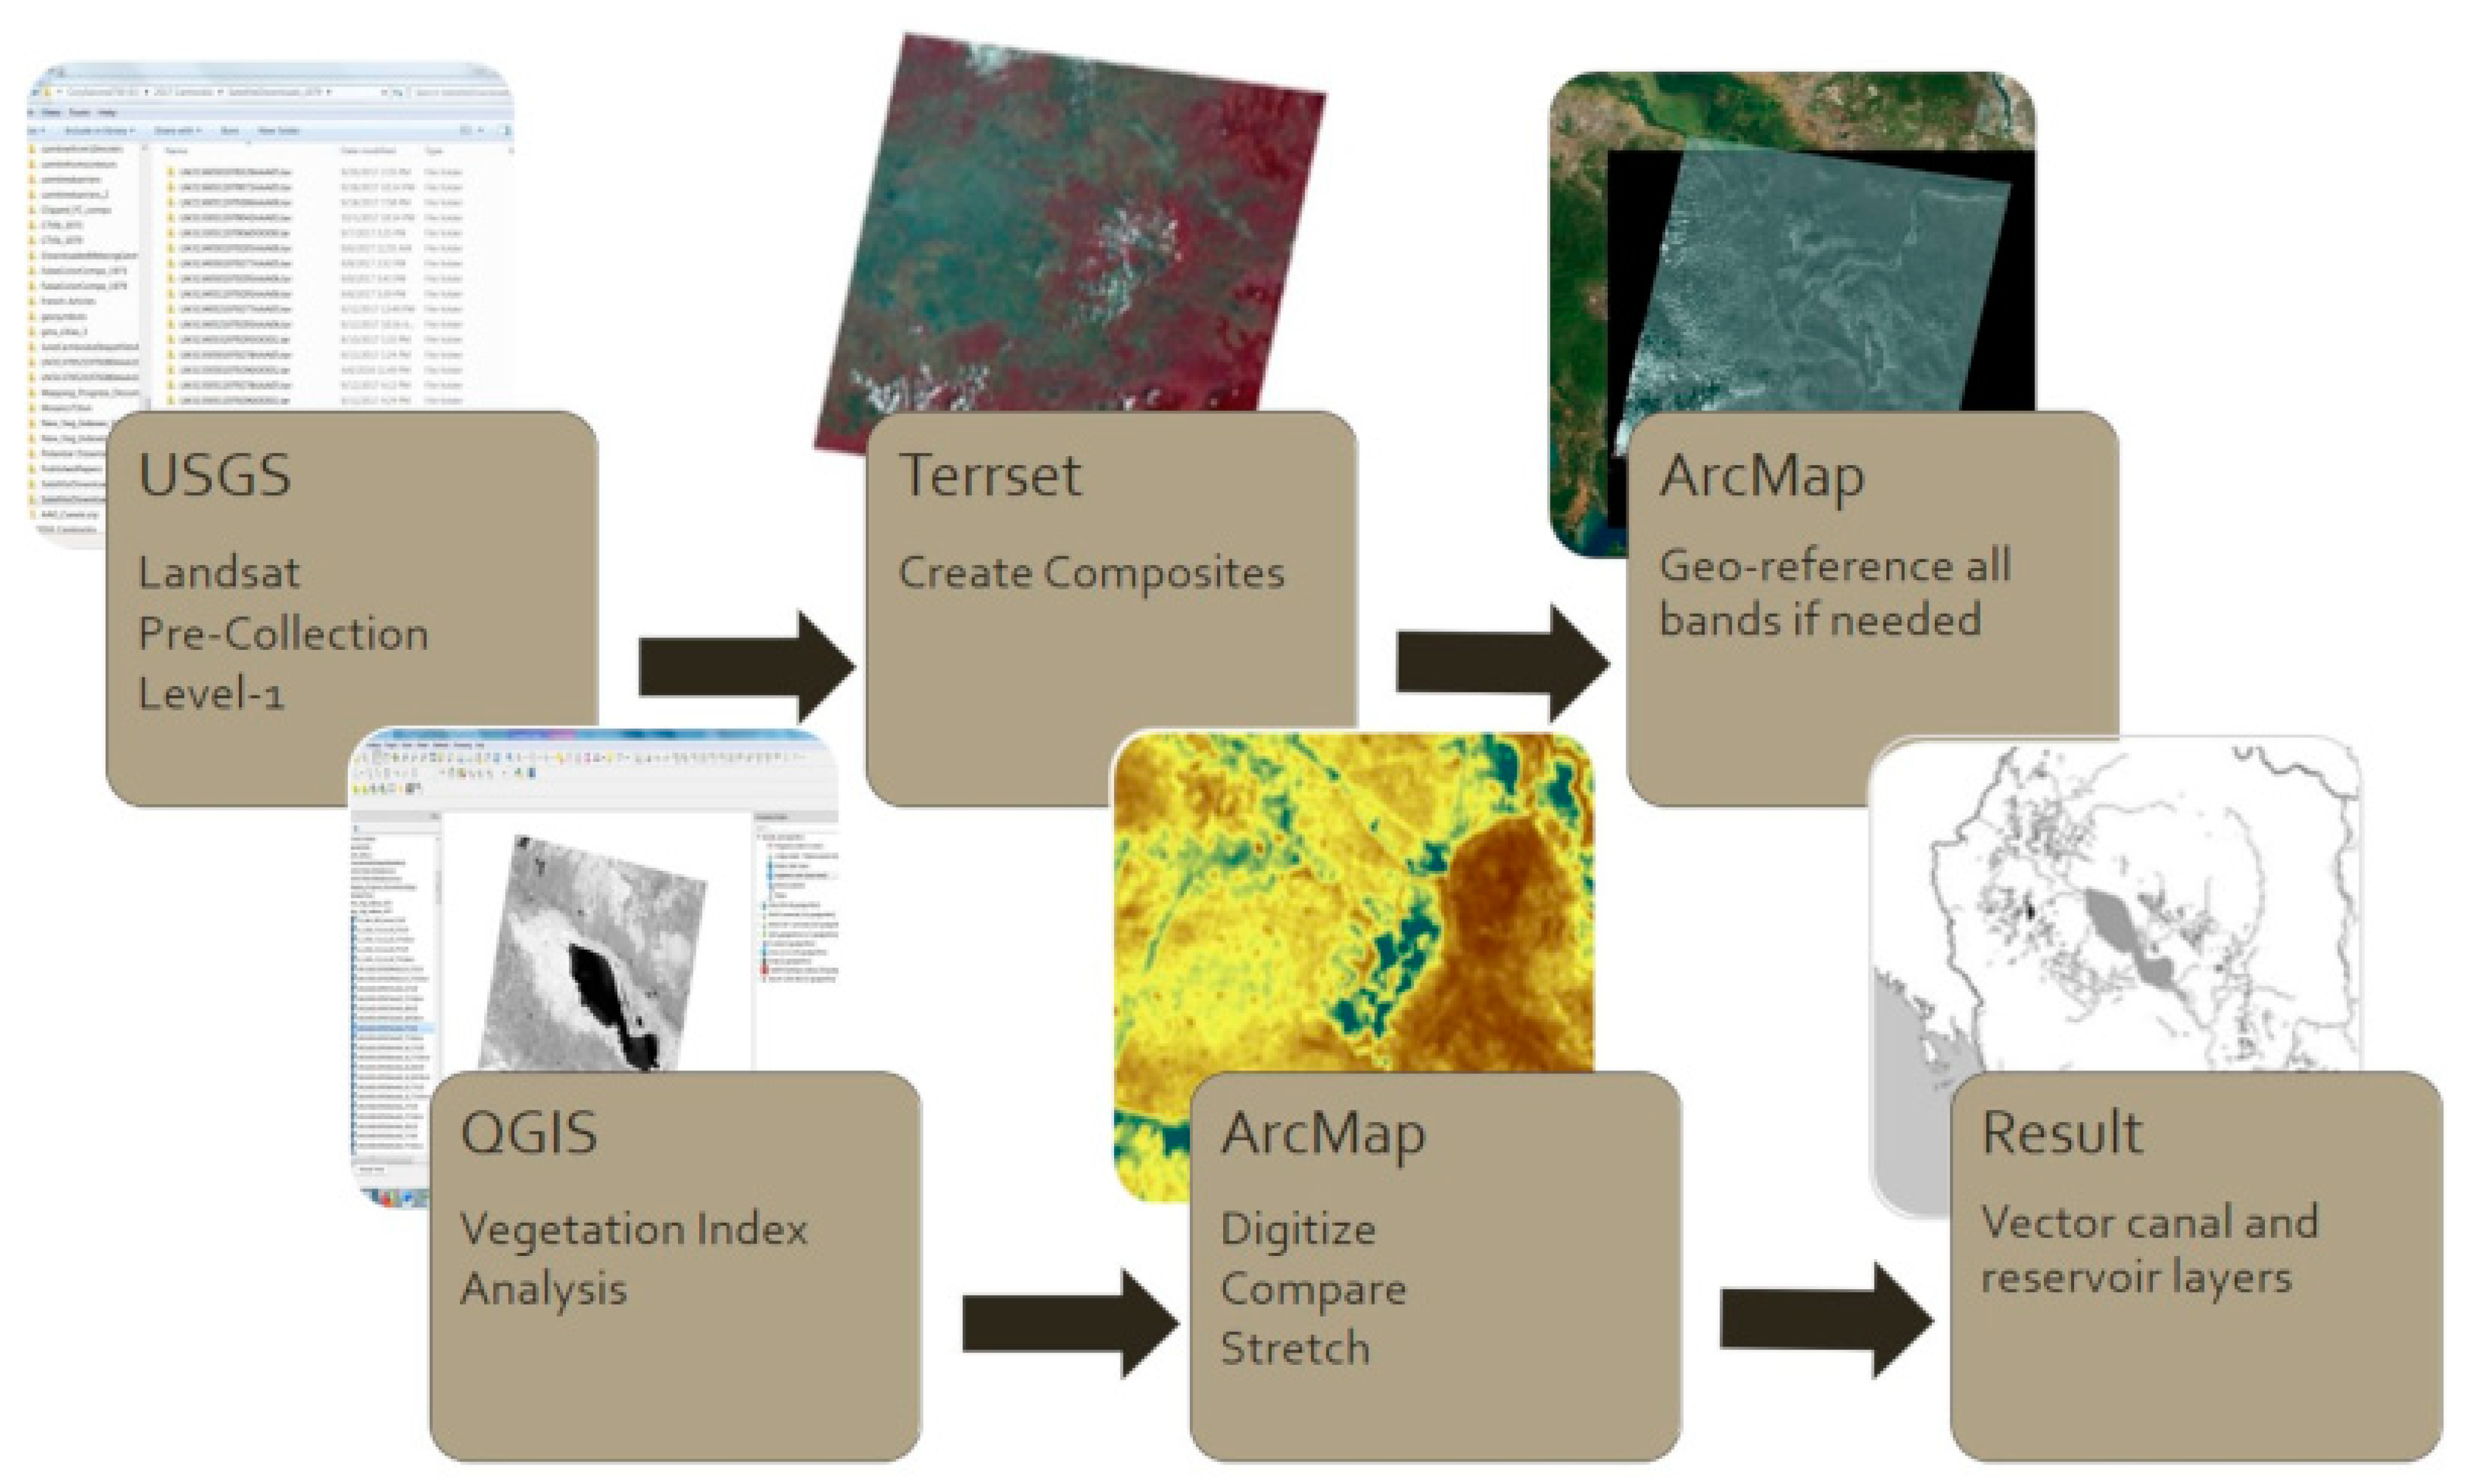
2.3. Image Processing Workflow

Since the goal of the Khmer Rouge was to create a nationwide irrigation network, the scope of our analysis needed to include the entire geographic area of Cambodia in order to calculate an estimate of the canals and water storage features constructed [14,33]. Landsat data filled that requirement, with the added advantage of having been collected during the time in question. Once acquired, the data was processed as follows in Figure 3:
  • Import all bands into Terrset. Create false color near infrared rasters to load into ArcMap.
  • Geo-reference composite images and individual bands if necessary.
  • Import near infrared (NIR) and red bands into QGIS to run multiple vegetation index algorithms.
  • Import vegetation indices into ArcMap and manually digitize water features. See figures for results.
  • Calculate total kilometers of canals and dikes built during the study period, and total number of water storage features created.
To create three-band raster composites, Terrset was chosen due to its streamlined geotiff file creation process. ArcMap’s integration of a world imagery basemap made rectifying imagery and ground truthing irrigation features more efficient. QGIS’s System for Automated GIS Analysis (SAGA) plugin, which calculated multiple vegetation indices simultaneously, sped up the image processing step and allowed more time for comparative analysis.

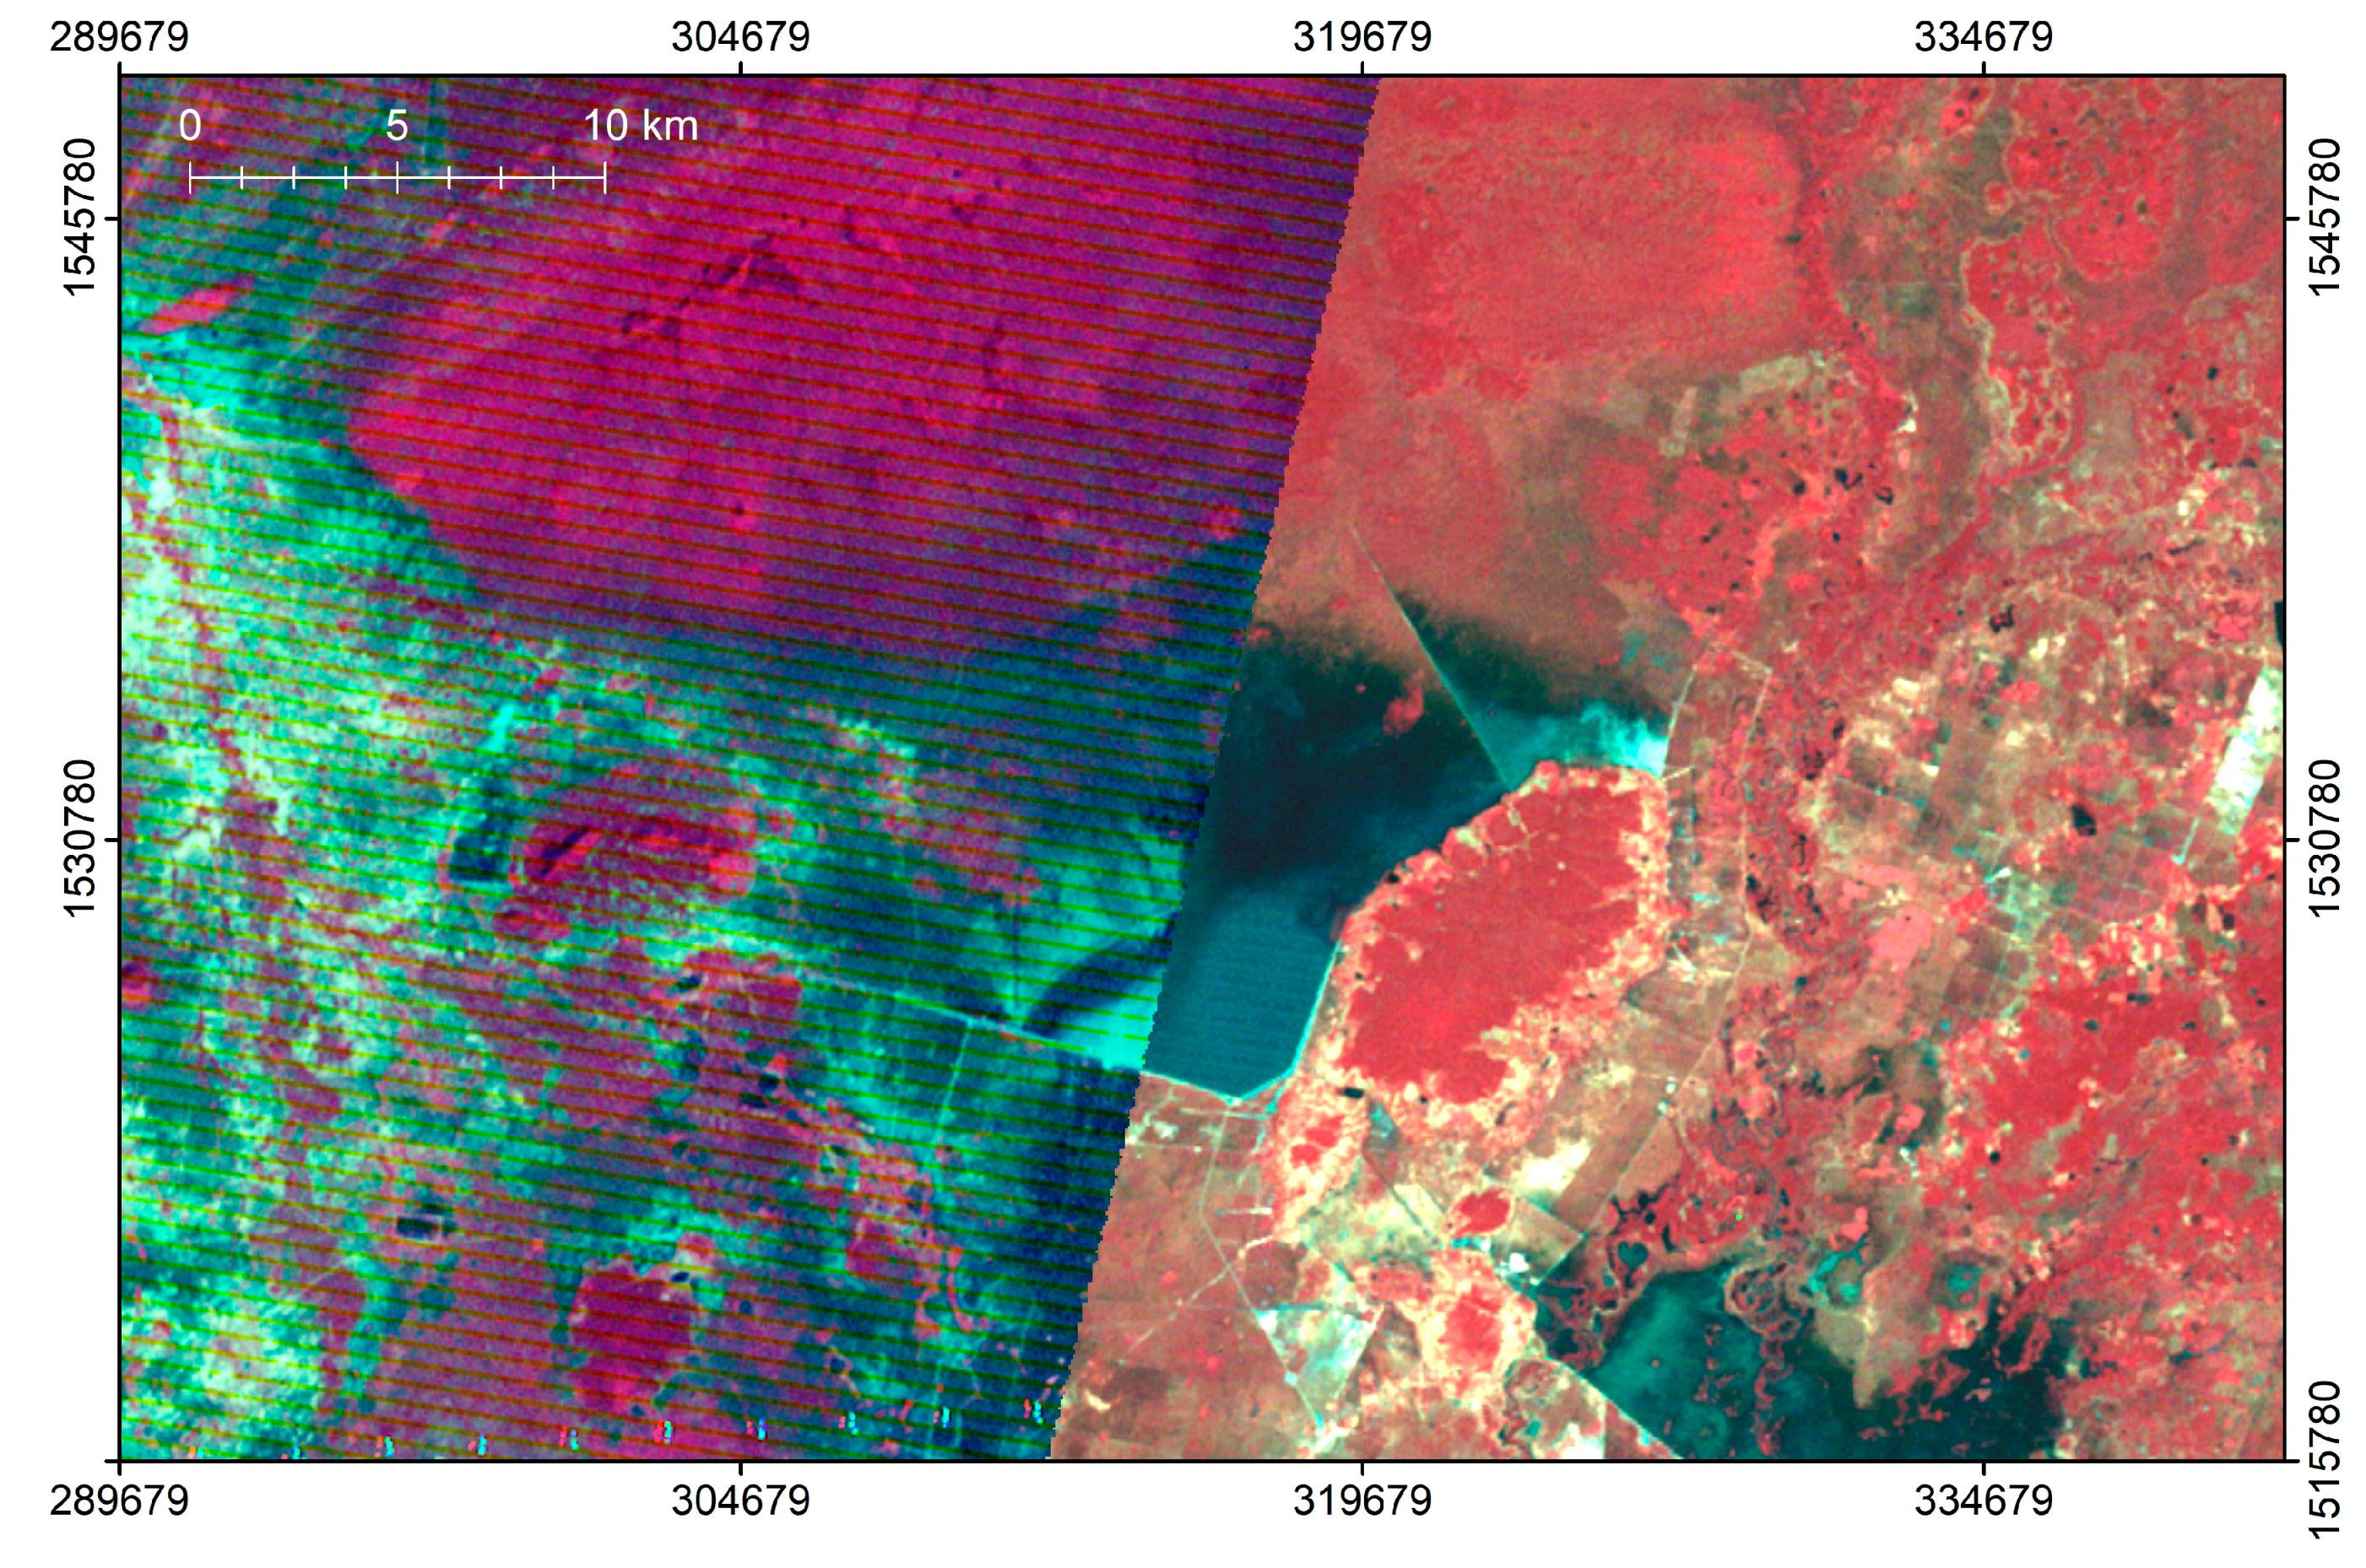
2.3.1. False Color Composites

The first step in building the image database involved filtering the images by cloud cover and image quality in TerrSet. Due to the lack of a blue band in Landsats 1–3 data, 654/RGB (false color infrared) images were created for each dataset. In this format, healthy vegetated areas appear as bright red and clear water bodies as black or dark blue due to the ability of water to absorb infrared rays [8]. At this stage, defects common to early Landsat scenes, such as data banding, were obvious. In order to maximize the cloud-free pixel area between the multiple images, all scenes were processed [34,35,36]. Cloud-free sections of an imperfect image, even if severely striped, filled in many missing data areas. In Figure 4 the left side displays a severely banded image, yet the large reservoir in the southwest is still easily visible.

2.3.2. Georeferencing Images

While Landsat scenes are processed by USGS and NASA to align with a modern coordinate system, early images do not always line up with the modern datums within a GIS. For this study, all composite images were corrected to WGS 1984 UTM zone 48 North. Reference points were created using identifiable landmarks that could be located in both the original Landsat scene and the modern ArcMap satellite imagery data and rectifying the two images [8]. Roughly 100 reference points were required to rectify each image. Cambodia’s lack of development and large forested areas made identification of common landmarks difficult, and changes to the landscape made over almost 50 years made some of the early landmarks indistinguishable. Once this process was completed for the composite image, it was repeated on all the original data bands to create a new set of four geo-referenced bands and one geo-referenced composite image. In addition to correcting spatial accuracy, this process removed extraneous “no data” cells from the raster extent. The corrected images were then used as input for vegetation difference indices.

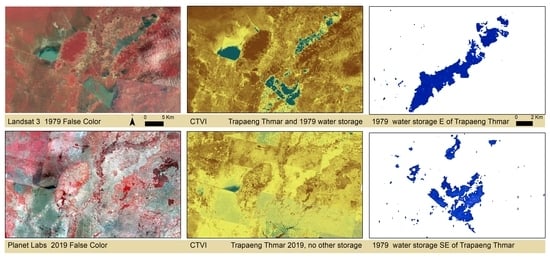
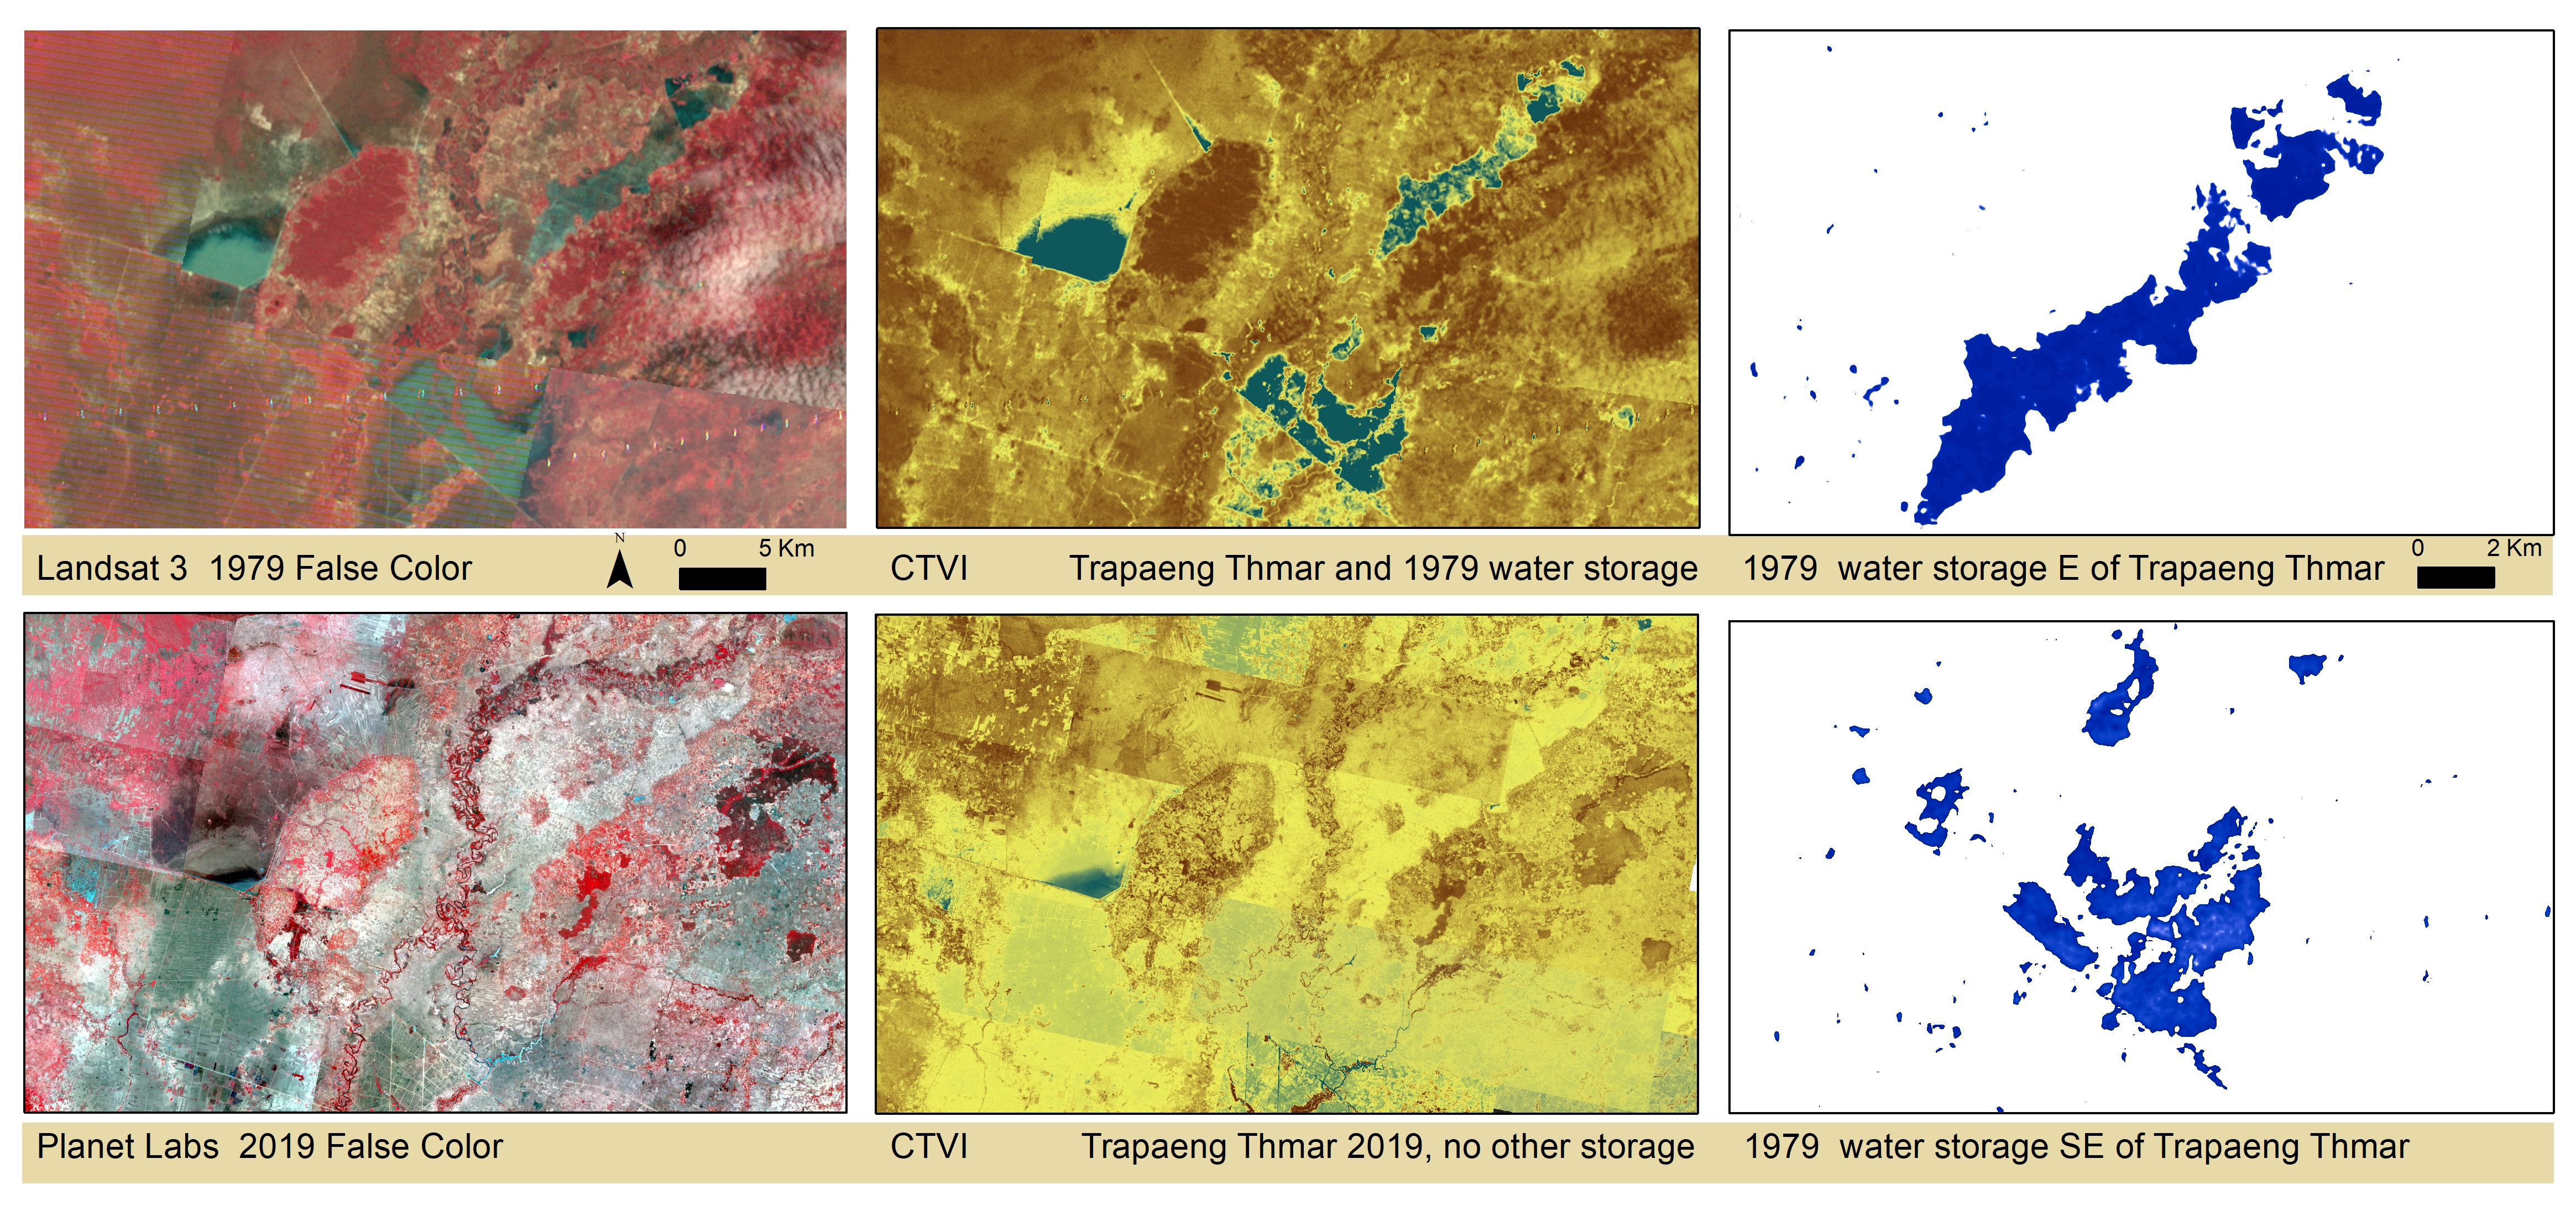
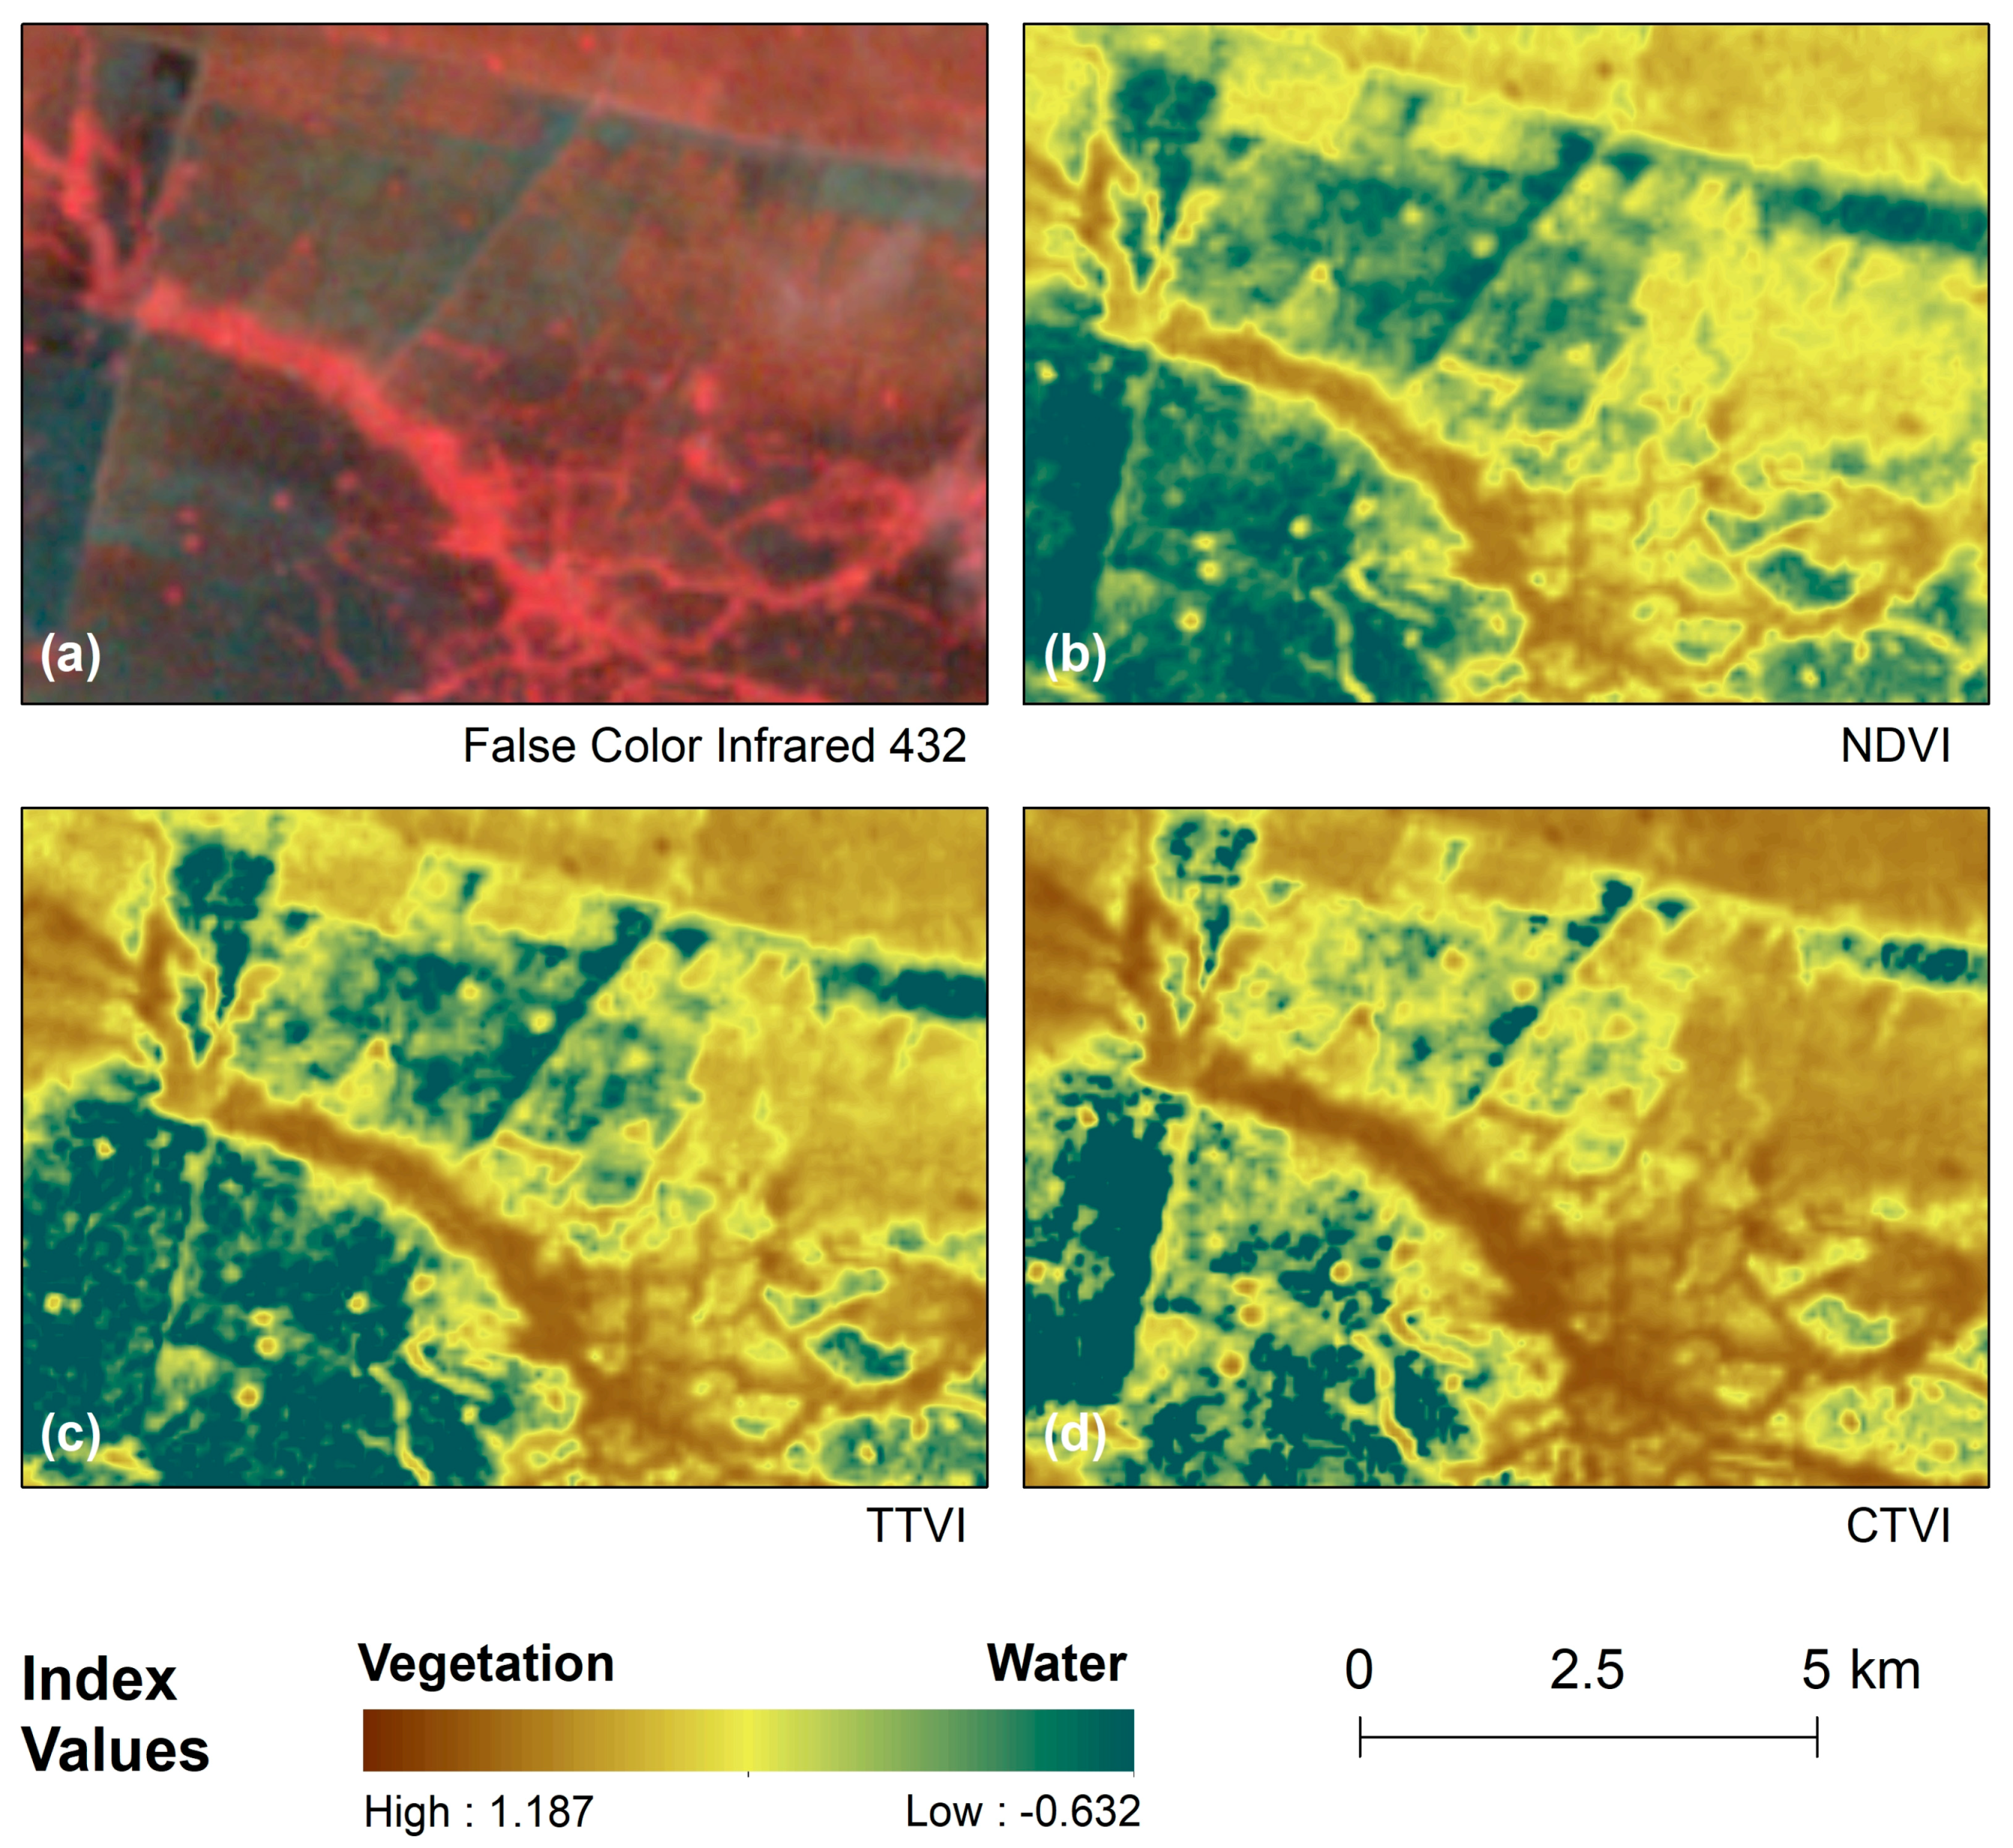
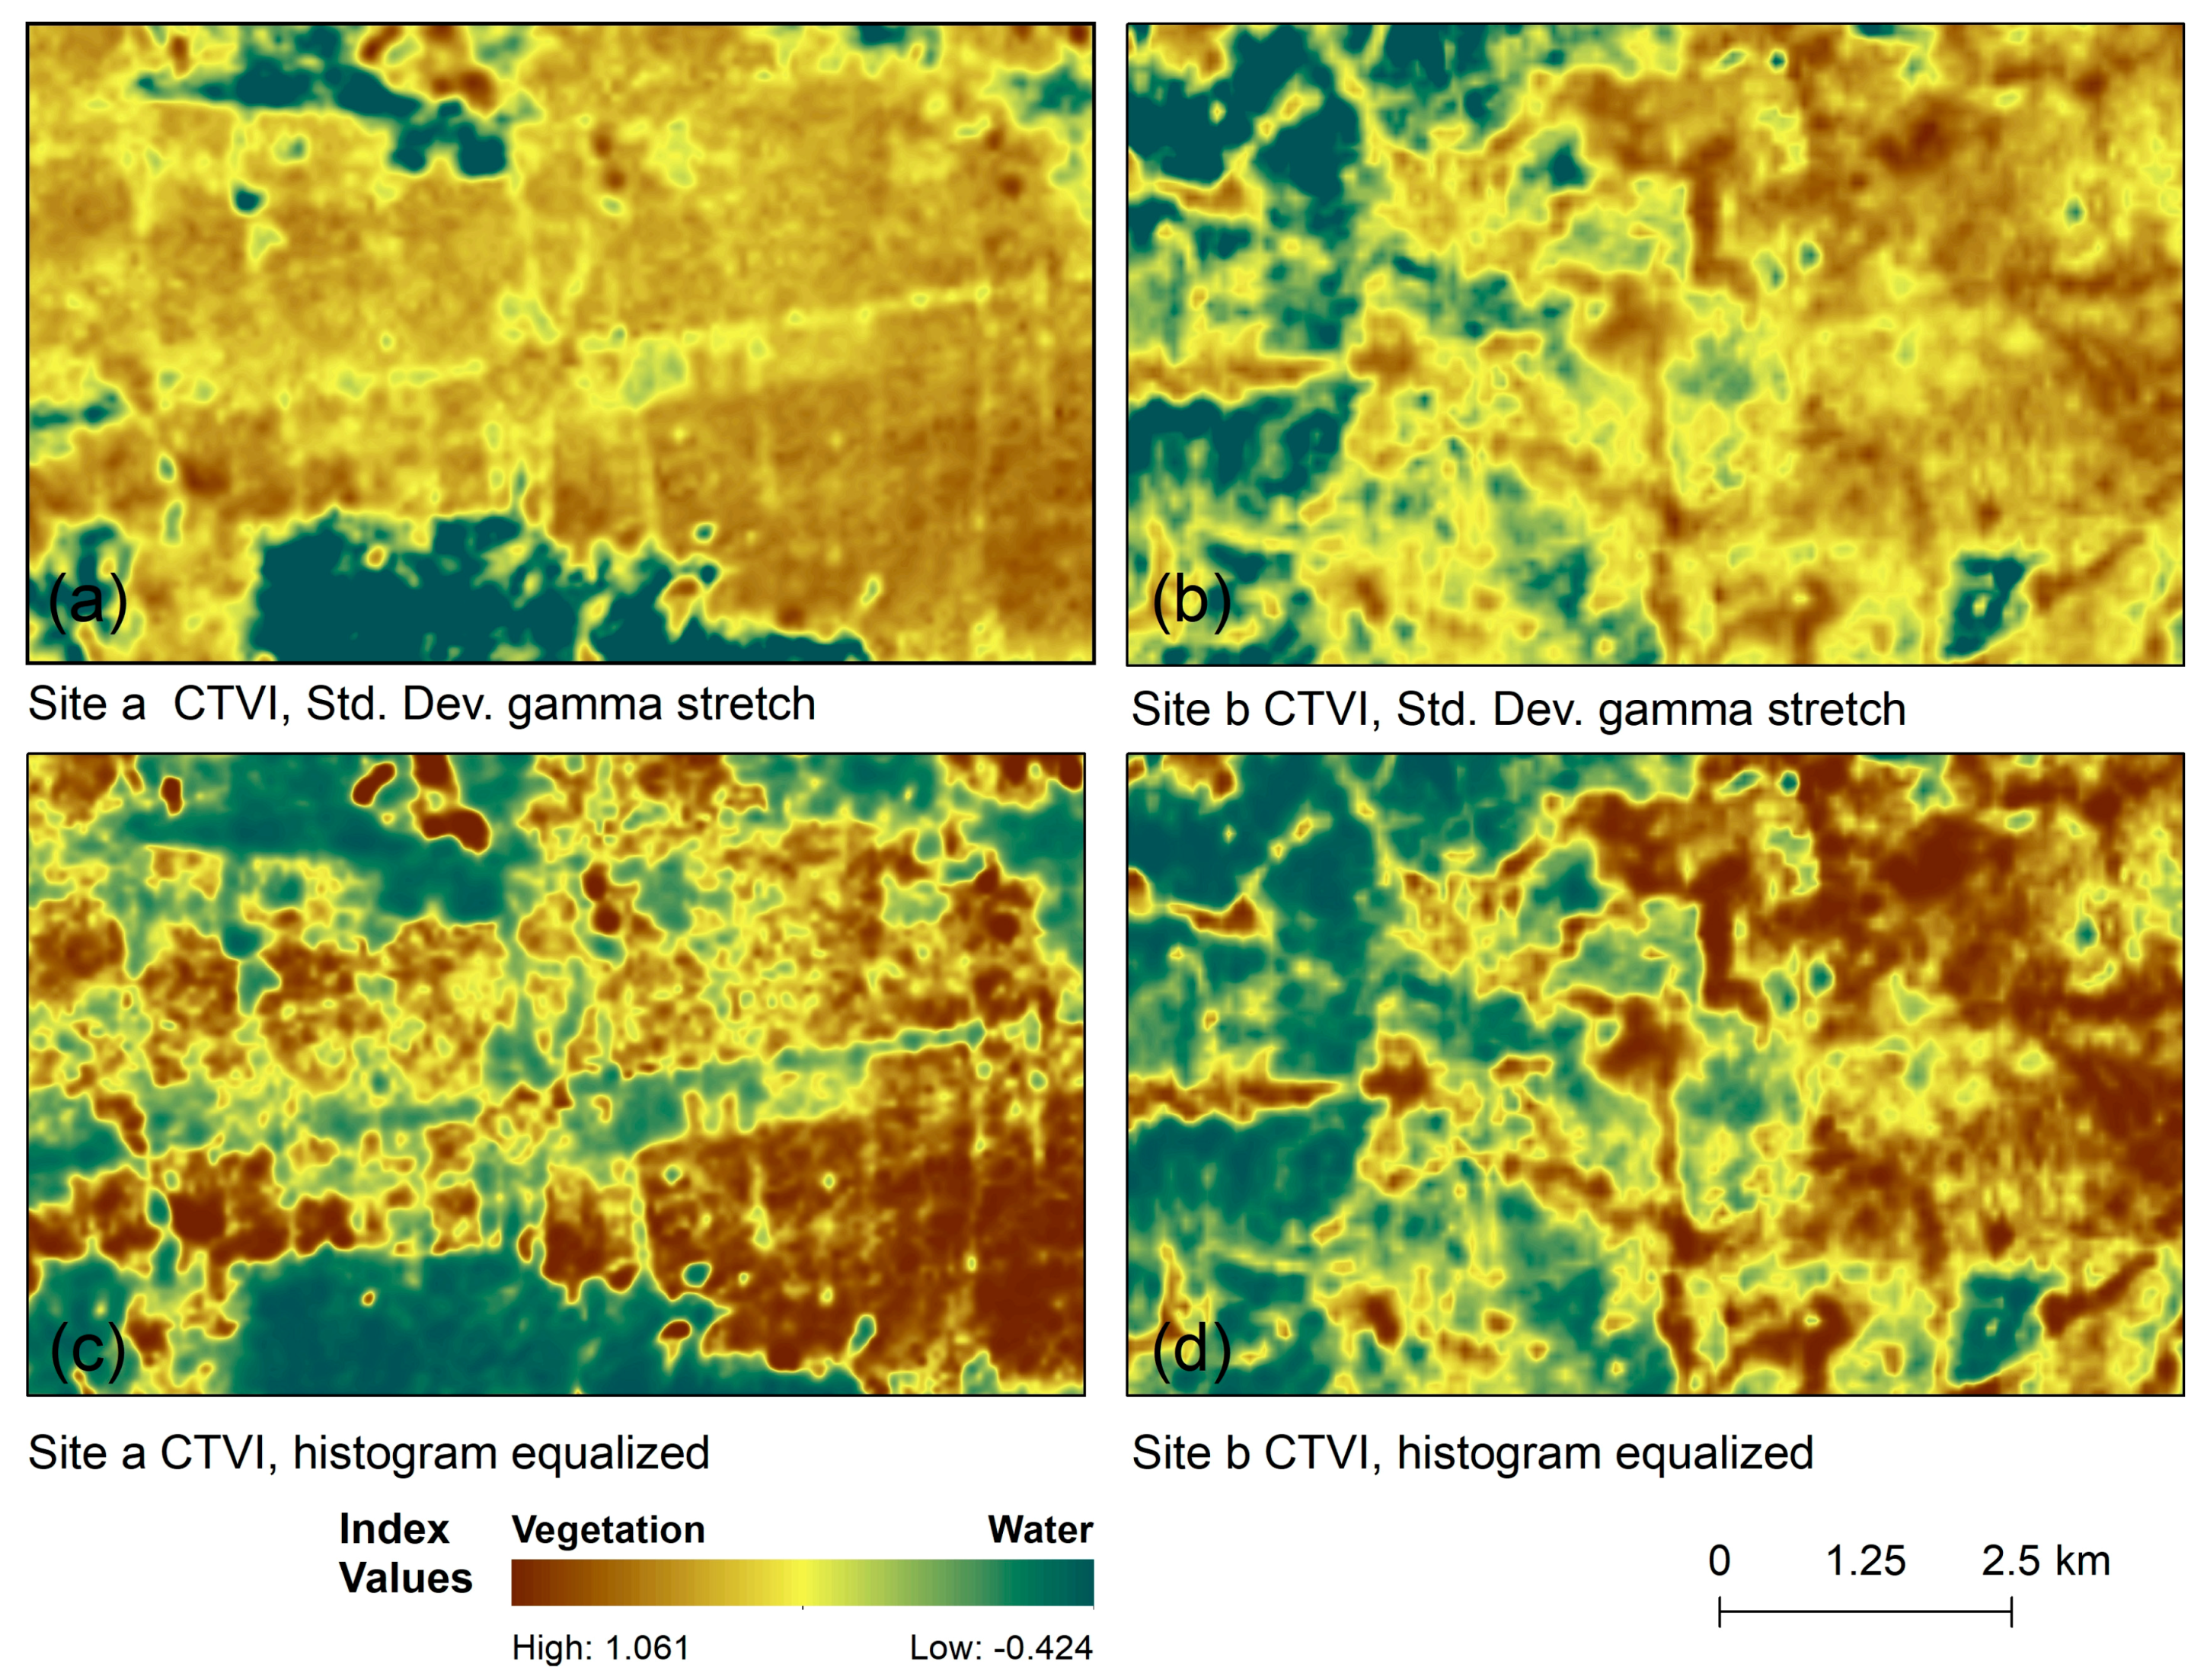
2.3.3. Vegetation Index Analyses

Although false color infrared gave a quick visual baseline for each data scene, the low-resolution imagery did not always give a clear indication of water containing areas. Due to seasonal variations in flow and sediment load, water visibly varied in color from black to light greenish blue, or reddish tan. Cloud shadows could also be mistaken for bodies of clear water when observed in NIR/R/G format. In order to increase the visibility of water on the landscape, vegetation indices were run on each Landsat scene. The normalized difference vegetation index, or NDVI, was used to extract water features from the surrounding landscape. The NDVI was developed by Rouse [37] using MSS data to minimize variations in reflectance measurements due to topographic effects and to enhance the difference between vegetation and non-vegetated land areas [38]. NDVI is a ratio of the red and near infrared (bands 5 and 6, respectively, in Landsats 1–3) [39]. It is one of the most commonly used vegetation indices and is efficient at detecting irrigated land. It has the advantage of providing a small range in values, −1.0 to 1.0, and a clear cutoff value, indicating that all values below 0 identify non-vegetated land or water bodies [34,40]. Both the corrected transformed vegetation index (CTVI) and the Thiam’s transformed vegetation index (TTVI) expand upon the NDVI, and are part of the same family of slope-based vegetation indexes. The TVI was created to correct index values so that the histogram reflected a more normal distribution. The CTVI altered the TVI in order to eliminate most negative values and return a higher quality vegetation index (VI) image. Thiam found the results from the CTVI to be too noisy, and overestimate greenness, so altered the TVI once again by dropping the first part of the equation, resulting in the TTVI [39].
Vegetation indices were calculated in QGIS 2.18, an open source GIS program. QGIS provides access to third party geoprocessing tools, offering the ease of a “black box” tool with supporting documentation available to the user. By partnering with independent software providers in this way, QGIS provides access to image filters, remote sensing workflows, and other raster analysis methods that might not be available in any one GIS or remote sensing package. One of the third-party providers is SAGA. Within QGIS, SAGA provides a module that computes seven slope-based vegetation indices simultaneously. This gave us the opportunity to produce NDVI, CTVI (corrected transformed vegetation index), and TTVI (Thiam’s transformed vegetation index) outputs for each of the downloaded scenes quickly and efficiently. The vegetation index equations appear below.
The normalized difference vegetation index [37]:
N D V I = N I R R N I R + R .
The corrected transformed vegetation index [41]:
C T V I = N D V I + 0.5 A B S ( N D V I + 0.5 ) | x | A B S ( N D V I + 0.5 ) .
Thiam’s transformed vegetation index [42]:
T T V I = A B S ( N D V I + 0.5 ) .

2.3.4. Visual Evaluation and Irrigation Mapping

All Landsat images and vegetation indices were resampled with bilinear interpolation and stretched using standard deviation symbology in ArcMap, with a 30% increase in contrast. A diverging color ramp was applied to highlight the contrasts between high and low index values. The images that follow were produced from Landsat scene LM3137051979280AAA10 (Landsat scene names have been reformatted since this data was originally acquired, the current Landsat product identifier for this scene is LM03_L1TP_137051_19791007_20180420_01_T2).
Canals were mapped by comparing known locations from field data with both the before and after data sets of satellite images, and using both the satellite basemap available in ArcMap and Google Earth for reference. Canals were often confused with roads in the false color images, however the vegetation index images provided clear differences in values between roads and water. When mapping, binary color ramps were used to contrast the green vegetation along road edges (high NDVI values) from water filled canals (low NDVI values). Uncertainty came in when viewing older canals full of vegetation or eroded former canals that had been plowed over, which usually called for comparing the three vegetation indices with each other and with modern Google Earth imagery. Figure 5 and Figure 6 show the results of the canal and water storage mapping.

3. Results

3.1. Comparison of Index Performance

While all three of the vegetation indices listed provided an acceptable advantage over the false color infrared in water detection, the index that most reliably detected water storage in most cases was the CTVI. The CTVI output reliably identified even very small water bodies while still maintaining distinct boundaries at the water’s edges. NDVI outputs often over emphasized water pixels, which made it difficult to distinguish between healthy vegetation and water bodies. The TTVI results tended to falsely identify clouds as surface water, which necessitated referring back to the false color infrared composites for confirmation. This algorithm worked well for identifying water bodies, but overrepresented wet soils and failed to clearly delineate between reservoirs and wet fields or flood plains.
Figure 5 shows the 1979 false color infrared, CTVI, NDVI, and TTVI outputs for the same location in Banteay Meanchey province, Cambodia. In false color, the land surface appears indistinct and flooded, with blue coloring suggesting water across most of the image. The NDVI increases contrast between water (blue) and land (yellow to brown), but the overall image is still hazy. Distinction between water and farmland is clearer in the TTVI than the NDVI, but the TTVI tended to overemphasize water. This can be seen in the lower left corner of the image, where the large blue (water) area has the same index value on both sides of the dividing dike, a uniform blue shade across the entire section. Contrast this to the same area in Figure 7a,b, where there is a stronger (darker) water reading on the left side. This was a drawback when mapping water storage features, as it failed to pick up differences in signal between wet land and deeper, stored water. However, the ability of the TTVI to clearly define a contrast between water and land made it the most useful for mapping canals, as it successfully separated the thin linear features from the surrounding landscape. The spectral signal of water is such that it supersedes all other signals in a pixel, making even the five-meter wide canals detectable [11]. In the CTVI imagery (Figure 7d), containment dikes and reservoirs could be clearly distinguished from the surrounding flooded landscape, while the large blue area in the lower left corner clearly separated the water storage section (left) with the inundated area on the right.

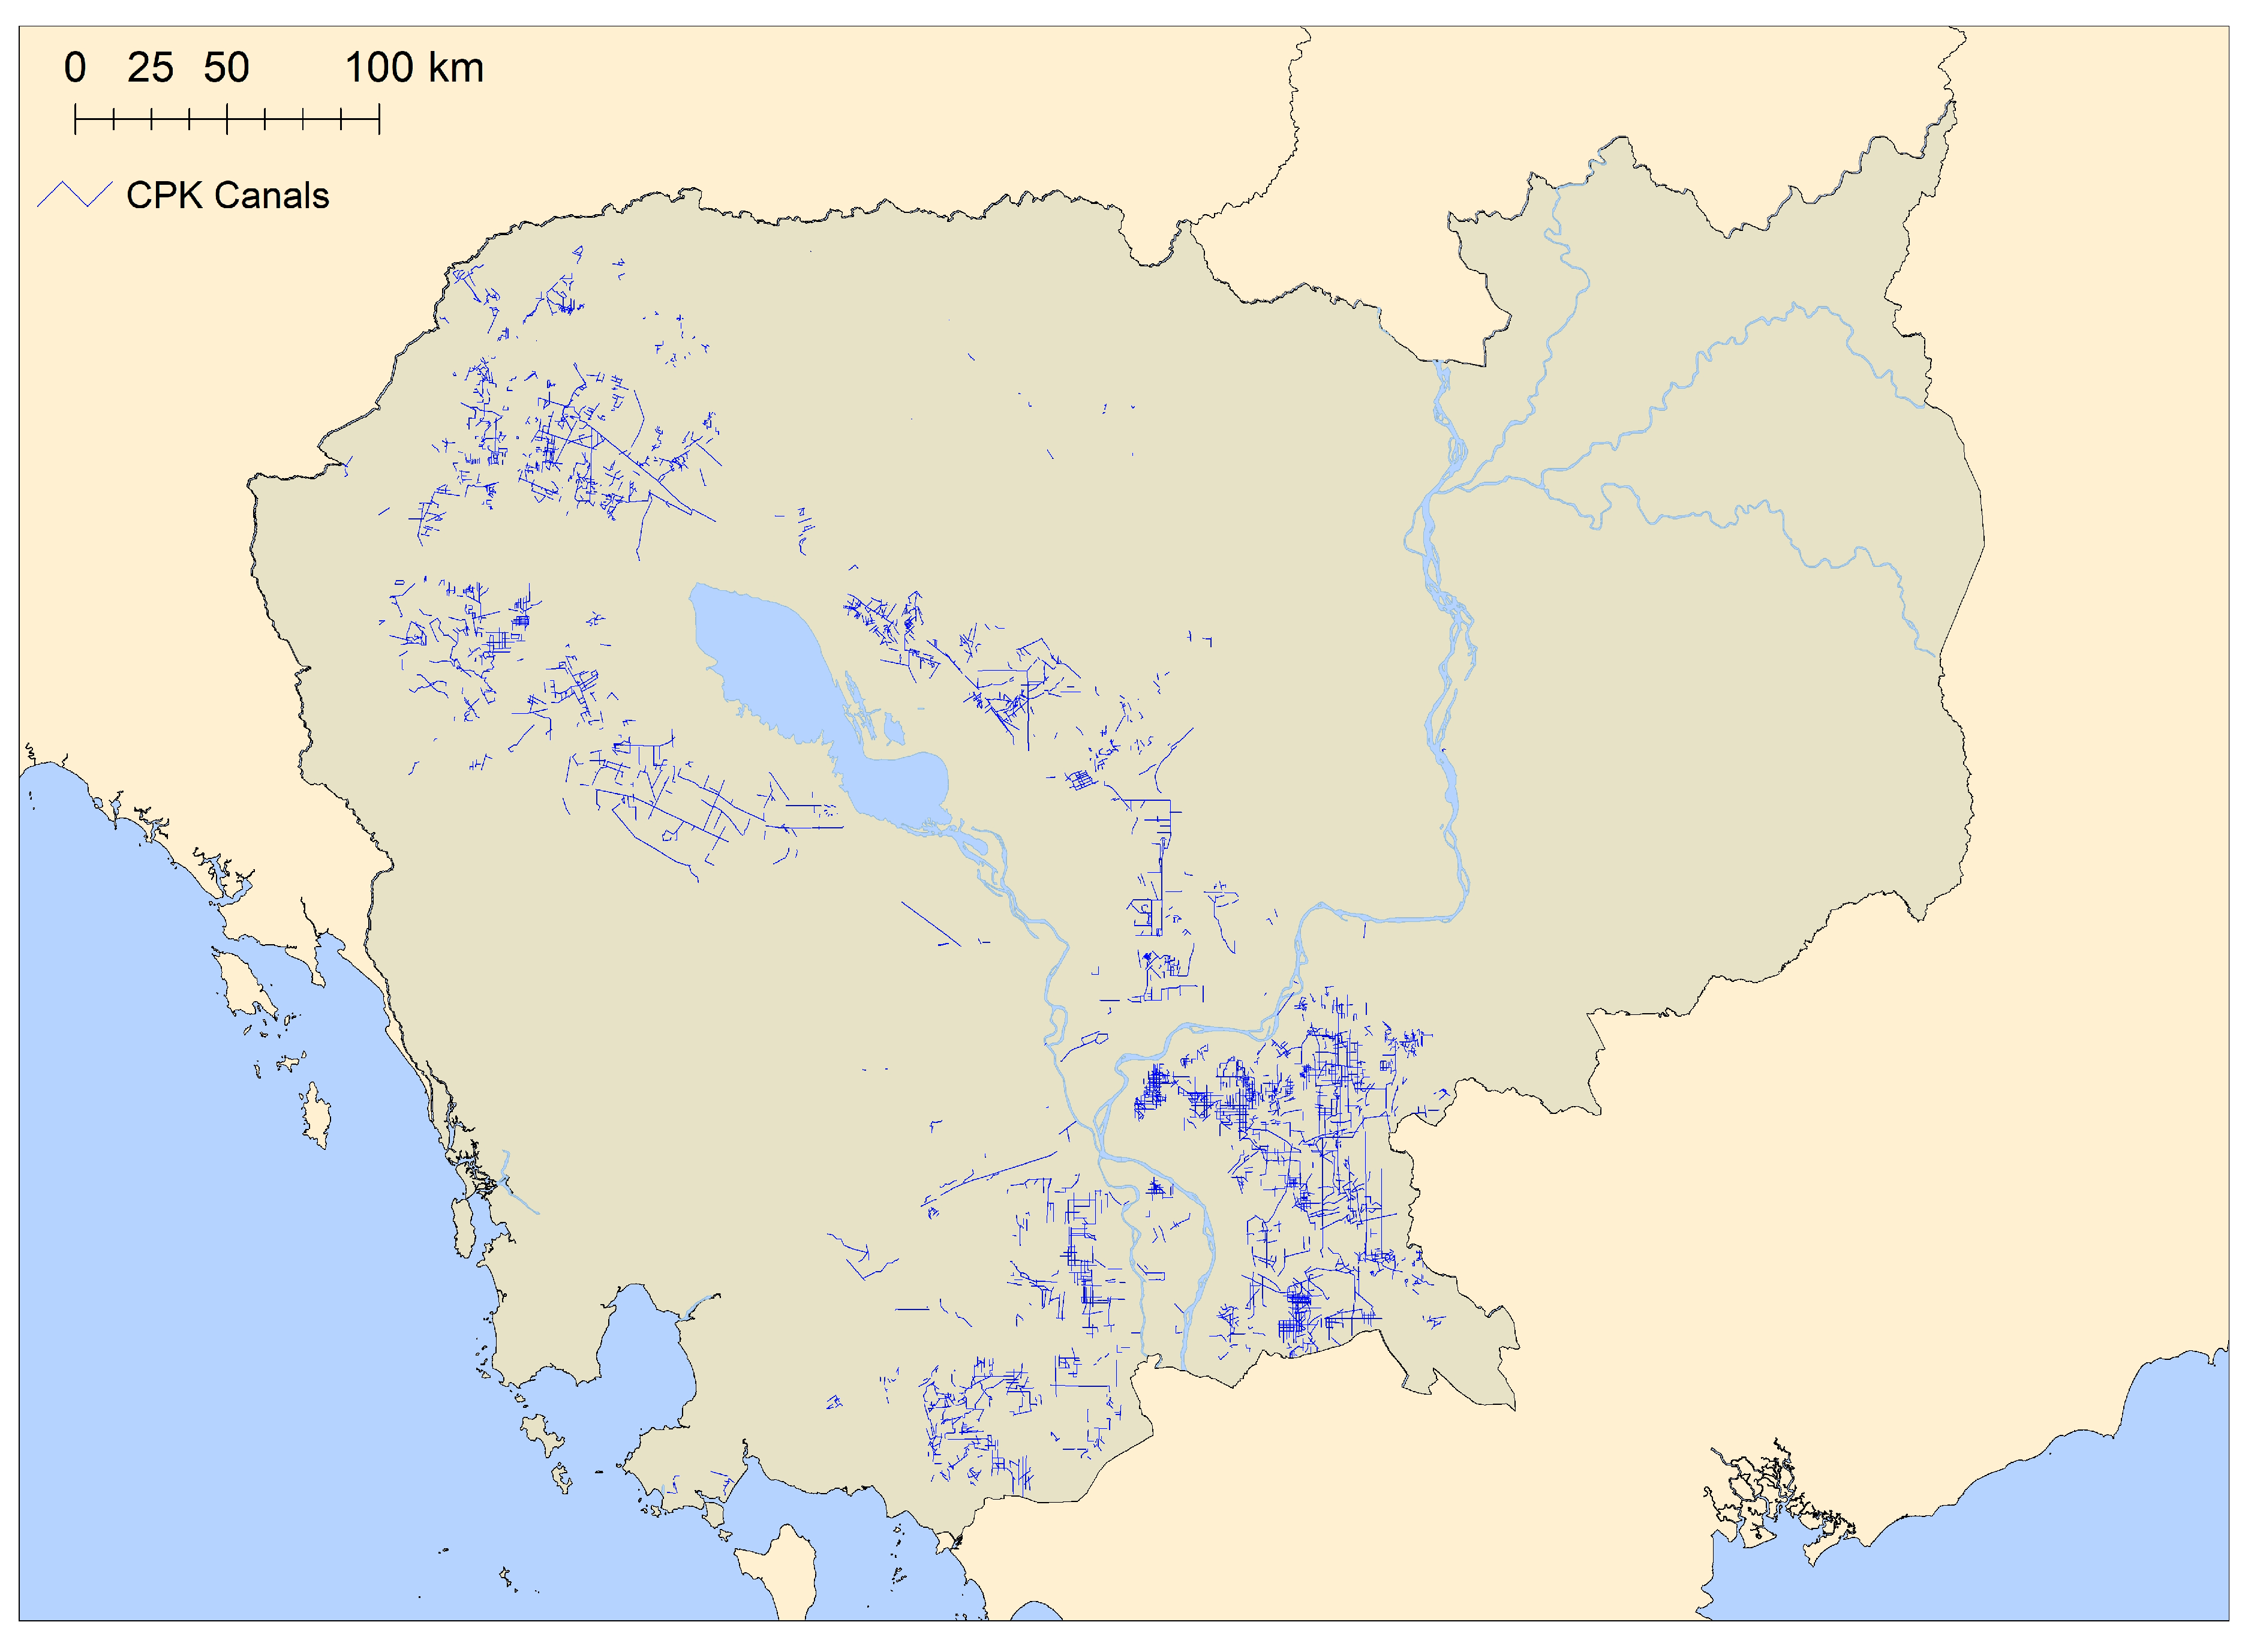
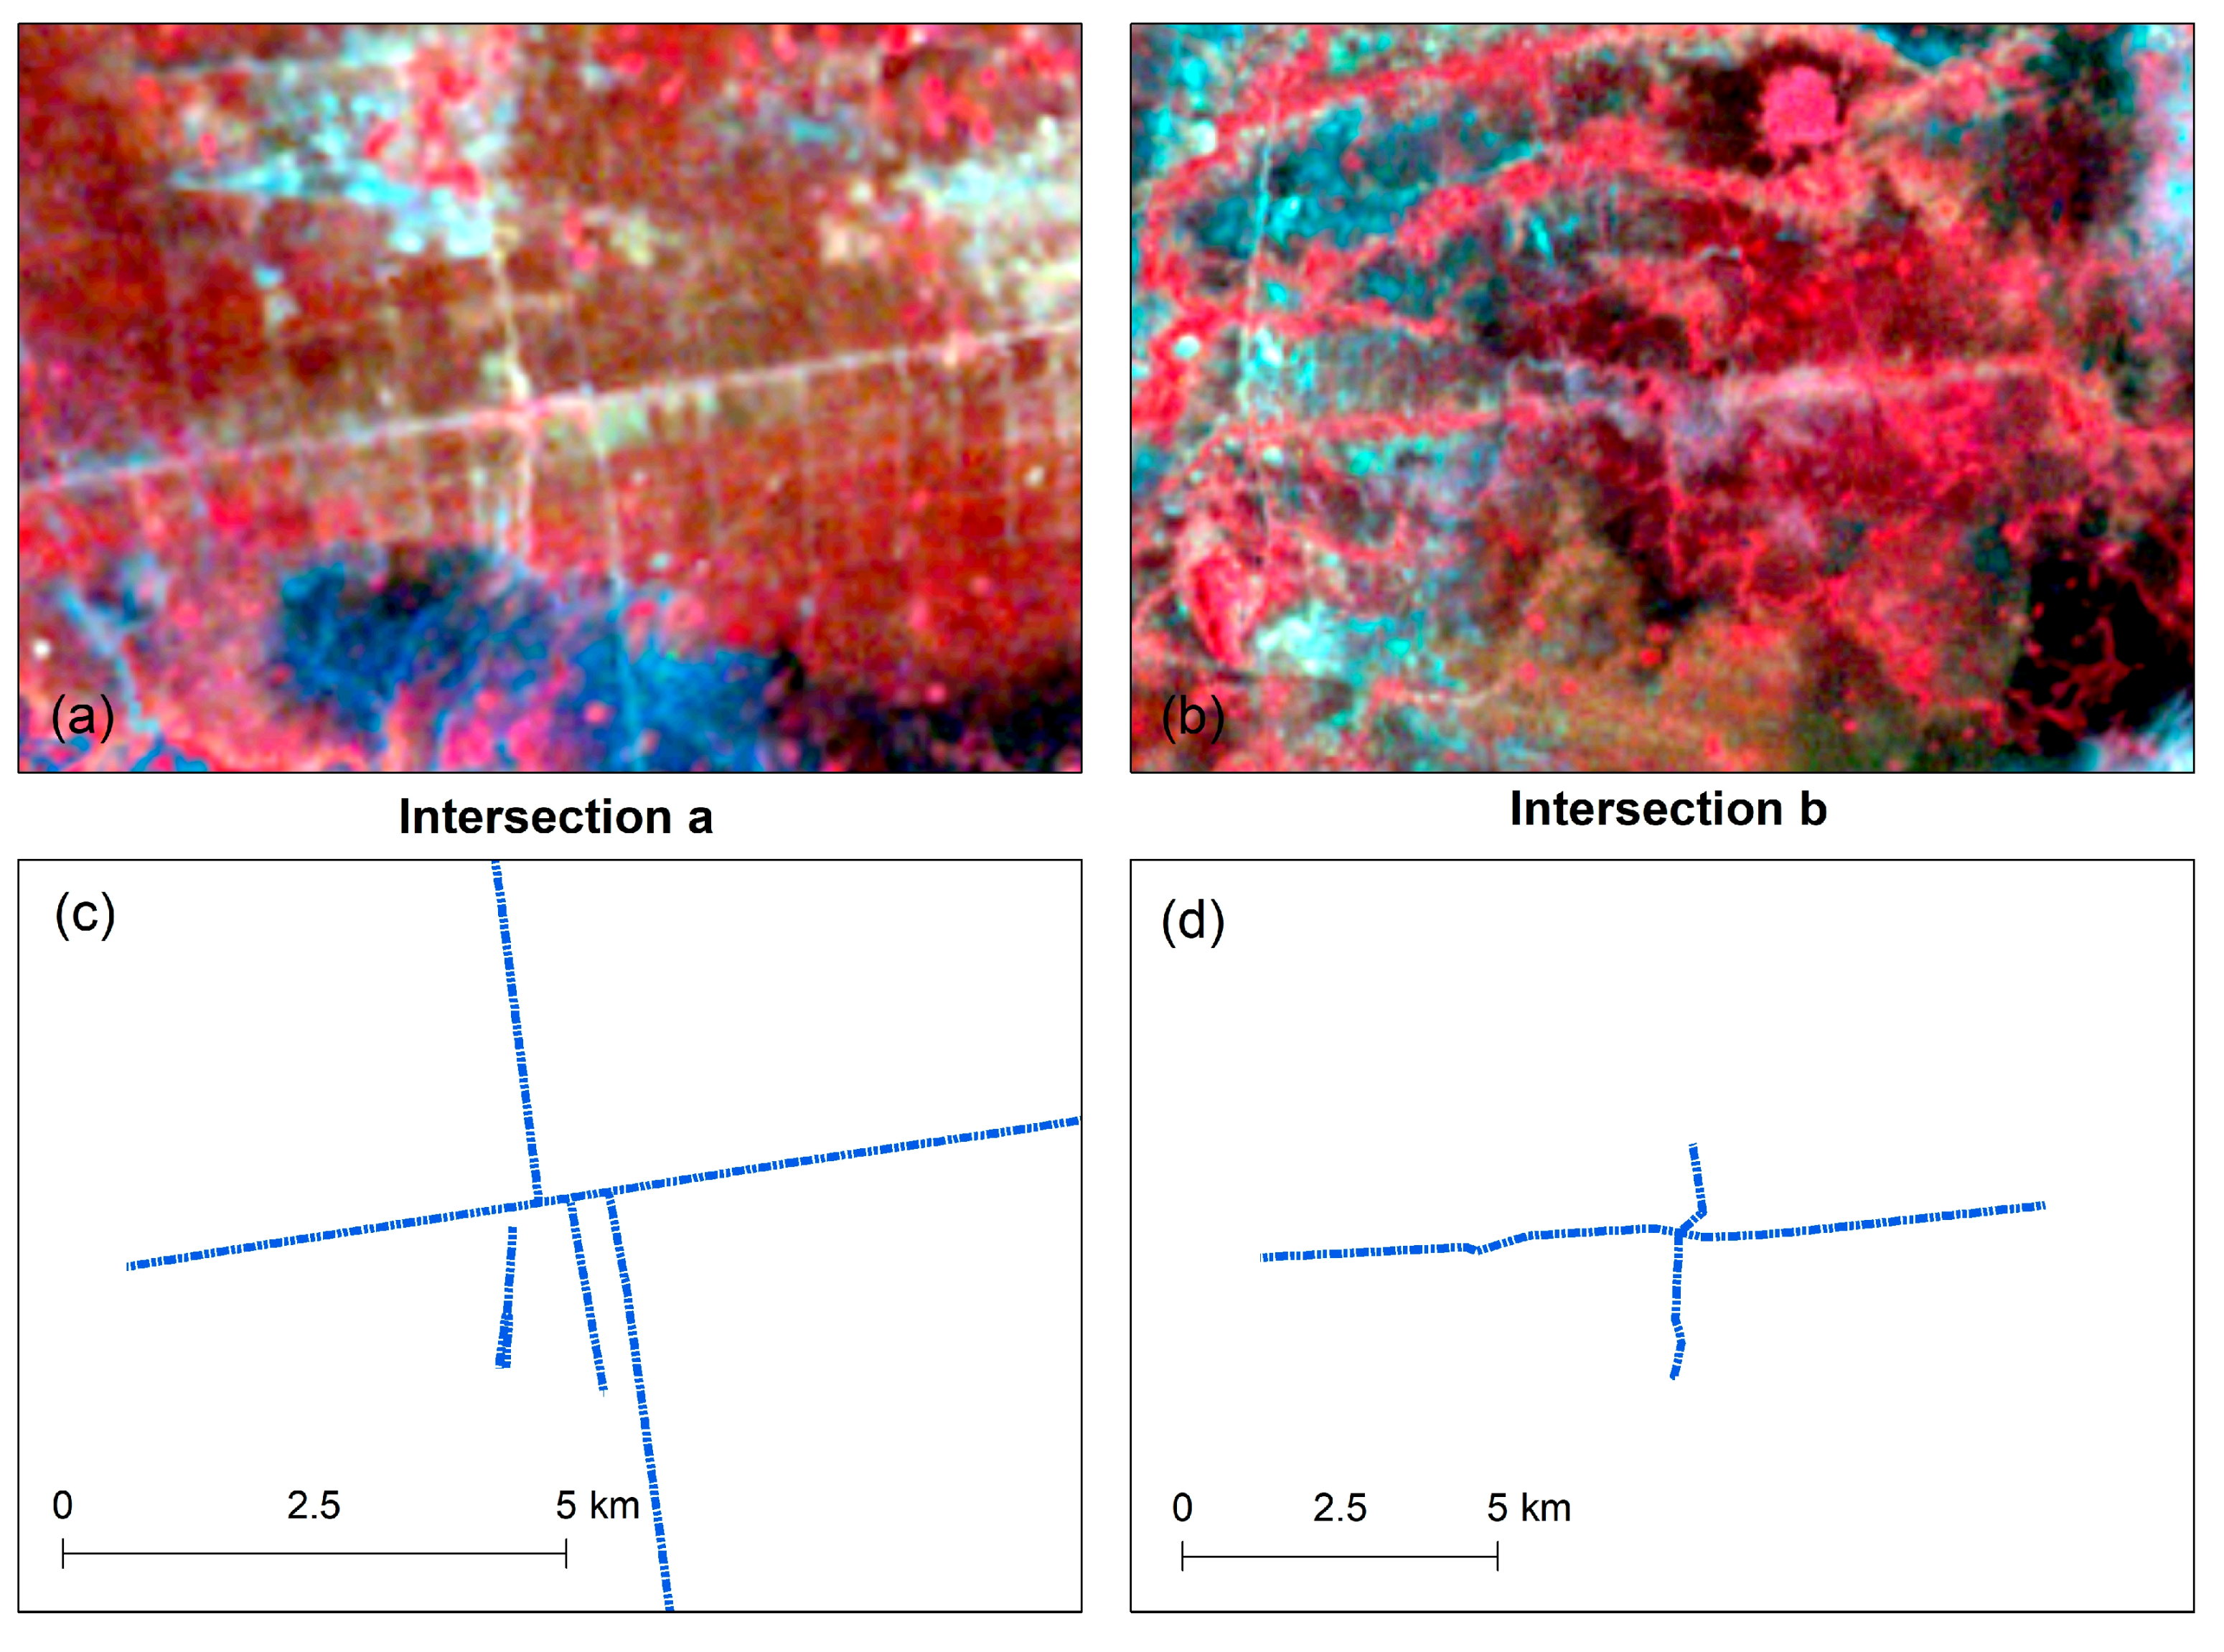
3.2. Linear Feature Detection

Even given modern imagery, canals varied in width and often had empty or missing sections that made them hard to trace long distances. This was complicated by sun-glint or high sediment load. While clear water absorbs most of the infrared that hits it, sediment filled water reflects more light back to the sensor and often registers higher index values similar to bare ground. A particularly effective example of this occurs in Banteay Meanchey Province, where two intersections presented similarly in the false color imagery, however one intersection displays canals and the second did not. Figure 8 below shows both intersections as they appear in the Landsat 3 imagery (top left and right). The paths of the two intersections are shown enlarged in blue below. At both locations, a diagonal line cuts across the image from the east to the west. At intersection a (Figure 8a) a, this line is lighter and almost white compared to the bright red vegetation surrounding it. Multiple perpendicular lines meet or cross it, although these are faint and almost fade into the brown/red background. At intersection b (Figure 8b), a similar line is evident. On the left it starts as a pale line edged in red running through a mixed light blue and brown background. As you follow the line towards the right, it becomes lighter and more pronounced against the bright red vegetation on the landscape. It, too, has a somewhat offset intersection running through the center of the image, however these lines are not as precisely defined and have a rougher outline than the lines at intersection a.
In Figure 9, Sites a and b display similar diagonal intersecting lines. In the top row, CTVI images are displayed using a standard-deviation gamma stretch. The lower index values of Site a remain lighter than the background values. Their light-yellow appearance indicates values in the middle of the index value range. This contrasts with Site b, which displays the dark brown (high CTVI value) lines of healthy vegetation, often found lining roadways. With the standard-deviation stretch, linear features are clear and contiguous, with good definition while still retaining vegetation (b) and non-vegetation (a) qualities. When the stretch was changed to a histogram equalized view (bottom row), linear definition was compromised, but Site a’s canals appeared distinctly in blue, low index values, confirming the presence of water. What can be seen of Site b’s linear features were much darker brown. This color contrast in the CTVI highlighted the difference in infrared reflection between vegetation and water, providing the information necessary to distinguish canals from roads.
Figure 10 shows Site a in 2019 Planet Labs imagery, with a 3 m spatial resolution, much higher than the 1979 Landsat 3 imagery (60 m resolution). The major intersection that was at the center of Figure 8a appears in the top right corner. This imagery illustrated just how difficult it was to find relict canals in true color imagery, especially after 40 years had passed. There was still a need for CTVI analysis even with high spatial resolution, as roads, canals, and vegetation can appear many different ways in a single true-color image.
The red inset rectangle (Figure 10a) highlights a wide, dark green canal to the south of the gray asphalt road on the left of the image. Close to the light-brown dirt road running north–south, canals begin running on both the south and north banks. Once the asphalt road crosses the dirt road, the canal south of the main road ends. The dirt road has a small tertiary canal in dark green running along its west side. Dark green colors indicated that the canal was older and had been overgrown by vegetation.
The blue inset rectangle (Figure 10b) is less that 400 m away from the red inset, but the dirt road running north–south at this location is a pale white line. The canal here also runs on the west side of the road, but is fragmented, and has various levels of reflectance in each section. The northmost canal section follows the dark green appearance of the previous wide canals. The section immediately to the south is a light blue, due to sun-glint reflecting off the surface. The last section is as wide as the light blue section above it, but the same color as the dirt road it runs beside. Contextually, the width, location, and the knowledge that the soil was very silty can help to identify this section as canal and not road. The light color can be explained by the fact that water very high in sediment reflects similarly to soil in the visible spectrum. It requires CTVI analysis to verify this description, however.
Figure 11 shows the intersection at Site b. The small red inset (Figure 11a) focuses on the road that crosses the image from west to east. This is a light beige dirt road flanked by houses on either side. Running vertically through the image is a natural waterway, in dark greens. This channel has a much more organic shape when contrasted to the manufactured canal to the east. In the CTVI and false color imagery, it was this channel to the west that appeared as a water on our Landsat imagery, and the more engineered canal to the east was not detected. The eastern canal may be more modern in construction. As to why the natural waterway appeared as vegetation in the CTVI image, comparing the color of the vegetation in the channel to the vegetation in the town to the east (top right corner of blue inset image), the natural waterway appears overgrown to the point where it would have a high enough infrared reflectance to register as vegetation as opposed to water. The more modern canal, highlighted in the blue inset (Figure 11b), is more to type, with a dark green channel and two light dirt roads on the east and west banks. As this channel proceeds north toward the town, however, we picked up sun-glint and sedimentation that made this wider canal section appear lighter and more similar to the dirt roads.

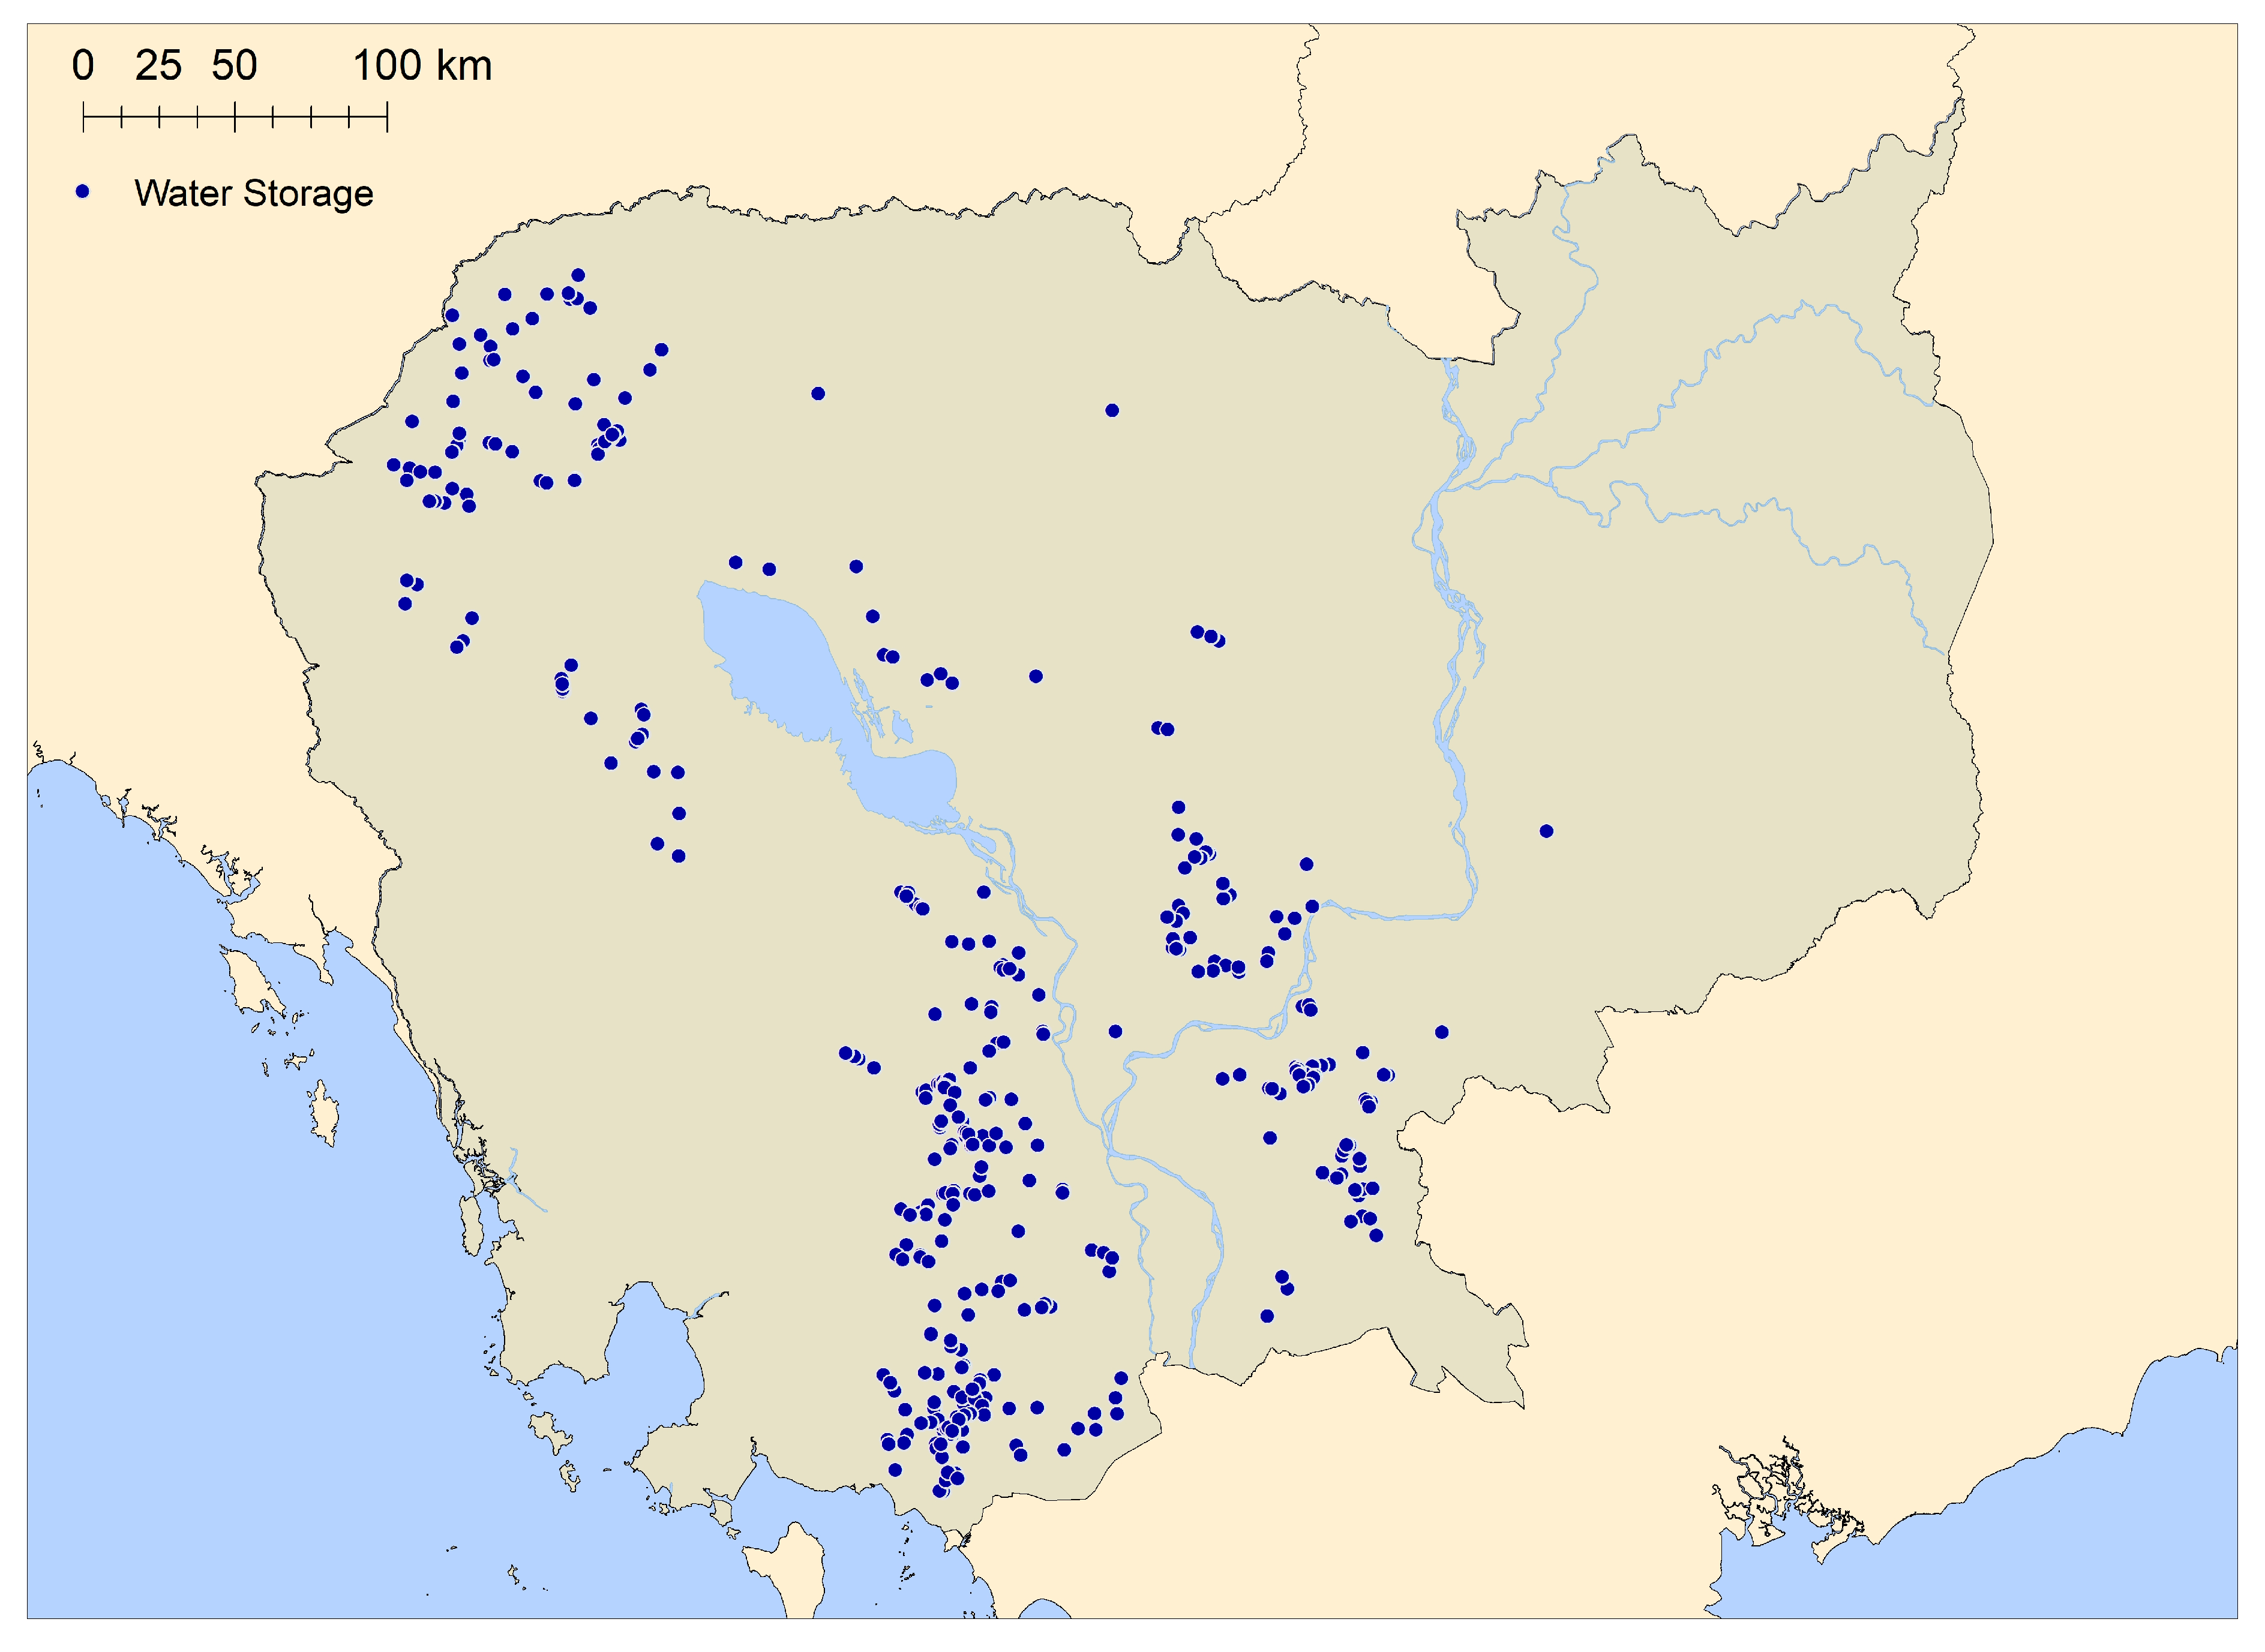
3.3. Canal and Water Storage Inventory

Excluding ancient Angkorian systems, we identified a total of 2540 km of canals in the “before” dataset, and 9772 km of canals in the post-Khmer Rouge satellite data. This is an increase of over 7000 km between 1973 and 1979. Although canals as small as five meters across could be detected, this is certainly an underestimate of the scope of the construction completed during this time. Field surveys in areas where the grid system has been maintained indicate that these canals were spaced one km apart, and smaller canals were spaced at 100 m intervals between them (see Figure 1).
Reservoirs increased from roughly 32 detectable in the pre-Khmer Rouge era to over 350 separate reservoirs by 1979. A rough typology of storage types was created based on the method of water containment and relationship of the water storage feature to both topography and hydrology of its location. Six types were identified: external storage, internal storage, segregated storage, linked storage, topographically controlled storage, and large-scale canal systems. For a more in-depth discussion of the typology characteristics, see Tyner et al. [11].

4. Discussion

4.1. Accuracy Assessment

To evaluate the success or sustainability of the irrigation features, first we looked at the larger structures as a whole—were the water storage features that we detected via the satellite imagery verified by ground-truthing? To what degree were the features detected—were structures identifiable “in toto” or were large components of irrigation systems missed by the CTVI index? The satellite mapping process revealed over 350 water storage features, all but one of which were Khmer Rouge constructed or improved. All of these were at least partially traceable in modern imagery, although not necessarily visible at ground level. Even for modern and rehabilitated dams, the amount of water stored at any given time varies, and a reservoir may be drained for irrigation use and sit empty until the next rainy season (an example of this was the Sla reservoir that was mapped with very low water levels during the 2018 field season). Because of this and the tendency of structures to erode in monsoon season, the evidence of dams, dikes or gates at a site all served to verify previously existing water storage. Of the reservoirs identified in the satellite imagery, 13 were verified as Khmer Rouge by ground survey, and five were determined to have been canal structures. One was verbally confirmed by a local resident, but unable to be reached by road. In addition, 14 new Khmer Rouge dams were identified in a field survey, for a total of 27 dams ground-truthed. All but one of these were visible in the 1979 imagery once we knew where to look based on ground data. When ground truthing canals, 276 satellite-identified points were surveyed as possible canals or canal fragments, and 272 of these proved to be accurate. Table 1 shows the accuracy matrix comparing the satellite feature detection and the ground survey. The category “other” describes canals or dams that were not mapped previous to the ground survey.
Several factors contribute to the relatively low number and low accuracy of water storage data points as compared to canal features. One, canal features were usually mapped at multiple points along their length, at gates or culverts or failure points. This means that canal points were nearer to each other and more numerous than water storage points. Often, during monsoon season canals over topped or breached, leading to large flooded areas in the imagery that were seen as storage. Areas where canals had broken or breached were sometimes mistakenly identified as individual reservoirs, when in fact they were two parts of the same canal. These large flooded areas resulted from the failure of the canal system transporting the water, rather than the storage features themselves. Finally, the size and scope of some of the water storage features, especially those that were topographically constrained, combined with the distance and limited time in the field prevented us from taking as many points as would have been desirable for a larger reference data set. Most of the water storage features (373 in total) were verified through satellite imagery available on Google Earth.
Separating individual canals even in modern imagery is often impossible, especially if those images were taken during flood season. For reference we used a combination of government and NGO (non-governmental organization) reports on scheme conditions and improvement plans. We then compared the canal networks detected in the 1979 CTVI imagery with modern networks known to have been modified from original Khmer Rouge construction. Following Treffner [43], we focused on identifying irrigation schemes and sub-projects rather than individual canals. Much of the data available consisted of lists of irrigation projects by district without location information, with details given only on planned rehabilitation project sites. Given these limitations, of the over 9000 km of canals traceable in the 1979 imagery, 897 km were linked to 32 irrigation schemes, in 11 provinces.

4.2. Success or Failure?

In terms of judging the success or failure of the Khmer Rouge structures, we looked at factors that would apply to any irrigation structure. Did the structure perform its most basic function? If it was a canal, did it transport water to the intended area? If it was a water storage feature, how effective were the structures (dam, gates, or culverts) at retaining and distributing water as needed?
At three water storage sites, containment dams were not completed before the fall of the Khmer Rouge regime. These structures were all in the CPK Northwest zone, which remained under the influence of the Khmer Rouge until 1998 [24]. Two of these were large topographically constrained structures, Kampong Puoy and Trapaeng Thmar, with dikes stretching over 6 km and 13 km, respectively. The third was the Prek Chik irrigation diversion dam, secondary intake structure for the large-scale Damnak Ampil/April 17th canal system, which stretched over 48 km. The Damnak Ampil was both unable to cope with heavy monsoon rains, which led to frequent canal breaching due to overland flow, and too large and permeable to distribute enough water to farmers along its length during the dry season. Both this dam and a nearby dam to the northeast, Thleam Ma’oam, collapsed repeatedly during construction. We were unable to procure details for each of the water storage sites visited, but of the 11 dams for which we have failure information, five lasted fewer than three years, two failed after roughly six years, and only two lasted more than a decade. Seven were left unused or abandoned at some point, five of those permanently.
Functionally, at nineteen of the water storage sites the dams are at least partially operable at the current time, and most of these have been rehabilitated at least once. Erosion around gate structures and inoperable gates were the primary complaints. At Trapaeng Thmar, the largest water storage site, water distribution, gate repair, and canal maintenance has been fractious and plans for rehabilitation poorly understood since construction [43]. This area of Cambodia suffered from conflict between Khmer Rouge splinter groups and the government until 1998. As of 2010 only upstream farmers could benefit from the reservoir during the dry season [43]. The projected goal for the Trapaeng Thmar project by the Khmer Rouge was to irrigate 3000 ha. At present the upstream irrigated land has increased from 50 hectares to 300 hectares, but downstream fields remain unirrigated and with no more access to water during the dry season than in the 1970s. In southwest Cambodia, Kep province, four Khmer Rouge reservoirs were linked along a single river. Upstream of this cascade system a large, post-Khmer Rouge dam (Chamka Bey) was built that funneled more water than the next dam downstream could hold, resulting in breaching of the dam at Kraal Kau Ta Pom and downstream flooding [44]. In the case of the Damnak Ampil irrigation scheme, as of 2009 water did not reach the secondary canals due to their deterioration [19]. The permeability of the canals causes high water loss and neither upstream or downstream residents are able to access water to farm dry season rice [45]. The Jan 6th/Traing Krasaing system has repeatedly breached since its construction due to monsoon-related runoff, and despite being in a water-rich area only supplies water to 3% of its potential service area [46]. Table 2 lists the conditions of water storage sites that we were able to visit.
Even more fundamental than whether a particular structure still functions is whether or not it still exists. Figure 12 shows Kep Province, Cambodia, where many reservoirs were visible in the 1979 imagery that were barely traceable in modern imagery. Field survey and local interviews confirmed that multiple reservoirs, seen as dark blue or black in the 1979 near infrared image (Figure 12a) were built by the Khmer Rouge; these are visible as blue in the 1979 CTVI images (Figure 12b) In the high resolution images from Planet Labs. (Figure 12e,f), the two reservoirs in the lower left corner are no longer visible. In the northeast, a large dike south of the river can be traced, but does not hold water.
Figure 13 shows water storage sites in Banteay Meanchey, Cambodia, to the east and southeast of a large reservoir called Trapaeng Thmar. The 1979 imagery is shown in false color infrared (Figure 13a) and CTVI (Figure 13b). Two reservoirs can be detected in the early imagery, they are shown enlarged in Figure 13c,d. The reservoir directly to the east (d) stretches north to south over 16 km, and the southeast reservoir (c) measures over 11 km. Figure 13e, shows Planet Labs’ false color infrared imagery from the same location in 2019. The former water storage shows up as bright, bare land. It is difficult to locate the previous location of the southern reservoir. The Planet Labs’ 2019 CTVI (Figure 13f) image makes it clear that there is no water storage at either location currently.
Applying vegetation indices to pre-Landsat 4 imagery gave us the unique ability to view these irrigation systems immediately after their construction. This allowed us to view the structures in their original configurations, before floods, failures, and multiple rehabilitations altered their function or layout. However, challenges to using this data exist and we are still experimenting with ways to make this process more efficient and productive.
The ability to automatically detect irrigation features would greatly speed up the process. Multispectral classification was attempted, but large pixel size combined with poor quality data rendered it unsuccessful. In the future we hope to use Hexagon KH-9 imagery from the same time period to provide a higher resolution view of the area. Extracting raster attributes in ArcMap in order to create water-only rasters has been promising. By removing all but the values below the average value in the CTVI rasters, we are left with a raster of only water storage and flooded features. This works well to isolate even very small reservoirs. Unfortunately, the canal values are too close to the surrounding wet soil values to be able to separate the two. An image convolution filter might improve results. Several cloud removal processes have been attempted but many require multiple images of the same area or the use of the blue spectral band, which is unavailable in early Landsat imagery [47]. We have tried a partial homomorphic filter process with limited success [48]. Braaten et al.’s [49] cloud and cloud shadow identification algorithm is a promising alternative.

5. Conclusions

While the STV maintains that these structures failed due to lack of planning, improper design, or unskilled workmanship, it is apparent that, while faulty, many of the structures are still being used for their intended purpose. In some cases, even when completely rebuilt, as in the case of the Damnak Ampil intake dam or the dam at Thleam Ma’om, the locations and general layout rely on the systems initially put in place during the Khmer Rouge period. In cases like Trapaeng Thmar, functionality has been partially improved by the completion of control gates to release water downstream, but the access to irrigation water remains problematic. This is as often as much a failure of current planning or lack of cooperation between villages as it is hydraulic in nature [24]. Our field work has observed significant erosion in canals that have been widened and improved within the last few years, due to the inherent instability of the alluvial soil. Without entirely lining canals with stone or concrete, it is hard to see how any canal, modern or Khmer Rouge, could withstand the fluctuations in flow during the monsoon season.
Germann and Epp [50] emphasize that one of the singular qualities of an archaeological site is that the physical context of a site contributes as much information as the objects that are found there. Watershed development can irrevocably destroy that context as well as bury or wash away a site’s material artifacts. While they focus on the damage that reservoir and watershed development cause to the archaeological material contained within the site, in the case of the Cambodian dams and canals, the sites themselves are the material culture. Our study has shown that often these structures have been built, washed away, and rebuilt multiple times. The history of their construction and reconstruction is inseparable from the history of the people killed during their production [51,52]. The best physical record that we have of their production is recorded in the Landsats 1–3 imagery. It is important that we continue to salvage what we can to fill this gap in our historical knowledge by retrieving as much information as possible from these images.

Author Contributions

The authors responsible for conceptualization were M.M.-S., J.A.T., and C.C. (Corrine Coakley); methodology, M.M.-S. and C.C. (Corrine Coakley); software, C.C. (Corrine Coakley); validation, M.M.-S., J.A.T., S.K., C.C. (Chhunly Chhay), and C.C. (Corrine Coakley); formal analysis, C.C. (Corrine Coakley); investigation, C.C. (Corrine Coakley), M.M.-S., J.A.T., S.K., and C.C. (Chhunly Chhay); resources, J.A.T. and M.M.-S.; data curation, C.C. (Corrine Coakley); writing—original draft preparation, C.C. (Corrine Coakley); writing—review and editing, M.M.-S. and S.R.; supervision, project administration, and funding acquisition, M.M.-S. and J.A.T.

Funding

This project was funded through the National Science Foundation Grant # BCS 1461790.

Acknowledgments

The authors acknowledge the Kent State Department of Geology for the loan of survey equipment used for field work. We also appreciate the assistance offered by The Tuol Sleng Museum of Genocide and the DCCam project. We want to thank Planet Labs for making imagery available at no cost for this study.

Conflicts of Interest

The authors declare no conflict of interest.

References

  1. Seto, K.C.; Woodcock, C.E.; Song, C.; Huang, X.; Lu, J.; Kaufmann, R.K. Monitoring Land-Use Change in the Pearl River Delta Using Landsat TM. Int. J. Remote Sens. 2002, 23, 1985–2004. [Google Scholar] [CrossRef]
  2. Gaughan, A.E.; Binford, M.W.; Southworth, J. Tourism, Forest Conversion, and Land Transformations in the Angkor Basin, Cambodia. Appl. Geogr. 2009, 29, 212–223. [Google Scholar] [CrossRef]
  3. Anderson, M.C.; Allen, R.G.; Morse, A.; Kustas, W.P. Use of Landsat Thermal Imagery in Monitoring Evapotranspiration and Managing Water Resources. Remote Sens. Environ. 2012, 122, 50–65. [Google Scholar] [CrossRef]
  4. Roy, D.P.; Wulder, M.A.; Loveland, T.R.; Woodcock, C.E.; Allen, R.G.; Anderson, M.C.; Helder, D.; Irons, J.R.; Johnson, D.M.; Kennedy, R. Landsat-8: Science and Product Vision for Terrestrial Global Change Research. Remote Sens. Environ. 2014, 145, 154–172. [Google Scholar] [CrossRef]
  5. Jaafar, H.H.; Woertz, E. Agriculture as a Funding Source of ISIS: A GIS and Remote Sensing Analysis. Food Policy 2016, 64, 14–25. [Google Scholar] [CrossRef]
  6. Hassan, M.; Smith, A.; Walker, K.; Rahman, M.; Southworth, J. Rohingya Refugee Crisis and Forest Cover Change in Teknaf, Bangladesh. Remote Sens. 2018, 10, 689. [Google Scholar] [CrossRef]
  7. Witmer, F.D. Remote Sensing of Violent Conflict: Eyes from Above. Int. J. Remote Sens. 2015, 36, 2326–2352. [Google Scholar] [CrossRef]
  8. Khorram, S.; Koch, F.H.; van der Wiele, C.F.; Nelson, S.A. Remote Sensing; Springer Science & Business Media: New York, NY, USA, 2012. [Google Scholar]
  9. Chander, G.; Markham, B.L.; Helder, D.L. Summary of Current Radiometric Calibration Coefficients for Landsat MSS, TM, ETM+, and EO-1 ALI Sensors. Remote Sens. Environ. 2009, 113, 893–903. [Google Scholar] [CrossRef]
  10. Wulder, M.A.; Masek, J.G.; Cohen, W.B.; Loveland, T.R.; Woodcock, C.E. Opening the Archive: How Free Data Has Enabled the Science and Monitoring Promise of Landsat. Remote Sens. Environ. 2012, 122, 2–10. [Google Scholar] [CrossRef]
  11. Tyner, J.A.; Munro-Stasiuk, M.; Coakley, C.; Kimsroy, S.; Rice, S. Khmer Rouge Irrigation Schemes during the Cambodian Genocide. Genocide Stud. Int. 2018, 12, 103–119. [Google Scholar] [CrossRef]
  12. Etcheson, C. After the Killing Fields: Lessons from the Cambodian Genocide; Praeger: Westport, CT, USA, 2005. [Google Scholar]
  13. Kiernan, B. The Cambodian Genocide, 1975–1979. In Centuries of Genocide; Routledge: New York, NY, USA, 2012; pp. 331–368. [Google Scholar]
  14. Himel, J. Khmer Rouge Irrigation Development in Cambodia. Available online: http://genocidewatch.info/images/Cambodia_11_Apr_07_Khmer_Rouge_Irrigation_Development_in_Cambodia.pdf (accessed on 15 October 2019).
  15. Dumas, L.P. Obstacles Facing Farmer-Managed Irrigation Systems in the State of Cambodia. In Design Issues in Farmer-Managed Irrigation Systems: Proceedings of an International Workshop of the Farmer-Managed Irrigation Systems Network; International Water Management Institute: Batttaramulla, Sri Lanka, 1990; p. 275. [Google Scholar]
  16. Vickery, M. Cambodia: 1975–1982; South End Press: Boston, MA, USA, 1984. [Google Scholar]
  17. Tyner, J.A. State Sovereignty, Bioethics, and Political Geographies: The Practice of Medicine under the Khmer Rouge. Environ. Plan. D Soc. Space 2012, 30, 842–860. [Google Scholar] [CrossRef]
  18. Rice, S.; Tyner, J. The Rice Cities of the Khmer Rouge: An Urban Political Ecology of Rural Mass Violence. Trans. Inst. Br. Geogr. 2017, 42, 559–571. [Google Scholar] [CrossRef]
  19. Special Assistance for Project Formation for West Tonle Sap Irrigation and Drainage Rehabilitation and Improvement Project in the Kingdom of Cambodia: Final Report; Vol. 2—Supporting Report; Japan International Cooperation Agency: Phnom Penh, Cambodia, 2009.
  20. Lorgeron, Fanny, A Pilot Project … to Serve Collective Action; GRET-ISC: Phnom Penh, Cambodia, 2010.
  21. Siphana, S.; Sotharith, C.; Vannarith, C. Cambodia’s Agriculture: Challenges and Prospects; Cambodia Institute for Cooperation and Peace: Phnom Penh, Cambodia, 2011. [Google Scholar]
  22. Technical Assistance Final Report; Egis & Key Consultants (Cambodia) Ltd.: Phnom Penh, Cambodia, 2015.
  23. Kim, S. Climate Change and Water Governance in Cambodia; Cambodian Development Resources Institute: Phnom Penh, Cambodia, 2013. [Google Scholar]
  24. Sithirith, M. Water Governance in Cambodia: From Centralized Water Governance to Farmer Water User Community. Resources 2017, 6, 44. [Google Scholar] [CrossRef]
  25. Kummu, M.; Sarkkula, J.; Koponen, J.; Nikula, J. Ecosystem Management of the Tonle Sap Lake: An Integrated Modelling Approach. Int. J. Water Resour. Dev. 2006, 22, 497–519. [Google Scholar] [CrossRef]
  26. Kummu, M. The Natural Environment and Historical Water Management of Angkor, Cambodia. In Proceedings of the 5th World Archaeological Congress, Washington, DC, USA, 22–26 June 2003. [Google Scholar]
  27. Kummu, M.; Varis, O. Sediment-Related Impacts Due to Upstream Reservoir Trapping, the Lower Mekong River. Geomorphology 2007, 85, 275–293. [Google Scholar] [CrossRef]
  28. Meshkova, L.V.; Carling, P.A. The Geomorphological Characteristics of the Mekong River in Northern Cambodia: A Mixed Bedrock–Alluvial Multi-Channel Network. Geomorphology 2012, 147, 2–17. [Google Scholar] [CrossRef]
  29. Barker, J.L.; Gunther, F.J. Landsat-4 Sensor Performance; NASA Goddard Space Flight Center: Greenbelt, MD, USA, 1983.
  30. Fletcher, R.; Penny, D.; Evans, D.; Pottier, C.; Barbetti, M.; Kummu, M.; Lustig, T. The Water Management Network of Angkor, Cambodia. Antiquity 2008, 82, 658–670. [Google Scholar] [CrossRef]
  31. Evans, D. Airborne Laser Scanning as a Method for Exploring Long-Term Socio-Ecological Dynamics in Cambodia. J. Archaeol. Sci. 2016, 74, 164–175. [Google Scholar] [CrossRef]
  32. Evans, D.; Moylan, E. Pixels, Ponds and People: Mapping Archaeological Landscapes in Cambodia Using Historical Aerial and Satellite Imagery. In Archaeology from Historical Aerial and Satellite Archives; Springer: New York, NY, USA, 2013; pp. 291–313. [Google Scholar]
  33. Bultmann, D. Irrigating a Socialist Utopia: Disciplinary Space and Population Control under the Khmer Rouge, 1975–1979. Transcience 2012, 3, 40. [Google Scholar]
  34. Kerr, J.T.; Ostrovsky, M. From Space to Species: Ecological Applications for Remote Sensing. Trends Ecol. Evol. 2003, 18, 299–305. [Google Scholar] [CrossRef]
  35. Richards, J.A.; Richards, J.A. Remote Sensing Digital Image Analysis; Springer: Berlin, Germany, 1999. [Google Scholar]
  36. Skole, D.; Tucker, C. Tropical Deforestation and Habitat Fragmentation in the Amazon: Satellite Data from 1978 to 1988. Science 1993, 260, 1905–1910. [Google Scholar] [CrossRef] [PubMed] [Green Version]
  37. Rouse, J., Jr.; Haas, R.H.; Schell, J.A.; Deering, D.W. Monitoring Vegetation Systems in the Great Plains with ERTS; NASA Goddard Space Flight Center: Greenbelt, MD, USA, 1974.
  38. Liu, L.; Zhou, J.; Jiang, D.; Zhuang, D.; Mansaray, L.R.; Hu, Z.; Ji, Z. Mineral Resources Prospecting by Synthetic Application of TM/ETM+, Quickbird and Hyperion Data in the Hatu Area, West Junggar, Xinjiang, China. Sci. Rep. 2016, 6, 21851. [Google Scholar] [CrossRef] [PubMed]
  39. Silleos, N.G.; Alexandridis, T.K.; Gitas, I.Z.; Perakis, K. Vegetation Indices: Advances Made in Biomass Estimation and Vegetation Monitoring in the Last 30 Years. Geocarto Int. 2006, 21, 21–28. [Google Scholar] [CrossRef]
  40. Sharma, A.; Hubert-Moy, L.; Buvaneshwari, S.; Sekhar, M.; Ruiz, L.; Bandyopadhyay, S.; Corgne, S. Irrigation History Estimation Using Multitemporal Landsat Satellite Images: Application to an Intensive Groundwater Irrigated Agricultural Watershed in India. Remote Sens. 2018, 10, 893. [Google Scholar] [CrossRef]
  41. Perry, C.R., Jr.; Lautenschlager, L.F. Functional Equivalence of Spectral Vegetation Indices. Remote Sens. Environ. 1984, 14, 169–182. [Google Scholar] [CrossRef]
  42. Thiam, A.K. Geographic Information Systems and Remote Sensing Methods for Assessing and Monitoring Land Degradation in the Sahel Region: The Case of Southern Mauritania; Clark University: Worchester, MA, USA, 1998. [Google Scholar]
  43. Treffner, J. Irrigation Governance in Cambodia. Analyzing the Role of Aid, Intervention Models and Institutional Traditions. Ph.D. Thesis, Irrigation and Water Engineering Group Institut des Régions Chaudes, Montpellier SupAgro, France, 2010. [Google Scholar]
  44. Masumoto, T.; Yoshida, T.; Kudo, R. Basin-Scale Irrigation Planning in Areas with Scarce Data. Irrig. Drain. 2016, 65, 22–30. [Google Scholar] [CrossRef]
  45. Chea, C.; Nang, P.; Whitehead, I.; Hirsch, P.; Thompson, A. Decentralised Governance of Irrigation Water in Cambodia: Matching Principles to Local Realities; CDRI: Phnom Penh, Cambodia, 2011. [Google Scholar]
  46. 44328-012: Uplands Irrigation and Water Resources Management Sector Project; Ministry of Water Resources and Meteorology: Phnom Penh, Cambodia, 2019.
  47. Xiao, Y.; Ouyang, Z.; Zhang, Z.; Xian, C. A Comparison of Haze Removal Algorithms and Their Impacts on Classification Accuracy for Landsat Imagery. Bol. De Ciências Geodésicas 2017, 23, 55–71. [Google Scholar] [CrossRef]
  48. Cai, W.; Liu, Y.; Li, M.; Cheng, L.; Zhang, C. A Self-Adaptive Homomorphic Filter Method for Removing Thin Cloud. In Proceedings of the IEEE 2011 19th International Conference on Geoinformatics, Shanghai, China, 24–26 June 2011; pp. 1–4. [Google Scholar]
  49. Braaten, J.D.; Cohen, W.B.; Yang, Z. Automated Cloud and Cloud Shadow Identification in Landsat MSS Imagery for Temperate Ecosystems. Remote Sens. Environ. 2015, 169, 128–138. [Google Scholar] [CrossRef]
  50. Germann, C.; Epp, H.T. Archaeological Heritage in Watershed Management and Planning. Can. Water Resour. J. 1991, 16, 401–420. [Google Scholar] [CrossRef]
  51. Tyner, J.A. Dead Labor, Landscapes, and Mass Graves: Administrative Violence during the Cambodian Genocide. Geoforum 2014, 52, 70–77. [Google Scholar] [CrossRef]
  52. Tyner, J.A.; Rice, S. To Live and Let Die: Food, Famine, and Administrative Violence in Democratic Kampuchea, 1975–1979. Political Geogr. 2016, 52, 47–56. [Google Scholar] [CrossRef]
Figure 1. (a) 1979 satellite image at the borders of Kampong Chang and Kandal provinces, Cambodia; (b) current satellite imagery from Esri. Both show the Khmer Rouge grid irrigation network. The inset in Figure 1b shows smaller canals spaced 100 m apart within the 1 km grid.
Remotesensing 11 02397 g001
Figure 2. A mosaic of fifteen Landsat scenes was needed to provide national coverage of Cambodia.
Remotesensing 11 02397 g002
Figure 3. Landsat image processing workflow.
Remotesensing 11 02397 g003
Figure 4. Closeup of two Landsat scenes, showing severe data striping on the left.
Remotesensing 11 02397 g004
Figure 5. Results of canal mapping from 1979 imagery.
Remotesensing 11 02397 g005
Figure 6. Water Storage features identified using 1979 imagery.
Remotesensing 11 02397 g006
Figure 7. 1979 image of Banteay Meanchey, Cambodia. False color infrared composite compared to normalized difference vegetation index (NDVI), Thiam’s transformed vegetation index (TTVI), and corrected transformed vegetation index (CTVI) results. In the false color image (a), haze obscured flooded areas and boundaries between water and land were hard to define. In the NDVI (b), the contrast between wet areas (blue) and farmland (yellow to brown) was much clearer, but boundaries still remained blurred. The TTVI (c) isolated the water signal but overemphasized it. This could be seen in the lower left corner of the image, where the large blue (water) area has the same index value on both sides of the dividing dike, showing a uniform blue shade across the entire section. Contrast this to the same area in (a,b), where there was a stronger (darker) water reading on the left side. CTVI (d) results showed the clearest distinction between water storage and flooded fields, and proved the most successful in defining borders between fields (pale blue) and water storage structures (darker solid blue).
Remotesensing 11 02397 g007
Figure 8. Detail of Landsat 3 path/row 137 051, showing two similar intersections in the 1979 false color imagery. Their paths are highlighted in blue below the Landsat image. Intersection a (a,c) displays canals, and intersection b (b,d) was revealed to be roadways.
Remotesensing 11 02397 g008
Figure 9. CTVI results for the same locations as in Figure 8, displayed with a standard deviation stretch (a,b), and histogram equalized stretch (c,d).
Remotesensing 11 02397 g009
Figure 10. Modern imagery of the Banteay Meanchey Site a. Planet Labs imagery 3 m resolution. Red (a) and blue (b) insets provide a closer view of canals and roads at the site.
Remotesensing 11 02397 g010
Figure 11. Modern imagery of the Banteay Meanchey Site b. Planet Labs imagery 3 m resolution. Red (a) and blue (b) insets provide a closer view of canals and roads at the site.
Remotesensing 11 02397 g011
Figure 12. Water storage features in Kep Province, Cambodia. (a) 1979 false color infrared; (b) same imagery, CTVI processed; (c) and (d) enlarged views of water storage areas visible in 1979; (e) 2019 Planet Labs imagery in false color composite; (f) same 2019 imagery, CTVI processed.
Remotesensing 11 02397 g012
Figure 13. Landsat images (60 m resolution) and Planet Labs imagery (3 m resolution) of the Trapaeng Thmar and Banteay Meanchey water storage areas, from 1979 and 2019, respectively. (a) 1979 imagery in false color infrared; (b) 1979 CTVI image; (c) and (d) are close-up images of the 1979 water storage features; (e) is the 2019 high resolution false color image, and (f) the same imagery, CTVI processed.
Remotesensing 11 02397 g013
Table 1. Accuracy matrix of canals and storage points, when ground-truthed by GPS (Global Positioning System).
GPS PointsGround-Truthed:Ground-Truthed:Ground-Truthed:TotalUser’s Accuracy
Mapped As:Water StorageCanals/Partial CanalsOther
Water Storage14401814/18 = 77%
Canals/Partial Canals32721276272/276 = 98%
Other161017N/A
Total332771311
Producer’s accuracy14/33 = 42%272/277 = 98%N/A
Overall accuracy:286/311 = 92%
Table 2. List of water storage dams identified, in terms of stability.
Dam NameYear BuiltYears Functional (Best Estimate)StatusCondition
6th January Dam19762Rehabilitated, washed away same place 1979. Repeats annually. “Has never really worked.”In use.
Daem Pring1977unknownIn use.In use; rehabilitation unknown.
Damnak Ampil/17th April1976–770“Every rainy season gates would fail within three days.”In use; still breaching during monsoon season, unable to provide enough water to farmers in dry season.
Kamping Puoy1977–78unfinishedNot finished before fall of regime.
Kampong Trauhoung1973 AbandonedAbandoned
Kandall Tuol197317Floodgate collapsed 1990s.Abandoned
Kbal Houng19763Destroyed by explosives for fishing.Partially operable. Gates broken.
Kdol unknownAbandonedAbandoned
Khang TbouunknownNot visible on current landscape.Abandoned
Khum19773Collapsed in 1980s after scavenging.In use; rehabilitation date unknown.
Koh Ph Dao19736Abandoned before 1980, never rebuilt.Abandoned
Koh Saom1974unknown In use; expanded since Khmer Rouge period, date unknown.
Kraal Kau Ta Pom19773Collapsed in 1980s after fall of regime.In use; rehabilitated 1998.
Nimitt1976unknown In use.
O Daung1977unknown“Floodgate did not work well.”In use; rehabilitation unknown.
O Thmar1976unknownOngoing piping and erosion of dike.In use; recent rehabilitation, heavy erosion occuring.
O Touk19786Destroyed by explosives for fishing.In use; rehabilitation date unknown.
Okrasa1976–772Flood gate collapsed, fixed, collapsed again.In use.
Prek Chik1977unfinishedNot finished before fall of regime, left unused until rehabilitated in 2003.In use; under major rehabilitation.
Proteh Krolaunknown In use; rehabilitation unknown.
Rom Chlech1977unknown
Rones1974–7525Deteriorated after fall of regime, collapsed 2000s.In use; rehabilitation date unknown.
Roung1975unknown Partially operable; no known rehabilitation.
Sla Reservoir Dam1977unknown In use; ongoing rehabilitation.
Thleam Ma’oam19760Collapsed multiple times due to heavy monsoon flows while under construction.In use; new dam, new dike, heavy erosion along main canal.
Trapaeng Thmar1976unfinished Not finished before fall of regime, left unused. Deliberatedly breached to distribute water because gates were never installed.In use, recent new gates built; restored 1987, 2004.
Veal Vong1976unknown In use; recent new gate installed.

