Article

Estimating Rainfall Interception of Vegetation Canopy from MODIS Imageries in Southern China

1
Key Lab of Guangdong for Utilization of Remote Sensing and Geographical Information System, Guangdong Open Laboratory of Geospatial Information Technology and Application, Guangzhou Institute of Geography, Guangzhou 510070, China
2
School of Civil and Architectural Engineering, Shandong University of Technology, Zibo 255049, China
*
Author to whom correspondence should be addressed.
Remote Sens. 2019, 11(21), 2468; https://0-doi-org.brum.beds.ac.uk/10.3390/rs11212468
Submission received: 30 August 2019 / Revised: 17 October 2019 / Accepted: 18 October 2019 / Published: 23 October 2019

Abstract

:
The interception of rainfall by vegetation canopies plays an important role in the hydrologic process of ecosystems. Most estimates of canopy rainfall interception in present studies are mainly through field observations at the plot region. However, it is difficult, yet important, to map the regional rainfall interception by vegetation canopy at a larger scale, especially in the southern rainy areas of China. To obtain a better understanding of the spatiotemporal variation of vegetation canopy rainfall interception with regard to the basin scale in this region, we extended a rainfall interception model by combining the observed rainfall data and moderate resolution imaging spectroradiometer leaf area index (MODIS_LAI) data to quantitatively estimate the vegetation canopy rainfall interception rate (CRIR) at small/medium basin scales in Guangdong Province, which is undergoing large changes in vegetation cover due to rapid urban expansion in the area. The results showed that the CRIR in Guangdong declined continuously during 2004–2012, but increased slightly in 2016, and the spatial variability of CRIR showed a diminishing yearly trend. The CRIR also exhibited a distinctive spatial pattern, with a higher rate to the east and west of the mountainous areas and a lower rate in the central mountainous and coastal areas. This pattern was more closely related to the spatial variation of the LAI than that of rainfall due to frequent extreme rainfall events saturating vegetation leaves. Further analysis demonstrated that forest coverage, instead of background climate, has a certain impact on the canopy rainfall interception, especially the proportion of broad-leaved forests in the basin, but more in-depth study is warranted in the future. In conclusion, the results of this study provide insights into the spatiotemporal variation of canopy rainfall interception at the basin scale of the Guangdong Province, and suggest that forest cover should be increased by adjusting the species composition to increase the proportion of native broad-leaved species based on the local condition within the basin. In addition, these results would be helpful in accurately assessing the impacts of forest ecosystems on regional water cycling, and provide scientific and practical implications for water resources management.

Graphical Abstract

1. Introduction

Canopy rainfall interception is the amount of rainwater that is intercepted, stored, and subsequently lost by evaporation from the canopy [1,2]. It is a significant component of the water cycle in the vegetation ecosystem since it influences many hydrological processes such as infiltration, erosion, soil moisture distribution, runoff dynamics, and flood generation [3,4]. Considering that canopy rainfall interception is an important component of the water balance in a terrestrial ecosystem, an accurate estimation of rainfall interception by the vegetation canopy is of great value in the study of hydrological processes [5]. This hydrological process is also very important in water resource management and in the context of climate change [2,6].
Since canopy rainfall interception cannot be measured directly, it is usually estimated by determining the difference between gross rainfall and the sum of throughfall and stemflow [7,8,9], which are commonly assessed through the study of individual leaves or whole plants and extrapolated to entire plant communities. This means that an average value is therefore generally obtained by using a large number of collectors and a large collection area [10,11]. Ultimately, these methods are time-consuming and expensive to implement. Although these field observations provide high precision data on a small scale, the extrapolation of rainfall interception data to a larger area is difficult to achieve, and the spatiotemporal patterns of interception are also difficult to map quantitatively. Many scientists have attempted to find a cost-effective approach in documenting changes over large geographic regions in both time and space [2,12,13,14]. Modeling has become an effective tool in understanding the spatial distribution of canopy interception at a larger scale [6,15,16]. Many models of the rainfall interception process have been developed [17,18,19]. The best-known models for canopy rainfall interception are the Rutter model [20,21] and Gash model [22]. One of the most important parameters in the Gash and Rutter models is canopy storage capacity ( S m a x ) [22,23,24]. This parameter indicates that exceeding the threshold storm size most likely results in a significant overflow of water through the canopy and thus downward toward the soil surface [5,25]. Therefore, canopy storage capacity is a key factor in controlling rainfall interception by vegetation canopy [7,26,27].
However, estimating an average value of S m a x in large or medium-sized areas is difficult due to the high spatial variability of vegetation. Many studies have demonstrated that canopy rainfall storage capacity is generally related to the leaf area index (LAI), which can be derived from remote-sensing images [28,29]. Many publications have shown that remote sensing is widely recognized as an effective tool for spatially and temporally monitoring the changing patterns of vegetation, and it has significant advantages over in situ measurements [6,30]. The ability to rapidly assess the LAI using vegetation indices from remote-sensing images provides a means of determining the phenological characteristics of cover vegetation over a wide geographic area [31,32,33].
Guangdong Province is situated in a subtropical zone in southern China, which has been confronted by a large change in vegetation cover due to the rapidly developing economy and subsequent urban expansion [34,35]. In addition, many studies have shown that, in the context of climate change, the number of extreme rainfall days and the intensity of storms have increased, and abnormal rainfall and flood emergencies have constantly occurred in Guangdong [36,37]. For these reasons, in addition to its unique soil characteristics with thin soil layers, disproportionate soil texture, and its specific topography and landform characteristics with mountain and hilly areas occupying approximately 60 % of the total area [38,39], Guangdong is particularly susceptible to soil erosion, especially that caused by rainfall erosive processes [40]. Given that rainfall interception by vegetation canopy, which accounts for a large proportion of atmospheric precipitation (totals were between 10% and 50% of annual gross rainfall) [41,42,43], plays an important role in ecosystem hydrological processes including infiltration, erosion, and even runoff [44], it is all the more important to quantitatively simulate and analyze vegetation canopy rainfall interception as well as its spatiotemporal variation characteristics in Guangdong Province. However, studies have been focused more frequently on the characteristics of rainfall interception at the plot scale and less often at the basin scale because impact factors such as precipitation and vegetation characteristics are difficult to model spatially.
In this study, a site-based atmospheric rainfall interception of the vegetation canopy model was applied to moderate resolution imaging spectroradiometer leaf area index (MODIS_LAI) remote sensing data coupled with observed precipitation data from weather stations. We quantitatively estimated the rainfall interception capacity of the vegetation canopy in Guangdong at the small/medium basin scale from 2004 to 2016. This is a novel application of remote sensing technology in a combination of ecological models. The results could be very helpful in accurately assessing the impacts of forest ecosystem on regional water cycling and provide scientific and practical implications for water resource management.

2. Materials and Methods
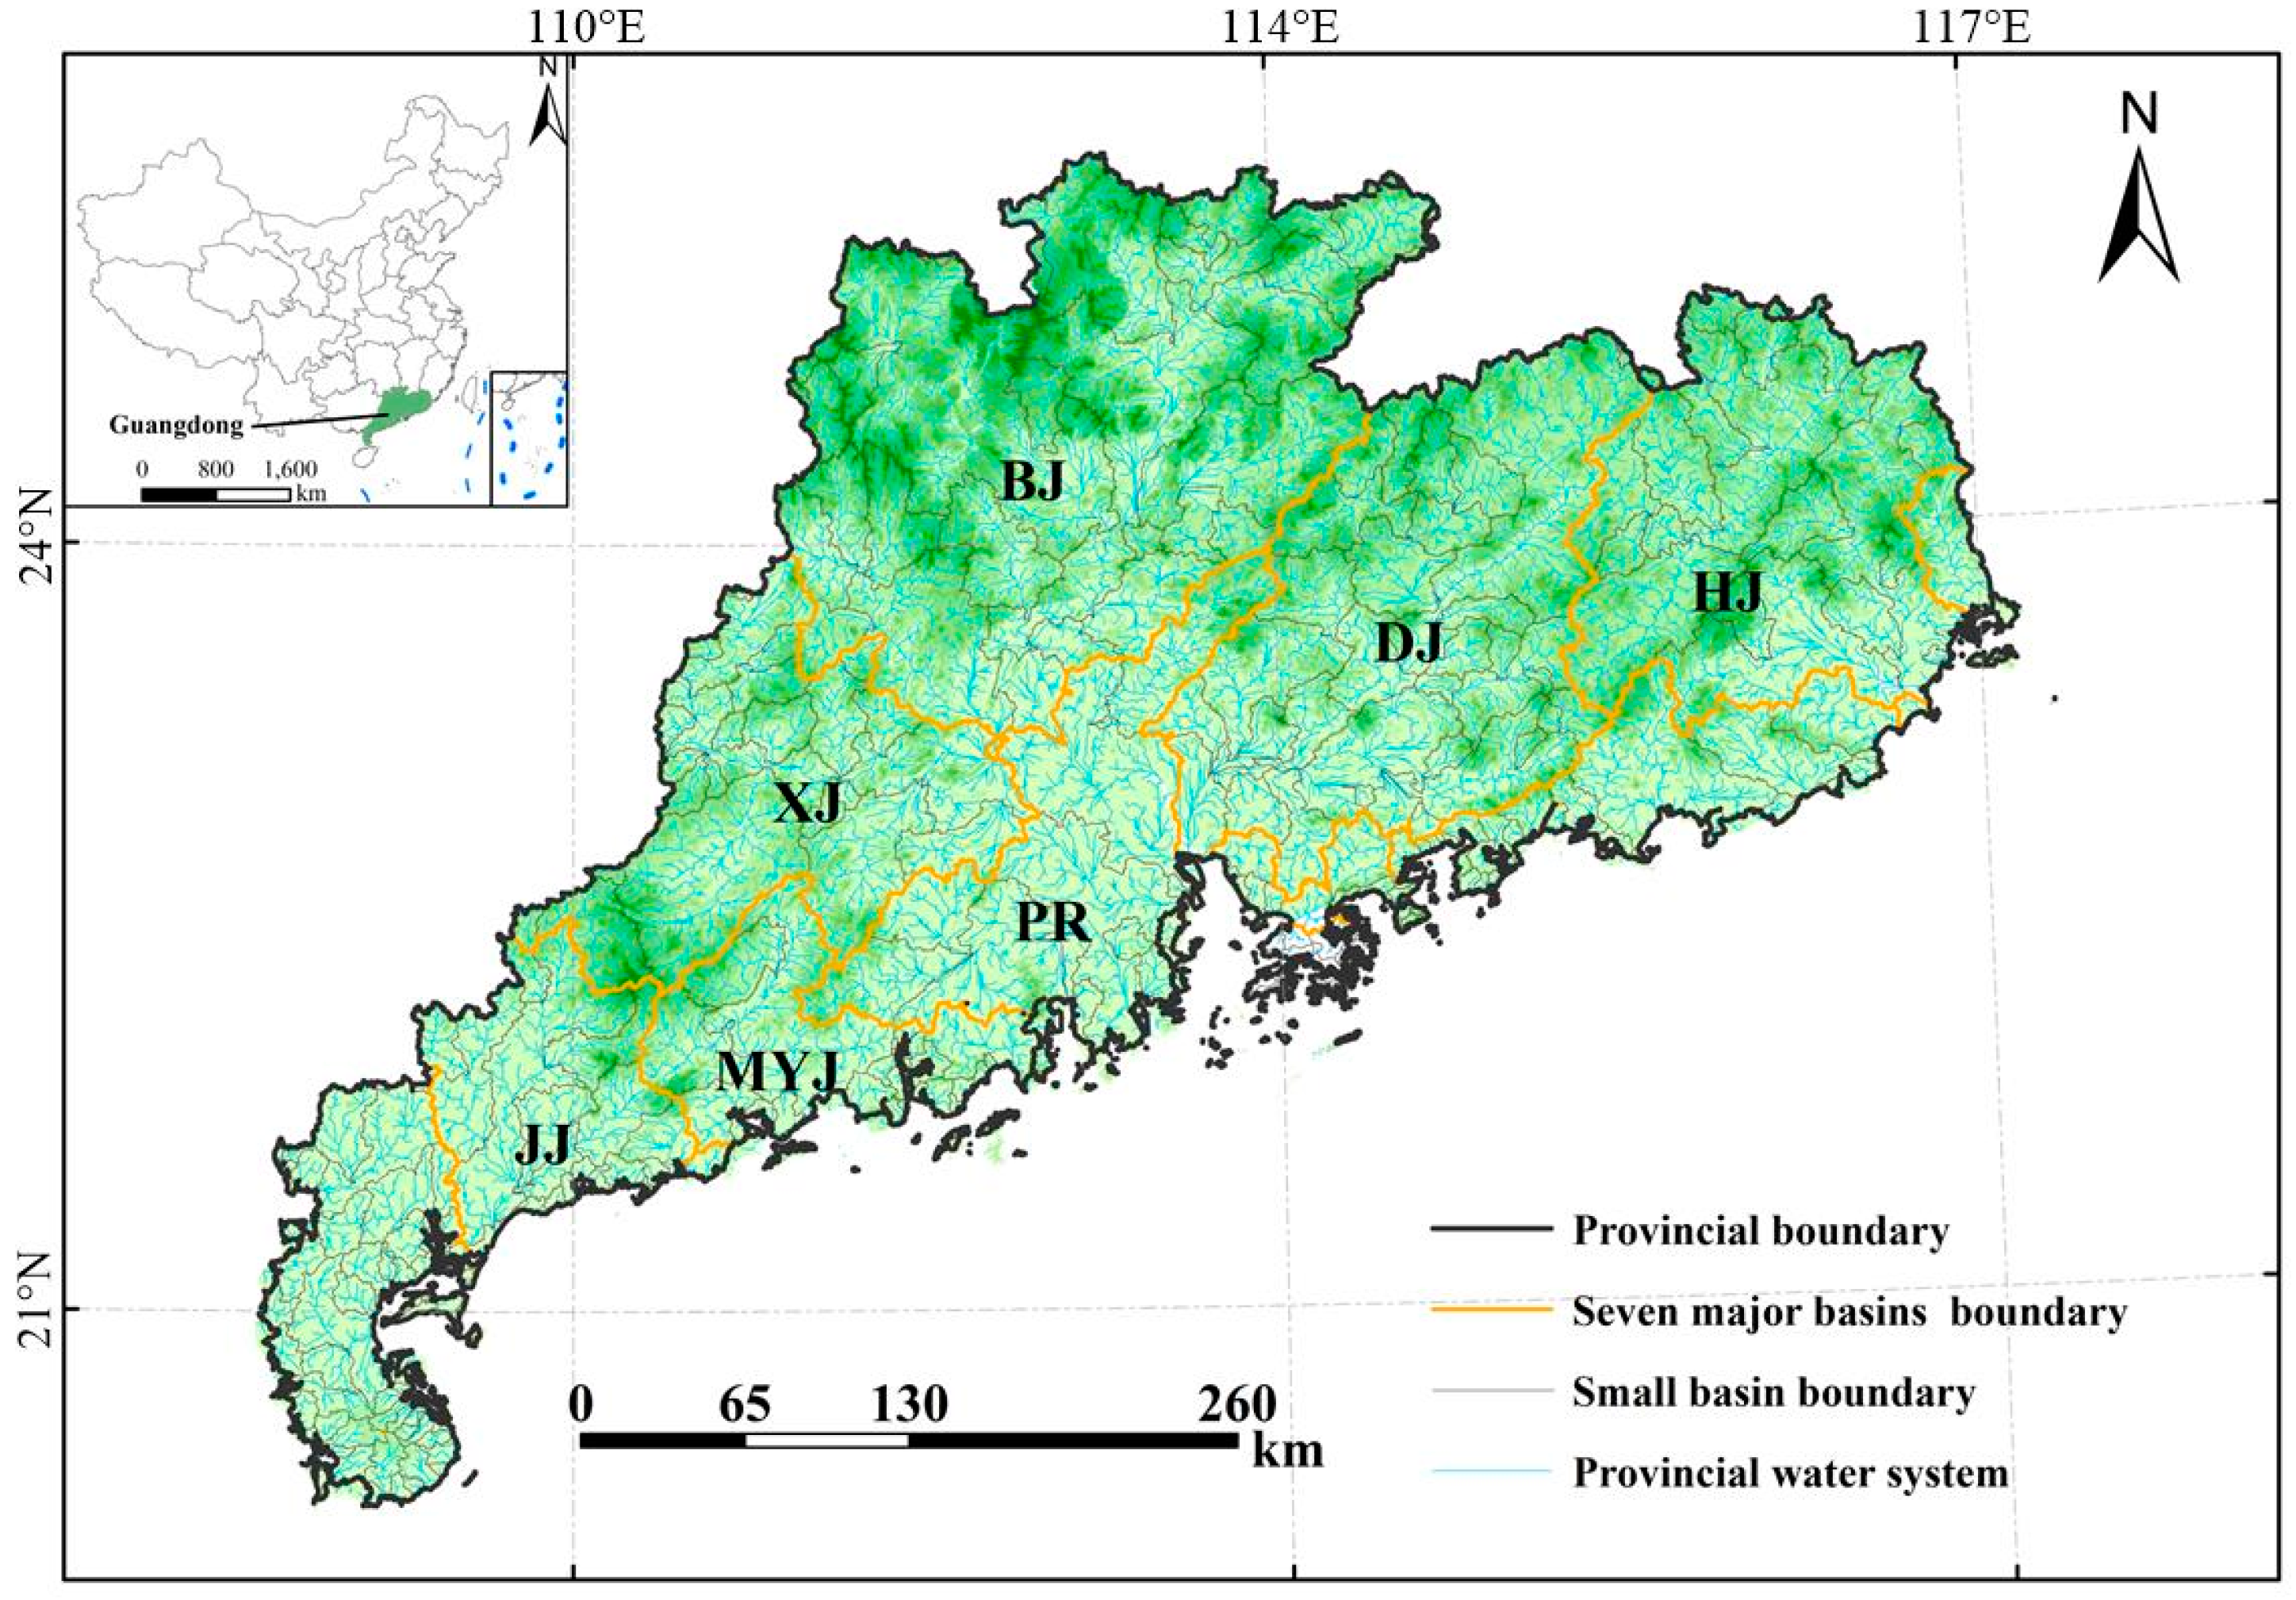
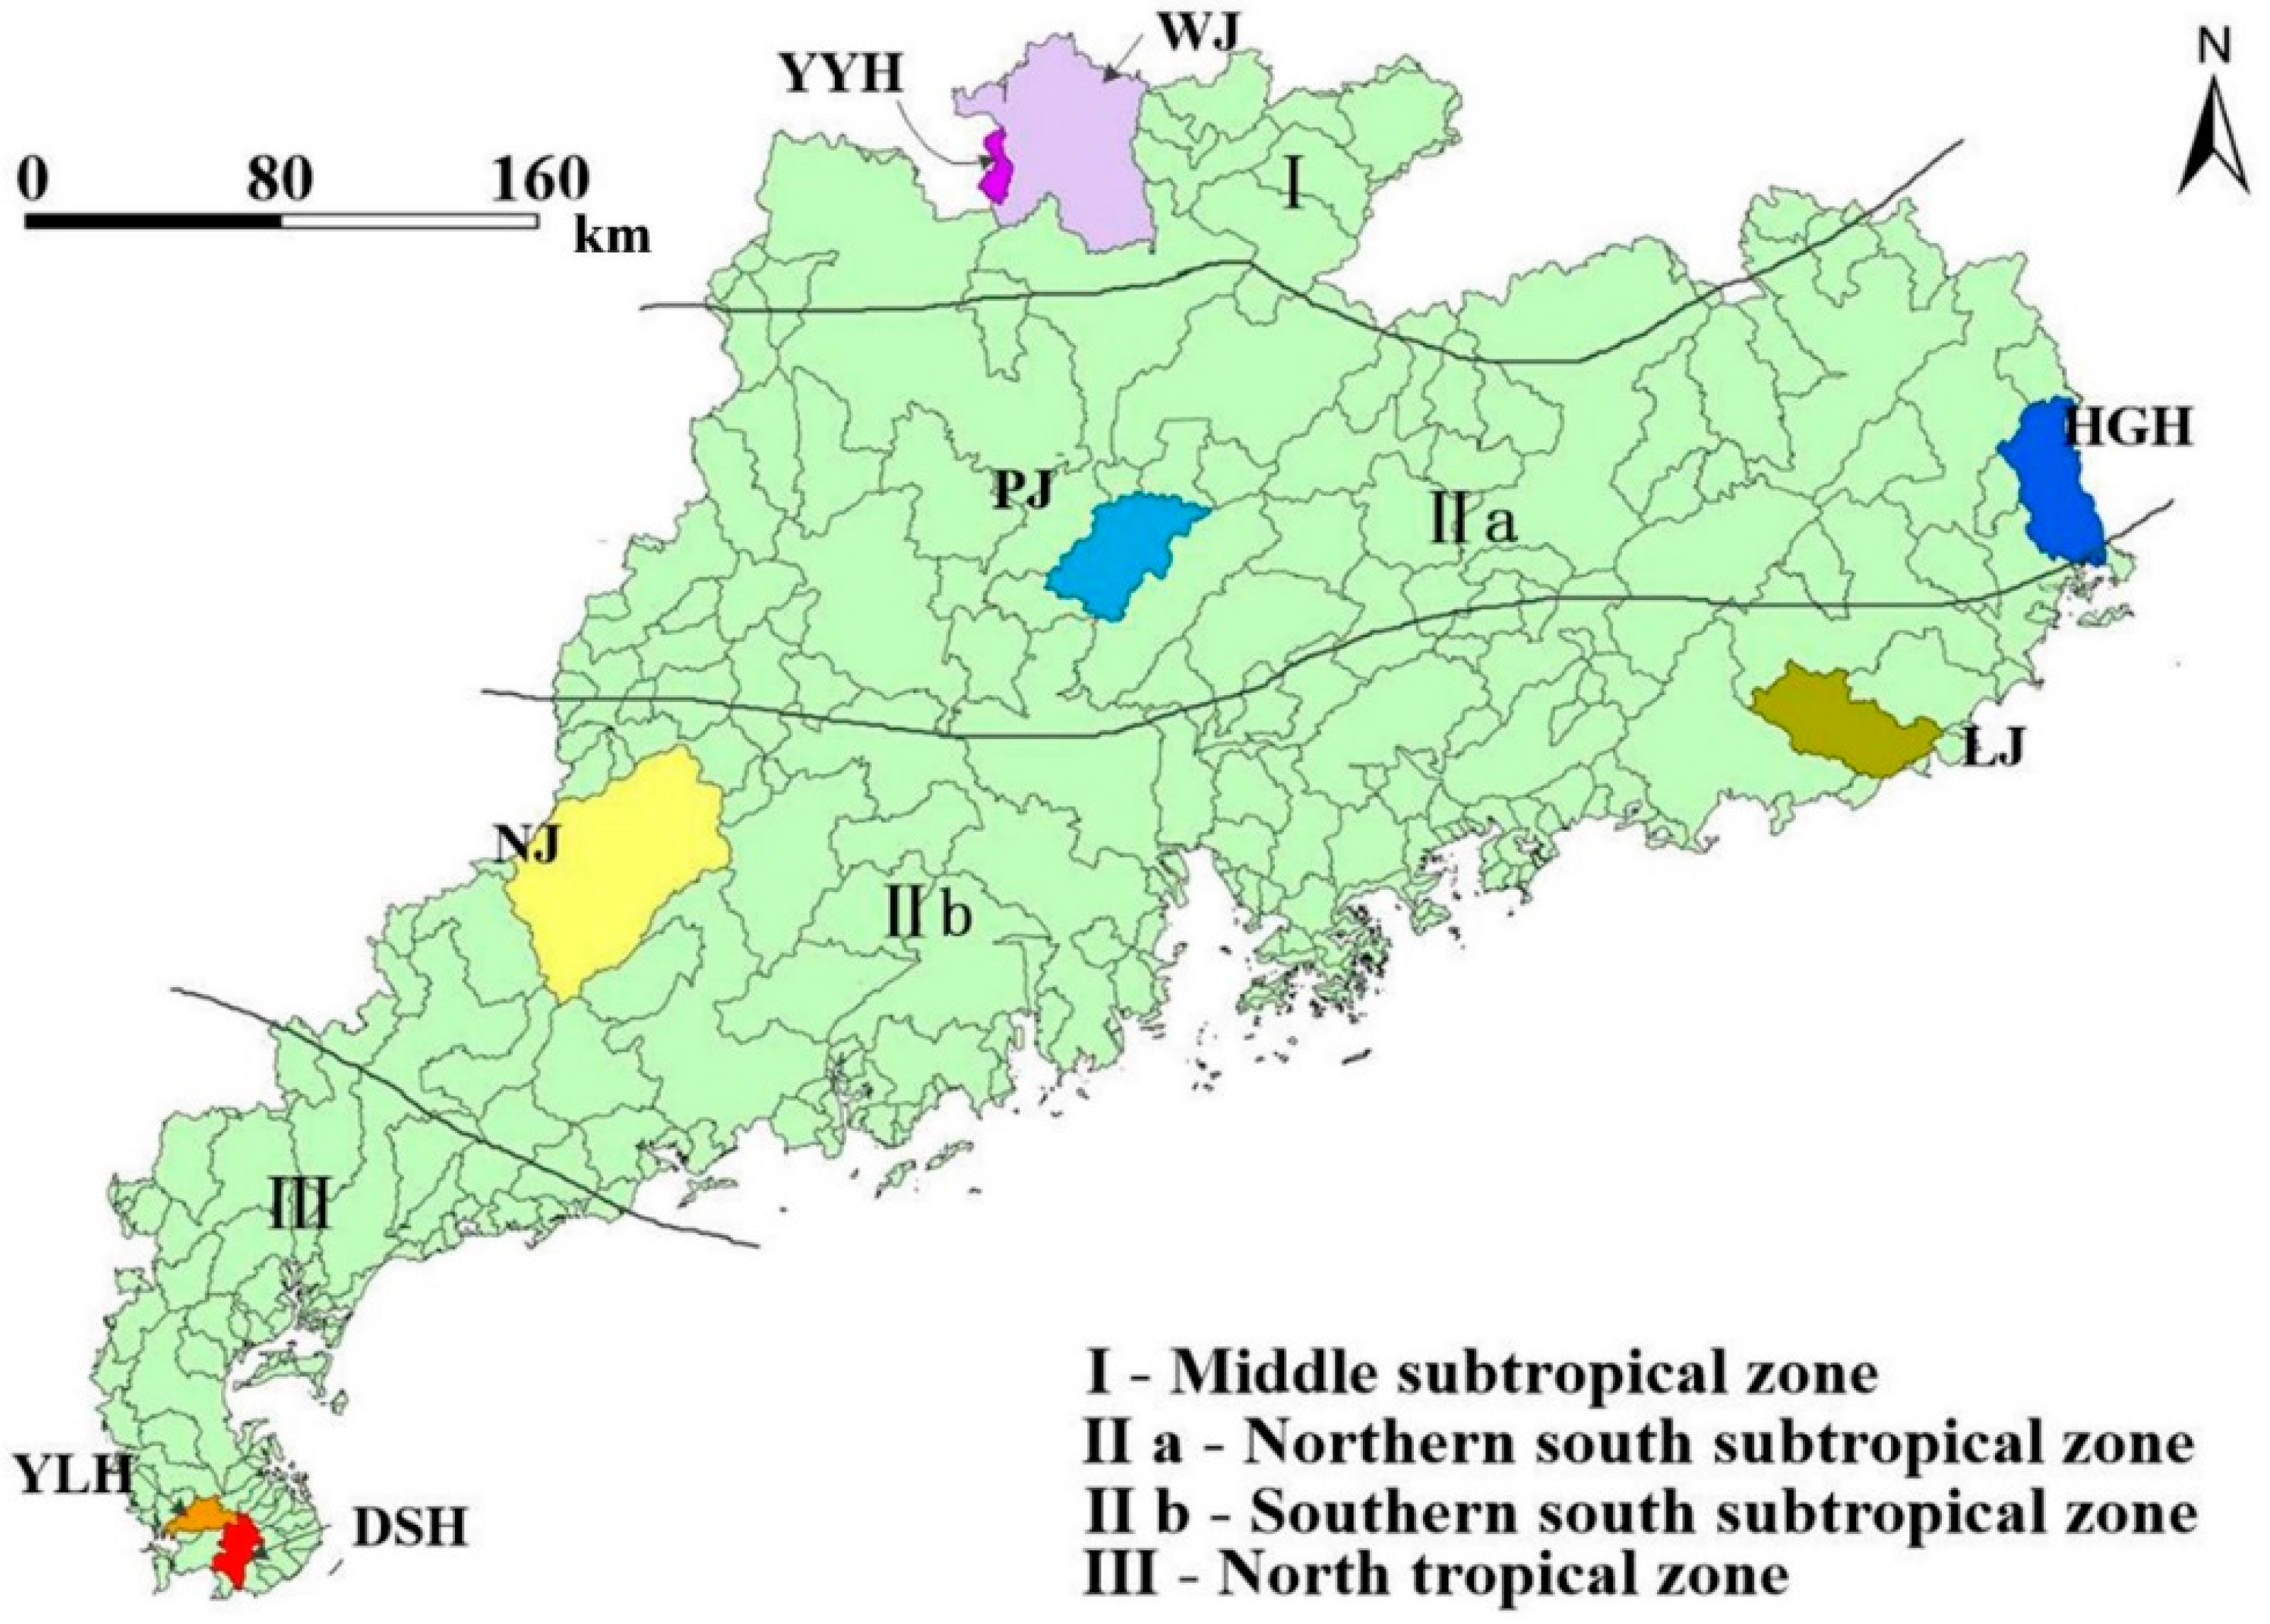
2.1. Study Area

Guangdong Province is located in southern China (20°14′–25°31′N, 109°40′–117°20′E) and occupies an area of 179,752 km2. The climate of Guangdong is tropical and subtropical monsoon and the 12 months can be divided into humid (April to September) and dry (October to March) seasons. The annual mean temperature is 22 °C, and the annual precipitation amount is about 1770 mm, of which 1384 mm (78%) and 386 mm (22%) fall in the wet and dry seasons, respectively [45].
The soil distribution in Guangdong is characterized by an obvious zonality. Hapic Acrisol, Haplic Ferralsol, and Rhodic Ferralsol are distributed from north to south in this region, which accounts for 37.96%, 24.8%, and 5.15% of soil composition, respectively. The tropical and subtropical broad-leaved evergreen forests are the major climax forest communities. The sclerophyllous evergreen savanna shrubs and grasslands are the secondary climax forest communities [46]. However, due to poor soil fertility and interference by humans, the original forest community structure has been severely damaged. To reduce the environmental problems of the areas, forestry protection policies and afforestation projects have been implemented, and the amount of forestland has since increased [46,47]. However, the number of natural forests has decreased while the number of planted forests has increased.
The main landform type in Guangdong is mountainous, and between the mountains there are different sized valleys and basins. Guangdong is divided into 1367 relatively independent and closed small basins, and the drainage area of each small basin is lower than 50 km2 (Figure 1). In addition, seven major basins, with drainage areas larger than 3000 km2, were selected to be the main research objects of this study including the Hanjiang (HJ) basin, Dongjiang (DJ) basin, Beijiang (BJ) basin, Xijiang (XJ) basin, the Pearl River (PR) basin, Moyangjiang (MYJ) basin, and Jianjiang (JJ) basin (Figure 1). The regions beyond these seven major basins with incomplete drainage areas were classified as ‘other areas’ in this study.

2.2. Data Collection

2.2.1. Rainfall Data

Based on ArcGIS software, the gridded daily time-series images of rainfall data with a resolution of 500 m were produced by applying the interpolation method to remain consistent with the moderate resolution imaging spectroradiometer leaf area index (MODIS_LAI) gridded data of 500 m resolution. Three interpolation methods (e.g., inverse distance weighting (IDW), Kriging, and Spline) were fully evaluated before we chose a suitable method to use in this study. A point-by-point assessment was conducted and involved a comparison of the interpolated daily rainfall data in the grid cell of 500 m resolution from June to August 2015 by reference to the 238 situ-observed rainfall data in Wu et al. (2019) [48]. The rainfall data were ultimately interpolated to grid cells by using the IDW method due to its higher accuracy in this study (Figure S1). These grid cell data were interpolated with daily precipitation data from January 2004 to December 2016 collected from 87 in situ observation stations belonging to the Guangdong Provincial Meteorological Bureau.

2.2.2. Leaf Area Index (LAI) Data

Due to the low resolution of the early remote sensing data and the uncertainty of the products’ data quality from the different sources, it is difficult to ensure the comparability of the products. In this study, the MODIS terrestrial standard product MOD13A1 (16-day composited vegetation index product with a spatial resolution of 500 m) was acquired between February 2004 and December 2016 in hierarchical data format (HDF) from the geospatial data cloud [49], which is maintained by the Scientific Data Center of the Computer Network Information Center, Chinese Academy of Sciences.
Compared with the National Oceanic and Atmospheric Administration (NOAA) satellite and other Landsat data, the rate of space separation has significantly improved. The spatial resolution has increased by one order of magnitude from the kilometer level of NOAA to the 100-meter level of MODIS. Second, the time resolution is more advantageous. The MODIS satellite passes through four times a day (while the NOAA satellite passes through only two times a day) and has a greater real-time monitoring capacity for a variety of sudden, rapidly changing natural disasters. Third, the spectral resolution has been greatly improved. The MODIS satellite has 36 wavebands (while the NOAA satellite only has five wavebands), and its multi-channel observation enhances the ability to observe the Earth’s complex systems and surface types.
The MODIS_LAI data were spliced and clipped by ENVI software, and the LAI data of Guangdong were extracted. Next, the data were averaged by ArcGIS software to obtain the monthly and annual LAI gridded data with a resolution of 500 m for 2004 to 2016. In order to ensure the accuracy of the results, this study only selected the high-quality MODIS_LAI data for analysis.
In order to more clearly reveal the spatial and temporal variation patterns in Guangdong during the period of 2004 to 2016, we only present the results and spatial quantization maps for the years 2004, 2008, 2012, and 2016 in the text. The integrated spatial quantization maps from 2004 to 2016 are presented in the Supplementary Materials.

2.3. Methodology

2.3.1. Canopy Rainfall Interception Model

Rainfall interception by vegetation canopy is simulated by calculating a maximum storage capacity (mm, S m a x ), which is filled during rainfall. The maximum interception storage capacity is estimated using an equation developed by De Roo et al. [50]:
S m a x = 0.935 + 0.498 × L A I 0.00575 × L A I 2
where LAI is the leaf area index.
Cumulative interception during each rainfall event is simulated using an equation developed by Aston [51], which is modified from Merriam [52]:
S v = S m a x × [ 1 e η P c u m S m a x ]
where S v is the canopy rainfall interception (mm); P c u m is the cumulative rainfall (mm) during each rainfall event; and η is the correction factor, equal to (0.046 × LAI). The theoretical assumption of the equation is when P c u m = 0, S v = 0, and P c u m , S v = Maximum storage capacity ( S m a x ).

2.3.2. Canopy Rainfall Interception Rate (CRIR)

The CRIR of vegetation is calculated by the following equation:
a = S v P c u m × 100
where a is the CRIR (%).
To verify the precision and validity of the interception model, the canopy rainfall interception rate of 24 typical and relative heavy precipitation events from our previous study [48] were chosen as the observed data to validate the corresponding modeled rainfall interception rate. Through the verification of error analysis, the accuracy and reliability of the model was feasible in this study (Figure S2).

2.3.3. Propensity Score Analysis

To clarify the temporal variation characteristics of each basin, a unary linear regression model was used to calculate the change in slope from 2004 to 2016, namely the propensity score (SLOPE), which was used to analyze the linear trend of CRIR for each basin [53]:
S L O P E = n × i = 1 n x i A i i = 1 n x i i = 1 n A i n × i = 1 n x i 2 ( i = 1 n x i ) 2
where   n is the total number of years (13); x i is the i year (2004 is the first year); and A i represents the corresponding vegetation CRIR for the i year.

2.3.4. Categorization of Canopy Rainfall Interception

To reflect the spatial distribution characteristics of the vegetation canopy rainfall interception in Guangdong, based on the canopy rainfall interception of all small basins in 2004, the subregions of Guangdong were divided into three areas with different levels of interception (high, moderate, and low), as shown in Table 1.

3. Results and Analysis

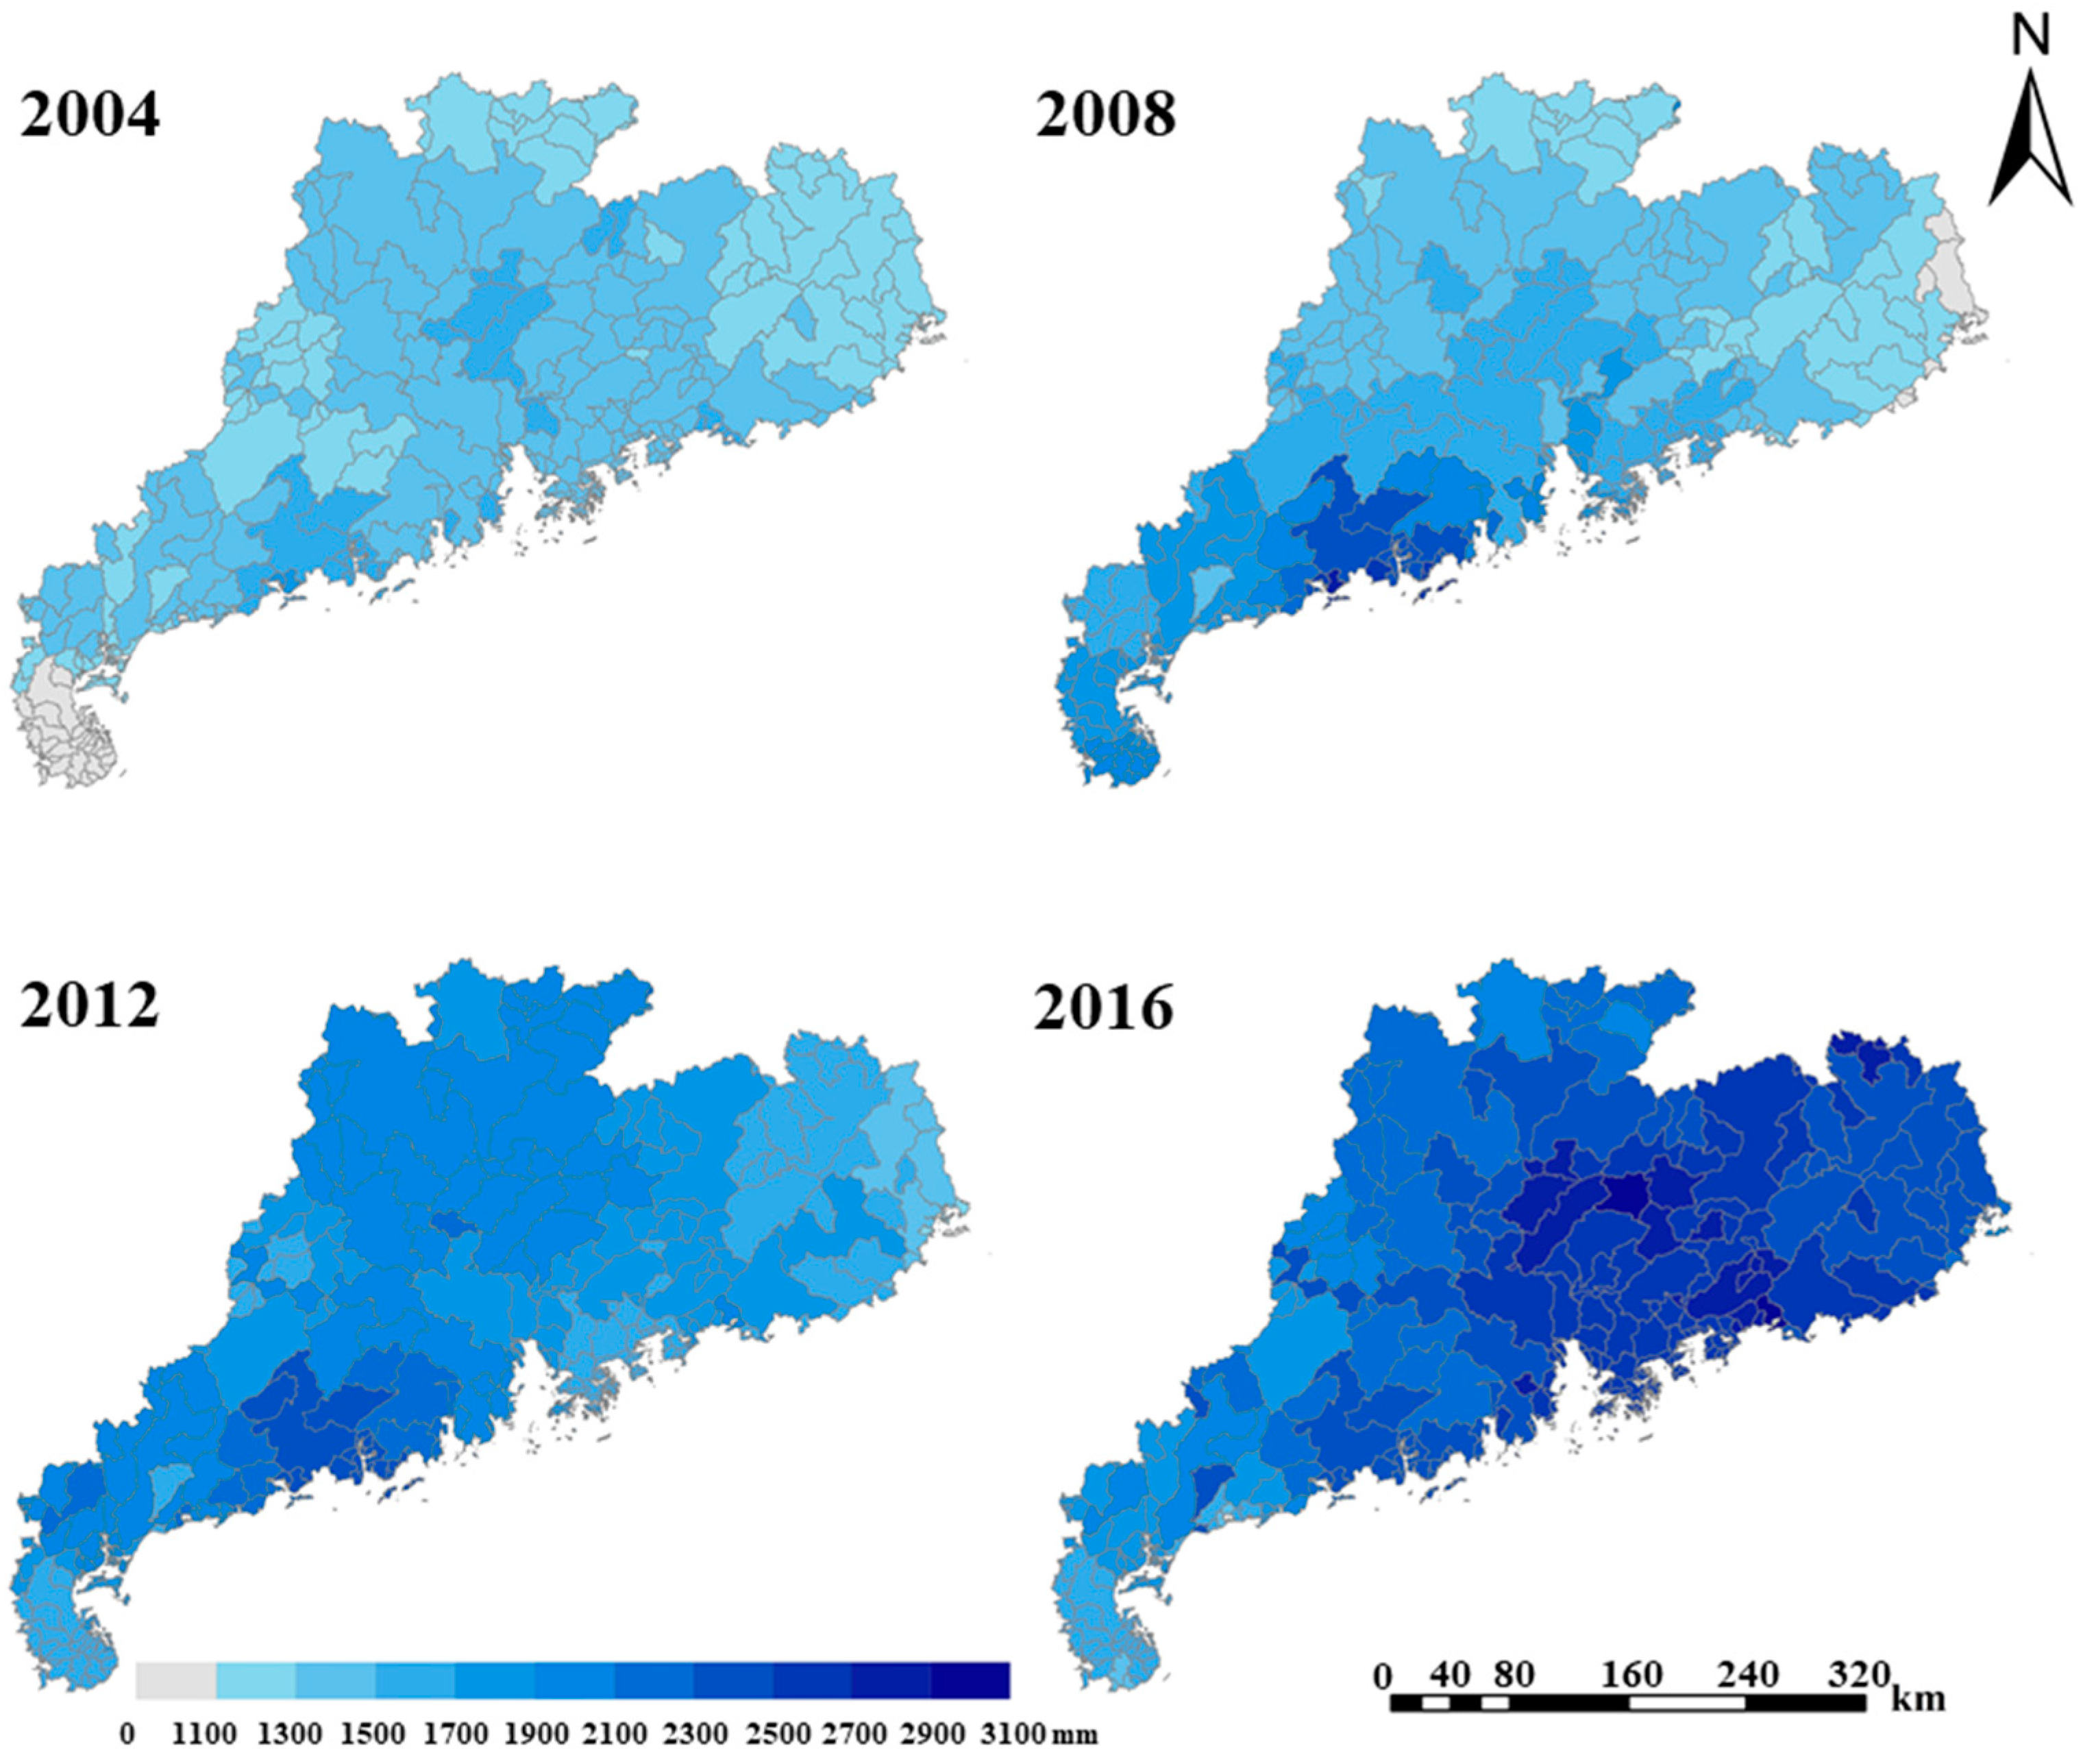
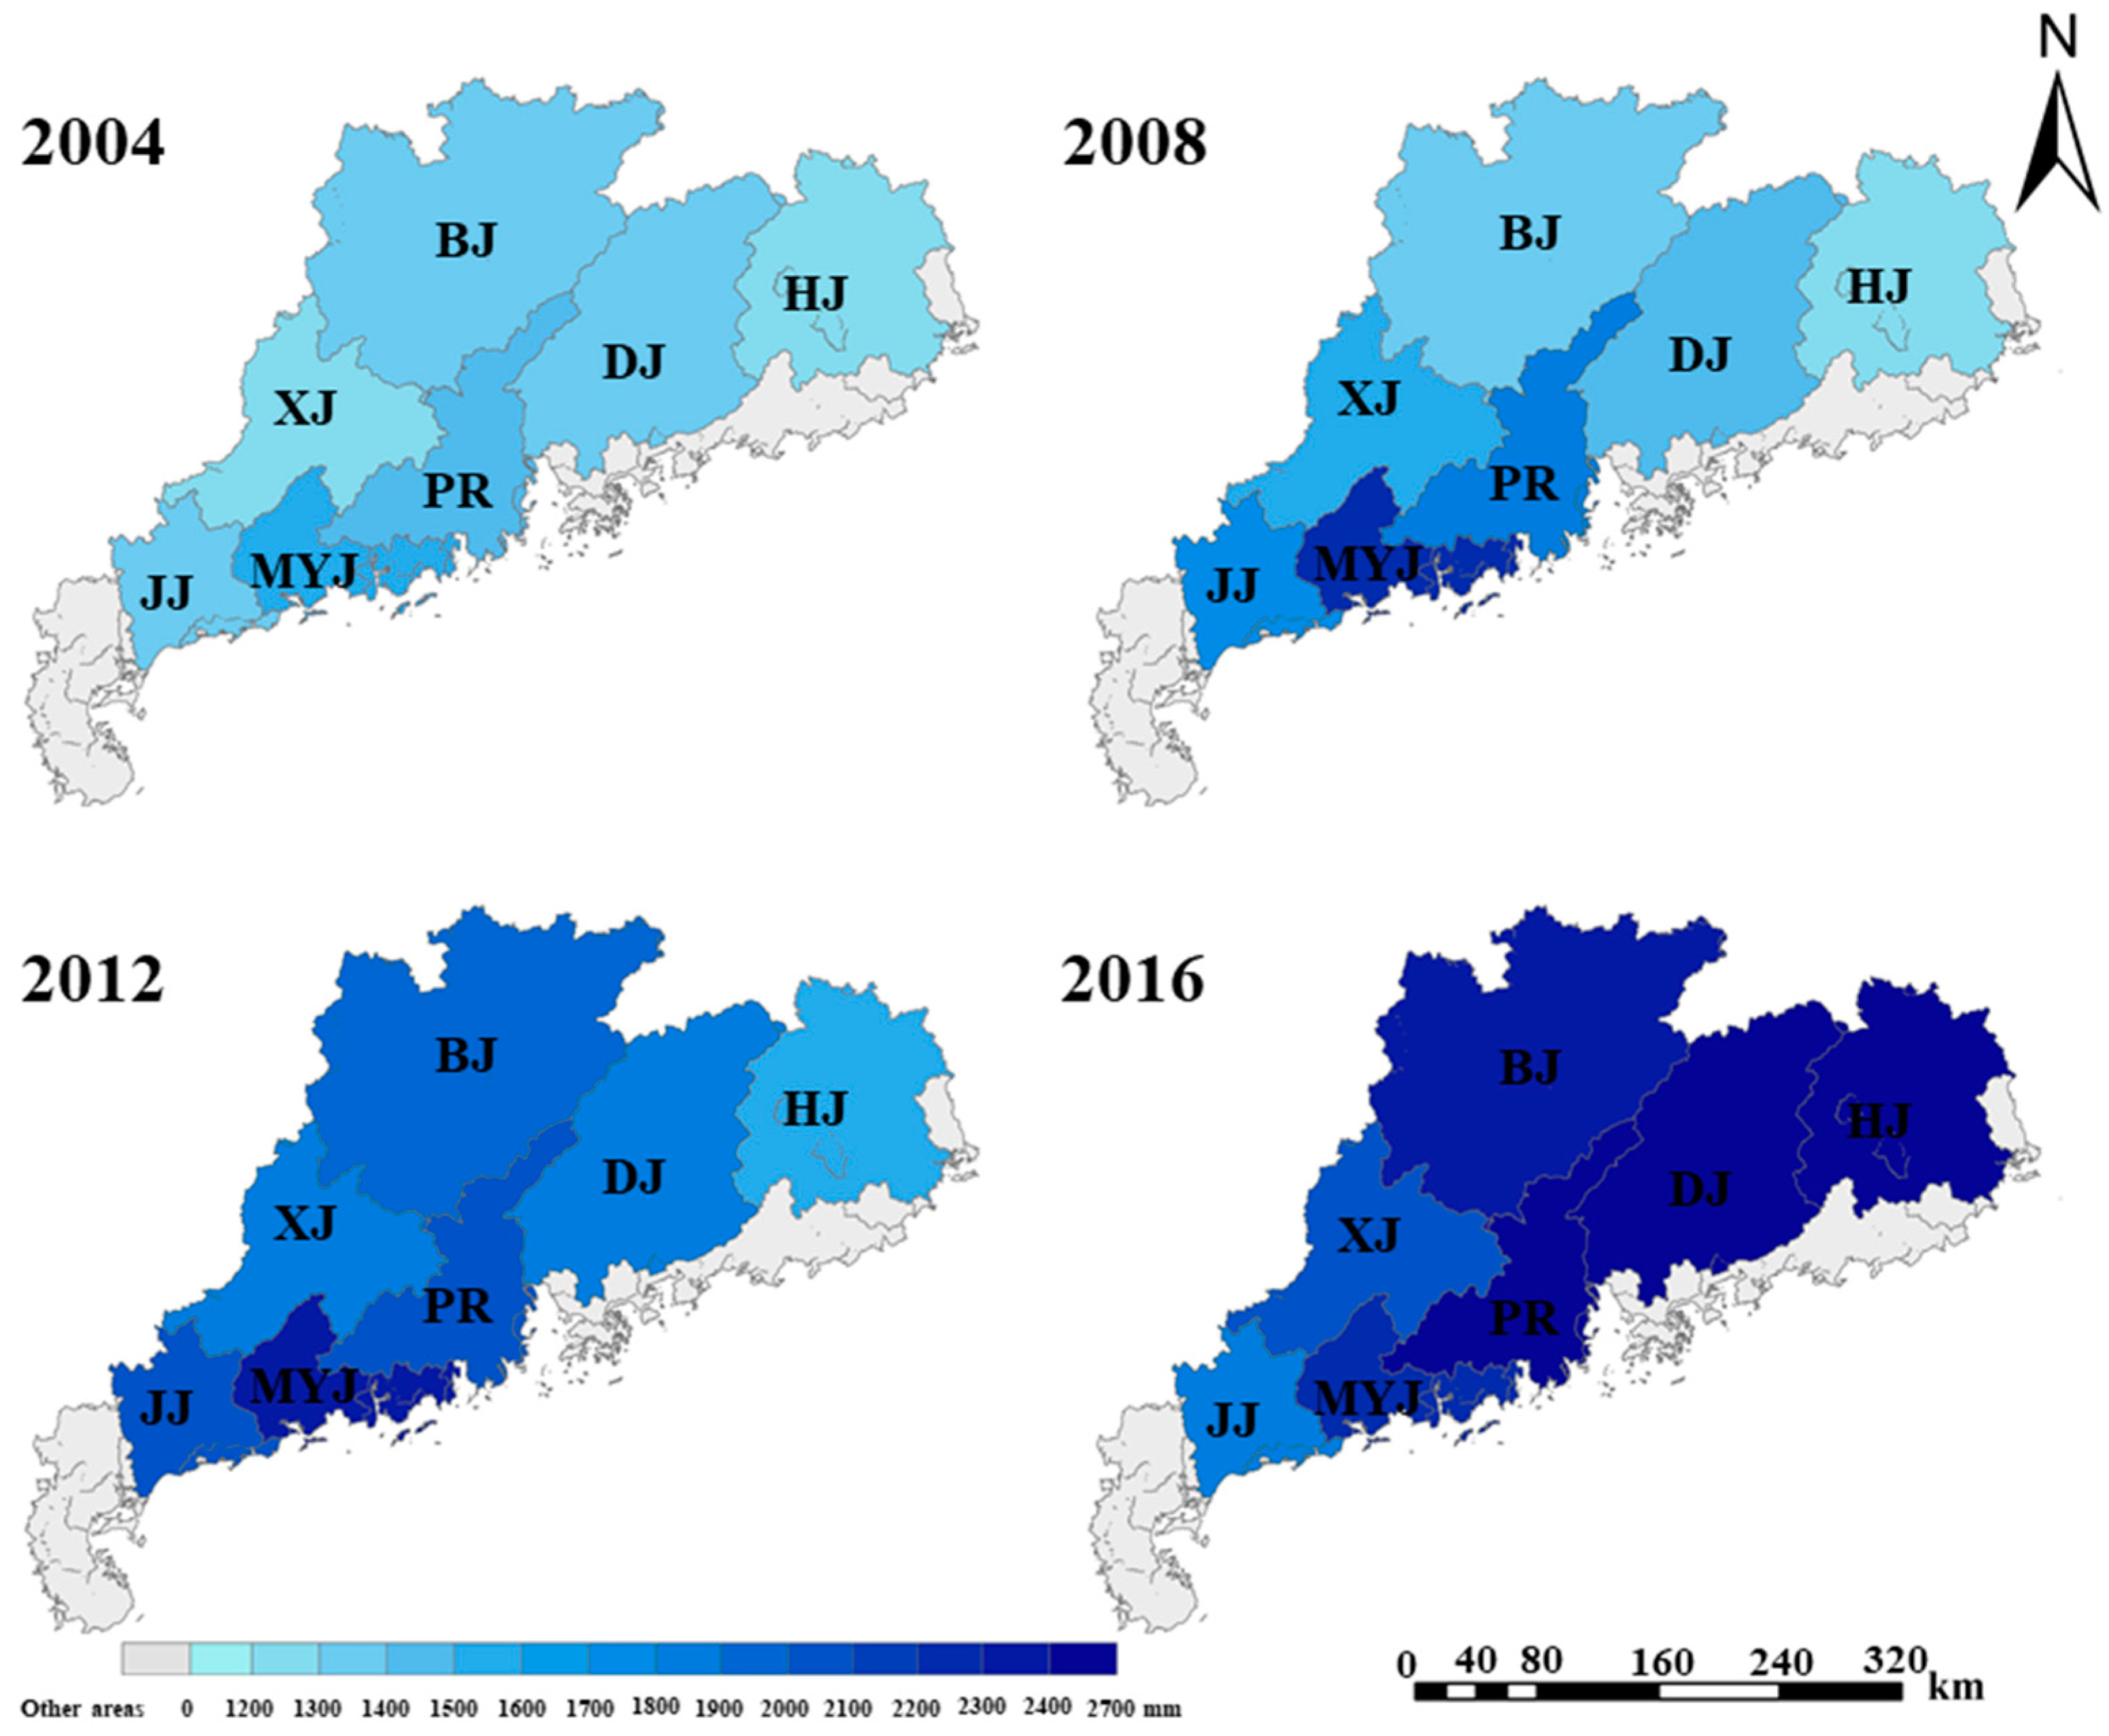
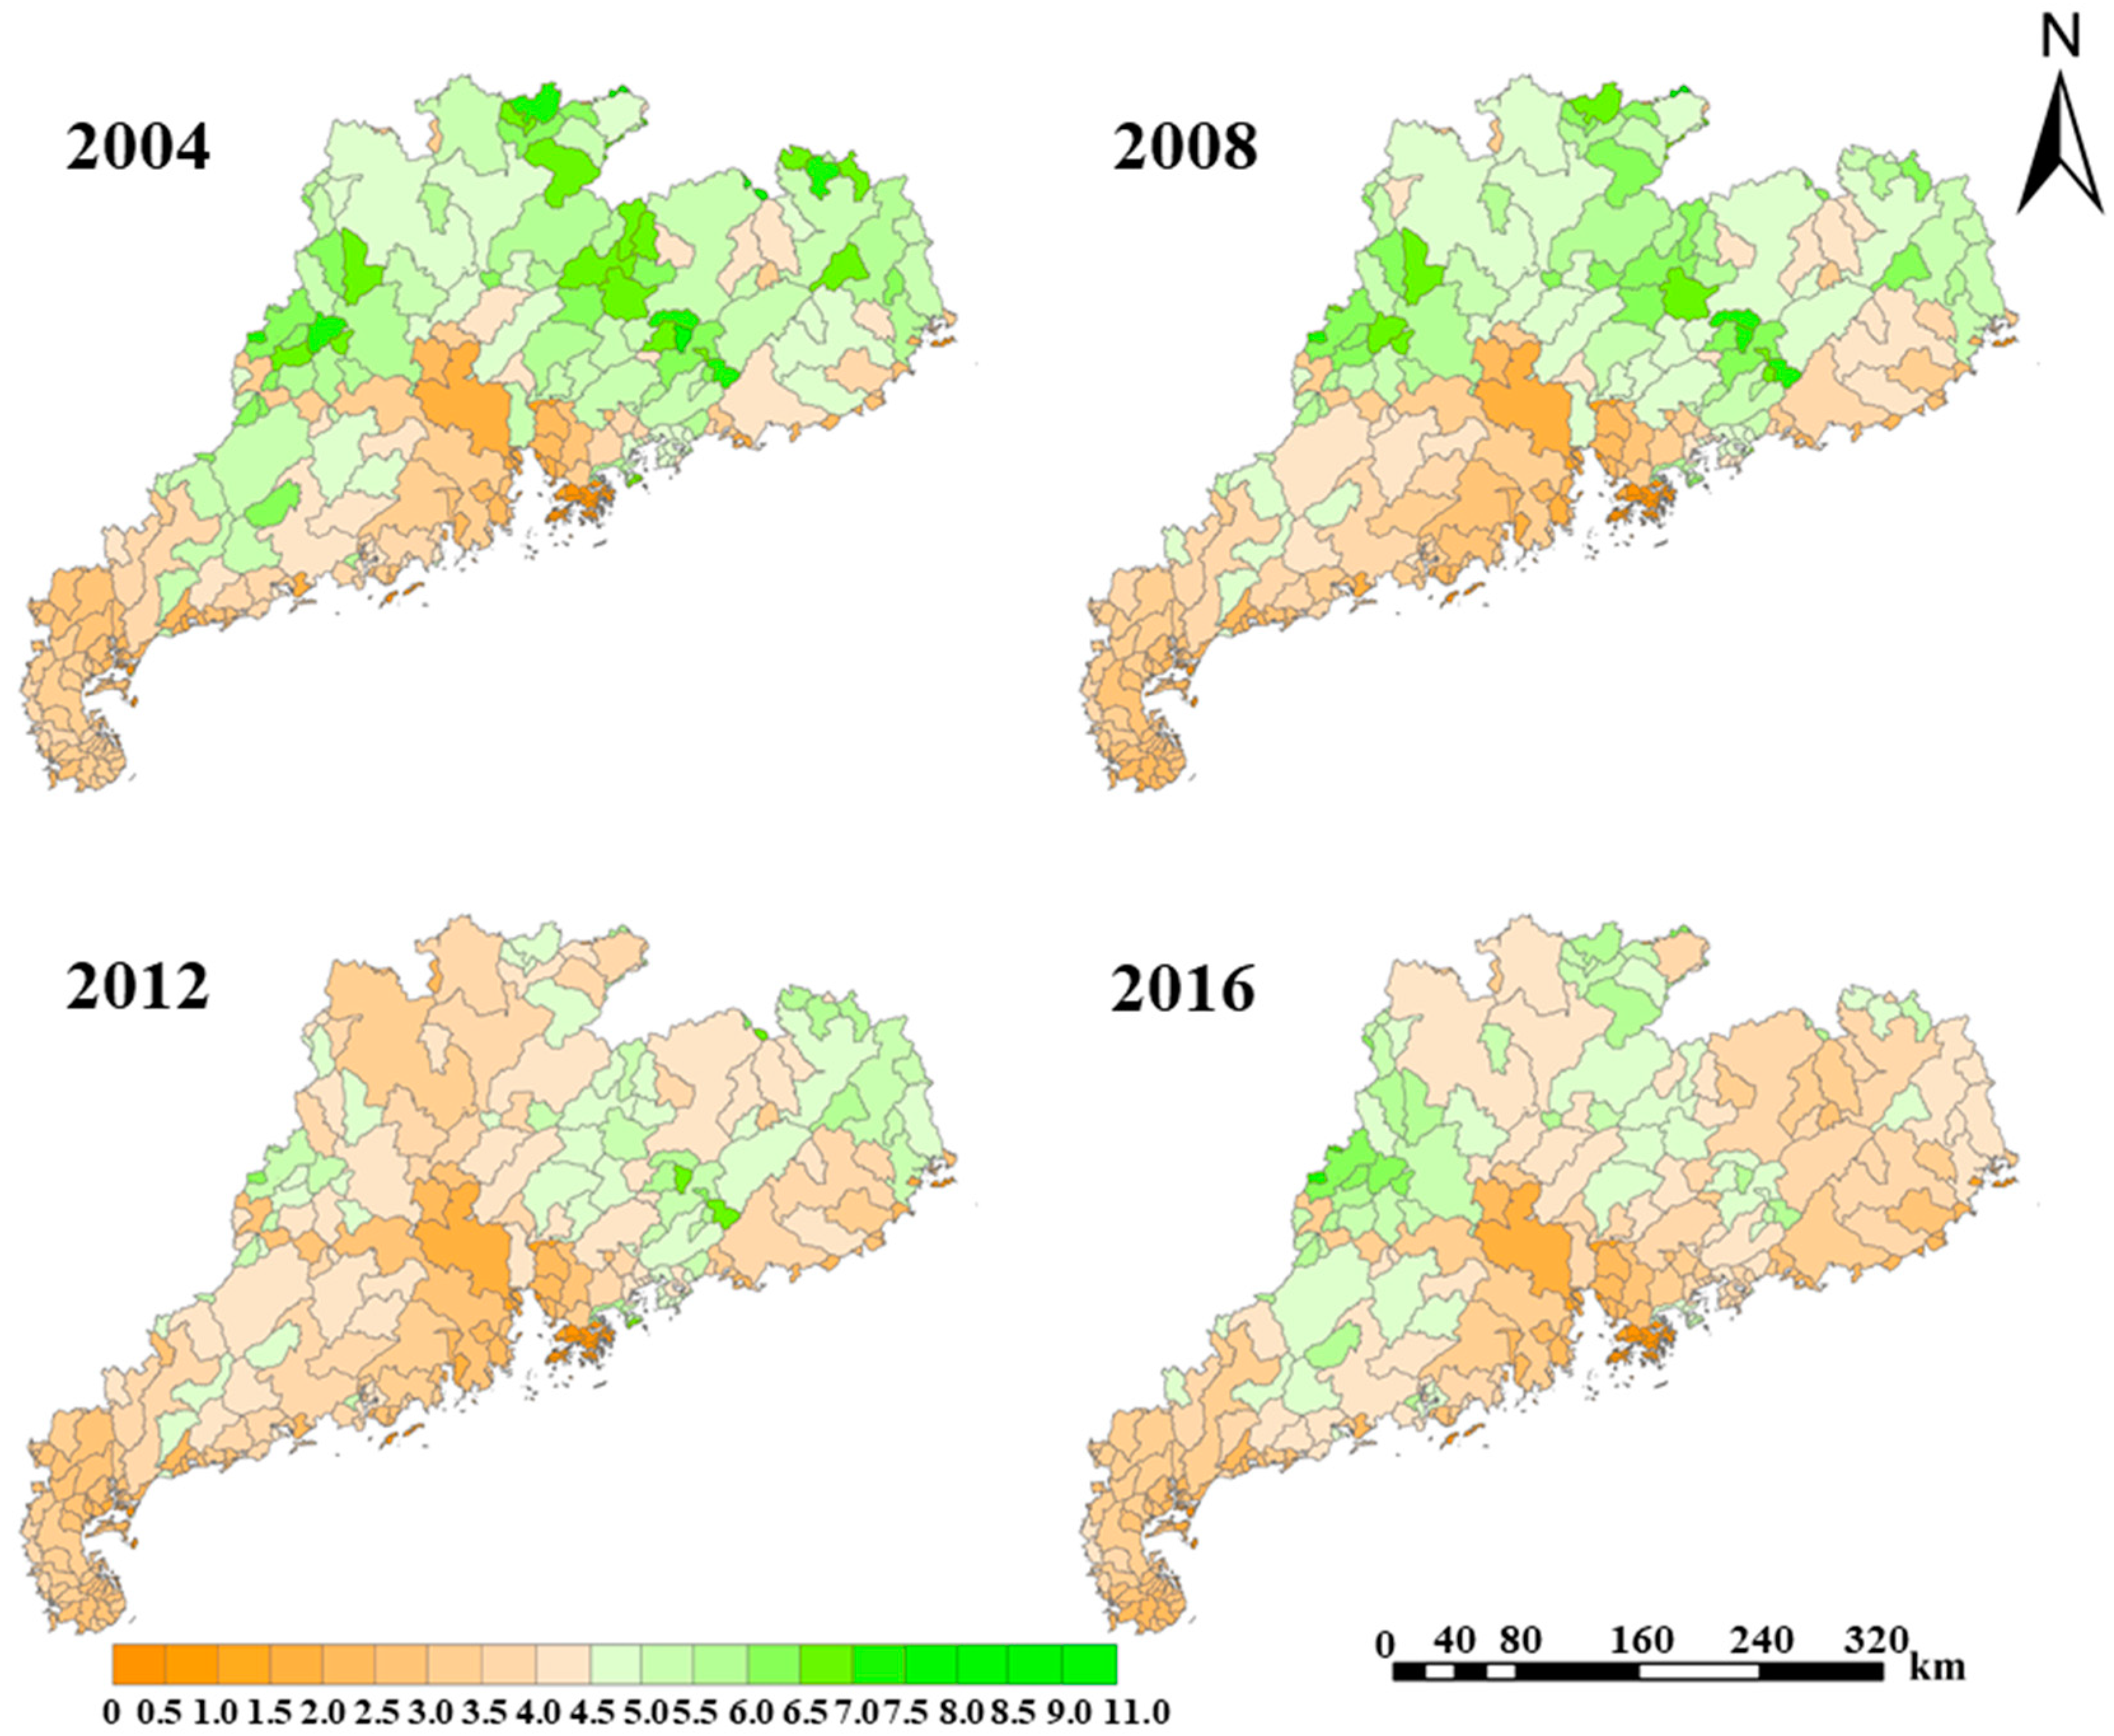
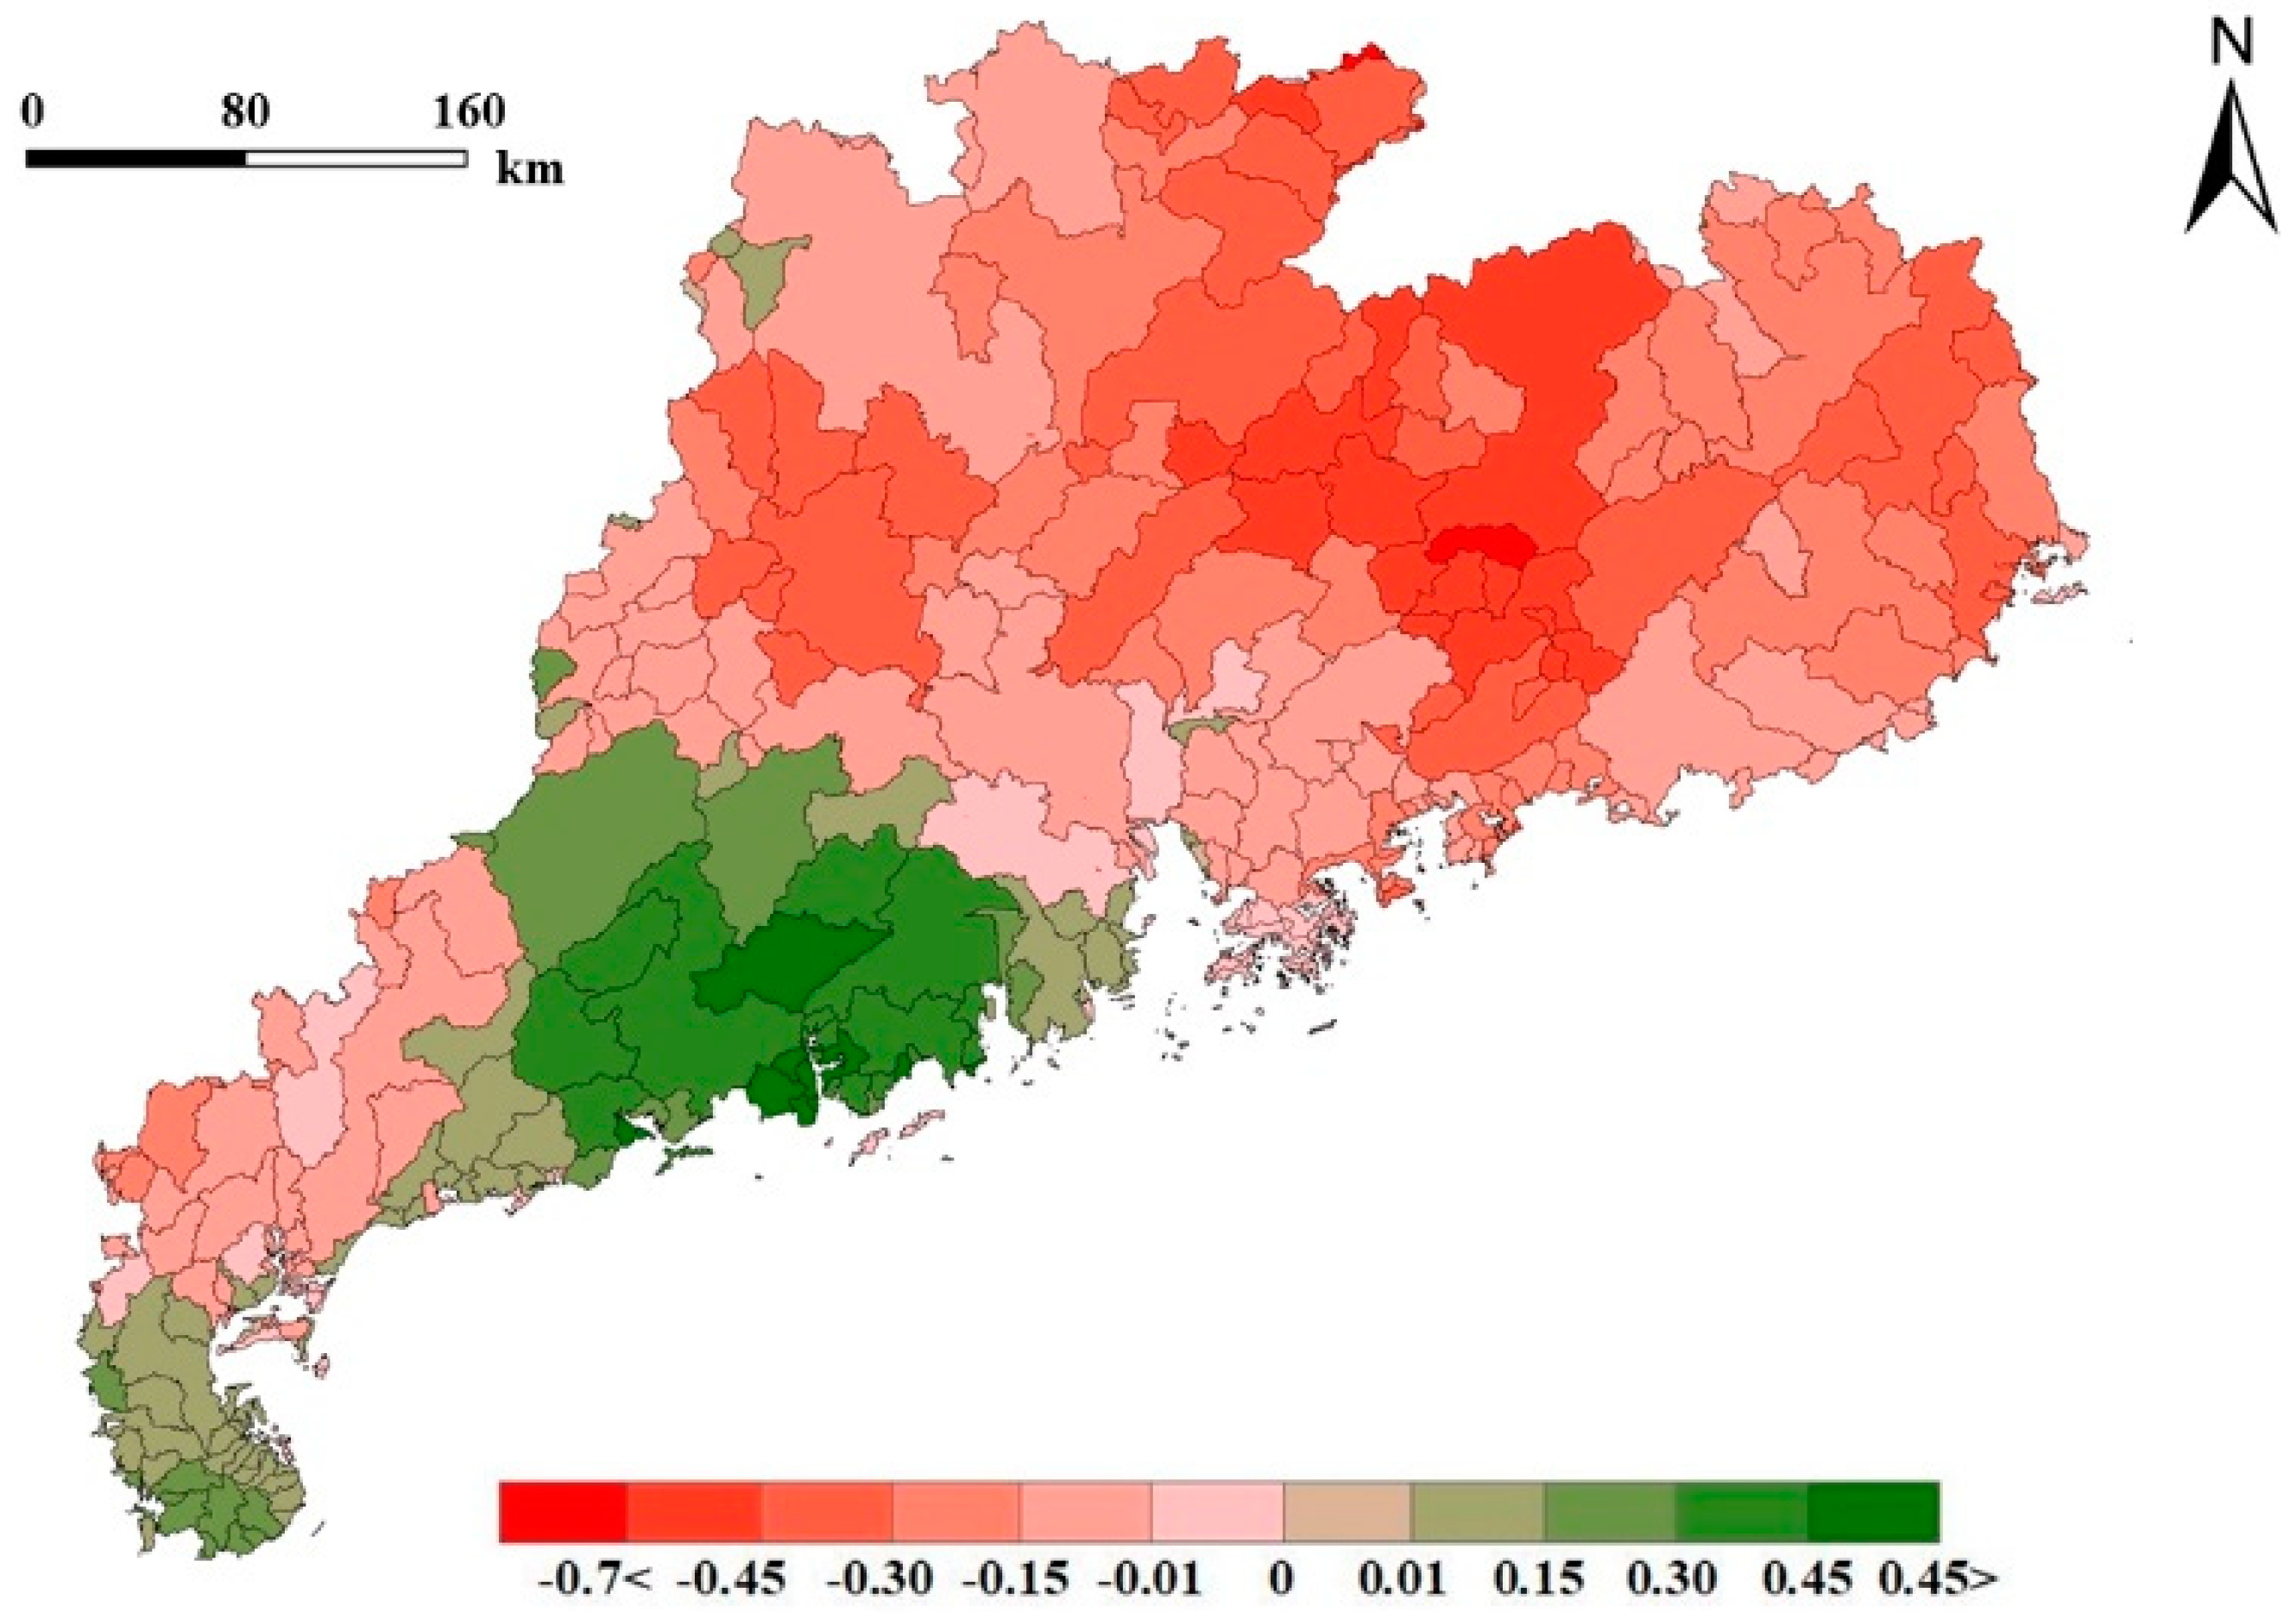
3.1. Spatiotemporal Variation Pattern of Rainfall

The annual rainfall of Guangdong in 2004, 2008, 2012, and 2016 was 1334.18 mm, 1531.58 mm, 1875.43 mm, and 2327.89 mm, respectively. The overall rainfall in Guangdong has increased due to the impacts of climate change [44]. The most noticeable increases in rainfall occur along the coast and in the eastern part of Guangdong (Figure 2, Figure S3), which are mainly caused by the increase in the number of extreme weather events such as subtropical cyclones. In general, the amount of rainfall in Guangdong mainly presents a spatial pattern of decreasing gradually from south to north, and this pattern is particularly prominent in wetter years such as 2012 and 2016 (Figure 2).
For the seven major basins (Figure 3 and Figure S4), the rainfall trend for each basin was the same as the overall increasing rainfall trend in Guangdong. Specifically, the annual growth rate of rainfall in the XJ and PR basins is particularly noticeable, with a growth range between 0 and 1000 mm. The rainfall in the BJ, DJ, and HJ basins slightly increased from 2004 to 2008, with a growth range between 0 and 90 mm, but then rapidly increased from 2008 to 2016, with a growth range between 0 and 1200 mm. In the MYJ and JJ basins, the annual rainfall rapidly increased from 2004 to 2008, gradually increased from 2008 to 2012, and then slightly decreased from 2012 to 2016. In addition, the annual mean rainfall displayed obvious zonality, which was significantly greater in coastal regions than in inland regions. Areas with relatively little rainfall were mostly found in the basin with high surroundings and a low middle point (e.g., the BJ basin). However, areas with relatively high rainfall were generally distributed across flat coastal areas or in low-lying valleys (e.g., the MYJ basin).

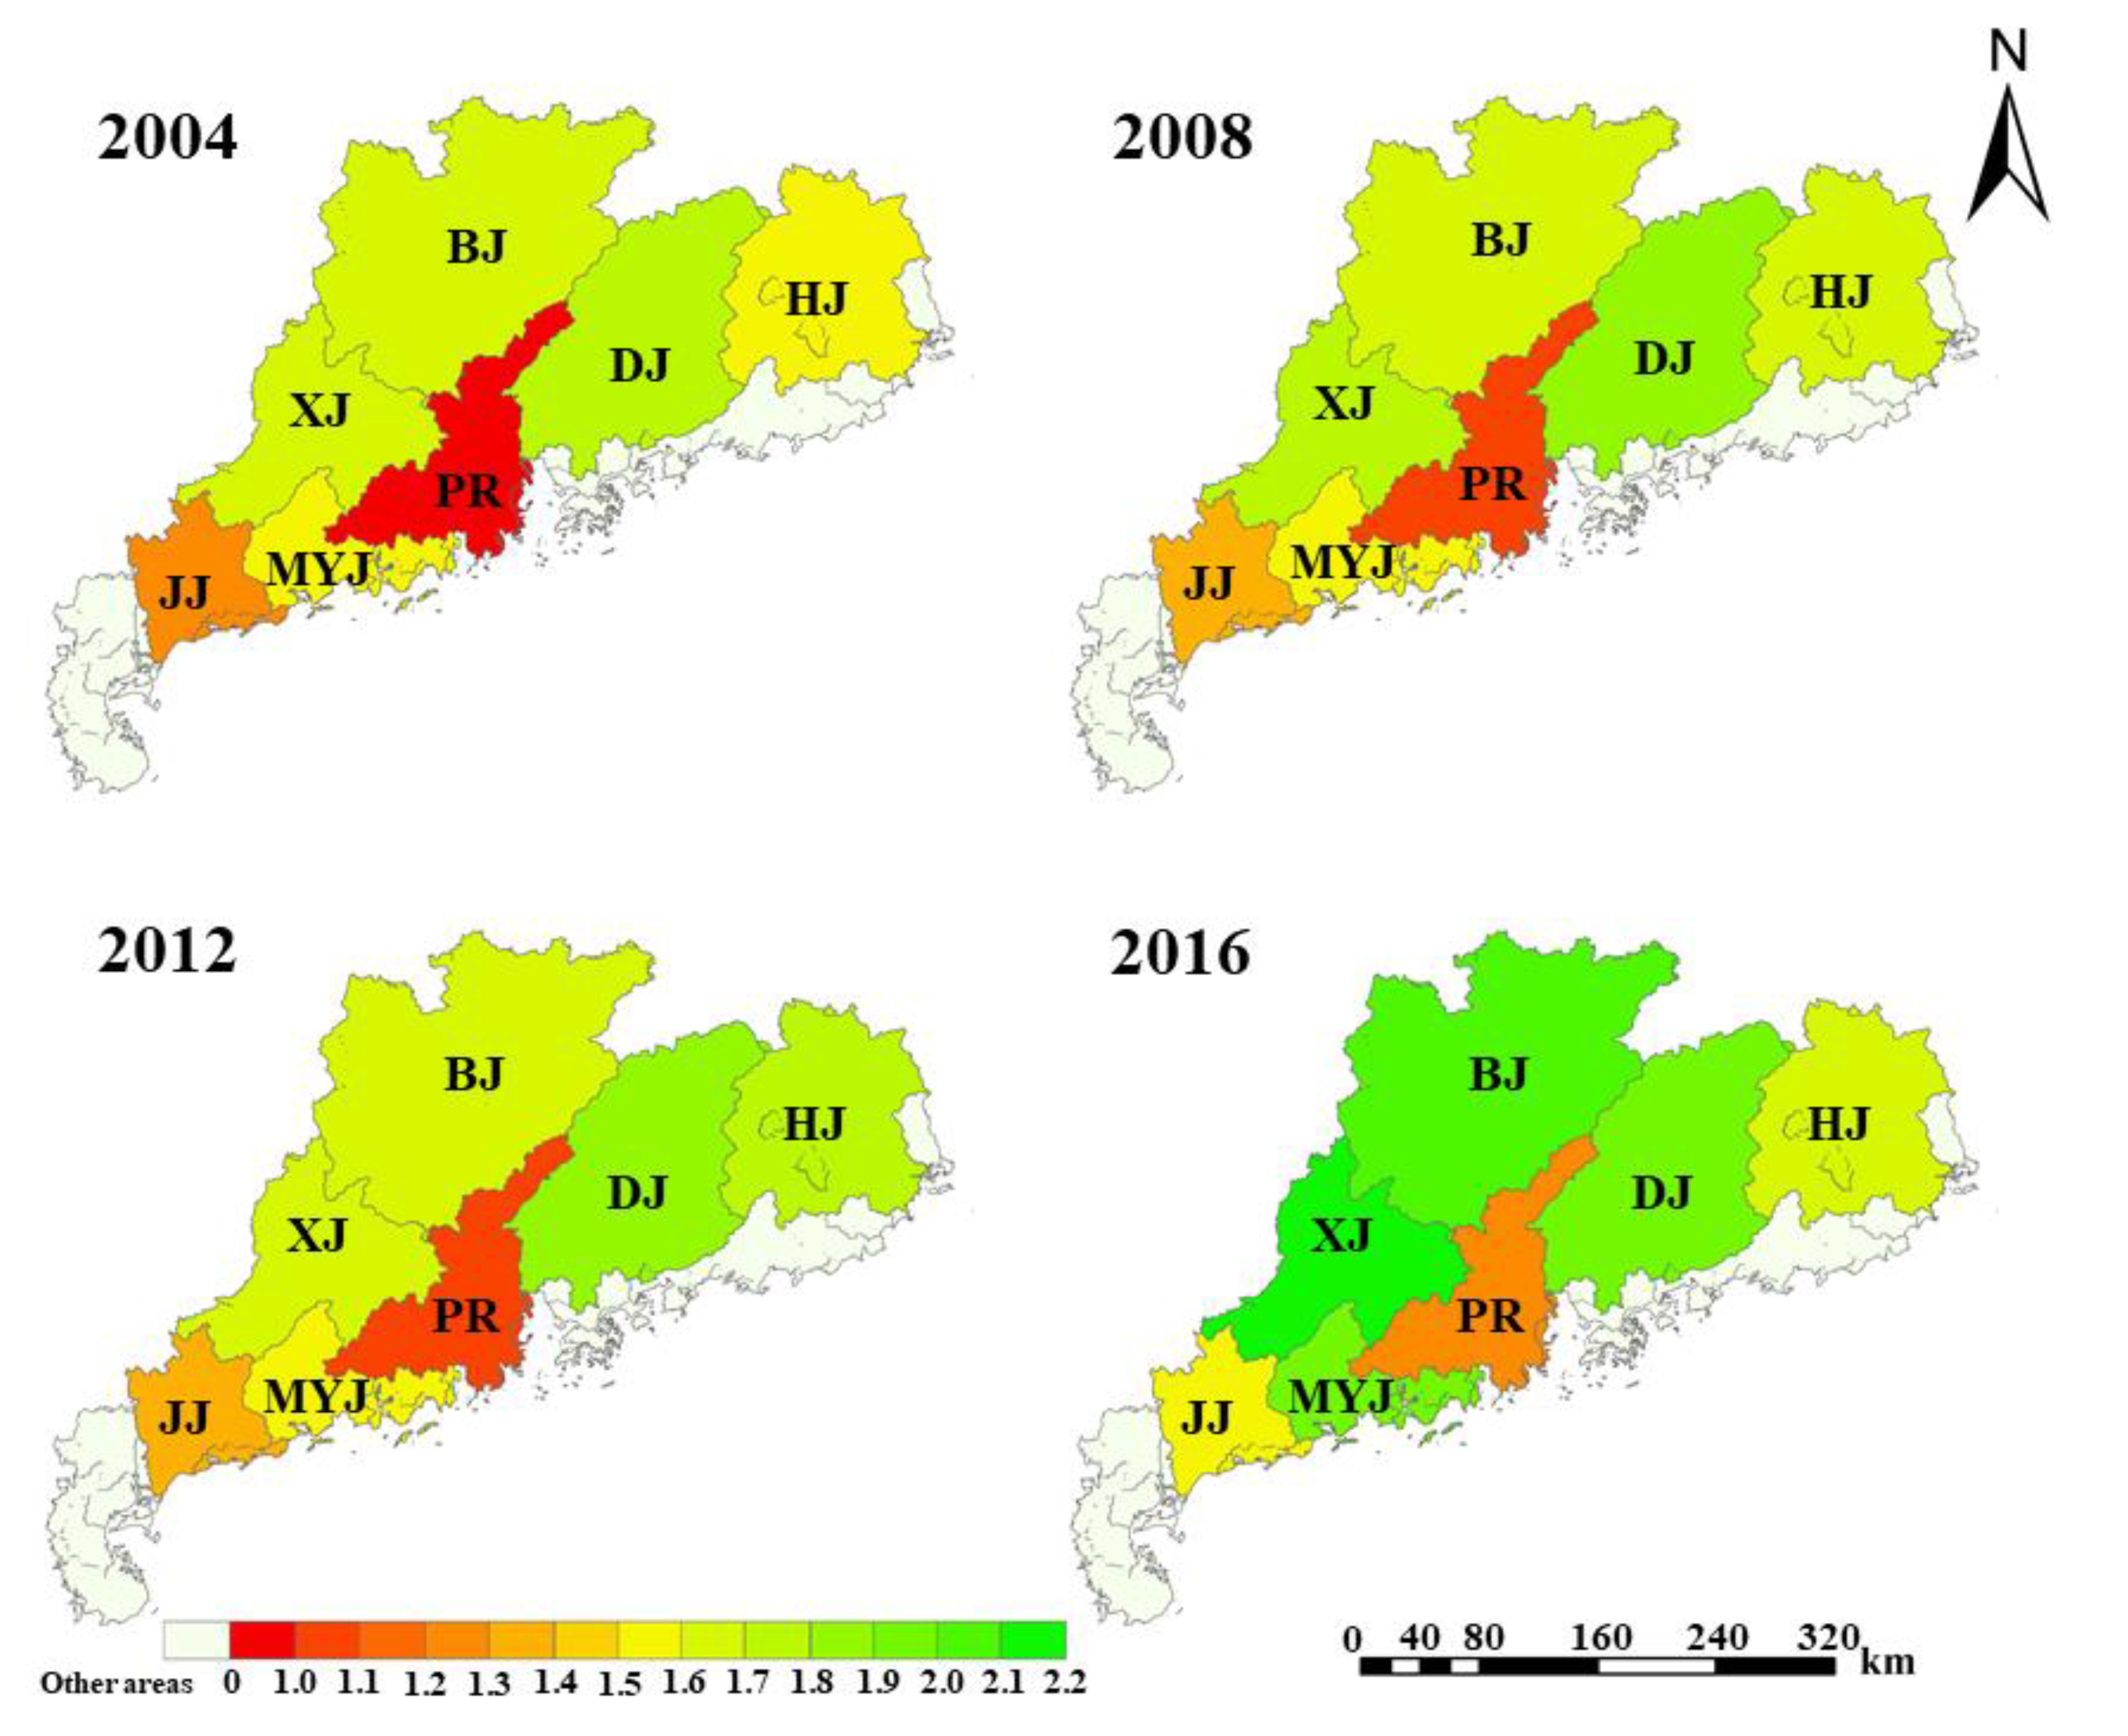
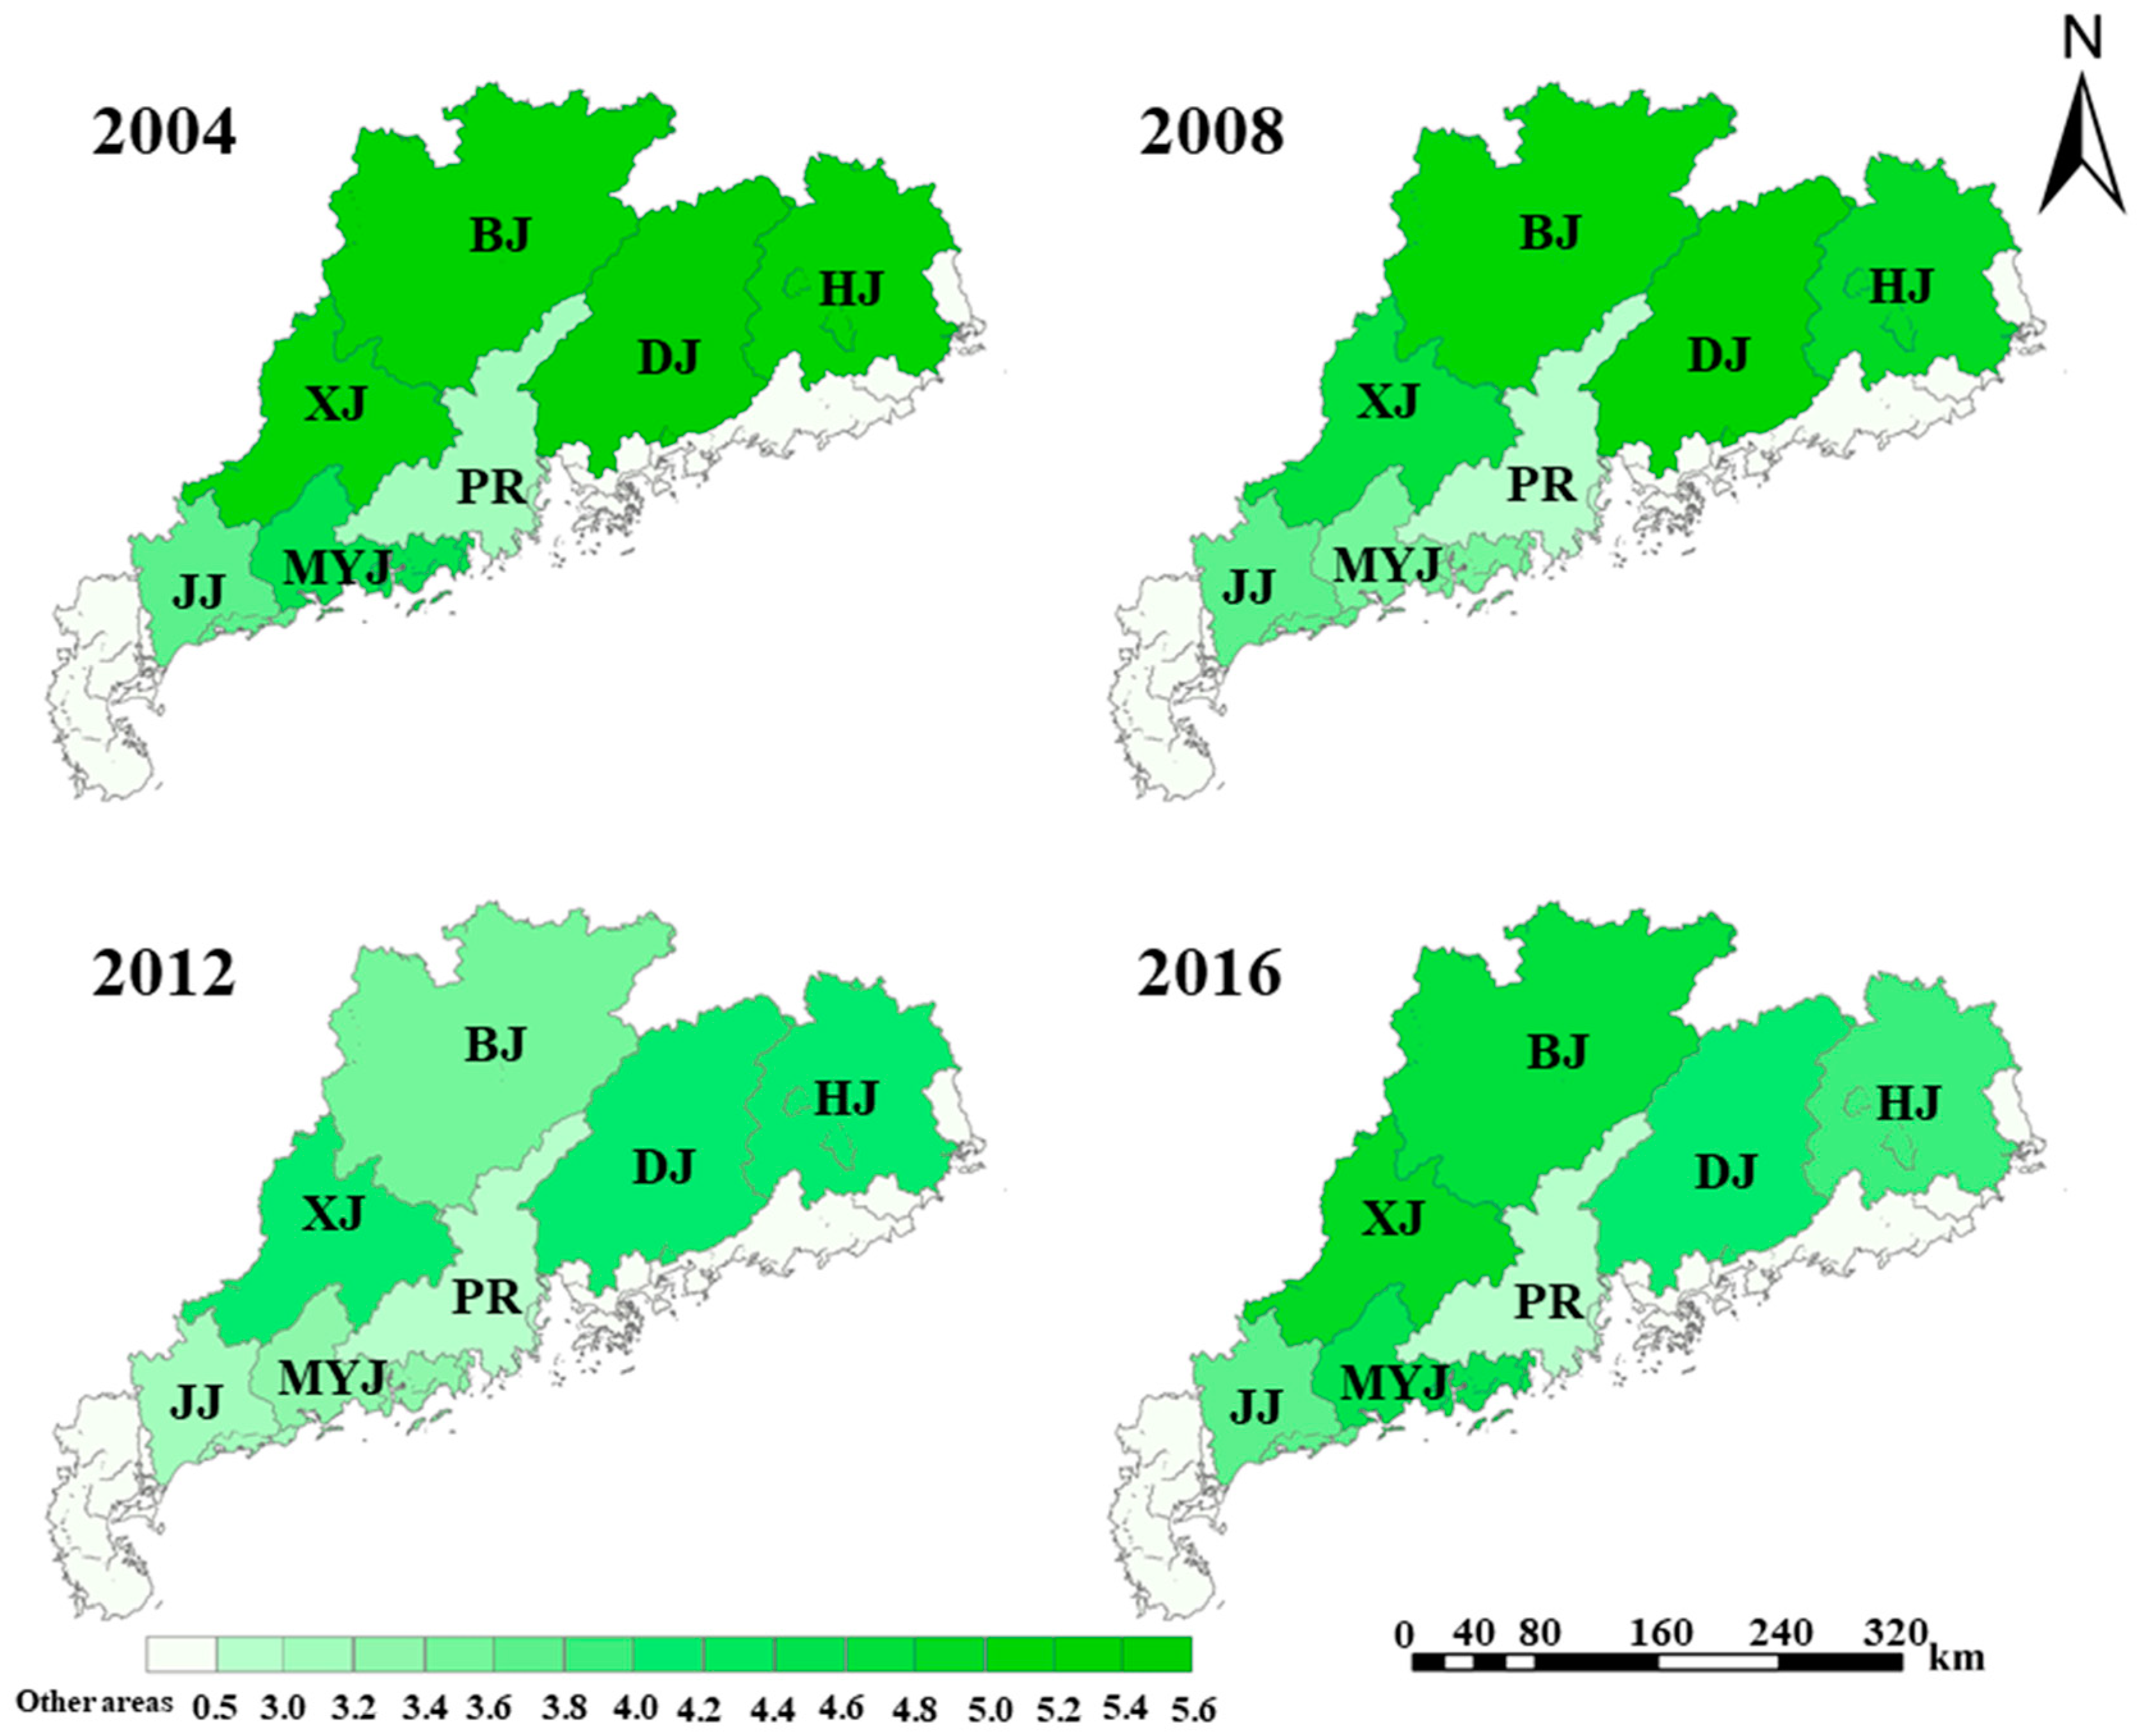
3.2. Spatiotemporal Variation Patterns of LAI

From Figure 4 and Figure S5, we found that the spatial heterogeneity of the land surface vegetation is diverse in Guangdong. The annual mean LAI was relatively low in the central Pearl River Delta region, the southwest Leizhou Peninsula, and the east Chaoshan Plain in Guangdong. This is mainly due to the rapid economic development and exploitation of natural resources in the Pearl River Delta region, and the perennial typhoon in the Chaoshan Plain. In addition, the Leizhou Peninsula’s terrain gradually becomes lower from north to south, and the streamflow in its short, shallow river quickly drains into the sea. Therefore, it is difficult to build a reservoir there to store water, which makes the peninsula prone to drought. In addition, since the peninsula is located in a subtropical monsoon region, typhoons also affect this region from May to October every year. The above reasons lead to a poor growth environment for vegetation and results in a lower LAI value for the region. The annual mean LAIs in the east, west, and north mountainous areas were higher than that in other areas of Guangdong (Figure 4). The vegetation coverage and quality were correspondingly higher in these regions, which is mainly due to better vegetation sites and growing conditions. The ecological background such as topography and geomorphology as well as the degree of economic development are important factors affecting the spatial distribution patterns of vegetation in Guangdong. The annual mean LAIs of this area in 2004, 2008, 2012, and 2016 were 1.50, 1.57, 1.59, and 1.80, respectively, which indicates that the overall vegetation coverage in Guangdong has increased (Figure S5).
According to the analysis on the seven major river basins (Figure 5), the annual mean increase in the LAI in the BJ, XJ, and MYJ basins were the largest, increasing from 1.61, 1.51, and 1.69 in 2004 to 2.09, 1.97, and 2.14 in 2016, respectively. In addition, the annual mean LAI in the PR and DJ basins increased slightly from 0.98 and 1.71 in 2004 to 1.27 and 1.91 in 2016, respectively. However, the annual increase of the LAI in the HJ basin slightly increased from 2004 to 2012, but decreased after 2012 (Figure S6).

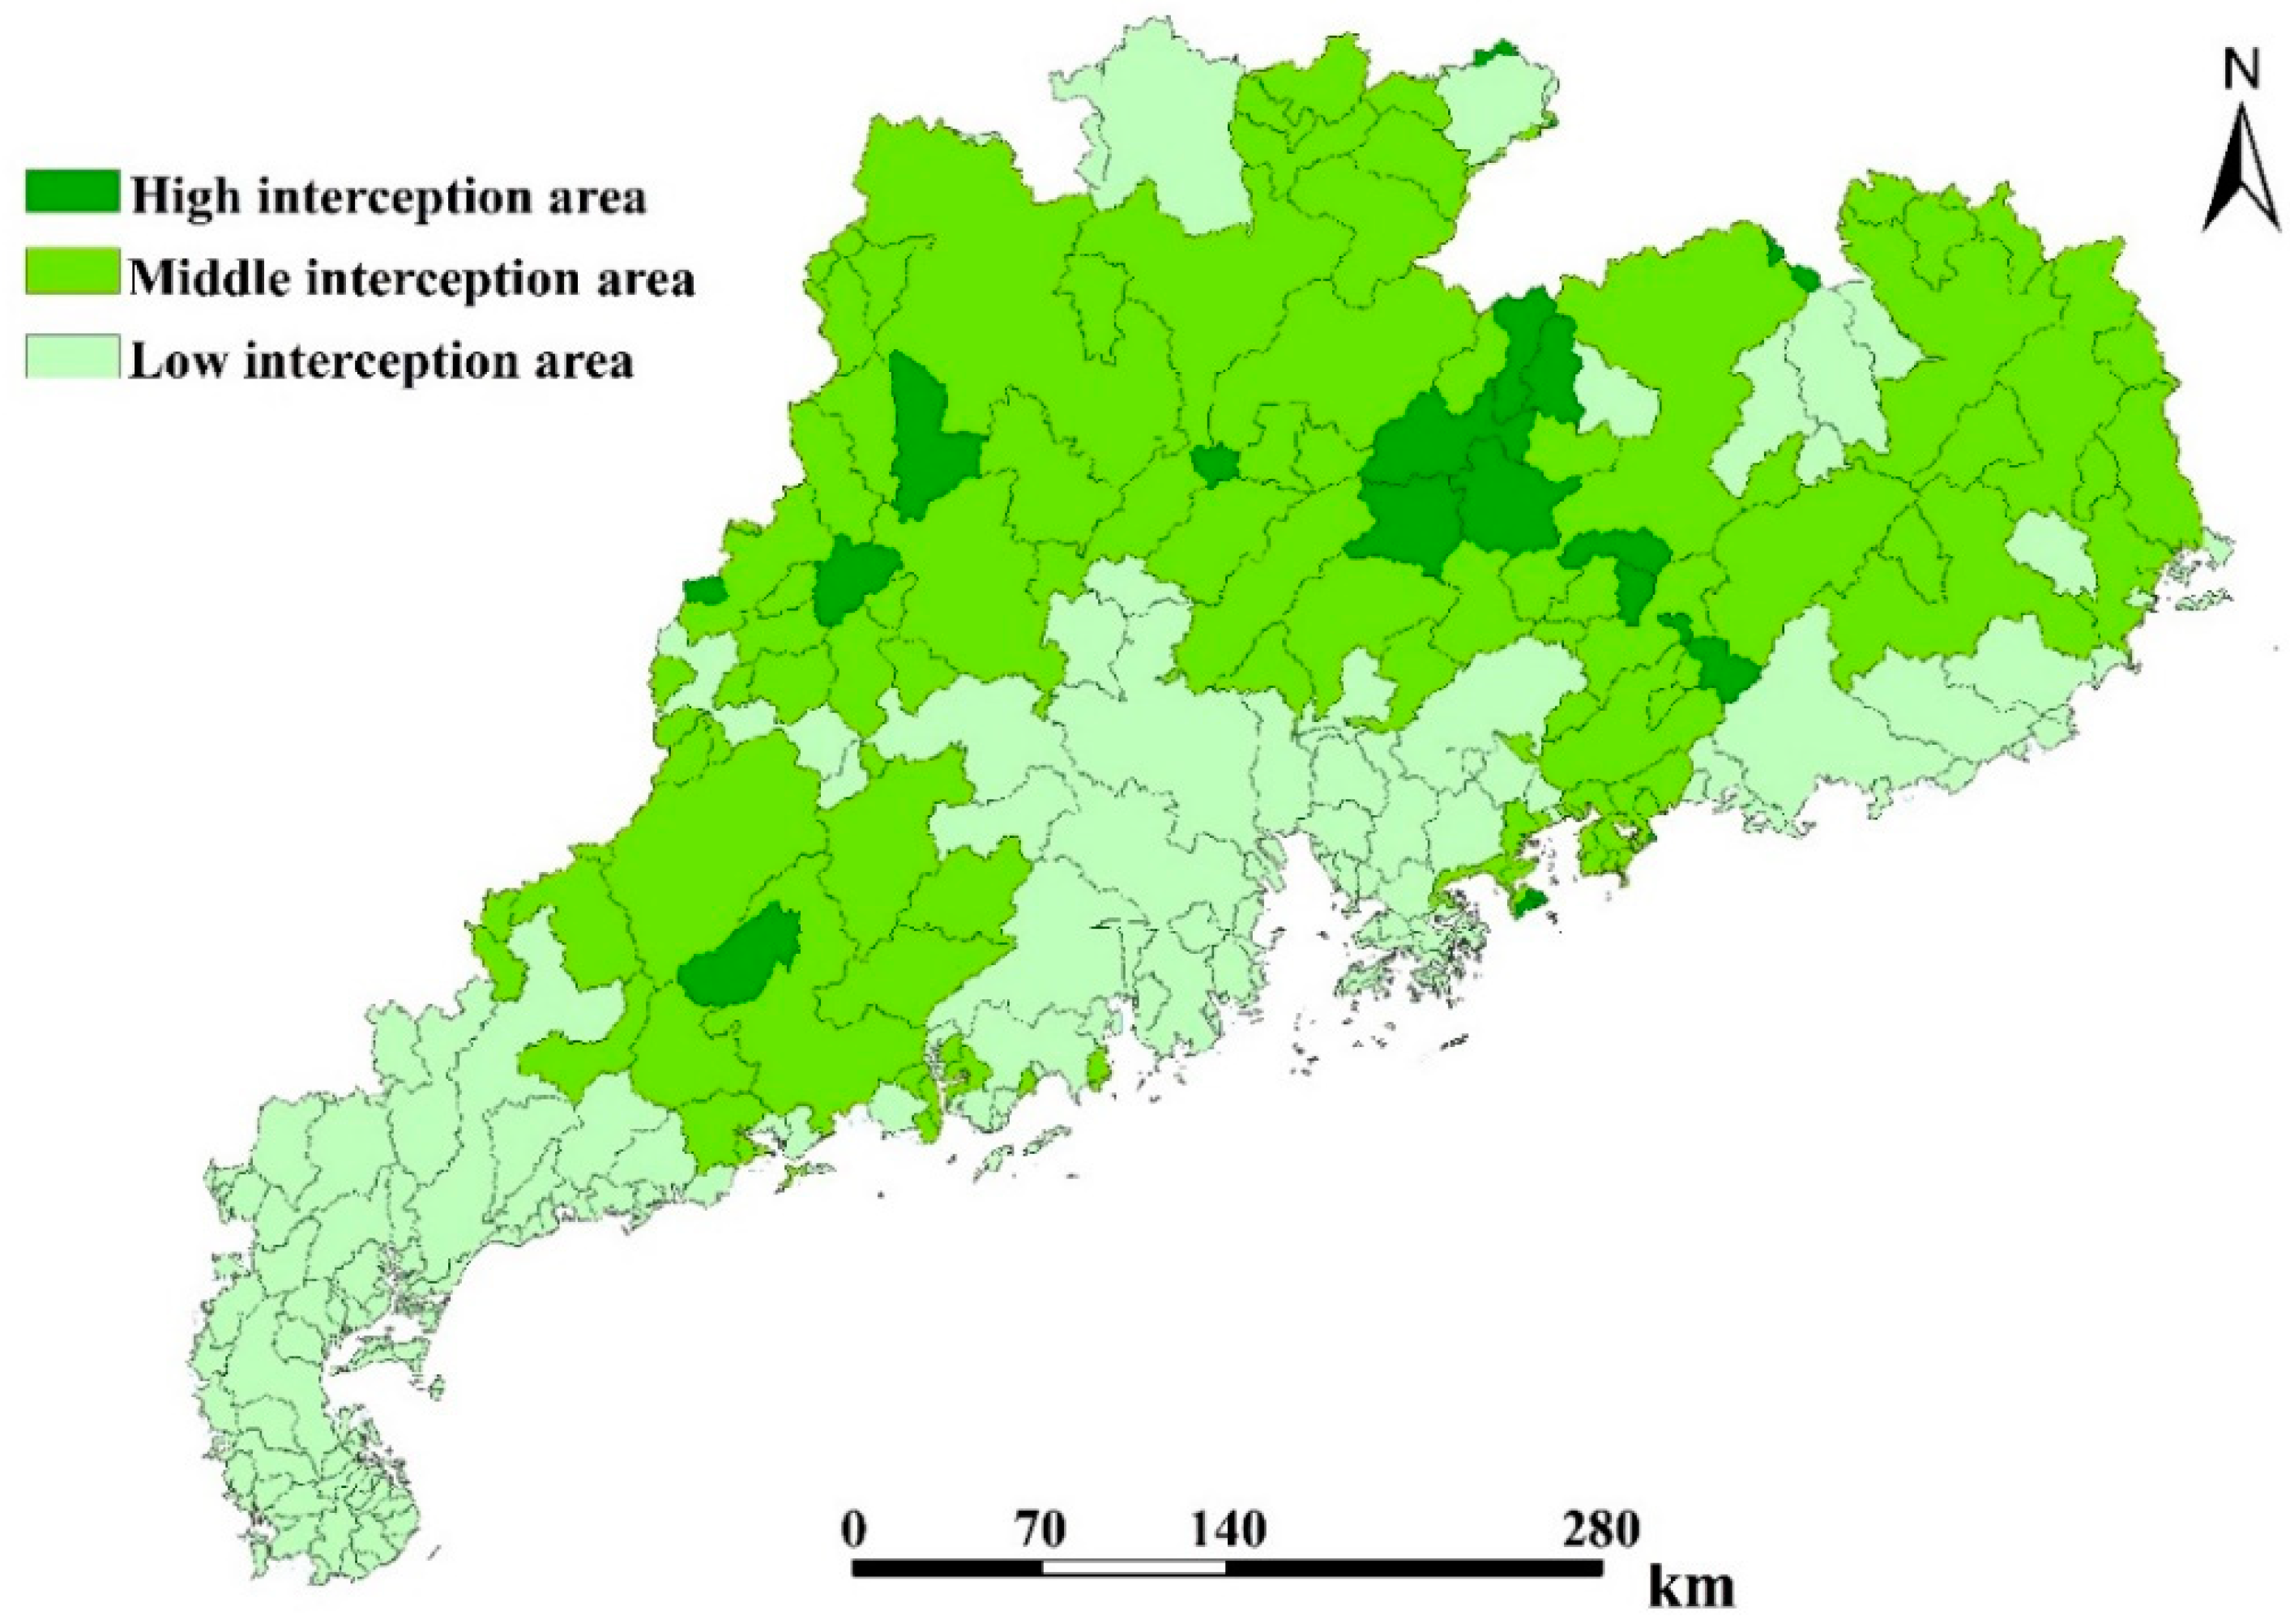
3.3. Spatiotemporal Variation Pattern of Rainfall Interception

3.3.1. Variation Pattern of Annual Canopy Rainfall Interception

Based on the cumulative rainfall canopy interception in 2004, the small basins in Guangdong were divided into three canopy rainfall interception grades (high, moderate, and low interception area, Figure 6) according to the standard categorization of rainfall canopy interception described in Table 1.
In Table 2, we can see that the annual rainfall canopy interception for the different regions gradually increased over the years. The annual rainfall canopy interception in the moderate interception area was 131.83 mm in 2016, which exceeded its threshold of 90 mm. The same trend also occurred in the low interception area, with an annual canopy rainfall interception of 70.26 mm in 2016, which also exceeded its threshold of 60 mm. This means that when the annual rainfall and vegetation cover increased, the number of high-magnitude interception areas (e.g., moderate and high interception areas) also increased.

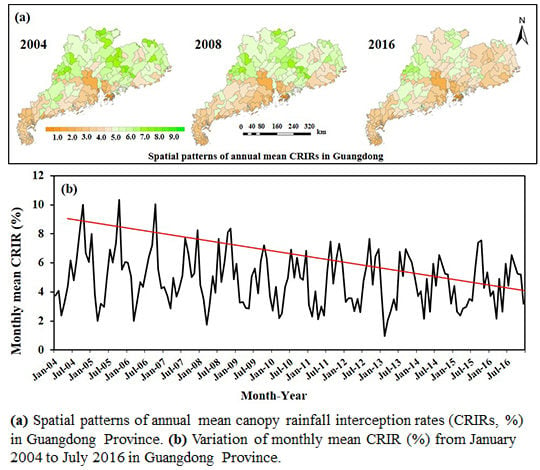
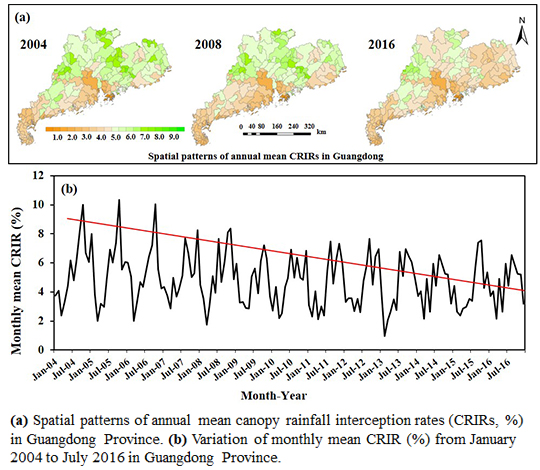
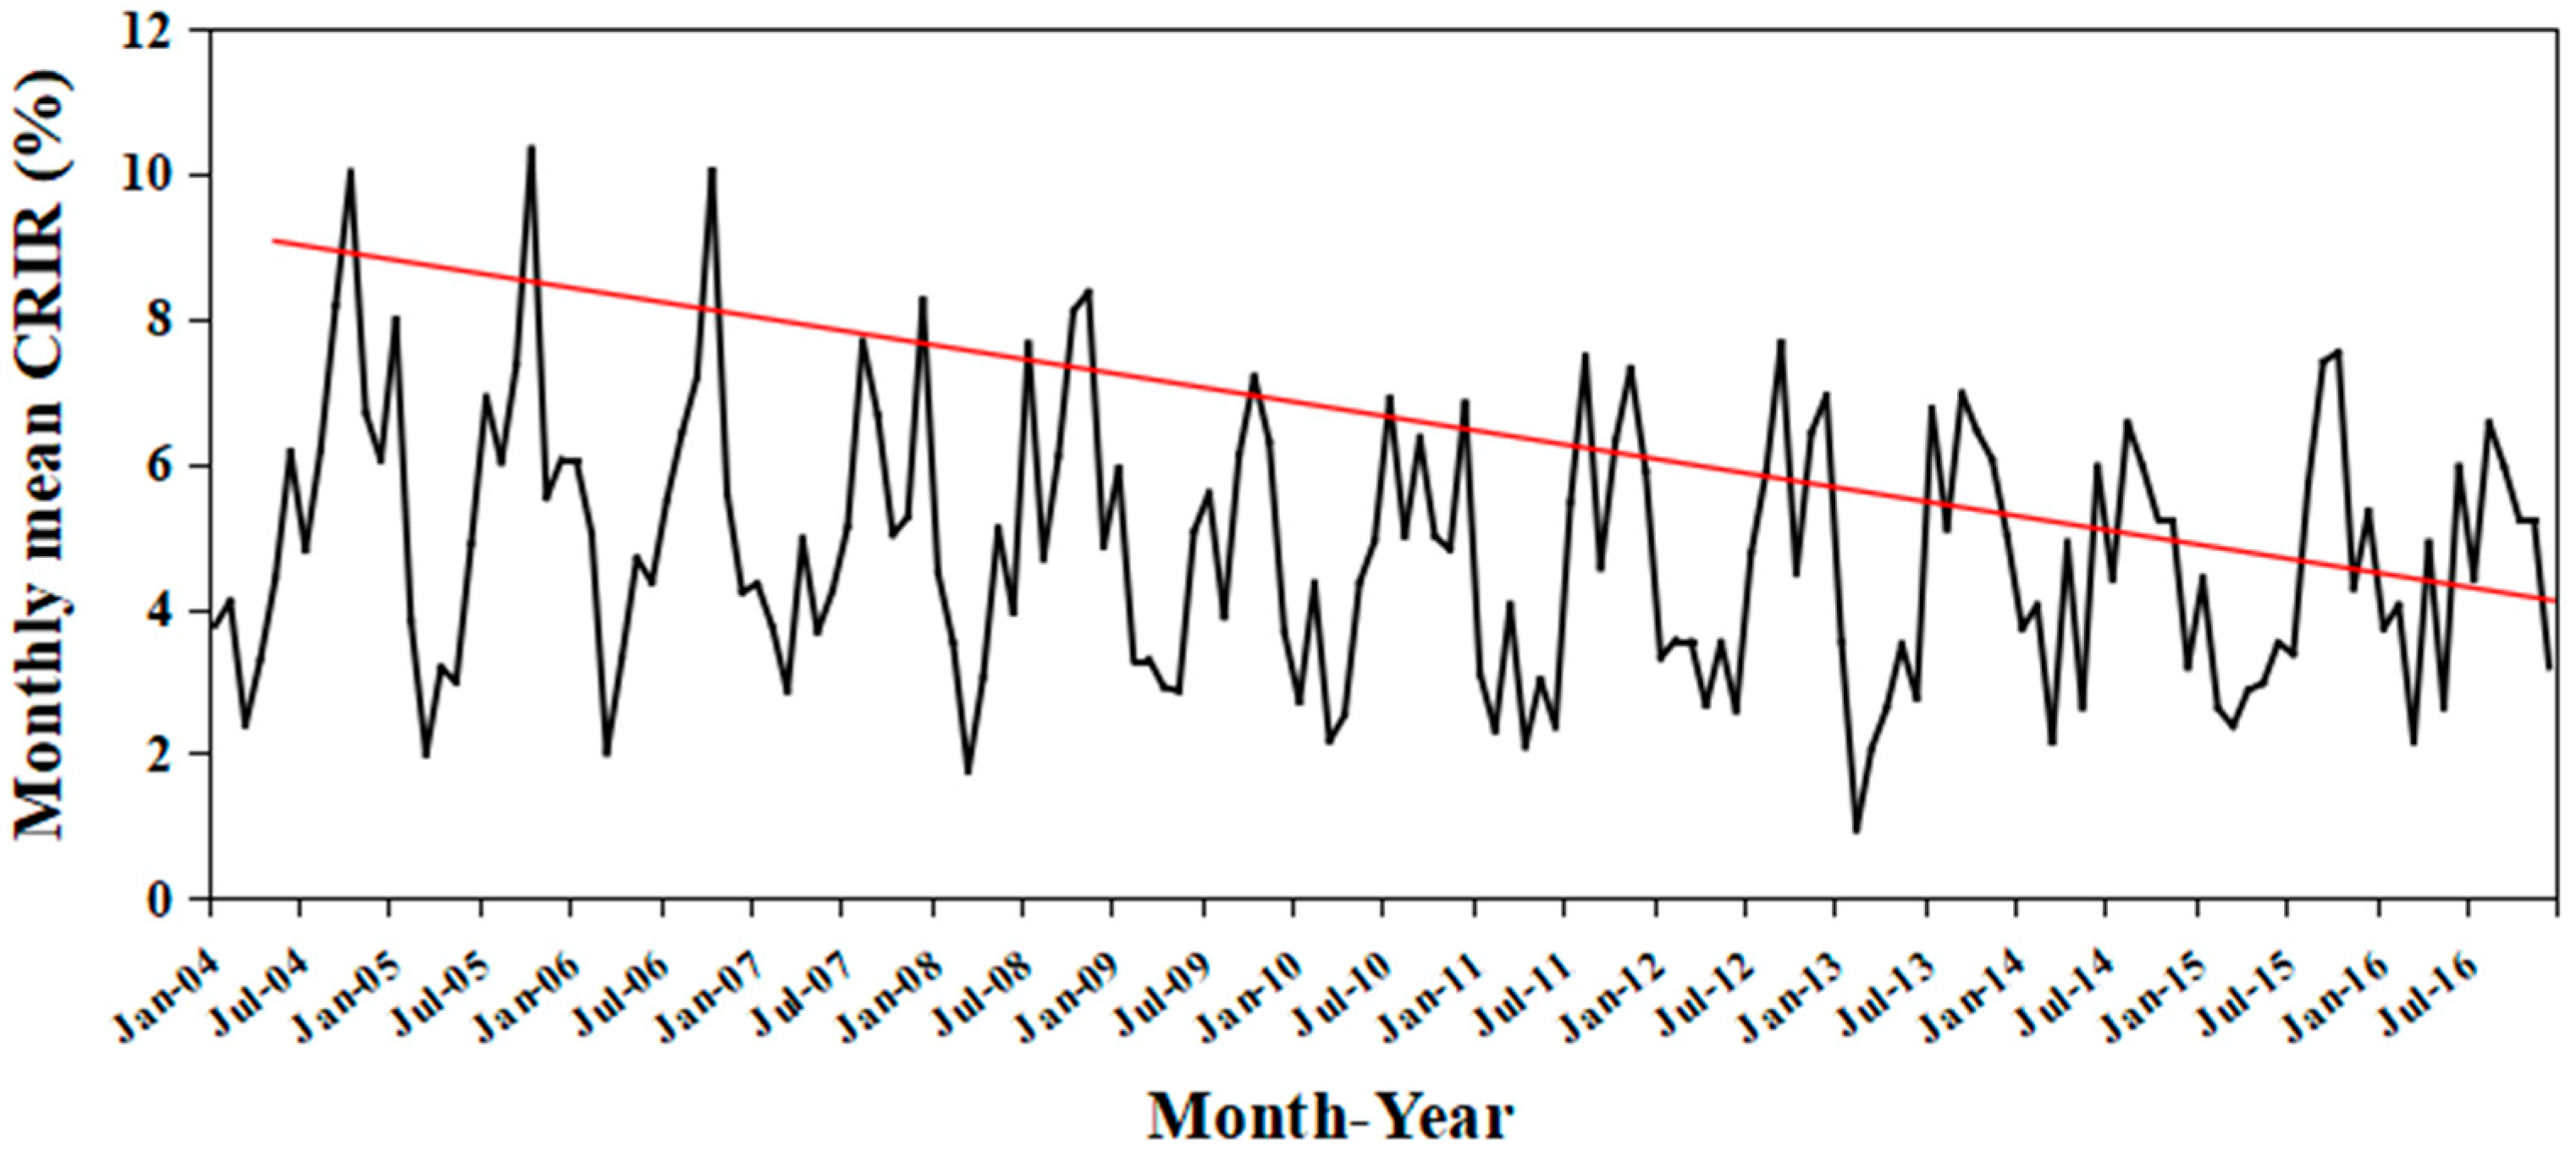
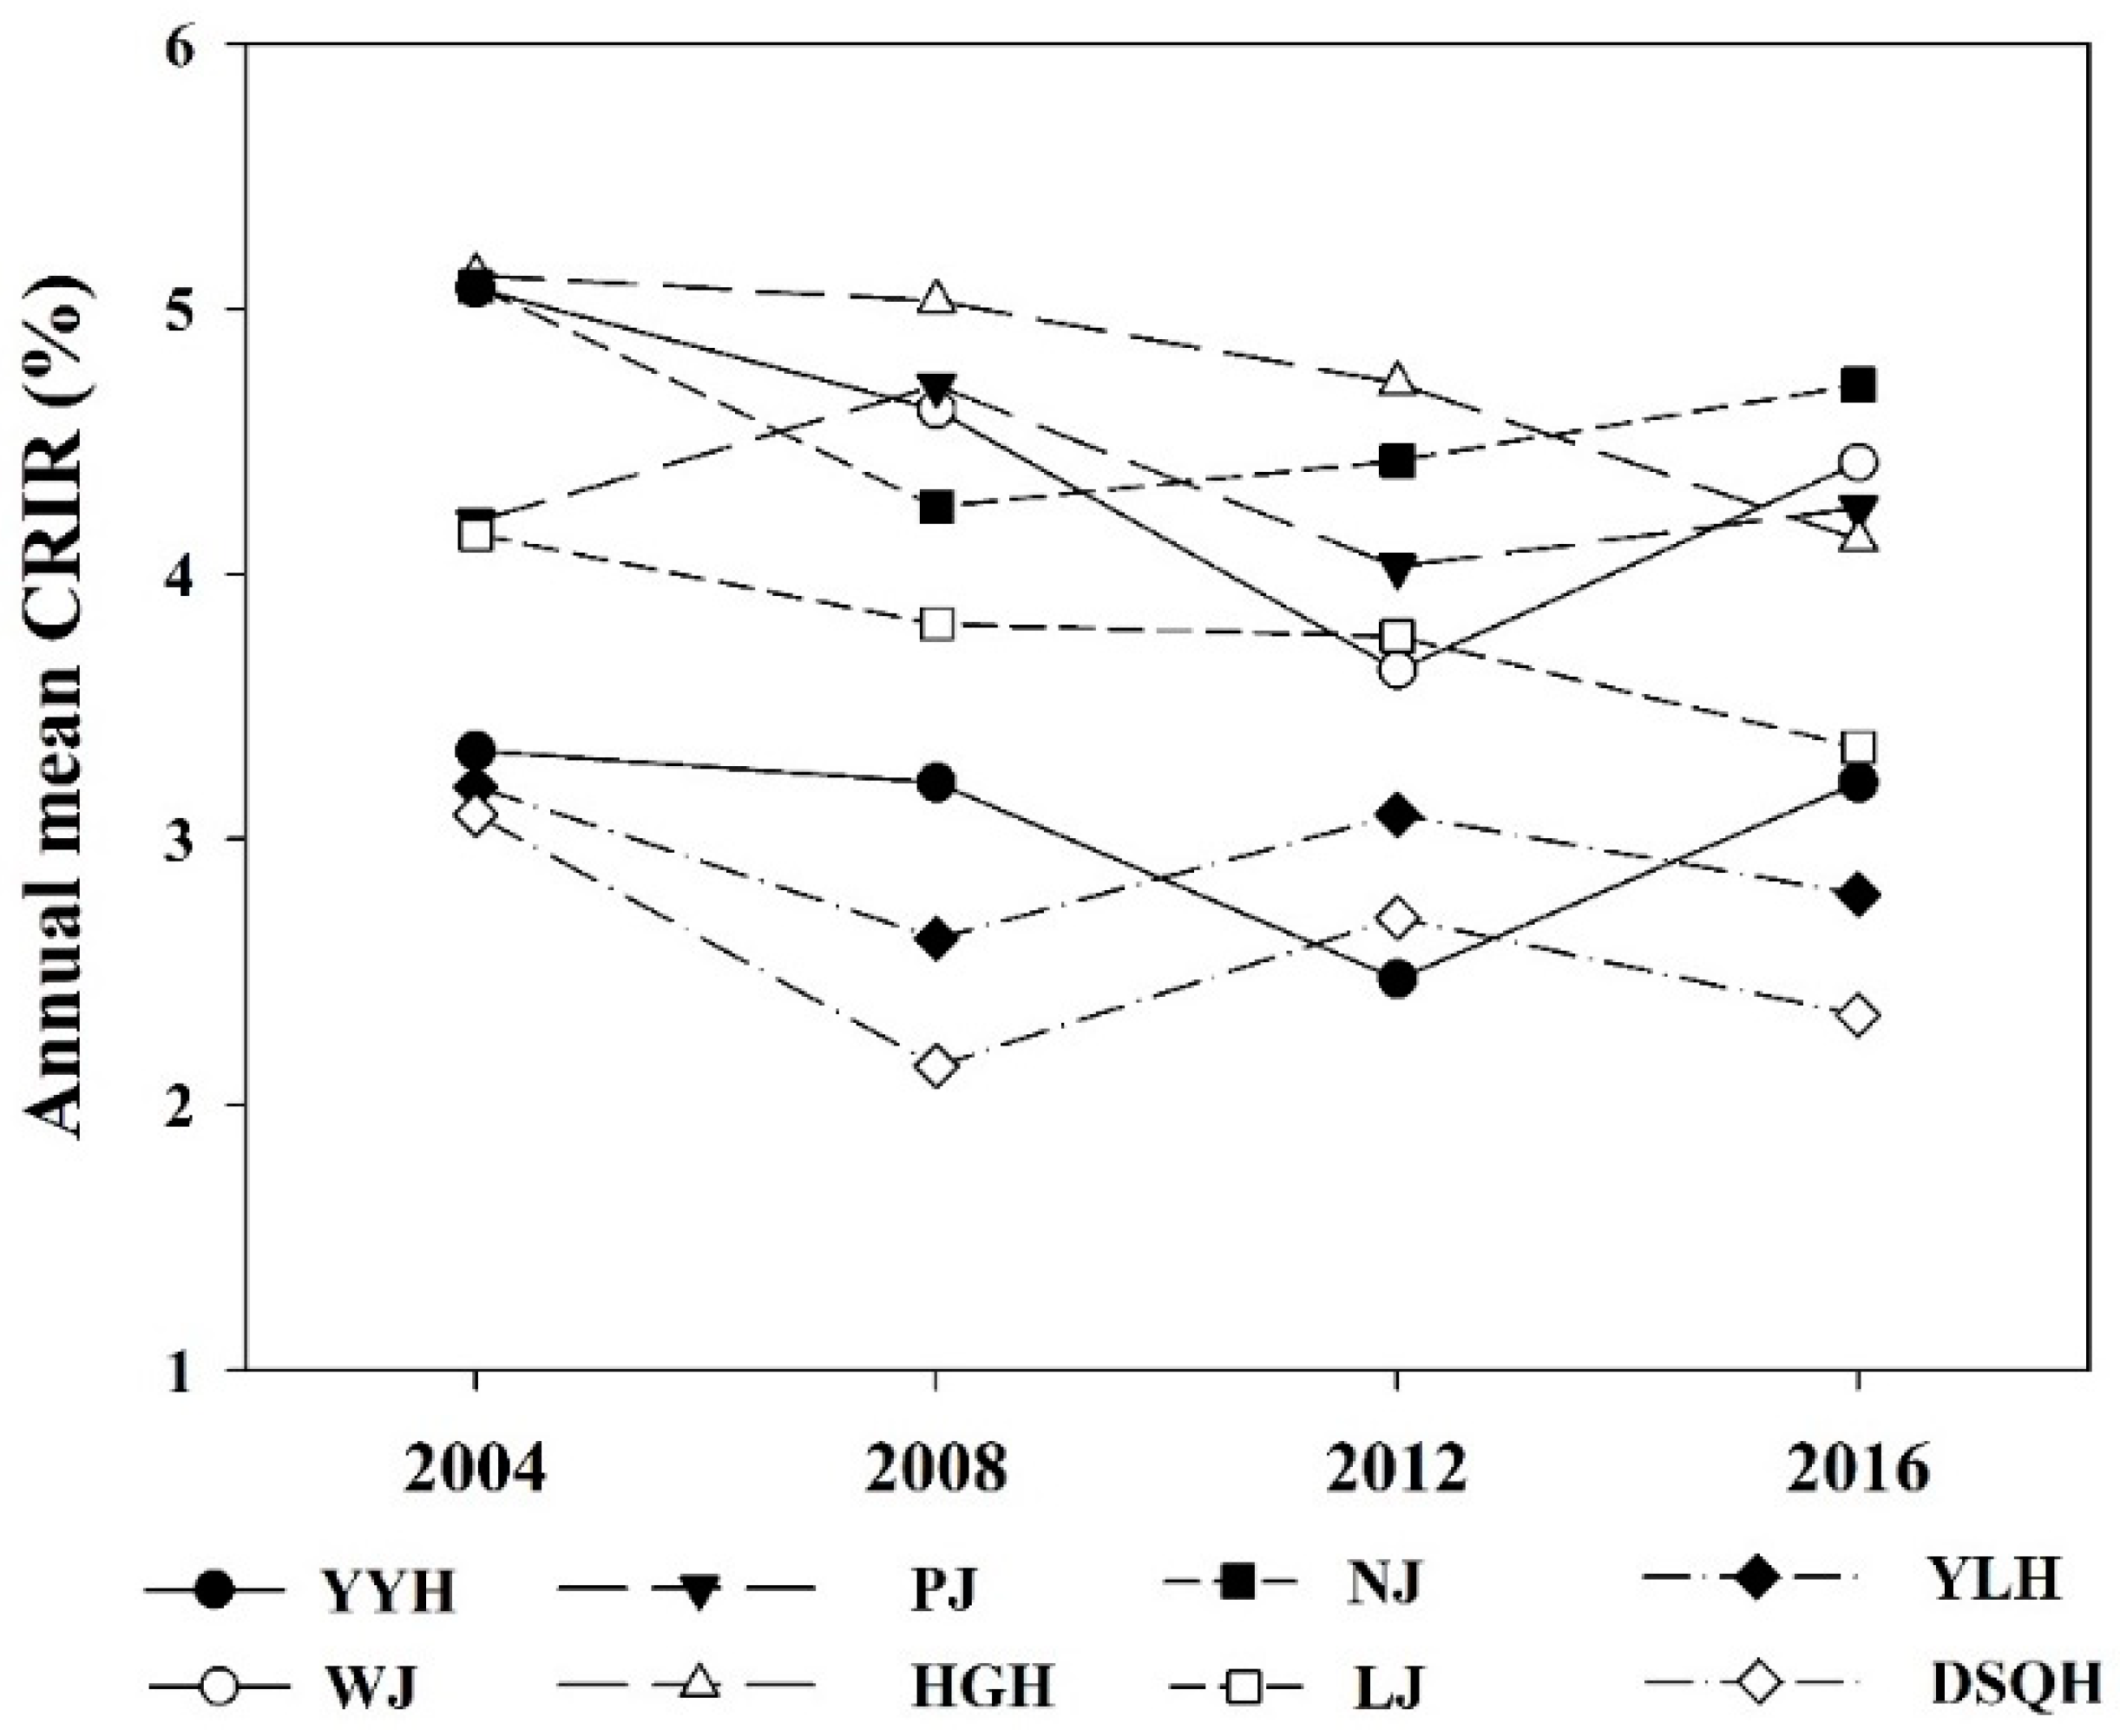
3.3.2. Variation Patterns of Annual CRIR

The annual mean CRIRs from 2004 to 2016 all showed the same trend where the rates were lowest in March, and began to rise in April, reached their highest values in October, and began to decrease in November until March the following year (Figure 7). In particular, the fluctuations of monthly mean CRIR were depressed through the years. The difference in monthly mean rate (the difference between the highest and the lowest monthly mean CRIRs within a year) decreased from 6.26% in 2004 to 4.41% in 2016. Annual statistical results have shown that the annual mean CRIR had a downward trend in 2004, 2008, and 2012, but increased slightly in 2016 with annual mean values of 4.80%, 4.53%, 4.05%, and 4.13%, respectively (Figure 8). Considering Equations (1)–(3) and the annual rainfall and LAI trends in Guangdong, there are two possible reasons for these variations. On one hand, the increase in rainfall will increase the canopy interception to a certain extent, according to Equation (1), as the vegetation leaves have a saturation value for water absorption. Generally speaking, rainfall canopy interception will increase as the amount of rainfall increases, but once the rainfall reaches a certain point, canopy rainfall interception gradually reaches saturation and plateaus. On the other hand, the increase in rainfall can also inhibit canopy interception according to Equation (3). The CRIR decreases if this inhibiting effect is greater than the driving effect of the vegetation LAI increase on the CRIR.
When considering the spatial characteristic (Figure 8 and Figure S7), we found that the CRIR showed a significant spatial difference pattern that was high in the mountainous areas of the eastern and western flanks, but low in the central mountainous areas and the coastal areas in Guangdong in 2004. There were 149 basins with a CRIR greater than 5%, and 1227 basins with a CRIR lower than 5%, accounting for 40.75% and 59.25% of Guangdong’s total area, respectively. The maximum and minimum annual mean CRIRs were 11.67% and 0.33%, respectively, in 2004. However, the spatial difference gradually decreased over time. The number of basins with a CRIR greater than 5% decreased to 79 in 2012, accounting for only 10.49% of the total area of Guangdong, and the maximum and minimum annual mean CRIRs were 10.41% and 0.34%, respectively, in 2012. The annual mean CRIR decreased significantly in western and northern Guangdong from 2004 to 2012, and increased slightly from 2012 to 2016. However, the annual mean CRIR in eastern Guangdong, especially in the HJ basin, decreased from 2004 to 2016. Based on the analysis in Section 3.1 and Section 3.2, though both the annual mean LAI and annual rainfall gradually increased, the spatial heterogeneity of the annual mean LAI increased (Figure 4) while the spatial heterogeneity of the annual rainfall decreased (Figure 2). Combining the saturation threshold of LAI-Smax (Equation (1)) and the inhibitory effect of rainfall on CRIR (Equation (3)), the spatial homogeneity of annual rainfall further magnified the spatial pattern of the CRIR, while the spatial heterogeneity of the annual mean LAI narrowed the spatial pattern of the CRIR, leading to a decrease in the spatial variability of CRIR during the 2004–2016 period. From the SLOPE index of CRIR in Guangdong from 2004 to 2016 (Figure 9), we found that the CRIR could potentially increase in the Leizhou Peninsula and west coastal areas of Guangdong.
From the perspective of the seven major river basins (Figure 10 and Figure S8), the CRIR in the BJ and XJ basins gradually decreased from 2004 to 2012 and slightly increased from 2012 to 2016, with ranges of 0–1.33% and 0–0.74%, respectively. Similarly, the CRIR in the MYJ basin significantly decreased from 2004 to 2008 and then increased slightly from 2008 to 2016. The CRIR in the DJ and HJ basins, however, decreased from 2004 to 2016 with a range of 0–1.41%. The CRIR in the JJ basin remained essentially invariable during the 2004–2016 period.

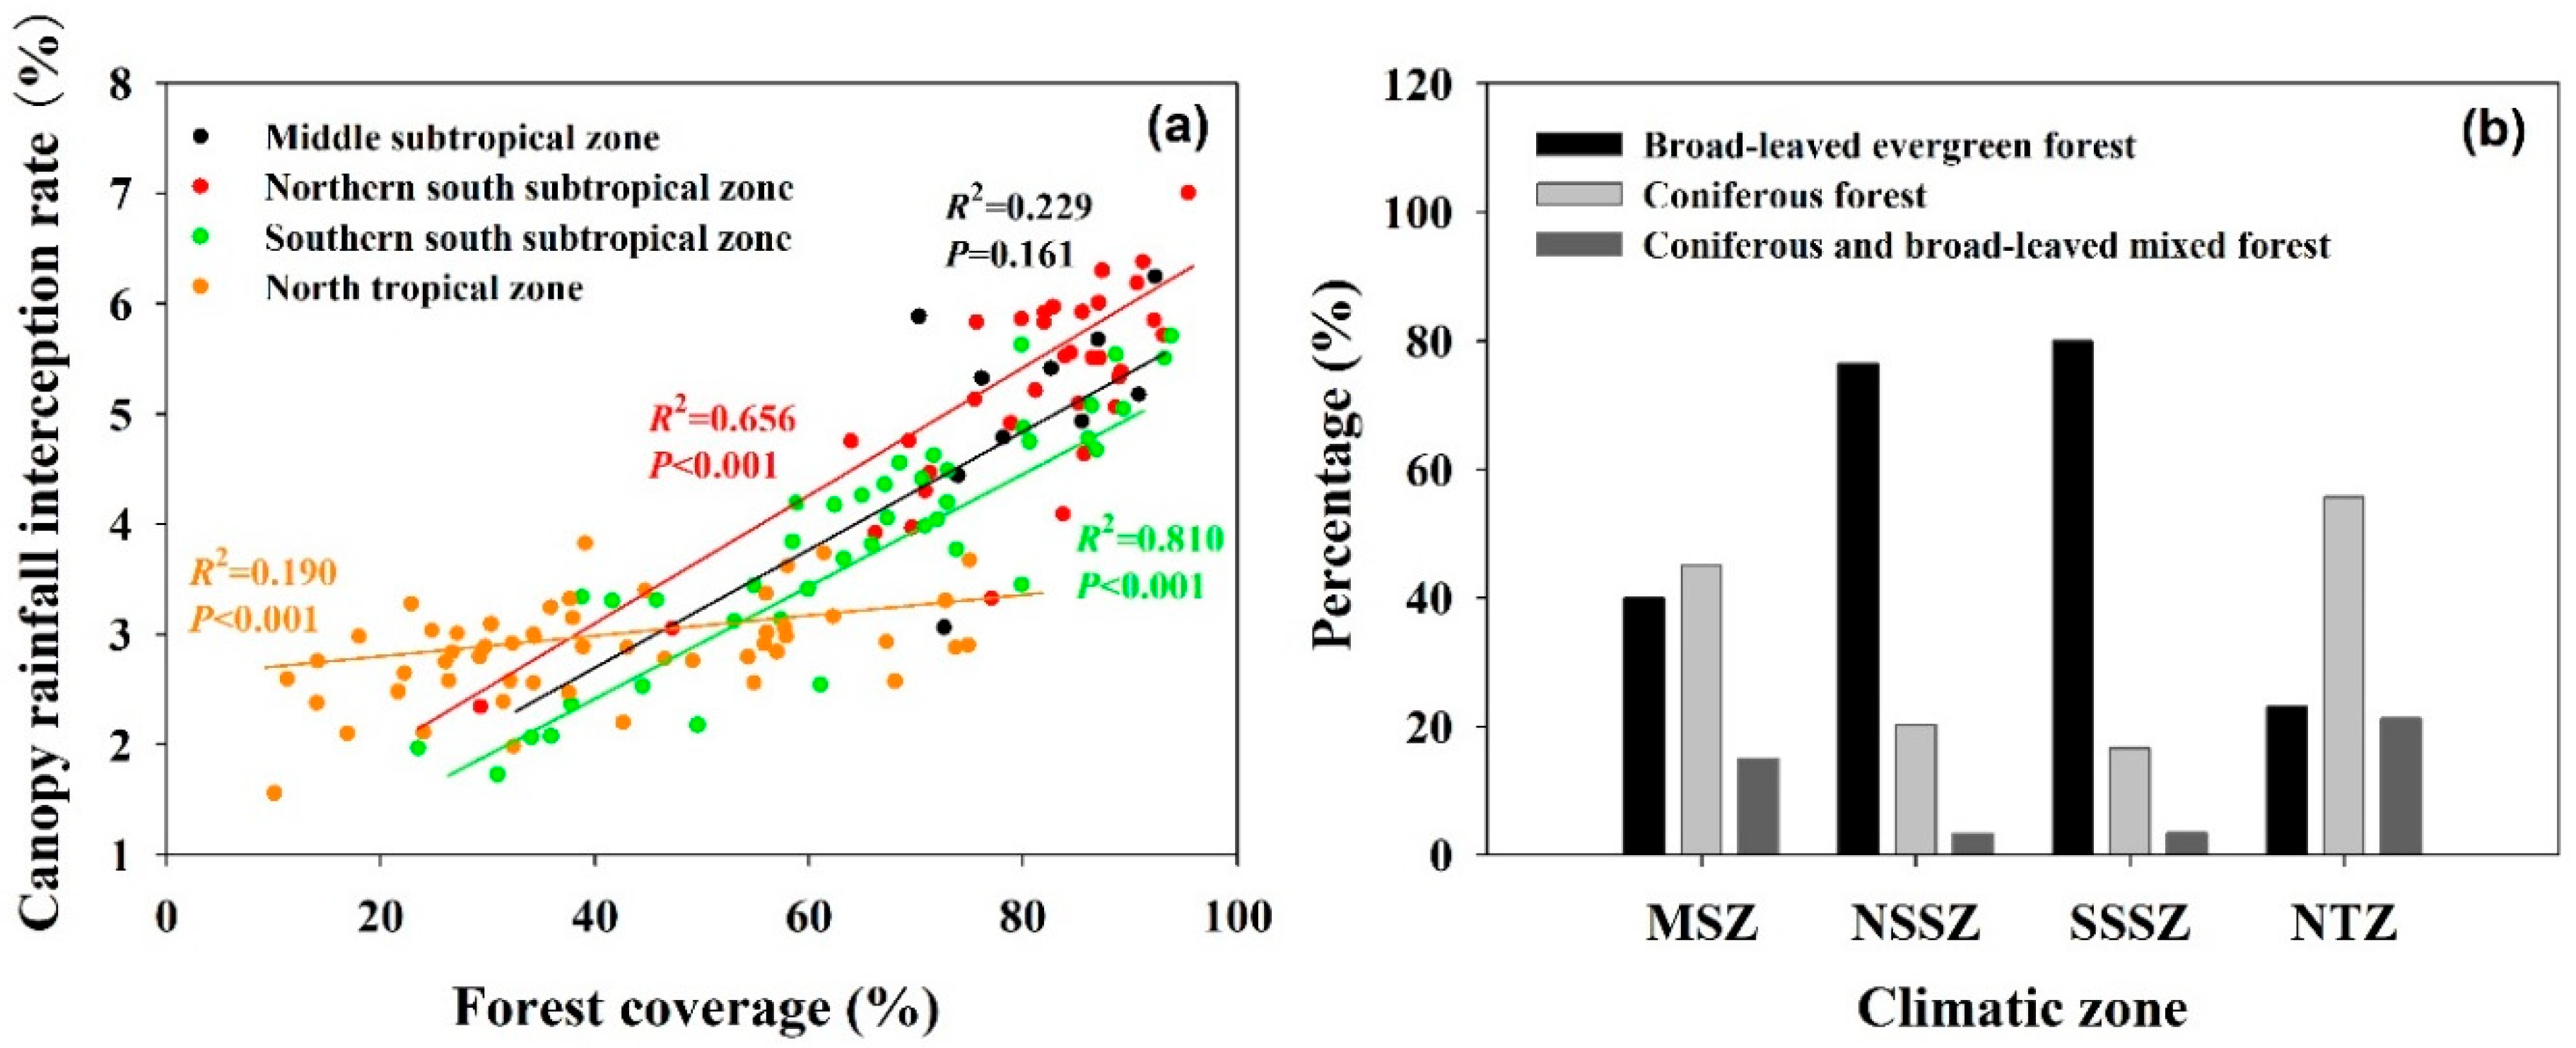
3.4. Effects of Climate and Forest Cover on Variation Patterns of the CRIR

The forest canopy plays an important role in rainfall interception in the forest ecosystem. However, differentiating the effects of climate and forest cover on the spatiotemporal variation patterns of the CRIR is not well understood for this region. To address this issue, we first selected two basins with similar forest coverage (about 70%) in each of the four climatic zones (e.g., middle subtropical zone, southern south subtropical zone, northern south subtropical zone, and north tropical zone, Table 3) in Guangdong to analyze their variation patterns of CRIR in the same climatic zone (Figure 11). The results showed that, with a similar forest coverage, the CRIRs of the basin-pairs were calculated as 2.48% and 5.08% in the middle subtropical zone, 4.03% and 5.13% in the northern south subtropical zone, 3.35% and 4.15% in southern south subtropical zone, and 2.34% and 3.10% in the north tropical zone, respectively (Figure 12).This shows that there were no significant differences in the influence of climatic zone on canopy rainfall interception in the basins.
To eliminate the influence of the climatic zone and evaluate the impact of forest cover change on canopy rainfall interception, we further extracted the forest ecosystem for all integrated basins in each climatic zone, and then analyzed the relationship between forest coverage and annual mean CRIR for each basin. The results showed that the forest coverage in all climatic zones, except for the middle subtropical zone, had a significant linear relationship (p < 0.001) with the CRIR (Figure 13a). The annual mean CRIR increased gradually with an increase in forest coverage in a linear pattern for the southern and northern south subtropical zones with the determination coefficients (R2) of 0.81 and 0.65, respectively. This showed the poor correlation of the middle subtropical and north tropical zones with the R2 of 0.23 and 0.19, respectively. This means that the forest cover does have a certain impact on canopy rainfall interception, but this effect is not obvious in some areas. Meanwhile, we also analyzed the proportions of different forest types (e.g., broad-leaved forest, coniferous forest, and coniferous and broad-leaved mixed forest) in the same climatic zone (Figure 13b) and found that the broad-leaved forest occupied a higher proportion of the southern and northern south subtropical zones, with a high correlation between the CRIR and forest cover. In contrast, the middle subtropical and north tropical zone had a higher proportion of coniferous forest and coniferous and broad-leaved mixed forest. This indicates that the proportion of broad-leaved forest may play a key role in canopy rainfall interception at the basin scale in Guangdong, but more research is needed in the future.

4. Discussion

Water source conservation is one of the most important vegetation functions in the terrestrial ecosystem. As an interface for atmospheric rainfall in the vegetation ecosystem, vegetation canopy influences the redistribution of rainwater as well as the damping and retention of the water that reaches the soil, affecting runoff dynamics through interception [54,55]. However, previous studies on canopy rainfall interception [55,56,57] have mainly focused on individual plants or groups of plants through in situ observation and are limited by spatiotemporal estimation in larger areas. In this study, we applied a canopy rainfall interception model coupled with MODIS_LAI remote sensing data to understand the spatial and temporal variation patterns of canopy rainfall interception at the basin scale in Guangdong Province, China.
From this study, we found that the CRIR at the basin scale in Guangdong ranged from 0.33% and 11.67%, which is similar to results in other studies in China that ranged from 0% and 12% [58]. However, this range is lower than that in forest ecosystems [57,59,60]. This is mainly because our study estimated the mean value of the CRIR for all vegetation ecosystems in the basin, which resulted in a lower estimated value when compared with that of a forest ecosystem. It is worth noting that the rainfall interception model applied in our study only considered the parameters of the LAI and rainfall, while rainfall interception was also closely related to many other factors such as atmospheric drivers of evaporation (e.g., wind speed, vapor pressure deficit, etc.), canopy characteristics, rainfall intensity, and rainfall duration [61,62,63,64,65]. In future research, introducing more meteorological factors into the interception model is necessary to estimate canopy rainfall interception more accurately.
It is important to note that, according to the analysis using the equations of cumulative interception (Equations (1) and (2)) and CRIR (Equation (3)), the spatiotemporal variation of the LAI and rainfall will have a similar influence on the annual and regional variation of vegetation canopy rainfall interception at the basin scale of Guangdong. We also found that the CRIR showed a significant spatial difference pattern that was high in the mountain areas of the eastern and western flanks, but low in the central mountainous region and coastal areas. This spatial pattern was closely related to the LAI of vegetation, which mainly presents a spatial pattern extending from the Pearl River Delta to the periphery, and has little correlation with the spatial pattern characteristics of rainfall that gradually decrease from south to north. Guangdong has many heavy rainfall events, and the leaves tend to reach their maximum saturation of rainfall interception, resulting in vegetation canopy rainfall interception depending mainly on the LAI, but not being restricted by the amount of rainfall. In addition, atmospheric rainfall is the main factor influencing the temporal variation of rainfall interception in the study area. Results showed that the annual mean CRIR in Guangdong continued to decrease from 2004 to 2012, but increased slightly in 2016. However, as time progressed, the difference in CRIRs between the basins decreased. This is because, as the annual mean LAI and annual rainfall increase, the spatial heterogeneity of LAI also increases (Figure 4), while the spatial heterogeneity of rainfall decreases (Figure 2). Combining the effects of the saturation of canopy rainfall interception and rainfall, the spatial homogeneity of annual rainfall magnifies the effects on the spatial pattern of CRIRs, while the spatial heterogeneity of annual mean LAI further diminishes the effects on spatial patterns of CRIR. This has led to decreases in both the CRIR and its spatial variability over time.
Importantly, broad-leaved forests are the main contributor to canopy rainfall interception in Guangdong. By analyzing the CRIRs of the basin-pairs in the four climatic zones with a similar forest coverage, we found that there was no significant difference in the canopy rainfall interception among the four climatic zones, while there was a significant correlation between forest coverage and the canopy rainfall interception within the basin. This means that canopy rainfall interception is far more affected by vegetation coverage than the background climate. In addition, the proportion of broad-leaved forest to the whole area of forest in the basin plays a critical role in the CRIR in Guangdong, which is similar to other results from previous research [55,66,67]. However, many studies conducted in various forests have reached the opposite conclusion, demonstrating that the canopy interception capacity in coniferous forests was higher than that in broad-leaved forests [68,69]. Researchers have found that the leaf surface area contributes to differences in the interception capacities between broad-leaved forests, coniferous forests, and coniferous and broad-leaved mixed forests [70], and the total annual interception was greater for the species with a denser canopy (e.g., broad-leaved forest). However, since the canopy interception capacity is also determined by other meteorological and canopy parameters, further research is needed on these other factors.
Note also that Guangdong is a typical rainy region in southern China with increased precipitation variability and abnormally frequent rainfall over the past several years, which can be explained at least in part by climate change. Water resource and soil erosion are two of the most crucial ecological concerns in this region and both are closely related to rainfall interception. Therefore, the assessment of vegetation canopy interception is extremely important for characterizing and understanding water cycling, and has scientific and practical implications for land surface cover planning and water and soil conservation. However, the level of economic development and ecological characteristics of various parts of Guangdong Province vary greatly, which requires relevant departments to formulate feasible policy plans according to local conditions. For example, in the part of the Pearl River Delta region that has a high demand for land for construction and economic development, green space system construction should be encouraged. For the mountainous areas in northern Guangdong with relatively large forest areas, it is necessary to strengthen forest conservation in successional stages to improve the quality of forests and form more vegetation coverage. For the Leizhou Peninsula and other coastal areas with serious soil erosion, vegetation types including mangrove forest, broad-leaved forest, and high-density grassland should be the main components of the ecological system in these regions.

5. Conclusions

In summary, the results of this study provide insights into the spatiotemporal variation in rainfall interception at the basin scale of Guangdong Province, and suggest that forest cover should be increased by adjusting the species composition and increasing the proportion of native broad-leaved species according to local condition in the basin. Furthermore, the results can provide helpful information for water resource management for the local government, and could potentially help assess the impacts of forest ecosystems on water cycling at a larger scale in the context of climate change.

Supplementary Materials

The following are available online at https://0-www-mdpi-com.brum.beds.ac.uk/2072-4292/11/21/2468/s1, Figure S1: Spatial patterns of annual rainfall from 2004 to 2016 in Guangdong, Figure S2: Spatial patterns of annual rainfall from 2004 to 2016 in seven major basins in Guangdong, Figure S3: Spatial patterns of annual mean LAI from 2004 to 2016 in Guangdong, Figure S4: Spatial patterns of annual mean LAI from 2004 to 2016 in seven major basins in Guangdong, Figure S5: Spatial patterns of annual mean canopy rainfall interception rate (CRIR) from 2004 to 2016 in Guangdong, Figure S6: Spatial patterns of annual mean CRIR from 2004 to 2016 in seven major river basins in Guangdong.

Author Contributions

Conceptualization, Y.S.; Data curation, C.S., C.W., and J.Y.; Formal analysis, J.L. and X.H.; Investigation, Q.L. and C.Z. Software, L.L.; Supervision, H.Z.; Writing—original draft, J.W.; Writing—review & editing, Y.S. and J.W.

Funding

This study was supported by the National Natural Science Foundation of China (grant number 41971275, 31971458, 41907289), the Special High-level Plan Project of Guangdong Province (grant number 2016TQ03Z354), the Key Programs of the Chinese Academy of Sciences (grant number KFZD-SW-312, QYZDJ-SSW-DQC003), the Pearl River S&T Nova Program of Guangzhou (grant number 201610010134), the GDAS Project of Science and Technology Development (grant number 2016GDASRC-0101, 2019GDASYL-0103002), and the Water Resource Science and Technology Innovation Program of Guangdong Province (grant number 2016-16).

Acknowledgments

We thank the Guangdong Provincial Meteorological Bureau for providing the daily precipitation data from January 2004 to December 2016. We thank Scientific Data Center of the Computer Network Information Center, Chinese Academy of Sciences for providing MODIS data.

Conflicts of Interest

The authors declare no conflicts of interest.

References

  1. Savenije, H.H.G. The importance of interception and why we should delete the term evapotranspiration from our vocabulary. Hydrol. Proc. 2004, 18, 1507–1511. [Google Scholar] [CrossRef]
  2. Galdos, F.V.; Álvarez, C.; García, A.; Revilla, J.A. Estimated distributed rainfall interception using a simple conceptual model and Moderate Resolution Imaging Spectroradiometer (MODIS). J. Hydrol. 2012, 468–469, 213–228. [Google Scholar] [CrossRef]
  3. Murakami, S. A proposal for a new forest canopy interception mechanism: Splash droplet evaporation. J. Hydrol. 2006, 319, 72–82. [Google Scholar] [CrossRef]
  4. Tsiko, C.T.; Makurira, H.; Gerrits, A.M.J.; Savenije, H.H.G. Measuring forest floor and canopy interception in a savannah ecosystem. Phys. Chem. Earth 2012, 47–48, 122–127. [Google Scholar] [CrossRef]
  5. Zhang, Y.; Li, X.Y.; Li, W.; Wu, X.C.; Shi, F.Z.; Fang, W.W.; Pei, T.T. Modeling rainfall interception loss by two xerophytic shrubs in the Loess Plateau. Hydrol. Process. 2017, 31, 1926–1937. [Google Scholar] [CrossRef]
  6. Muzylo, A.; Llorens, P.; Valente, F.; Keizer, J.J.; Domingo, F.; Gash, J.H.C. A review of rainfall interception modelling. J. Hydrol. 2009, 370, 191–206. [Google Scholar] [CrossRef] [Green Version]
  7. Dunkerley, D. Intra-storm evaporation as a component of canopy interception loss in dryland shrubs: Observations from Fowlers Gap, Australia. Hydrol. Process. 2008, 22, 1985–1995. [Google Scholar] [CrossRef]
  8. Shinohara, Y.; Komatsu, H.; Kuramoto, K.; Otsuki, K. Characteristics of canopy interception loss in moso bamboo forests of Japan. Hydrol. Process. 2013, 27, 2041–2047. [Google Scholar] [CrossRef]
  9. Carlyle-Moses, D.E.; Laureano, J.F.; Price, A.G. Throughfall and throughfall spatial variability in Madrean oak forest communities of northeastern Mexico. J. Hydrol. 2014, 297, 124–135. [Google Scholar] [CrossRef]
  10. Holwerda, F.; Scatena, F.N.; Bruijnzeel, L.A. Throughfall in a Puerto Rican lower montane rainforest: A comparison of sampling strategies. J. Hydrol. 2006, 327, 592–602. [Google Scholar] [CrossRef]
  11. Cuartas, L.A.; Tomasella, J.; Nobre, A.D.; Hodnett, M.G.; Waterloo, M.J.; Múnera, J.C. Interception water-partitioning dynamics for a pristine rainforest in Central Amazonia: Marked differences between normal and dry years. Agric. For. Meteorol. 2007, 145, 69–83. [Google Scholar] [CrossRef]
  12. Peterson, D.L.; Rolfe, G.L. Determining sample size in throughfall studies. For. Sci. 1979, 25, 582–584. [Google Scholar]
  13. Liu, S. Estimation of rainfall storage capacity in the canopies of cypress wetlands and slash pine uplands in North-Central Florida. J. Hydrol. 1998, 207, 32–41. [Google Scholar] [CrossRef]
  14. Deguchi, A.; Hattori, S.; Park, H.T. The influence of seasonal changes in canopy structure on interception loss: Application of the revised Gash model. J. Hydrol. 2006, 318, 80–102. [Google Scholar] [CrossRef]
  15. Peng, H.H.; Zhao, C.Y.; Shen, W.H.; Xu, Z.L.; Feng, Z.D. Modeling canopy interception of Picea Crassifolia forest in Qilian mountains using QuickBird satellite data. In Proceedings of the IEEE International Geoscience and Remote Sensing Symposium, Cape Town, South Africa, 12–17 July 2009. [Google Scholar]
  16. Cui, Y.K.; Zhao, P.; Yan, B.Y.; Xie, H.J.; Yu, P.T.; Wan, W.; Fan, W.; Hong, Y. Developing the Remote Sensing-Gash analytical model for estimating vegetation rainfall interception at very high resolution: A case study in the Heihe river basin. Remote Sens. 2017, 9, 661. [Google Scholar] [CrossRef]
  17. Domingo, F.; Sanchez, G.; Mor, M.J.; Brenner, A.J.; Puigdefábregas, J. Measurement and modelling of rainfall interception by three semi-arid canopies. Agr. For. Meteorol. 1998, 91, 275–292. [Google Scholar] [CrossRef] [Green Version]
  18. Dijk, A.I.J.M.V.; Gash, J.H.; van Gorsel, E.; Blanken, P.D.; Cescatti, A.; Emmel, C.; Gielen, B.; Harman, I.N.; Kiely, G.; Merbold, L.; et al. Rainfall interception and the coupled surface water and energy balance. Agr. For. Meteorol. 2015, 214–215, 402–415. [Google Scholar] [CrossRef]
  19. Stringham, T.K.; Snyder, K.A.; Snyder, D.K.; Lossing, S.S.; Carr, C.A.; Stringham, B.J. Rainfall Interception by Single leaf Piñon and Utah Juniper: Implications for Stand-Level Effective Precipitation. Rangeland Ecol. Manag. 2018, 71, 327–335. [Google Scholar] [CrossRef]
  20. Rutter, A.J.; Morton, A.J. A predictive model of rainfall interception in forests: III. Sensitivity of the model to stand parameters and meteorological variables. J. Appl. Ecol. 1977, 14, 567–588. [Google Scholar] [CrossRef]
  21. Rutter, A.J.; Morton, A.J.; Robins, P.C. A predictive model of rainfall interception in forests. II. Generalization of the model and comparison with observations in some coniferous and hardwood stand. J. Appl. Ecol. 1975, 12, 367–380. [Google Scholar] [CrossRef]
  22. Gash, J.H.C.; Lloyd, C.R.; Lachaud, G. Estimating sparse forest rainfall interception with an analytical model. J. Hydrol. 1995, 170, 79–86. [Google Scholar] [CrossRef]
  23. Gash, J.H.C.; Morton, A.J. An application of the Rutter model to the estimation of the interception loss from Thetford Forest. J. Hydrol. 1978, 38, 49–58. [Google Scholar] [CrossRef]
  24. Sadeghi, S.M.M.; Attarod, P.; Van Stan, J.T.; Pypker, T.G.; Dunkerley, D. Efficiency of the reformulated Gash’ interception model in semiarid afforestations. Agr. For. Meteorol. 2015, 201, 76–85. [Google Scholar] [CrossRef]
  25. Dunkerley, D. Measuring interception loss and canopy storage in dryland vegetation: A brief review and evaluation of available research strategies. Hydrol. Process. 2000, 14, 669–678. [Google Scholar] [CrossRef]
  26. Levia, D.F.; Frost, E.E. A review and evaluation of stemflow literature in the hydrologic and biogeochemical cycles of forested and agricultural ecosystems. J. Hydrol. 2003, 274, 1–29. [Google Scholar] [CrossRef]
  27. Wang, X.P.; Zhang, Y.F.; Wang, Z.N.; Pan, Y.X.; Hu, R.; Li, X.J.; Zhang, H. Influence of shrub canopy morphology and rainfall characteristics on stemflow within a revegetated sand dune in the Tengger Desert, NW China. Hydrol. Process. 2013, 27, 1501–1509. [Google Scholar] [CrossRef]
  28. De Jong, S.M.; Jetten, V.G. Estimating spatial patterns of rainfall interception from remotely sensed vegetation indices and spectral mixture analysis. Int. J. Geogr. Inf. Sci. 2007, 21, 529–545. [Google Scholar] [CrossRef]
  29. Delegido, J.; Fernandez, G.; Gandia, S.; Moreno, J. Retrieval of chlorophyll content and the LAI of crops using hyperspectral techniques: Applications of PROBA/CHRIS data. Int. J. Remote Sens. 2008, 29, 7107–7127. [Google Scholar] [CrossRef]
  30. Lunetta, R.S.; Johnson, D.M.; Lyon, J.G.; Crotwell, J. Impacts of imagery temporal frequency on land-cover change detection monitoring. Remote Sens. Environ. 2004, 89, 444–454. [Google Scholar] [CrossRef]
  31. Murakami, S. Application of three canopy interception models to a young stand of Japanese cypress and interpretation in terms of interception mechanism. J. Hydrol. 2007, 342, 305–319. [Google Scholar] [CrossRef]
  32. Peng, H.; Zhao, C.; Feng, Z.; Xu, Z.; Wang, C.; Zhao, Y. Canopy interception by a spruce forest in the upper reach of Heihe River basin, Northwestern China. Hydrol. Process. 2014, 28, 1734–1741. [Google Scholar] [CrossRef]
  33. Ghimire, C.P.; Bruijnzeel, L.A.; Lubczynski, M.W.; Ravelona, M.; Zwartendijk, B.W.; van Meerveld, H.J.I. Measurement and modelling of rainfall interception by two differently aged secondary forests in upland Eastern Madagascar. J. Hydrol. 2017, 545, 212–225. [Google Scholar] [CrossRef]
  34. Yu, Z.; Yao, Y.; Yang, G.; Wang, X.; Vejre, H. Spatiotemporal patterns and characteristics of remotely sensed region heat islands during the rapid urbanization (1995-2015) of Southern China. Sci. Total Environ. 2019, 674, 242–254. [Google Scholar] [CrossRef] [PubMed]
  35. Hasan, S.; Shi, W.; Zhu, X.; Abbas, S. Monitoring of land use/land cover and socioeconomic changes in south China over the last three decades using Landsat and Nighttime Light data. Remote Sens. 2019, 11, 1658. [Google Scholar] [CrossRef]
  36. Hu, J.; Bao, W. The characteristics of rain in the raining seasons in Guangdong province and its relationship with sea surface temperature (SST). In Proceedings of the International Conference on Electrical and Control Engineering, Yichang, China, 16–18 September 2011; pp. 3216–3219. [Google Scholar]
  37. Qiu, X.; Chen, X. Trend analysis of hydrological and meteorological factors in Guangdong under climate change. In Proceedings of the International Symposium on Water Resource and Environmental Protection, Xi’an, China, 20–22 May 2011; pp. 584–587. [Google Scholar]
  38. Zhang, H.; Chen, J.; Zhu, L.; Yang, G.; Li, D. Anthropogenic mercury enrichment factors and contributions in soils of Guangdong Province, south China. J. Geochem. Explor. 2014, 114, 312–319. [Google Scholar] [CrossRef]
  39. Zhao, Q.; Li, D.; Zhuo, M.; Guo, T.; Liao, Y.; Xie, Z. Effects of rainfall intensity and slope gradient on erosion characteristics of the red soil slope. Stoch. Environ. Res. Risk Assess. 2015, 29, 609–621. [Google Scholar] [CrossRef]
  40. Zhao, Q.; Liu, Q.; Ma, L.J.; Ding, S.Y.; Xu, S.; Wu, C.; Liu, P. Spatiotemporal variations in rainfall erosivity during the period of 1960-2011 in Guangdong Province, southern China. Theor. Appl. Climatol. 2017, 128, 113–128. [Google Scholar] [CrossRef]
  41. Levia, D.F.; Frost, E.E. Variability of throughfall volume and solute inputs in wooded ecosystems. Prog. Phys. Geog. 2006, 30, 605–632. [Google Scholar] [CrossRef]
  42. Cui, Y.K.; Li, J. A modified Gash Model for estimating rainfall interception loss of forest using remote sensing observations at regional scale. Water 2014, 6, 993–1012. [Google Scholar] [CrossRef]
  43. Liu, C.X.; Wang, Y.J.; Ma, C.; Wang, Y.Q.; Zhang, H.L.; Hu, B. Quantifying the effect of non-spatial and spatial forest stand structure on rainfall partitioning in mountain forests, Southern China. Forest. Chron. 2018, 94, 162–172. [Google Scholar] [CrossRef]
  44. Zhang, L.J.; Wang, C.Z.; Li, X.X.; Zhang, H.W.; Li, W.L.; Jiang, L.Q. Impacts of agricultural expansion (1910s-2010s) on the water cycle in the Songneng plain, Northeast China. Remote Sens. 2018, 10, 1108. [Google Scholar] [CrossRef]
  45. Zhou, G.Y.; Wei, X.H.; Luo, Y.; Zhang, M.F.; Li, Y.L.; Qiao, Y.N.; Liu, H.G.; Wang, C.L. Forest recovery and river discharge at the regional scale of Guangdong province, China. Water Resour. Res. 2010, 46, W09503. [Google Scholar] [CrossRef]
  46. Chen, X.Z.; Liu, X.D.; Zhou, G.Y.; Han, L.S.; Liu, W.; Liao, J.S. 50-year evapotranspiration declining and potential causations in subtropical Guangdong province, southern China. Catena 2015, 128, 185–194. [Google Scholar] [CrossRef]
  47. Huang, P.; Hou, C.M.; Zhang, C.; Zhang, Q.M.; Ren, H.; Ye, W.H. The value of forest ecosystem services of Guangdong province. Ecol. Sci. 2002, 21, 160–163. [Google Scholar]
  48. Wu, J.; Su, Y.; Chen, X.; Liu, L.; Sun, C.; Zhang, H.; Li, Y.; Ye, Y.; Zhou, X.; Yang, J.; et al. Redistribution characteristics of atmospheric precipitation in different spatial levels of Guangzhou urban typical forests in southern China. Atmos. Pollut. Res. 2019, 10, 1404–1411. [Google Scholar] [CrossRef]
  49. MODIS terrestrial standard product MOD13A1. Available online: http://www.gscloud.cn (accessed on 27 August 2019).
  50. De Roo, A.P.J.; Wesseling, C.G. LISEM: A single-event physically based hydrological and soil erosion model for drainage basins. I: Theory, input and output. Hydrol. Process. 1996, 10, 1107–1117. [Google Scholar] [CrossRef]
  51. Aston, A.R. Rainfall interception by eight small trees. J. Hydrol. 1979, 42, 383–396. [Google Scholar] [CrossRef]
  52. Merriam, R.A. A note on the interception loss equation. J. Geophys. Res. 1960, 65, 3850–3851. [Google Scholar] [CrossRef]
  53. Su, Y.X.; Chen, X.Z.; Li, Y.; Liao, J.S.; Ye, Y.; Zhang, H.; Huang, N.; Kuang, Y. China’s 19-year city-level carbon emissions of energy consumptions, driving forces and regionalized mitigation guidelines. Renew. Sustain. Energy Rev. 2014, 35, 231–243. [Google Scholar] [CrossRef]
  54. Cattan, P.; Bussiere, F.; Nouvellon, A. Evidence of large rainfall partitioning patterns by banana and impact on surface runoff generation. Hydrol. Process. 2007, 21, 2196–2205. [Google Scholar] [CrossRef]
  55. Alves, P.L.; Formiga, K.T.M.; Traldi, M.A.B. Rainfall interception capacity of tree species used in urban afforestation. Urban Ecosyst. 2018, 21, 697–706. [Google Scholar] [CrossRef]
  56. Fathizadeh, O.; Attarod, P.; Pypker, T.G.; Darvishsefat, A.A.; Amiri, G.Z. Seasonal variability of rainfall interception and canopy storage capacity measured under individual Oak (Quercus brantii) trees in western Iran. J. Agr. Sci. Tech. 2013, 15, 175–188. [Google Scholar]
  57. Guo, J.K.; Yu, B.Q.; Zhang, Y.; Che, S.Q. Predicted models for potential canopy rainfall interception capacity of landscape trees in Shanghai, China. Eur. J. For. Res. 2017, 136, 387–400. [Google Scholar] [CrossRef]
  58. Song, W.L.; Yang, S.T.; Lu, J.X.; Liu, C.M.; Wang, S.D. Simulation and analysis of vegetation interception at a large scale in the middle reaches of Yellow River. Acta Geographica Sinica 2014, 69, 80–89, in Chinese with English abstract. [Google Scholar]
  59. Xu, L.H.; Shi, Z.J.; Wang, Y.H.; Xiong, W.; Yu, P.T. Canopy interception characteristics of main vegetation types in Liupan Mountains of China. Chin. J. Appl. Ecol. 2010, 21, 2487–2493. [Google Scholar]
  60. Qiu, Z.J.; Zhou, G.Y.; Wu, Z.M.; Zhou, B.; Luo, X.H. Characteristics of the canopy interception in an evergreen broad-leaved secondary forest in Yangdongshan, North Guangdong. Scientia Silvae Sinicae 2011, 47, 157–161, in Chinese with English abstract. [Google Scholar]
  61. Pypker, T.G.; Levia, D.F.; Staelens, J.; Van Stan, I.I.J.T. Canopy structure in relation to hydrological and biogeochemical fluxes. In Forest Hydrology and Biogeochemistry; Levia, D., Carlyle-Moses, D., Tanaka, T., Eds.; Springer: Dordrecht, The Netherlands, 2011; Volume 216, pp. 371–388. [Google Scholar]
  62. Levia, D.; Michalzik, B.; Näthe, K.; Bischoff, S.; Richter, S.; Legates, D. Differential stemflow yield from European beech saplings: The role of individual canopy structure metrics. Hydrol. Process. 2015, 29, 43–51. [Google Scholar] [CrossRef]
  63. Llorens, P.; Domingo, F.; Garcia-Estringana, P.; Muzylo, A.; Gallart, F. Canopy wetness patterns in a Mediterranean deciduous stan. J. Hydrol. 2014, 512, 254–262. [Google Scholar] [CrossRef]
  64. Lozano-Parra, J.; Schnable, S.; Ceballo-Barbancho, C. The role of vegetation covers on soil wetting processes at rainfall event scale in scattered tree woodland of Mediterranean climate. J. Hydrol. 2015, 529, 951–961. [Google Scholar] [CrossRef]
  65. Li, L.; Li, X.Y.; Zhang, S.Y.; Jiang, Z.Y.; Zheng, X.R.; Hu, X.; Huang, Y.M. Stemflow and its controlling factors in the subshrub Artemisia ordosica during two contrasting growth stages in the Mu Us sandy land of northern China. Hydrol. Res. 2016, 47, 409–418. [Google Scholar] [CrossRef]
  66. Holder, C.D.; Gibbes, C. Influence of leaf and canopy characteristics on rainfall interception and urban hydrology. Hydrol. Sci. J. 2017, 62, 182–190. [Google Scholar] [CrossRef]
  67. Nytch, C.J.; Melendez-Ackerman, E.J.; Perez, M.; Ortiz-Zayas, J.R. Rainfall interception by six urban trees in San Juan, Puerto Rico. Urban Ecosyst. 2009, 22, 103–115. [Google Scholar] [CrossRef]
  68. Miralles, D.G.; Gash, J.H.; Holmes, T.R.H.; de Jeu, R.A.M.; Dolman, A.J. Global canopy interception from satellite observations. J. Geophys. Res. 2010, 115, D16122. [Google Scholar] [CrossRef]
  69. Staelens, J.; De Schrijver, A.; Verheyen, K.; Verhoest, N.E.C. Rainfall partitioning into throughfall, stemflow, and interception within a single beech (Fagus sylvatica L.) canopy: Influence of foliation, rain event characteristics, and meteorology. Hydrol. Process. 2008, 22, 33–45. [Google Scholar] [CrossRef]
  70. Xiao, Q.; McPherson, E.G. Surface water storage capacity of twenty tree species in Davis, California. J. Environ. Qual. 2016, 45, 188–198. [Google Scholar] [CrossRef]
Figure 1. Basins in Guangdong. BJ: Beijiang basin, DJ: Dongjiang basin, HJ: Hanjiang basin, XJ: Xijiang basin, PR: Pearl River basin, MYJ: Moyangjiang basin, JJ: Jianjiang river basin.
Remotesensing 11 02468 g001
Figure 2. Spatial patterns of annual rainfall in Guangdong.
Remotesensing 11 02468 g002
Figure 3. Spatial patterns of annual rainfall in the seven major basins in Guangdong.
Remotesensing 11 02468 g003
Figure 4. Spatial patterns of the annual mean leaf area index (LAI) in Guangdong.
Remotesensing 11 02468 g004
Figure 5. Spatial patterns of the annual mean LAI in the seven major basins in Guangdong.
Remotesensing 11 02468 g005
Figure 6. Spatial pattern of subregion with different rainfall interception in Guangdong in 2004.
Remotesensing 11 02468 g006
Figure 7. Variation of monthly mean canopy rainfall interception rates in Guangdong.
Remotesensing 11 02468 g007
Figure 8. Spatial patterns of annual mean CRIRs in Guangdong.
Remotesensing 11 02468 g008
Figure 9. Spatial patterns of the propensity score (SLOPE) for CRIRs in Guangdong.
Remotesensing 11 02468 g009
Figure 10. Spatial patterns of the annual mean CRIR in seven major river basins in Guangdong.
Remotesensing 11 02468 g010
Figure 11. Basin-pairs of the four climatic zones in Guangdong.
Remotesensing 11 02468 g011
Figure 12. Annual mean variation of the CRIR in basin-pairs in the four climatic zones in Guangdong.
Remotesensing 11 02468 g012
Figure 13. The relationship between the CRIR and forest coverage of all integrated basins in the four climatic zones (a), and the percentage of forest types in different climatic zones (b). MSZ: Middle subtropical zone, NSSZ: Northern south subtropical zone, SSSZ: Southern south subtropical zone, NTZ: North tropical zone.
Remotesensing 11 02468 g013
Table 1. Categorization of canopy rainfall interception.
CategorizationHigh Interception AreaModerate Interception AreaLow Interception Area
Canopy rainfall interception (mm) S v ≥ 9060 ≤ S v   < 90 S v < 60
Sv: the canopy rainfall interception (mm).
Table 2. Annual canopy rainfall interception (mm) in the different subregions.
YearHigh Interception AreaModerate Interception AreaLow Interception Area
200494.5171.2245.48
200890.8872.9252.68
2012101.2282.6659.61
2016131.83107.2370.26
Table 3. Areas and percentages of forests in basin-pairs in the four climatic zones.
Climatic ZoneMiddle Subtropical ZoneNorthern South Subtropical ZoneSouthern South Subtropical ZoneNorth Tropical Zone
BasinYYHWJPJHGHNJLJYLHDSH
Forest area (ha)11,692.88260,878.3104,807.697,092.87321,499.5155,122.115,207.2318,906.87
Coverage (%)72.6273.9270.8269.3471.6273.8067.2668.05
YYH: Yuyanhe basin, WJ: Wujiang basin, PJ: Pajiang basin, HGH: Huangganghe basin, NJ: Nanjiang basin, LJ: Longjiang basin, YLH: Yinglihe basin, DSH: Dashuiqiaohe basin.

