Geophysical Prospecting Using ERT and IP Techniques to Locate Galena Veins


1
Department of Mechanical and Mining Engineering, Linares Scientific-Technological Campus, University of Jaen, 23700 Linares, Spain
2
Department of Geology, Linares Scientific-Technological Campus, University of Jaen, 23700 Linares, Spain
3
Everest Geophysics, Cosme Gamella 23, 28270 Colmenarejo, Spain
*
Author to whom correspondence should be addressed.
Remote Sens. 2019, 11(24), 2923; https://0-doi-org.brum.beds.ac.uk/10.3390/rs11242923
Submission received: 31 October 2019
/
Revised: 26 November 2019
/
Accepted: 2 December 2019
/
Published: 6 December 2019
(This article belongs to the Special Issue Advances in Measurements and Modeling of the Earth’s Mineral Dust Source Regions)
Abstract
:The aim of this study is to prove the effectiveness of two electrical geophysical prospecting techniques, namely electrical resistivity tomography (ERT) and induced polarization (IP), in locating thin vein structures of metal sulphides embedded in Palaeozoic materials underlying a sedimentary cover. For this purpose, a Quaternary basin known as La Garza was selected, located in the mining district of Linares-La Carolina (Southern Spain). Galena (PbS) veins appear abundantly throughout this area, hosted in the Palaeozoic granitic bedrock. The studied veins show thicknesses from 0.5 to 2.0 m, and most present a vertical planar distribution. The veins lose their continuity below the sedimentary cover due to normal fractures that control the subsidence of the basin. During the 1980s, geophysical research campaigns were carried out in La Garza using vertical electrical sounding and failed in detecting the hidden veins. For this reason, to carry out this study, a closed regular mesh was designed, composed by eight ERT and IP profiles, with variable lengths between 315 and 411 metres. An electrode spacing between 5 and 7 metres was selected, thus allowing the granite bedrock to be reached without significantly reducing the resolution capabilities of the method. Even though ERT and IP are well-known geophysical techniques for mapping ore deposits, this is a case study that shows the advantages of the simultaneous use of both techniques (ERT and IP), over their individual application. ERT allows for reconstructing the morphology of the basin and the fractures that control it due to high-resistivity contrast between the overlying sedimentary cover and the underlaying granitic basement. However, it cannot provide any insights about their degree of mineralization. At this point, it is the IP technique that makes it possible to differentiate which are the mineralized structures. Some of these fractures produce high (above 50 mV/V) and moderate (below 50 mV/V) chargeability values, suggesting the existence of several unexploited metal veins. Furthermore, the derived models enable researchers to analyse the morphology of this sedimentary basin controlled by normal faults.
1. Introduction
In mineral prospecting, geological information extracted from available field maps, historical information on old exploitations and, in some cases, from mechanical drilling, can be insufficient when the studied structures are not exposed at the surface. In order to detect them, the use of indirect techniques of geophysical prospecting has proven to be very useful.
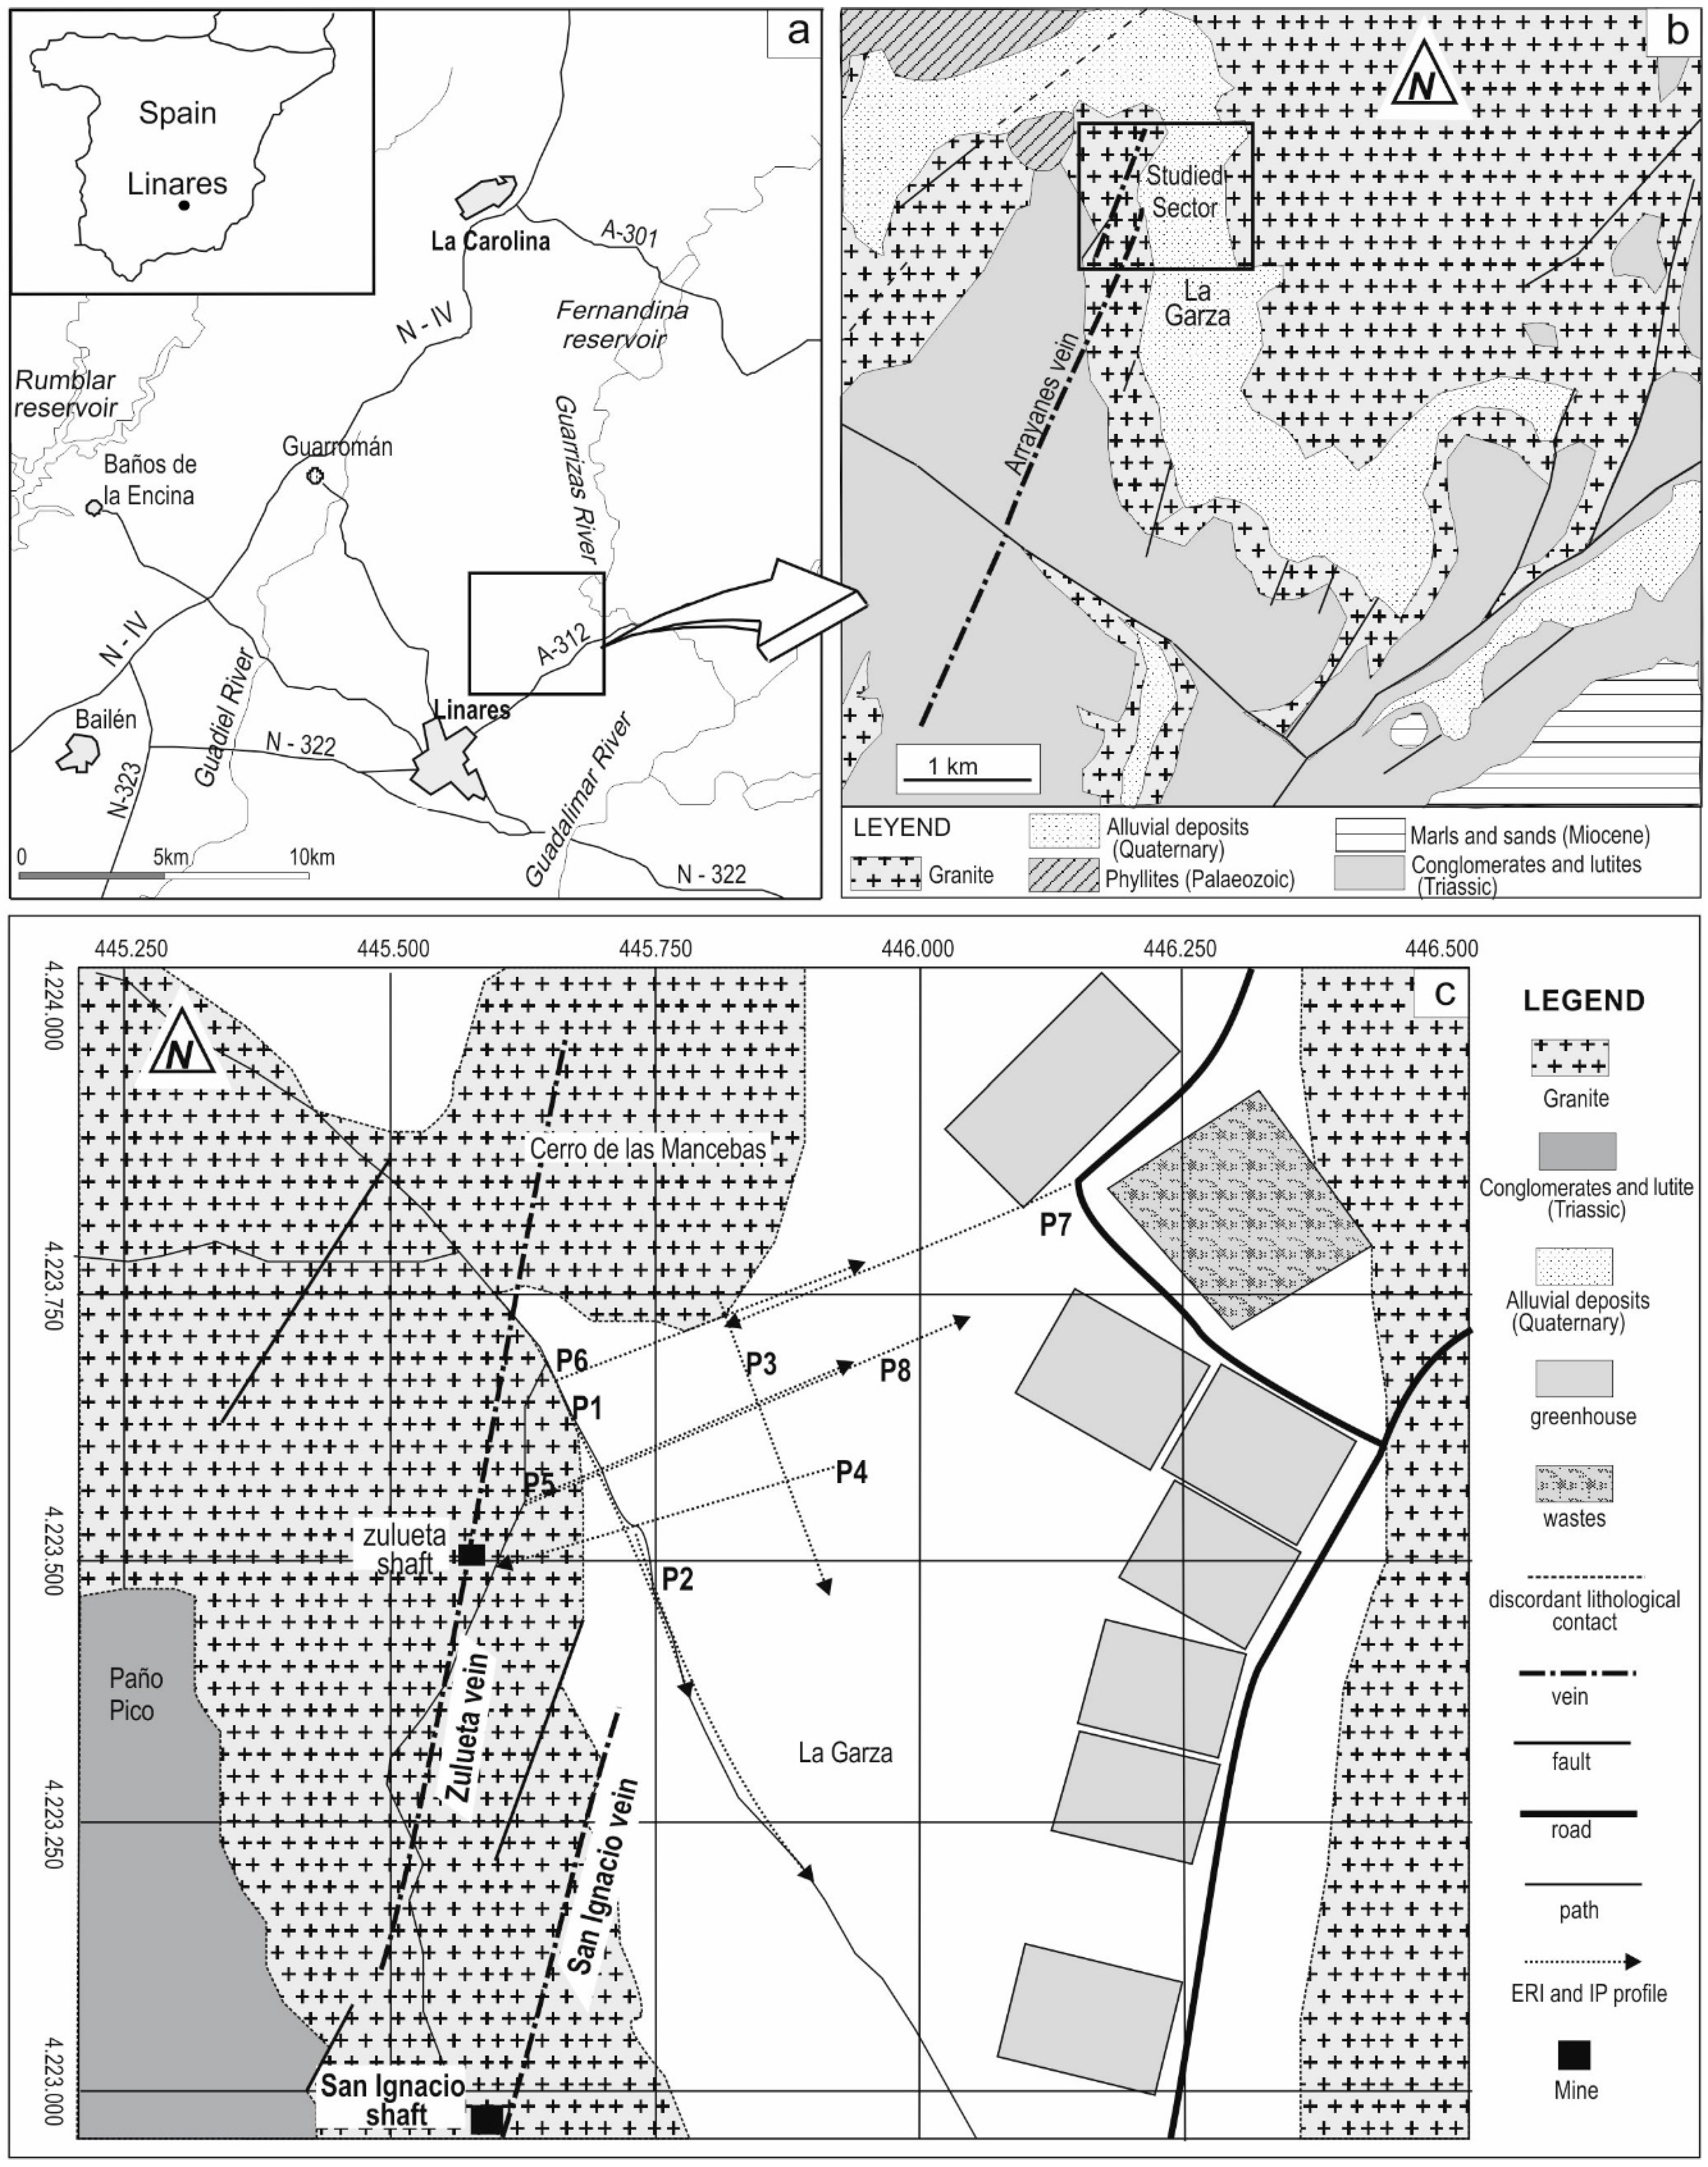
The area selected to carry out this study is located in the metallogenetic district of Linares-La Carolina (Southern Spain, Figure 1a), which is characterized by an abundant presence of lead and copper sulphide veins [1,2,3]. Mining activity ceased in the early 1990s due to the prevailing low price of metals and the depletion of the veins, although some of them were investigated using the vertical electrical sounding (VES) technique to see lateral continuity, without obtaining positive results (unpublished and private company reports).
Electrical resistivity methods have often been used in the exploration of metal deposits, mainly because these techniques are conceptually simple and the equipment has a relatively low cost compared to other methods, such as electromagnetic methods [5]. The VES method has been traditionally used to measure the thickness of the layers and their resistivity values, but the obtained information is limited to an average one-dimensional (1D) model represented at the centre of the measuring array device used. On the other hand, the horizontal profiling method allows to map lateral changes in resistivity, but the investigation depth is reduced when the resolution level needs to be enhanced. In addition to these limitations, when electrical prospecting techniques are used, it should be noted that the electrical resistivity and chargeability values depend on various factors, such as the mineralogy (composition) of the rock, the porosity of the various lithologies, the degree of fluid saturation within the pores and the composition of these fluids [6,7,8]. All of these factors generate a certain degree of uncertainty in the interpretation of the models, because they pose a strong influence in the electrical behaviour of the ground. For this reason, it is recommended to use various complementary methods simultaneously to reduce the uncertainty associated with these indirect methods.
The geometry and physical contrast of the searched structures, i.e., thin veins hidden under overlying deposits, do not make it advisable to use magnetic, electromagnetic or gravimetric methods, more suitable for massive deposits because the density and magnetic anomalies they generate are too subtle to make them detectable with these techniques. Galena (PbS) has a much larger density (7600 kg/m3) than the hosting rock (granite, 2750 kg/m3). However, the gravimetric anomaly [9] of a one-meter-thick vertical galena vein under a sedimentary cover of 20 metres is on the order of 0.5 mgal. This value is too small to be detectable with a standard gravimetric survey. Magnetic surveys could also be used as galena has a much stronger susceptibility than granite [10]. However, the potential signature of the galena veins could not be used to reconstruct the structure of the basin in detail. The Mise-a-la-Masse method cannot be used either, as mineralization is not accessible. Therefore, in this case study, we propose to jointly use two different electrical techniques: electrical resistivity tomography (ERT) and induced polarization imaging (IP). The aim is to analyse the effectiveness of the combined use to locate galena veins. The fundamental physical law used in resistivity surveys is Ohm’s Law, which governs the flow of current in the ground. In the IP method, the residual voltage that remains in the ground after injecting a controlled Direct Current (DC) current is measured. The chargeability value is given in milliseconds (msec), which is the same numerical value as the chargeability given in mV/V [4]. These methods allow for studying the underlying rock mass in which mineralised structures may exist [4,11,12,13] and to delineate the geometry of the sedimentary basins [14,15,16,17,18,19,20]. Thus, the IP method is complementary to the ERT and has been proven to be very useful in searching gold deposits, massive ore sulphides, graphite or bentonite deposits, as well as in investigating the contamination of aquifers by organic or inorganic substances [4,5,11,21,22]. The combination of these techniques has also been used in the detection of deeply buried caves [23], seepage [24] and slope stability [25].
2. Geological Description of the Study Area
In the district of Linares, an endorheic Quaternary basin was chosen, in an area known as La Garza (Figure 1b). A geophysical prospecting campaign was designed and carried out here to analyse the effectiveness of the combined use of ERT and IP in the detection of galena veins beneath the sedimentary cover. The aim was to obtain information on the trajectory of the vein and find possible mineralisations that had not previously been located.
Geologically, two groups of materials can be differentiated in the study area: a Palaeozoic bedrock and an overlying Mesocic-Cenozoic cover.
The bedrock consists of metamorphic rocks, composed by phyllites interspersed with quartzites, which were intensely folded during the Hercynian orogeny and affected by a granite intrusion [1,26,27]. Three intense tectonic episodes have affected at the region, producing the intrusion of the granites in the second, during a decompression phase, and the network of fractures with two predominant strikes tendencies, N 25° E and N 80° E were generated in the third tectonic episode [1,2,26,27]. Many of these fractures were mineralised by hydrothermal flows rich in Pb-Ag sulpho-antimonides and Cu-Fe sulphides, in three mineralisation phases [1,2,26,27].
The Mesozoic-Cenozoic sedimentary cover appears on top of the Palaeozoic bedrock, overlying the galena veins. Regionally, it is made up of Triassic, Tertiary Miocene and Quaternary materials [28]. The Quaternary materials are practically only those associated with flooding from the main streams, never being more than 5 m thick. However, in the La Garza basin, the Quaternary materials can be over 50 m thick [19,29]. These facies rest directly on the granite and are basically made up of silts and clays, among which, discontinuous layers of sands and conglomerates are interspersed. The morphology of La Garza basin is controlled by tectonics. It is approximately 8 km long and has an average width of 1 km. The geological map available of the mining district shows numerous veins hidden by the sedimentary deposits of La Garza (Figure 1b,c). This is the case of the most important mine exploitation in the district, named “Arrayanes” [3]. Mining work was essentially concentrated on the main vein, known as San José, which in its northern-most extreme splits in two, becoming the San Ignacio vein and the Zulueta vein (Figure 1c), with thickness from 0.5 to 2.0 m. According to the working plans consulted (unpublished), both veins were apparently lost at the point where the fractures limiting the western boundary of the La Garza basin intersect them.
3. Material and Methods
In the study area, a review of the geological mapping was carried out before performing the geophysical works.
Historically, vertical electrical soundings (VES) [9,30], and electrical trial pits (ETP) were used as electrical techniques in geophysical prospecting to study the geoelectrical behaviour of the subsoil through the distribution of electrical resistivity (the difficulty or resistance of an electric current in passing through a material). The method is simple: a known current intensity is injected into the ground through two electrodes, and the electric potential generated is measured between two other non-polarising electrodes. With these two magnitudes (current and voltage), the electrical resistivity of the ground can be calculated. Their use became generalised in hydrogeology and mining geology by the 1980s.
The development of automatic data acquisition systems (multi-electrode resistivity meters), capable of automatically obtaining a high volume of data and efficient inversion algorithms to rapidly process the field information, has given an enormous impulse to the application of geo-electrical methods. Nowadays, the electrical resistivity tomography (ERT) is a geophysical method that provides two-dimensional (2D) and three-dimensional (3D) models of the ground that allow the imaging of complex geological models [31,32,33,34].
On the other hand, the induced polarisation (IP) technique was used to determine the electrical chargeability. The method is based on electrically charging the ground to detect those materials that are able to store electrical charges for some time. This ability of a material is called chargeability (measured in mV/V), and it can be estimated by measuring the voltage decay at a point after switching off the current, divided by the measured potential (Vo), measured during the current injection [13].
Both methods are based on the implantation of numerous electrodes along a profile connected to a multi-core cable. The separation between electrodes defines the degree of resolution (lateral and vertical) and the length of the array limits the maximum investigation depth. To increase the resolution of the model, it is necessary to place the electrodes closer together. However, this will reduce the maximum investigation depth as the total number of available electrodes is limited. Therefore, it is important to select the appropriate distance between electrodes to find a balance between resolution and maximum investigation depth.
Figure 2 shows the implantation of the device, the placement of the electrodes in the field and the measuring equipment.
The electrical tomography equipment used in this study was a RESECS resistivity meter from Deutsche Montan Technologie (DMT). The energy source provides 250 W and 2.5 A, which generates impulses of up to 800Vp-p. A transmitter, receiver and power amplifier are all incorporated into the system. Among other features, it is worth mentioning that the system allows to control, in real time with an integrated PC, the main physical parameters of the experiment (voltage, injected current, apparent resistivity and chargeability).
The electrodes were connected to the resistivity meter that, using a specific sequential program RESECS32, with a Wenner-Schlumberger configuration, selects different combinations of electrodes (in groups of four, a pair of them injecting electrical current and another pair measuring the electrical potential generated). An apparent resistivity and chargeability reading are taken for each electrode combination. This measurement is displayed at a certain geometrical point within the ground. At each one of these points, two parameters are obtained: the apparent electrical resistivity (measured in ohm.m) and the apparent chargeability (measured in milliseconds or millivolt/volt). The stored apparent resistivity value is an average of hundreds of measurements (voltage and injection) carried out during the injection phase. Moreover, the current injection curve is a pattern of positive and negative current injections that is repeated several times to stack the measured voltages and improve the signal-to-noise ratio. Thus, the uncertainties in the measurements are accurately calculated and are used later in the processing stage.
As the intention was to measure the resistivity (ERT) and chargeability (IP) simultaneously, we used non-polarising electrodes, as they offer greater stability to the measurement and avoid the electrodes being polarised when prolonged injections of current are required. The use of these kinds of electrodes is very extensive in geo-electrical and electromagnetic surveying, and in particular for resistivity, induced polarization (IP) and spontaneous potential (SP) measurements [5,11,17,23]. These electrodes are free of potentials caused by electrochemical action between the electrodes and the ground. The body of the electrode is filled up with lead chloride saturated in hard gel and a lead spiral is cemented in it.
The operator can select the injection time and delay time according to the expected electrical response. In this study, the parameters used to measure the ground chargeability had an injection time of 1024 ms, with a current shut-down delay of 10 ms (a time window after turning off the current to avoid induction effects) and an interval between measurements of 1 second.
The apparent resistivity and chargeability values obtained in the field were pre-processed by PROSYSII (IRIS Instruments). It is a useful software for downloading and processing resistivity and induced polarisation measurements, allowing for displaying raw data in graphic plots, and isolating and removing erroneous data points (data with standard deviations over the average and/or values that produce spikes when compared with the surrounding measurements) prior to exporting to the specific inversion software RES2DINV [35]. This data processing program is based on the smoothness-constrained least-squares method, modified by the Quasi-Newton optimization technique. In case of noisy datasets, a strongly damped smoothness-constrained solution to the resistivity model can be applied. This will reduce the effect of data outliers that were not properly filtered out and decrease the possibility of the appearance of mathematical artefacts in the model. The inversion method constructs a model of the subsoil using rectangular prisms and determines the resistivity values for each of them, minimising the difference between the observed and calculated apparent resistivity values [33,35]. A damping factor of 0.03 was used during the inversion process. As a convergence limit (condition to stop the iterative procedure), we selected a 1% change between two consecutive iterations Root Mean Square (RMS). The program stops when the RMS fitting error is below that limit. In all cases, this condition was achieved within four to six iterations.
4. Results and Discussion
For this study, eight profiles were acquired (Table 1). Each profile consisted of 64 electrodes, forming a mesh, with an electrodes’ spacing between 5 and 7 m. The aim was to obtain, with sufficient resolution, models that could provide information about the geometrical detail of the sedimentary basin and the possible existence of veins embedded in the underlying granite. The selected electrode separation is a compromise between resolution and investigation depth. Thin (0.5 to 2 metres) galena veins would require closer electrode separations. However, the investigated basin shows a very complex geometry with a rapidly changing basin depth within the profile dimensions. Thus, the required investigation depth for all profiles needed to address these strong variations. With the above-mentioned characteristics, the maximum investigation depth was selected as 49 m for all profiles with a total length of 315 m, and 81 m for profile 8 (with a total length of 441 m).
When designing the fieldwork, the profiles were first acquired with two different configurations: dipole-dipole and Wenner-Schlumberger. In the dipole-dipole configuration, the distance between the two current electrodes (AB) is the same as that between potential electrodes (MN). The distance between dipoles is usually an integer multiple. For the Wenner-Schlumberger array, the space between potential electrodes is a small fraction of the distance between the current electrodes. The dipole-dipole datasets were very noisy (the standard deviations of the apparent resistivity values were too high) and they were finally removed from the modelling phase. Only the Wenner-Schlumberger datasets were chosen as they provided high signal-to-noise ratio and a good stability of measurements.
Figure 3 and Figure 4 represent the electrical resistivity and chargeability models obtained, with a common colour scale in every case, for easier comparison.
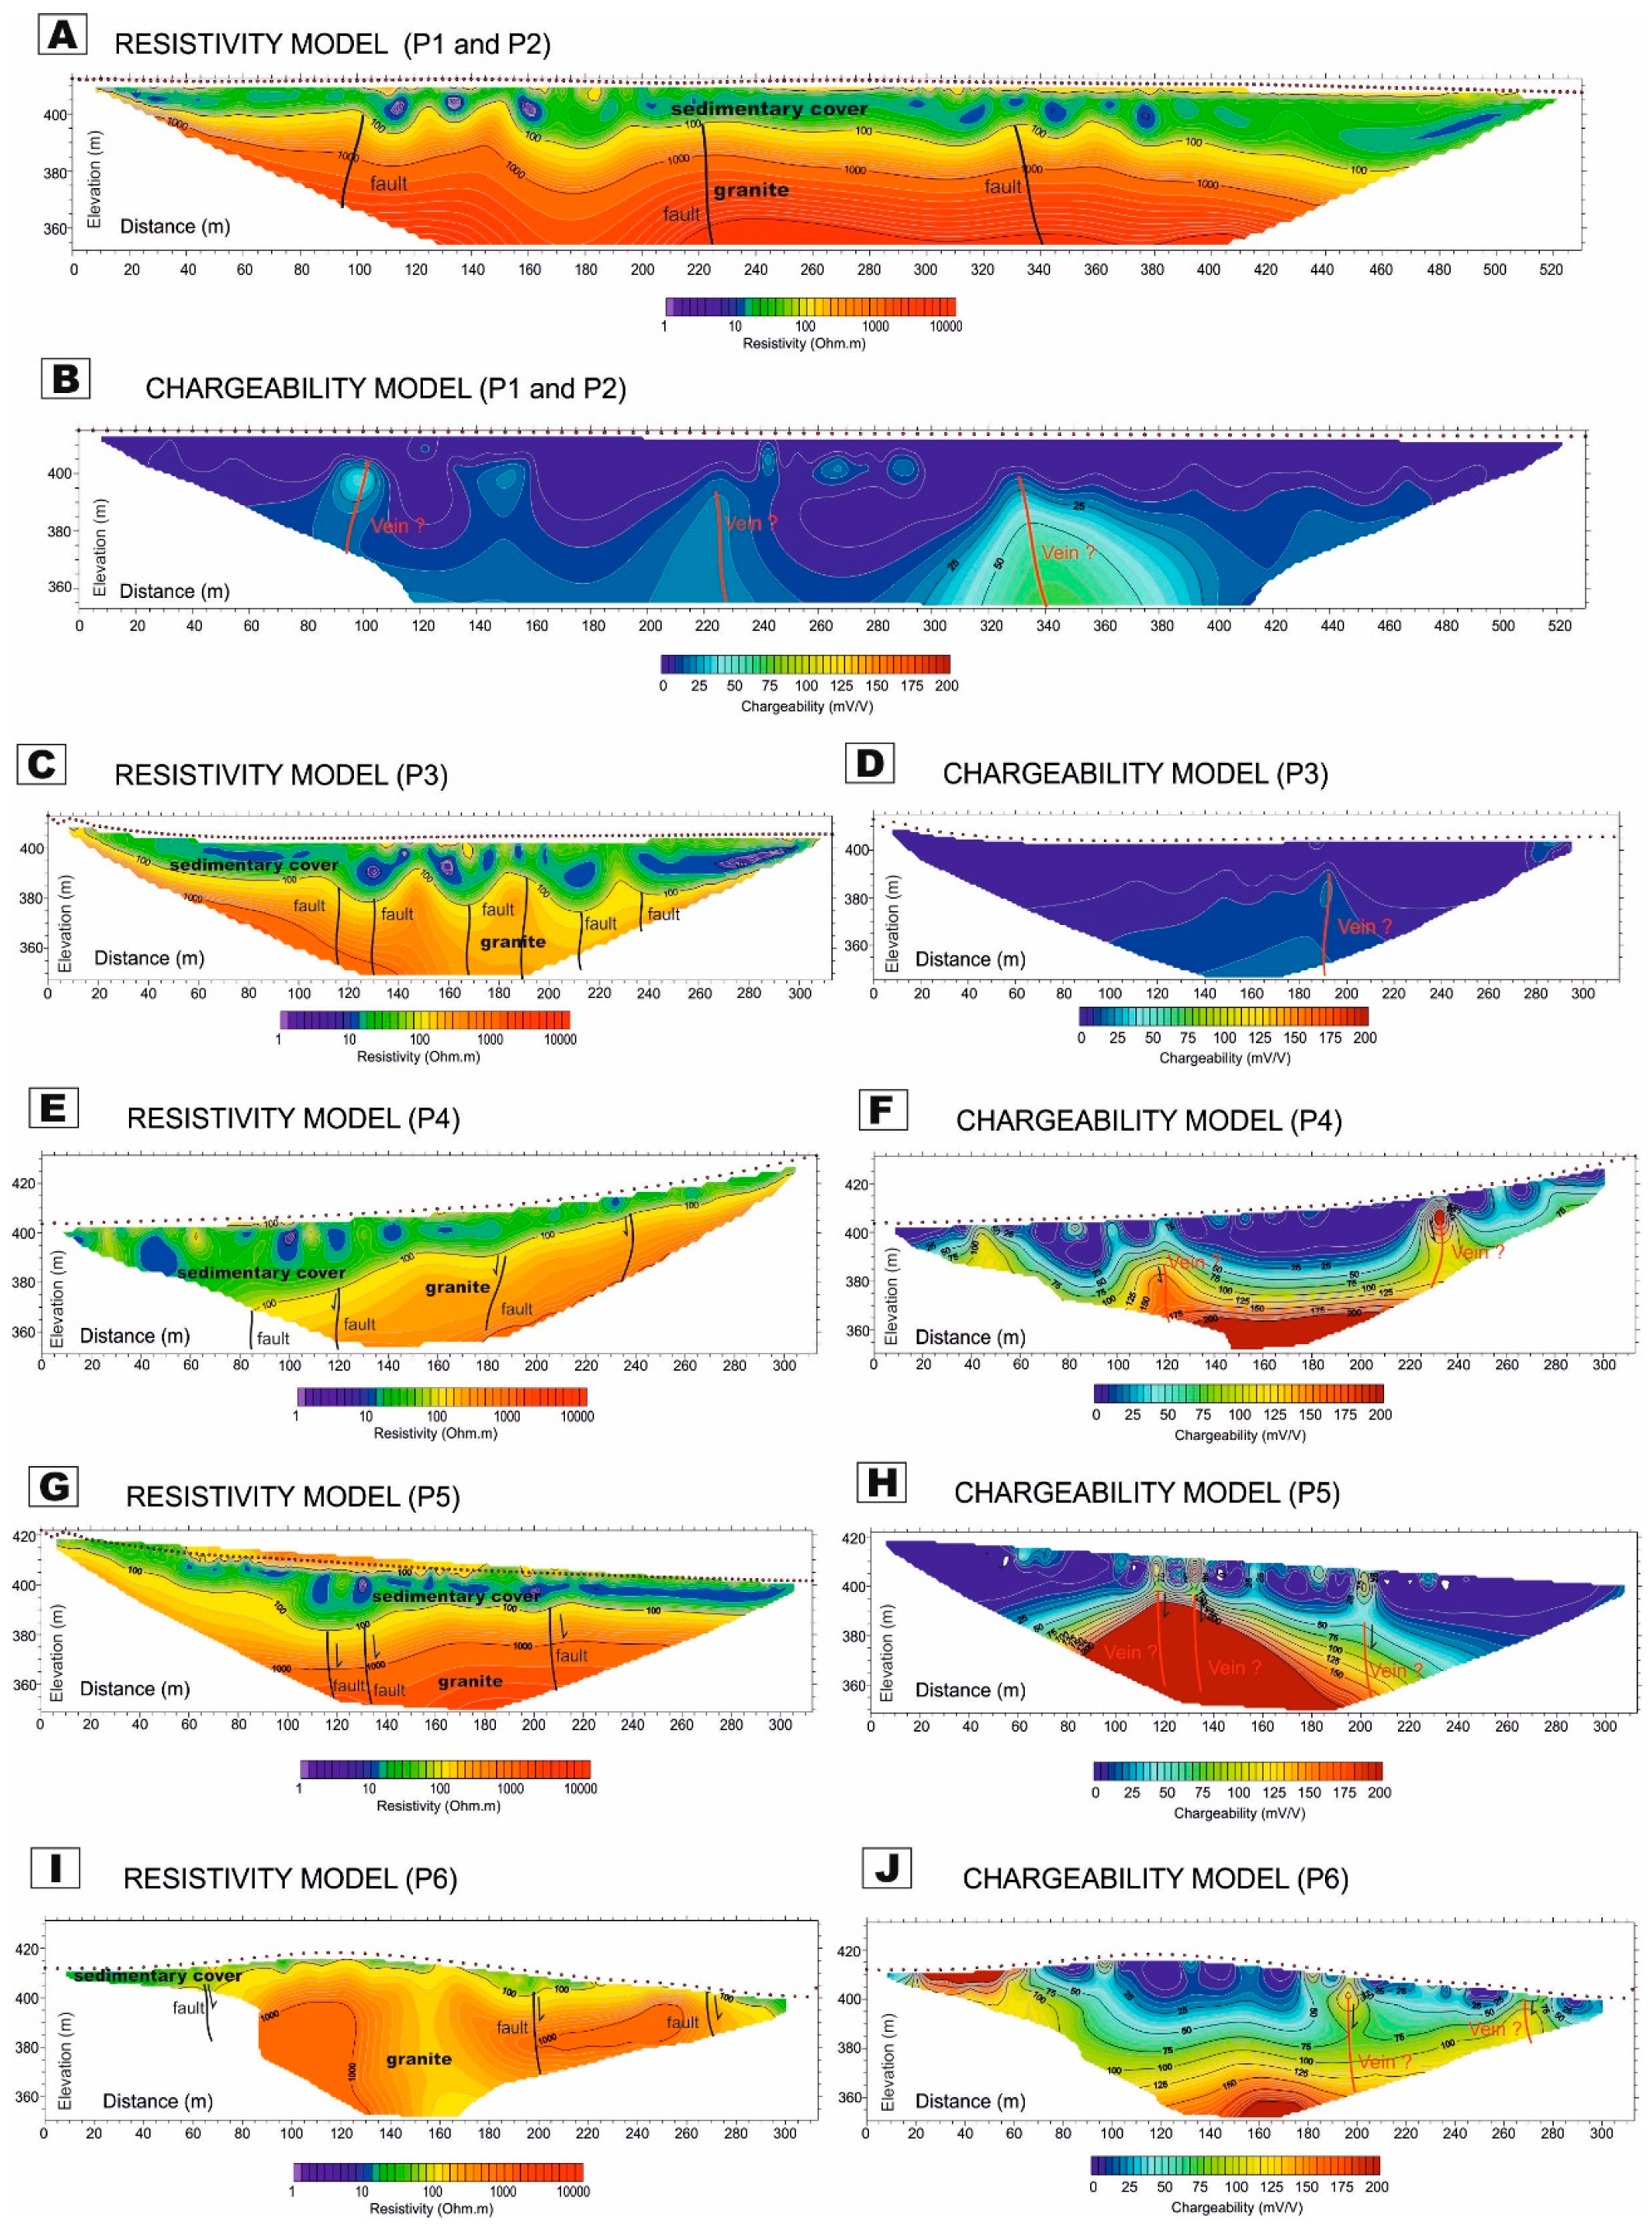
First, we analysed the quality of the resistivity and chargeability values measured in the field by calculating RMS errors. The quality of the data was good for profiles 1, 2 and 3 (Figure 3), which are orientated parallel to the boundary of the basin. The RMS errors of the final resistivity models were of 6.7%, 4.7% and 11.3%, respectively (Figure 3A,C). The RMS errors in the chargeability models were 2.3%, 2.0% and 2.7%, respectively (Figure 3B,D). Field measurements were less stable in profiles 4, 5 and 6 (Figure 3E–J), which were acquired in a SW-NE direction perpendicular to the boundary of the basin, with abrupt lateral changes in resistivity.
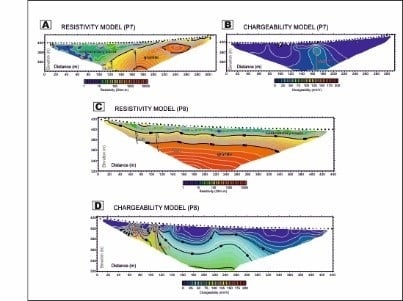
When weak potential measurements are recorded (usually at large offsets between current electrodes), it is a standard practice to increase the distance between the potential electrodes. Thus, profiles 5, 6 (Figure 3G–J), and 7 (Figure 4A,B) were repeated using a larger spacing of 25 m between the potential electrodes. As a result, the collected data showed significant improvement (reducing the resolution power of the array). Resistivity RMS errors of 6.3%, 3.7% and 3.9% (Figure 3G,I and Figure 4A), and chargeability RMS errors of 43%, 8.3% and 4.3% were obtained in profiles 5, 6 and 7, respectively (Figure 3H,J and Figure 4B). Profile 8 was acquired over the same line as profile 5, but using an electrode spacing of 7 m. A RMS of 6.7% and 19% was achieved for the resistivity and chargeability models (Figure 4C,D).
The analysis of the ERT profiles make it possible to deduce the geological model of the basin. The values close to the surface generally present lower resistivities, ranging from 10 to 100 Ω.m. This group could be interpreted as the detrital sedimentary cover, made up of conglomerates or sands, immersed in lutite and clay facies (Quaternary colluvium). The Palaeozoic bedrock is composed by granitoids in this sector, which present very high resistivities, over 2000 Ω.m. However, the contrast in resistivity values between the cover and the bedrock is not abrupt. On the contrary, these values increase gradually with depth. This is because the top of the granite is very weathered. This zone presents resistivity values that oscillate between 100 and 300 Ω.m. As the degree of alteration decreases with depth, the values of resistivity increase.
Important variations in thickness (10 to 40 m) of this sedimentary cover in adjacent sectors reveal the complex shape of the basin and the presence of fractures. This configuration can be better observed in those ERT profiles taken perpendicularly to the edge of the basin, e.g., Figure 3E and Figure 4A.
On the other hand, the chargeability anomalies obtained in the models can be described as high (above 50 mV/V) and moderate–low (below 50 mV/V). Thus, in profiles 1 and 2 (displayed together in Figure 3B, as a composite profile), three moderate–high chargeability anomalies were detected, at 100 m, 230 m and 330 m from the origin, with values from 50 to 70 mV/V.
In profile 3 (Figure 3D), a low chargeability anomaly is found at 190 m from the origin and in profile 4 (Figure 3F), three high chargeability anomalies were identified, at 45, 120 m and 235 m from the origin.
Profile 5 (Figure 3H) presents three maximums, with high chargeability values at 120, 135 and 200–210 m. When analysing profile 6 (Figure 3J), two high chargeability anomalies (over 75 mV/V) appear located at 200 and 270 m from the origin. Furthermore, profile 7 (Figure 4A) shows a low chargeability anomaly at 175 m from the origin.
In profile 8 (Figure 4D), acquired with different electrode spacings between the potential electrodes with respect to profile 5, anomalies are again detected at 70 and 110 m from the origin, which confirms their existence. On the other hand, the anomalies detected at 130 m and 210 m in profile 5 do not appear in profile 8, meaning they may be unreliable.
In all the chargeability profiles, the anomalies tend to have sub-vertical shapes, which would be consistent with vein structures in this mining district.
Figure 5 shows the spatial distribution of the fractures and anomalies detected in the various ERT and chargeability profiles. In this figure, the assumed position of the veins below the Quaternary cover is also included.
As it can be observed in the geological map (Figure 1b,c), granite outcrops on the Northern and Western boundaries of the study area. It can be deduced from the resistivity models (Figure 3 and Figure 4) that this basin is controlled by normal NW-SE fault-lines, which bury the Palaeozoic bedrock (Figure 5b), with an increase in the thickness of the sedimentary cover towards the centre of the basin. In this sense, a series of normal fractures dipping towards the east can be appreciated in profiles 4, 5, 6 and 7, which are found on the western boundary of the basin. Profiles measured with an orientation subparallel to these fractures (profiles 1 and 3) are able to detect another group of fault-lines without any vertical displacement, which could correspond to those that appear on the map in a NE-SW direction.
It can be seen how the San Ignacio vein is lost at the normal fault-lines, which bound the western sector of the La Garza basin. The alignment of anomalies could indicate that it was displaced towards the East. On the other hand, the anomalies detected are aligned with directions N 25° E, similar to the San Ignacio vein. This structure would have suffered splits and branches. With this new information, a research campaign using direct mechanical drillings can be designed to confirm the existence of the newly identified mineralised veins.
5. Conclusions
Eight electrical geophysical profiles have been made in the study area. The profiles acquired parallel to the fractures in the basin, without lateral changes in facies, have stable resistivity and chargeability values. The profiles perpendicular to the fractures that bound the basin, with changes in facies (sediment-granite), are more unstable.
From the ERT results, the morphology of the basin in the study area shows significant variations in the thickness of the cover (between 10 and 40 m in sections very close to each other). The substratum of the basin is most likely the Palaeozoic bedrock, made up of granitoids, which are altered at the top and present a very uneven shape controlled by tectonics and weathering. The filling is probably made up mainly of lutite facies with episodes of sands and conglomerates, and it is characterized by very low resistivity levels.
A series of fault-lines controlling the structure of the basin (and affecting the network of veins hosted in the Palaeozoic bedrock) were detected by the resistivity profiles. Given their small size and the spacing between the electrodes used, the presence of the veins is not apparent with the resistivity profiles. This is not the case with the chargeability profiles, where several anomalies have been detected (eleven with high value and four of low value). These anomalies of chargeability tend to have sub-vertical forms, this being consistent with vein structures, and allow for deducing the location of four galena veins with a strike NE-SW.
By correlating the ERT and IP models, it can be deduced that the normal fault-lines, which bound the western sector of the La Garza basin, moved the San Ignacio vein toward the East. This vein probably becomes smaller and its path becomes discontinuous. Other small associated veins could also be identified.
The correlation between the information from the field geology, the ERT and IP profiles carried out in the La Garza sedimentary basin, define the presence of possible veins of galena in the bedrock underlying the sedimentary basin. Despite the uncertainty inherent to indirect research methods, the results obtained using ERT and IP simultaneously are much more reliable than those provided by the old resistivity methods. The new information obtained allows for further research campaigns with optimised mechanical drillings that may confirm the existence of mineralised veins embedded in the Palaeozoic materials underlying a sedimentary cover.
Author Contributions
The fieldwork for ERT and IP and the processing of the information were carried out by J.M., J.R., S.S.; M.C.H. and R.M. participated in the interpretation of the results and the writing of the manuscript.
Funding
This work was supported by the Spanish Ministry of Economy and Competitiveness (Project CGL2013-45485-R, co-financed FEDER) and the Government of Andalusia (Project RNM 05959).
Acknowledgments
Technical services of the University of Jaén and Higher Polytechnic School of Linares.
Conflicts of Interest
The authors declare no conflict of interest.
References
- Available online: http://info.igme.es/cartografiadigital/geologica/Magna50Hoja.aspx?language=es&id=905 (accessed on 12 July 2018).
- Lillo, J. Geology and Geochemistry of Linares-La Carolina Pb-Ore Field (Southeastern Border of the Hesperian Massif). Ph.D. Thesis, University of Leeds, Leeds, UK, 1992. [Google Scholar]
- Available online: http://minaslinares.com/es/menu-publicacion-minas-de-linares (accessed on 15 June 2018).
- Moreira, C.A.; Rezende Borges, M.; Lira Vieira, G.M.; Malagutti Filho, W.; Fernándes Montanheiro, M.A. Geological and geophysical data integration for delimitation of mineralized areas in a supergene manganese deposits. Geofis. Inter. 2012, 52, 199–210. [Google Scholar]
- Bery, A.; Saad, R.; Tonnizam, E.; Jinmin, M.; Azwin, I.N.; Tan, N.M.A.; Nordiana, M.M. Electrical Resistivity and Induced Polarization Data Correlation with Conductivity for Iron Ore Exploration. Electron. J. Geotech. Eng. 2012, 17, 3223–3337. [Google Scholar]
- Binley, A.; Kemna, A. DC Resistivity and Induced Polarization Methods. In Hydrogeophysics; Rubin, Y., Hubbard, S.S., Eds.; Springer: Berlin/Heidelberg, Germany, 2005. [Google Scholar]
- Deceuster, J.; Kaufmann, O. Improving the delineation of hydrocarbon impacted soils and water through induced polarization (IP) tomographies: A field study at an industrial waste land. J. Contam. Hydrol. 2012, 136–137, 25–42. [Google Scholar] [CrossRef] [PubMed]
- Martinez, J.; Rey, J.; Hidalgo, M.C.; Garrido, J.; Rojas, D. Influence of measurement conditions on resolution of electrical resistivity imaging: The example of abandoned mining dams in the La Carolina District (Southern Spain). Int. J. Miner. Process. 2014, 133, 67–72. [Google Scholar] [CrossRef]
- Telford, W.M.; Geldart, L.P.; Sheriff, R.E. Applied Geophysics; Cambridge University Press: Cambridge, UK, 1990. [Google Scholar]
- Mikhail, H.; Mekkawy, I. Magnetic susceptibility of Lead Sulphide. Czechoslov. J. Phys. B 1978, 2, 216–219. [Google Scholar] [CrossRef]
- Irawan, D.; Sumintadireja, P.; Saepuloh, A. 2-D subsurface Imaging Tecniques for Deep ore mineral mapping using geoelectrical and induced polarization (IP) methods. Proc. Earth Planet. Sci. 2013, 6, 139–144. [Google Scholar] [CrossRef] [Green Version]
- Martínez, J.; Montiel, V.; Rey, J.; Cañas, F.; Vera, P. Utilization of Integrated Geophysical Techniques to Delineate the Extraction of Mining Bench of Ornamental Rocks (Marble). Remote Sens. 2017, 9, 1322. [Google Scholar] [CrossRef] [Green Version]
- Zhadanov, M.S. Direct current and induced polarization methods. In Foundations of Geophysical Electromagnetic, Theory and Methods; Elsevier: Amsterdam, The Netherlands, 2018; pp. 439–493. [Google Scholar]
- Suzuki, K.; Toda, S.; Kusunoki, K.; Fujimitsu, Y.; Mogi, T.; Jomori, A. Case studies of electrical and electromagnetic methods applied to mapping active faults beneath the thick quaternary. Eng. Geol. 2000, 56, 29–45. [Google Scholar] [CrossRef]
- Maillet, G.M.; Rizzo, E.; Revil, A.; Vella, C. High resolution electrical resistivity tomography (ERT) in a transition zone environment: Application for detailed internal architecture and infilling processes study of a Rhône River paleo-channel. Mar. Geophys. Res. 2005, 26, 317–328. [Google Scholar] [CrossRef]
- Sumanovac, F. Mapping of thin sandy aquifers by using high resolution reflection seismics and 2-D electrical tomography. J. Appl. Geophys. 2006, 59, 345–346. [Google Scholar] [CrossRef]
- Martínez, J.; Benavente, J.; García-Aróstegui, J.L.; Hidalgo, M.C.; Rey, J. Contribution of electrical resistivity tomography to the study of detrital aquifers affected by seawater intrusión-extrusion effects: The river Vélez delta (Vélez-Málaga, southern Spain). Eng. Geol. 2009, 108, 161–168. [Google Scholar] [CrossRef]
- Martínez, J.; Rey, J.; Hidalgo, C.; Benavente, J. Characterizing abandoned mining dams by geophysical (ERI) and geochemical methods: The Linares-La Carolina District (southern Spain). Water Air Soil Pollut. 2012, 223, 2955–2968. [Google Scholar] [CrossRef]
- Rey, J.; Martínez, J.; Hidalgo, C.; Rojas, D. Heavy metal pollution in the Quaternary Garza basin: A multidisciplinary study of the environmental risks posed by mining (Linares, southern Spain). Catena 2013, 110, 234–242. [Google Scholar] [CrossRef]
- Rey, J.; Martínez, J.; Mediavilla, R.; Santisteban, J.I.; Castaño, S.; de la Losa, A. Geophysical characterization of stratigraphical surfaces: Basin floor and sedimentological architectural elements of Las Tablas de Daimiel (Quaternary of southern-central Spain. J. Appl.Geophys. 2017, 136, 387–399. [Google Scholar] [CrossRef]
- Sodeifi, A.H.; Hafini, M.K. The application of Induced polarization polymetal mines. Explor. J. Earth 2011, 6, 81–97. [Google Scholar]
- Arifin, M.H.; Kayode, J.S.; Izwan, M.K.; Hasan Said, H.A.; Hussin, H. Data for the potential gold mineralization mapping with the applications of Electrical Resistivity Imaging and Induces Polarization geophysical surveys. Data Brief 2019, 22, 830–835. [Google Scholar] [CrossRef]
- Martínez-Moreno, F.J.; Pedrera, A.; Ruano, P.; Galindo-Zaldivar, J.; Martos-Rosillo, L.; González-Castillo, L.; Sánchez-Úbeda, J.P.; Martín-Lechado, C. Combined microgravity, electrical resistivity tomography and induced polarization to detect deeply buried caves: Algaidilla cave (Southern Spain). Eng. Geol. 2013, 162, 67–78. [Google Scholar] [CrossRef]
- Martínez-Moreno, F.J.; Delgado-Ramos, F.; Galindo-Zaldivar, J.; Martin-Rosales, W.; López-Chicano, M.; González-Castillo, L. Identification of leakage and potential areas for internal erosion combining ERT and IP techniques at the Negratin Dam left abutment (Granada, Southern Spain). Eng. Geol. 2018, 240, 74–80. [Google Scholar] [CrossRef]
- Marescot, L.; Monnet, R.; Chapellier, D. Resistivity and induced polarization surveys for slope instability studies in the Swiss Alps. Eng. Geol. 2008, 98, 18–28. [Google Scholar] [CrossRef]
- Azcárate, J.E.; Argüelles, A. Evolución Tectónica y Estructuras Filonianas en el Distrito Minero de Linares. Congr.; Hispano-Luso-Americano de Geol. Econo: Madrid, Spain, 1971; pp. 17–32. [Google Scholar]
- Available online: http://info.igme.es/cartografiadigital/geologica/Sintesis200Hoja.aspx?Id=70&language=es (accessed on 12 July 2018).
- Perconing, E. Sobre la edad de la Transgresión del Terciario marino en el borde meridional de la Meseta; Congr. Hispano-Luso-Americano de Geol. Econo.: Madrid, Spain, 1971; pp. 309–319. [Google Scholar]
- Hidalgo, M.C.; Rey, J.; Cruz San Julián, J. Caracterización físico-química de los recursos hídricos de la comarca de Linares (Jaén). IV Simposio del Agua de Andalucía; Instituto Tecnológico Geominero de España: Madrid, Spain, 1996; pp. 89–98. [Google Scholar]
- Orellana, E. Prospección Geoeléctrica en Corriente Continua; Madrid Paraninfo: Madrid, Spain, 1982. [Google Scholar]
- Store, H.; Storz, W.; Jacobs, F. Electrical resistivity tomography to investigate geological structures of earth’s upper crust. Geophys. Prospect. 2000, 48, 455–471. [Google Scholar] [CrossRef]
- Sasaki, Y. Resolution of resistivity tomography inferred from numerical simulation. Geophys. Prospect. 1992, 40, 453–464. [Google Scholar] [CrossRef]
- Loke, M.H.; Dahlin, T. A comparison of the Gauss-Newton and quasi-Newton methods in resistivity imaging inversion. J. Appl. Geophys. 2002, 49, 149–162. [Google Scholar] [CrossRef] [Green Version]
- Griffiths, D.H.; Barker, R.D. Two-dimensional resistivity imaging and modelling in areas of complex geology. J. Appl. Geophys. 1993, 29, 211–226. [Google Scholar] [CrossRef]
- Loke, M.H.; Barker, R.D. Rapid least-squares inversion of apparent resistivity pseudosections by a quasi-Newton method. Geophys. Prospect. 1996, 44, 131–152. [Google Scholar] [CrossRef]
Figure 1.
(a) Location of the study region and (b) geological map of La Garza basin, modified from Reference [4]. (c) Location of electrical resistivity tomography (ERT) and induced polarization (IP) profiles (P1, P2, P3, P4, P5, P6, P7, and P8).
Figure 1.
(a) Location of the study region and (b) geological map of La Garza basin, modified from Reference [4]. (c) Location of electrical resistivity tomography (ERT) and induced polarization (IP) profiles (P1, P2, P3, P4, P5, P6, P7, and P8).

Figure 2.
(a) Drilling a hole with an auger to place the non-polarising electrodes. (b) Electrode placed in the ground and connected to the electrical main cable. (c) Profile 1 field layout. (d) Data collection with the resistivity meter.
Figure 2.
(a) Drilling a hole with an auger to place the non-polarising electrodes. (b) Electrode placed in the ground and connected to the electrical main cable. (c) Profile 1 field layout. (d) Data collection with the resistivity meter.

Figure 3.
Interpretation of the electrical resistivity tomography and chargeability models. (A) Resistivity model for the profiles 1 and 2, (B) Chargeability model for the profiles 1 and 2, (C) Resistivity model for the profile 3, (D) Chargeability model for the profile 3, (E) Resistivity model for the profile 4, (F) Chargeability model for the profile 4, (G) Resistivity model for the profile 5, (H) Chargeability model for the profile 5, (I) Resistivity model for the profile 6, (J) Chargeability model for the profile 6. The position of each profile is shown in Figure 1c.

Figure 4.
Interpretation of the electrical resistivity tomography and chargeability models. (A) Resistivity model for the profile 7, (B) Chargeability model for the profile 7, (C) Resistivity model for the profile 8, (D) Chargeability model for the profile 8. The position of each profile is shown in Figure 1c.

Figure 5.
(a) Representation of the fractures and track of the veins deduced from the ERT and IP profiles, respectively. (b) Geological profile X-Y.
Figure 5.
(a) Representation of the fractures and track of the veins deduced from the ERT and IP profiles, respectively. (b) Geological profile X-Y.


Table 1.
Characteristics of the acquired ERT profiles. All profiles were composed by 64 non-polarising electrodes using a Wenner-Schlumberger array configuration.
Table 1.
Characteristics of the acquired ERT profiles. All profiles were composed by 64 non-polarising electrodes using a Wenner-Schlumberger array configuration.
| Profile | Origin Coordinates | End Coordinates | Total Length (m) | Direction | Electrode Spacing (m) | Measurements | Maximum Depth (m) |
|---|---|---|---|---|---|---|---|
| 1 | 445653 E 4223694 N | 445782 E 4223379 N | 315 | NW-SE | 5 | 910 | 49 |
| 2 | 445746 E 4223488 N | 445883 E 4223207 N | 315 | NW-SE | 5 | 920 | 49 |
| 3 | 445811 E 4223742 N | 445918 E 4223207 N | 315 | NW-SE | 5 | 924 | 49 |
| 4 | 445914 E 4223574 N | 445605 E 4223428 N | 315 | NE-SW | 5 | 893 | 49 |
| 5 | 445626 E 4223575 N | 445922 E 4223504 N | 315 | NE-SW | 5 | 913 | 49 |
| 6 | 445656 E 4223687 N | 445948 E 4223783 N | 315 | SW-NE | 5 | 892 | 49 |
| 7 | 446120 E 4223855 N | 445807 E 4223730 N | 315 | NE-SW | 5 | 892 | 49 |
| 8 | 445626 E 4223575 N | 446046 E 4223732 N | 441 | SW-NE | 7 | 824 | 81 |
© 2019 by the authors. Licensee MDPI, Basel, Switzerland. This article is an open access article distributed under the terms and conditions of the Creative Commons Attribution (CC BY) license (http://creativecommons.org/licenses/by/4.0/).
Share and Cite
MDPI and ACS Style
Martínez, J.; Rey, J.; Sandoval, S.; Hidalgo, M.C.; Mendoza, R. Geophysical Prospecting Using ERT and IP Techniques to Locate Galena Veins. Remote Sens. 2019, 11, 2923. https://0-doi-org.brum.beds.ac.uk/10.3390/rs11242923
AMA Style
Martínez J, Rey J, Sandoval S, Hidalgo MC, Mendoza R. Geophysical Prospecting Using ERT and IP Techniques to Locate Galena Veins. Remote Sensing. 2019; 11(24):2923. https://0-doi-org.brum.beds.ac.uk/10.3390/rs11242923
Chicago/Turabian StyleMartínez, Julián, Javier Rey, Senén Sandoval, Mª Camen Hidalgo, and Rosendo Mendoza. 2019. "Geophysical Prospecting Using ERT and IP Techniques to Locate Galena Veins" Remote Sensing 11, no. 24: 2923. https://0-doi-org.brum.beds.ac.uk/10.3390/rs11242923
Note that from the first issue of 2016, this journal uses article numbers instead of page numbers. See further details here.