Article

Optical and Geometrical Properties of Cirrus Clouds over the Tibetan Plateau Measured by LiDAR and Radiosonde Sounding during the Summertime in 2014

1
Ocean Remote Sensing Institute, Ocean University of China, Qingdao 266100, China
2
Laboratory for Regional Oceanography and Numerical Modeling, Qingdao National Laboratory for Marine Science and Technology, Qingdao 266237, China
3
Laboratory of Severe Weather, Chinese Academy of Meteorological Science, Beijing 100081, China
*
Authors to whom correspondence should be addressed.
Submission received: 27 December 2018 / Revised: 31 January 2019 / Accepted: 31 January 2019 / Published: 2 February 2019
(This article belongs to the Special Issue Remote Sensing of Clouds)

Abstract

:
Optical and geometrical characteristics of the cirrus clouds over Naqu (4508 m a.s.l., 31.48° N, 92.06° E), in the Tibetan Plateau were determined from LiDAR and radiosonde measurements performed during the third TIbetan Plateau EXperiment of atmospheric sciences (TIPEX III) campaign from July to August 2014. For the analysis of the temperature dependence, the simultaneous observations with LiDAR and radiosonde were conducted. Cirrus clouds were generally observed ranging from 5.2 km to 12 km above ground level (AGL) (i.e., 9.7 km to 16.5 km a.s.l.), with the midcloud temperatures ranging from −79.7 to −26.0 °C. The cloud thickness generally differed from 0.12 to 2.55 km with a mean thickness of 1.22 ± 0.70 km, and 85.7% of the measurement cases had thickness smaller than 1.5 km. The retrievals of linear particle depolarization ratio, extinction coefficient, and optical depth of cirrus clouds were provided. Moreover, the multiple scattering effect inside of cirrus clouds was corrected. The linear particle depolarization ratio of the cirrus clouds varied from 0.36 to 0.52, with a mean value of 0.44 ± 0.04. The optical depth of the cirrus clouds was between 0.01 and 3 following the scheme of Fernald-Klett method. Sub-visual, thin, and opaque cirrus clouds were observed at 4.76%, 61.90% and 33.34% of the measured cases, respectively. The temperature and thickness dependencies of the optical properties were studied in detail. A maximum cirrus thickness of around 2 km was found at temperatures between −60 and −50 °C. This study shows that the mean extinction coefficient of the cirrus clouds increases with the increase of temperature. Conversely, the measurements indicate that the linear particle depolarization ratio decreases with the increasing temperature. The relationships between the existence of cirrus clouds and the temperature anomaly (temperature difference from the mean value of the temperature during July and August 2014 over Naqu) and deep convective activity are also discussed. The formation of cirrus clouds is investigated and also its apparent relationship with the South Asia High Pressure, the dynamic processes of Rossby wave, and deep convective activity over the Tibetan Plateau. The outgoing longwave radiation of cirrus clouds is calculated with the Fu-Liou model and is shown to increases monotonously with the increase of optical depth.

Graphical Abstract

1. Introduction

Cirrus clouds play a significant role in the energy budget and the hydrological cycle of the Earth’s atmosphere system [1]. Several studies show that cirrus cover on average 30% of the Earth’s surface [2]. The classification of cirrus clouds has been defined on the basis of visible observations from the surface. Cirrus clouds are made predominantly or wholly of ice [3]. Only rarely do they contain supercooled liquid cloud droplets at their lower altitudes [4]. Cirrus affects the climate of the whole Earth via two opposite effects; an infrared greenhouse effect and a solar albedo effect [5]. The contribution of each effect depends strongly on cirrus optical properties [6]. Thin cirrus clouds usually cause a positive radiative effect at the top of the atmosphere, while thick cirrus clouds (e.g., opaque cirrus) may produce a cooling effect [7,8,9]. From the reports of the IPCC, significant uncertainties remain regarding the radiative and climate effect of cirrus clouds and cirrus clouds continue to contribute large uncertainty to estimates and interpretations of the Earth’s changing energy budget [10]. Because of the essential role that the cirrus clouds play, a clear understanding of their optical and geometrical properties is highly essential for climate modeling studies. Moreover, they are critical to understanding feedback processes that regulate or modulate the climate response to forcing.
As one of the best techniques for remotely studying the characteristics and properties of cirrus clouds, LiDAR will contribute much to solve the uncertainties of cirrus. Polarization and Raman LiDARs have been employed to detect geometrical and optical properties of cirrus clouds by applying the methods that have been earlier demonstrated by previous works [11,12,13]. Several key optical parameters such as the extinction coefficient, LiDAR ratio and depolarization ratio as well as the mid-altitude and the corresponding midcloud temperature of cirrus clouds were measured [14]. The depolarization ratios are considered to be of special importance since they are related to microphysics properties of the ice crystals contained on cirrus clouds, while the optical depth, mid-altitude, and mid-temperature play an important role in determining cloud radiative properties.
The optical depth of clouds is a key parameter in radiative transfer computations and therefore considerable effort has been put in its retrieval. The evaluation of the optical depth of cirrus clouds has been accomplished through the application of different methods which have been described in the literature [5,11,13,15,16]. Most of these methods depend on the solution of the standard LiDAR equation [11,15,16]. A different technique called “transmittance method” to determine the optical depth of cirrus clouds from elastic LiDAR signal has also been developed. It is based on the comparison of the backscattering signals below and above the cloud assuming that the LiDAR signals correctly represented the scattering medium [5,13,15].
Hence, a clear understanding of the optical properties such as the extinction coefficient, the optical depth, and the depolarization ratio of cirrus is of high priority, especially over the high-altitude area and polar regions. The Tibetan Plateau is a vast elevated plateau in the middle of the Eurasian continent with averaged elevation 4.5 km a.s.l., and it has an important role in the global and regional climate system [17]. The Tibetan Plateau lies at a critical and sensitive junction of four climatic systems: the Westerlies, the East Asian monsoon, the Siberian cold polar airflow and the Indian monsoon [18]. Especially given the elevated heat source in summer, the low pressure over the Tibetan Plateau induces a supply of moist, warm air from the Indian Ocean to the continent significantly affecting the general circulation and the Asian Summer monsoon circulation [18,19]. Considering the significant thermal effect of the Tibetan Plateau, the statistics of the cirrus clouds over the Tibetan Plateau is crucial. However, the high altitude, lack of oxygen, and extreme climate conditions make it difficult to perform long-term atmosphere research by ground-based LiDAR. We developed a high-power polarization Raman LiDAR and deployed it, for the first time to our knowledge, to the Tibetan Plateau to obtain the optical properties of cirrus in the Tibetan Plateau during July and August 2014.
In this paper, we briefly describe the LiDAR system, including the transmitter, receiver, and data acquisition. The third TIbetan Plateau EXperiment of atmospheric sciences (TIPEX III) is introduced as well. Furthermore, the methodologies of the determination of the linear particle depolarization ratio, extinction coefficient, optical depth, cloud base/top height and outgoing longwave radiation (OLR) are presented. The correction of multiple scattering inside of cirrus clouds is interpreted. One measurement case of the cirrus clouds optical and geometrical properties observed in Naqu during the TIPEX III are provided. Additionally, combining with the temperature profiles obtained from simultaneous observations with radiosonde, the temperature dependences of such properties are investigated. Finally, the longwave fluxes and formation of cirrus clouds are discussed briefly.

2. Instruments and Campaign

2.1. Water Vapor, Cloud and Aerosol LiDAR (WACAL)

A three-wavelength combined elastic-backscatter Raman LiDAR, Water vapor, cloud and aerosol LiDAR (WACAL) is employed to perform continuous observations of suspended aerosol particles and cirrus clouds. The system is based on the second and third harmonic frequency of a compact, pulsed Nd:YAG laser, which emits pulses of 400, 120 and 710 mJ output energy at wavelengths of 355, 532, and 1064 nm, respectively, at a 30 Hz repetition rate. The optical receiver consists of four 308 mm diameter Newtonian telescopes. The telescope array helps to better collect the signal from both near field and far field. It also takes the collection efficiency of the strong elastic-backscatter light and the weak Raman backscatter light into account. This design also makes the system convenient to be transported and suitable for field experiments. Five Hamamatsu 10721P-110 photomultipliers and one Hamamatsu G8931-20 APD are used to detect the LiDAR signals at the wavelengths of 355, 387, 407, 532 (parallel-polarized), 532 (cross-polarized) and 1064 nm. The acquisition system employs a six-channels LICEL transient recorder including analog and photon counting modes. The vertical resolution of the signal is equal to 3.75 m and the temporal resolution is 16 s. Several data pre-processing methods are applied to the raw LiDAR return signal before retrieving the optical properties. The WACAL was built successfully in 2013 by the LiDAR group at Ocean University of China. The details of WACAL were described by Wu et al. (2015) in a separate paper [20].

2.2. Radiosonde Sounding

The electronic radiosondes of GTS1 type (Nanjing Bridge Machinery Co., Ltd., China) [21] are used in our research to provide vertical profiles of temperature, pressure, and relative humidity. The radiosondes can provide temperature with accuracy of ±0.2 °C, relative humidity with an absolute uncertainty of ±5% and pressure with accuracy of ±1 hPa. The radiosondes were launched regularly at 00:00 UTC and 12:00 UTC during this campaign.

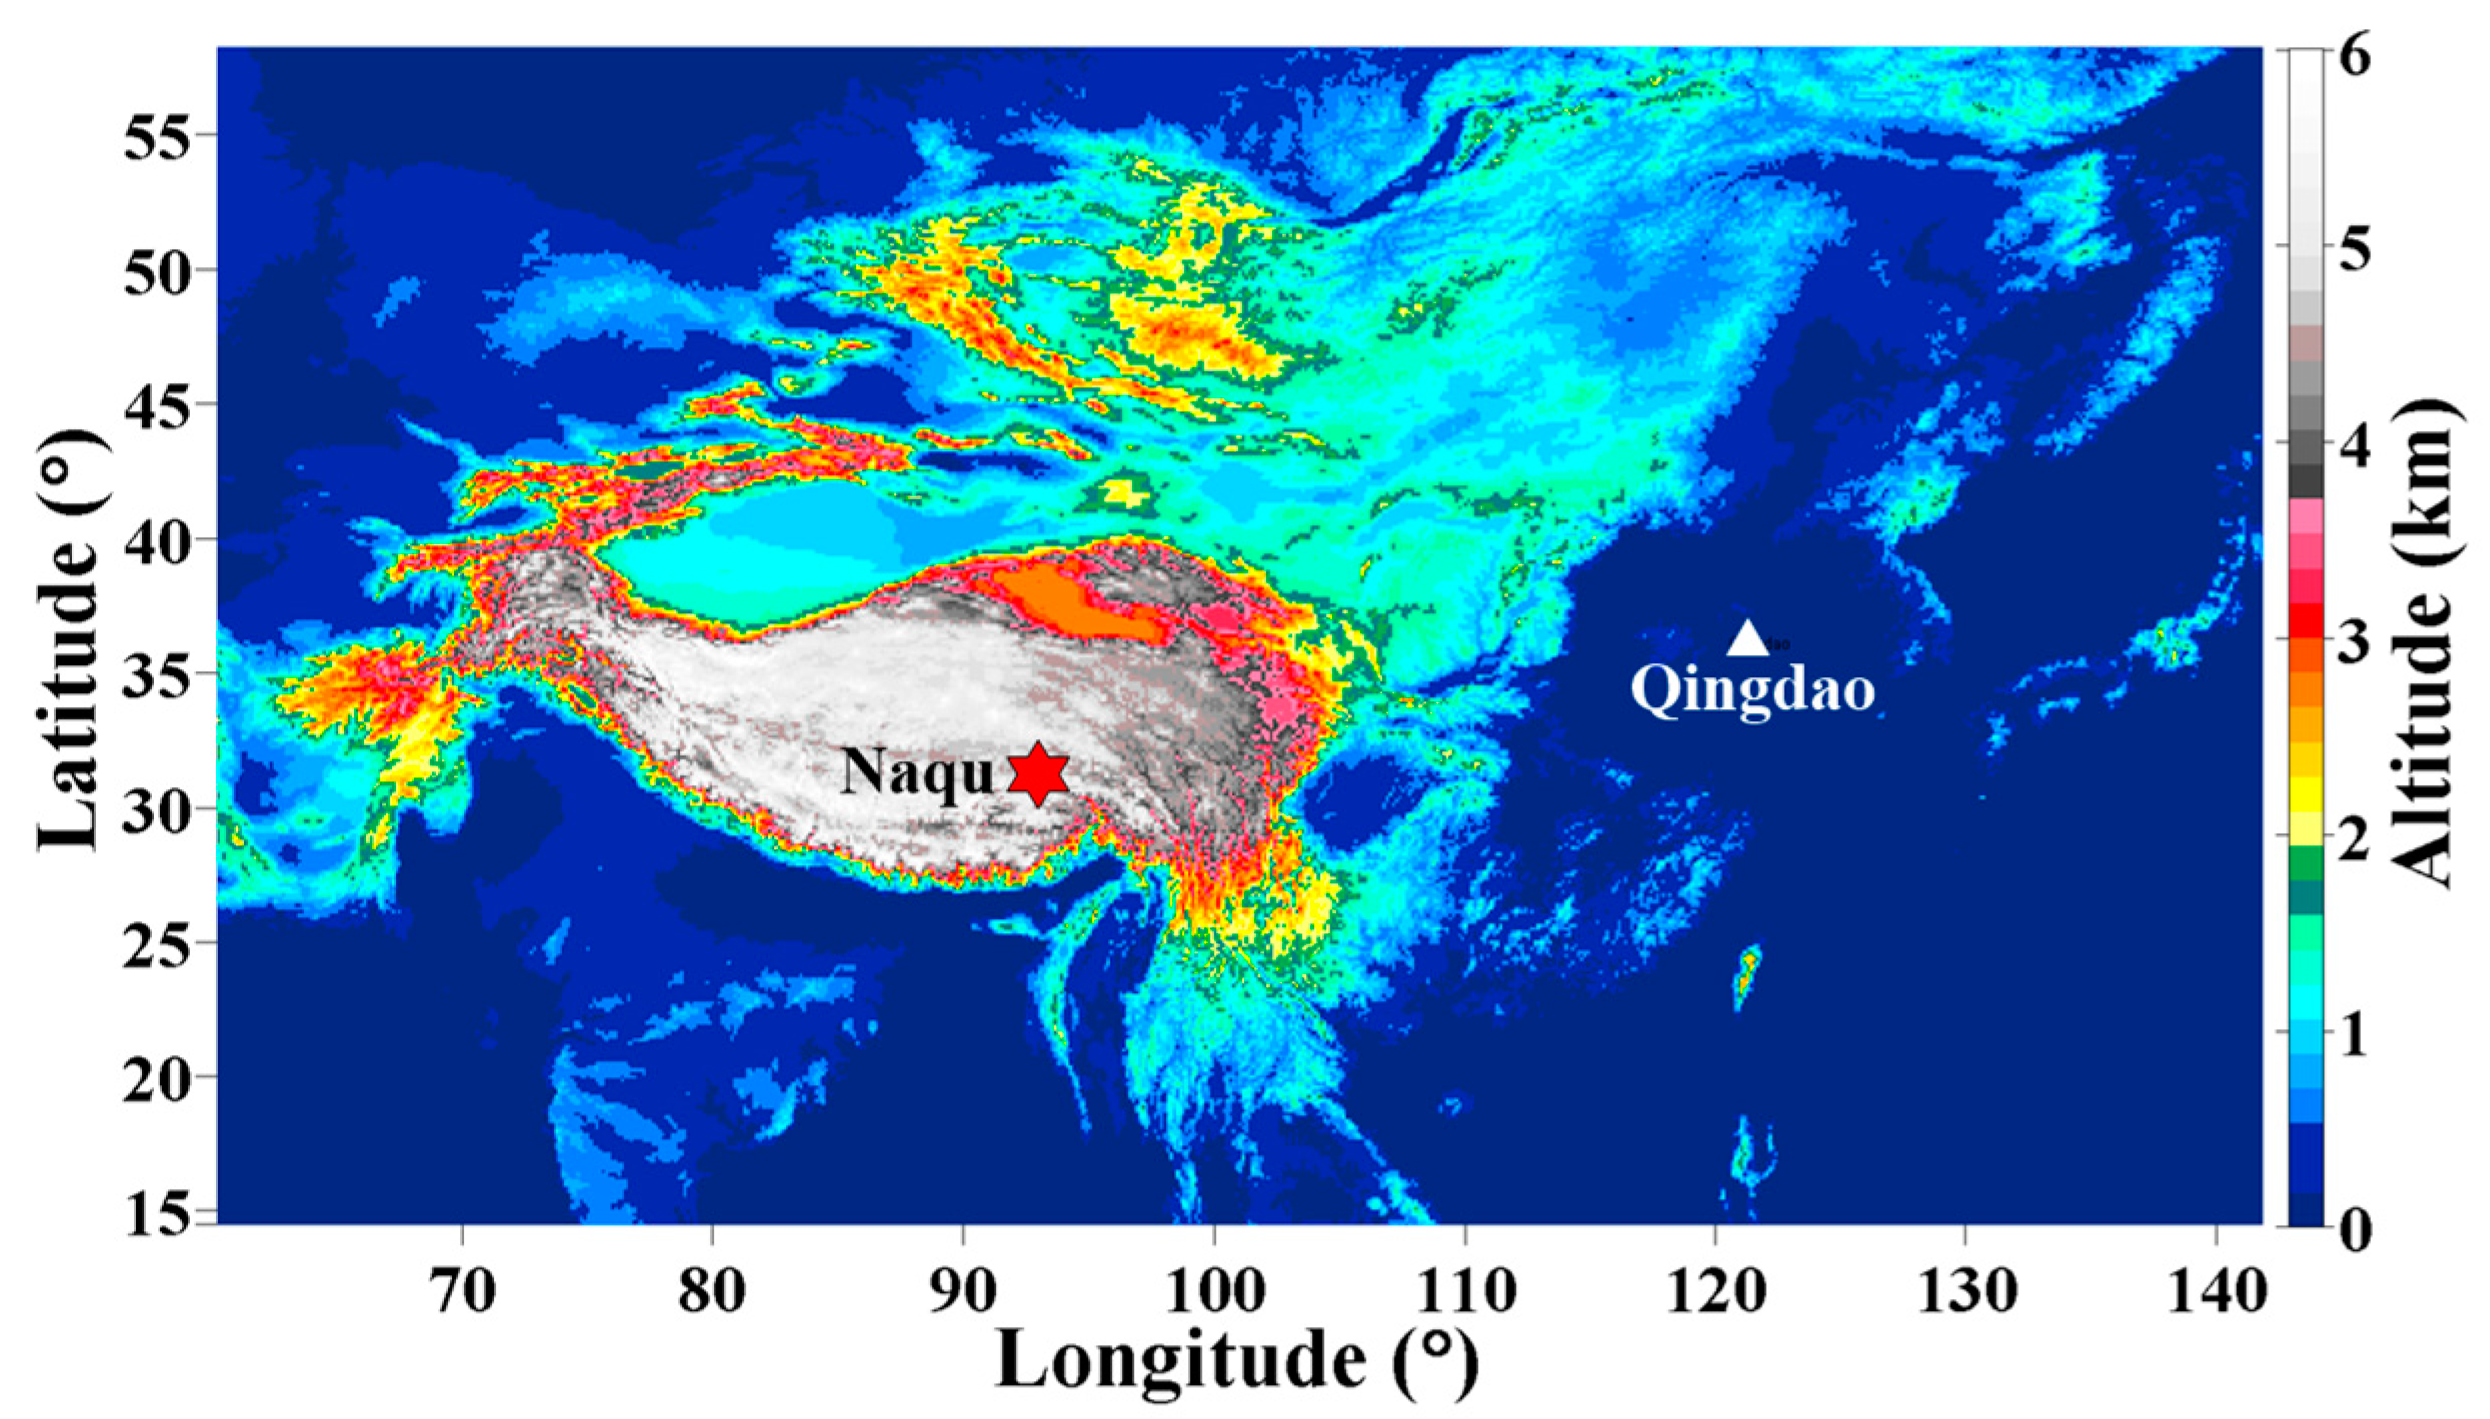
2.3. TIPEX III Campaign

The TIPEX III campaign was conducted by a collaboration between Ocean University of China and Chinese Academy of Meteorology Science. This experiment was conducted during July and August 2014 in Naqu. As an important approach to collect the atmospheric information, the WACAL system was deployed at Naqu Bureau of Meteorology (31.48° N, 92.06° E) from 10 July to 16 August 2014. The measurement site is shown in the elevation map of Figure 1 (The elevation data were downloaded from http://www.temis.nl/data/gmted2010/). The red star denotes the LiDAR site during TIPEX III while the white triangle represents the city of Qingdao. With the help of the WACAL, the optical and geometrical properties of cirrus clouds including backscatter coefficient, linear particle depolarization ratio, cloud base height, and cloud top height can be obtained. To investigate the temperature dependences of the optical and geometrical properties of cirrus, simultaneous observations by WACAL and radiosonde are obtained. Referring to the results measured by the co-located ceilometer of VAISALA CL31, almost all the high clouds including cirrus occurred at nighttime and before dawn (the period between 18:00 UTC, i.e., 02:00 LT and 22:00 UTC, i.e., 06:00 LT) [22]. Such a temporal distribution (free of sunlight) of the cirrus clouds is conducive to the joint observations by the WACAL and radiosonde sounding. Consequently, only the concurrent measurements by WACAL and radiosonde at nighttime were taken into account.

3. Methodology

In this section, the methods for retrieving the optical properties of the cirrus clouds are presented.
The SNR of the signal is calculated from
S N R = P m ( z ) P n o i s e P b g P m ( z ) ,
where P m ( z ) is the measured signal at the height of z recorded by PMT, P n o i s e and P b g denote the noise of the PMT and the background of measured signal, respectively. In this study, the P n o i s e is determined by measuring the signal of the covered PMT (so called “zero signal recording”). The background signal P b g (e.g., daytime solar background) is obtained by averaging the raw signal at far ranges from 18.75 km to 20.55 km. For the quality assurance and quality control, only the signal of SNR > 10 is used for retrieval. It should be emphasized that in this study, since the altitude of the LiDAR measurement site is 4508 m a.s.l., the SNR of the extremely high-altitude cirrus clouds signal is still commendable.
In this study, to avoid a possible impact of liquid cloud, only clouds with the linear particle depolarization ratios larger than 0.35 and with the optical depth smaller than 3 are taken into account. Since the linear particle depolarization ratio values of the dust and volcanic ash layers lofted in high altitude are smaller than 0.35 [23], they can be filtered out with these thresholds above. Actually, during the TIPEX III campaign, the dust and volcanic ash at high altitude were not measured.
Another main aspect is the accurate determination of the cirrus cloud base and top height. The aspect is of major importance for the precise calculation of the optical and geometrical properties of cirrus clouds.

3.1. Calibration of the Linear Particle Depolarization Ratio and Error Analysis

WACAL provides the linear particle depolarization ratio at 532 nm. For the precise measurement of the linear particle depolarization ratio, an effective and accurate calibration method called “±45°-calibration” is used in this paper [24]. In this method, the influences of the gain ratio, offset angle of the receiver module and the properties of the polarizing beam splitter (PBS) are calibrated by using half wave plate. After the calibration, the linear particle depolarization ratio can be represented as a function of component variables including measured ratio m ( r ) , gain ratio G , offset angle φ , the reflectivities and the transmittances ( T P , T S , R P and R S . The subscripts “ P ” indicates the reflectivity and transmittance for the parallel-polarized light while the subscript “ S ” represents the reflectivity and transmittance for the cross-polarized light.) of PBS by
δ v ( r ) = m ( r ) T P G R P + ( m ( r ) T S G R S ) tan 2 φ G R S m ( r ) T S + ( G R P m ( r ) T P ) tan 2 φ   and
δ p ( r ) = ( 1 + δ m ) δ v ( r ) R ( 1 + δ v ( r ) ) δ m ( 1 + δ m ) R ( 1 + δ v ( r ) ) ,
with δ v is the volume depolarization ratio, δ p is the linear particle depolarization ratio, δ m is the depolarization ratio of molecule which is set as 0.0036 for 532 nm and R is the backscatter ratio. The backscatter ratio is defined as R = ( β mol + β aer ) / β mol , where β aer is the aerosol backscatter coefficient and β mol denotes the molecule backscatter coefficient.
In this study, the gain ratio of the perpendicular channel to the parallel channel G is determined from the measurements with half wave plate at angles of 0° and 45°. It is calculated by
G 2 = m 45 ° ( r )   m 0 ° ( r ) [ T P δ v ( r ) + T S + T P tan 2 φ ] T P [ R S δ v ( r ) + R P + R S tan 2 φ ] R S .
The error of the gain ratio is calculated by
( Δ G G | total ) 2 = ( Δ G G | systematic ) 2 + ( Δ G G | random ) 2 = F m G [ ( Δ m 0 ° m 0 ° ) 2 + ( Δ m 45 ° m 45 ° ) 2 ] + F φ G ( Δ φ φ ) 2 .
The propagation factor F x f ( x ) is a factor by which the relative error in f ( x ) is magnified with respect to the relative error in the component variables x . It is defined as
F x f ( x ) = ( x f ( x ) f ( x ) x ) 2 .
The relative uncertainty of the offset angle is around 5% and the error of the measured ratio is calculated via
( Δ m m ) 2 = ( Δ P T P T ) 2 + ( Δ P R P R ) 2 = 1 S N R P T 2 + 1 S N R P R 2 .
The total error of the volume depolarization ratio is determined with
( Δ δ v δ v | total ) 2 = ( Δ δ v δ v | systematic ) 2 + ( Δ δ v δ v | random ) 2 ( Δ δ v δ v | systematic ) 2 = F G δ v ( Δ G G ) 2 + F φ δ v ( Δ φ φ ) 2 ( Δ δ v δ v | random ) 2 = F m δ v ( Δ m m ) 2 .
Once the volume depolarization ratio was calibrated, the particle depolarization ratio can be determined via Equation (3). The error of the particle depolarization ratio can be calculated by
( Δ δ p ( r ) δ p ( r ) ) 2 = F R δ p ( Δ R ( r ) R ( r ) ) 2 + F δ v δ p ( Δ δ v ( r ) δ v ( r ) ) 2 .
The propagation factors F R δ p and F δ v δ p are determined by Equation (6).
The detailed error analysis of volume and linear particle depolarization ratio was described in a separate paper [25].

3.2. Determination of the Extinction Coefficient

Based on the elastic-backscatter signal at wavelength of 532 nm, the particle extinction coefficient α λ 0 p ( z 0 ) profile can be calculated by using Fernald method [11,26]. In this paper, the particle LiDAR ratio S λ 0 p ( z ) is determined by means of the updated method of Comstock and Sassen (2001) [27,28]. The S λ 0 p ( z ) of cirrus clouds over Naqu calculated by this method is 28.4 ± 5.2 sr.
The method for determination of the reference height z 0 is known as “Minimum value method”, which is also described in Wu et al. (2015) [20]. In this method, the vertical profile of P λ 0 ( z ) z 2 / β λ 0 m o l ( z ) is calculated and the minimum value is found at a certain height of z . This height can act as reference height z 0 . Once the reference height is fixed, the Fernald method is applied to determine the aerosol extinction coefficient α λ 0 p ( z ) . Beforehand, the particle extinction coefficient at reference height α λ 0 p ( z 0 ) is assigned an initial value. In this study, the initial value is 4 × 10⁻⁶ km−1. An iteration process is used to determine the final α λ 0 p ( z 0 ) . From the derived extinction coefficient result, the mean value α λ 0 , m e a p ( z 0 ) is computed. In each iteration step, the input value of α λ 0 p ( z 0 ) is increased by 10% than last value until the relative difference between α λ 0 p ( z 0 ) and α λ 0 , m e a p ( z 0 ) is less than 5% [29].

3.3. Multiple Scattering Correction

The multiple scattering (MS) returns of elastic signal from cirrus clouds should be considered. The amount of the MS returns relies on the forward diffraction peak in the phase function [28]. The MS factor is the function of laser penetration, cloud range, FOV and mean effective radius for ice particles [5,30,31,32]. However, there is no obvious dependence of the forward diffraction peak on ice crystal shape, which was reported by Macke et al. (1996) [33]. In this study, to accurately correct the MS influence, we perform a full treatment of multiple scattering following the model of Hogan et al. (2006) [34]. The model is also introduced and applied by Seifert et al. (2007) [35], Kienast-Sjögren et al. (2016) [36] and Gouveia et al. (2017) [37]. In this model, the typically operated FOV of 1.3 mrad and the full divergence angle of 0.5 mrad in WACAL are used. Moreover, the particle size of cirrus clouds which is modeled according to the method in Krämer et al. (2016) [38] is applied into the MS model to correct the effect in cirrus clouds as well.

3.4. Extraction of the Cloud Base and Top Heights
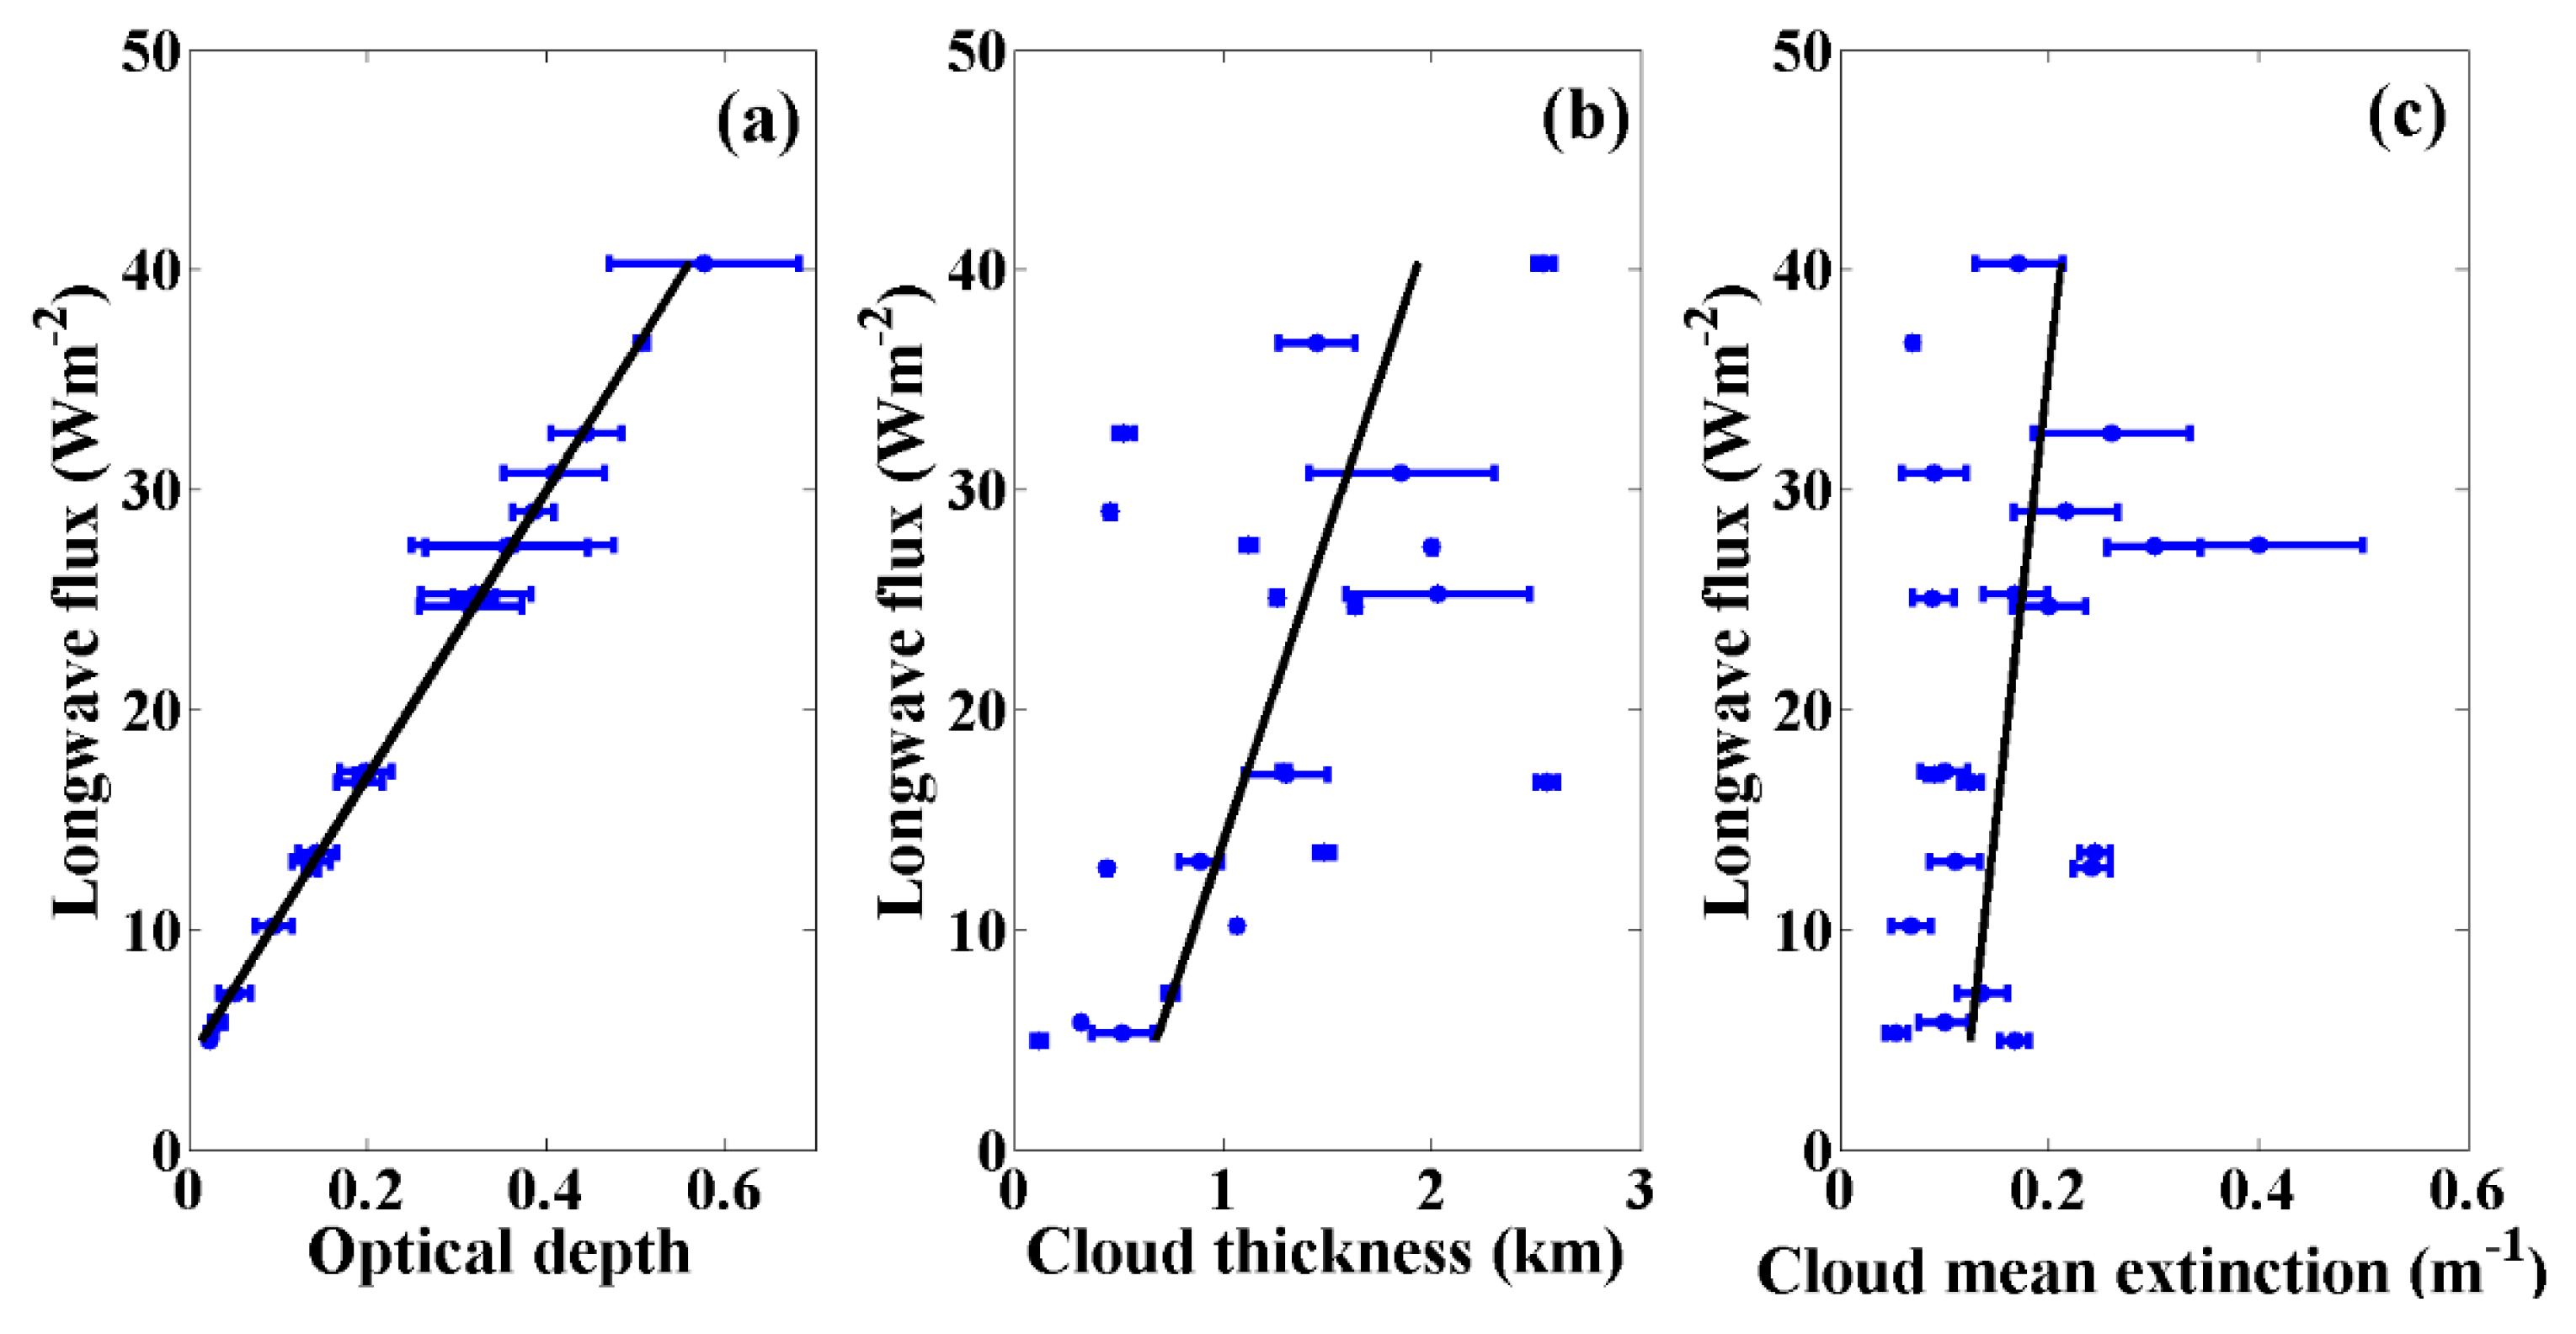
To determine the cloud base and top heights, an algorithm that combines “differential zero-crossing algorithm” [39] and “threshold algorithm” [40] is used when the clouds can be penetrated by laser. In most of cases, cloud heights can be defined directly from these zero crossings of the first derivative of backscatter intensity d P ( z ) / d z . However, to exclude interference of spurious zero crossings, the d P ( z ) / d z is calculated via least-squares fit by using a multipoint window that slides through successive points from z 0 to the end of the LiDAR profile. Additionally, based on the noise in the recorded LiDAR signal, a series of range-dependent thresholds are defined. Only the signal excursion above the corresponding threshold value is identified as a cloud. By this algorithm, cloud layers apparent in the return signal are identified. However, if the lower clouds were too thick to be penetrated, the higher clouds cannot be identified [20,22]. During this campaign, the cloud base heights determined with WACAL and that with the co-located VAISALA CL31 ceilometer were compared and the results were reported by Song et al. (2017) [22]. A good agreement is found. In this study, to ensure that the LiDAR can detect the cloud top, the LiDAR signal above the cirrus is checked. When the signal still tends to be attenuated, the cirrus top is ensured. Moreover, since the LiDAR is restricted when the optical depth is bigger than 3, only cirrus clouds with the whole path optical depth smaller than 3 are taken into account.

3.5. Cirrus OLR

Cirrus OLR is a parameter that has been used extensively to study cloud-radiation interactions. The Fu-Liou radiative transfer model is used here to estimate OLR. The model is available freely online (https://www-cave.larc.nasa.gov/cgi-bin/fuliou/runfl.cgi). It is a delta-four steam radiative transfer scheme with 15 spectral bands from 0.175 to 4.0 μ m in shortwave (SW) and 12 longwave (LW) spectral bands between 2850 and 0 c m 1 . The corrected k-distribution method is used to parameterize the non-gray gaseous absorption by H 2 O , C O 2 , O 3 , N 2 O , and C H 4 [8]. The Fu-Liou model inputs here are visible optical depth, phase, cloud top and base pressure, and particle size. The optical depth can be obtained from above cirrus optical properties retrieval. Cloud phase is an input as either WATER or ICE phase, which affects the input of cloud particle size. Here the cirrus clouds are chosen as ICE phase. The cloud top and base pressures can be obtained from radiosonde data.

4. Discussion

During the TIPEX III, 21 measurement cases of cirrus clouds were measured, with 17 of them observed at nighttime while the rest detected before dawn. In this section, the optical and geometrical properties of these cirrus clouds are presented. With the temperatures measured by radiosondes that are launched at Naqu meteorological bureau twice per day, at 0000 UTC and 1200 UTC (LST – 8 h), the temperature dependence of optical and geometrical properties is investigated and discussed. Furthermore, the relationship of the appearance of cirrus clouds and the temperature anomaly, as well as the cirrus OLR are investigated.
According to the measurement results from CL31 and WACAL in Song et al. (2017), the diurnal variations of CBH distribution proportion and CBH frequency have a similar variation trend with a distinct “U” shape in the time dimension, which analyze the cloud structure variation at spatial and temporal aspects, respectively [22]. Therefore, almost all the high clouds including cirrus occurred at nighttime (mainly the period between 18:00 UTC (02:00 LT) and 22:00 UTC (06:00 LT)). In our study, for the analysis of the temperature dependence of cirrus optical and geometrical properties, the simultaneous observations with LiDAR and radiosonde were conducted. The time difference between cirrus observations with LiDAR and radiosonde is less than 2 h. Therefore, the frequency is a relative value. It should be noted that in our database, almost all the cirrus meets the requirement (time difference less than 2 h). Thus, the sampling has only a tiny impact on the results.

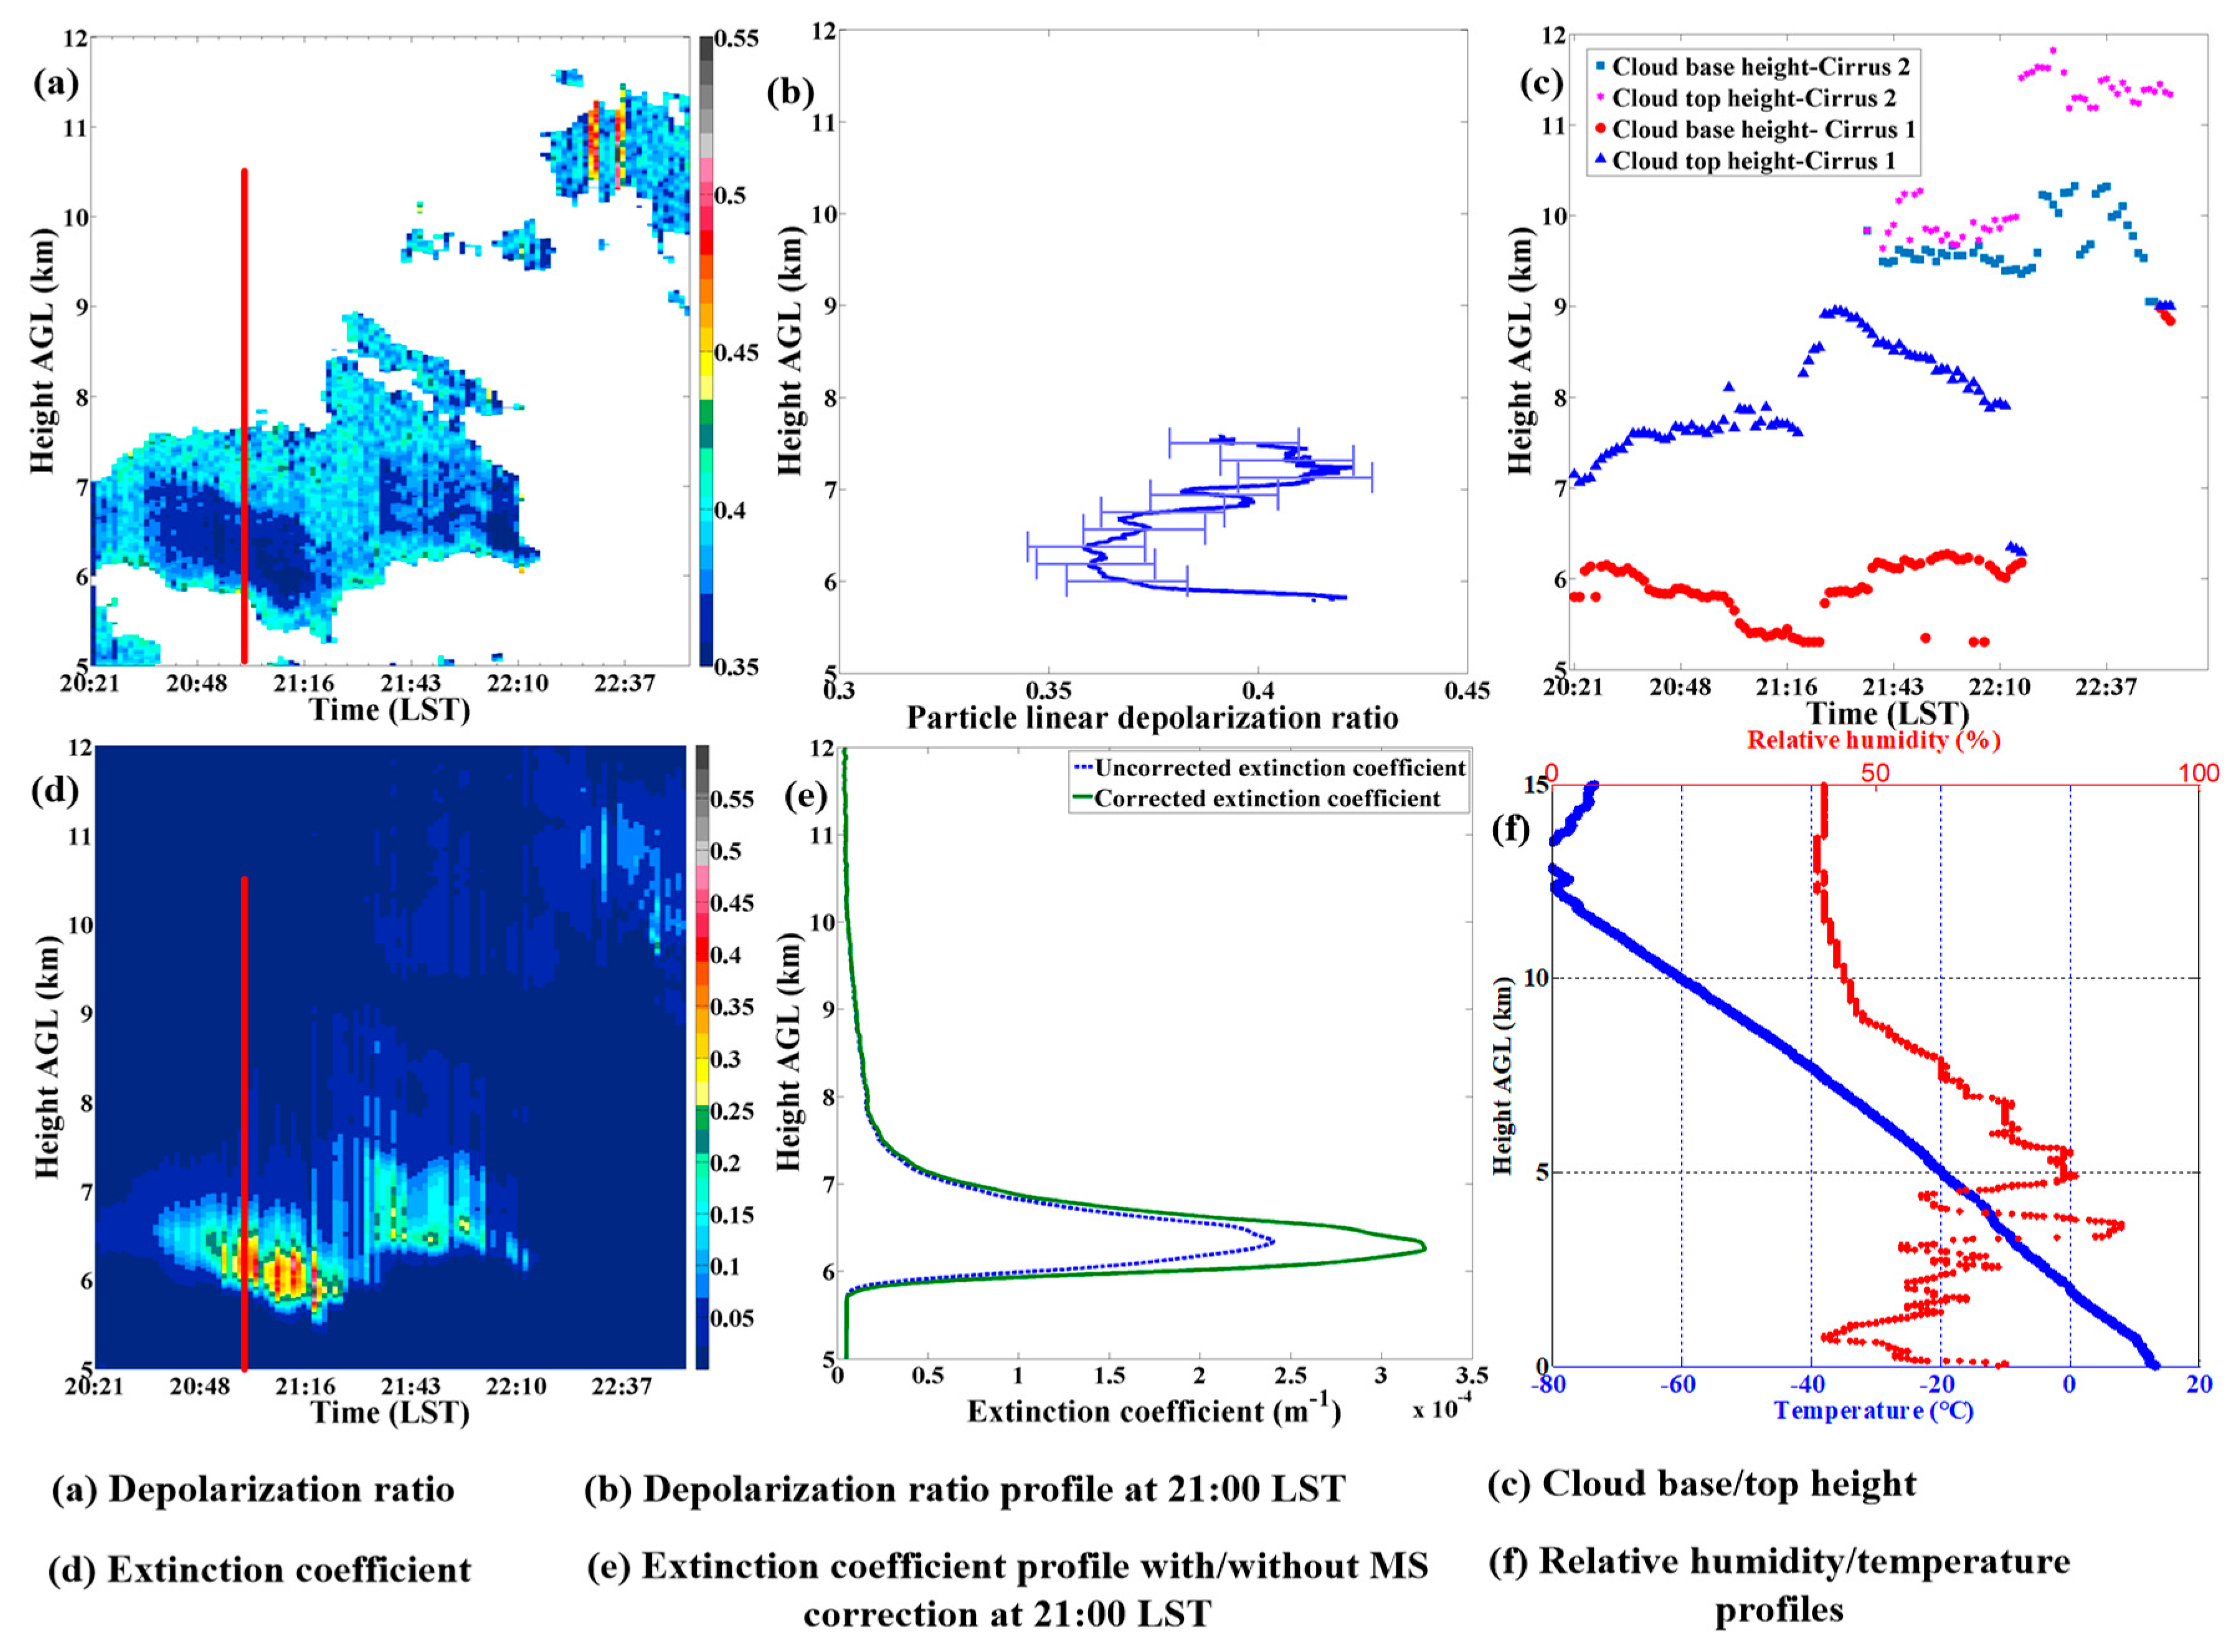
4.1. Measument Case and Short Summary

For detailed study of the optical and geometrical properties of cirrus clouds, we present one measurement case on 4 August 2014 in Figure 2. During this measurement period, two cirrus clouds layers were observed.
According to Figure 2a,c, the developments of linear particle depolarization ratio and extinction coefficient inside of the cirrus clouds are expressed in detail with a temporal resolution of 80 s. For instance, one depolarization ratio profile and one extinction coefficient measured at 21:00 LST are presented in Figure 2b,d. It should be emphasized that only the depolarization ratios inside of cirrus clouds are plotted and the extinction coefficients are shown with and without MS correction. Due to the inherent inhomogeneity inside of the cirrus clouds, the linear particle depolarization ratio and extinction coefficient vary as the cirrus evolves and ice crystal habit changes. The value of linear particle depolarization ratio under 7 km above ground level (AGL) is generally smaller than that of cirrus higher. Conversely, the value of extinction coefficient under 7 km AGL is larger than that of cirrus higher. The results may be explained by the temperature dependence changes of the crystal shape, shape ratios, number concentration, and size distribution of ice crystals in cirrus clouds. With the increase of the height, the temperatures gradually decrease. According to the previous work [5,14,27,35], temperature has great impact on linear particle depolarization ratio and extinction coefficient by dominating the crystal shape, number concentration, and other microphysics properties of cirrus. Furthermore, the mean cloud base height and the mean top height of the first cirrus layer are 6.02 ± 0.60 km and 8.56 ± 0.69 km, respectively. The mean linear particle depolarization ratio and mean extinction coefficient are 0.39 ± 0.02 and 0.17 ± 0.08 km−1, respectively. The mean temperature at the layer top is −39.8 ± 4.0 °C. The mean cloud base height and mean top height of the second cirrus layer are 9.70 ± 0.39 km and 11.77 ± 0.76 km, respectively. The corresponding mean linear particle depolarization ratio and mean extinction coefficient are 0.40 ± 0.02 and 0.07 ± 0.04 km−1, respectively. In addition, the mean temperature at the layer top is −67.0 ± 4.4 °C. In this study, the geometrical and optical properties of all the 21 cirrus clouds are retrieved.

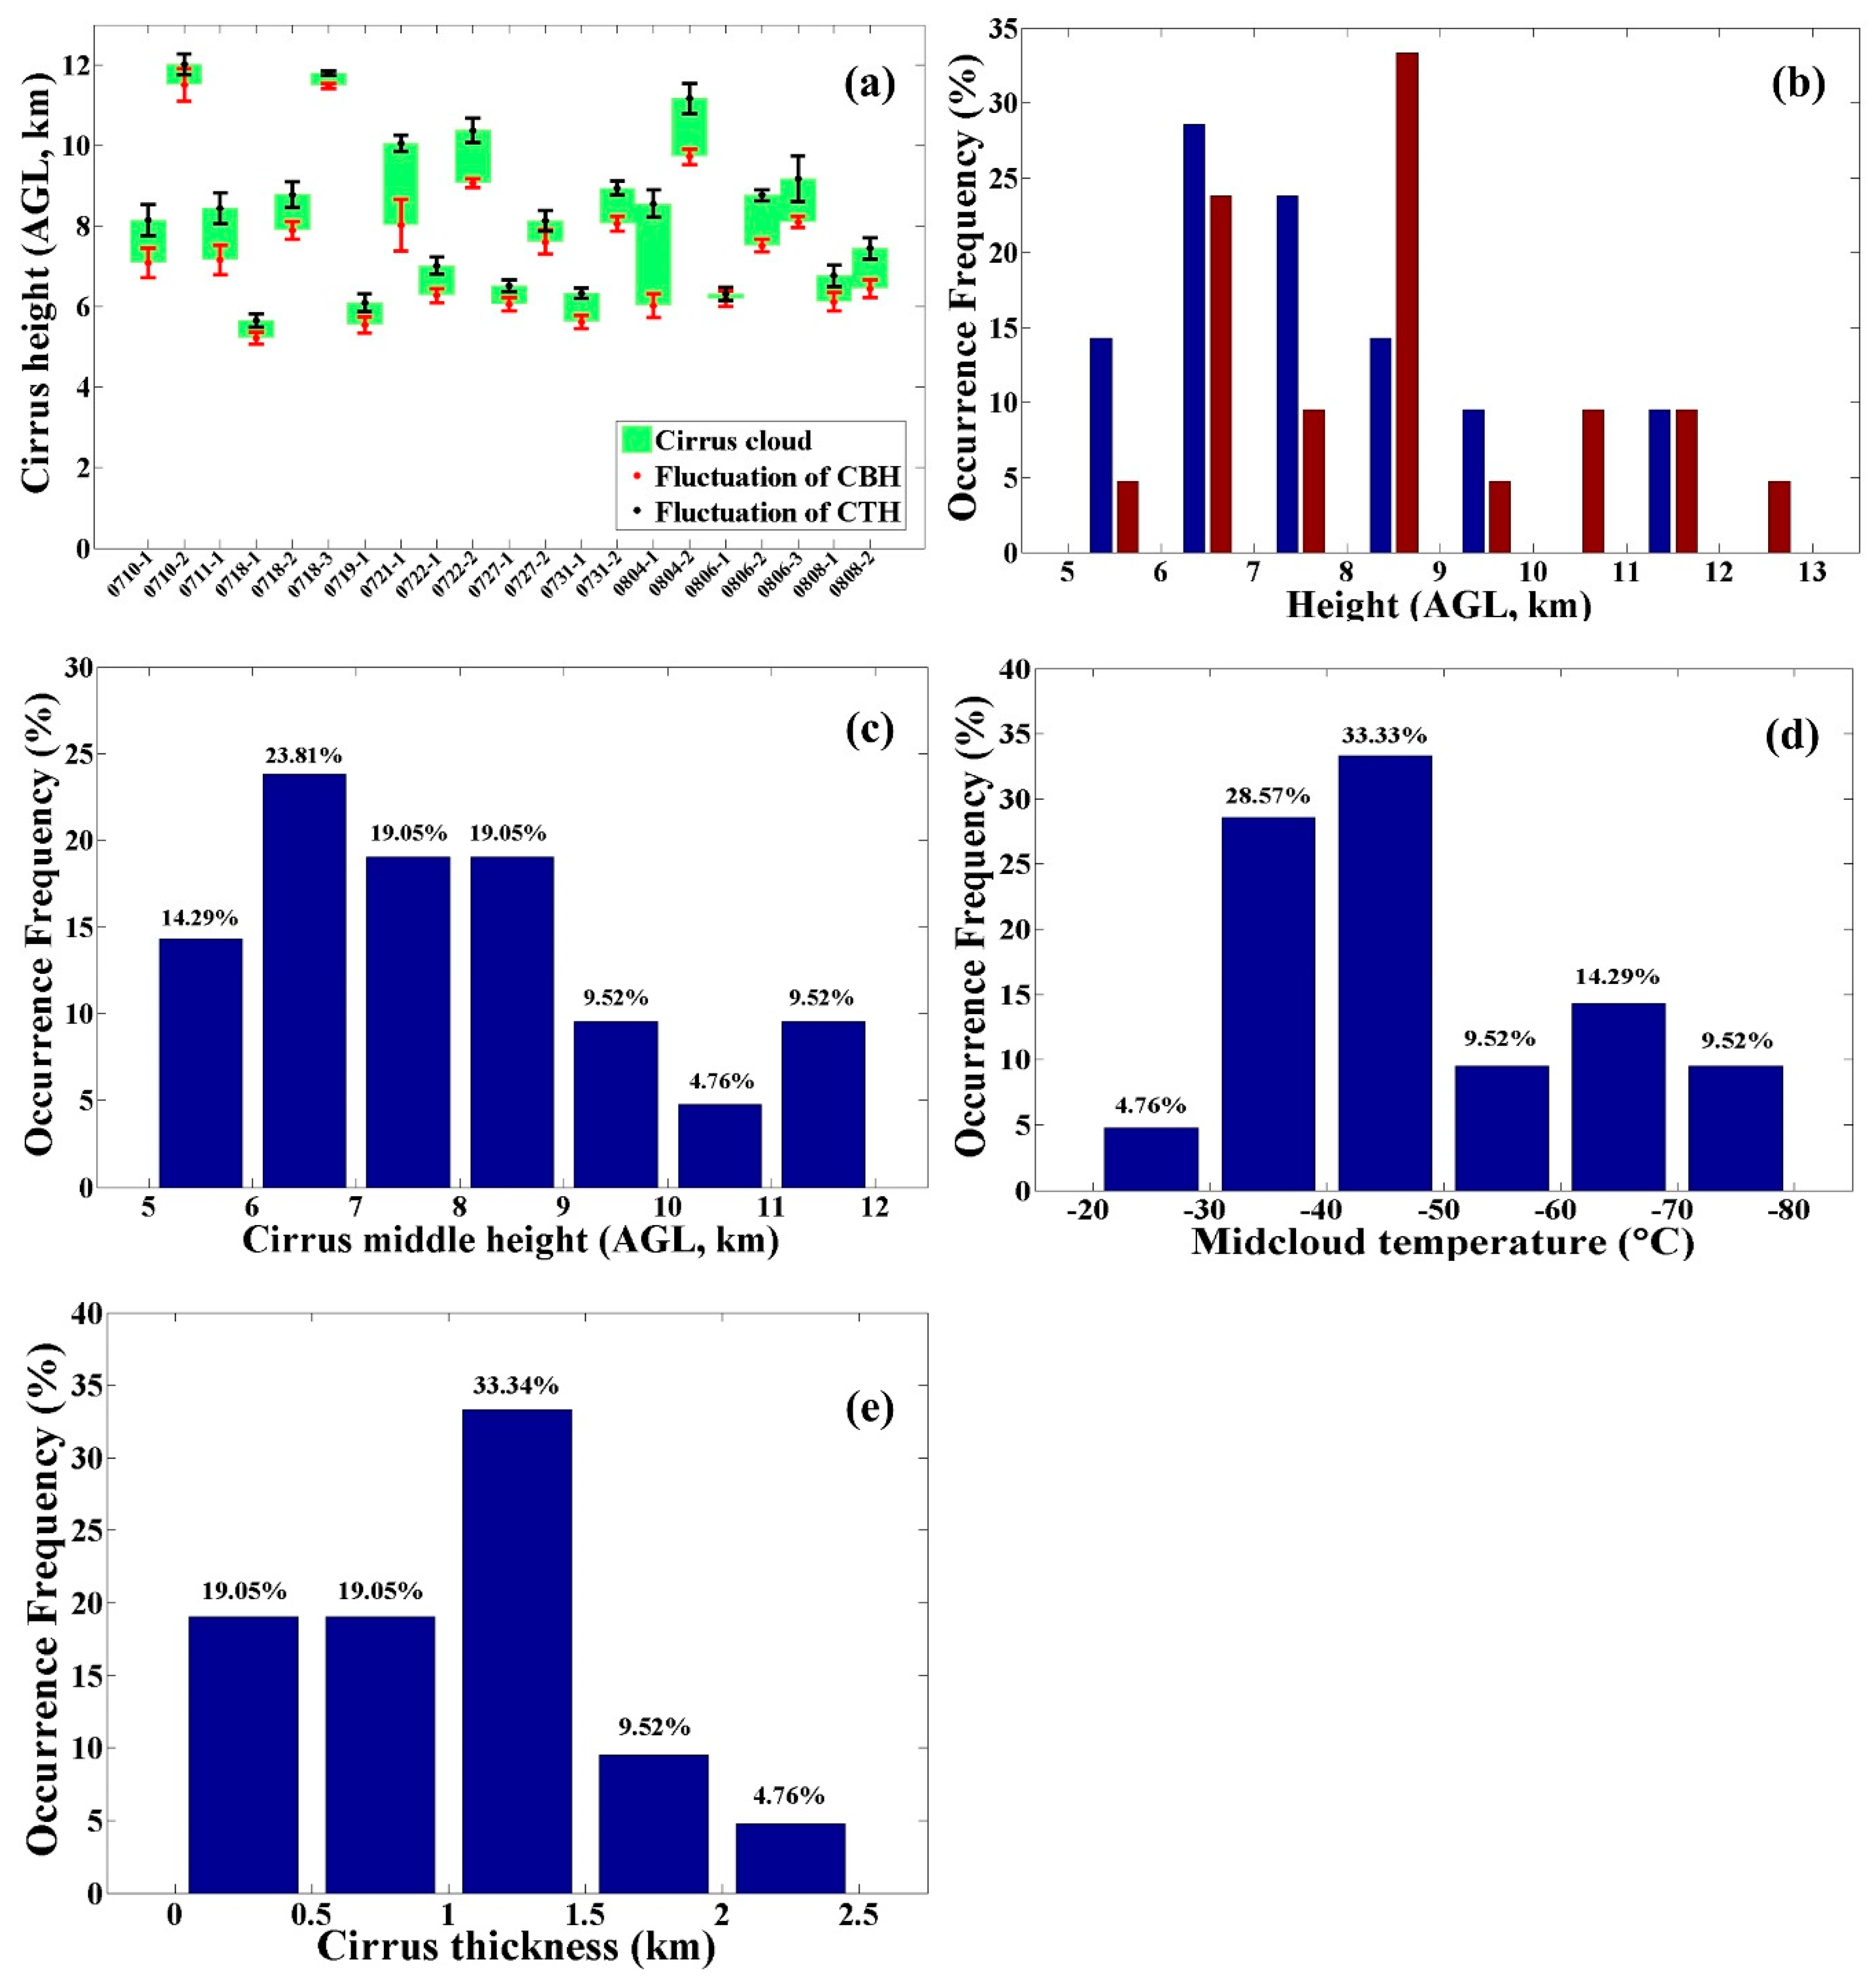
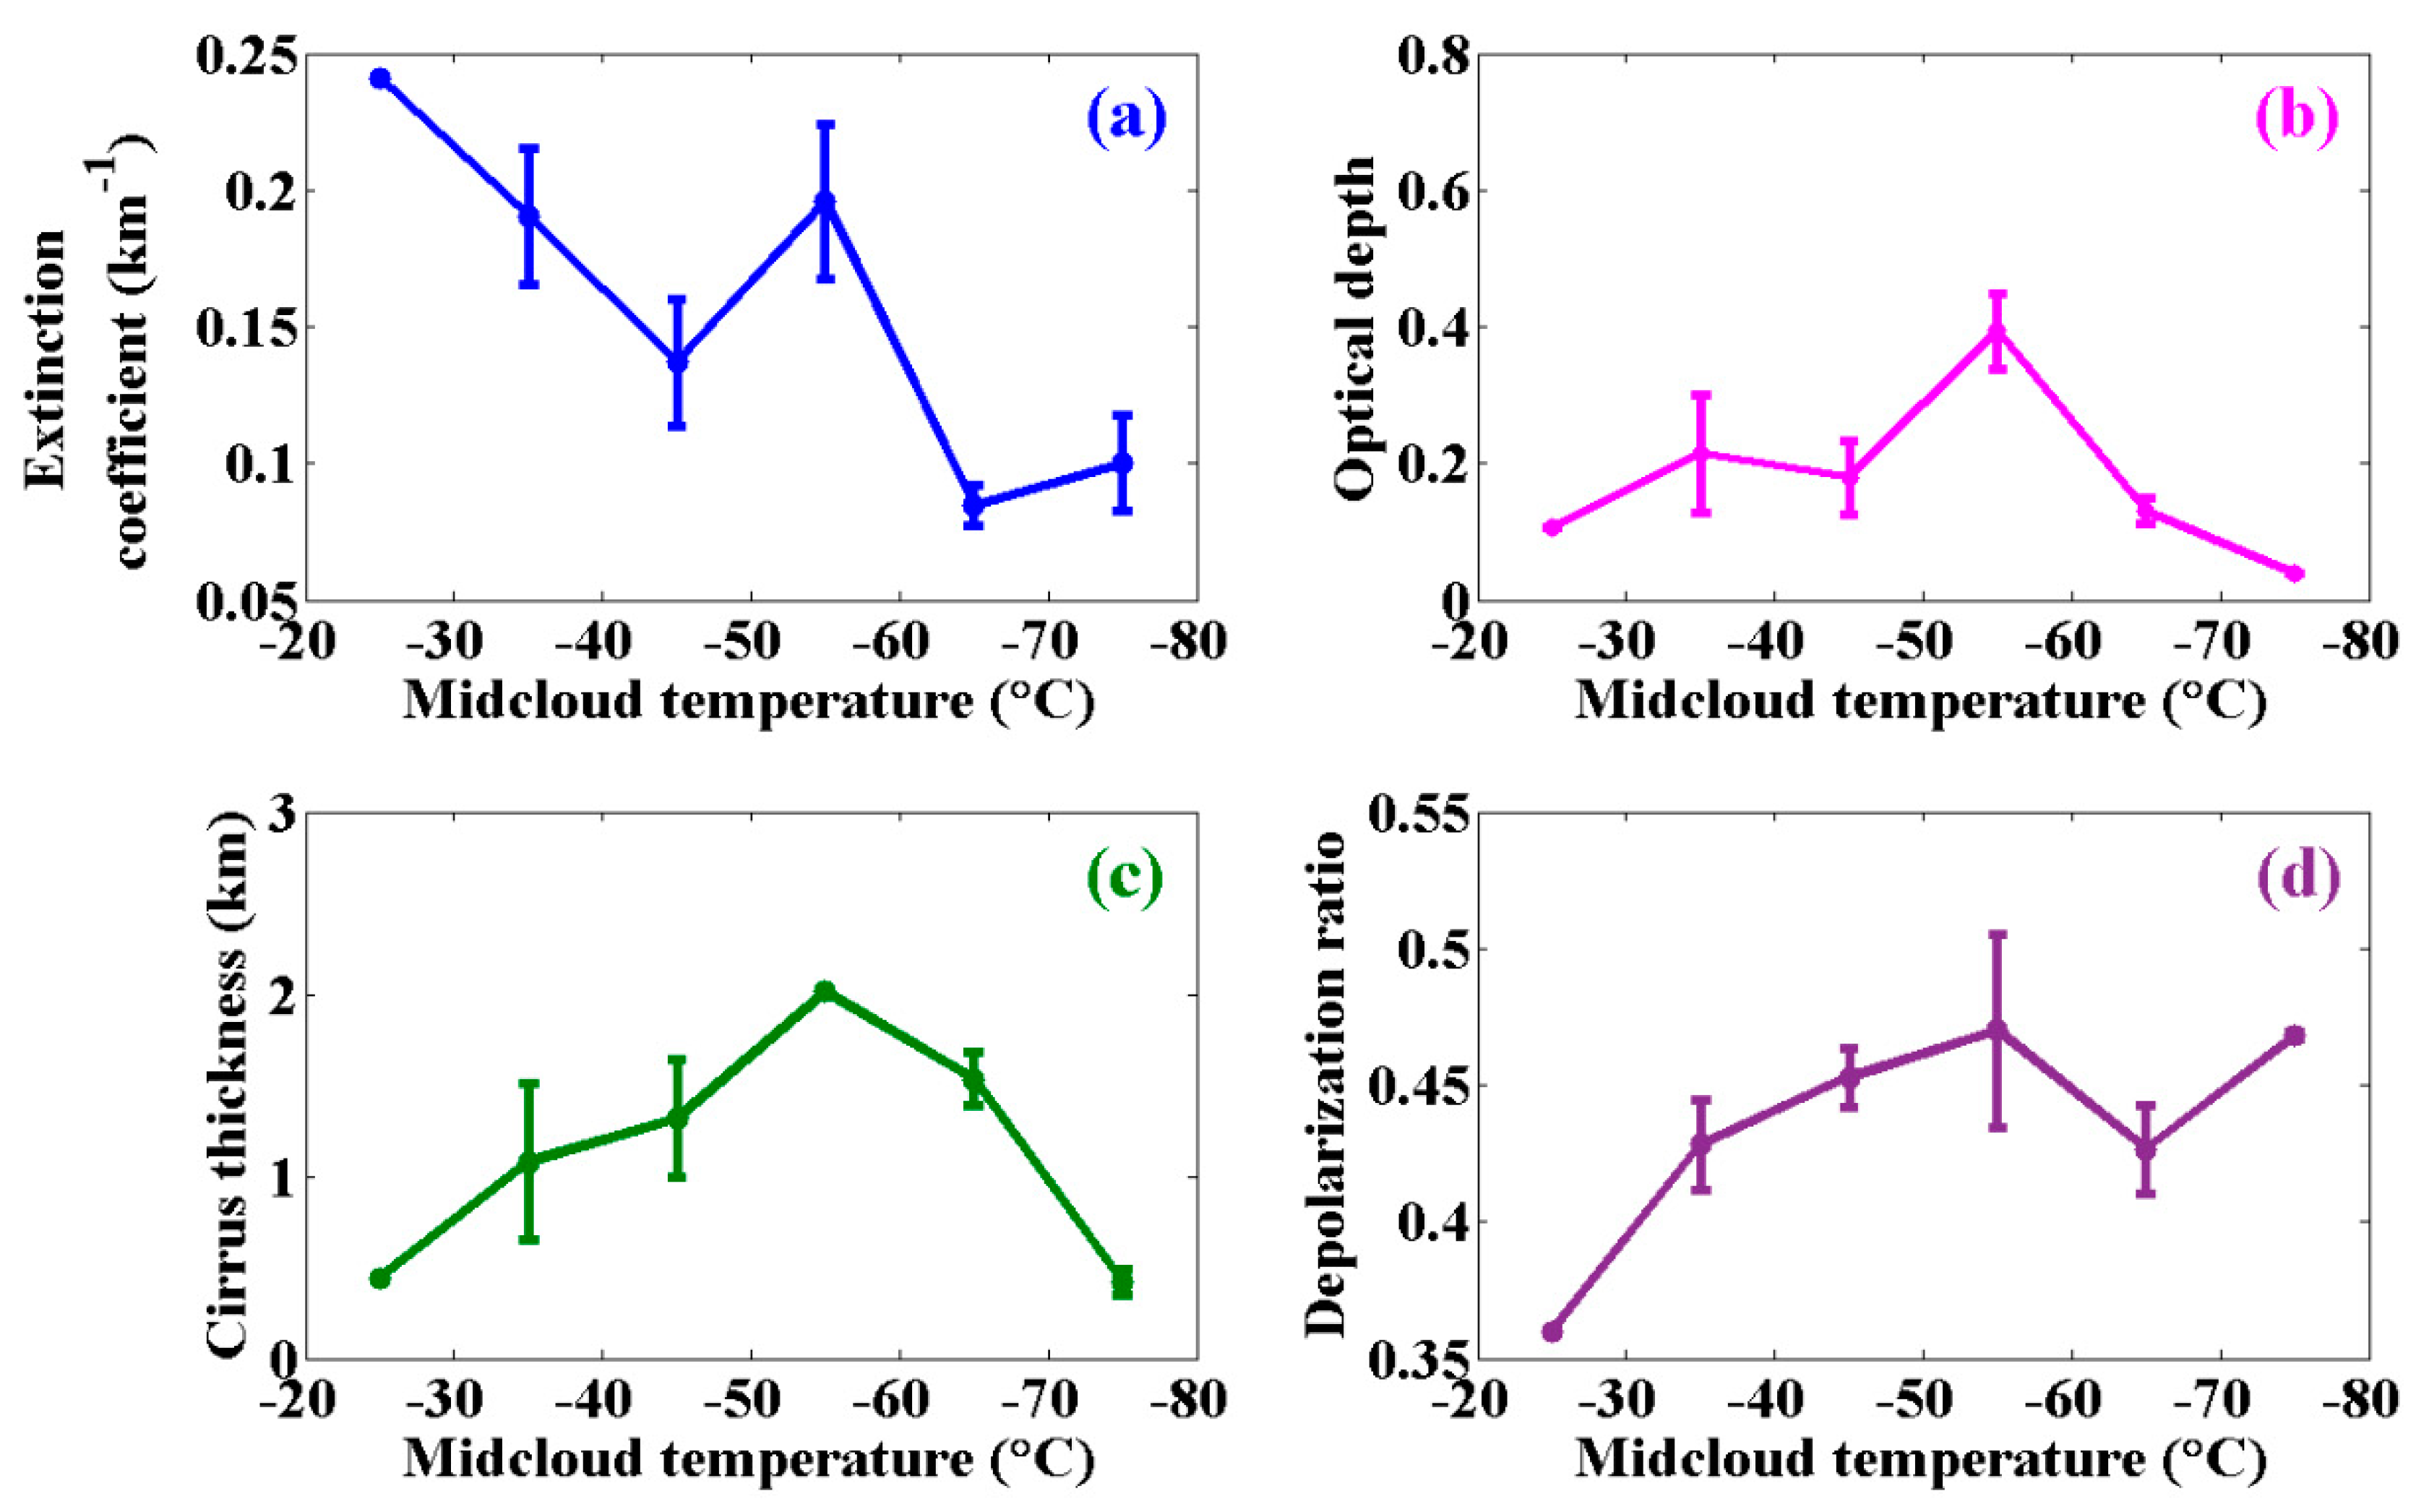
4.2. Geometrical Characteristics and Temperature Dependence

Cloud thickness and structure are important factors in determining the cirrus cloud properties. Based on the measurements of WACAL, the structures of cirrus clouds were provided. In Figure 3, we present the cirrus structure and the vertical distribution of the occurrence frequency of cloud base/top heights measured during the TIPEX III. The abscissa axis coordinates in style of “MMDD-No.” indicate the measurement date (MMDD) and the serial number (No.) of cirrus on that day. Figure 3a shows the vertical extent of cirrus clouds measured by WACAL over Naqu. The variation of cloud base/top heights were also presented. Figure 3b presents the occurrence frequency of cloud base and top heights at 1 km altitude interval. The maximum frequencies of the cirrus cloud base and top height were 28.57% at height of 6–7 km AGL and 33.34% at height of 8–9 km AGL, respectively. The cirrus base height ranged from 5 to 12 km AGL, with a mean value of 7.46 ± 1.79 km AGL. Meanwhile, the cirrus top height ranged from 5 to 13 km AGL, with a mean value of 8.41 ± 1.88 km AGL.
Histograms of cirrus cloud middle height (geometric center height) and temperature at cirrus top are also presented in Figure 3. The middle heights of the cirrus clouds are generally observed in the Tibetan Plateau region from 5 to 12 km AGL and 61.91% of them are located between 6 and 9 km AGL. According to Figure 3d, the maximum frequency of the temperatures at midcloud is 33.33% between −50 °C and −40 °C and the midcloud temperatures range from −79.7 to −26.0 °C with a mean value of −44.0 ± 15.0 °C.
From Figure 3e, it can be found that the cirrus thickness distribution has a skewed distribution. 85.7% of the case studies have thickness smaller than 1.5 km and the cloud thickness ranges from 0.12 to 2.55 km with a mean thickness of 1.22 ± 0.70 km.

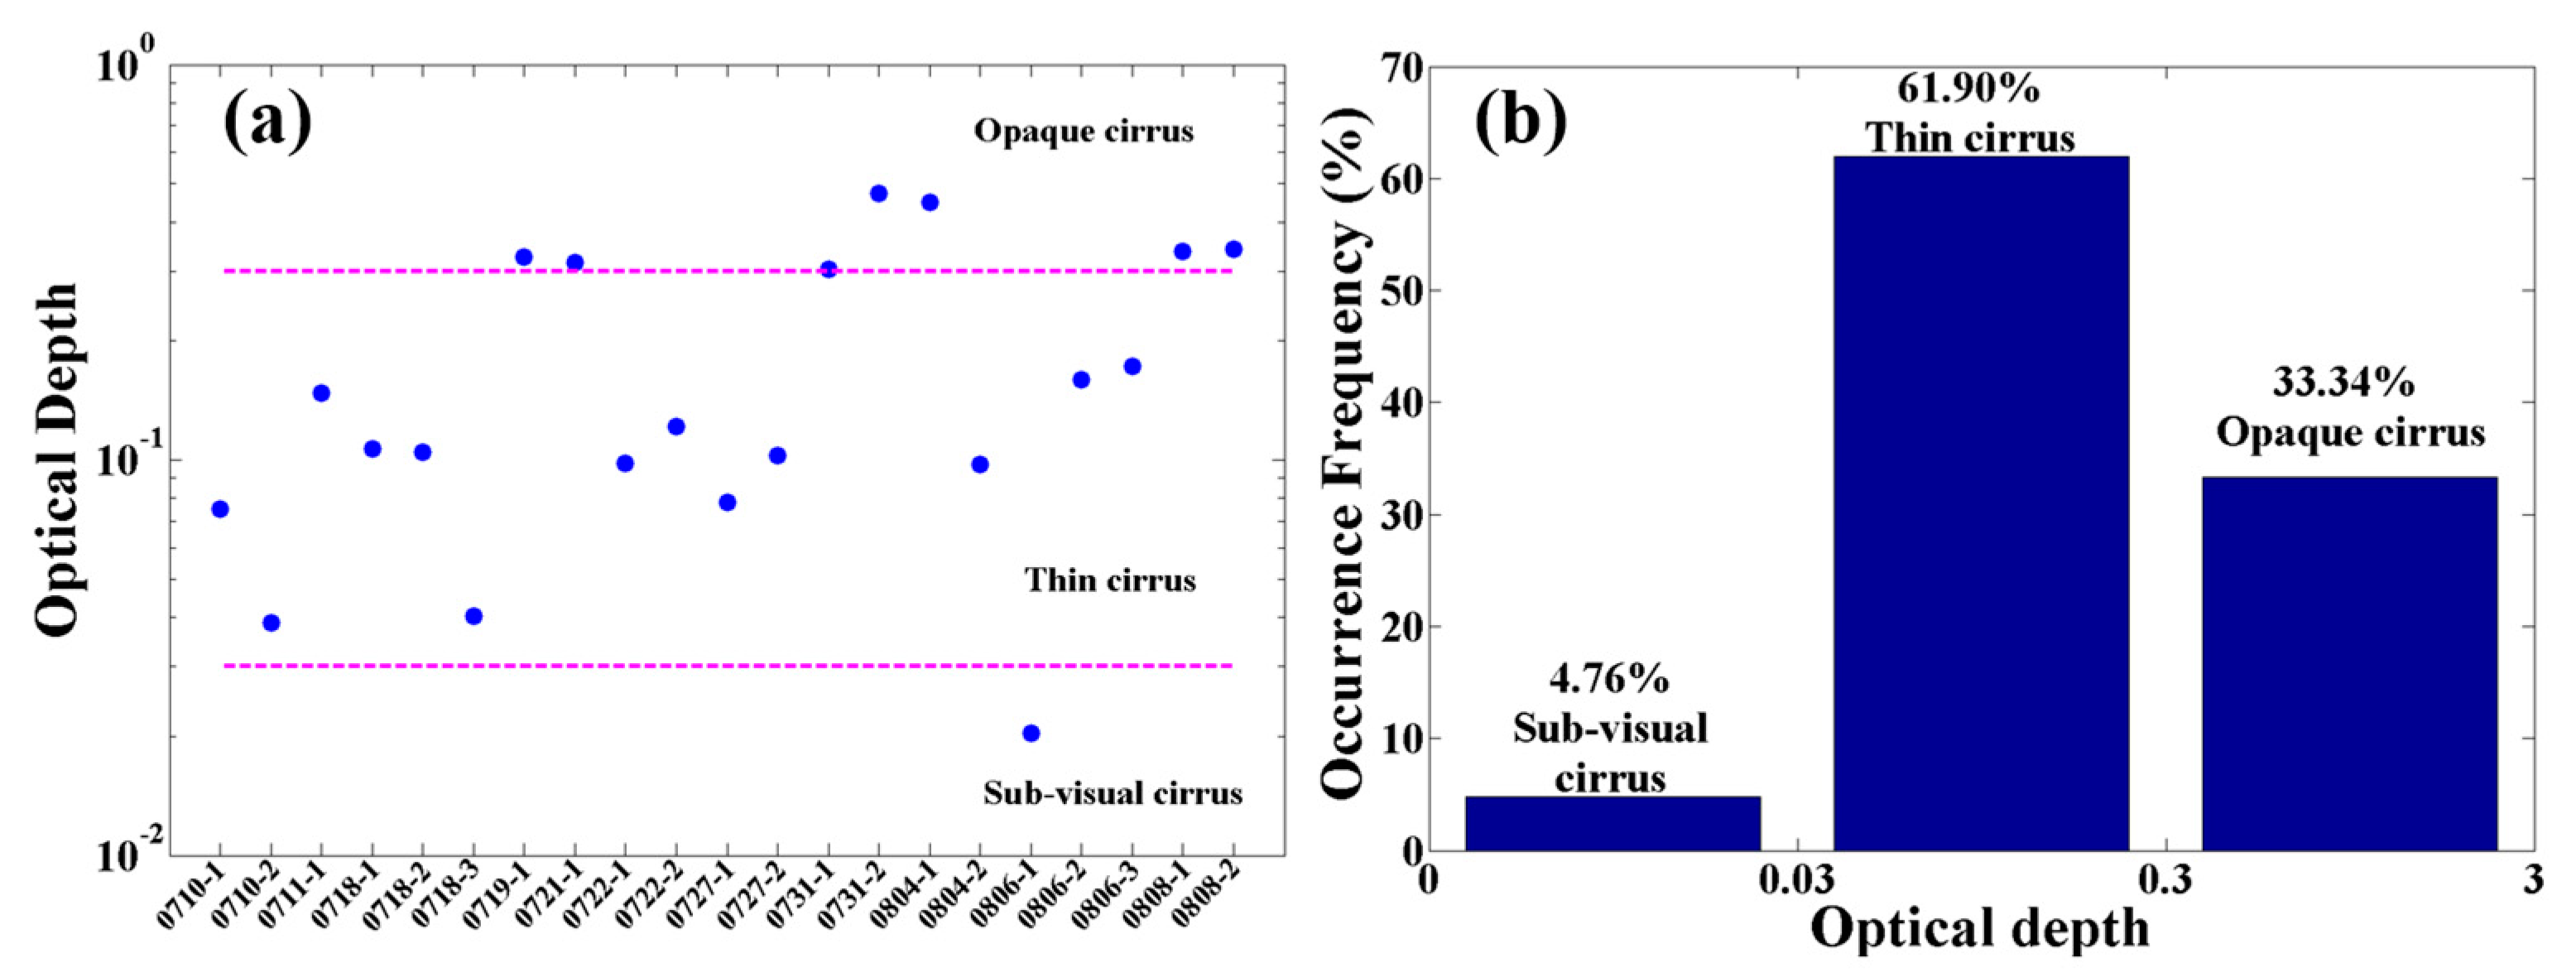
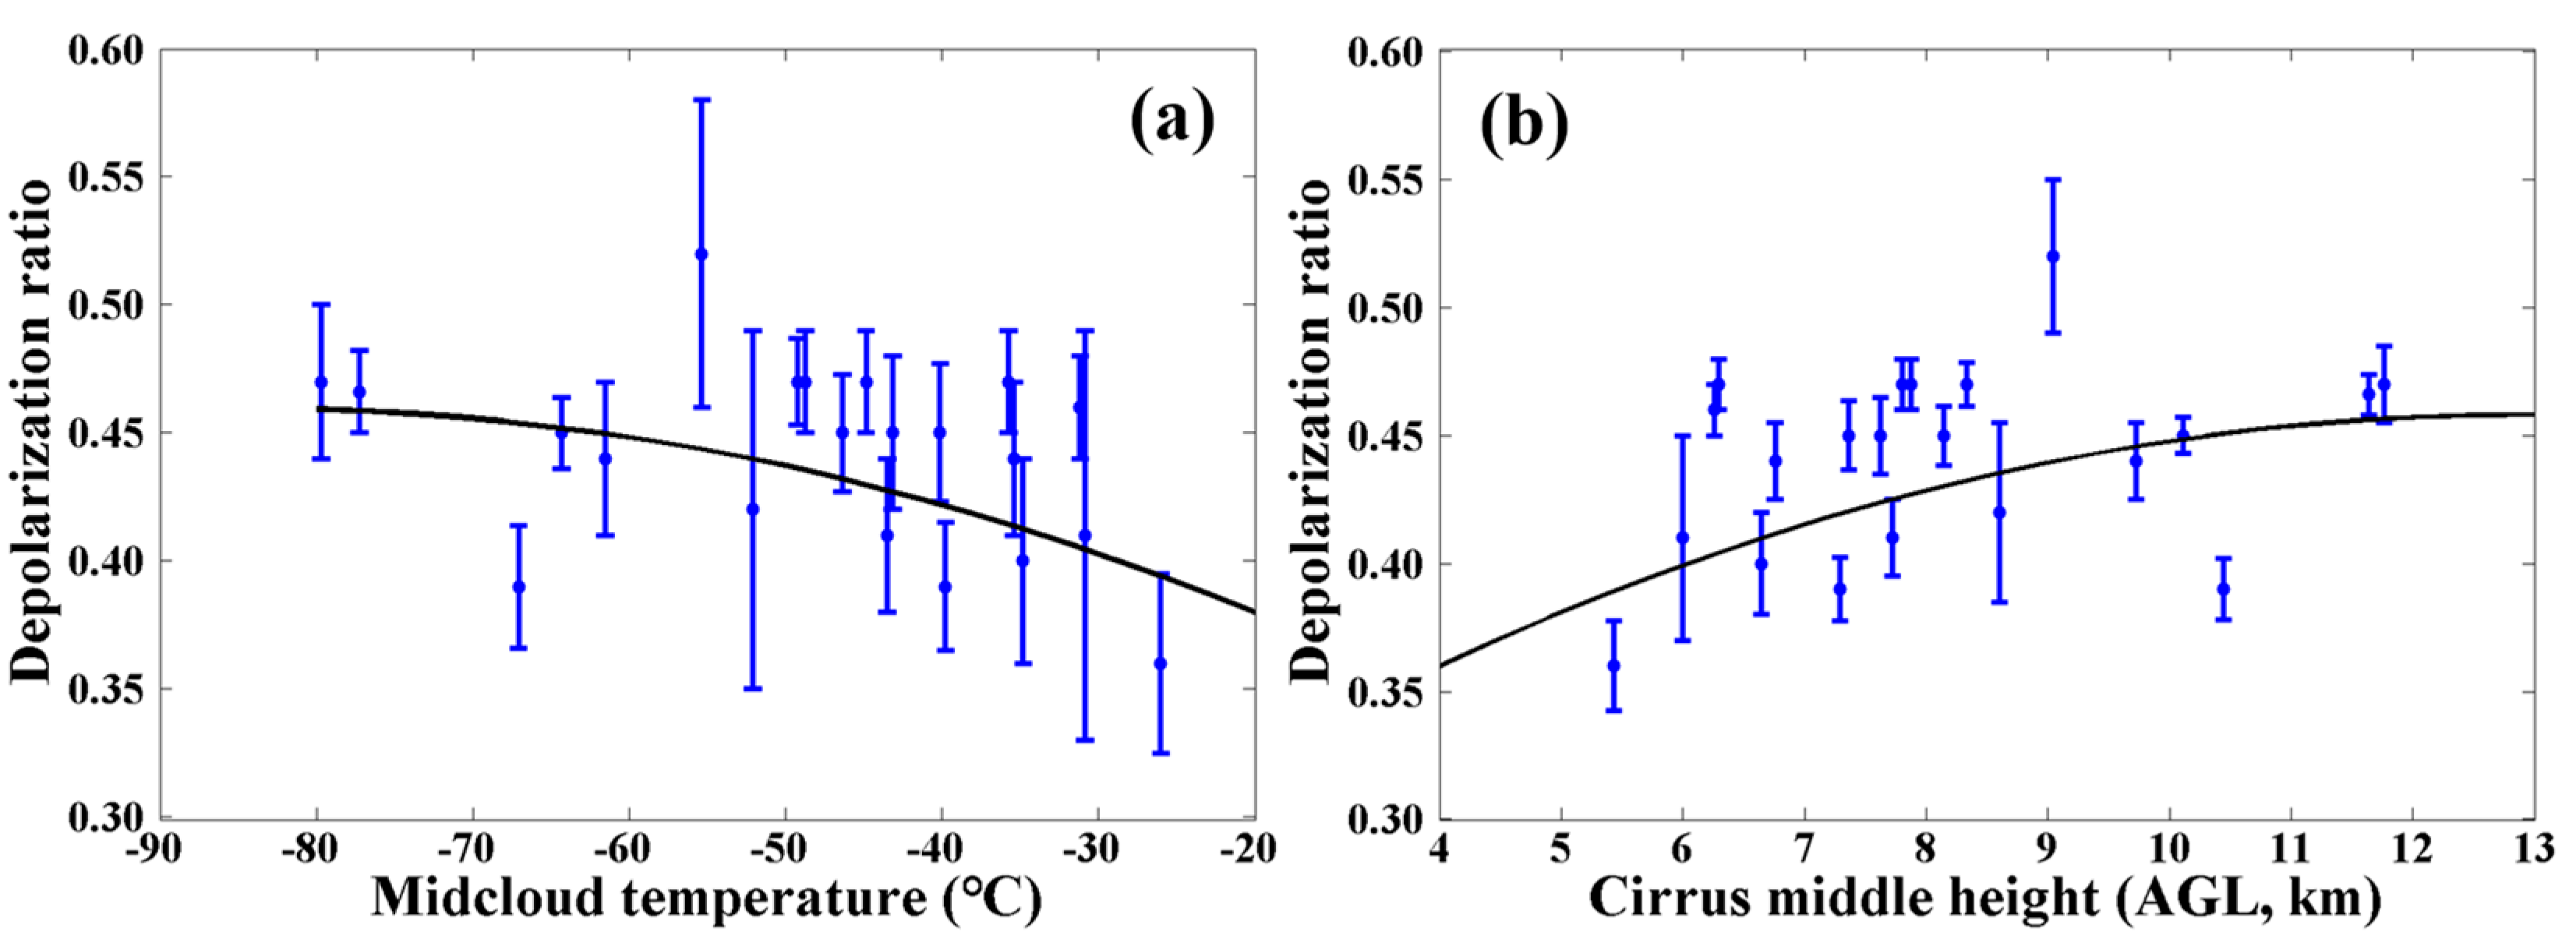
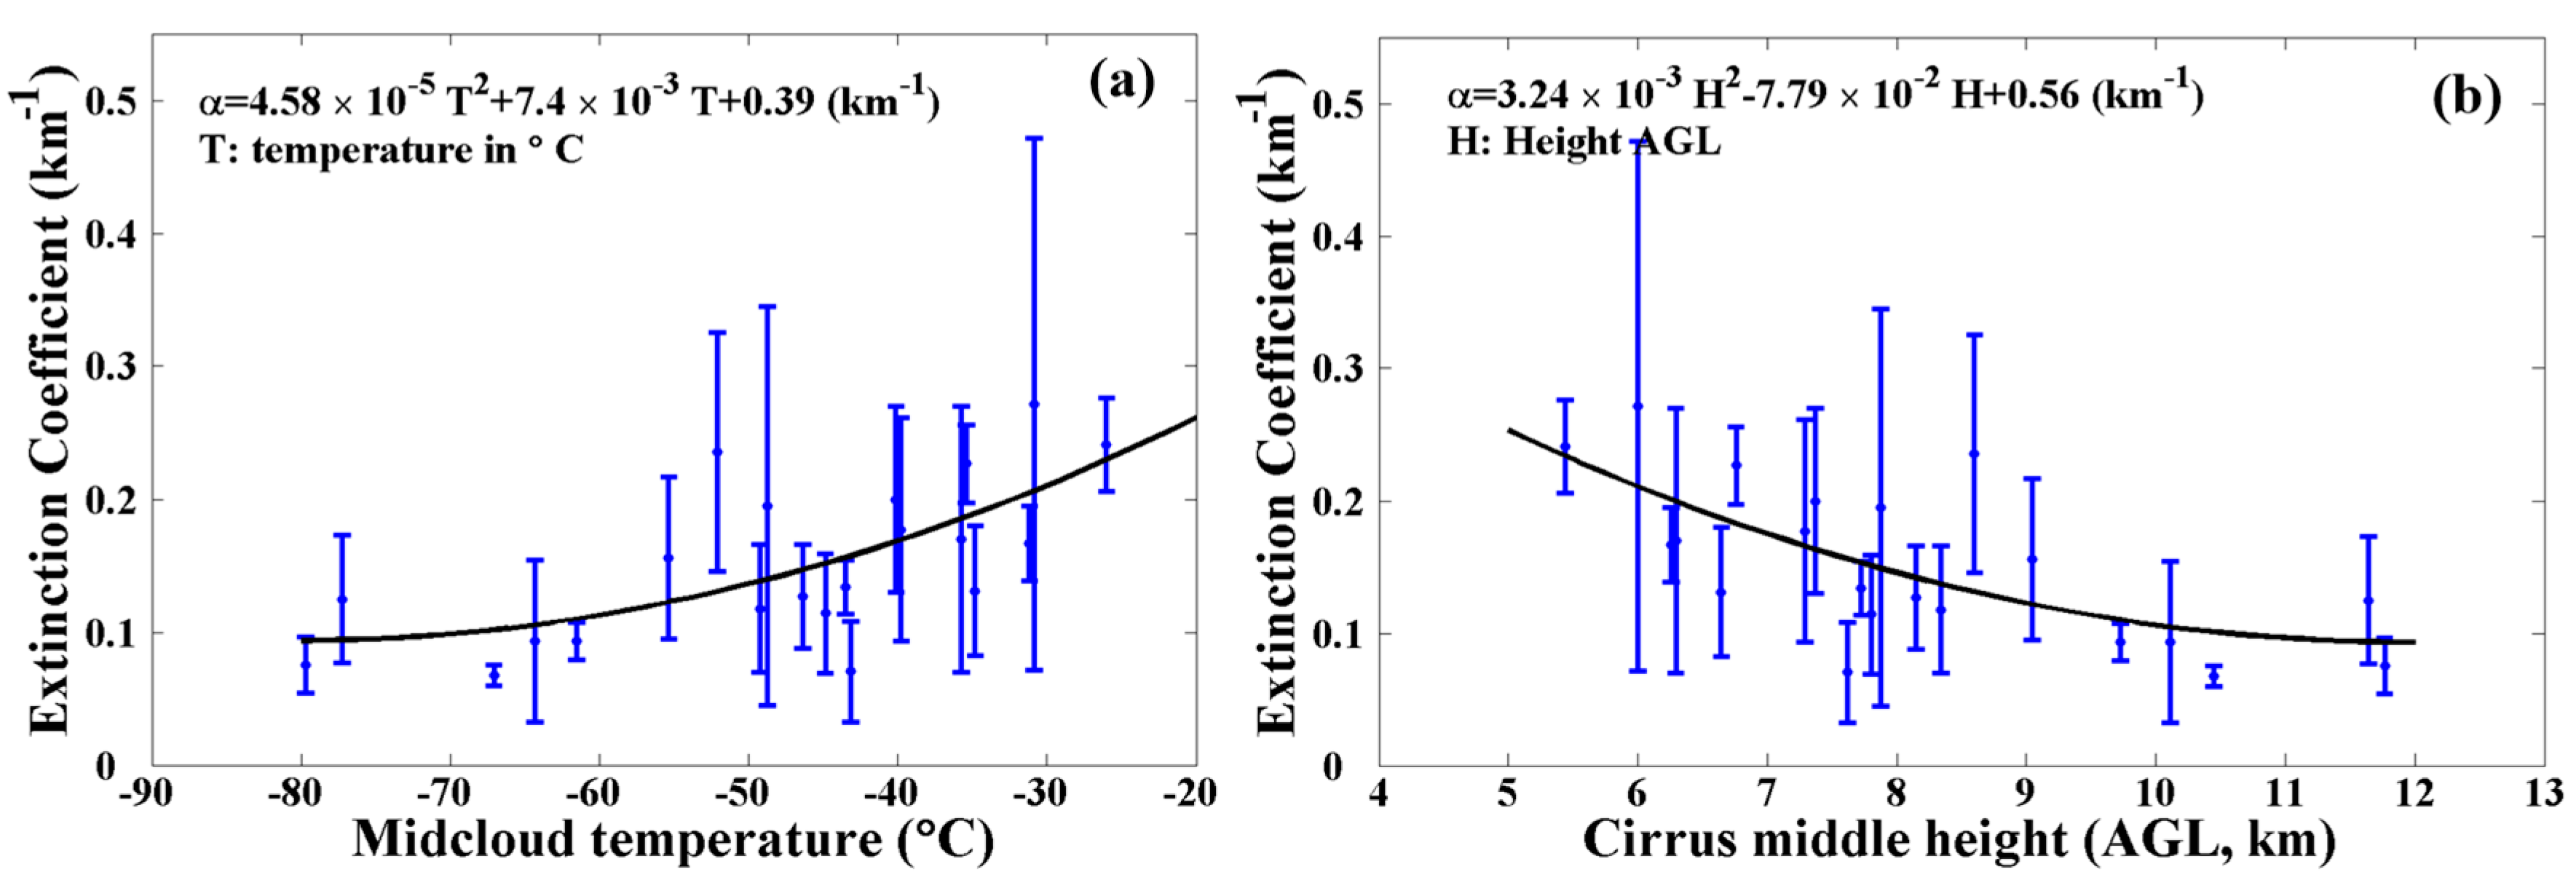
4.3. Optical Properties and Temperature Dependence

In this study, the extinction coefficient, the linear particle depolarization ratio and optical depth are calculated. We applied the methods which were briefly presented in the methodology section to all the case studies of cirrus clouds during the TIPEX III over Naqu. In this study, the linear particle depolarization ratio and cirrus mean extinction coefficient and the corresponding statistical uncertainties are calculated. The depolarization ratio ranges from 0.36 to 0.52, with the cirrus mean extinction coefficient differs from 0.05 km−1 to 0.40 km−1.
For further investigation of the extinction coefficient and optical depth, we present the distribution and histogram of the cirrus clouds optical depth in Figure 4. The optical depth of the cirrus clouds is between 0.01 and 3. We found that 4.76% of cirrus clouds are sub-visual (optical depth<0.03), 61.90% of cirrus clouds are optical thin (0.03<optical depth<0.3) and 33.34% of cirrus clouds are opaque (optical depth>0.3). In our study, 66.66% of the cirrus clouds during this Tibetan Plateau campaign are sub-visual or optically thin, which is distinctly higher than the occurrence frequency of 50% that measured by He et al. (2013) [27]. Several investigations on the statistics of cirrus clouds have been accomplished. The threshold of 0.03 for optical depth measured at the wavelength of 694 nm was first proposed by Sassen and Cho (1992) [31] to separate cirrus clouds to visible and sub-visual. Goldfarb et al. (2001) found that ~20% of total cirrus cloud occurrences (with 384 nights of measurements) are sub-visual for a mid-latitude LiDAR station in France [41]. Based on the cirrus cloud measurements in northern Germany during May 1994 and March 1996, Reichardt (1999) found that 70% of cirrus clouds were classified as sub-visual or optically thin ice clouds (optical depths bellow 0.3) [42]. According to the cirrus clouds studied over Utah, the US from 1986 to 1996 (~2200 h of data), Sassen and Campbell (2001) presented a mid-latitude climatology showing that optical depth of cirrus clouds is greater than 0.3 for ~50% of detected cases [43].
To investigate the temperature dependence of linear particle depolarization ratio and mean extinction coefficient distribution, we plotted the scatter diagrams of linear particle depolarization ratio, mean extinction coefficient, and midcloud temperature, cirrus middle height.
In Figure 5, the linear particle depolarization ratios dependences on midcloud temperature and cirrus middle height are presented. The bars show the statistical uncertainties of linear particle depolarization ratio while the black lines are the fitting curves. From Figure 5, the linear particle depolarization ratio of cirrus varies from 0.36 to 0.52. With the increase of the temperature, the values of the linear particle depolarization ratio are gradually reduced, which agrees with previous papers [5,14]. Depolarization ratio is sensitive to crystal shape and shape ratios [44]. With the extremely low temperature, the formation of crystals with small mean sizes and more complex form with irregular structures may initiate. According to the measurement results from Heymsfield and Iaquinta (2000) [45] and Miloshevich and Heymsfield (1997) [46], we propose that with the decrease of the temperature and the increase of cirrus middle height, the irregular type ices with smaller size and greater aspect ratio are formed, which result in the increase of linear particle depolarization ratio of the cirrus clouds. According to Figure 5, the linear particle depolarization ratio with higher temperature and lower altitude is slightly more sensitive to the ambient temperature. Under the condition of low temperature, it is proposed that the existence of the stable cirrus particles with smaller radius makes the temperature sensitivity gradually weaker with the decreasing temperature.
Figure 6 shows the mean extinction coefficient dependences on midcloud temperature and cirrus middle height. The bar presents the standard deviation of extinction coefficient of a certain cirrus layer while the black lines are the fitting curves. From Figure 6, as expected, the mean extinction coefficient decreases with decreasing temperature for the measured cirrus clouds over the Tibetan Plateau, which agrees with previous papers [27,35]. The particle extinction coefficient is essentially influenced by the number concentration and size distribution of ice crystals in cirrus clouds. Although the cirrus radiative properties depend on cloud microphysics, it is the ambient temperature that governs the radiative transfer. It dominates the microphysics properties such as number concentration and size distribution. Platt et al. (1988) reported that the relationship between the cirrus extinction coefficient and atmospheric temperature yields the follow equation of α = a T 2 + b T + c [30]. Wang and Sassen (2002) described the temperature dependence of cirrus extinction coefficient by using the LiDAR and radar data with a three-order polynomial function [47]. Here we applied the second-order functional forms in representing the temperature dependence of cirrus mean extinction coefficient and the formula is α = 4.58 × 10 5 T 2 + 7.4 × 10 3 T + 0.39   ( k m 1 ) . Moreover, we also provided the relationship between the cirrus mean extinction coefficient and the height AGL and the fitting curve is presented in Figure 6b. The temperature sensitivity of cirrus mean extinction coefficient is gradually weakened with the decreasing temperature. Consequently, temperature has a more prominent impact on extinction coefficient for warmer and lower cirrus.
The dependence of cirrus mean optical and geometrical properties on midcloud temperature with an interval of 10 °C is also provided in Figure 7. According to Figure 7a,d, with the decrease of the temperatures, the developments of linear particle depolarization ratio and mean extinction coefficient show opposite change tendencies. Since the number concentration and size distribution of ice crystals in cirrus clouds are temperature-dependent, the mean extinction coefficient increases with increasing temperature. In contrast, the linear particle depolarization ratio which is sensitive to ice crystal shape and shape ratios increases along with the decrease of temperature, which is also demonstrated in Platt et al. (1987) [48]. It can also be noted from Figure 7b,c that the mean cirrus thickness and optical depth have the similar tendencies. Accordingly, the maximum optical depth and cloud thickness are both found at the temperatures between −60 and −50 °C. In Platt et al. (1987) [48], the similar temperature dependency of optical depth is also presented.

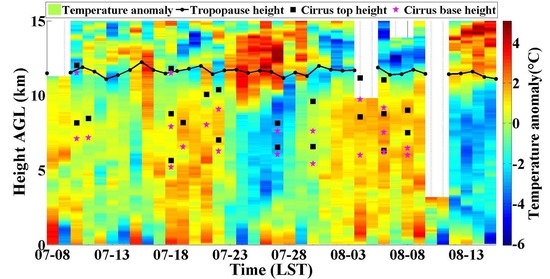
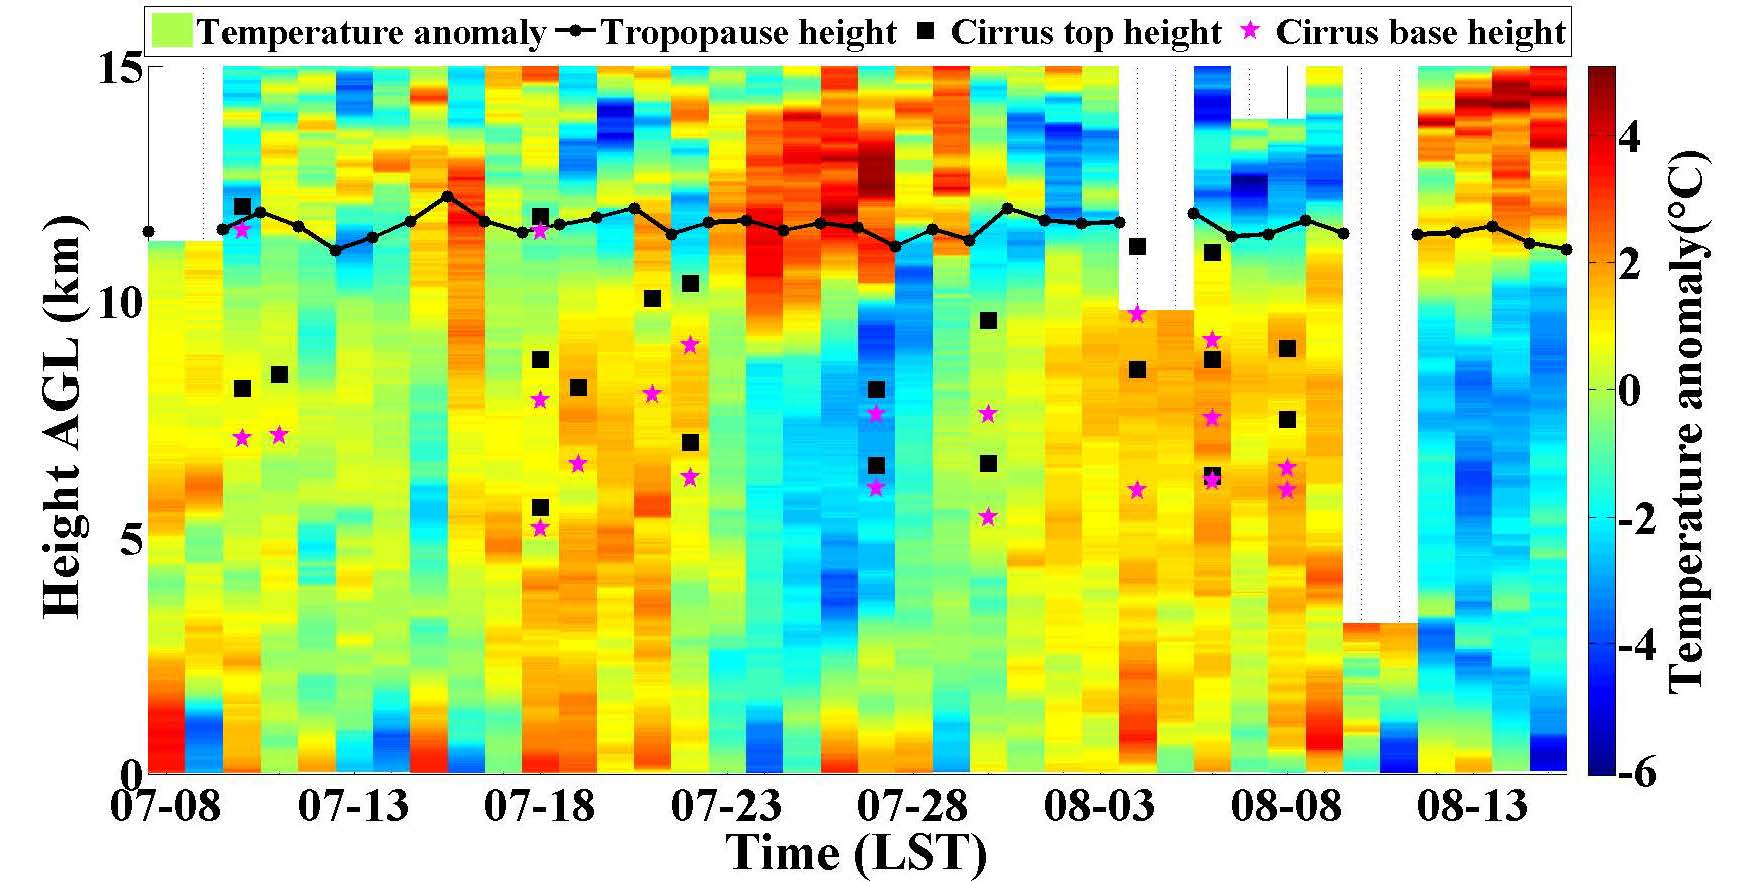
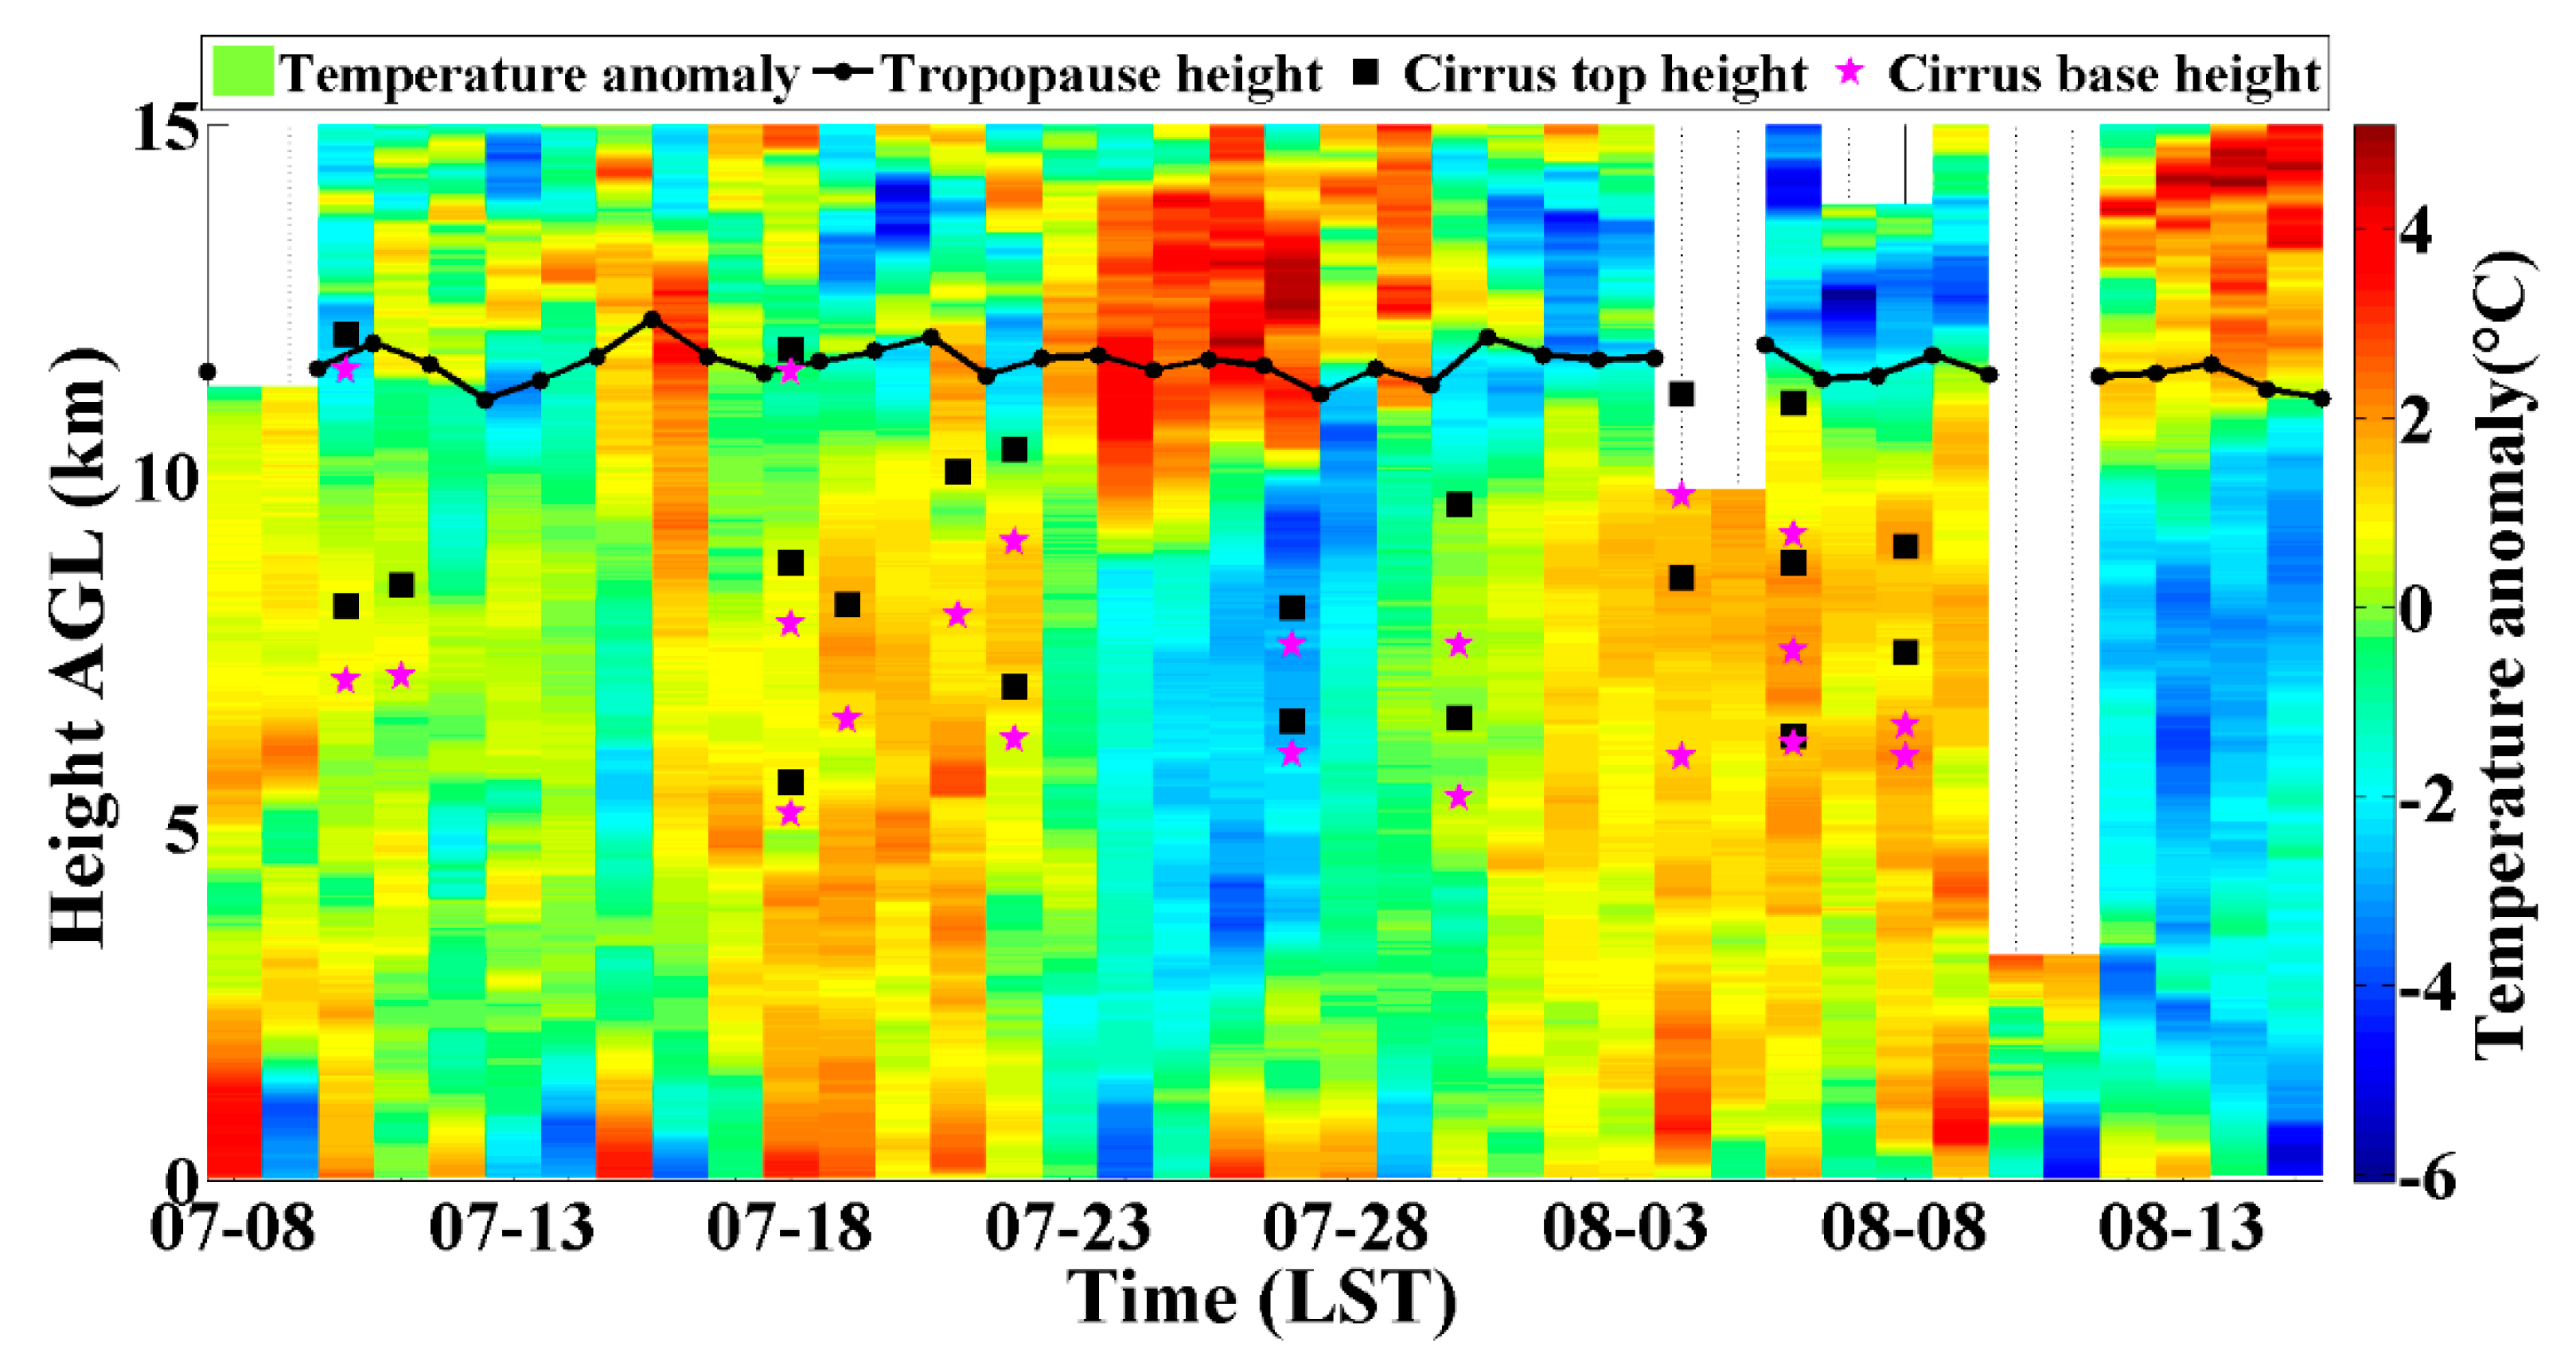
4.4. Cirrus Occurrence and Temperature Anomaly

The temperature anomalies (difference from the mean value of the temperature) during July and August 2014 over Naqu is provided in Figure 8. The simultaneous tropopause heights and cirrus base/top heights were provided as well. The tropopause heights are determined by using temperature data. According to the previous reports (e.g., Gage and Green, 1982 [49]), the height of tropopause can be determined when the d T / d z = 2   K km 1 and the temperature lapse rate does not exceed 2 K km 1 for at least two kilometers. From this figure, most of the cirrus were below tropopause except the cases on 10 and 18 July 2014. However, we still took them into account since the cirrus top heights of these two cases were smaller than 1.5 km above the tropopause. The warm color corresponds to the positive deviation while the cool color corresponds to negative deviation. The cirrus cloud base and top heights are also plotted in Figure 8. The pink star symbol denotes the cirrus base height while the black square symbol represents the cirrus top height. The LiDAR observation can be separated in six stages: 10 to 11 July, 18 to 22 July and 31 July to 8 August for the cirrus-existence stages and 12 to 17 July, 23 to 30 July, and 9 to 16 August for the cirrus-inexistence stages. During the 3 cirrus-existence stages, the temperatures below the cirrus clouds were higher than the average value, which indicates that the formation of the cirrus clouds may be related to the local ground heating and deep convective activity over the Tibetan Plateau. In this period, cold perturbations were found at height of about 12 km AGL. During the 3 cirrus-inexistence stages, oppositely, the temperatures below the cirrus clouds were lower than the average. Consequently, it can be found that the tropospheric temperatures with the presence of cirrus were about 5 °C higher than that with no cirrus clouds. Based on the appearance of the colder and warmer air masses at the height of above 12 km AGL (16.5 km a.s.l.), the Rossby waves can be recognized at the same height in the tropospheric layer and with a duration cycle of about 10 days. The formation of the cirrus clouds may also be affected by South Asia High Pressure (SAHP), which has characteristics of quasi-biweekly oscillation. In summer, there are two main heating centers on the latitude band near the SAHP Center, one on the Tibetan Plateau and one in the middle and lower reaches of the Yangtze River. Following the development of the heating field and the surrounding atmospheric circulation, these two centers change with characteristics of quasi-biweekly oscillation.
To research the significant impact of the radiative effect and climate effect caused by cirrus clouds, we calculated the longwave fluxes of cirrus clouds based on the Fu-Liou model. Since the microphysical properties such as mean effective radius for ice particles is unavailable from WACAL system, we modeled the ice particle size by the method described in Krämer et al. (2016) [38]. Figure 9a shows that the cirrus OLR F c increases monotonously with the increase of optical depth. F c is smaller than 6 Wm−2 for sub-visual cirrus while for thin cirrus, the values of F c lies between 6 Wm−2 and 25 Wm−2. As for the opaque cirrus, the value of F c is greater than 25 Wm−2. Comstock et al. (2002) estimated that a cloud becomes significant in term of OLR when the cloud forcing is approximately 10 Wm−2 [50]. According to Figure 9a, the cirrus clouds in this study with OD>0.095 have a significant cloud forcing and the value of OD is slightly bigger than that reported by Comstock et al. (2002) [50]. Moreover, the relationships between cloud thickness, mean extinction coefficient, and OLR are shown in Figure 9b,c. It is found there is no obvious direct dependency among these parameters.

5. Results and Conclusions

This study provides an analysis of the geometrical and temperature characteristics as well as the optical properties and OLR of cirrus clouds over the Tibetan Plateau during TIPEX III between July 10 and August 16. Our results show that cirrus clouds are occurring between 5.2 km to 12 km AGL (i.e., 9.7 km to 16.5 km a.s.l.), with midcloud temperatures ranging from −79.7 to −26.0 °C. The mean cirrus top temperature is −44.0 ± 15.0 °C. The cloud thickness ranges from 0.12 to 2.55 km with a mean thickness of 1.22 ± 0.70 km. The linear particle depolarization ratio differs from 0.36 to 0.52, with a mean value of 0.44 ± 0.04.
According to the measured optical depth, the cirrus clouds are classified as sub-visual cirrus (4.76%), optical thin cirrus (61.90%) and opaque cirrus (33.34%). From the results, the fitting curves about linear particle depolarization ratio, mean extinction coefficient depending on the midcloud temperature and the cirrus middle height are plotted.
The dependence of cirrus mean optical and geometrical properties on temperature with an interval of 10 °C is also provided. With the decrease of the temperatures, the developments of linear particle depolarization ratio and mean extinction coefficient show opposite change tendencies. The mean cirrus thickness and optical depth have the similar tendencies. The maximum optical depth and cloud thickness are both found at the midcloud temperatures between −60 and −50 °C.
According to the temperature anomaly during the July and August in 2014, the formation of cirrus clouds has apparent relationship with the dynamic processes of Rossby wave and South Asia High over the Tibetan Plateau.
The OLR of sub-visual, thin, and opaque cirrus was calculated respectively and they increase gradually along with the optical depth.

Author Contributions

Conceptualization, G.D. and S.W.; methodology, G.D.; validation, S.W. and X.S.; formal analysis, G.D.; investigation, G.D., S.W. and X.S.; resources, S.W. and L.L.; data curation, G.D.; writing—original draft preparation, G.D.; writing—review and editing, G.D. and S.W.; supervision, S.W.; project administration, S.W. and L.L.; funding acquisition, S.W. and L.L.

Funding

This research was funded by National Key Research and Development Program of China, grant number 2016YFC1400904, National Natural Science Foundation of China (NSFC), grant numbers 41375016 and 91337103; and the China Special Fund for Research in the Public Interest, grant numbers GYHY201406001.

Acknowledgments

The authors are very grateful to Patric Seifert from Leibniz Institute for Tropospheric Research, Germany for providing us comments about cirrus filters, quality control, and multiple scattering. We also thank Diego A. Gouveia from University of São Paulo, Brazil for discussion and providing scripts for correcting multiple scattering of cirrus. We appreciate the contribution made by Meteorological Bureau of Tibet Autonomous Region, Naqu Bureau of Meteorology. We also thank Dongxiang Wang, Xiaochun Zhai and Qichao Wang for their help with the observations and discussions.

Conflicts of Interest

The authors declare no conflict of interest.

References

  1. Webster, P.J. The role of hydrological processes in ocean-atmosphere interactions. Rev. Geophys. 1994, 32, 427–476. [Google Scholar] [CrossRef]
  2. Nazaryan, H.; McCormick, M.P.; Menzel, W.P. Global characterization of cirrus clouds using CALIPSO data. J. Geophys. Res. 2008, 113. [Google Scholar] [CrossRef]
  3. Lynch, D. Cirrus: History and definition. In CIRRUS; Lynch, D., Sassen, K., Starr, D., Stephens, G., Eds.; Oxford Univ. Press: New York, NY, USA, 2002; pp. 3–10. [Google Scholar]
  4. Sassen, K. The polarization lidar technique for cloud research: A review and current assessment. Bull. Am. Meteorol. Soc. 1991, 72, 1848–1866. [Google Scholar] [CrossRef]
  5. Giannakaki, E.; Balis, D.; Amiridis, V.; Kazadzis, S. Optical and geometrical characteristics of cirrus clouds over a southern European lidar station. Atmos. Chem. Phys. 2007, 7, 5519–5530. [Google Scholar] [CrossRef]
  6. Zerefos, C.; Eleftheratos, K.; Balis, D.; Zanis, P.; Tselioudis, G.; Meleti, C. Evidence of impact of aviation on cirrus cloud formation. Atmos. Chem. Phys. 2003, 3, 1633–1644. [Google Scholar] [CrossRef] [Green Version]
  7. Stephens, G.L.; Webster, P.J. Clouds and climate: Sensitivity of simple systems. J. Atmos. Sci. 1981, 38, 235–247. [Google Scholar] [CrossRef]
  8. Fu, Q.; Liou, K.N. Parameterization of the radiative properties of cirrus clouds. J. Atmos. Sci. 1993, 50, 2008–2025. [Google Scholar] [CrossRef]
  9. Fahey, D.W.; Schumann, U.; Ackerman, S.; Artaxo, P.; Boucher, O.; Danilin, M.Y.; Kärcher, B.; Minnis, P.; Nakajima, T.; Toon, O.B. Aviation-Produced Aerosols and Cloudiness. In Aviation and the Global Atmosphere: A Special Report of the Intergovernmental Panel on Climate Change; Cambridge University Press: Cambridge, UK, 1999; pp. 65–120. [Google Scholar]
  10. Stocker, T.F.; Qin, D.; Plattner, G.K.; Tignor, M.M.B.; Allen, S.K.; Boschung, J.; Nauels, A.; Xia, Y.; Bex, V.; Midgley, P.M. Climate Change 2013: The Physical Science Basis. Contribution of Working Group I to the Fifth Assessment Report of IPCC the Intergovernmental Panel on Climate Change; Cambridge University Press: Cambridge, UK; New York, NY, USA, 2014; pp. 159–254. [Google Scholar]
  11. Ansmann, A.; Wandinger, U.; Riebesell, M.; Weitkamp, C.; Michaelis, W. Independent measurement of extinction and backscatter profiles in cirrus clouds by using a combined Raman elastic-backscatter lidar. Appl. Opt. 1992, 31, 7113–7131. [Google Scholar] [CrossRef]
  12. Sassen, K.; Benson, S. A midlatitude cirrus cloud climatology from the facility for atmospheric remote sensing. Part II: Microphysical properties derived from lidar depolarization. J. Atmos. Sci. 2001, 58, 2103–2112. [Google Scholar] [CrossRef]
  13. Chen, W.-N.; Chiang, C.-W.; Nee, J.-B. Lidar ratio and depolarization ratio for cirrus clouds. Appl. Opt. 2002, 41, 6470–6476. [Google Scholar] [CrossRef]
  14. Sunilkumar, S.; Parameswaran, K. Temperature dependence of tropical cirrus properties and radiative effects. J. Geophys. Res. 2005, 110. [Google Scholar] [CrossRef] [Green Version]
  15. Elouragini, S.; Flamant, P.H. Iterative method to determine an averaged backscatter-to-extinction ratio in cirrus clouds. Appl. Opt. 1996, 35, 1512–1518. [Google Scholar] [CrossRef] [PubMed]
  16. Wandinger, U. Multiple-scattering influence on extinction-and backscatter-coefficient measurements with Raman and high-spectral-resolution lidars. Appl. Opt. 1998, 37, 417–427. [Google Scholar] [CrossRef] [PubMed]
  17. Kuwagata, T.; Numaguti, A.; Endo, N. Diurnal variation of water vapor over the central Tibetan Plateau during summer. J. Meteorol. Soc. Jpn. Ser. II 2001, 79, 401–418. [Google Scholar] [CrossRef]
  18. Wu, S.; Dai, G.; Song, X.; Liu, B.; Liu, L. Observations of water vapor mixing ratio profile and flux in the Tibetan Plateau based on the lidar technique. Atmos. Meas. Tech. 2016, 9, 1399–1413. [Google Scholar] [CrossRef] [Green Version]
  19. Wu, G.X.; Chen, S.J. The effect of mechanical forcing on the formation of a mesoscale vortex. Quart. J. R. Meteorol. Soc. 1985, 111, 1049–1070. [Google Scholar] [CrossRef]
  20. Wu, S.; Song, X.; Liu, B.; Dai, G.; Liu, J.; Zhang, K.; Qin, S.; Hua, D.; Gao, F.; Liu, L. Mobile multi-wavelength polarization Raman lidar for water vapor, cloud and aerosol measurement. Opt. Express 2015, 23, 33870–33892. [Google Scholar] [CrossRef] [PubMed] [Green Version]
  21. Qiyun, G.; Wei, L.; Yucun, Z.; Fengqin, L.; Peitao, Z. Performance test and comparative analysis of GTS1, GTS1-1 and GTS1-2 radiosondes. Meteorol. Hydrol. Mar. Instrum. 2012, 1, 7–12. [Google Scholar]
  22. Song, X.; Zhai, X.; Liu, L.; Wu, S. Lidar and ceilometer observations and comparisons of atmospheric cloud structure at Nagqu of Tibetan Plateau in 2014 summer. Atmosphere 2017, 8, 9. [Google Scholar] [CrossRef]
  23. GROß, S.; Tesche, M.; Freudenthaler, V.; Toledano, C.; Wiegner, M.; Ansmann, A.; Althausen, D.; Seefeldner, M. Characterization of Saharan dust, marine aerosols and mixtures of biomass-burning aerosols and dust by means of multi-wavelength depolarization and Raman lidar measurements during SAMUM-2. Tellus B 2011, 63, 706–724. [Google Scholar] [CrossRef]
  24. Freudenthaler, V.; Esselborn, M.; Wiegner, M.; Heese, B.; Tesche, M.; Ansmann, A.; Müller, D.; Althausen, D.; Wirth, M.; Fix, A. Depolarization ratio profiling at several wavelengths in pure Saharan dust during SAMUM 2006. Tellus B 2009, 61, 165–179. [Google Scholar] [CrossRef] [Green Version]
  25. Dai, G.; Wu, S.; Song, X. Depolarization ratio profiles calibration and observations of aerosol and cloud in the Tibetan Plateau based on polarization Raman lidar. Remote Sens. 2018, 10, 378. [Google Scholar] [CrossRef]
  26. Fernald, F.G. Analysis of atmospheric lidar observations: Some comments. Appl. Opt. 1984, 23, 652–653. [Google Scholar] [CrossRef]
  27. He, Q.; Li, C.; Ma, J.; Wang, H.; Shi, G.; Liang, Z.; Luan, Q.; Geng, F.; Zhou, X. The properties and formation of cirrus clouds over the Tibetan Plateau based on summertime lidar measurements. J. Atmos. Sci. 2013, 70, 901–915. [Google Scholar] [CrossRef]
  28. Comstock, J.M.; Sassen, K. Retrieval of cirrus cloud radiative and backscattering properties using combined lidar and infrared radiometer (LIRAD) measurements. J. Atmos. Ocean. Technol. 2001, 18, 1658–1673. [Google Scholar] [CrossRef]
  29. Althausen, D.; Engelmann, R.; Baars, H.; Heese, B.; Ansmann, A.; Müller, D.; Komppula, M. Portable Raman lidar PollyXT for automated profiling of aerosol backscatter, extinction, and depolarization. J. Atmos. Ocean. Technol. 2009, 26, 2366–2378. [Google Scholar] [CrossRef]
  30. Platt, C.M.R. Temperature dependence of cirrus extinction: Implications for climate feedback. J. Geophys. Res. 1988, 93, 11051–11058. [Google Scholar] [CrossRef]
  31. Sassen, K.; Cho, B.S. Subvisual-thin cirrus lidar dataset for satellite verification and climatological research. J. Appl. Meteorol. 1992, 31, 1275–1285. [Google Scholar] [CrossRef]
  32. Chepfer, H.; Pelon, J.; Brogniez, G.; Flamant, C.; Trouillet, V.; Flamant, P.H. Impact of cirrus cloud ice crystal shape and size on multiple scattering effects: Application to spaceborne and airborne backscatter lidar measurements during lite mission and e lite campaign. Geophys. Res. Let. 1999, 26, 2203–2206. [Google Scholar] [CrossRef]
  33. Macke, A.; Mueller, J.; Raschke, E. Single scattering properties of atmospheric ice crystals. J. Atmos. Sci. 1996, 53, 2813–2825. [Google Scholar] [CrossRef]
  34. Hogan, R.J. Fast approximate calculation of multiply scattered lidar returns. Appl. Opt. 2006, 45, 5984–5992. [Google Scholar] [CrossRef]
  35. Seifert, P.; Ansmann, A.; Müller, D.; Wandinger, U.; Althausen, D.; Heymsfield, A.; Massie, S.; Schmitt, C. Cirrus optical properties observed with lidar, radiosonde, and satellite over the tropical Indian ocean during the aerosol-polluted northeast and clean maritime southwest monsoon. J. Geophys. Res. 2007, 112. [Google Scholar] [CrossRef]
  36. Kienast-Sjögren, E.; Rolf, C.; Seifert, P.; Krieger, U.K.; Luo, B.P.; Krämer, M.; Peter, T. Climatological and radiative properties of midlatitude cirrus clouds derived by automatic evaluation of lidar measurements. Atmos. Chem. Phys. 2016, 16, 7605–7621. [Google Scholar] [CrossRef] [Green Version]
  37. Gouveia, D.A.; Barja, B.; Barbosa, H.M.; Seifert, P.; Baars, H.; Pauliquevis, T.; Artaxo, P. Optical and geometrical properties of cirrus clouds in Amazonia derived from 1 year of ground-based lidar measurements. Atmos. Chem. Phys. 2017, 17, 3619–3636. [Google Scholar] [CrossRef]
  38. Krämer, M.; Rolf, C.; Anna, L.; Armin, A.; Nicole, S.; Anja, C.; Jessica, M.; Martin, Z.; Jessica, S.; Robert, H. A microphysics guide to cirrus clouds-part i: Cirrus types. Atmos. Chem. Phys. 2016, 16, 346–3483. [Google Scholar] [CrossRef]
  39. Pal, S.R.; Steinbrecht, W.; Carswell, A.I. Automated method for lidar determination of cloud-base height and vertical extent. Appl. Opt. 1992, 31, 1488–1494. [Google Scholar] [CrossRef]
  40. Winker, D.; Vaughan, M. Vertical distribution of clouds over Hampton, Virginia observed by lidar under the ECLIPS and FIRE ETO programs. Atmos. Res. 1994, 34, 117–133. [Google Scholar] [CrossRef] [Green Version]
  41. Goldfarb, L.; Keckhut, P.; Chanin, M.L.; Hauchecorne, A. Cirrus climatological results from lidar measurements at OHP (44 N, 6 E). Geophys. Res. Lett. 2001, 28, 1687–1690. [Google Scholar] [CrossRef]
  42. Reichardt, J. Optical and geometrical properties of northern midlatitude cirrus clouds observed with a UV Raman lidar. Phys. Chem. Earth B Hydrol. Oceans Atmos. 1999, 24, 255–260. [Google Scholar] [CrossRef]
  43. Sassen, K.; Campbell, J.R. A midlatitude cirrus cloud climatology from the facility for atmospheric remote sensing. Part I: Macrophysical and synoptic properties. J. Atmos. Sci. 2001, 58, 481–496. [Google Scholar] [CrossRef]
  44. Noel, V.; Chepfer, H.; Ledanois, G.; Delaval, A.; Flamant, P.H. Classification of particle effective shape ratios in cirrus clouds based on the lidar depolarization ratio. Appl. Opt. 2002, 41, 4245–4257. [Google Scholar] [CrossRef]
  45. Heymsfield, A.J.; Iaquinta, J. Cirrus crystal terminal velocities. J. Atmos. Sci. 2000, 57, 916–938. [Google Scholar] [CrossRef]
  46. Miloshevich, L.M.; Heymsfield, A.J. A balloon-borne continuous cloud particle replicator for measuring vertical profiles of cloud microphysical properties: Instrument design, performance, and collection efficiency analysis. J. Atmos. Ocean. Technol. 1997, 14, 753–768. [Google Scholar] [CrossRef]
  47. Wang, Z.; Sassen, K. Cirrus cloud microphysical property retrieval using lidar and radar measurements. Part II: Midlatitude cirrus microphysical and radiative properties. J. Atmos. Sci. 2002, 59, 2291–2302. [Google Scholar] [CrossRef]
  48. Platt, C.; Scott, S.; Dilley, A. Remote sounding of high clouds. Part VI: Optical properties of midlatitude and tropical cirrus. J. Atmos. Sci. 1987, 44, 729–747. [Google Scholar] [CrossRef]
  49. Gage, K.; Green, J. An objective method for the determination of tropopause height from vhf radar observations. J. Appl. Meteorol. 1982, 21, 1150–1154. [Google Scholar] [CrossRef]
  50. Comstock, J.M.; Ackerman, T.P.; Mace, G.G. Ground-based lidar and radar remote sensing of tropical cirrus clouds at Nauru Island: Cloud statistics and radiative impacts. J. Geophys. Res. 2002, 107. [Google Scholar] [CrossRef]
Figure 1. The altitude map with the red star denoting the LiDAR site during TIPEX III while the white triangle shows the location of Qingdao.
Remotesensing 11 00302 g001
Figure 2. Time serials of (a) depolarization ratio, (b) one depolarization ratio profile, (c) cloud base/top heights on 04 August 2014. In this figure, (d) extinction coefficient and (e) one extinction coefficient profile measured at 21:00 LST are provided, as well as the (f) relative humidity/temperature. Please note that only the depolarization ratios inside of the cirrus are provided. In the Figure (d), the extinction coefficient with multiple scattering correction and without the correction are plotted and the results are denoted by dark green solid line and blue dashed line, respectively.
Remotesensing 11 00302 g002
Figure 3. (a) Cirrus structure, (b) the histogram of cloud base/top heights, (c) cirrus middle height occurrence frequency, (d) temperature occurrence frequency and (e) cloud thickness measured by WACAL over Naqu during TIPEX III.
Remotesensing 11 00302 g003
Figure 4. (a) Distribution of optical depth and the classification, (b) Occurrence frequency of different types of cirrus clouds.
Remotesensing 11 00302 g004
Figure 5. (a) Scatter diagram and correlation of depolarization ratio and midcloud temperature, (b) Scatter diagram and correlation of depolarization ratio and cirrus middle height. The black lines indicate the fitting curves.
Remotesensing 11 00302 g005
Figure 6. (a) Scatter diagram of extinction coefficient and midcloud temperature, (b) Scatter diagram of extinction coefficient and cirrus middle height. The black lines indicate the corresponding fitting curves.
Remotesensing 11 00302 g006
Figure 7. (a) Mean extinction coefficient (b) optical depth (c) thickness and (d) depolarization ratio as a function of midcloud temperature at 10 °C intervals.
Remotesensing 11 00302 g007
Figure 8. Temperature anomalies during July and August 2014.
Remotesensing 11 00302 g008
Figure 9. Relationships between optical depth, cloud thickness, extinction coefficient, and longwave flux.
Remotesensing 11 00302 g009

