A Set of Satellite-Based Near Real-Time Meteorological Drought Monitoring Data over China
by
 and
and
Xuejun Zhang
1, 
Zhicheng Su
1,*,
Juan Lv
1,
Weiwei Liu
2,
Miaomiao Ma
1,
Jian Peng
3 and
Guoyong Leng
4,* 1
China Institute of Water Resources and Hydropower Research, Beijing 100038, China
2
State Environmental Protection Key Laboratory of Regional Eco-process and Function Assessment, Chinese Research Academy of Environmental Sciences, Beijing 100012, China
3
School of Geography and the Environment, University of Oxford, Oxford OX1 3QY, UK
4
Environmental Change Institute, University of Oxford, Oxford OX1 3QY, UK
*
Authors to whom correspondence should be addressed.
Remote Sens. 2019, 11(4), 453; https://0-doi-org.brum.beds.ac.uk/10.3390/rs11040453
Submission received: 18 January 2019
/
Revised: 15 February 2019
/
Accepted: 17 February 2019
/
Published: 22 February 2019
(This article belongs to the Special Issue Observations, Modeling, and Impacts of Climate Extremes)
Abstract
:A high-resolution and near real-time drought monitoring dataset has not been made readily available in drought-prone China, except for the low-resolution global product. Here we developed a set of near real-time meteorological drought data at a 0.25° spatial resolution over China, by seamlessly merging the satellite-based near real-time (RT) precipitation (3B42RTv7) into the high-quality gauge-based retrospective product (CN05.1) using the quantile-mapping (QM) bias-adjustment method. Comparing the standard precipitation index (SPI) from the satellite-gauge merged product (SGMP) with that from the retrospective ground product CN05.1 (OBS) shows that the SGMP reproduces well the observed spatial distribution of SPI and the pattern of meteorological drought across China, at both the 6-month and 12-month time scales. In contrast, the UN-SGMP generated by merging the unadjusted raw satellite precipitation into the gauging data shows systematical overestimation of the SPI, leaving less meteorological droughts to be identified. Furthermore, the SGMP is found to be able to capture the inter-annual variation of percentage area in meteorological droughts. These validation results suggest that the newly developed drought dataset is reliable for monitoring meteorological drought dynamics in near real-time. This dataset will be routinely updated as the satellite RT precipitation is made available, thus facilitating near real-time drought diagnosis in China.

1. Introduction
Drought is one of the most widely spread and costly natural disasters in the world [1,2]. Compared with other natural disasters, droughts tend to persist for a long time period (from months to years) and extend over a large spatial extent (from local to continental scale), with devastating impacts on agriculture production [3], water use [4], and ecosystem function [5]. China has suffered from a series of prolonged and severe droughts in the past few decades [6,7], with crop yield loss up to 25.2 billion kilograms and an average of more than 270 million people affected by water shortage per year [8]. Monitoring the development of drought in a real-time manner is fundamental for enhancing the resilience to droughts, thus benefiting the adaptation and mitigation strategies.
Typically, drought originates from a sustained precipitation deficit relative to the long-term climatology [9,10,11,12,13]. The standard precipitation index (SPI) has been widely used to characterize below-normal precipitation conditions and detect meteorological droughts at various time scales [13,14,15]. In China, the multi-decadal in-situ precipitation measurements have been used to enable historical drought analysis, in terms of the spatial-temporal variations and change trends [16,17,18,19,20]. However, ground observations are not readily available in real-time, with several months (or even longer time) latency for data post-processing, thus limiting the feasibility of real-time drought monitoring and diagnosis using ground observations [21]. Alternatively, satellite remote sensing provides a promising opportunity for large-scale measurement of precipitation with high temporal resolution and has been successfully used in numerous studies for hydrometeorological monitoring and analysis [22,23,24,25,26,27,28,29]. To date, several satellite-based precipitation products have been developed with various spaceborne and retrieval algorithms, including the Integrated Multi-satellitE Retrievals for Global Precipitation Measurement (GPM) mission (IMERG) [30], the Tropical Rainfall Measuring Mission (TRMM) Multisatellite Precipitation Analysis (TMPA) [31], the Climate Precipitation Center Morphing (CMORPH) [32], and the Precipitation Estimation from Remotely Sensed Information using Artificial Neural Networks (PERSIANN) [33]. Albeit with near real-time mode, the satellite dataset suffers from short data records (usually less than 20 y), which hampers its utility to provide detailed drought information [34]. Therefore, integrating satellite-based real-time precipitation estimates into the ground-based multi-decadal observations can effectively remove the length limitation of satellite data and enables the reliable near real-time estimation of SPI, with respect to a long-term consistent climatology (formed by the multi-decadal ground observations), for operational drought monitoring applications.
Considerable efforts have been made to seamlessly combine satellite estimates with ground observations [35,36,37]. For example, using a statistical bias-adjustment approach, Sheffield et al. [38] corrected the satellite-based near real-time (RT) data against the observational data for establishing an experimental hydrological model-based drought monitoring system. Through merging the existing historical rain gauge data, Kimani et al. [39] created consistent satellite rainfall data to facilitate long-term climate studies over East Africa. In China, past efforts have been devoted to developing conceptual models for conducting high spatial-temporal satellite-gauge integrated precipitation analyses during the warming season (May–September), when data records from the ground automatic weather stations are accessible [40,41]. However, to date, little work has been done to derive a long-term and near real-time record with consistent climatology for drought analysis due to the lack of large-extent near real-time ground observations in China. That is, high-resolution drought data that can be timely updated in near real-time is still not publically available in China, which largely limits large-scale drought monitoring and diagnoses.
To fill this gap, in this study, we aim to develop a high-resolution near real-time meteorological drought dataset by combining satellite RT precipitation with high-quality retrospective ground observations. The meteorological drought data records can be routinely updated when the satellite-based precipitation data is available in near real-time. This will enable us to track dynamics of meteorological drought in near real-time, thus providing timely information for prompt response and preparation for droughts.
2. Materials and Methods
The TRMM Multisatellite Precipitation Analysis (TMPA) real-time (RT) product provides 3 h near real-time precipitation (with about 9 h latency) for each 0.25° × 0.25° latitude-longitude grid cell across the domain of 50°S–50°N [31] and has been widely used to drive hydrological models to produce real-time hydrological conditions. The latest version of TMPA-RT product (3B42RTV7), which includes consistent precipitation estimates from March 2000 to the near real-time moment, was obtained for use in this study. A set of 56-y (1961–2016) daily observational product (CN05.1) at a 0.25° spatial resolution, derived from more than 2400 in-situ gauging stations by the Chinese Meteorological Administration (CMA), was utilized to form the long-term climatology [42]. With inclusion of more ground stations, the CN05.1 product has been recognized to be more reliable than its previous versions, which were based on about 700 gauging stations [43,44,45].
In this study, the quantile mapping (QM) bias-adjustment approach, which has been widely used in previous studies [46,47], was introduced to seamlessly merge the 3B42RTV7 satellite RT data into the CN05.1 gauging data for producing the near real-time meteorological drought data. The QM approach is used to adjust the cumulative distribution function (CDF) of 3B42RTV7 by mapping it onto the corresponding distribution of CN05.1 in the same period. In general, it includes two steps: 1) Identifying a percentile fraction for the raw data from the probability distribution fitted by the satellite data; 2) estimating the adjusted value by ‘‘looking up’’ that percentile fraction in the corresponding distribution, derived from the observations [48]. This equal-quantile transformation scheme has been demonstrated as comparable to other bias-correction methods [49]. To independently evaluate the performance of the satellite-gauge merging approach, a leave-one-out cross-validation strategy is employed when applying the QM. That is, for any given year during the satellite-gauge overlapping period (2001–2016), the daily precipitation for each month was adjusted following the corresponding satellite-gauge precipitation transformation relationship derived from the remaining 15-y period (referred to as training period). Specifically, the daily precipitation (xi,j) of month j (j = 1, 2, …, 12) in the year i (i = 2001, 2002, …, 2016) was corrected in following procedures:
1) To construct the CDF-mapping relationship in the training period. The CDFs of 3B42RTV7 (FSj) and CN05.1 (FOj) for the month j were fitted from the daily precipitation for all days within this month over the 15-y training period (with the validation year i excluded) using two-parameter Gamma distribution, respectively.
2) To replace the raw daily precipitation xi,j with the adjusted x′i,j. A cumulative probability (probi,j) for the raw satellite data xi,j was determined by its position in the CDF of 3B42RTV7 data (i.e., FSj) (see Equation (1)); thereafter, the daily precipitation (x′i,j) with the same cumulative probability (probi,j) in the CDF of CN05.1 data (FOj) was estimated and employed to replace xi,j.
probi,j = FSj (xi,j),
x′i,j = FOj−1 (probi,j),
By doing so, the satellite-based 3B42RTv7 precipitation was seamlessly combined with the gauge-based CN05.1 data, leading to the real-time daily precipitation data with a 56-y climatology. Using the satellite-gauge merged precipitation record, the near real-time meteorological drought dataset was developed from the near real-time estimation of SPI at various time scales.
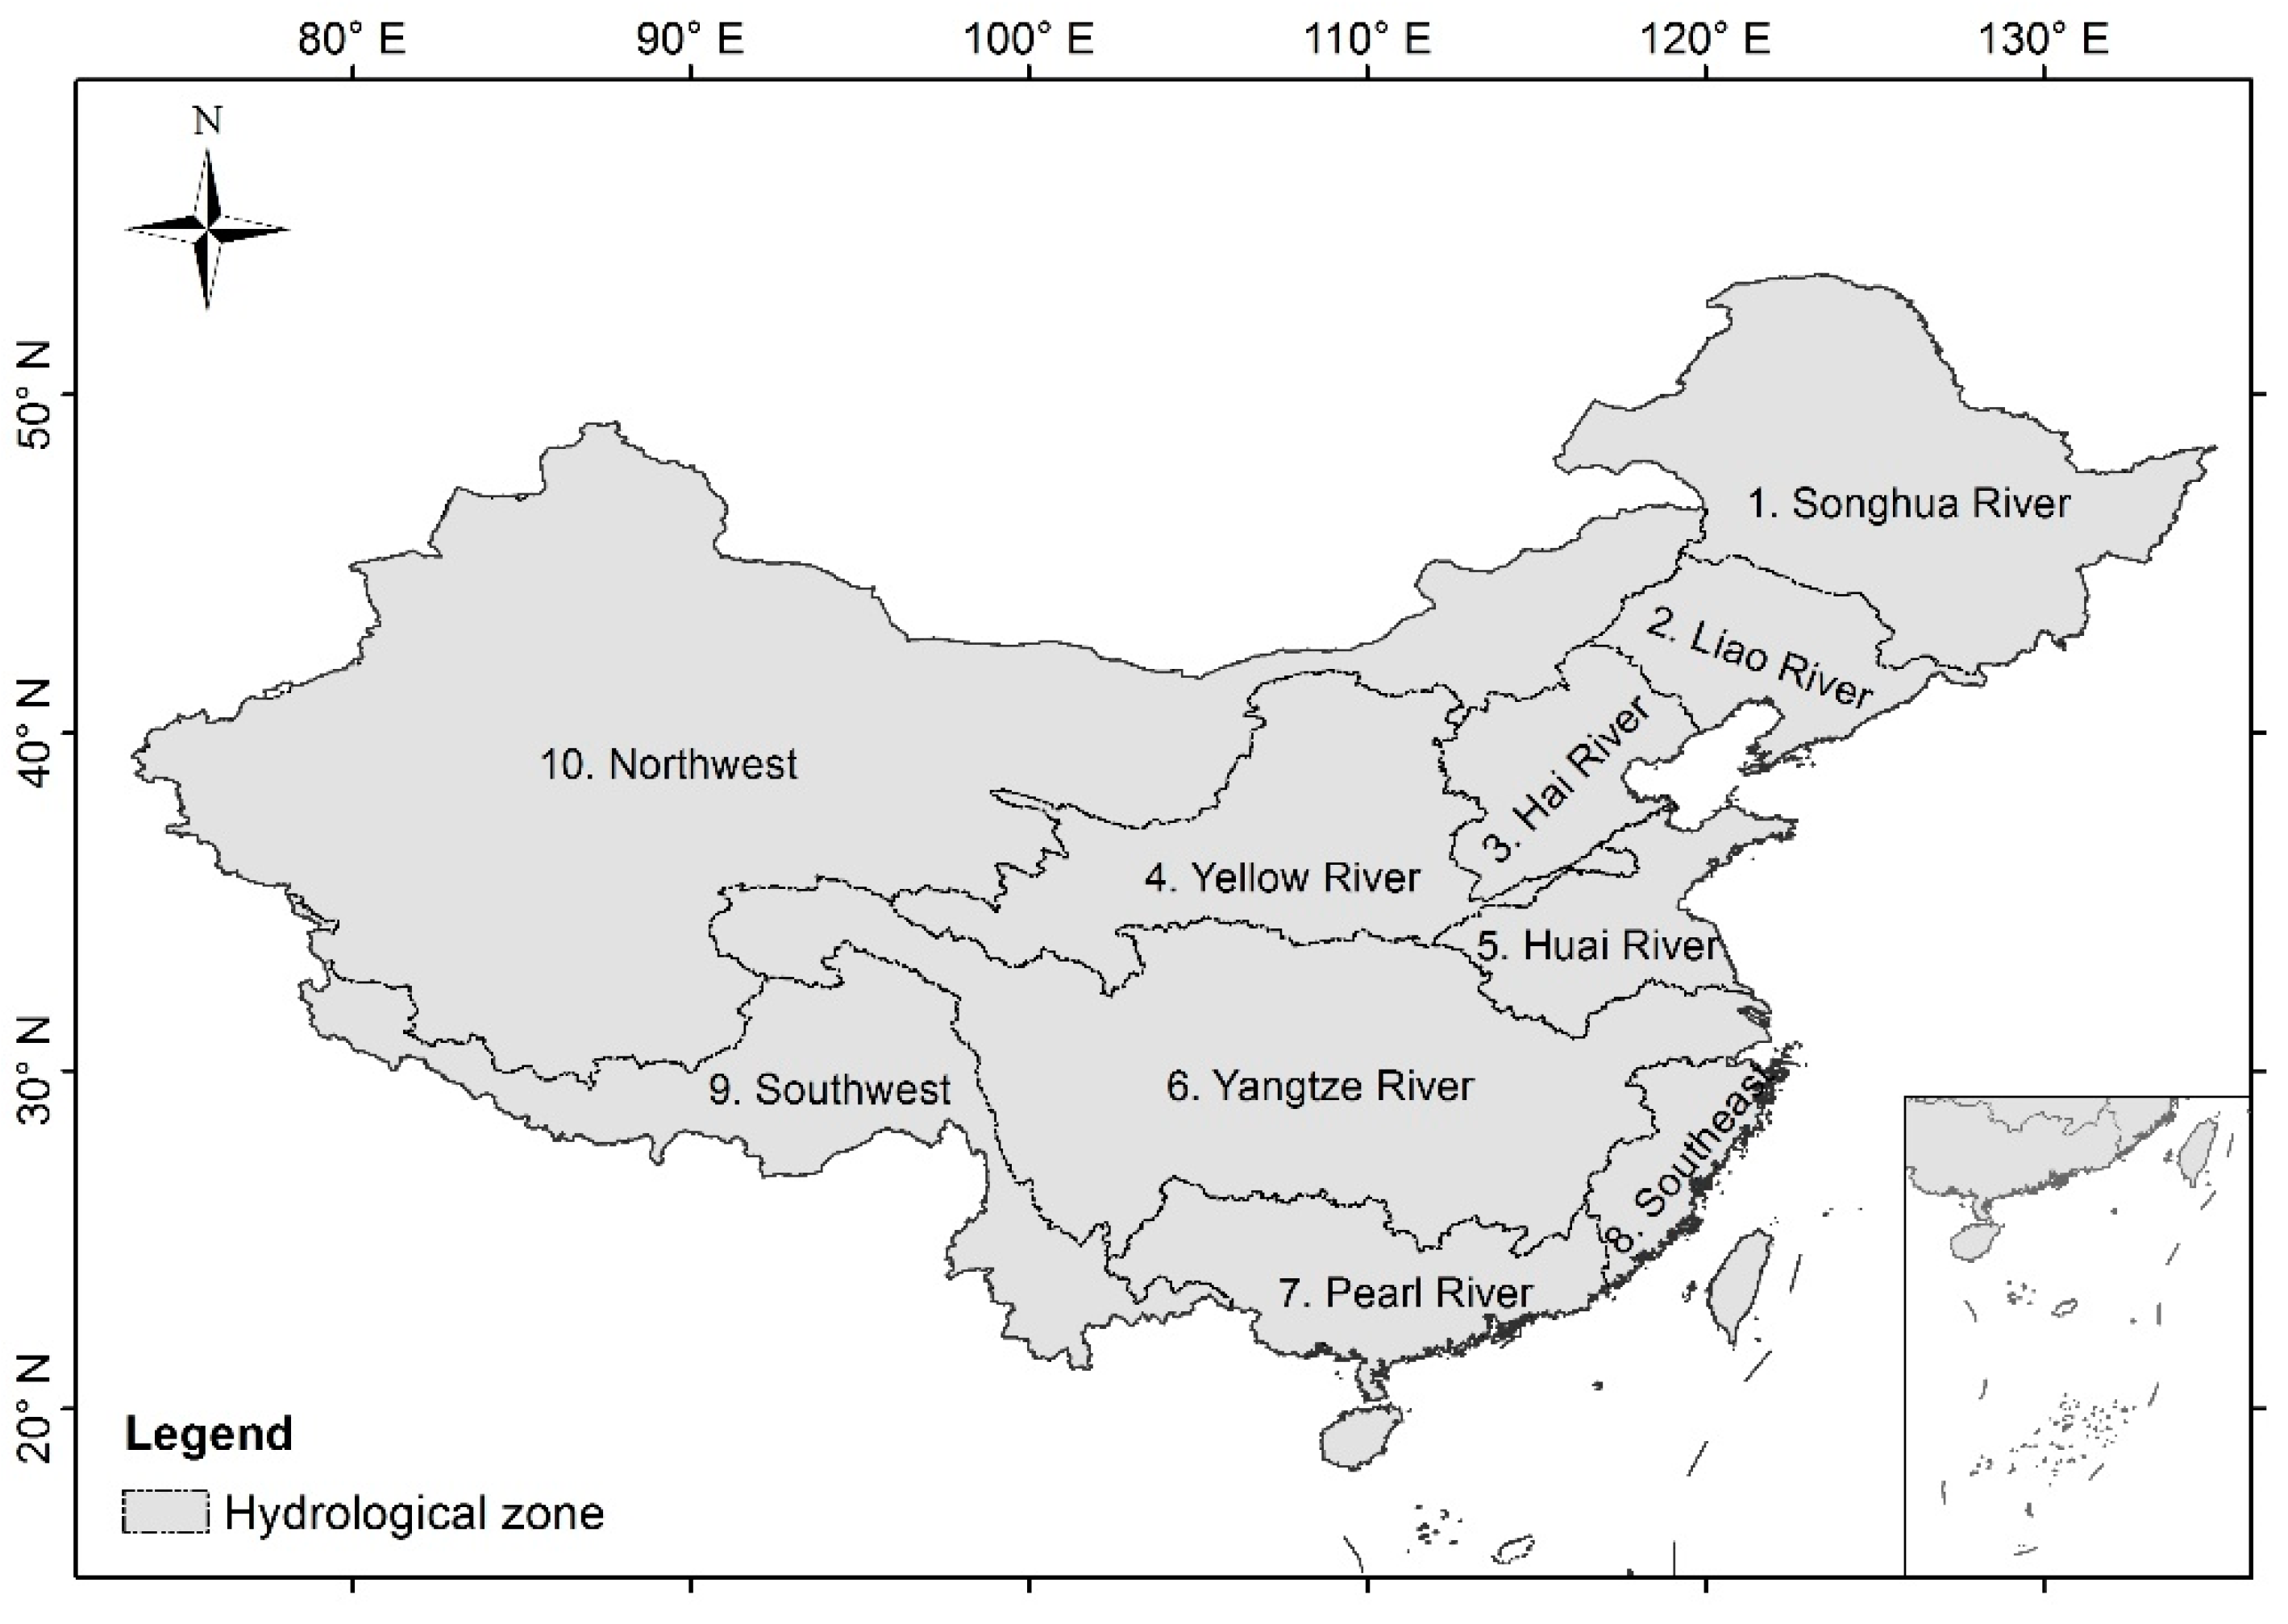
In this study, we selected two typical drought years of China, i.e., 2010 and 2012, to validate the newly developed meteorological drought monitoring data by comparing the SPI, estimated from the satellite-gauge merged data, with that from the observational CN05.1 over 10 major hydrological zones of China, including seven large river basins (Songhua River, Liao River, Hai River, Yellow River, Huai River, Yangtze River, and Pearl River) and three regions (southeast region, southwest region, and northwest region) (see Figure 1). In addition, the percentage area affected by meteorological drought, summarized from the grid cells with SPI value less than −0.8 [50], was calculated for further comparisons. Hereafter, the ground-based CN05.1 data is taken as the observational reference (referred to as OBS). The long-term and near real-time precipitation record derived through merging the adjusted 3B42RTv7 satellite data into the CN05.1 gauging data is referred to as the SGMP data, while the UN-SGMP data indicates the product created by merging the unadjusted raw satellite data into the CN05.1 observational data. Two metrics, the Nash–Sutcliffe efficiency (Ef) and relative error (Er; %), were employed to assess the performance of the meteorological drought data product. The variables Ef and Er (%) are calculated as:
where Di,o and Di,s are the ith month percentage area in meteorological drought, summarized from the OBS and SGMP (or UN-SGMP) data during the overlapping period, respectively. and are the mean annual percentage meteorological drought area estimated from the OBS and SGMP (or UN-SGMP) data during the overlapping period, respectively.
3. Results
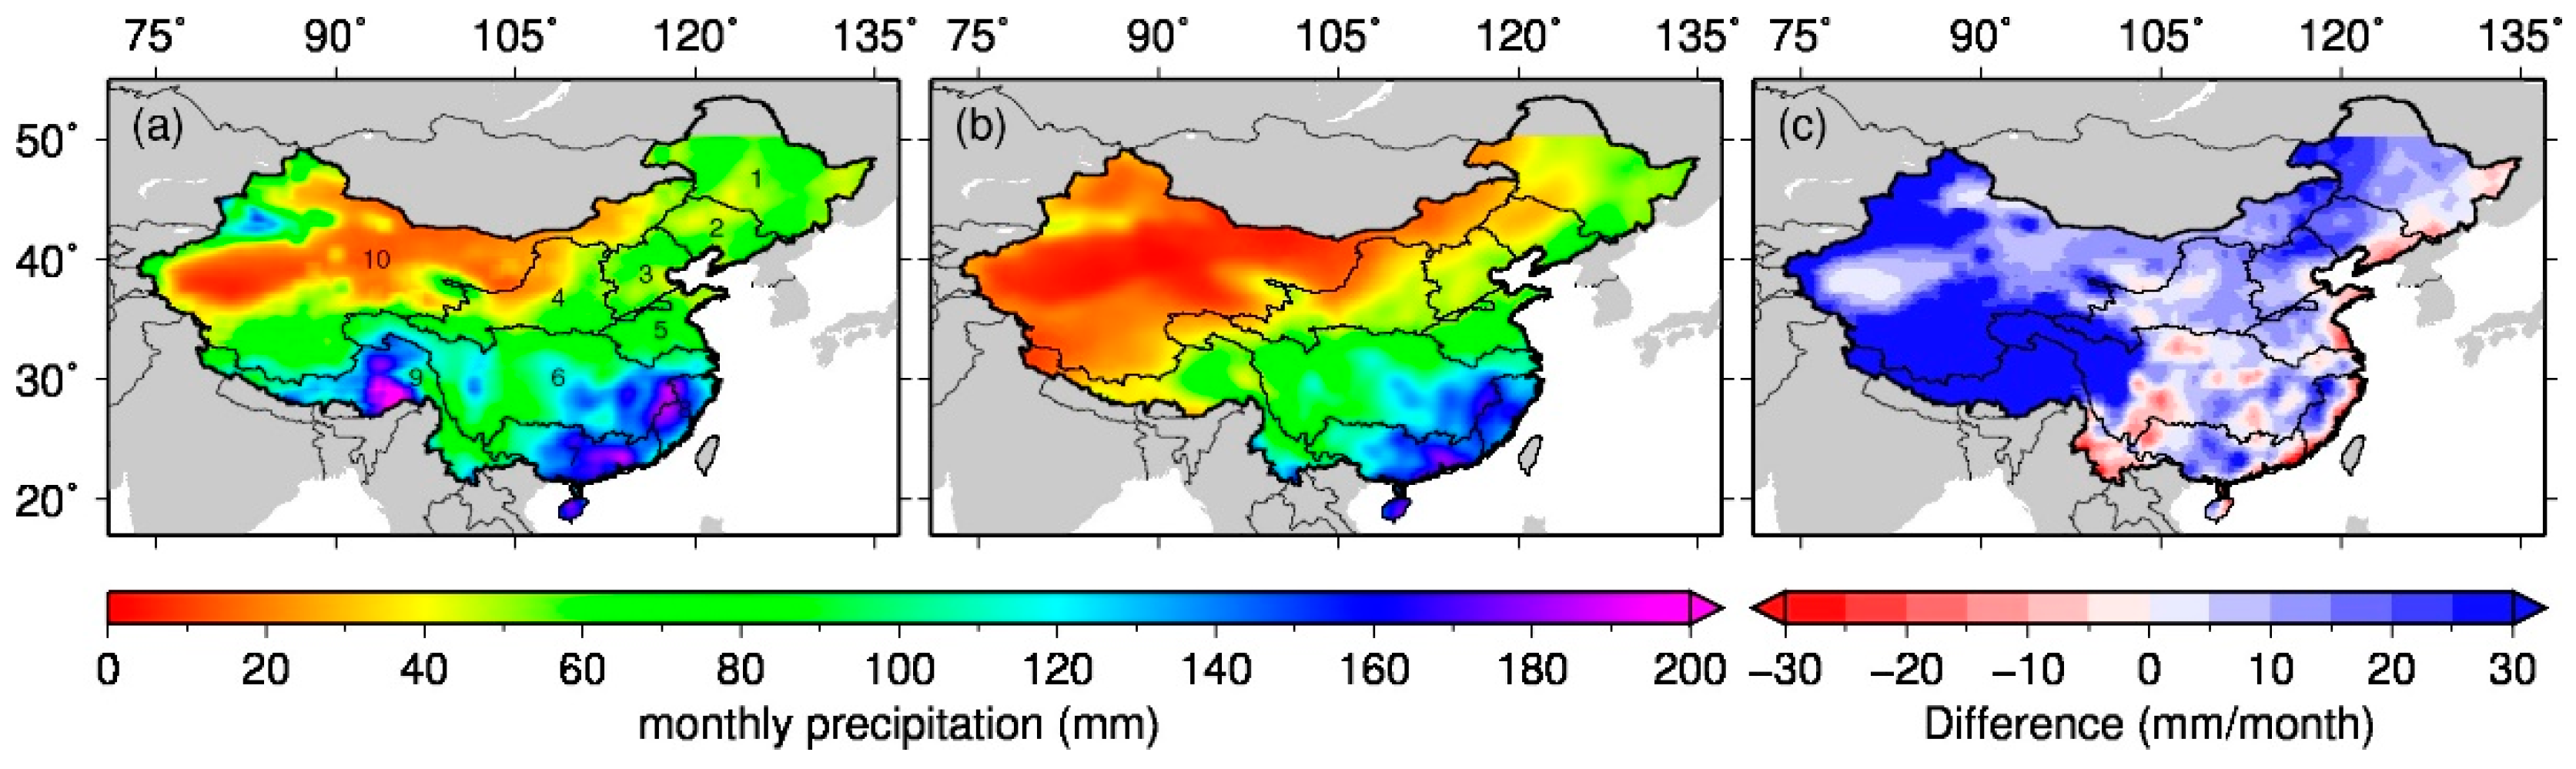
Figure 2 shows the monthly mean precipitation from the raw unadjusted satellite-based 3B42RTv7 data and ground observations, across China, during the overlapping period. Overall, the satellite RT data (Figure 2a) bears some resemblance with the ground-based precipitation in terms of the spatial distribution pattern (Figure 2b), with monthly precipitation decreasing from Southeast to Northwest China. However, there is a positive bias in most of the country, inherent in the raw satellite data compared to the observational data (Figure 2c). Specifically, a positive bias greater than 10 cm (per month) is found in more than three quarters (76%) of the grid cells, while ~25% of grid cells show a difference larger than 30 cm (per month) which are mainly located in the drought-prone regions of China including the northeast region (e.g., Western Liao River), southwest, and northwest regions.
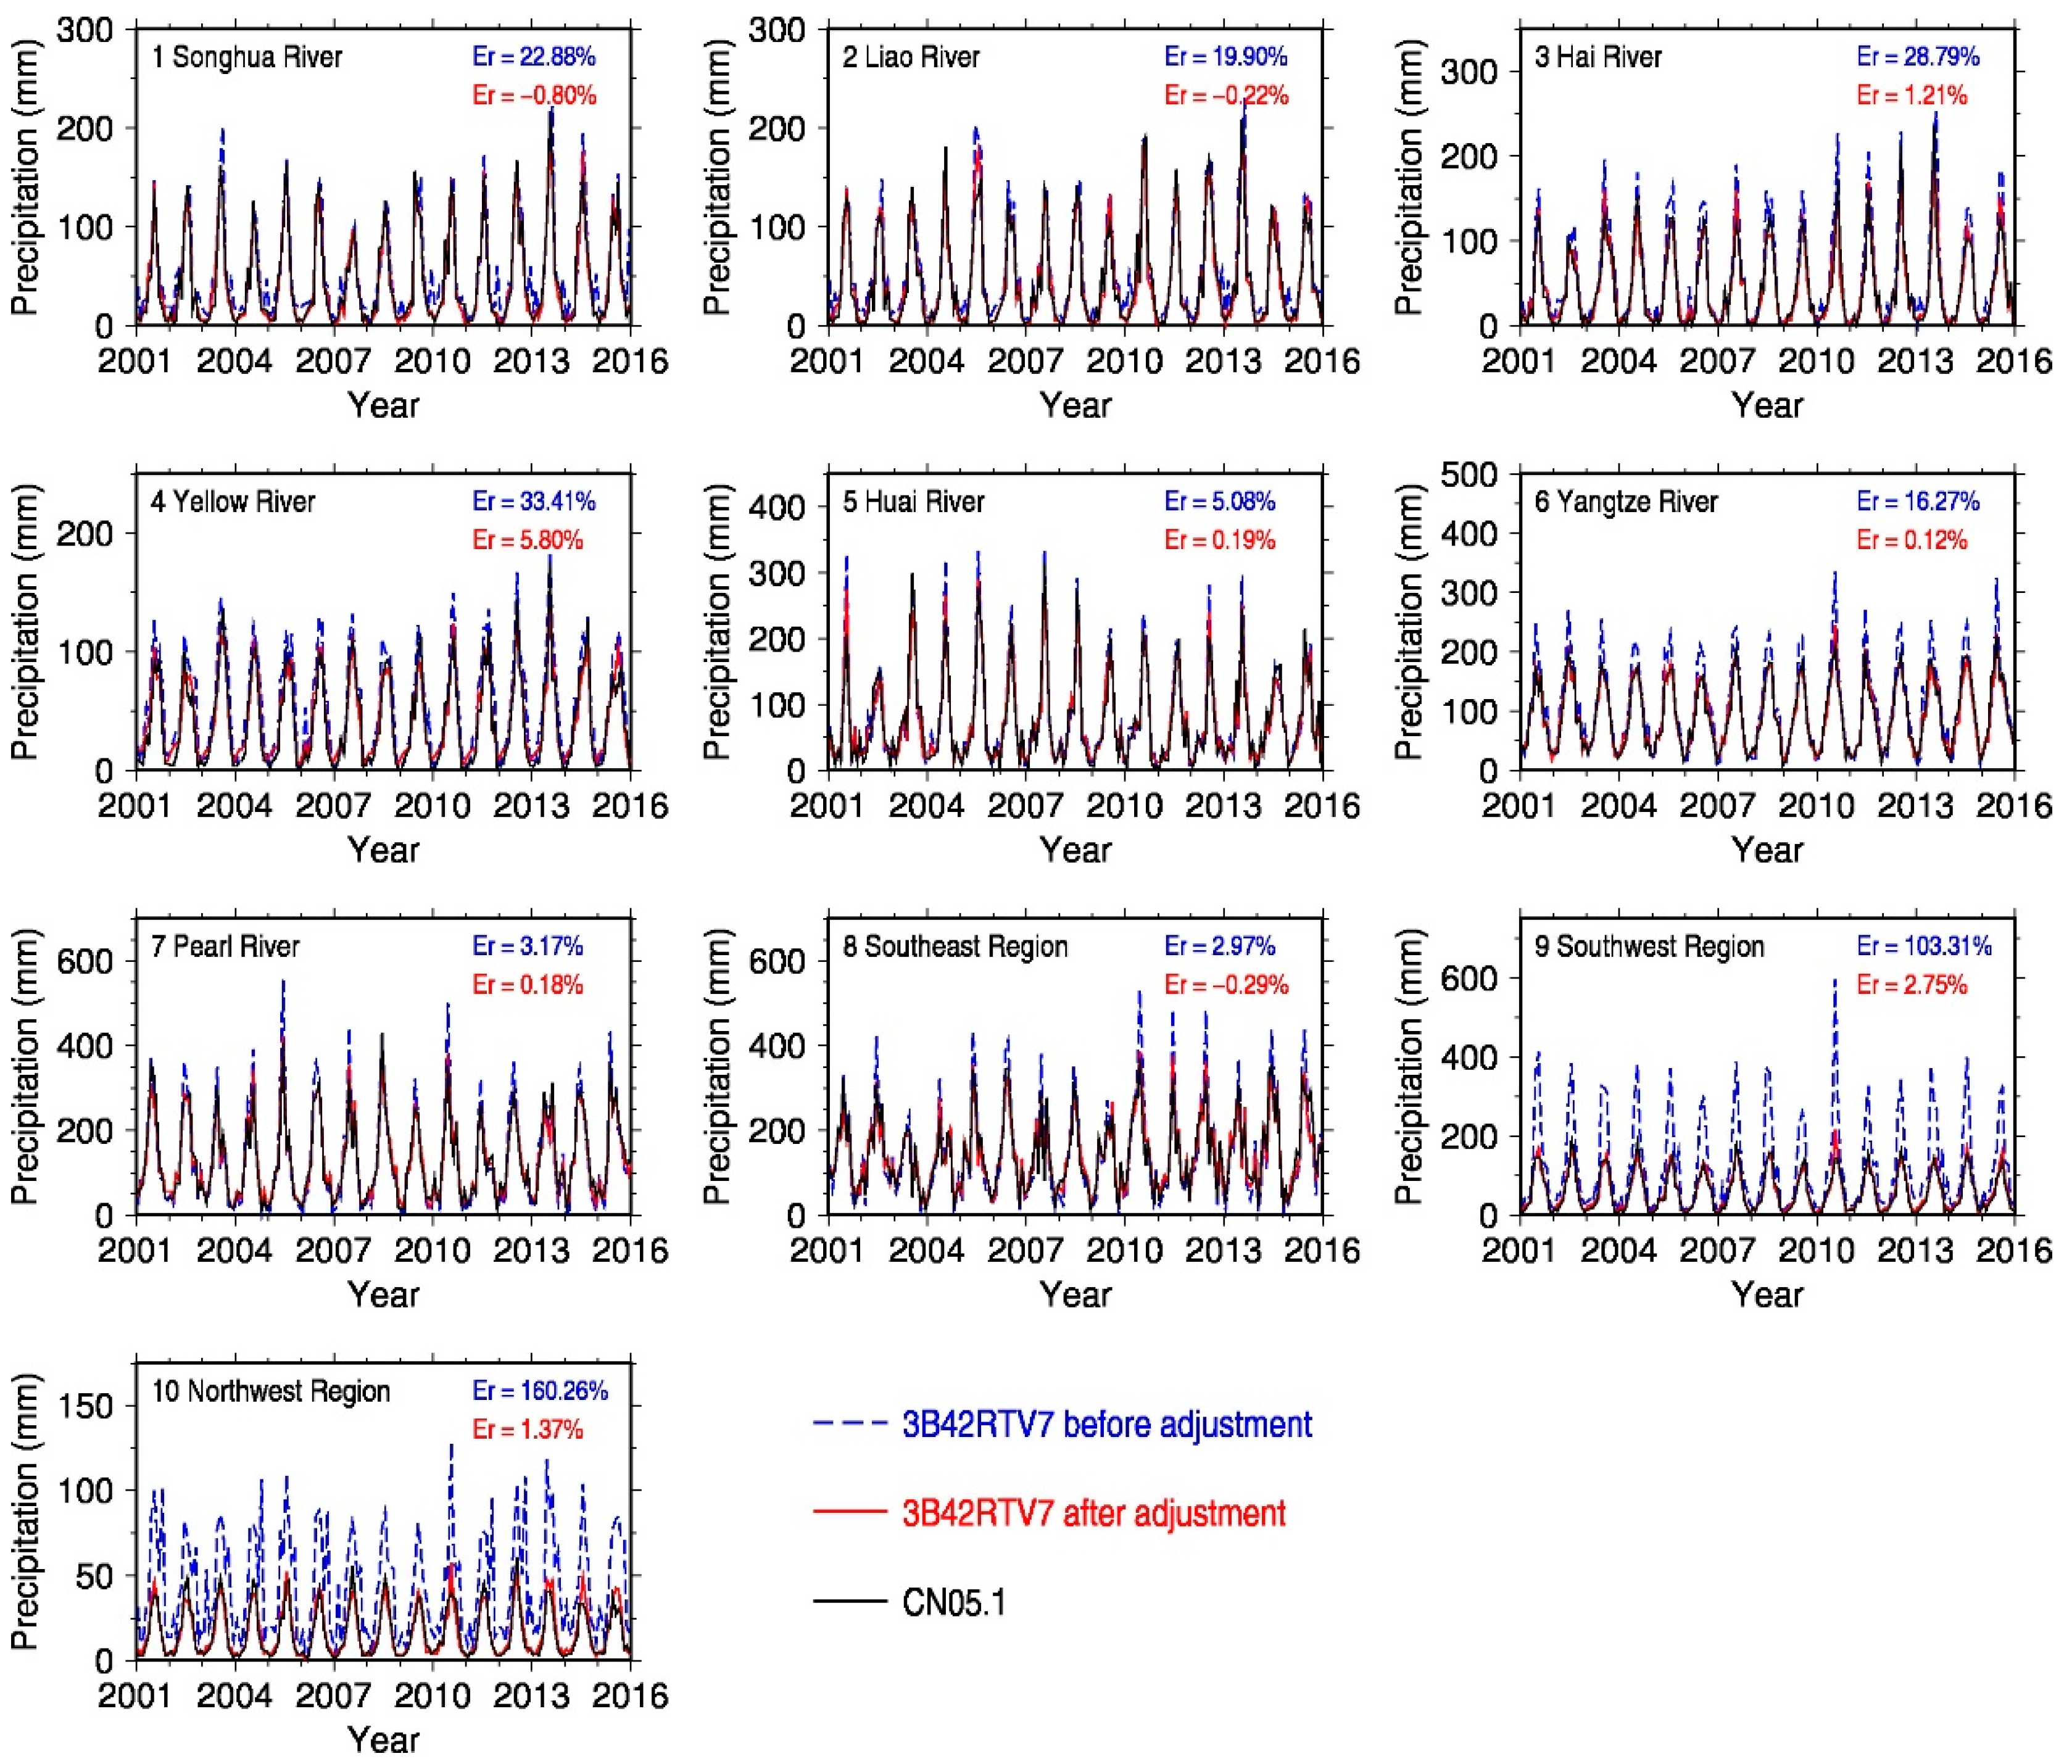
Figure 3 shows the 16-y monthly precipitation from the 3B42RTV7 (blue line), adjusted 3B42RTV7 (red line), and the gauge-based CN05.1 data (black line) for each of the 10 hydrological zones. Compared with the gauge-based CN05.1 data, a systematic overestimation of 3B42RTV7 precipitation was found for all zones. In Northern (Songhua River, Liao River, Hai River, and Yellow River) and western mountainous areas of China (Southwest and Northwest China), the relative bias (Er) is more than 20% and, in extremes cases, exceeds 100%, indicating a significant inconsistency between satellite remote sensing and ground gauges. With bias-adjustment, the systematic overestimation of 3B42RTv7 was effectively removed, with the relative bias less than 6% for all zones. This suggests that the bias-adjustment can effectively remove the satellite-gauge (3B42RTv7–CN05.1) inconsistency arising from different data sources.
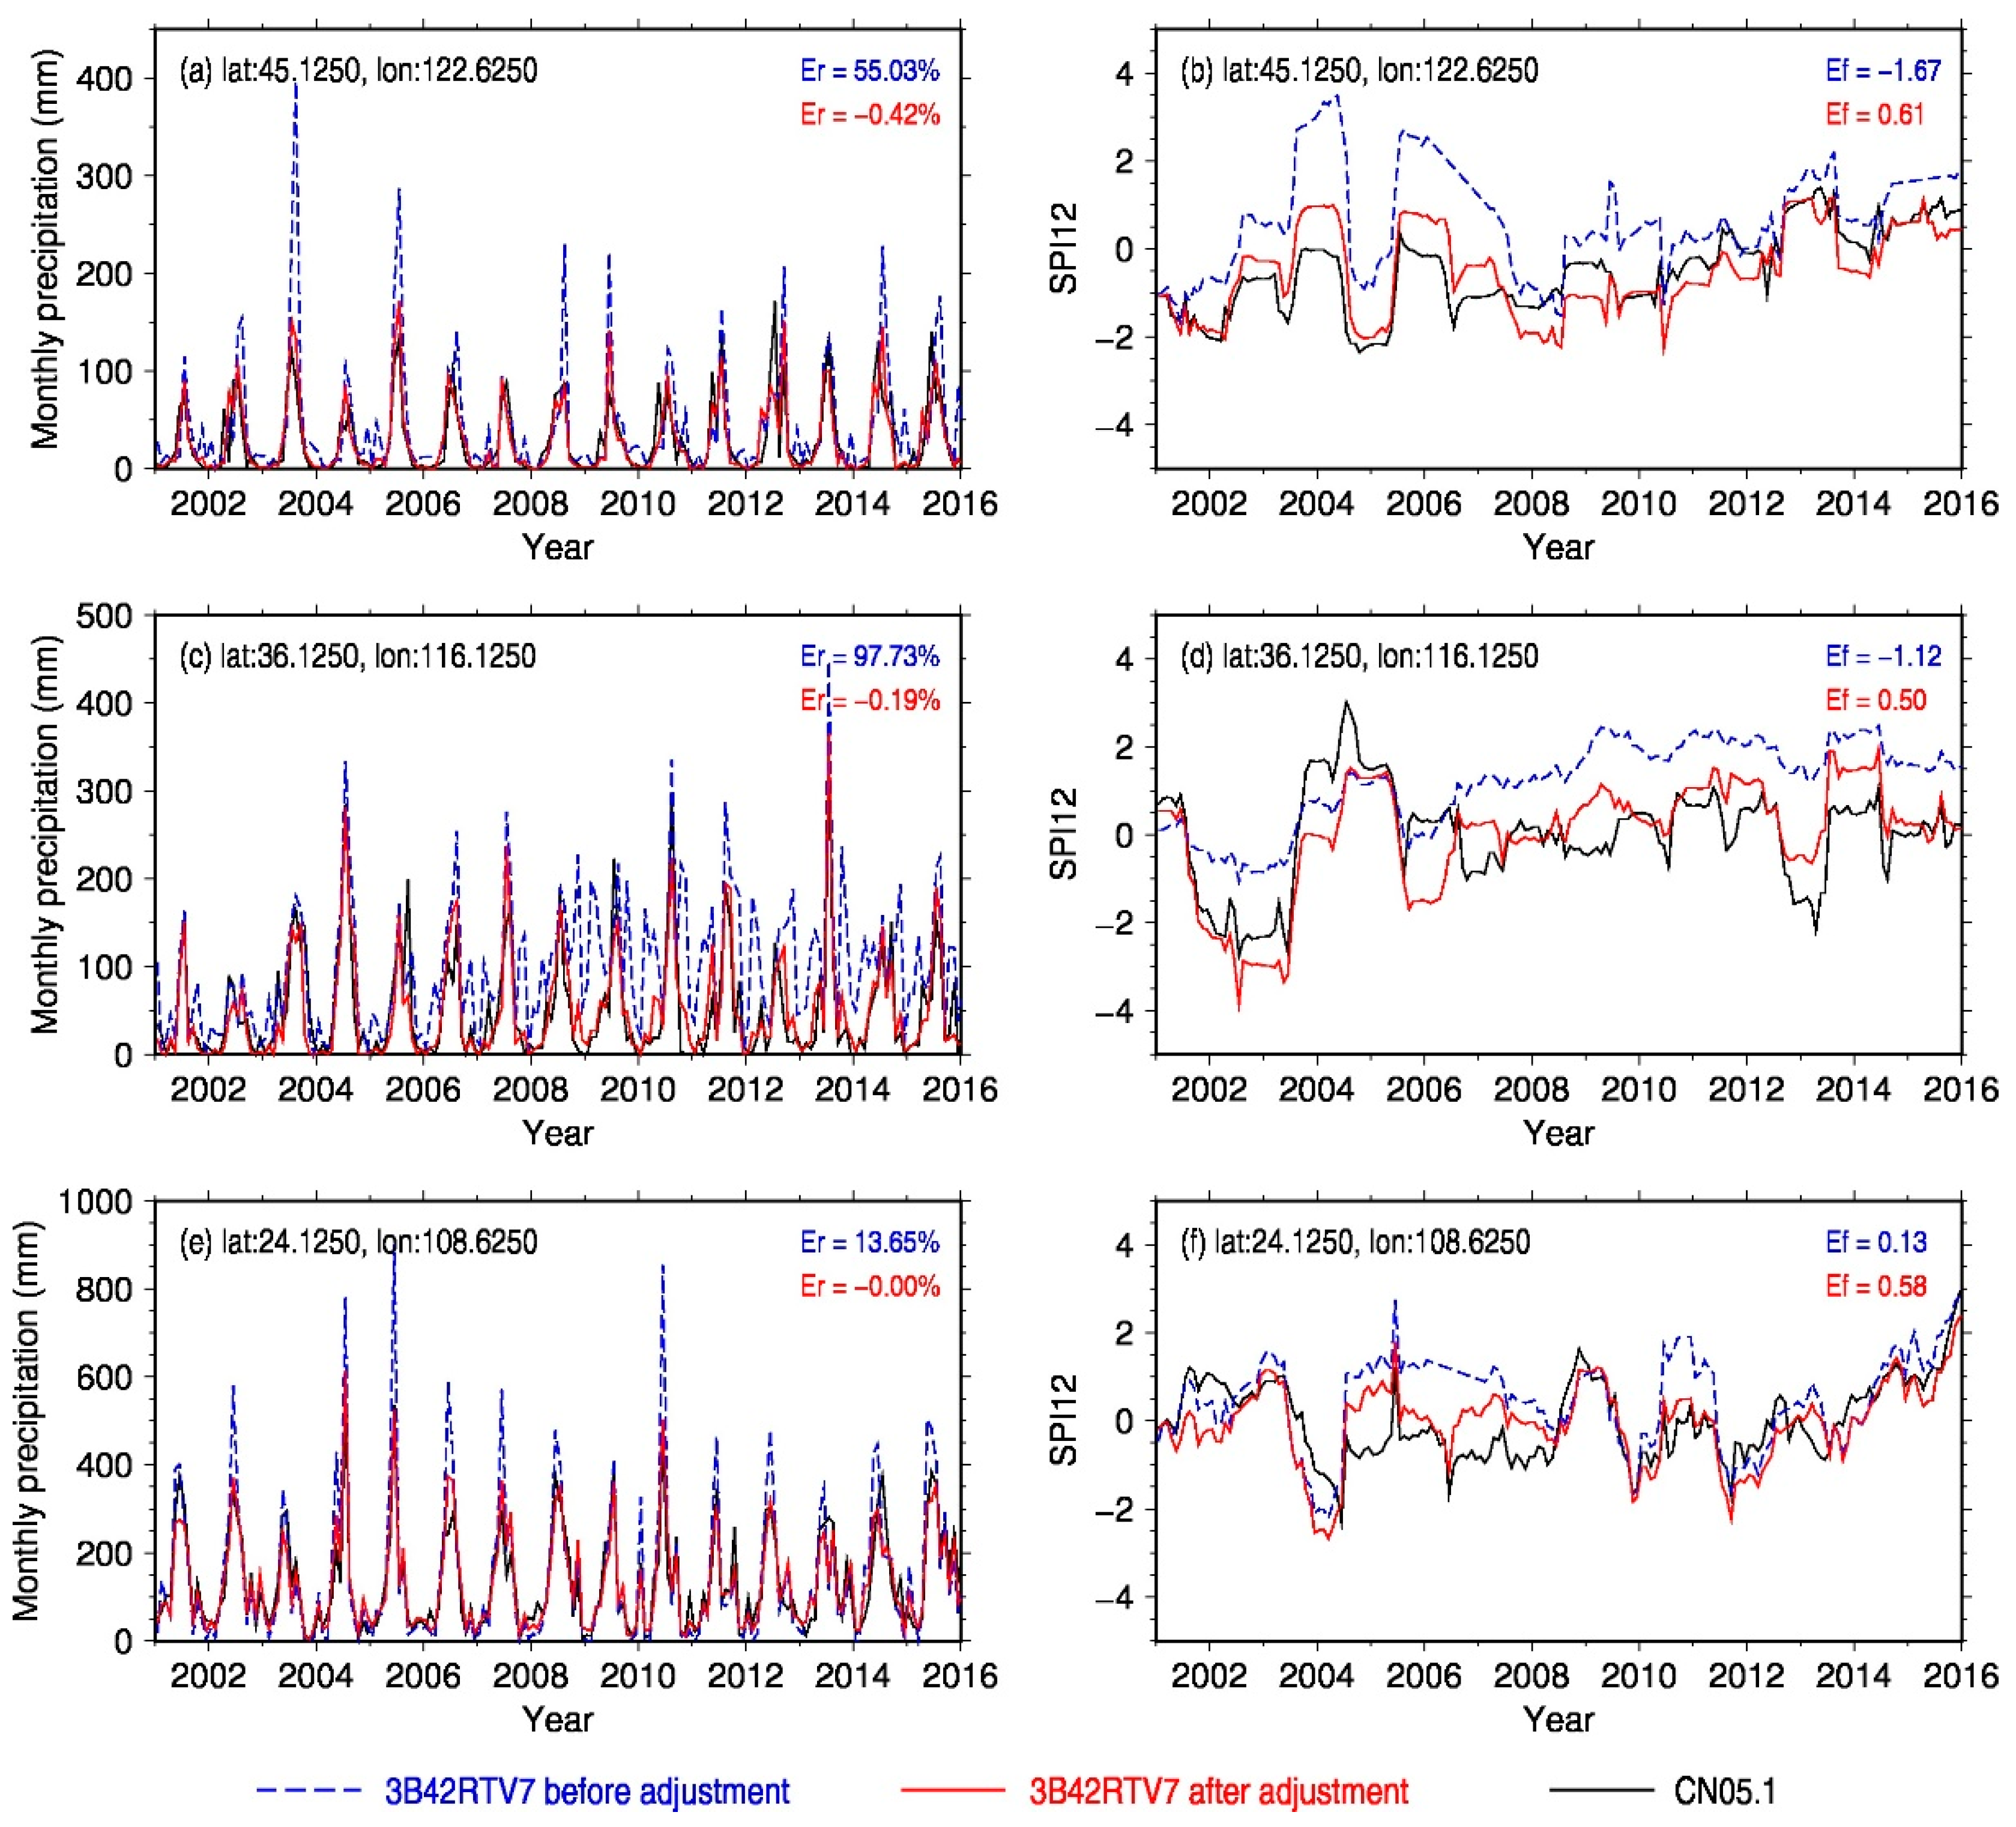
Figure 4 presents the monthly precipitation and the 12-month SPI (SPI12) derived from the satellite-gauge merged data before and after adjustment at three typical locations in North, Central and South China, respectively. Comparing with the observational CN05.1 data, the 3B42RTv7 shows an evident positive bias of 55%, 97%, and 13%, respectively, at each of the selected grid cells. As expected, the 12-month SPI estimated from the UN-SGMP fails to capture the inter-annual variability of SPI from the observational data (i.e., CN05.1), with the Nash–Sutcliffe efficiency (Ef) falling to the unsatisfactory catalog (less than zero). After the adjustment, the positive bias of monthly precipitation has been largely removed with the Er value around zero. The estimated 12-month SPI (using the SGMP data) have also well reproduced the observations, with the Ef no less than 0.50. This suggests that seamlessly merging the adjusted satellite RT data into the gauging data can benefit reliable estimation of SPI in near real-time mode.
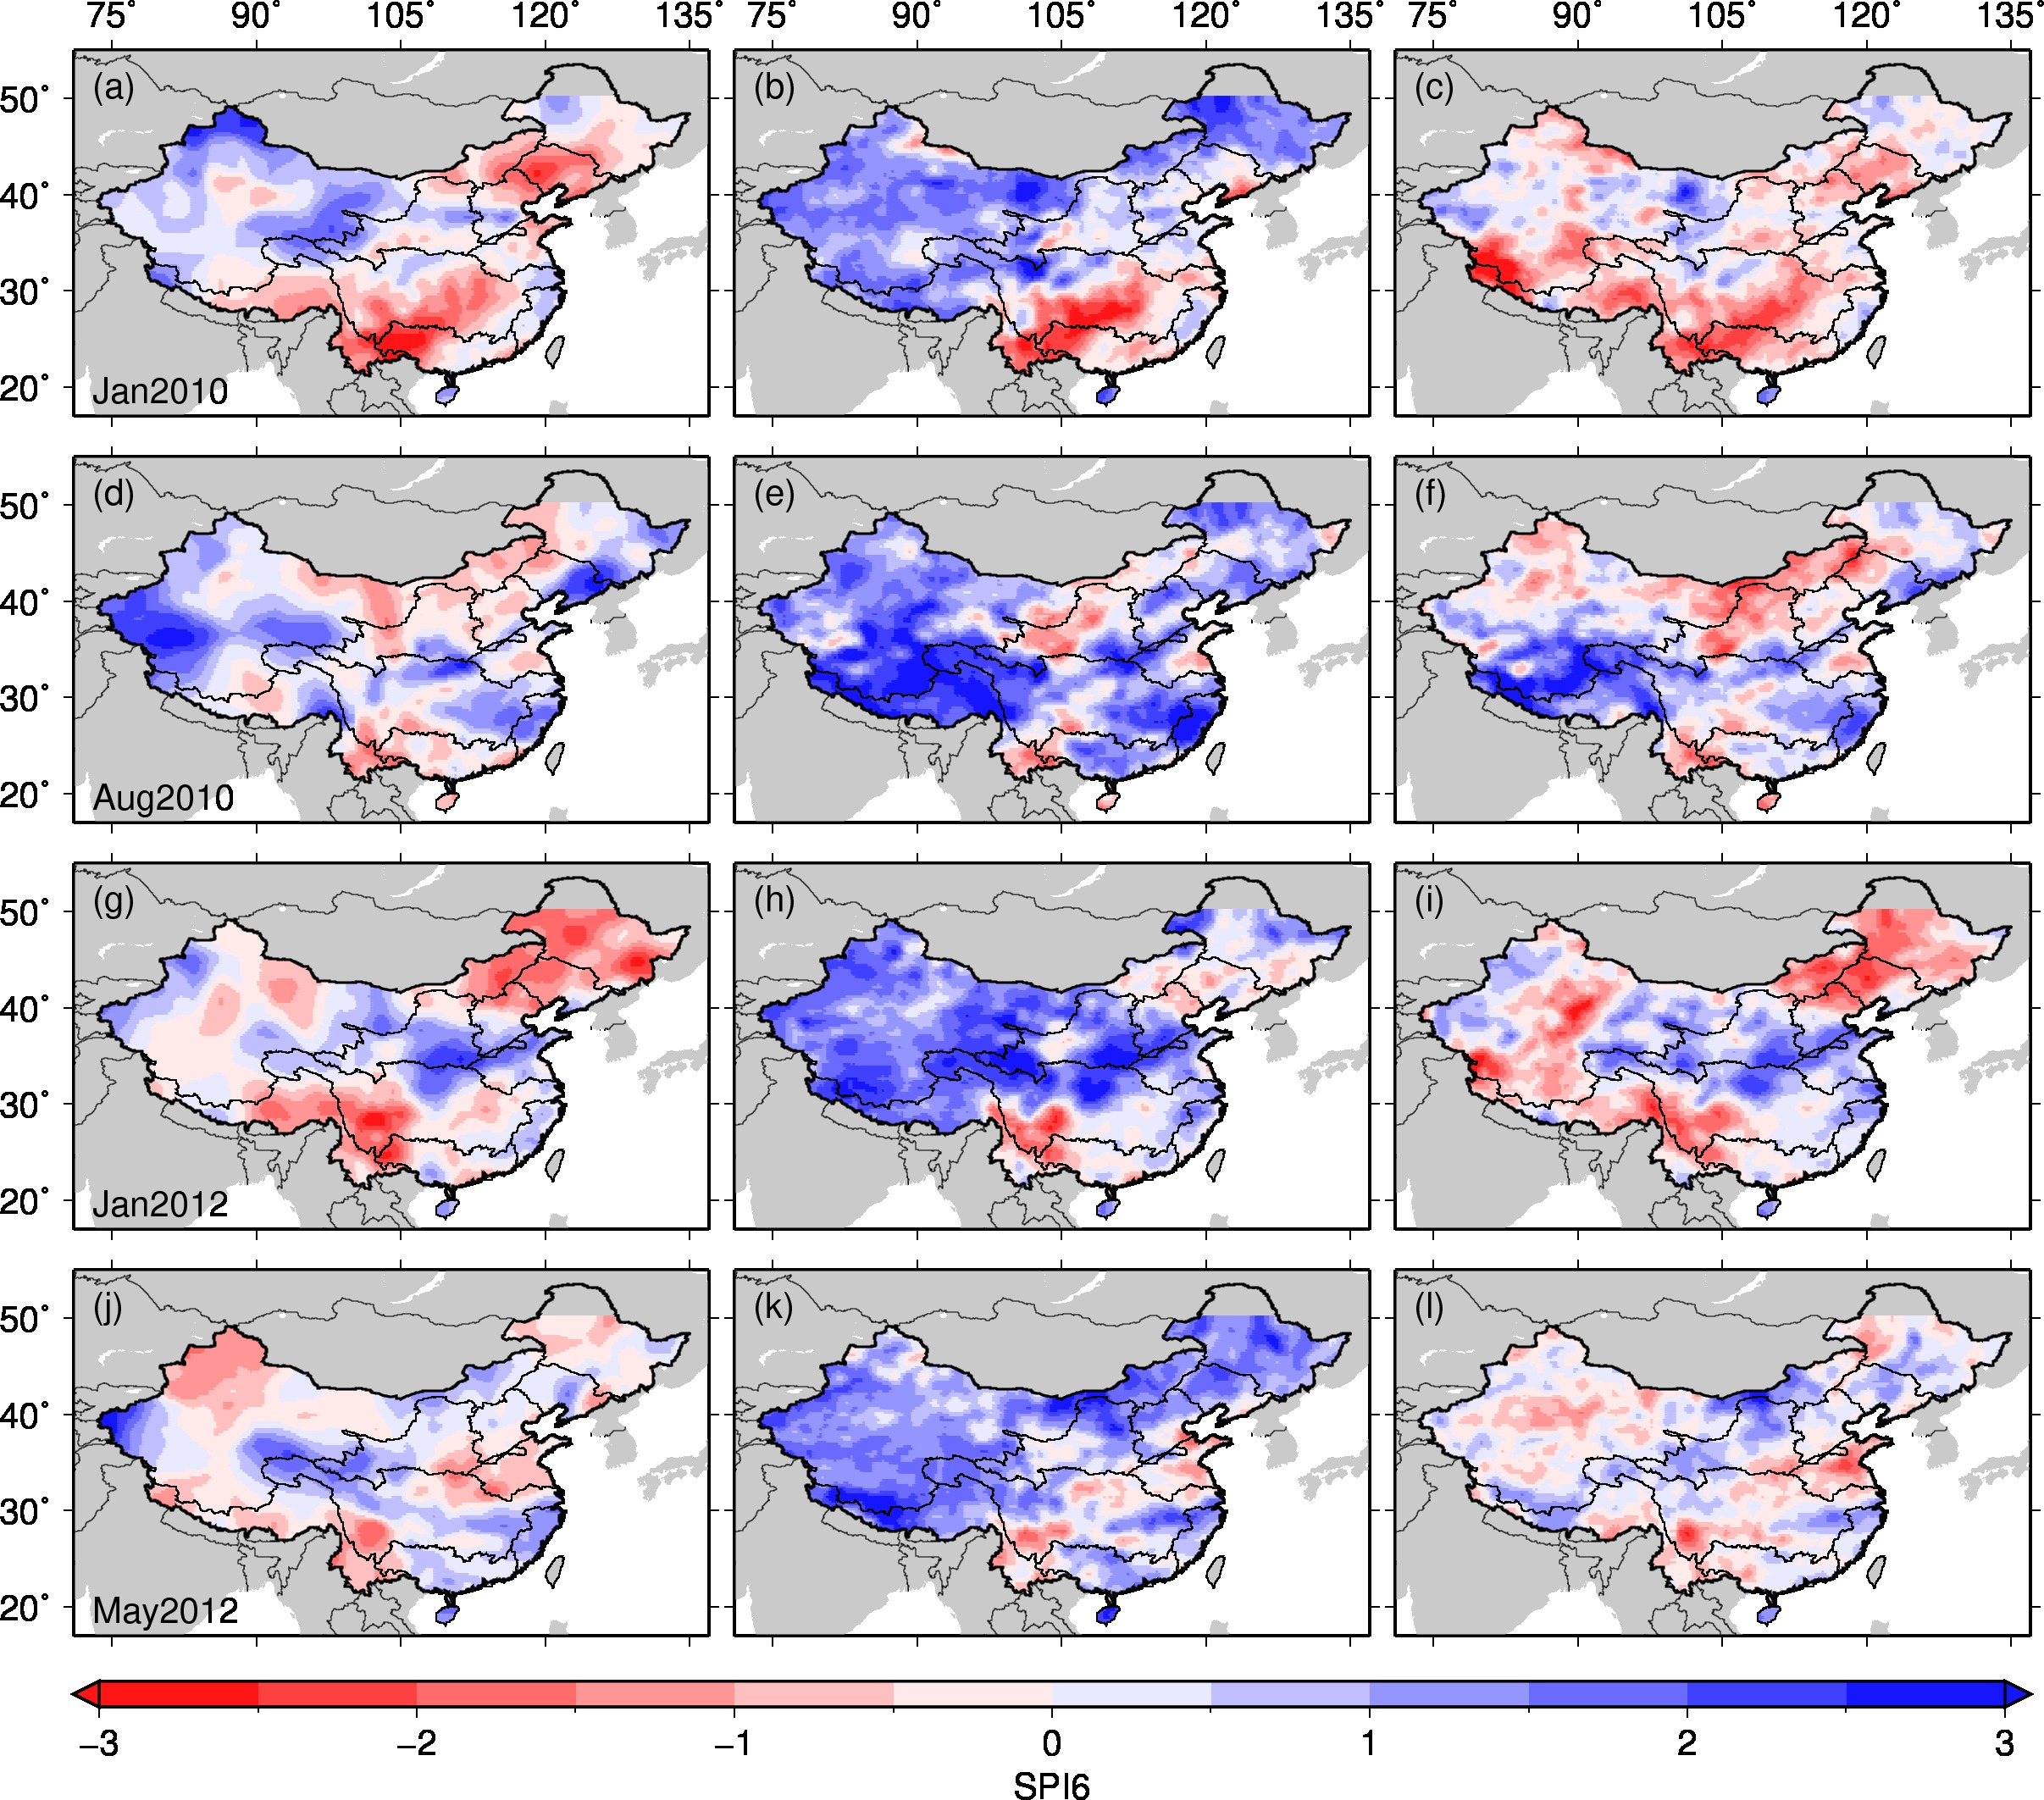
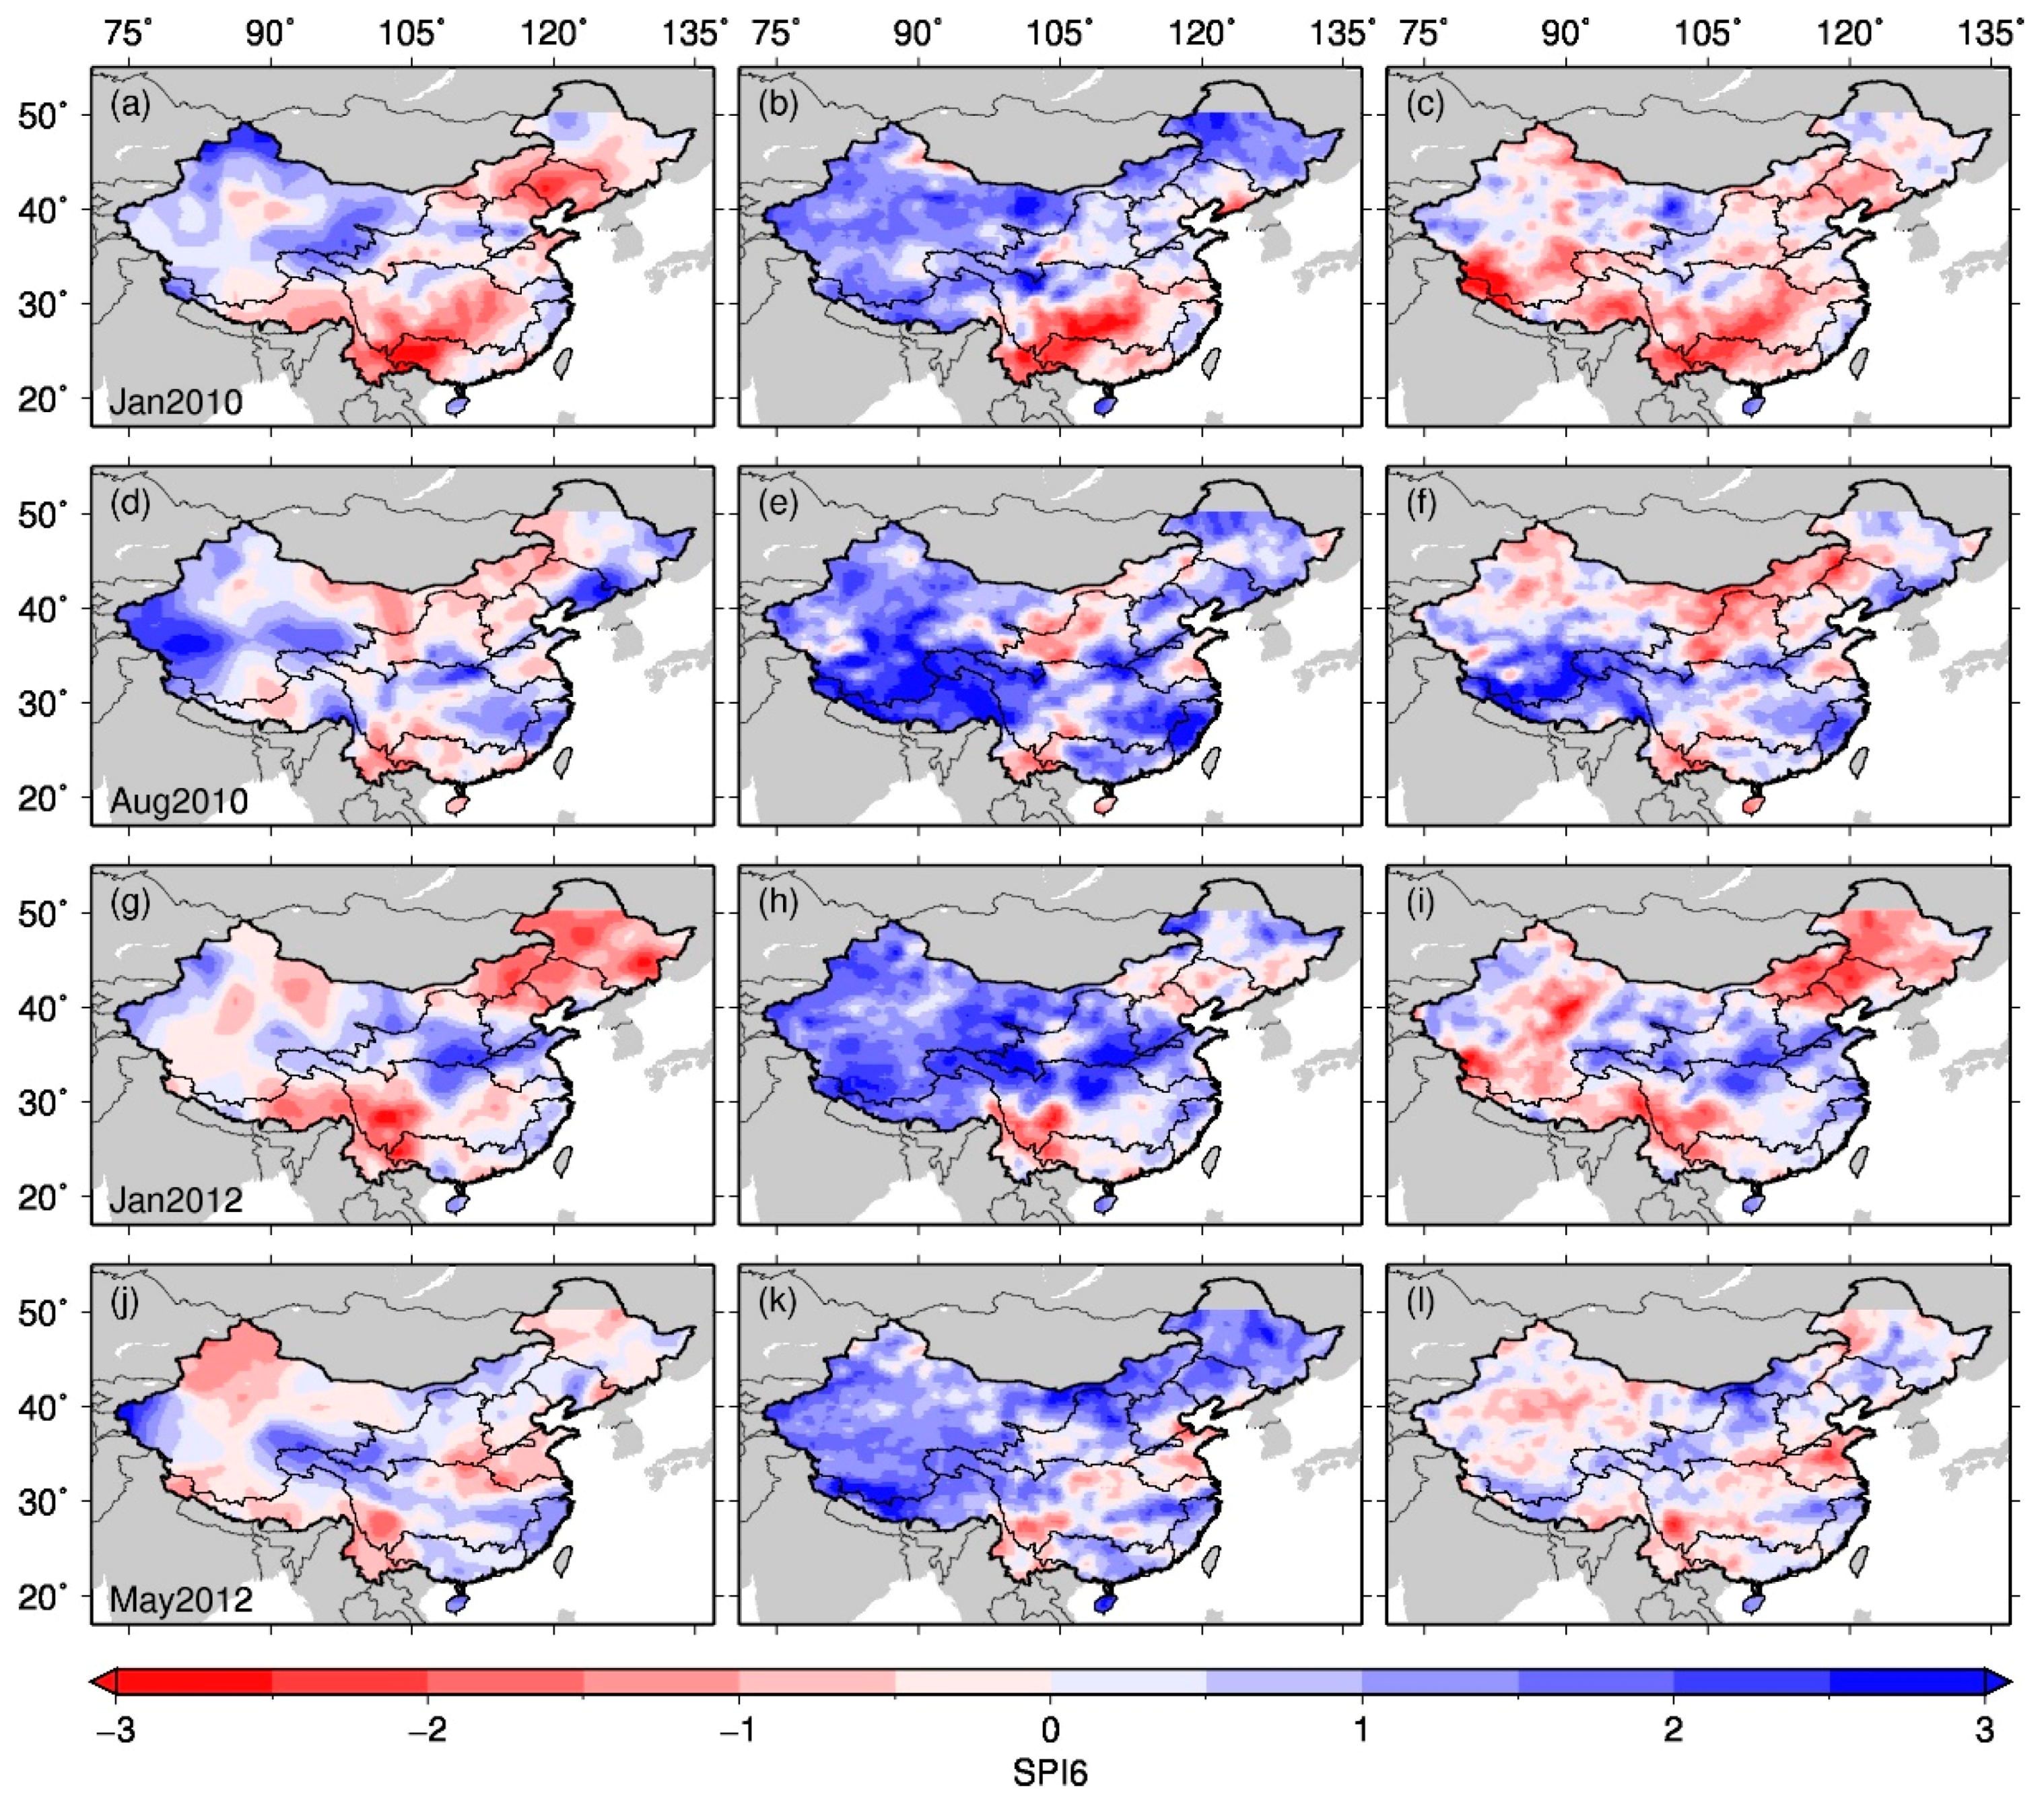
Figure 5 compares the 6-month SPI from the SGMP (and UN-SGMP) data with that estimated from the 61-y gauge-based CN05.1 product (i.e., OBS) in two drought months from 2010 (January and August) and from 2012 (January and May), respectively. Consistent with the observed drought pattern in January 2010 (Figure 5a), two distinct meteorological droughts in the southwest and northeast regions are identified from the SGMP (Figure 5c), while meteorological drought in the northeast is not detected by the UN-SGMP data (Figure 5b). In August 2010, the SGMP (Figure 5f) and OBS data (Figure 5d) both indicate considerable drying in part of North (mostly in Inner Mongolia) and Southwest China (mostly in Yunnan), while such patterns are not reproduced by the UN-SGMP product (Figure 5e). The January 2012 SPI estimated from the SGMP (Figure 5g) and OBS (Figure 5i) bear an overall resemblance with meteorological droughts identified over most of the northeast, southwest, and northwest zones. In contrast, the UN-SGMP tends to exhibit a wide-spread wetting (SPI > 0) in January, except for a small portion of the southwest region (Figure 5h). Similarly, in May 2012 (Figure 5j–l), the estimated meteorological drought pattern, based on SGMP data, is found to be more realistic than the UN-SGMP. In addition, the percentage area in meteorological drought estimated from the SGMP is close to that from the OBS data, which amounts to 43% and 33% in January 2010, 23% and 19% in August 2010, 34% and 35% in January 2012, and 20% and 24% in May 2012, respectively (see Table 1).
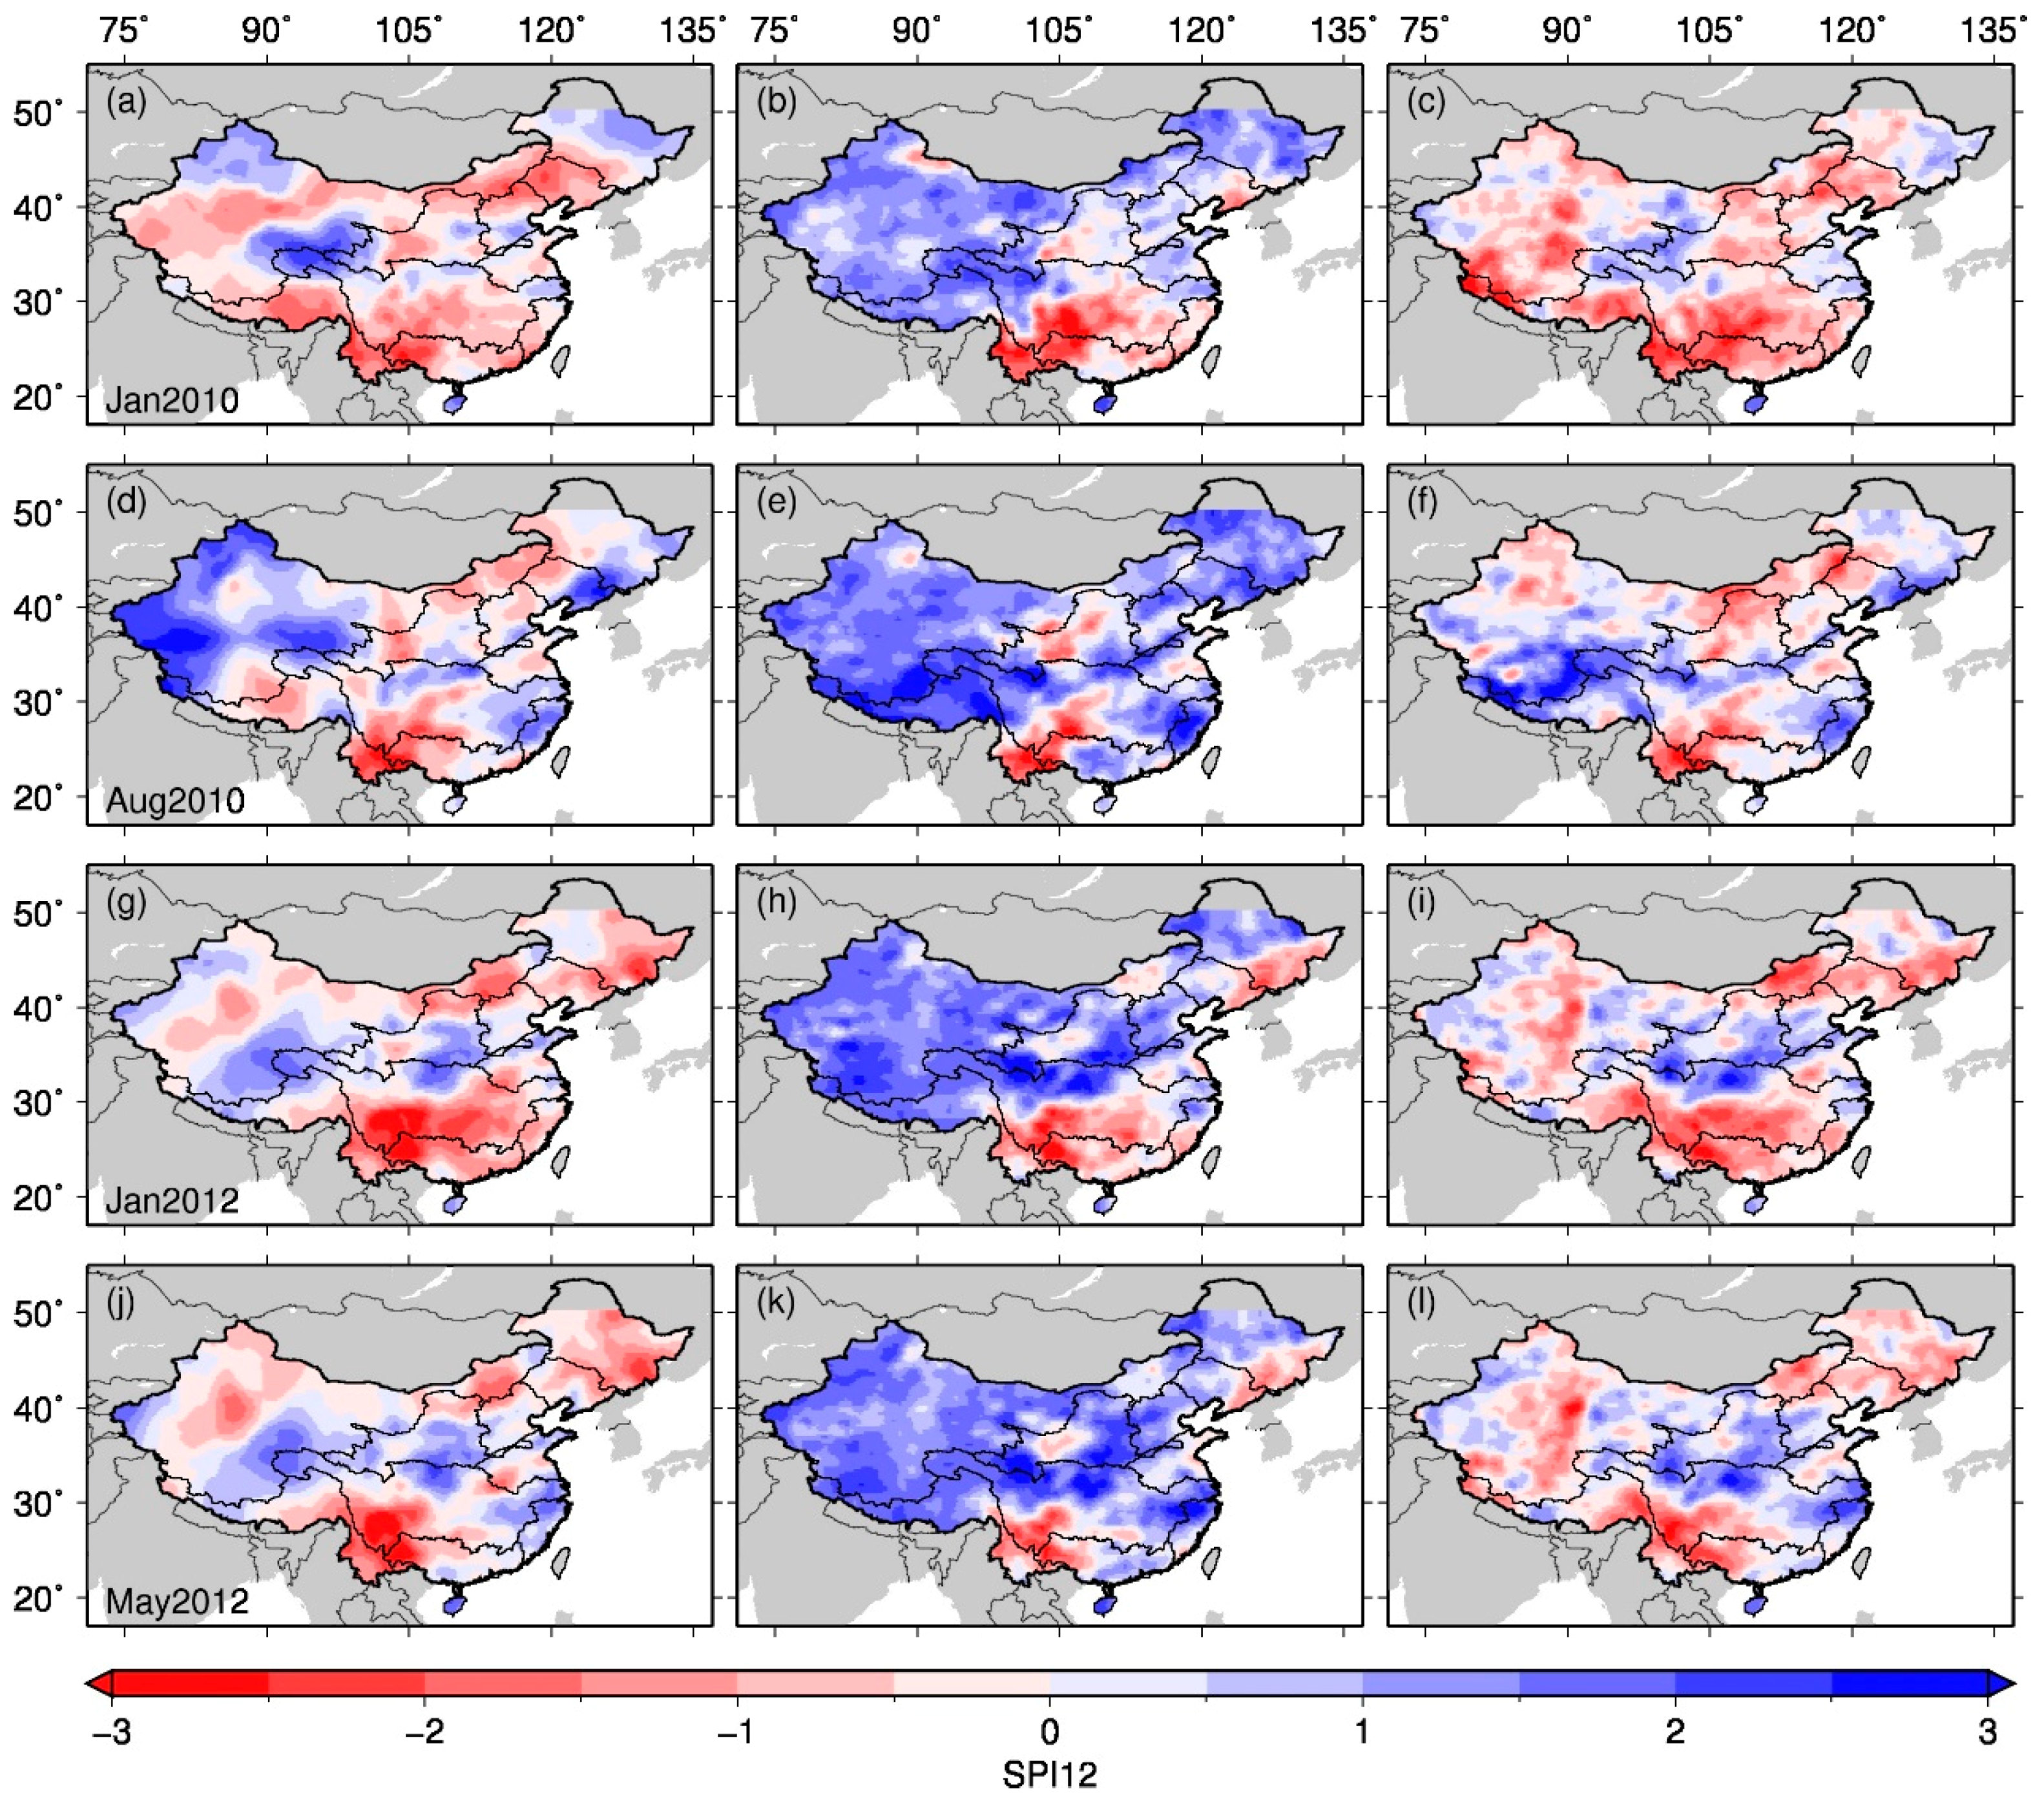
Figure 6 shows the spatial pattern of 12-month SPI (SPI12) estimated from the UN-SGMP, SGMP, and the reference OBS data in two drought months from 2010 (January and August) and from 2012 (January and May). Overall, the SGMP data is found to outperform the UN-SGMP in reproducing the spatial distribution pattern of 12-month SPI from OBS. Overall, the UN-SGMP data tends to overestimate SPI in large areas in the four year-month combinations, leading to unrealistic meteorological drought diagnoses. For instance, two severe meteorological droughts across a large portion of South China and Northeast China in January 2012 are detected in the OBS precipitation data (Figure 6g), while significant underestimation of spatial extent under meteorological drought is found for the UN-SGMP (Figure 6h). In contrast, the SGMP data have captured the observational patterns well, with meteorological droughts identified in most of South China (stretching from the southwest inland to the southeast coast) and the southern part of the northeast (Figure 6i). With adjustment (i.e., from the UN-SGMP to SGMP), the fractional area of meteorological drought increases from 16% to 50% in January 2010, from 9% to 24% in August 2010, from 17% to 40% in January 2012, and from 9% to 32% in May 2012, respectively, which is consistent with the estimates (49%, 25%, 40%, and 32%) from the OBS data (see Table 1). The above analyses on the 6-month and 12-month SPI (SPI6 and SPI12) both suggest that the SGMP data, with the satellite-gauge gap bridged, can reproduce the observed spatial patterns of SPI and meteorological drought well.
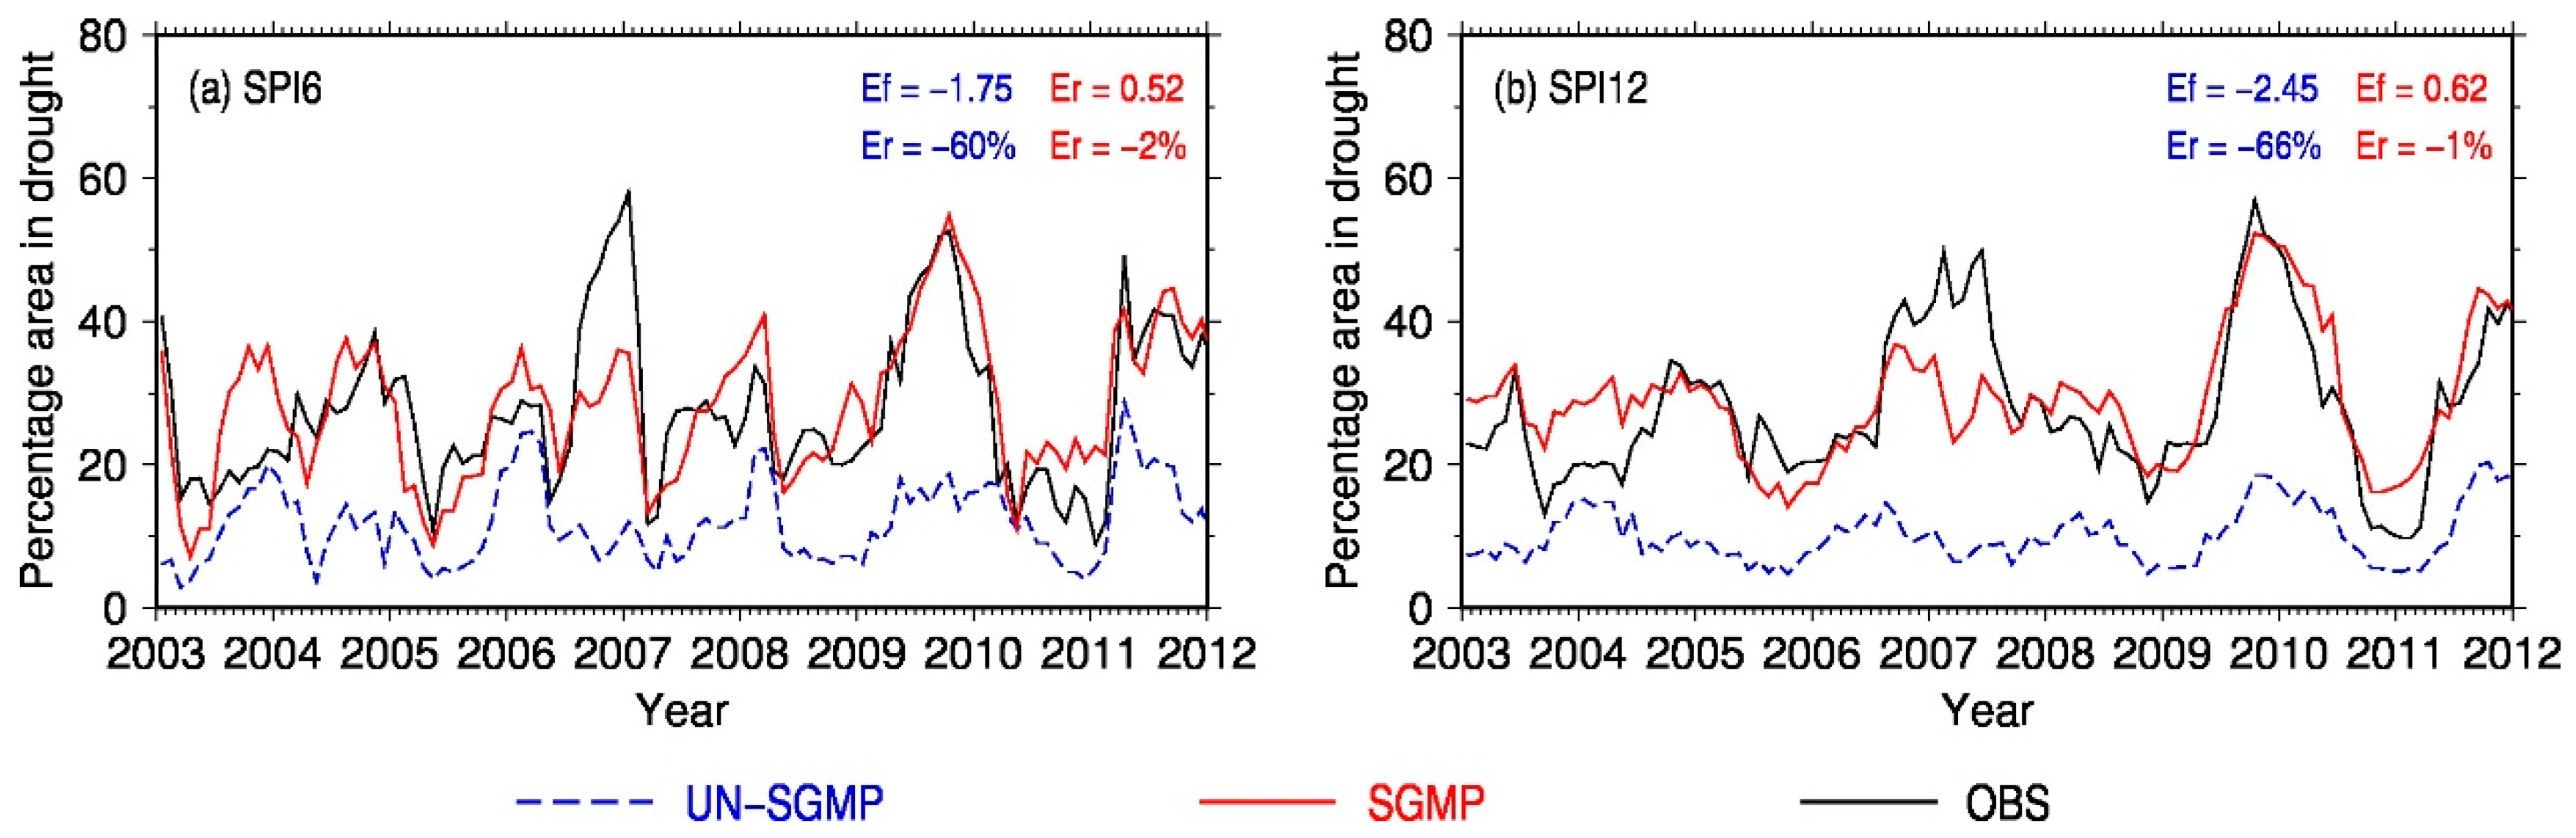
Figure 7 shows the temporal variation in the percentage area affected by meteorological drought, estimated from the UN-SGMP, SGMP, and OBS data, during the overlapping period. As expected, the UN-SGMP exhibits considerable bias (up to 60%) in the SPI6-based meteorological drought area, while the magnitude of Ef is above 0.50 and Er is less than 5% for the SGMP data. This suggests that the SGMP data is able to capture the inter-annual variability of observational meteorological drought area in China [51]. Similarly, the SGMP data is much superior in the SPI12-based meteorological drought area to the UN-SGMP data, with Er decreasing from 66% to 2% and Ef increasing from less than zero to 0.62. These comparisons further demonstrate the effectiveness of SGMP data, generated in this study, for reliable meteorological drought monitoring in near real-time.
4. Conclusions and Discussion
In this study, we generated a long-term near real-time precipitation record with consistent climatology by merging the satellite RT data (3B42RTv7) into the retrospective ground observations (CN05.1), wherein the QM approach was used to bridge the gap (i.e., source-specific inconsistency) between the 3B42RTv7 satellite data and the CN05.1 gauging data. Using the satellite-gauge merged precipitation (SGMP) record, we developed near real-time meteorological drought monitoring data at a spatial resolution of 0.25° over China. The newly developed meteorological drought dataset was validated against that estimated from the observational CN05.1 data (OBS) during the overlapping period.
Results show that the raw 3B42RTV7 satellite data is subject to systematic overestimation of precipitation relative to the gauge-based CN05.1 data. The relative bias (Er) is found to be greater than 20% (or even exceeding 100%) across most of China. After bias-adjustment with the QM approach, the bias of satellite-gauge dataset (3B42RTV7–CN05.1) is dramatically decreased to less than 6%, suggesting that the adjusted 3B42RTV7 data bear an overall consistency with ground observations. Further analyses at three typical locations (grid cells) show that the SGMP dataset is able to capture the inter-annual variability of reference SPI from the OBS data, with the Ef being less than 0.50. In contrast, the performance of UN-SGMP data (i.e., combining the unadjusted raw satellite RT data with the multi-decadal gauging data) is relatively poor with the Ef falling to the catalog of less than zero. Comparing the spatial patterns of meteorological droughts in four typical drought months show that the SGMP data is able to reproduce the spatial distribution pattern of SPI and meteorological drought, as indicated by the observational data (CN05.1), at both the 6-month and the 12-month scales, while the UN-SGMP data shows wide-spread overestimation of SPI. Consistently, the meteorological drought area summarized from the SGMP data shows close agreement with the OBS data, with the magnitude of Ef above 0.50 and Er less than 5%. These validation analyses demonstrate that the meteorological drought diagnosis based on the UN-SGMP data is rather unrealistic due to the systematic overestimation of SPI arising from the satellite-gauge inconsistency, whereas the SGMP-based drought data can provide reliable meteorological drought information through realistic near real-time estimation of SPI.
Although the Integrated Multi-satellitE Retrievals for GPM (IMERG) has been made available as the successor mission of the TRMM mission since March 2014, the short overlapping period between IMERG satellite data and CN05.1 gauging data (March 2014–December 2016) hampers the effectiveness of the satellite-gauge merging approach. Thus, the TMPA-RT data were employed as the source of near real-time precipitation in this study. Future efforts should be dedicated to develop and update the near real-time meteorological drought product with the IMERG-RT data when the long-term record of IMERG data is available. Furthermore, it should be noted that the QM bias-adjustment approach used in this study is not intended to remove the inherent errors in 3B42RTV7 satellite RT data, but to remove the satellite-gauge systematic error.
The newly developed meteorological drought product will be updated on a timely basis and made available to the public in netCDF format via the internet, with the near real-time availability of 3B42RTv7 satellite precipitation. It is not only useful for examining the long-term historical changes in meteorological drought, but also has a great value by facilitating near real-time detections of meteorological drought, thus complementing existing drought adaptation and mitigation efforts in China.
Author Contributions
Conceptualization, X.Z., Z.S., J.L., and G.L.; methodology, X.Z. and W.L.; validation, X.Z. and M.M.; writing—original draft preparation, X.Z. and G.L.; writing—review and editing, all authors; funding acquisition, Z.S. and J.L.
Funding
This research was funded by the National Key R&D Program of China (2017YFC1502406); the National Natural Science Foundation of China (51609257, 41601580, 41701023); the IWHR Research & Development Support Program (JZ0145B582017).
Acknowledgments
The 3B42RTv7 satellite near real-time precipitation and gauge-based CN05.1 retrospective product used in this study are open-available at NASA Goddard Space Flight Center (GSFC; https://trmm.gsfc.nasa.gov/) and the China Meteorological Data Service Center (CMDC; http://data.cma.cn/).
Conflicts of Interest
The authors declare no conflict of interest.
References
- Below, R.; Grover-Kopec, E.; Dilley, M. Documenting drought-related disasters: A global reassessment. J. Environ. Dev. 2007, 16, 328–344. [Google Scholar] [CrossRef]
- UNISDR and CRED. The Human Cost of Weather Related Disasters: 1995–2015. p. 30. Available online: http://www.unisdr.org/2015/docs/climatechange/COP21_WeatherDisastersReport_2015_FINAL.pdf (accessed on 20 February 2019).
- Lesk, C.; Rowhani, P.; Ramankutty, N. Influence of extreme weather disasters on global crop production. Nature 2016, 529, 84–87. [Google Scholar] [CrossRef] [PubMed]
- Qiu, J. China drought highlights future climate threats. Nature 2010, 465, 142–143. [Google Scholar] [CrossRef] [PubMed] [Green Version]
- Yang, Y.; Guan, H.; Batelaan, O.; McVicar, T.R.; Long, D.; Piao, S.; Liang, W.; Liu, B.; Jin, Z.; Simmons, C.T. Contrasting responses of water use efficiency to drought across global terrestrial ecosystems. Sci. Rep. 2016, 6, 23284. [Google Scholar] [CrossRef] [PubMed] [Green Version]
- Wang, A.H.; Lettenmaier, D.P.; Sheffield, J. Soil Moisture Drought in China, 1950–2006. J. Clim. 2011, 24, 3257–3271. [Google Scholar] [CrossRef]
- He, J.; Yang, X.; Li, Z.; Zhang, X.; Tang, Q. Spatiotemporal variations of meteorological droughts in China during 1961–2014: An investigation based on multi-threshold identification. Int. J. Disaster Risk Sci. 2016, 7, 63–76. [Google Scholar] [CrossRef]
- Qu, Y.; Lv, J.; Su, Z.; Sun, H.; Ma, M. Research review and perspective of drought mitigation. J. Hydraul. Eng. 2018, 49, 115–125. (In Chinese) [Google Scholar]
- Mishra, A.K.; Singh, V.P. A review of drought concepts. J. Hydrol. 2010, 391, 202–216. [Google Scholar] [CrossRef]
- Vicente-Serrano, S.M.; Beguería, S.; López-Moreno, J.I. A multiscalar drought index sensitive to global warming: The standardized precipitation evapotranspiration index. J. Clim. 2010, 23, 1696–1718. [Google Scholar] [CrossRef]
- Dai, A. Drought under global warming: A review. WIREs Clim. Chang. 2011, 2, 45–65. [Google Scholar] [CrossRef]
- Van Loon, A.F.; Van Lanen, H.A.J. A process-based typology of hydrological drought. Hydrol. Earth Syst. Sci. 2012, 16, 1915–1946. [Google Scholar] [CrossRef] [Green Version]
- Leng, G.; Tang, Q.; Rayburg, S. Climate change impacts on meteorological, agricultural and hydrological droughts in China. Glob. Planet. Chang. 2015, 126, 23–34. [Google Scholar] [CrossRef] [Green Version]
- McKee, T.; Doesken, N.; Kleist, J. The relationship of drought frequency and duration to time scales. In Proceedings of the 8th Conference on Applied Climatology, Anaheim, CA, USA, 17–22 January 1993; American Meteorological Society: Boston, MA, USA, 1993; pp. 179–184. [Google Scholar]
- Hao, Z.; AghaKouchak, A. Multivariate standardized drought index: A parametric multi-index model. Adv. Water Resour. 2013, 57, 12–18. [Google Scholar] [CrossRef]
- Zou, X.; Zhai, P.; Zhang, Q. Variations in droughts over China: 1951–2003. Geophys. Res. Lett. 2005, 32, L04707. [Google Scholar] [CrossRef]
- Zhai, J.; Su, B.; Krysanova, V.; Vetter, T.; Gao, C.; Jiang, T. Spatial variation and trends in PDSI and SPI indices and their relation to streamflow in 10 large regions of China. J. Clim. 2010, 23, 649–663. [Google Scholar] [CrossRef]
- Zhang, Q.; Li, J.F.; Singh, V.P.; Bai, Y.G. SPI-based evaluation of drought events in Xinjiang, China. Nat. Hazards 2012, 64, 481–492. [Google Scholar] [CrossRef]
- Xu, K.; Yang, D.W.; Yang, H.B.; Li, Z.; Qin, Y.; Shen, Y. Spatio-temporal variation of drought in China during 1961–2012: A climatic perspective. J. Hydrol. 2015, 526, 253–264. [Google Scholar] [CrossRef]
- Fang, W.; Huang, S.; Huang, G.; Huang, Q.; Wang, H.; Wang, L.; Zhang, Y.; Li, P.; Ma, L. Copulas-based risk analysis for inter-seasonal combinations of wet and dry conditions under a changing climate. Int. J. Climatol. 2018. [Google Scholar] [CrossRef]
- Zhou, T.; Nijssen, B.; Huffman, G.J.; Lettenmaier, D.P. Evaluation of real-time satellite precipitation data for global drought monitoring. J. Hydrometeorol. 2014, 15, 1651–1660. [Google Scholar] [CrossRef]
- Baumgartner, M.F.; Apfl, G. Towards an integrated geographic analysis system with remote sensing, GIS and consecutive modeling for snow cover monitoring. Int. J. Remote Sens. 1994, 15, 1507–1518. [Google Scholar] [CrossRef]
- Fortin, J.P.; Turcotte, R.; Massicotte, S.; Moussa, R.; Fitzback, J.; Villeneuve, J.P. A distributed watershed model compatible with remote sensing and GIS data, I: Description of the model. J. Hydrol. Eng. ASCE 2001, 6, 91–99. [Google Scholar] [CrossRef]
- Chen, J.M.; Chen, X.; Ju, W.; Geng, X. Distributed hydrologic model for mapping evapotranspiration using remote sensing inputs. J. Hydrol. 2005, 305, 15–39. [Google Scholar] [CrossRef]
- Hong, Y.; Adler, R.F.; Hossain, F.; Curtis, S.; Huffman, G.J. A first approach to global runoff simulation using satellite rainfall estimation. Water Resour. Res. 2007, 43, W08502. [Google Scholar] [CrossRef]
- Chormanski, J.; Van de Voorde, T.; De Roeck, T.; Batelaan, O.; Canters, F. Improving distributed runoff prediction in urbanized catchments with remote sensing based estimates of impervious surface cover. Sensors 2008, 8, 910–932. [Google Scholar] [CrossRef] [PubMed]
- Balenzano, A.; Mattia, F.; Satalino, G.; Davidson, M. Dense temporal series of C- and L-band SAR data for soil moisture retrieval over agricultural crops. IEEE J.-STARS 2011, 4, 439–450. [Google Scholar] [CrossRef]
- Bitew, M.M.; Gebremichael, M. Evaluation of satellite rainfall products through hydrologic simulation in a fully distributed hydrologic model. Water Resour. Res. 2011, 47, W06526. [Google Scholar] [CrossRef]
- Mattia, F.; Satalino, G.; Balenzano, A.; D’Urso, G.; Capodici, F.; Iacobellis, V.; Milella, P.; Gioia, A.; Rinaldi, M.; Ruggieri, S.; et al. Time series of COSMO-SkyMed data for landcover classification and surface parameter retrieval over agricultural sites. In Proceedings of the International Geoscience and Remote Sensing Symposium (IGARSS), Munich, Germany, 22–27 July 2012; 13133369; pp. 6511–6514. [Google Scholar]
- Hou, A.Y.; Kakar, R.K.; Neeck, S.; Azarbarzin, A.A.; Kummerow, C.D.; Kojima, M.; Iguchi, T. The global precipitation measurement mission. Bull. Am. Meteorol. Soc. 2014, 95, 701–722. [Google Scholar] [CrossRef]
- Huffman, G.J.; Bolvin, D.T.; Nelkin, E.J.; Wolff, D.B.; Adler, R.F.; Gu, G.; Stocker, E.F. The TRMM multisatellite precipitation analysis (TMPA): Quasi-global, multiyear, combined-sensor precipitation estimates at fine scales. J. Hydrometeorol. 2007, 8, 38–55. [Google Scholar] [CrossRef]
- Joyce, R.J.; Janowiak, J.E.; Arkin, P.A.; Xie, P. CMORPH: A method that produces global precipitation estimates from passive microwave and infrared data at high spatial and temporal resolution. J. Hydrometeorol. 2004, 5, 487–503. [Google Scholar] [CrossRef]
- Sorooshian, S.; Hsu, K.L.; Gao, X.; Gupta, H.V.; Imam, B.; Dan, B. Evaluation of PERSIANN system satellite-based estimates of tropical rainfall. Bull. Am. Meteorol. Soc. 2000, 81, 2035–2046. [Google Scholar] [CrossRef]
- Zhang, X.; Tang, Q. Combining satellite precipitation and long-term ground observations for hydrological monitoring in China. J. Geophys. Res. Atmos. 2015, 120, 6426–6443. [Google Scholar] [CrossRef] [Green Version]
- Tian, Y.; Peters-Lidard, C.D.; Eylander, J.B. Real-time bias reduction for satellite-based precipitation estimates. J. Hydrometeorol. 2010, 11, 1275–1285. [Google Scholar] [CrossRef]
- AghaKouchak, A.; Nakhjiri, N. A near real-time satellite-based global drought climate data record. Environ. Res. Lett. 2012, 7, 044037. [Google Scholar] [CrossRef] [Green Version]
- Nijssen, B.; Shukla, S.; Lin, C.; Gao, H.; Zhou, T.; Ishottama, J.; Wood, E.F.; Lettenmaier, D.P. A prototype global drought information system based on multiple land surface models. J. Hydrometeorol. 2014, 15, 1661–1676. [Google Scholar] [CrossRef]
- Sheffield, J.; Wood, E.F.; Chaney, N.; Guan, K.; Sadri, S.; Yuan, X.; Olang, L.; Amani, A.; Ali, A.; Demuth, S.; et al. A drought monitoring and forecasting system for sub-Sahara African water resources and food security. Bull. Am. Meteorol. Soc. 2014, 95, 861–882. [Google Scholar] [CrossRef]
- Kimani, M.W.; Hoedjes, J.C.B.; Su, Z. Bayesian Bias Correction of Satellite Rainfall Estimates for Climate Studies. Remote Sens. 2018, 10, 1074. [Google Scholar] [CrossRef]
- Xie, P.; Xiong, A.-Y. A conceptual model for constructing high-resolution gauge-satellite merged precipitation analyses. J. Geophys. Res. 2011, 116, D21106. [Google Scholar] [CrossRef]
- Shen, Y.; Zhao, P.; Pan, Y.; Yu, J. A high spatiotemporal gauge-satellite merged precipitation analysis over China. J. Geophys. Res. Atmos. 2014, 119, 3063–3075. [Google Scholar] [CrossRef] [Green Version]
- Wu, J.; Gao, X.J. A gridded daily observation dataset over China region and comparison with the other datasets. Chin. J. Geophys. 2013, 56, 1102–1111. (In Chinese) [Google Scholar]
- Xie, P.; Chen, M.; Yang, S.; Yatagai, A.; Hayasaka, T.; Fukushima, Y.; Liu, C. A gauge-based analysis of daily precipitation over East Asia. J. Hydrometeorol. 2007, 8, 607–626. [Google Scholar] [CrossRef]
- Yatagai, A.; Arakawa, O.; Kamiguchi, K.; Kawamoto, H.; Nodzu, M.I.; Hamada, A. A 44-year daily gridded precipitation dataset for Asia based on a dense network of rain gauges. Sola 2009, 5, 137–140. [Google Scholar] [CrossRef]
- Zhang, X.; Tang, Q.; Pan, M.; Tang, Y. A long-term land surface hydrologic fluxes and states dataset for China. J. Hydrometeorol. 2014, 15, 2067–2084. [Google Scholar] [CrossRef]
- Wood, A.W.; Lettenmaier, D.P. A test bed for new seasonal hydrologic forecasting approaches in the western United States. Bull. Am. Meteorol. Soc. 2006, 87, 1699–1712. [Google Scholar] [CrossRef]
- Zhang, X.; Tang, Q.; Liu, X.; Leng, G.; Li, Z. Soil moisture drought monitoring and forecasting using satellite and climate model data over southwestern China. J. Hydrometeorol. 2017, 18, 5–23. [Google Scholar] [CrossRef]
- Zhao, T.; Bennett, J.C.; Wang, Q.J.; Schepen, A.; Wood, A.W.; Robertson, D.E.; Ramos, M.-H. How Suitable is Quantile Mapping For Postprocessing GCM Precipitation Forecasts? J. Clim. 2017, 30, 3185–3196. [Google Scholar] [CrossRef]
- Yoon, J.-H.; Mo, K.; Wood, E.F. Dynamic-model-based seasonal prediction of meteorological drought over the United States. J. Hydrometeorol. 2012, 13, 463–482. [Google Scholar] [CrossRef]
- Svoboda, M.; LeComte, D.; Hayes, M.; Heim, R.; Gleason, K. The Drought Monitor. Bull. Am. Meteorol. Soc. 2002, 83, 1181–1190. [Google Scholar] [CrossRef]
- Moriasi, D.N.; Arnold, J.G.; Van Liew, M.W.; Bingner, R.L.; Harmel, R.D.; Veith, T.L. Model evaluation guidelines for systematic quantification of accuracy in watershed simulations. Trans. ASABE 2007, 50, 885–900. [Google Scholar] [CrossRef]
Figure 1.
The 10 major hydrological zones of China denoted by a unique number: 1. Songhua River; 2. Liao River; 3. Hai River; 4. Yellow River; 5. Huai River; 6. Yangtze River; 7. Pearl River; 8. Southeast region; 9. Southwest region; and 10. Northwest region.
Figure 1.
The 10 major hydrological zones of China denoted by a unique number: 1. Songhua River; 2. Liao River; 3. Hai River; 4. Yellow River; 5. Huai River; 6. Yangtze River; 7. Pearl River; 8. Southeast region; 9. Southwest region; and 10. Northwest region.

Figure 2.
Monthly mean precipitation from (a) the raw satellite-based 3B42RTV7 data and (b) the gauge-based CN05.1 data, as well as (c) the difference between the two products over the overlapping period (2001–2016). (1–10) the basins/regions shown in Figure 1.
Figure 2.
Monthly mean precipitation from (a) the raw satellite-based 3B42RTV7 data and (b) the gauge-based CN05.1 data, as well as (c) the difference between the two products over the overlapping period (2001–2016). (1–10) the basins/regions shown in Figure 1.

Figure 3.
Comparisons of monthly precipitation from the 3B42RTV7 before adjustment (blue dash line), 3B42RTV7 after adjustment (rea line), and the gauge-based CN05.1 data (black line) during the overlapping period (2001–2016) for the 10 hydrological zones as shown in Figure 1.
Figure 3.
Comparisons of monthly precipitation from the 3B42RTV7 before adjustment (blue dash line), 3B42RTV7 after adjustment (rea line), and the gauge-based CN05.1 data (black line) during the overlapping period (2001–2016) for the 10 hydrological zones as shown in Figure 1.

Figure 4.
Comparisons of monthly precipitation and the 12-month SPI (SPI12) from the UN-SGMP (blue dash line), SGMP (red line), and OBS data (black line) during the overlapping period (2001–2016) in three example grid cells.
Figure 4.
Comparisons of monthly precipitation and the 12-month SPI (SPI12) from the UN-SGMP (blue dash line), SGMP (red line), and OBS data (black line) during the overlapping period (2001–2016) in three example grid cells.

Figure 5.
Six-month SPI (SPI6) derived from the OBS data (CN05.1; left panels), the UN-SGMP data (unadjusted 3B42RTV7–CN05.1 merged data; middle panels), and the SGMP data (adjusted 3B42RTV7–CN05.1 merged data; right panels) for January (a–c) and August 2010 (d–f) and for January (g–i) and May 2012 (j–l).

Figure 6.
12-month SPI (SPI12) derived from the gauge-based N05.1 data (left panels), 3B42RTV7–CN05.1 merged data (middle panels), and adjusted 3B42RTV7–CN05.1 merged data (right panels) for January (a–c) and August 2010 (d–f) and for January (g–i), and May 2012 (j–l).
Figure 6.
12-month SPI (SPI12) derived from the gauge-based N05.1 data (left panels), 3B42RTV7–CN05.1 merged data (middle panels), and adjusted 3B42RTV7–CN05.1 merged data (right panels) for January (a–c) and August 2010 (d–f) and for January (g–i), and May 2012 (j–l).

Figure 7.
The 10-y percentage area in meteorological drought identified from the (a) 6-month SPI (SPI6) and (b) 12-month SPI (SPI12) based on the UN-SGMP (blue dash line), SGMP (red line), and OBS (black line) data.
Figure 7.
The 10-y percentage area in meteorological drought identified from the (a) 6-month SPI (SPI6) and (b) 12-month SPI (SPI12) based on the UN-SGMP (blue dash line), SGMP (red line), and OBS (black line) data.


Table 1.
Percentage area in meteorological drought (%) estimated from the UN-SGMP, SGMP, and OBS data
Table 1.
Percentage area in meteorological drought (%) estimated from the UN-SGMP, SGMP, and OBS data
| Month | 6-Month SPI | 12-Month SPI | ||||
|---|---|---|---|---|---|---|
| UN-SGMP | SGMP | OBS | UN-SGMP | SGMP | OBS | |
| January 2010 | 16 | 43 | 33 | 16 | 50 | 49 |
| August 2010 | 9 | 23 | 19 | 9 | 24 | 25 |
| January 2012 | 8 | 34 | 35 | 17 | 40 | 40 |
| May 2012 | 7 | 20 | 24 | 9 | 32 | 32 |
© 2019 by the authors. Licensee MDPI, Basel, Switzerland. This article is an open access article distributed under the terms and conditions of the Creative Commons Attribution (CC BY) license (http://creativecommons.org/licenses/by/4.0/).
Share and Cite
MDPI and ACS Style
Zhang, X.; Su, Z.; Lv, J.; Liu, W.; Ma, M.; Peng, J.; Leng, G. A Set of Satellite-Based Near Real-Time Meteorological Drought Monitoring Data over China. Remote Sens. 2019, 11, 453. https://0-doi-org.brum.beds.ac.uk/10.3390/rs11040453
AMA Style
Zhang X, Su Z, Lv J, Liu W, Ma M, Peng J, Leng G. A Set of Satellite-Based Near Real-Time Meteorological Drought Monitoring Data over China. Remote Sensing. 2019; 11(4):453. https://0-doi-org.brum.beds.ac.uk/10.3390/rs11040453
Chicago/Turabian StyleZhang, Xuejun, Zhicheng Su, Juan Lv, Weiwei Liu, Miaomiao Ma, Jian Peng, and Guoyong Leng. 2019. "A Set of Satellite-Based Near Real-Time Meteorological Drought Monitoring Data over China" Remote Sensing 11, no. 4: 453. https://0-doi-org.brum.beds.ac.uk/10.3390/rs11040453
Note that from the first issue of 2016, this journal uses article numbers instead of page numbers. See further details here.