Drifting Effects of NOAA Satellites on Long-Term Active Fire Records of Europe


1
Institute of Geography, University of Bern, Hallerstr. 12, 3012 Bern, Switzerland
2
Oeschger Centre for Climate Change Research, University of Bern, Hochschulstr. 4, 3012 Bern, Switzerland
*
Author to whom correspondence should be addressed.
Remote Sens. 2019, 11(4), 467; https://0-doi-org.brum.beds.ac.uk/10.3390/rs11040467
Submission received: 27 December 2018
/
Revised: 11 February 2019
/
Accepted: 19 February 2019
/
Published: 25 February 2019
Abstract
:Explicit knowledge of different error sources in long-term climate records from space is required to understand and mitigate their impacts on resulting time series. Imagery of the heritage Advanced Very High Resolution Radiometer (AVHRR) provides unique potential for climate research dating back to the 1980s, flying onboard a series of successive National Oceanic and Atmospheric Administration (NOAA) and Meteorological Operational (MetOp) satellites. However, the NOAA satellites are affected by severe orbital drift that results in spurious trends in time series. We identified the impact and extent of the orbital drift in 1 km AVHRR long-term active fire data. This record contains data of European fire activity from 1985–2016 and was analyzed on a regional scale and extended across Europe. Inconsistent sampling of the diurnal active fire cycle due to orbital drift with a maximum delay of ∼5 h over NOAA-14 lifetime revealed a ∼90% decline in the number of observed fires. However, interregional results were less conclusive and other error sources as well as interannual variability were more pronounced. Solar illumination, measured by the sun zenith angle (SZA), related changes in background temperatures were significant for all regions and afternoon satellites with major changes in −0.03 to −0.09 K deg for (). Based on example scenes, we simulated the influence of changing temperatures related to changes in the SZA on the detection of active fires. These simulations showed a profound influence of the active fire detection capabilities dependent on biome and land cover characteristics. The strong decrease in the relative changes in the apparent number of active fires calculated over the satellites lifetime highlights that a correction of the orbital drift effect is essential even over short time periods.

1. Introduction
Unpredictable random and systematic errors are the two main types of errors, which can be quantitively assessed to analyze the quality of a satellite-based time series [1]. Time series of the Advanced Very High Resolution Radiometer (AVHRR) are affected by both. For example, changing sensor technology [2], radiometric calibration uncertainty (e.g., [3,4]), and navigational errors like satellite attitude, satellite clock, and orbital drift (e.g., [5,6]) result in systematic errors, which affect measurement accuracy. The orbital drifting, as already described by [7], can result in the detection of false trends or masking of actual trends in AVHRR retrieved climatological time series (e.g., [8]).
While orbital parameters of the Polar Orbiting Environmental Satellites (POES), operated by the National Oceanic and Atmospheric Administration (NOAA), allow for drifting over its individual time spans [9], an active positional control is implemented for more recent AVHRR missions flying on MetOp satellites (e.g., [10]). MetOp stands for the Meteorological Operational satellites under operation of the European Organisation for the Exploitation of Meteorological Satellites (EUMETSAT). The drifting is an example of the systematic error specific to each satellite. Orbital drift leads to inconsistent sampling of geophysical variables with pronounced diurnal cycles over time. Furthermore, changes in equator crossing times (ECT) induce different solar illumination. Consequently, measured reflectances and brightness temperatures are affected.
However, multi-decadal AVHRR time series, with moderate spatial (i.e., 1 × 1 km) and temporal (i.e., daily) resolution, have the potential to support climate research [11]. Corrections of systematic orbit drift errors have been subsequently undertaken to optimize the accuracy with respect to a range of applications. These include but are not limited to the monitoring of land surface temperature [8], extraction of cloud climatologies [12], analysis of phenological metrics [13], or the retrieval of water surface temperatures [14]. However, correction of systematic orbit drift errors has yet to be fully extended to other climate parameters like fire.
The recent occurrence of devastating fires around the globe have had substantial environmental, social, and economic impacts [15]. These extreme fire events are projected to become more frequent, since days conducive to extreme wildfire events are likely to increase by 20–50% by the mid-21st century in disaster-prone landscapes (e.g., the Mediterranean; [16]). Knowledge of long-term fire activity and patterns can support our understanding of fire-prone ecosystems [17] and assess their current and future adaptation to the projected increase in fire risk that results from climate change [18,19].
To fully employ AVHRR retrieved fire records dating back to the 1980s, it is important to understand the orbital drifting effect of NOAA-07 to -19 satellites on the quality of the generated time series. Orbital drift related inconsistent sampling of the diurnal fire cycle varied the number of active fires by a factor of ten for NOAA-14 and very likely introduced biases over even short times (e.g., more than a single fire season [20]). Furthermore, drifting was found to influence background temperatures of fire pixels on the interannual scale, which led to spurious trends in the number of active fires over non-forested areas in North America [21]. Recent retrievals of active fire records from AVHRR include studies by [22] and ([23], in review). The latter corrected the diurnal sampling bias due to orbital drifting by using observed annual numbers of active fires on a continental scale. However, expected variations in diurnal fire cycles across different regions and fire regimes with their inherent types of burning [24] should be accounted for.
To ensure the generation of a consistent, high-quality active fire time series for further applications, systematic errors like the orbit drift need to be assessed in detail. Here, we analyze the effect of the orbit drift for 1 km AVHRR long-term active fire data from 1985–2016, on regional and European scales, to quantify the magnitude of its impact. Given the aforementioned challenges and potentials, the following sections address the problem by: (1) analysing inconsistencies in diurnal sampling by orbital drifting on active fires, (2) describing varying degrees of temperature contrast between the fire pixels and their background in relation to trends in illumination angles, (3) assessing example-wise relative changes of the drifting effect on the AVHRR active fire record to quantify its magnitude, and (4) combining and discussing the impacts within a larger context of active fire records.
2. Data and Study Sites
2.1. The 1 km AVHRR Active Fire Product
The daytime 1 km AVHRR active fire product (AVH18) consists of binary fire masks including confidence estimates for each fire pixel, algorithm quality layers with pixel-based indicators, and fire pixel tables. Radiometric measurements, after passing quality tests, are included from AVHRR/2 (AVHRR/3) on-board NOAA-09, -11 -12, and -14 (on-board NOAA-16, -18, and -19). NOAA-07 has been excluded here due to lower quality compared to the other satellites. One of the requirements is, for example, the activated mid-infrared (MIR) channel of the AVHRR sensor at daytime. The AVHRR active fire product is retrieved from the comprehensive, full resolution (1.1 km at nadir) European local area coverage (LAC) AVHRR archive hosted by the University of Bern, Switzerland [25].
The detection of an active fire employs the spectral response of a subpixel fire in the MIR (hereafter: ) in relation to its background in the MIR (hereafter: ), thermal infrared (TIR; hereafter: ), and their difference (hereafter: ) to separate active fires from their cooler fire-free background. This is done by dynamical thresholding using contextual algorithms after the initial identification of a potential fire pixel. The extraction algorithms were based on Dozier’s study on subpixel temperature fields according to Plancks’s law (see [26,27,28]). The extraction of active fires is influenced and limited by the viewing geometries of the satellites and the position of the sun. For example, the sun zenith angle (SZA) influences the observed signal of the subpixel fire (i.e., temperature and the reflective part of ) and background conditions. The detection of active fires is strongly limited by the low saturation temperatures of the MIR channel at temperatures greater than 320.5 K (335 K) for AVHRR2 (AVHRR/3; [29,30]). A detailed description of the AVHRR methodology including data characteristics, the active fire detection algorithm, and its performance is provided in ([23], in review).
For this time period, we also retrieved daytime, clear-sky, mean top-of-atmosphere (TOA) reflectances, and brightness temperatures together with sun and viewing zenith angle statistics corresponding to each swath-based fire mask for the study regions (see Section 2.3).
2.2. Sampling Characteristics of AVHRR
The AVHRR across track scanner is carried by the sun-synchronous NOAA and MetOp platforms at a nominal orbit altitude of ∼833 km, a swath width of ∼2700 km, and an orbital period of ∼102 min [2]. Afternoon NOAA platforms were launched at an ECT of ∼14:30 UTC (NOAA-07, -09), ∼13:30 UTC (NOAA-11, -14, -19), ∼14:00 UTC (NOAA-16), or ∼15:00 UTC (NOAA-18) in an ascending orbit, while morning NOAA platforms with descending node passing at ∼07:30 UTC (NOAA-12, e.g., [9]). However, their actual ECTs change systematically by drifting away from noon [31], which results in later (earlier) crossing times for afternoon (morning) orbits. These ECT changes are platform dependent and vary over time. NOAA-11 and NOAA-14 are affected most with ECT shifts of ∼3.7 h and ∼2.9 h, respectively, over the platforms’ operational life spans (6 years from satellites launch; [13]).
Data availability increases in years of consecutive orbits and simultaneous operating platforms and provides a high sub-daily coverage of the diurnal fire cycle. The different sampling of the diurnal fire cycle is of high relevance to support our understanding of prevailing fire regimes and their changes over time [20].
2.3. Selection of Regions
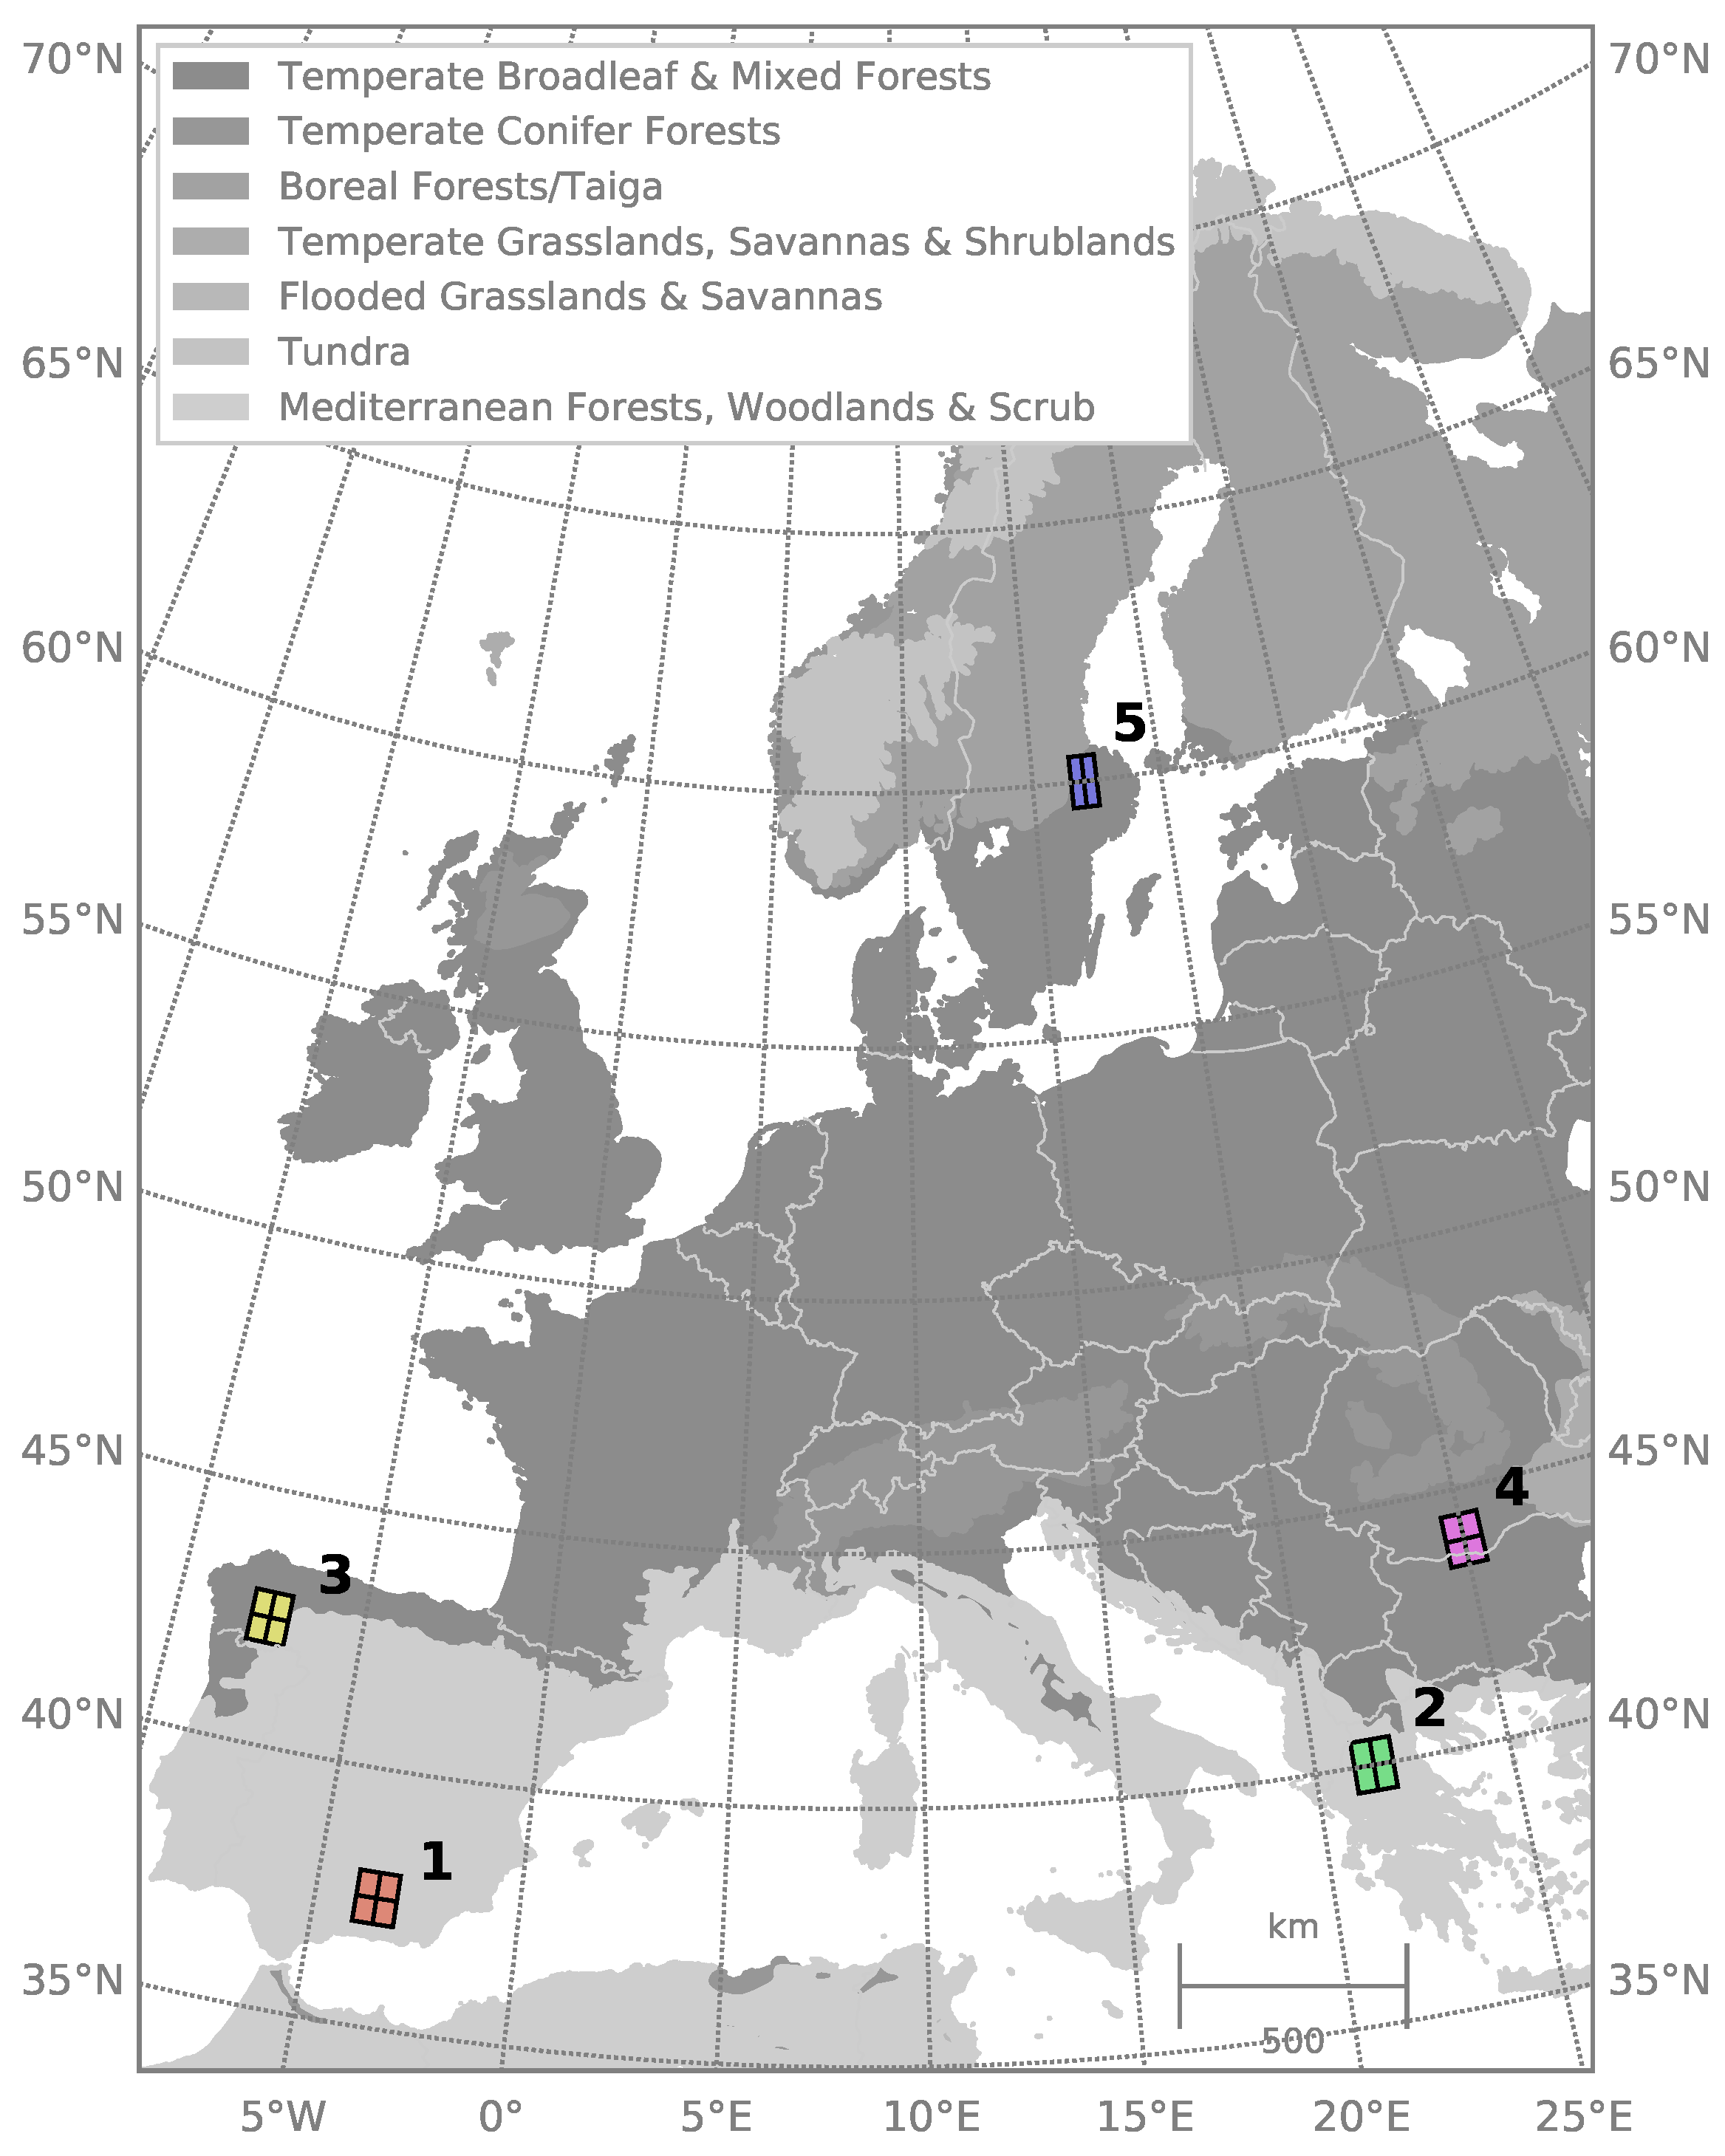
To study the influence of the orbit drift on active fire detection, we selected five study regions representative of different biomes and fire regimes (see Figure 1). These particular study regions include three major biomes: Mediterranean, temperate, and boreal, which capture the variability of European environments and their underlying vegetation and climate conditions. The Mediterranean region is strongly shaped by its fuel (vegetation) structures [32] and is most susceptible to fire. Only 15% of the annual area burned in Europe occurs outside of this region [33]. In general, the European biomes experience strong internal variability in fire activity (i.e., fire frequency, intensity, size, and spread), which is characterized by its different fire regimes. The latter show a distinct geographical divergence within Europe with decreasing fire activity along a south to north-east gradient [34]. The biomes as well as land surface characteristics for the selected regions, are listed in Table 1.
We considered two potential errors related to the size of the study areas, which could bias the results: (1) too small extents could lead to sampling errors because of an insufficient number of observations therein and (2) large spatial extents that limit the assessment of regional differences in e.g., diurnal fire activity of the individual fire regimes [20]. Following [21], study regions with 1 × 1 dimensions were considered to be sufficiently large to represent interannual changes in terms of illumination and background temperature conditions. Furthermore, we made the a priori assumption that these 1 grid cells were large enough to resample differences in diurnal fire cycles across prevailing fire regimes. However, since European land surfaces are very heterogenous, we split each of the study regions into four subregions of 0.5 spatial resolution (see Figure 1).
3. Results
To assess the assumptions made about the size of the study regions, we analyzed subregional differences at 0.5 spatial resolution in the near-infrared (alias NIR), MIR, and TIR AVHRR channels in comparison with their regional means. Intraregional differences of these mean, clear-sky, TOA radiances were highest in regions 2 and 3, indicating a more heterogenous landscape. We considered those small intraregional variations as negligible for the purpose of this study and based the following analyses of the 1 × 1 grid cells.
3.1. Orbital Drift-Related Changes in Diurnal Sampling
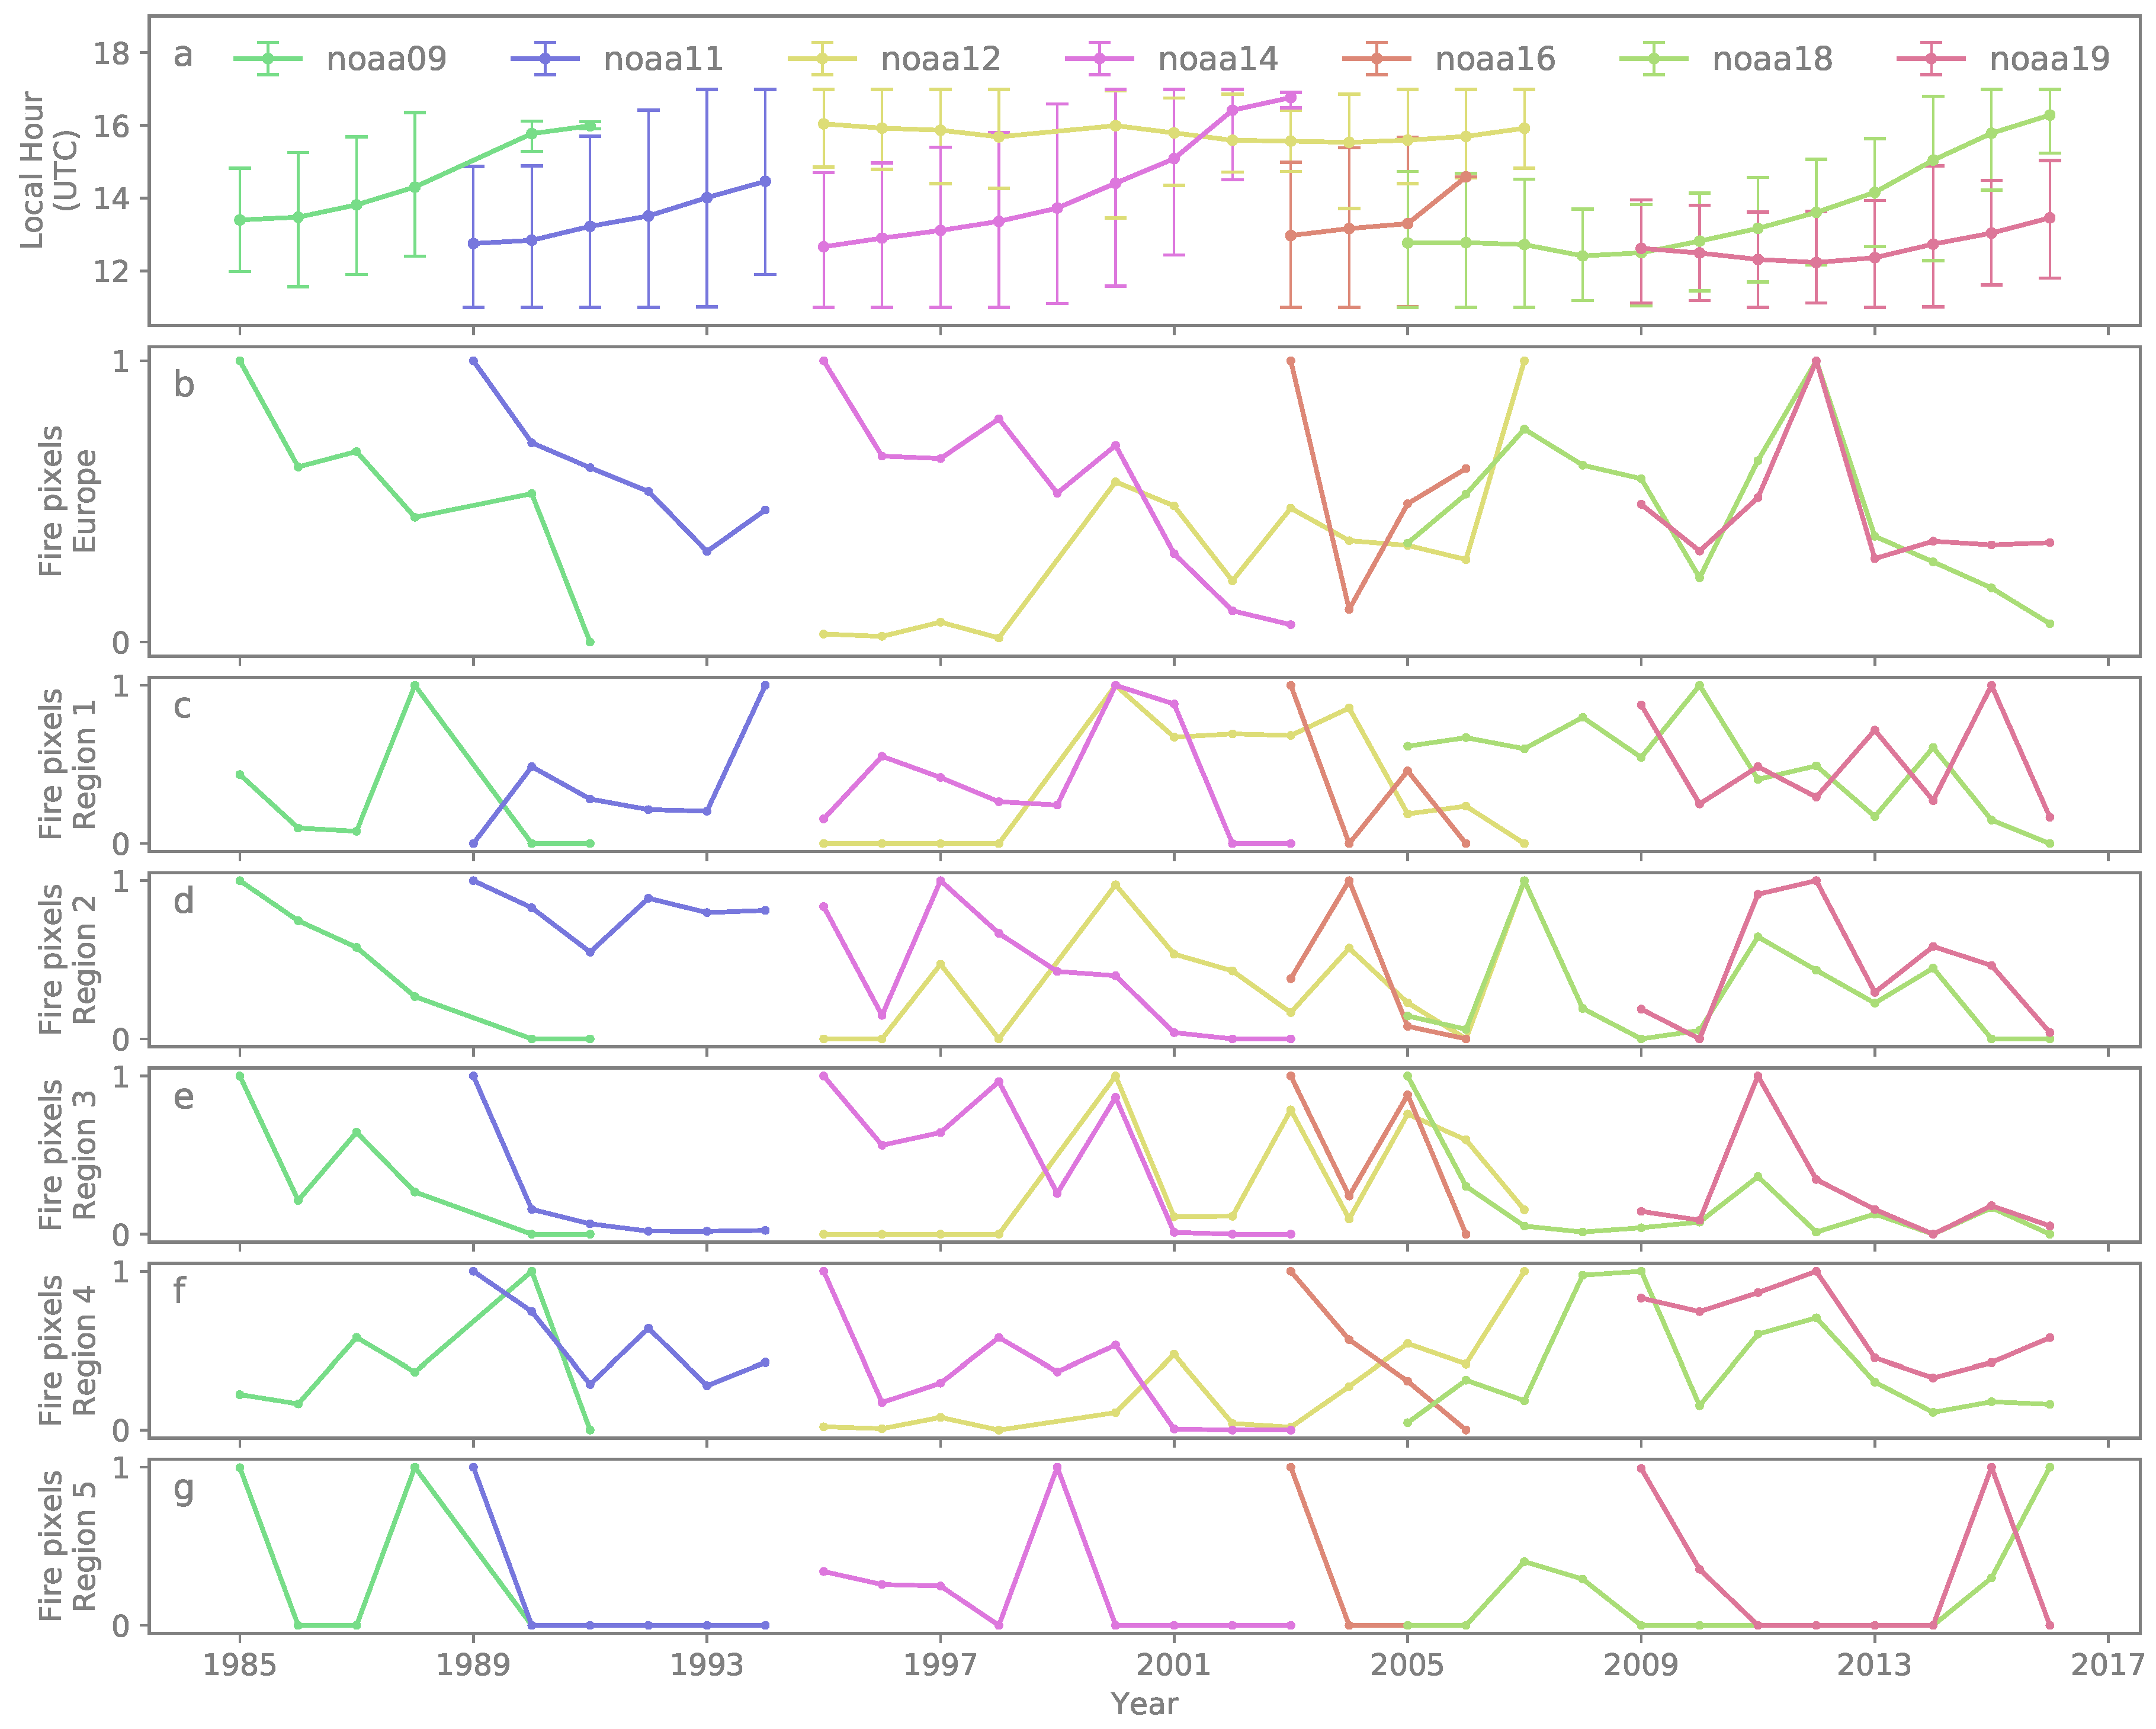
We first investigated impacts of the orbital drifting on the sampling of the diurnal fire cycle. To analyze these inconsistencies in sampling, we extracted mean yearly fire data from the AVH18 product for each of the five regions as well as all of Europe. Figure 2a shows the annual mean local hour of the afternoon overpasses from NOAA-09 to -19 and the late afternoon overpasses of NOAA-12, in relation to the relative number of mean yearly detected active fire pixels. The effect of the satellite-dependent orbital drift results in a decrease in the apparent number of active fires detected in all of Europe, with an attenuated signal across regions (1 to 5).
As expected, this decrease in active fires is strongly associated with those satellites that exhibit the largest change in local overpass time (see Figure 2a,b). The effect of drifting is especially evident when comparing the simultaneously operating satellites NOAA-12 and NOAA-14 between 1995–2003, whereby almost no (slightly negative) change in the annual mean local hour is observed for NOAA-12. Over this timespan, the relative change of observed active fires on an European scale by NOAA-12 increased by almost 50%. However, observations of NOAA-14, which exhibited the largest drift with a ∼5 h delay towards the end of its lifetime, resulted in a ∼90% decline in the number of observed fires for Europe (see Figure 2b). This result is consistent with observations reported by Giglio [20], who found a similar decrease in Brazil’s rainforest for NOAA-14 by applying observed diurnal fire cycles on a synthetic AVHRR time series.
For Europe, we observed interannual variability in the number of active fires derived from all satellites (see Figure 2b). This interannual variability became apparent in the late 1990s and over-shaded the effect of orbital drifting on the diurnal sampling, as seen for example in the years 1989, 2007, and 2012. These years with extremely high fire activity have been analyzed (e.g., [37,38,39]) and documented in the historical fire database of the European Forest Fire Information System (EFFIS; [40]). The observed interannual variability has much stronger impacts on the regional level but also changed considerably among the regions, partly due to the low number of observed fires in each region (see Figure 2c–g). For example, high fire activity in 1989 had no impact on region 1, whereas regions 3 to 5 were affected by high fire activity. In other years with high fire activity like 2012 yearly means were much more variable over the regions.
Dependent on the satellite and region, the interregional decrease in observed fire activity due to the effect of orbit drift was less pronounced compared to Europe. We also found regionally reversed patterns (i.e., NOAA-11 active fire detections in region 1) or non-discernible trends (i.e., active fire time series of NOAA-19 in region 2) in the observed number of fires as compared to the whole of Europe. As already shown at the European scale, NOAA-12 and -19 exhibited only small delays in overpass time. Hence, the number of observed fires was less biased by the orbital drift.
The peak of diurnal fire occurs ∼3 pm for human related causes of fire and ∼5 pm for natural causes in Europe [41]. None of the satellites’ initial orbits would have sampled the maximum peak occurrence. But by drifting away from noon, all satellites except for NOAA-12 and NOAA-19 crossed the peak in diurnal fire activity at some point of their lifetime. However, the expected increase in the number of fires towards the diurnal fire peak and subsequent decline was not observed in our fire record. The signal is likely canceled out by other factors such as the interannual variability in fire activity.
The data sampling with increasing availability during years of simultaneous platform operation supported coverage of different regional characteristics of the diurnal fire cycle. These regional differences in the number of observed fires over the day were related to regional fire regimes. Fires in boreal region (see Figure 2g) were primarily related to natural fire regimes and timing was linked to fire weather and season (e.g., [42]). However, the small number of observed fires precluded any interpretation since sampling inconsistencies on the diurnal cycles were less pronounced. In contrast, the timing of fires in agricultural and pasture areas was closely linked to human activities [41,43]. In both regions, 1 and 4, smaller relative changes in the active fires observed by for example NOAA-11 might be representative of the regional fire regime (see Figure 2c,f).
Nevertheless, the assessment of diurnal fire cycles with respect to orbital drifting remains challenging. While we identified a prominent orbit drift signal on the European scale, effects on the regional scale (1 grid cells) were less conclusive and other factors might have been more dominant on the active fire time series of each NOAA satellite. Albeit, we tried to disentangle the inconsistencies due to diurnal sampling in our investigation from SZA induced changes in the background temperatures, the latter are inherent in the used active fire data set.
3.2. Temporal Trends in SZA Caused by Orbital Drifting
A second important effect of the orbital drifting is changing solar illumination at the time of the overpass. We examined the varying local time, and hence the temporal trends in SZA, due to the drifting NOAA satellites. This is based on the knowledge that SZA depends on local hour, day of the year, and latitude [44]. These properties impact the accuracy of the active fire detection algorithm. For the month of July, we calculated linear trends of the study regions’ monthly mean SZA values for data retrieved from all afternoon NOAA platforms (see Table 2). July was chosen, since it is characterized by high fire activity in Europe (e.g., [41]). Furthermore, we expected the highest impact of the orbital drift on the background conditions in this month due to the highest position of the sun. With lower values around noon, morning satellites drifting towards earlier overpass time exhibit decreasing SZAs, whereas afternoon satellites with the same drift exhibit the opposite. Table 2 shows the July SZA trends of the afternoon satellites NOAA-09 to -19 and their significance.
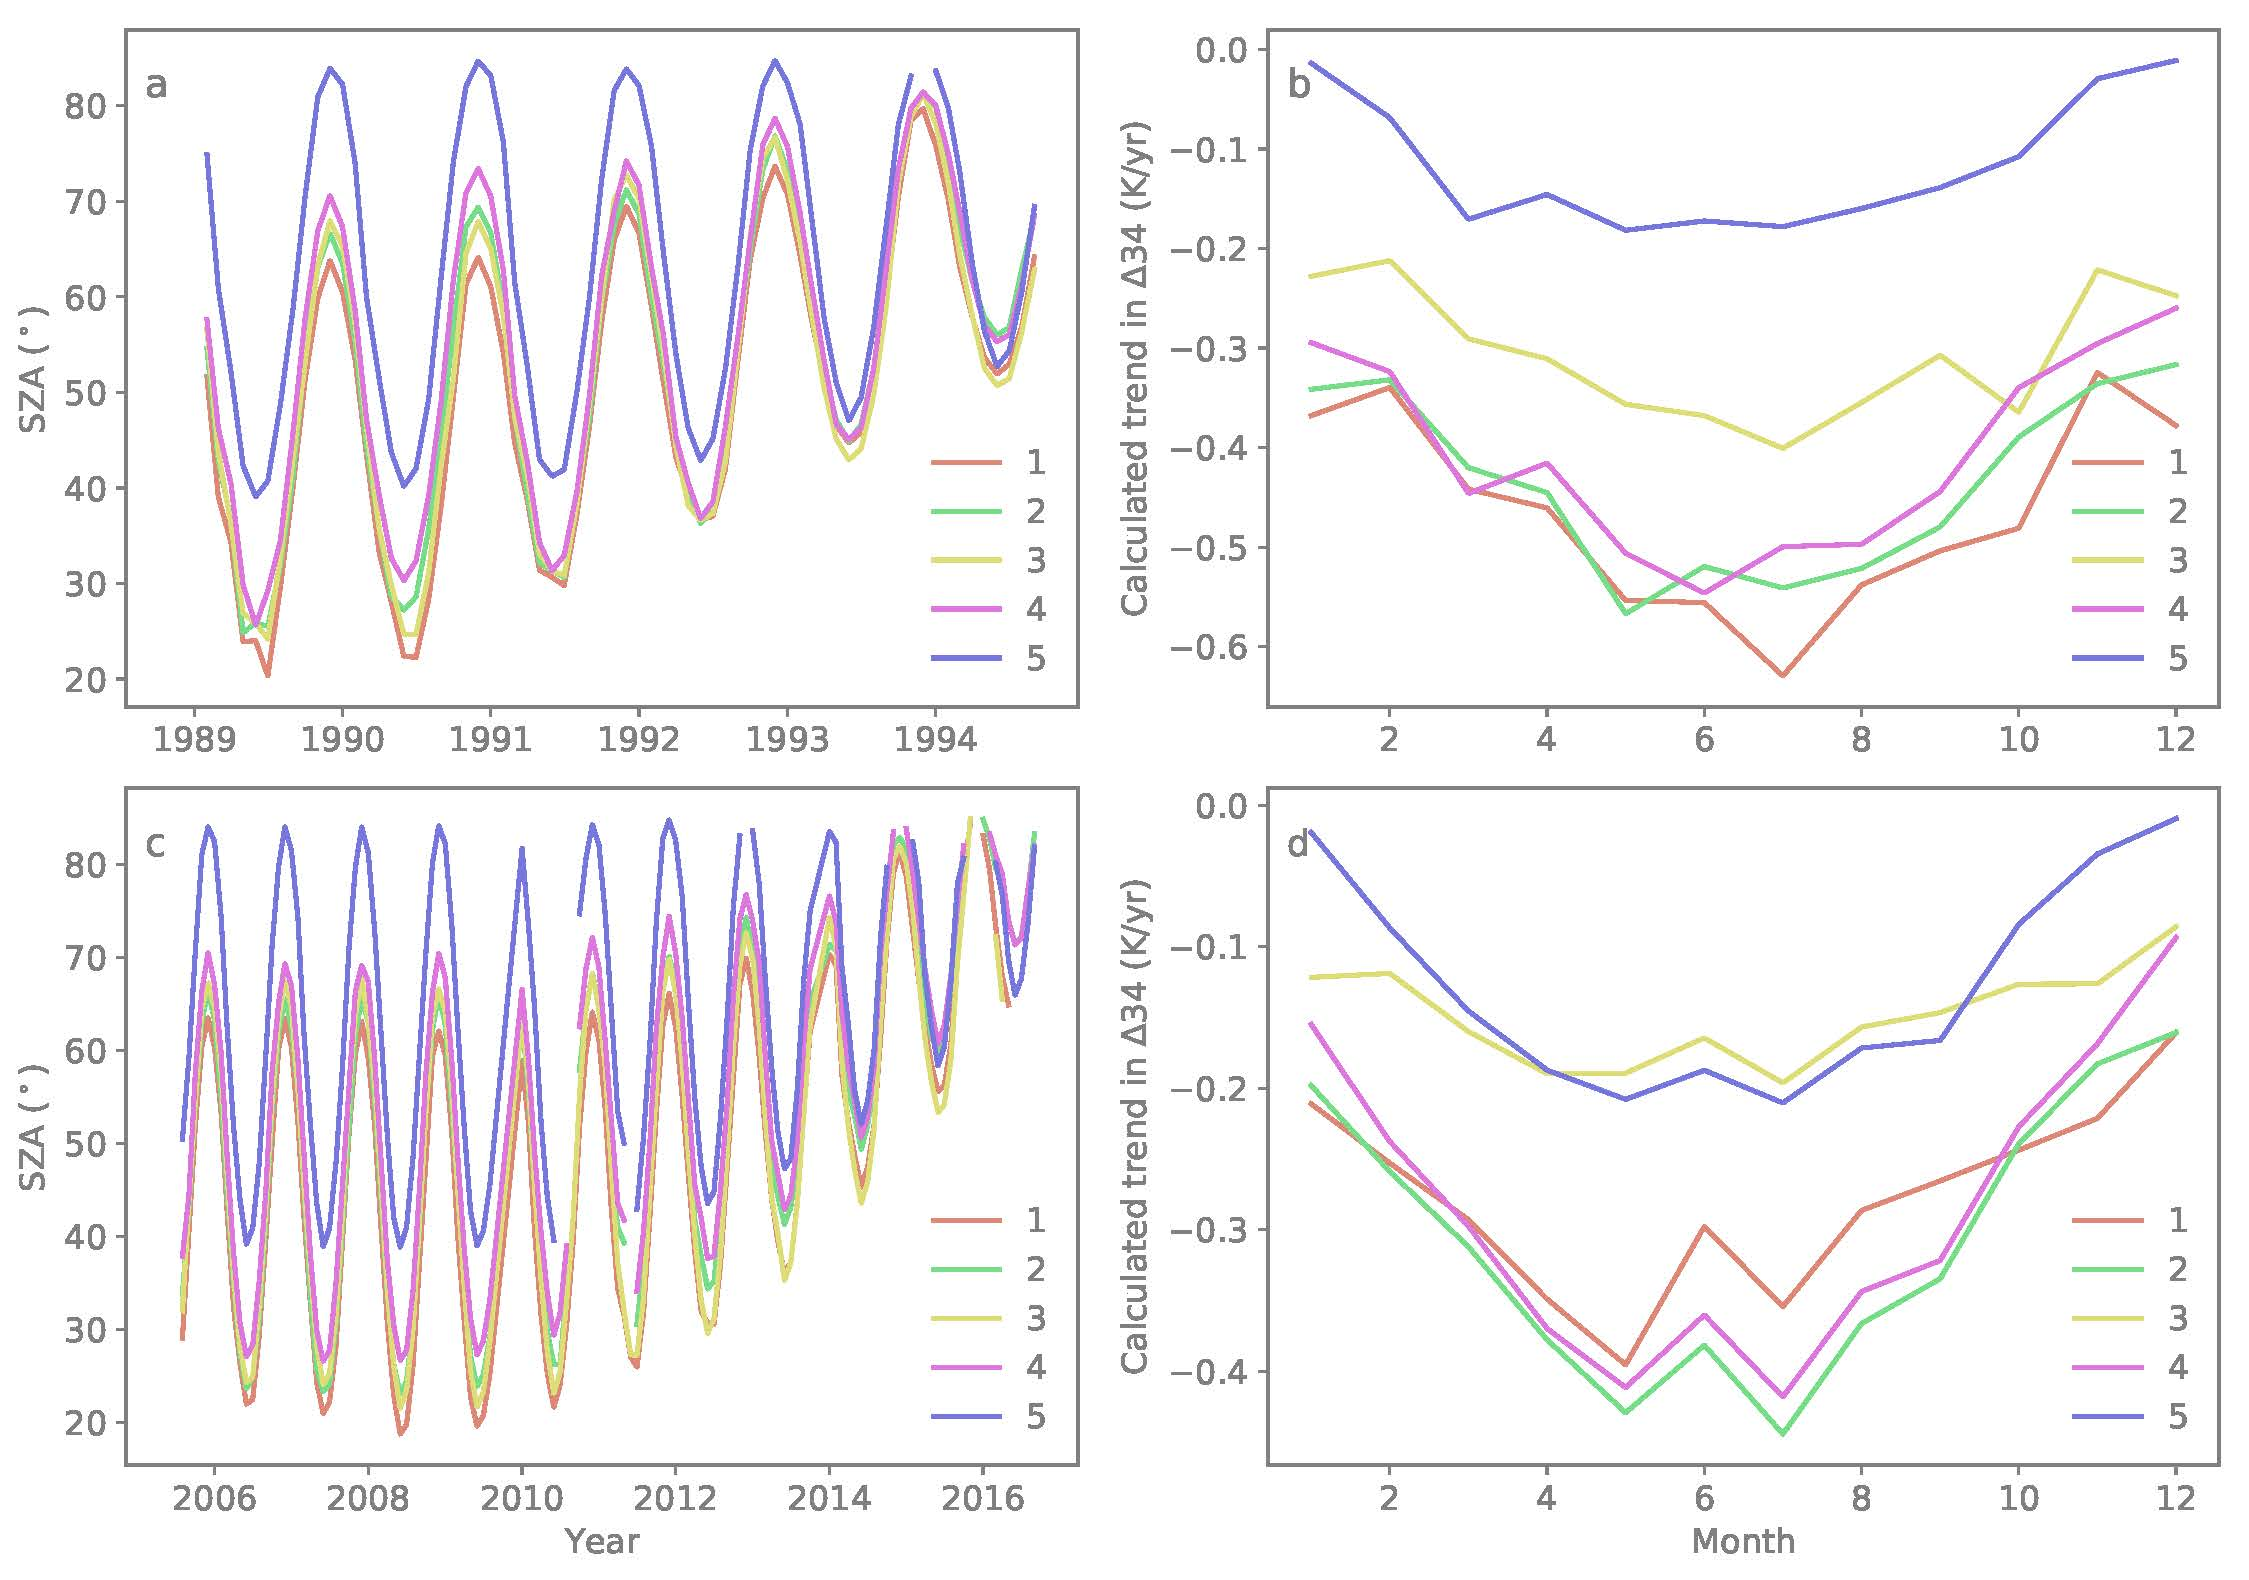
The trends of the observed SZA, ranging from 0.26 to 7.07 deg year, were significant for all considered NOAA platforms and regions with at least , except of NOAA-19 for regions 2 and 4. Largest slopes were found for NOAA-14 of 5.49 deg year, while NOAA-19 showed the smallest slope of 0.85 deg year for the five regions (see Table 2). As expected, the SZA slopes were higher in southern compared to the northern study regions (1 to 5) revealing its latitudinal pattern. This is illustrated in Figure 3a,c, which show the yearly cycle of the changing SZA over the lifetime of the afternoon NOAA-11 and NOAA-18 satellites and depict the regional differences in the study regions. For example, this resulted in July trends of 6.88 deg year and 2.67 deg year for regions 1 and 5 for NOAA-11.
3.3. Correlation of SZA and Background Temperatures
To quantify the influence of SZA trends on the fire detection algorithm, we regressed the SZA against the background temperatures of , , and (see Table 2). The regressions show a significant decrease () for all afternoon platforms considered in the AVH18 product with increasing SZA (see Table 2). These ranged from −0.42 to −0.73 K deg for and −0.35 to −0.65 K deg for , respectively and −0.03 to −0.09 K deg for (). The declining with increasing SZA leads to a more pronounced fire pixel signal, compared to respective background temperatures. This contrast facilitates more effective signal separation. In addition, non-fire background temperature can be biased and elevated by a high reflective component of the fire pixel (). With increasing SZA, the solar radiance component and consequently their effect on the background temperatures is also reduced.
The decrease in background temperatures was strongly dependent on regional land cover types in combination with latitudinally varying SZA. Figure 3b,d show a stronger resulting temperature relationship for the southern regions compared to the northernmost region (5) for NOAA-11 and less pronounced for NOAA-18. This was also the case for being slightly lower than with −0.61 to −0.59 K deg and −0.56 to −0.51 K deg for NOAA-11, respectively. However, as shown in Table 2, pronounced interregional differences exist due to varying land cover and land surface temperatures. Even though regions 1 and 2 were at similar latitudes, the background temperature dependence on SZA of these areas were quite different due to the existing land cover characteristics. In comparison with forested regions (2), agricultural land (1) showed overall higher background temperatures, as well as higher variability in these temperature values. In the first region type with higher slopes of and , the contrast of the fire pixel from its background diminished more with decreasing SZA, possibly leading to false alarms. Moreover, when becomes saturated and background temperatures are high, declines and omission errors can occur. As a result, the low saturation temperatures of the AVHRR, especially the AVHRR/2, MIR channel limits the separation of valid and falsely detected active fires over non-forested areas [21]. With the function of SZA, declining in agricultural land leads consequently to higher detection certainty (see Table 2).
The correlation between the SZA and background temperatures clearly indicated the impact of the orbital drift on these background conditions. The influence varied in magnitude and extent depending on regions, time of year, as well as land cover and vegetation types.
To better understand the relationship of the high July SZA trends to the fires’ background temperatures, we assessed their trends for this month. Using the trend in observed SZA, we calculated changes in , , and background temperatures over each satellite’s time span under the assumptions that all other conditions remain constant. NOAA-14 was affected most with the highest increasing trend in SZA of ∼7.07 deg year followed by NOAA-11. However, the strongest decline in the calculated July trends of () was obtained from NOAA-11 with values up to −4.11 K year (−3.55 K year) in region 1. As shown in Figure 3, calculated trends were more pronounced for NOAA-11 with a max. decrease of −0.56 K year for region 1 compared to NOAA-18 with a max. declining of −0.38 K year for region 2. These background conditions are impacted by several more factors, like natural change in meteorological conditions and land surface changes, which we did not consider.
3.4. Relative Changes in Active Fires
To quantify the effects of the orbital drifting on the number of detected fires, we calculated relative changes in fire pixels on both regional and European level. In particular, we selected scenes for each of the afternoon NOAA-09 to -19 satellites with observed fire activity during the month of July. Thereby, scenes with the maximum number of detected active fires were chosen in the early years after launch in the regions. We present you here three of those test scenes of satellites, which experienced the most drifting, but identical results can be achieved with any other satellite scene. These three test scenes have the following characteristics: (1) NOAA-11 (AVHRR/2), 1990-07-29 at 13:28 pm local time, with four active fire pixels in region 3, (2) NOAA-14 (AVHRR/2), 1995-07-23 at 12:02 pm local time, with 17 active fire pixels in region 4, (3) NOAA-18 (AVHRR/2), 2007-07-25 at 11:34 am local time, where 26 active fire pixels were detected in region 2.
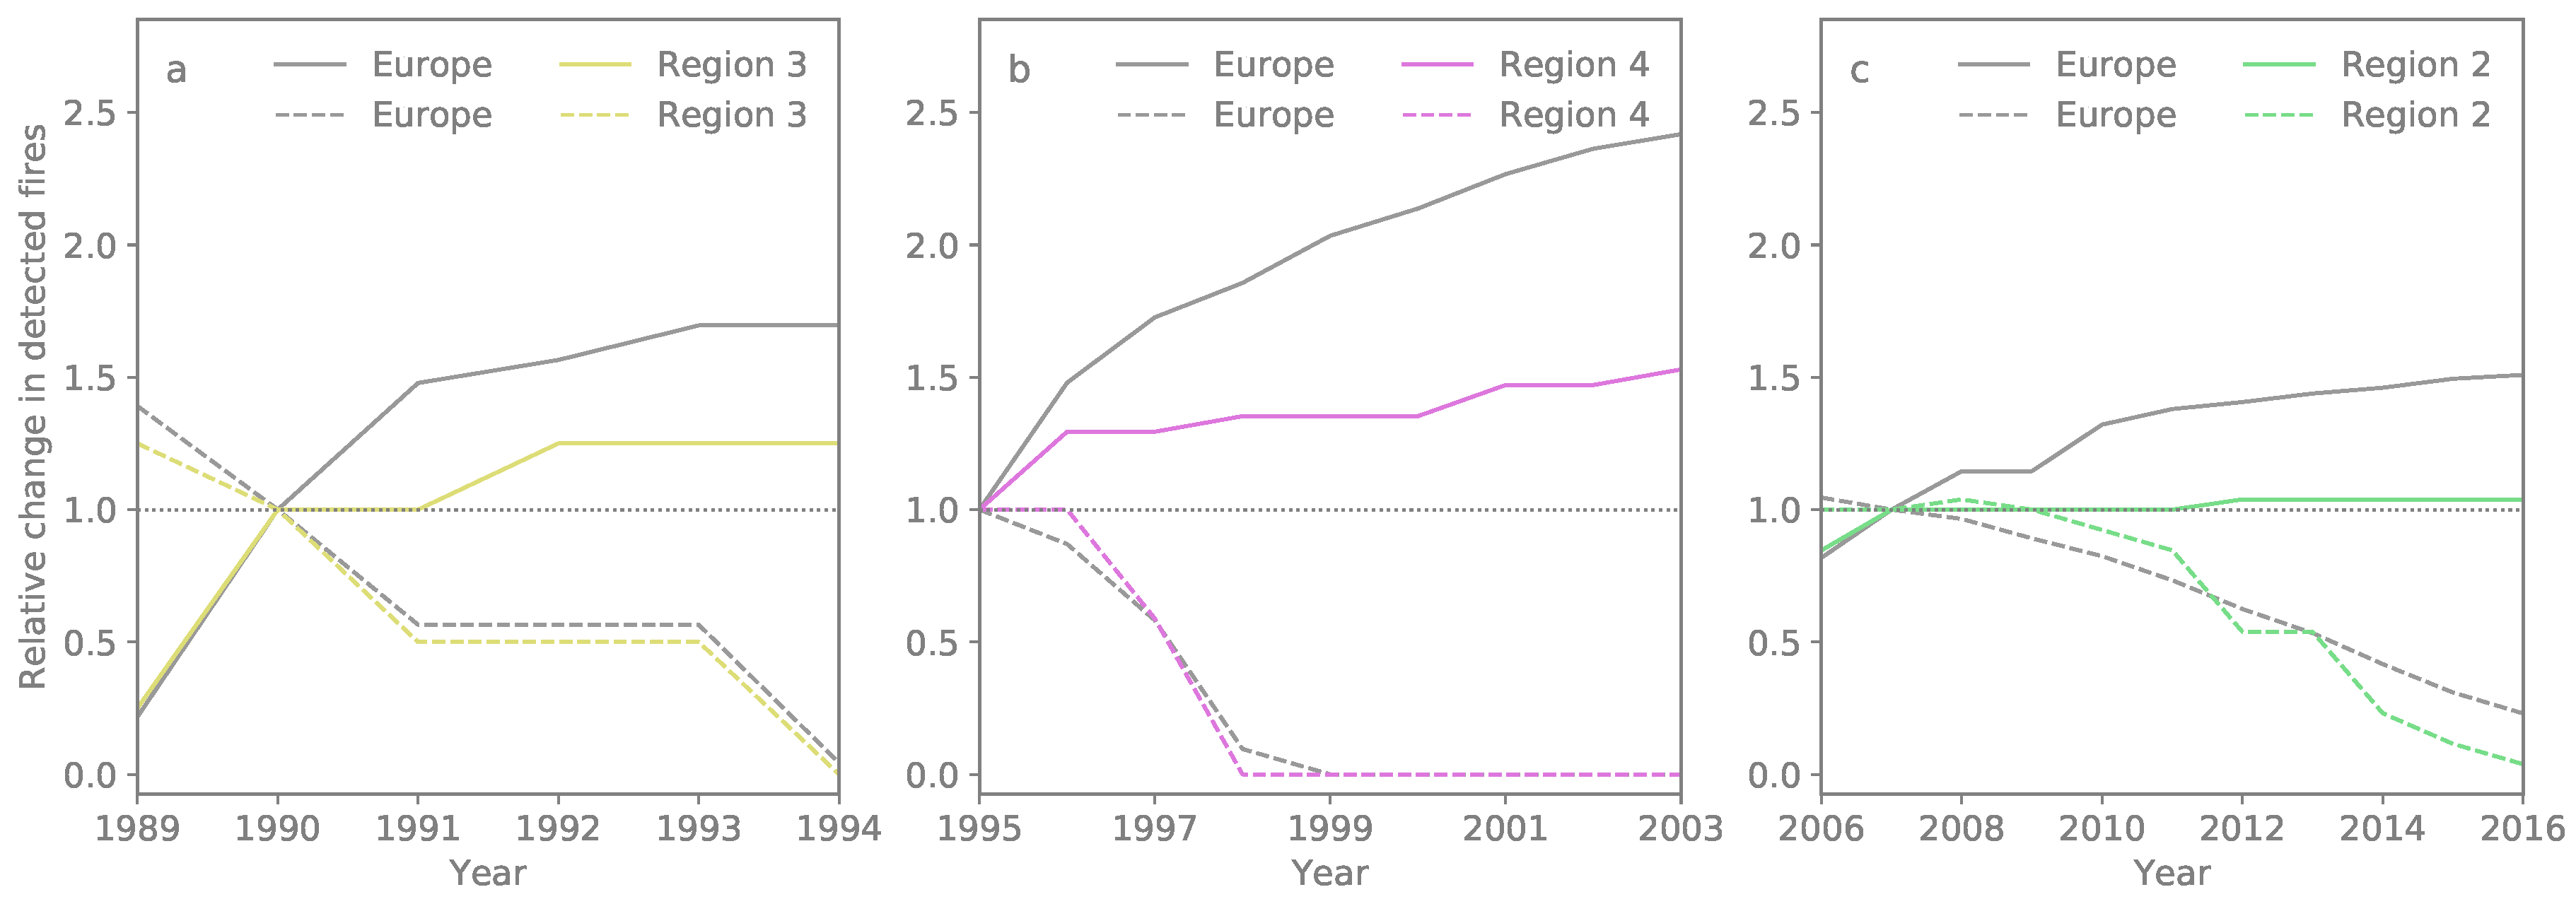
We defined two scenarios to calculate relative changes in detected fire pixels under the assumption that all other conditions remain constant. In the first scenario, we changed only the non-fire background conditions of , , and by multiplying this background temperatures with regionally calculated July trends (K year; see Table 2), with respect to the duration of satellite’s lifetime in years. In the second scenario (2), we changed the temperature of the fire pixel (), in addition to non-fire background temperatures of , , and and performed the same calculations by multiplying all with the regionally calculated July trends as before. In this way, we aim to simulate the effect of the changing SZA on both all (scenario 2) and only the temperature of background pixels in isolation from other effects (scenario 1). Figure 4 displays the changes of the apparent number of fires relative to the reference image. Results suggest in all regions (2, 3, and 4) an increase in the number of observed fires with drifting towards later time of the day in scenario 1 (dashed lines). On the contrary, we observed a decrease in the number of observed fire pixels under scenario 2 (solid lines).
With regards to scenario 1, an increase in SZA decreased the solar radiance component in and improved the separability of fire pixels from their background temperatures. A fire pixel associated with larger SZA was more pronounced against non-fire background pixels. In effect, these fire pixels can be detected with much higher certainty. This observation was demonstrated in our test scenes, which show an overall increase in the number of observed fire pixels (see Figure 4a–c). For scenario 1 and at the European scale, we observed an increase of ∼70% for NOAA-11. But note, that NOAA-11 detected only four active fires in this region, which would result in 25% change for each additional fire pixel. This was also reflected in the relative change of active fire pixels in the years before the reference image. A high increase was also found for NOAA-14, whereby we observed a smaller ∼50% increase on regional scale. For NOAA-18, these results were less pronounced with ∼50% on European and on regional scale with ≤ 5%. It is important to mention that NOAA-18 was drifting towards noon until 2008, which would have resulted in the opposite effect. This corresponds to decreasing SZA and a high reflective component in (see Figure 3). However, application of calculated trends in as well as and were not affected, since they were based on the calculated SZA trends. Therefore, its impact on relative changes in the active fire pixels in NOAA-18 were mostly cancelled out.
Overall, scenario 1 resulted in larger differences between the regional and European scale as seen in Figure 4a,c, compared to the relative changes between these scales in active fires for scenario 2. Here, we observed for all NOAA satellites a strong decrease on both regional and European scale, with similar declining slopes for both spatial scales. Including changes of the fire temperature in this scenario itself, this decrease resulted in almost 100% change in the apparent number of active fires calculated over the satellites’ lifetime. For NOAA-11, results of scenario 2 reflected again the limited number of detected active fires in the reference image. We observed the strongest decrease over a short time period in the apparent number of active fires for NOAA-14 indicated by the fast declining slope, which is related to the regional land cover characteristics and its temperatures. For NOAA-18, the relative changes in the apparent number of active fires resulted in a negative linear slope of ∼95% on regional and ∼75% on European scale. Overall, the decrease in the number of detected fires from scenario 2 is related to fewer pixels exceeding the initial threshold to be considered as potential fires. However, for both scenarios, the results at the European scale should be considered with caution, since the applied July trends are region-specific. Nevertheless, all regional trends have the same sign and subsequently, trends on European scale will at least qualitatively be the same as shown in Figure 4.
While improved algorithms’ detection capabilities were demonstrated for large and hot fires close to the saturation threshold as a function of SZA (described in [27]), a lower reflective part of with increasing SZA restricts the detection of small fires. Effects were found to be inconsistent, depending on the fire regime at regional level. Both scenarios identified land cover as a strong contributor to the relative change in active fire detection in region 3, covered by pastures and mixed forests (see Figure 4a). The relative change in the apparent number of active fires was about 100% for scenario 2 and ∼25% for scenario 1. However, as previously mentioned, this is also attributed to the limited number of fire pixels observed in this region. Scenario 2 is characterized by a steeper negative slope in region 4 (i.e., predominantly agricultural lands) compared to region 2 (i.e., comprised of mixed forests and pasture lands: see Figure 1). This comparison illustrates the influence of different land cover types on fire detection affected by SZA-induced temperature changes. Scenario 1 and 2 clearly showed, that higher SZA was strongly linked to fire and non-fire background temperatures affecting the differentiation of fires in agricultural areas, which led to the higher likelihood of spurious trends in this type of region.
Overall, relative changes that were calculated in this study were consistent with the aforementioned results. But given the small sample size for each of the afternoon NOAA-09 to -19 satellites in addition to the working assumption that all other factors remain constant, their results should be considered with a justified degree of caution.
4. Overall Discussion
The impact of the orbital drifting of NOAA satellites on derived long-term active fire records was assessed by disentangling two major impacts of the changes in local overpass time: (1) inconsistencies related to diurnal sampling of active fires, which show a pronounced diurnal cycle amplitude and (2) SZA effects on the radiometric contrast between fires and the non-fire background related to instrument calibration offsets. The latter was then used to calculate relative changes in detected active fires in test scenes of different NOAA afternoon satellites to quantify the magnitude of the drifting effect. Our analyses accounted for variations on number of fires over the day that have been related to regional fire regimes with their inherent types of burning.
Diurnal fire cycles and their varying peaks in fire activity have been detected with AVHRR in different regions across the globe in past studies by (e.g., [20,24,45]). Our results suggest a maximum change in the number of detected fires with a 90% decrease over NOAA-14 lifetime due to inconsistent sampling of the European fire cycle. On the regional scale, the effect was less pronounced when compared to the contributions of other factors like years with high fire activity. The assessment of regional differences according to existing fire regime is difficult and limited by the observed low fire activity on the boreal region, for instance. Especially in agricultural and pastures landscapes, different types of burning (i.e., agricultural waste, prescribed burning) with specific signatures in the diurnal fire cycle add to the observed large regional variation in fire activity.
The impacts of the drift are dependent on the satellites’ life time, which mostly amplified with the time in orbit up to ∼5 h delay. NOAA-11 and -14 are drifting the most out of the platforms considered and NOAA-19 is the least affected as also shown in former studies (e.g., [13]). The correlation of SZA and fire background temperatures showed a significant decrease in these temperatures for all satellites, which facilitates the separation of the fire pixel from its fire-free background. The magnitude depends strongly on the region and land cover types, which is in accordance with previous findings (e.g., [8]). Calculated trends in maximum July background temperature are the largest for NOAA-11 with July’s and of up to −4.11 K year and −3.55 K year.
To assess the magnitude of the orbital drift on the apparent number of fires, we calculated relative changes of active fire pixels in three regions, based on example scenes. The decrease in the number of fires with drifting towards later hours is consistent with findings in previously reported results. Simulations of scenario 1 showed an increase of about ≤5 to 50% on regional and ≥50% on European scale for NOAA-11, NOAA-14, and NOAA-18. For scenario 2, we observed a strong decrease in the number of observed fire pixels dependent on the regions and their land cover characteristics. Both scenarios illustrate that illumination induced temperature changes can have a profound influence of the active fire detection capabilities.
Assessing the influence of meteorological conditions on the interannual variability of background temperatures would provide additional information to analyze changes in interannual fire activity. Furthermore, it is advised to address land cover changes in future studies. The consistency of the time series is affected by several systematic errors besides the orbit drift, like fluctuation in the thermal channel calibration data [46] or inter-sensor differences [1]. It is challenging to correct AVHRR time series for orbital drifting but certain efforts have been undertaken in relation for example to SZA [47,48]. A minimization of the orbit drift effect can be also achieved by comprehensive pre-processing procedures. Nevertheless, a correction of this effect and its introduced bias in active fire time series is essential considering the application of AVHRR fire records for climatological studies.
5. Conclusions
Orbital drifting is one of the systematic error sources specific to each of the NOAA satellites. Our study presents an example of how severely the impact of orbital drift affects AVHRR active fire records of Europe, which have resulted in non-homogenous time series and biased trends. We used data of NOAA-09 to -19 afternoon satellites, considered in the AVH18 fire record, based on 1 km LAC imagery from 1985–2016. By choosing five regions in different biomes across Europe, we disentangled the regional prevailing fire regimes. We found a severe impact of the inconsistencies in diurnal sampling by orbital drifting on active fires. Solar illumination induced changes highly affected the detection capabilities of active fires with varying degrees of temperature contrast between the fire pixels and their background in relation to trends in SZA. Based on SZA July temperature trends, relative changes in detected fire pixels on regional scale were as high as ≤5 to 50% under scenario 1 and revealed a fast decrease against zero after four years of satellite launch under scenario 2. This underlines the importance of understanding and correcting orbital drift effects, which otherwise result in detection of false or spurious trends over even short active fire time series.
Besides the limitations and diverse caveats of the AVHRR heritage sensor, an added value for the detection of active fires with this instrument are its sampling characteristics. These support the observation of different parts of the diurnal fire cycles, dependent on the number of simultaneous operating satellites in orbit. AVHRR-based retrievals of long-term fire activity reveal its pattern from diurnal, seasonal, annual to decadal scales. This information becomes even more relevant with the recent occurrence of large fires with devastating consequences and their possible increased risk related to warmer and drier conditions [49] and projected fire weather season length [50]. Before the 2000s, AVHRR/2 and AVHRR/3 onboard NOAA platforms are the only sensors that could provide large scale observations of fire activity dating back to the 1980s (e.g., [21]).
Author Contributions
The idea was conceived by H.W. and refined by S.W. The software development, data processing and writing were mainly conducted by H.W. Both authors contributed to the interpretation of the results. S.W. provided supervision and review.
Funding
This study was funded by the Swiss National Science Foundation (SNSF) in the frame of the Sinergia project “Paleo fires from high-alpine ice cores” (Sinergia 154450).
Acknowledgments
We thank the Swiss National Science Foundation (SNSF) for funding this study as part of the Sinergia project “Paleo fires from high-alpine ice cores” (Sinergia 154450). We acknowledge the use of coordinate information on the Environment (CORINE) land cover classification (CLC) data (https://www.eea.europa.eu/data-and-maps/), which was acquired from the European Environmental Agency (EEA). Furthermore, the authors appreciate the used global land cover 2000 database of the European Commission, joint research centre, 2003. We also want to mention the open source projects used: LaTeX, IPython, Numpy, Matplotlib and Pandas. Special thanks goes to Christoph Neuhaus for maintaining the RSGB archive.
Conflicts of Interest
The authors declare no conflict of interest.
References
- Latifovic, R.; Pouliot, D.; Dillabaugh, C. Identification and correction of systematic error in NOAA AVHRR long-term satellite data record. Remote Sens. Environ. 2012, 127, 84–97. [Google Scholar] [CrossRef]
- Cracknell, A.P. The Advanced Very High Resolution Radiometer (AVHRR); CRC Press, Taylor & Francis Ltd.: London, UK, 1997; pp. 1–534. [Google Scholar]
- Rao, C.R.N. Pre-Launch Calibration of Channels 1 and 2 of the Advanced Very High Resolution Radiometer—NOAA Technical Report NESDIS 36; Satellite Research Laboratory, National Environmental Satellite, Data, and Information Service: Washington, DC, USA, 1987; pp. 1–62. [Google Scholar]
- Heidinger, A.K.; Straka, W.C.; Molling, C.C.; Sullivan, J.T.; Wu, X. Deriving an inter-sensor consistent calibration for the AVHRR solar reflectance data record. Int. J. Remote Sens. 2010, 31, 6493–6517. [Google Scholar] [CrossRef]
- Privette, J.; Fowler, C.; Wick, G.; Baldwin, D.; Emery, W. Effects of orbital drift on advanced very high resolution radiometer products: Normalized difference vegetation index and sea surface temperature. Remote Sens. Environ. 1995, 53, 164–171. [Google Scholar] [CrossRef]
- Brunel, P.; Marsouin, A. Operational AVHRR navigation results. Int. J. Remote Sens. 2000, 21, 951–972. [Google Scholar] [CrossRef]
- Price, J.C. Timing of NOAA afternoon passes. Int. J. Remote Sens. 1991, 12, 193–198. [Google Scholar] [CrossRef]
- Gutman, G.G. On the monitoring of land surface temperatures with the NOAA/ AVHRR: Removing the effect of satellite orbit drift. Int. J. Remote Sens. 1999, 20, 3407–3413. [Google Scholar] [CrossRef]
- Ignatov, A.; Laszlo, I.; Harrod, E.D.; Kidwell, K.B.; Goodrum, G.P. Equator crossing times for NOAA, ERS and EOS sun-synchronous satellites. Int. J. Remote Sens. 2004, 25, 5255–5266. [Google Scholar] [CrossRef]
- John, V.O.; Holl, G.; Buehler, S.A.; Candy, B.; Saunders, R.W.; Parker, D.E. Understanding intersatellite biases of microwave humidity sounders using global simultaneous nadir overpasses. J. Geophys. Res. Atmos. 2012, 117, 1–13. [Google Scholar] [CrossRef]
- Gutman, G.G.; Masek, J.G. Long-term time series of the Earth’s land-surface observations from space. Int. J. Remote Sens. 2012, 33, 4700–4719. [Google Scholar] [CrossRef]
- Devasthale, A.; Karlsson, K.G.; Quaas, J.; Grassl, H. Correcting orbital drift signal in the time series of AVHRR derived convective cloud fraction using rotated empirical orthogonal function. Atmos. Meas. Tech. 2012, 5, 267–273. [Google Scholar] [CrossRef] [Green Version]
- Ji, L.; Brown, J.F. Effect of NOAA satellite orbital drift on AVHRR-derived phenological metrics. Int. J. Appl. Earth Observ. Geoinform. 2017, 62, 215–223. [Google Scholar] [CrossRef]
- Lieberherr, G.; Wunderle, S. Lake Surface Water Temperature Derived from 35 Years of AVHRR Sensor Data for European Lakes. Remote Sens. 2018, 10, 990. [Google Scholar] [CrossRef]
- Moritz, M.A.; Batllori, E.; Bradstock, R.A.; Gill, A.M.; Handmer, J.; Hessburg, P.F.; Leonard, J.; McCaffrey, S.; Odion, D.C.; Schoennagel, T.; et al. Learning to coexist with wildfire. Nature 2014, 515, 58–66. [Google Scholar] [CrossRef] [PubMed]
- Bowman, D.M.J.S.; Williamson, G.J.; Abatzoglou, J.T.; Kolden, C.A.; Cochrane, M.A.; Smith, A.M.S. Human exposure and sensitivity to globally extreme wildfire events. Nat. Ecol. Evol. 2017, 1, 1–6. [Google Scholar] [CrossRef] [PubMed]
- Kehrwald, N.M.; Whitlock, C.; Barbante, C.; Brovkin, V.; Daniau, A.L.; Kaplan, J.O.; Marlon, J.R.; Power, M.J.; Thonicke, K.; van der Werf, G.R. Fire Research: Linking Past, Present, and Future Data. Eos Trans. Am. Geophys. Union 2013, 94, 421–422. [Google Scholar] [CrossRef] [Green Version]
- IPCC. Climate Change 2013—The Physical Science Basis. Contribution of Working Group I to the Fifth Assessment Report of the Intergovernmental Panel on Climate Change; Cambridge University Press: Cambridge, UK, 2013; p. 1535. [Google Scholar] [CrossRef]
- IPCC. Climate Change 2014: Synthesis Report. Contribution of Working Groups I, II and III to the Fifth Assessment Report of the Intergovernmental Panel on Climate Change; IPCC: Geneva, Switzerland, 2014; p. 151. [Google Scholar]
- Giglio, L. Characterization of the tropical diurnal fire cycle using VIRS and MODIS observations. Remote Sens. Environ. 2007, 108, 407–421. [Google Scholar] [CrossRef]
- Csiszar, I.A. Interannual changes of active fire detectability in North America from long-term records of the advanced very high resolution radiometer. J. Geophys. Res. 2003, 108, 4075. [Google Scholar] [CrossRef]
- Plank, S.; Fuchs, E.m.; Frey, C. A Fully Automatic Instantaneous Fire Hotspot Detection Processor Based on AVHRR Imagery—A TIMELINE Thematic Processor. Remote Sens. 2017, 9, 30. [Google Scholar] [CrossRef]
- Weber, H.; Wunderle, S. A 30 year AVHRR active fire product of Europe: Algorithm & accuracy assessment. Remote Sens. Environ. 2019, in press. [Google Scholar]
- Eva, H.; Lambin, E.F. Remote Sensing of Biomass Burning in Tropical Regions: Sampling Issues and Multisensor Approach. Remote Sens. Environ. 1998, 64, 292–315. [Google Scholar] [CrossRef]
- Hüsler, F.; Fontana, F.; Neuhaus, C.; Riffler, M.; Musial, J.P.; Wunderle, S. AVHRR Archive and Processing Facility at the University of Bern: A comprehensive 1-km satellite data set for climate change studies. EARSeL Proc. 2011, 10, 83–101. [Google Scholar]
- Dozier, J. A method for satellite identification of surface temperature fields of subpixel resolution. Remote Sens. Environ. 1981, 11, 221–229. [Google Scholar] [CrossRef]
- Giglio, L.; Kendall, J.D.; Justice, C.O. Evaluation of global fire detection algorithms using simulated AVHRR infrared data. Int. J. Remote Sens. 1999, 20, 1947–1985. [Google Scholar] [CrossRef]
- Justice, C.O.; Giglio, L.; Korontzi, S.; Owens, J.; Morisette, J.T.; Roy, D.P.; Descloitres, J.; Alleaume, S.; Petitcolin, F.; Kaufman, Y.J. The MODIS fire products. Remote Sens. Environ. 2002, 83, 244–262. [Google Scholar] [CrossRef]
- Robinson, J.M. Fire from space: Global fire evaluation using infrared remote sensing. Int. J. Remote Sens. 1991, 12, 3–24. [Google Scholar] [CrossRef]
- Csiszar, I.A.; Sullivan, J. Recalculated pre-launch saturation temperatures of the AVHRR 3.7 μm sensors on board the TIROS-N to NOAA-14 satellites. Int. J. Remote Sens. 2002, 23, 5271–5276. [Google Scholar] [CrossRef]
- McGregor, J.; Gorman, A.J. Some considerations for using AVHRR data in climatological studies: I. Orbital characteristics of NOAA satellites. Int. J. Remote Sens. 1994, 15, 537–548. [Google Scholar] [CrossRef]
- Pausas, J.G.; Paula, S. Fuel shapes the fire-climate relationship: Evidence from Mediterranean ecosystems. Glob. Ecol. Biogeogr. 2012, 21, 1074–1082. [Google Scholar] [CrossRef]
- San-Miguel-Ayanz, J.; Camia, A. Mapping the Impacts of Recent Natural Disasters and Technological Accidents in Europe—An Overview of the Last Decade; European Environment Agency: Copenhagen, Denmark, 2010; pp. 47–53. [Google Scholar]
- Chuvieco, E.; Giglio, L.; Justice, C.O. Global characterization of fire activity: Toward defining fire regimes from Earth observation data. Glob. Chang. Biol. 2008, 14, 1488–1502. [Google Scholar] [CrossRef]
- Olson, D.M.; Dinerstein, E.; Wikramanayake, E.D.; Burgess, N.D.; Powell, G.V.N.; Underwood, E.C.; D’amico, J.A.; Itoua, I.; Strand, H.E.; Morrison, J.C.; et al. Terrestrial Ecoregions of the World: A New Map of Life on Earth. BioScience 2001, 51, 933–938. [Google Scholar] [CrossRef]
- Heymann, Y.; Steenmans, C.; Croisille, G.; Bossard, M.; Lenco, M.; Wyatt, B.; Weber, J.L.; O’Brian, C.; Cornaert, M.H.; Nicolas, S. Corine Land Cover Technical Guide, Part I.; Office for Official Publications of the European Communities: Luxemburg, 1994. [Google Scholar]
- Koutsias, N.; Arianoutsou, M.; Kallimanis, A.S.; Mallinis, G.; Halley, J.M.; Dimopoulos, P. Agricultural and Forest Meteorology Where did the fires burn in Peloponnisos, Greece the summer of 2007? Evidence for a synergy of fuel and weather. Agric. For. Meteorol. 2012, 156, 41–53. [Google Scholar] [CrossRef]
- San-Miguel-Ayanz, J.; Moreno, J.M.; Camia, A. Analysis of large fires in European Mediterranean landscapes: Lessons learned and perspectives. For. Ecol. Manag. 2013, 294, 11–22. [Google Scholar] [CrossRef]
- Turco, M.; Bedia, J.; Di Liberto, F.; Fiorucci, P.; von Hardenberg, J.; Koutsias, N.; Llasat, M.C.; Xystrakis, F.; Provenzale, A. Decreasing Fires in Mediterranean Europe. PLoS ONE 2016, 11, e0150663. [Google Scholar] [CrossRef] [PubMed]
- San-Miguel-Ayanz, J.; Schulte, E.; Schmuck, G.; Camia, A.; Strobl, P.; Libertà, G.; Giovando, C.; Boca, R.; Sedano, F.; Kempeneer, P.; et al. Comprehensive Monitoring of Wildfires in Europe: The European Forest Fire Information System ( EFFIS ). In Approaches to Managing Disaster—Assessing Hazards, Emergencies and Disaster Impacts; Tiefenbacher, J., Ed.; IntechOpen: London, UK, 2012; pp. 87–108. [Google Scholar]
- Ganteaume, A.; Camia, A.; Jappiot, M.; San-Miguel-Ayanz, J.; Long-Fournel, M.; Lampin, C. A Review of the Main Driving Factors of Forest Fire Ignition Over Europe. Environ. Manag. 2013, 51, 651–662. [Google Scholar] [CrossRef] [PubMed]
- Larjavaara, M.; Pennanen, J.; Tuomi, T.J. Lightning that ignites forest fires in Finland. Agric. For. Meteorol. 2005, 132, 171–180. [Google Scholar] [CrossRef]
- Moreira, F.; Viedma, O.; Arianoutsou, M.; Curt, T.; Koutsias, N.; Rigolot, E.; Barbati, A.; Corona, P.; Vaz, P.; Xanthopoulos, G.; et al. Landscape–wildfire interactions in southern Europe: Implications for landscape management. J. Environ. Manag. 2011, 92, 2389–2402. [Google Scholar] [CrossRef] [PubMed]
- Jacobson, M.Z. Fundamentals of Atmospheric Modeling, 2nd ed.; Cambridge University Press: Cambridge, UK, 2005; p. 813. [Google Scholar]
- Langaas, S. Temporal and Spatial Distribution of Savanna Fires in Senegal and the Gambia, West Africa, 1989-90, Derived From Multi-Temporal AVHRR Night Images. Int. J. Wildl. Fire 1992, 2, 21. [Google Scholar] [CrossRef]
- Trishchenko, A.P. Trends and uncertainties in thermal calibration of AVHRR radiometers onboard NOAA-9 to NOAA-16. J. Geophys. Res. 2002, 107, 4778. [Google Scholar] [CrossRef]
- Pinzón, J.E.; Brown, M.E.; Tucker, C.J. EMD Correction of orbital drift artifacts in satellite data stream. In Hilbert-Huang Transform and Its Applications; Huang, N.E., Shen, S.S., Eds.; World Scientific Publishing Co. Pte. Ltd.: Singapore, 2014; pp. 241–260. [Google Scholar] [CrossRef]
- Sobrino, J.A.; Julien, Y.; Atitar, M.; Nerry, F. NOAA-AVHRR Orbital Drift Correction From Solar Zenithal Angle Data. IEEE Trans. Geosci. Remote Sens. 2008, 46, 4014–4019. [Google Scholar] [CrossRef] [Green Version]
- Turco, M.; Rosa-Cánovas, J.J.; Bedia, J.; Jerez, S.; Montávez, J.P.; Llasat, M.C.; Provenzale, A. Exacerbated fires in Mediterranean Europe due to anthropogenic warming projected with non-stationary climate-fire models. Nat. Commun. 2018, 9, 3821. [Google Scholar] [CrossRef] [PubMed]
- Jolly, W.M.; Cochrane, M.A.; Freeborn, P.H.; Holden, Z.A.; Brown, T.J.; Williamson, G.J.; Bowman, D.M.J.S. Climate-induced variations in global wildfire danger from 1979 to 2013. Nat. Commun. 2015, 6, 7537. [Google Scholar] [CrossRef] [PubMed] [Green Version]
Figure 1.
The map displays the geographical location of the five regions across Europe’s major biomes. These biomes include the mediterranean, temperate, and boreal from south–north and east–west. The boxes illustrate the selected regions at 1 × 1 spatial resolution and their subregions (with a size of 0.5).

Figure 2.
Annual mean local hour and relative number of mean yearly active fire pixels retrieved from the Advanced Very High Resolution Radiometer (AVHRR) active fire product (AVH18). The local hour refers to the overhead time of the National Oceanic and Atmospheric Administration (NOAA) satellites above Bern, Switzerland. Some satellites overpassed Europe twice at daytime ∼102 min apart, which is indicated by the annual mean minimum and maximum overpass time (a). However, each of the regions were typically covered by only one of these overpasses. The relative number of mean yearly active fire pixels are shown for Europe (b) and relative to the maximum observed value for the regions 1 to 5 (c–g). Note, that very few fires were detected in region 5 and none of them by NOAA-12.

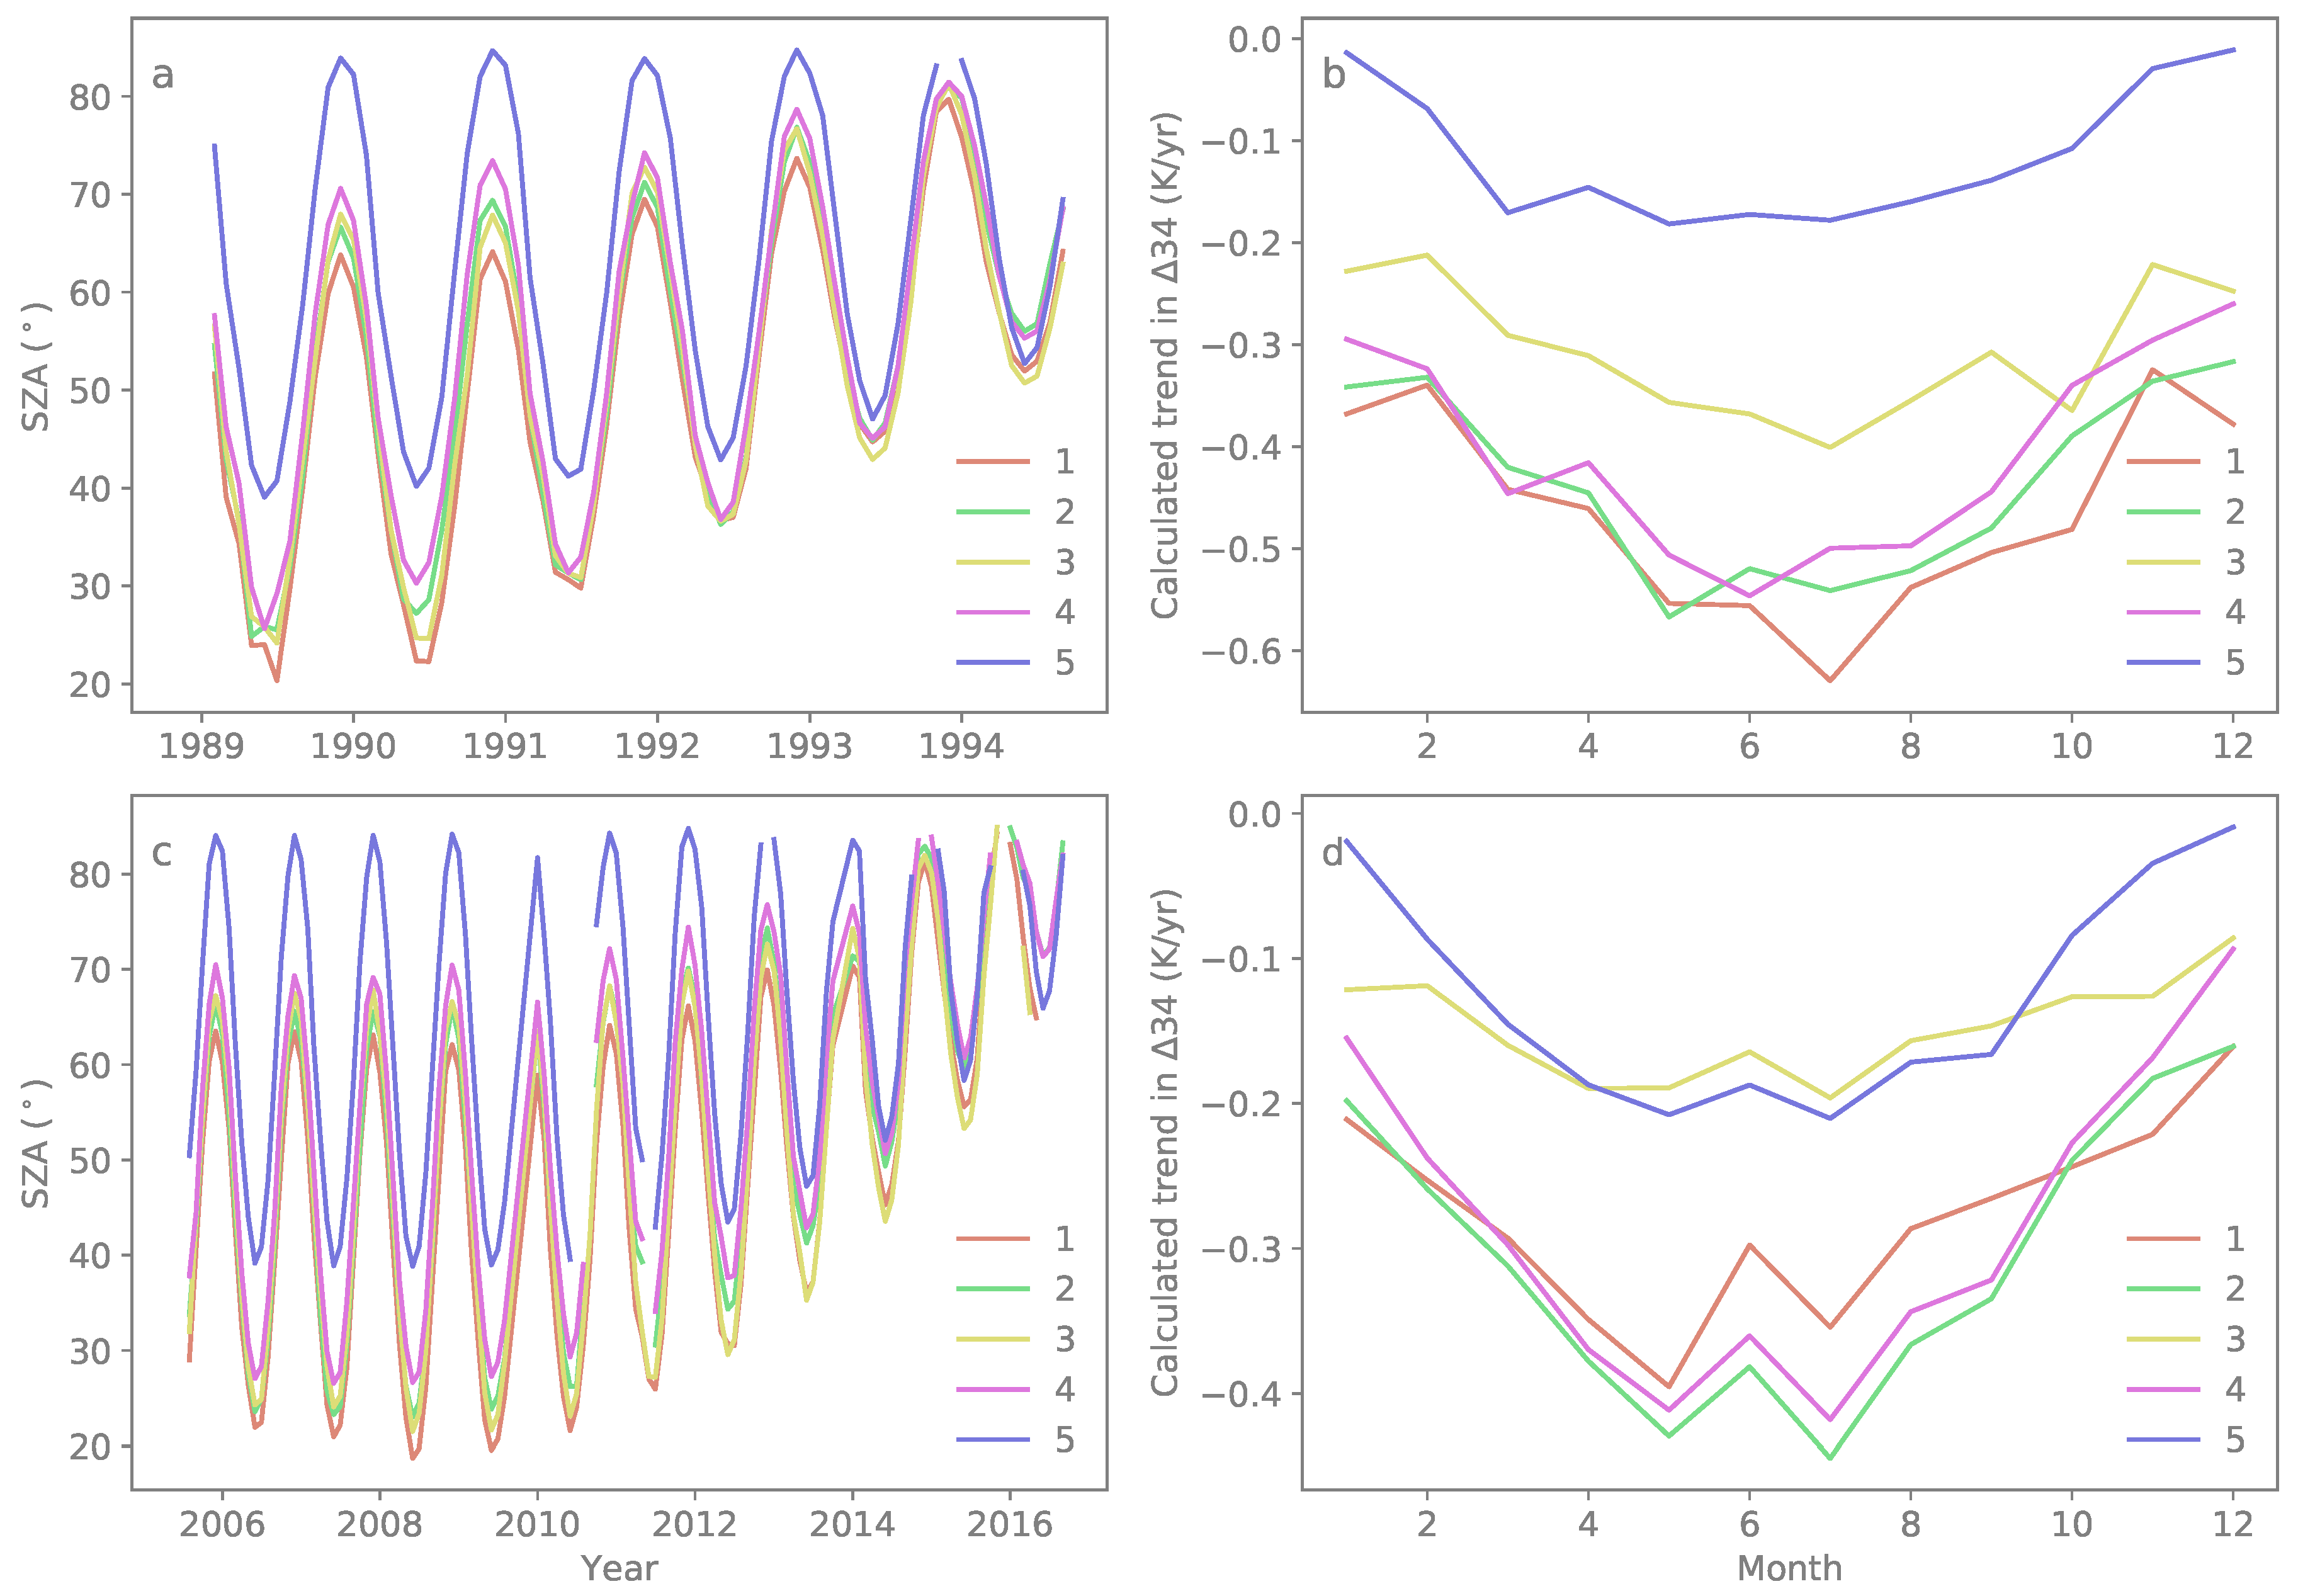
Figure 3.
Sun zenith angle (SZA) and calculated monthly trends in shown for the five study regions for NOAA-11 and NOAA-18. Both platforms exhibit a pronounced orbital drifting indicated by the increase in SZA over each platforms life time, whereby NOAA-11 (a) experiences a stronger drift over a shorter lifetime compared to NOAA-18 (c). Note, that NOAA-18 was drifting towards noon until 2009, resulting in lower SZA values. The gap in year 2009 of the NOAA-18 time series in region 5 results from clouds obscuring the region. Panels (b) for NOAA-11 and (d) for NOAA-18 illustrate the calculated monthly mean trends in .

Figure 4.
Relative change in the apparent number of active fires calculated over the satellites’ lifetime: (a) NOAA-11 image 1990-07-29, (b) NOAA-14 image 1995-07-23, and (c) NOAA-18 image 2007-07-25. Only three examples were selected here for illustration purposes but identically results were found for other scenes and satellites. The calculations are based on two scenarios with calculated trends only in non-fire background temperatures (solid lines; scenario 1) and including temperatures of the fire pixels (dashed lines; scenario 2) based on the SZA trends both for the regional (2, 3, 4) and European scale. Note, the different lifetime and related impact of the orbital drift of the NOAA satellites.


Table 1.
List of the five study regions, with the specific biomes (after [35]) and characteristic land cover types. The predominant land cover types are classified according to the CORINE land cover (here, CLC2012; Version 18) by the European Environment Agency (EEA) Copernicus program [36] and are listed in decreasing order of frequency.
| Region | Biome | Characteristics |
|---|---|---|
| 1 | Mediterranean Forests, Woodlands & Scrub | Arable land, permanent crops, semi-deciduous forests |
| 2 | Mediterranean Forests, Woodlands & Scrub | Mountain mixed forests, pastures and mosaics |
| 3 | Temperate Broadleaf & Mixed Forests | Pastures and mosaics, mixed forests, scrub |
| 4 | Temperate Broadleaf & Mixed Forests | Arable land, permanent crops, pastures, mixed forests |
| 5 | Boreal Forests/Taiga | Forest, arable land |
Table 2.
Interannual changes in sun zenith angle (SZA) related to background temperatures. For each region, we show the correlation of the monthly mean SZA with the , , and and the monthly mean SZA trends of July of the afternoon platforms NOAA-09, -11, -14, -16, -18, and -19. Significant trends are denoted by asterisks (* , ** , *** ). Based on these trends, we calculated the July trends in , , and over the lifetime of each platform under the assumption that all other conditions remain stable.
| Satellite | Region | BT3/SZA (K deg) | BT4/SZA (K deg) | BT34/SZA (K deg) | SZA Trend (deg year) | Calc. Trend | ||
|---|---|---|---|---|---|---|---|---|
(K year) | (K year) | (K year) | ||||||
| NOAA-09 | 1 | −0.68 *** | −0.63 *** | −0.04 *** | 4.92 * | −3.34 | −3.11 | −0.22 |
| 2 | −0.50 *** | −0.44 *** | −0.06 *** | 6.37 ** | −3.24 | −2.83 | −0.40 | |
| 3 | −0.45 *** | −0.40 *** | −0.05 *** | 4.94 * | −2.26 | −2.01 | −0.25 | |
| 4 | −0.63 *** | −0.54 *** | −0.08 *** | 5.90 * | −3.71 | −3.2 | −0.47 | |
| 5 | −0.65 *** | −0.61 *** | −0.03 *** | 3.67 * | −2.38 | −2.24 | −0.14 | |
| NOAA-11 | 1 | −0.59 *** | −0.51 *** | −0.08 *** | 6.88 *** | −4.11 | −3.55 | −0.56 |
| 2 | −0.51 *** | −0.44 *** | −0.07 *** | 6.21 ** | −3.21 | −2.75 | −0.46 | |
| 3 | −0.50 *** | −0.43 *** | −0.07 *** | 5.74 *** | −2.88 | −2.48 | −0.40 | |
| 4 | −0.62 *** | −0.53 *** | −0.08 *** | 5.17 ** | −3.23 | −2.78 | −0.45 | |
| 5 | −0.61 *** | −0.56 *** | −0.04 *** | 2.67 ** | −1.64 | −1.51 | −0.12 | |
| NOAA-14 | 1 | −0.59 *** | −0.49 *** | −0.09 *** | 5.74 *** | −3.41 | −2.84 | −0.56 |
| 2 | −0.48 *** | −0.39 *** | −0.09 *** | 7.07 *** | −3.41 | −2.77 | −0.64 | |
| 3 | −0.43 *** | −0.35 *** | −0.07 *** | 4.78 *** | −2.06 | −1.70 | −0.36 | |
| 4 | −0.59 *** | −0.51 *** | −0.07 *** | 6.26 *** | −3.69 | −3.20 | −0.48 | |
| 5 | −0.62 *** | −0.55 *** | −0.06 *** | 3.58 ** | −2.23 | −1.98 | −0.24 | |
| NOAA-16 | 1 | −0.73 *** | −0.65 *** | −0.07 *** | 3.92 *** | −2.87 | −2.58 | −0.29 |
| 2 | −0.60 *** | −0.55 *** | −0.05 *** | 3.31 *** | −1.98 | −1.82 | −0.16 | |
| 3 | −0.49 *** | −0.42 *** | −0.06 *** | 3.55 *** | −1.75 | −1.51 | −0.24 | |
| 4 | −0.70 *** | −0.64 *** | −0.06 *** | 2.83 *** | −2.00 | −1.82 | −0.18 | |
| 5 | −0.64 *** | −0.55 *** | −0.08 *** | 0.26 *** | −0.16 | −0.14 | −0.02 | |
| NOAA-18 | 1 | −0.61 *** | −0.52 *** | −0.09 *** | 3.64 *** | −2.22 | −1.88 | −0.34 |
| 2 | −0.48 *** | −0.40 *** | −0.08 *** | 4.68 *** | −2.26 | −1.89 | −0.38 | |
| 3 | −0.42 *** | −0.36 *** | −0.06 *** | 3.04 ** | −1.28 | −1.09 | −0.19 | |
| 4 | −0.57 *** | −0.49 *** | −0.08 *** | 4.29 *** | −2.45 | −2.10 | −0.35 | |
| 5 | −0.61 *** | −0.53 *** | −0.07 *** | 2.44 *** | −1.48 | −1.30 | −0.18 | |
| NOAA-19 | 1 | −0.67 *** | −0.61 *** | −0.07 *** | 1.03 * | −0.69 | −0.63 | −0.07 |
| 2 | −0.56 *** | −0.50 *** | −0.06 *** | 1.03 | −0.57 | −0.51 | −0.06 | |
| 3 | −0.45 *** | −0.41 *** | −0.04 *** | 0.82 * | −0.37 | −0.33 | −0.03 | |
| 4 | −0.68 *** | −0.62 *** | −0.06 *** | 0.92 | −0.63 | −0.57 | −0.06 | |
| 5 | −0.65 *** | −0.59 *** | −0.07 *** | 0.43 * | −0.28 | −0.25 | −0.03 | |
© 2019 by the authors. Licensee MDPI, Basel, Switzerland. This article is an open access article distributed under the terms and conditions of the Creative Commons Attribution (CC BY) license (http://creativecommons.org/licenses/by/4.0/).
Share and Cite
MDPI and ACS Style
Weber, H.; Wunderle, S. Drifting Effects of NOAA Satellites on Long-Term Active Fire Records of Europe. Remote Sens. 2019, 11, 467. https://0-doi-org.brum.beds.ac.uk/10.3390/rs11040467
AMA Style
Weber H, Wunderle S. Drifting Effects of NOAA Satellites on Long-Term Active Fire Records of Europe. Remote Sensing. 2019; 11(4):467. https://0-doi-org.brum.beds.ac.uk/10.3390/rs11040467
Chicago/Turabian StyleWeber, Helga, and Stefan Wunderle. 2019. "Drifting Effects of NOAA Satellites on Long-Term Active Fire Records of Europe" Remote Sensing 11, no. 4: 467. https://0-doi-org.brum.beds.ac.uk/10.3390/rs11040467
Note that from the first issue of 2016, this journal uses article numbers instead of page numbers. See further details here.