Multi-Channel Optical Receiver for Ground-Based Topographic Hyperspectral Remote Sensing


Department of Civil Engineering, University of Arkansas, 4190 Bell Engineering Center, Fayetteville, AR 72701, USA
*
Author to whom correspondence should be addressed.
Remote Sens. 2019, 11(5), 578; https://0-doi-org.brum.beds.ac.uk/10.3390/rs11050578
Submission received: 21 January 2019
/
Revised: 28 February 2019
/
Accepted: 5 March 2019
/
Published: 9 March 2019
(This article belongs to the Special Issue Hyperspectral Imaging for Fine to Medium Scale Applications in Environmental Sciences)
Abstract
:Receiver design is integral to the development of a new remote sensor. An effective receiver delivers backscattered light to the detector while optimizing the signal-to-noise ratio at the desired wavelengths. Towards the goal of effective receiver design, a multi-channel optical receiver was developed to collect range-resolved, backscattered energy for simultaneous hyperspectral and differential absorption spectrometry (LAS) measurements. The receiver is part of a new, ground-based, multi-mode lidar instrument for remote characterization of soil properties. The instrument, referred to as the soil observation laser absorption spectrometer (SOLAS), was described previously in the literature. A detailed description of the multi-channel receiver of the SOLAS is presented herein. The hyperspectral channel receives light across the visible near-infrared (VNIR) to shortwave infrared (SWIR) spectrum (350–2500 nm), while the LAS channel was optimized for detection in a narrower portion of the near-infrared range (820–850 nm). The range-dependent field of view for each channel is presented and compared with the beam evolution of the SOLAS instrument transmitter. Laboratory-based testing of each of the receiver channels was performed to determine the effectiveness of the receiver. Based on reflectance spectra collected for four soil types, at distances of 20, 35, and 60 m from the receiver, reliable hyperspectral measurements were gathered, independent of the range to the target. Increased levels of noise were observed at the edges of the VNIR and SWIR detector ranges, which were attributed to the lack of sensitivity of the instrument in these regions. The suitability of the receiver design, for the collection of both hyperspectral and LAS measurements at close-ranges, is documented herein. Future development of the instrument will enable the combination of long-range, ground-based hyperspectral measurements with the LAS measurements to correct for absorption, due to atmospheric water vapor. The envisioned application for the instrument includes the rapid characterization of bare or vegetated soils and minerals, such as are present in mine faces and tailings, or unstable slopes.
1. Introduction
All remote sensors, including various types of lidar instruments, employ receivers to collect backscattered energy. The receiver design is commonly dependent on the sensor type and the instrument application. While some lidar receivers use one or more lenses to focus and collimate incoming light, others utilize custom, large-aperture optical arrays to maximize, split, or otherwise manipulate the received energy. Ground-based, atmosphere-focused laser absorption spectrometry (LAS) instruments, commonly identified as differential absorption lidars (DIAL), have often employed a telescope as the primary aperture of the receiver [1,2,3,4]. Compact, large-diameter telescopes have been favored because the relative light grasp of a telescope is directly proportional to the square of the aperture area, aiding in long-range atmospheric measurements.
While most examples in the literature utilize simple, single-channel, configurations to receive light, some researchers have designed multi-channel optical receivers, placed between the primary aperture (telescope) and the data acquisition system. For example, Moore et al. [5] split light into separate channels to allow for simultaneous low-gain/high-gain detection and laser-to-telescope alignment. Likewise, Repasky [6] and Moen [7] split light into near-field and far-field receiver channels to provide atmospheric measurements over short (1 km) and long (up to 12 km) ranges, respectively. In another iteration of the Moen [7] two-channel DIAL receiver, a shared telescope for transmission and receiving enabled stable alignment and eye-safe beam expansion [4].
As DIAL instruments have historically been developed to collect atmospheric backscatter from water vapor and aerosols in the troposphere, there are limited examples of DIAL instruments operating in horizontal orientations to collect backscatter from a topographic (hard) target [1,8,9,10]. In the aforementioned instances, the topographic targets served as a test for bias, due to differential spectral reflectance [8,10], or as a measurement of spectral purity [9]. Typical DIAL configurations provide information for two wavelengths (one wavelength centered on a molecular species absorption line, λon, while the second, nearby wavelength, λoff, serves as a reference).
In this paper, a multi-channel optical receiver is described. The receiver was developed to enable simultaneous range-resolved hyperspectral measurements of hard targets and differential laser absorption measurements for atmospheric corrections of the hyperspectral measurements. The receiver is part of a new ground-based remote sensing instrument, called the soil observation laser absorption spectrometer (SOLAS), previously described in the literature by Salazar et al. [11]. The instrument was developed for rapid characterization of bare soil, rock surfaces, and/or vegetation. There is also potential for cross-platform calibration and validation (ground-truth) of airborne or upcoming spaceborne hyperspectral missions, such as PRISMA, EnMAP, HISUI, and HyspIRI [12,13,14,15]. The SOLAS instrument transmits two amplitude-modulated continuous-wave (AM-CW) near-infrared (NIR) lasers with wavelengths of 823.20 nm and 847.00 nm. The SOLAS receives backscattered light with a hyperspectral sensor and a pair of near-infrared photodetectors. The hyperspectral receiver detects light continuously across the visible to shortwave infrared (SWIR) range (350–2500 nm). A balanced photodetector is used to determine the range to the target using a frequency-modulated continuous-wave (FMCW) lidar, while an avalanche photodetector is used to determine the horizontal concentration of atmospheric water vapor en route to the target via a differential laser absorption measurement technique. The atmospheric measurements will be used in the future to correct the hyperspectral reflectance from long-range targets. Although the SOLAS instrument was described previously [11], a more detailed discussion of the development and testing of the multi-channel receiver portion of the instrument, as used to collect the backscattered energy, is discussed in the following sections.
2. Materials and Methods
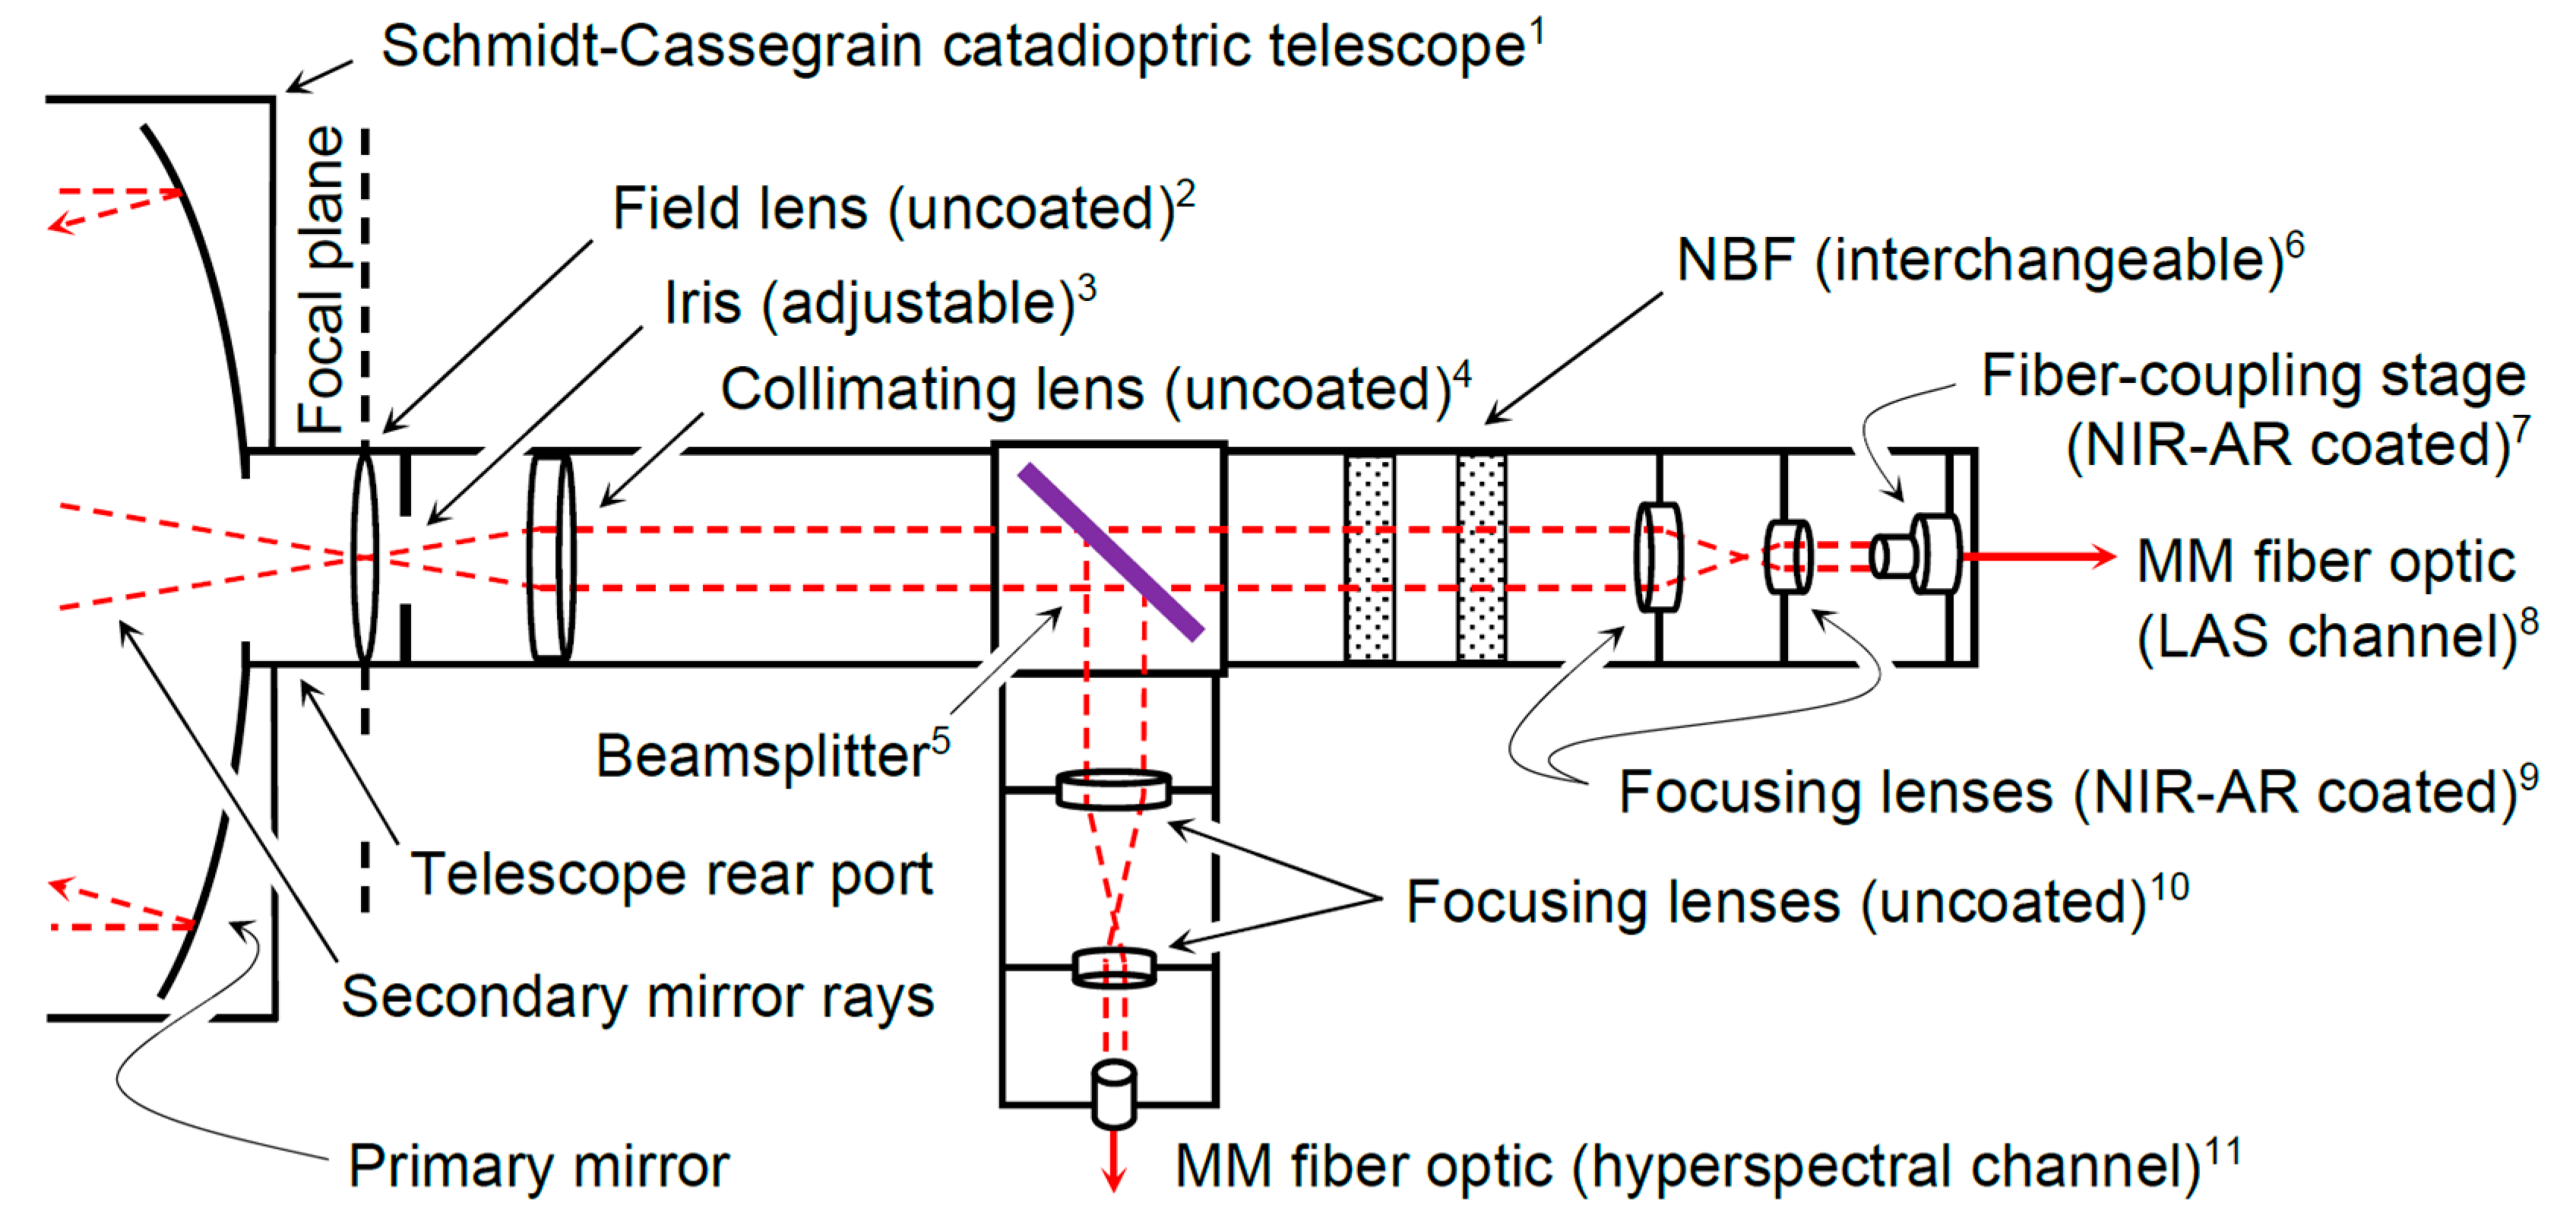
The primary aperture of the SOLAS instrument receiver consists of a Meade LX200-ACF Schmidt-Cassegrain catadioptric telescope (Meade Instruments; Irvine, California, USA). The surfaces of the telescope optics are coated with a proprietary Ultra High Transmission Coating (UHTC). The UHTC is designed to reduce reflections while maximizing light transmission. Various compounds are used in the coating (aluminum and titanium oxides on the front and back of the corrector lens; titanium and silicon dioxides on the reflecting surface of the primary and secondary mirrors). The telescope has a diameter of 203 mm and an effective focal length of 2032 mm that focuses light into a multi-channel, polarization insensitive, optical relay mounted to the rear port of the telescope. An uncoated Thorlabs LB1471 field lens (Thorlabs Inc.; Newton, NJ, USA), positioned at the focal plane of the telescope, gathers the received light from the rear port. Positioned behind the field lens is a 0.8–25.0 mm diameter adjustable Thorlabs SM1D25 iris and an uncoated Thorlabs LBF254-050 spherical singlet collimator lens. A Thorlabs BPD254-G Polka-Dot 50:50 beamsplitter positioned at 45° splits the collimated light evenly into two separate channels; one hyperspectral channel and one LAS channel.
The hyperspectral channel, referred to in this paper as Channel 1, is reserved for hyperspectral backscatter measurements. For this channel, light is focused with two uncoated aspheric lenses (Thorlabs AL1512 and AL108) and coupled into a high radiometric-resolution spectroradiometer (Analytical Spectral Devices (ASD) FieldSpec 4 Hi-Res; Malvern Panalytical, Longmont, CO, USA) via a multimode fiber bundle. The ASD FieldSpec 4 instrument detects light continuously over the visible to SWIR wavelengths using 2151 bands. The visible near-infrared (VNIR) bands, ranging in wavelength from 350 to 1000 nm, use a silicon detector to provide a spectral resolution of 3 nm and a sampling interval of 1.4 nm. Two sets of SWIR bands, ranging in wavelength from 1001 to 1800 nm and 1801 to 2500 nm, each using a thermoelectric-cooled indium gallium arsenide (InGaAs) detector, provide a spectral resolution of 8 nm and a sampling interval of 1.1 nm. The wavelength reproducibility is 0.1 nm and the wavelength accuracy is 0.5 nm.
The LAS channel, referred to in this paper as Channel 2, focuses light via two, coated, positive achromatic doublet lenses (Thorlabs AC127-050-B and AC080-10-B) and optionally filters the light using one of two interchangeable narrow bandpass filters, centered at 820 nm or 850 nm (Thorlabs FB820-10 and FB850-10, respectively), each with full-width at half-maximum (FWHM) filtering of 10 ± 2 nm. After focusing and filtering, the light in Channel 2 is collimated into a 50-μm core diameter, anti-reflective-coated, step-index multimode, fiber optic cable (Thorlabs M50L02S-B) via a Thorlabs PAF-SMA-5-B aspheric lens fiber-coupling stage. The aforementioned light on Channel 2 is delivered to a pair of near-infrared photodetectors as part of a topographic LAS measurement system. The LAS measurement system is described in further detail in Salazar et al. [11]. A labeled photograph of the receiver is presented in Figure 1 and a schematic of the receiver is presented in Figure 2.
The field of view (FOV) for each of the receiver channels was determined using Equation (1) [16]. The diameter of the fiber core, Df, and the focal length, f, of the primary mirror of the telescope were used to determine the FOV.
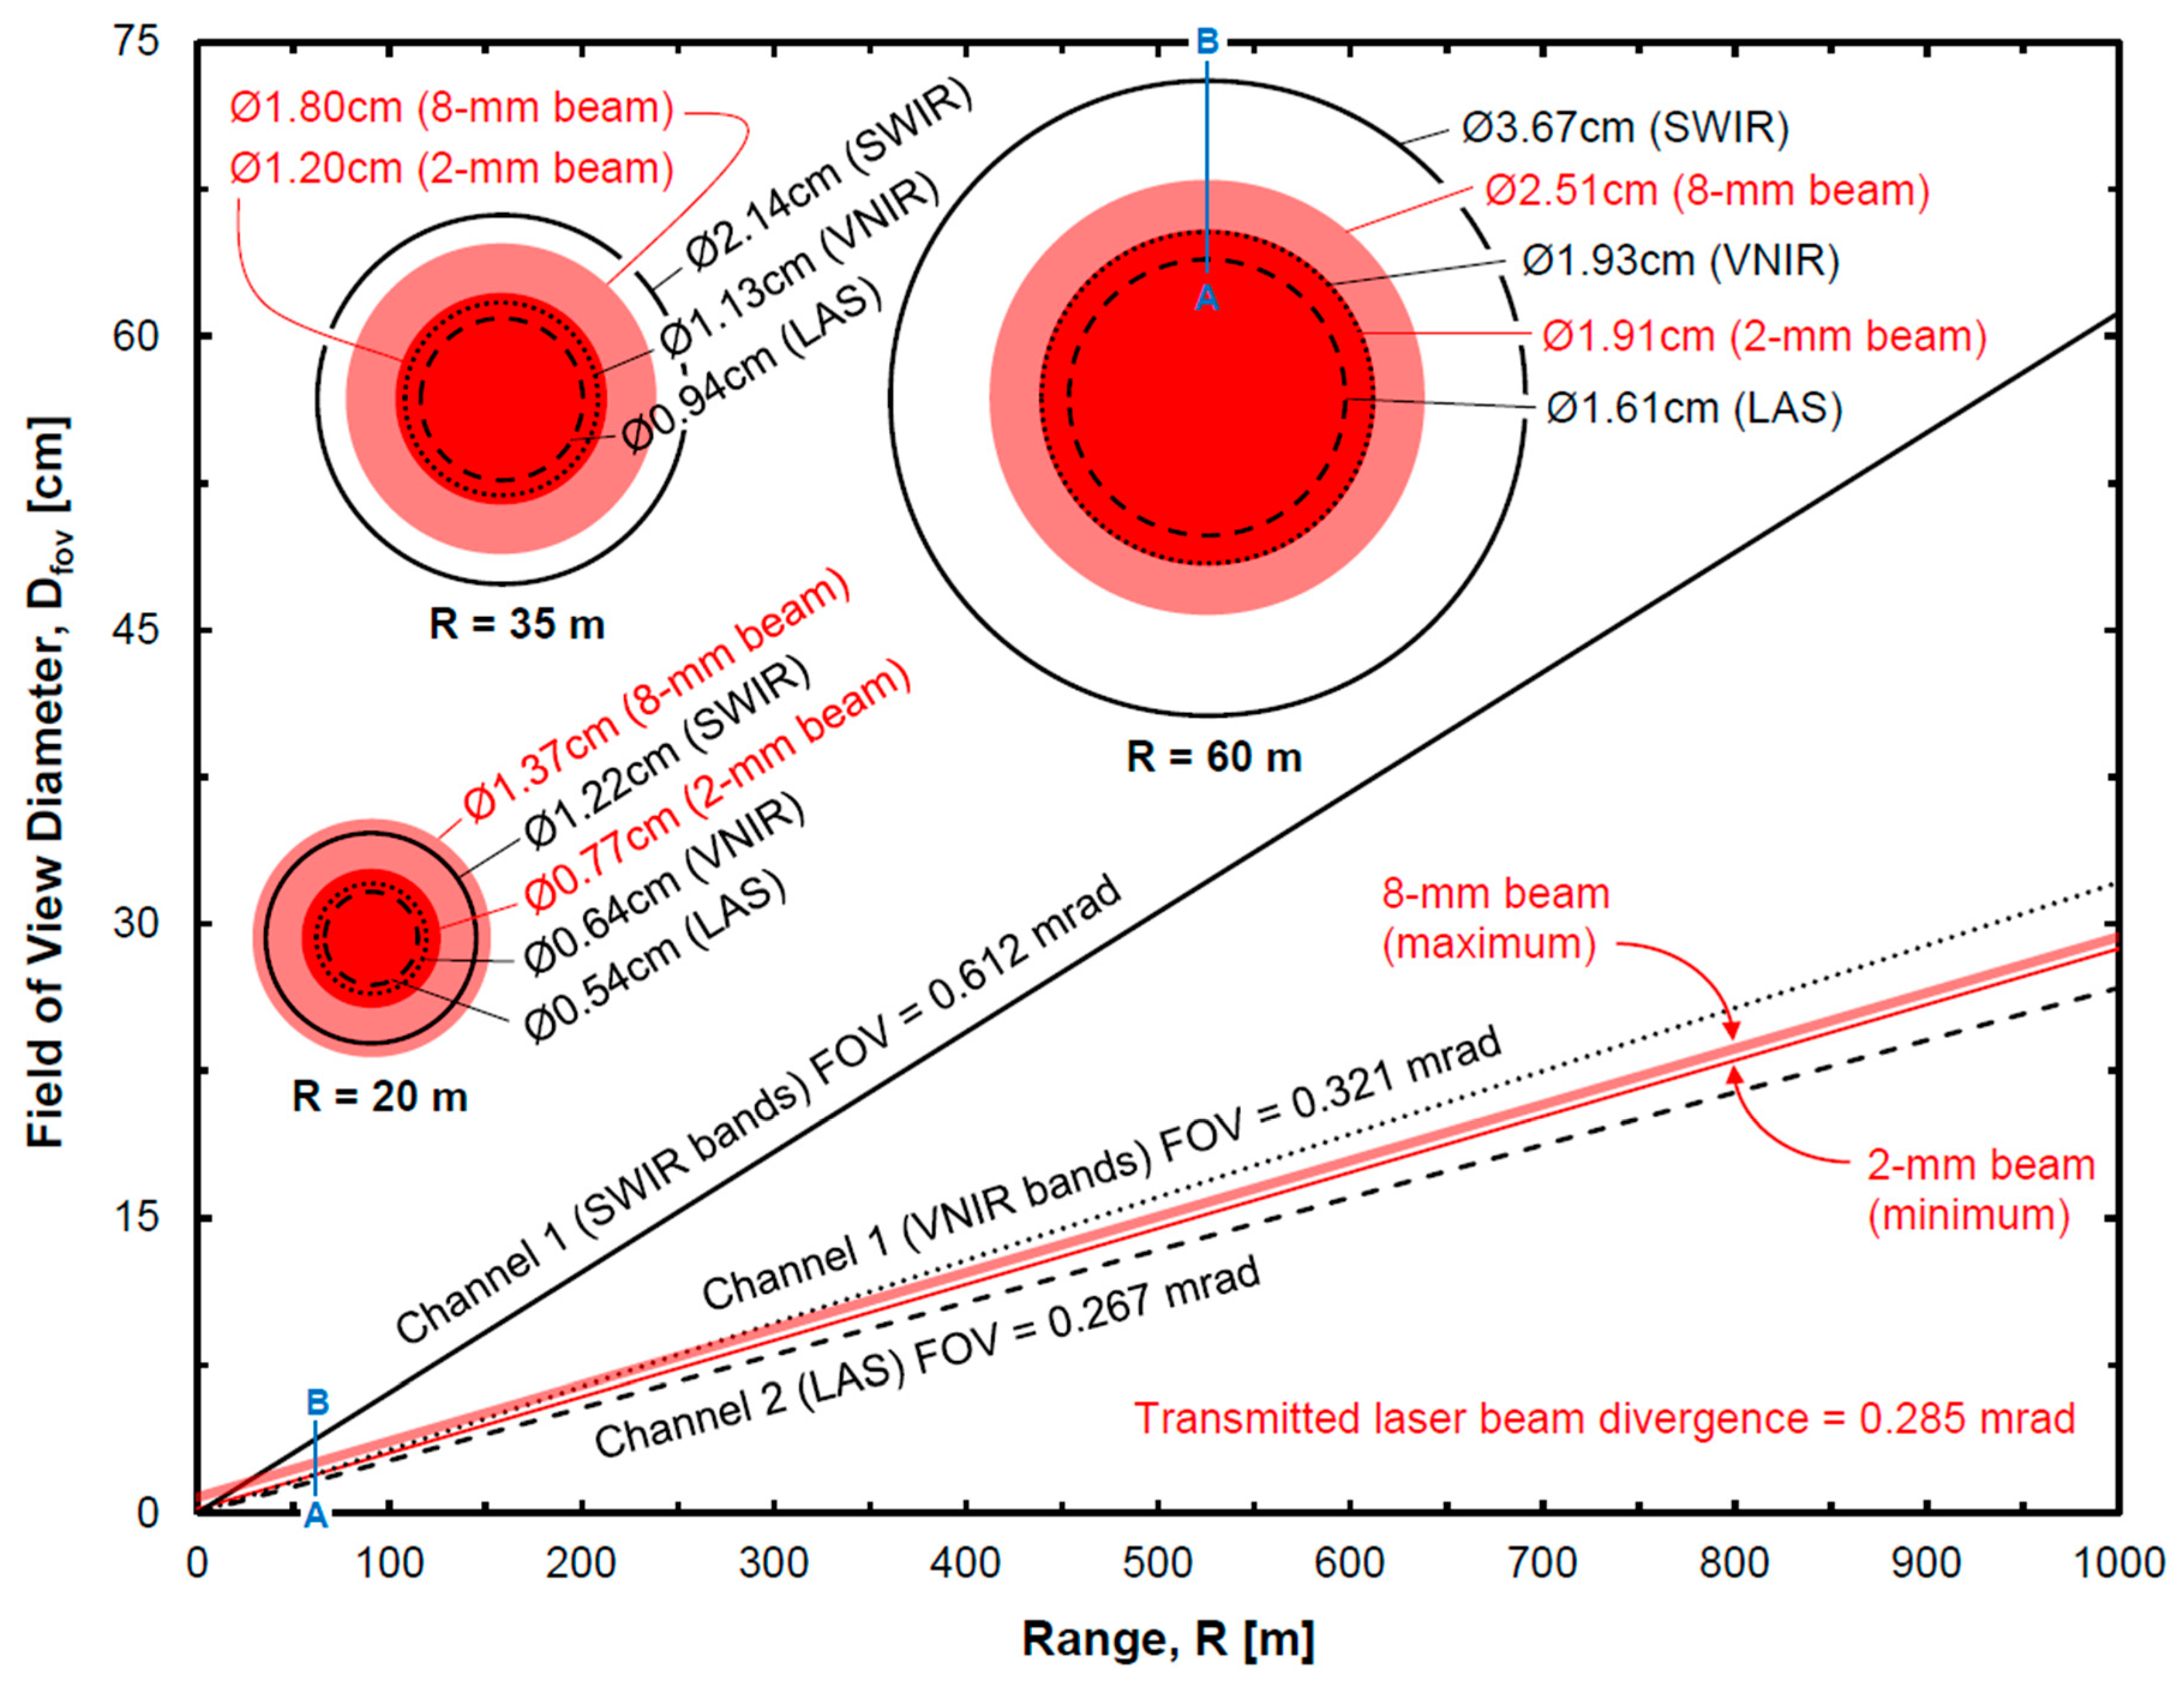
The placement of the optical components (focusing and collimating lenses) between the telescope and the fiber for each channel of the receiver magnifies the image onto the core of the fiber, thereby increasing the FOV of the channel [9]. Thus, the image is magnified by factors of 50/12 and 12/8 for Channel 1 (hyperspectral channel), where light is focused onto the bare end of the fiber bundle. The 105 μm core diameter for the VNIR bands and 200 μm core for the SWIR bands resulted in a FOV of 0.321 mrad and 0.612 mrad for the VNIR and SWIR bands, respectively. For Channel 2 (LAS channel), where light is focused into 50μm fiber using a fiber-coupling stage, the image is magnified by factors of 50/25, 25/10, and 10/4.6, resulting in a FOV of 0.267 mrad. As part of the LAS functionality of the SOLAS instrument, the actively transmitted laser has a variable beam diameter of 2.0 mm up to a maximum of 8.0 mm and a beam divergence of 0.285 mrad. A plot of the FOV diameter as a function of range, for each of the receiver channels, is presented in Figure 3. For comparison, the laser beam evolution is included, though the relationship between the FOV and the laser beam diameter is only important for the LAS measurements, which are not presented in this paper. For completeness, the specifications for each of the receiver channels are summarized in Table 1.
Receiver Testing
The receiver was tested, in a laboratory setting, to verify the transmission of the wavelengths of interest through each channel. A 25 by 25 cm, calibrated Spectralon® (Labsphere Inc., North Sutton, NH, USA) diffuse reflectance reference panel was positioned with an incidence angle of 32° relative to the receiver and the receiver was focused on the center of the panel at a range of 5 m. To achieve focus, the primary mirror of the telescope was adjusted until the focal plane aligned with the receiver optics. The correct alignment was verified by observing the maximum amplitude response, as measured with the ASD FieldSpec 4 instrument. An ASD “Illuminator” direct-current powered tungsten quartz halogen lamp provided full-spectrum illumination across the reference panel. The ASD FieldSpec 4 instrument collected 10 reflectance spectra of the panel through each of the receiver channels. The reflectance measurement from the panel, as observed through Channel 1, provided a reference (baseline) for the measurements observed through Channel 2.
Four specimens, consisting of different types of soil, were prepared for observation with the receiver. The soil types included: (i) KaoWhite-S, a commercial kaolinite soil (Thiele Kaolin Co., Sandersville, Georgia, USA); (ii) Ottawa sand, a pure silica (O2Si) sand (Humboldt Mfg. Co., Elgin, Illinois, USA); (iii) coarse, quartzitic, Arkansas River sand (Arkhola, Van Buren, Arkansas, USA); and (iv) Donna Fill, a synthetic nepheline synetite material (Donna Fill Co., Little Rock, Arkansas, USA). Each specimen was 25 cm in diameter and 0.5 cm thick. The aforementioned Spectralon® reference panel was placed in view of the receiver at a distance of 20 m, with an effective incidence angle of 32°, and the panel was illuminated with the full-spectrum halogen lamp shining perpendicular to the surface of the panel. Baseline reflectance values were recorded for the panel, followed by the collection of reflectance spectra for each of the soil specimens placed in view of the receiver at the same range and incidence angle as the reference panel. Ten spectra were gathered for each specimen via Channel 1. This procedure was repeated for distances of 35 and 60 m (maximum distance available within the laboratory).
For the data that were collected for the Spectralon® panel and the soil specimens, each set of spectra were averaged, normalized with respect to the reference panel, and plotted as a function of wavelength. A splice correction procedure [17] was applied to the reflectance values for λ > 1000 nm to eliminate offsets that occurred at the transition wavelengths (1000 nm, 1800 nm) between the VNIR and two SWIR channel bands. A Savitzky-Golay [18] filter was also applied to smooth the spectra.
3. Results and Discussion
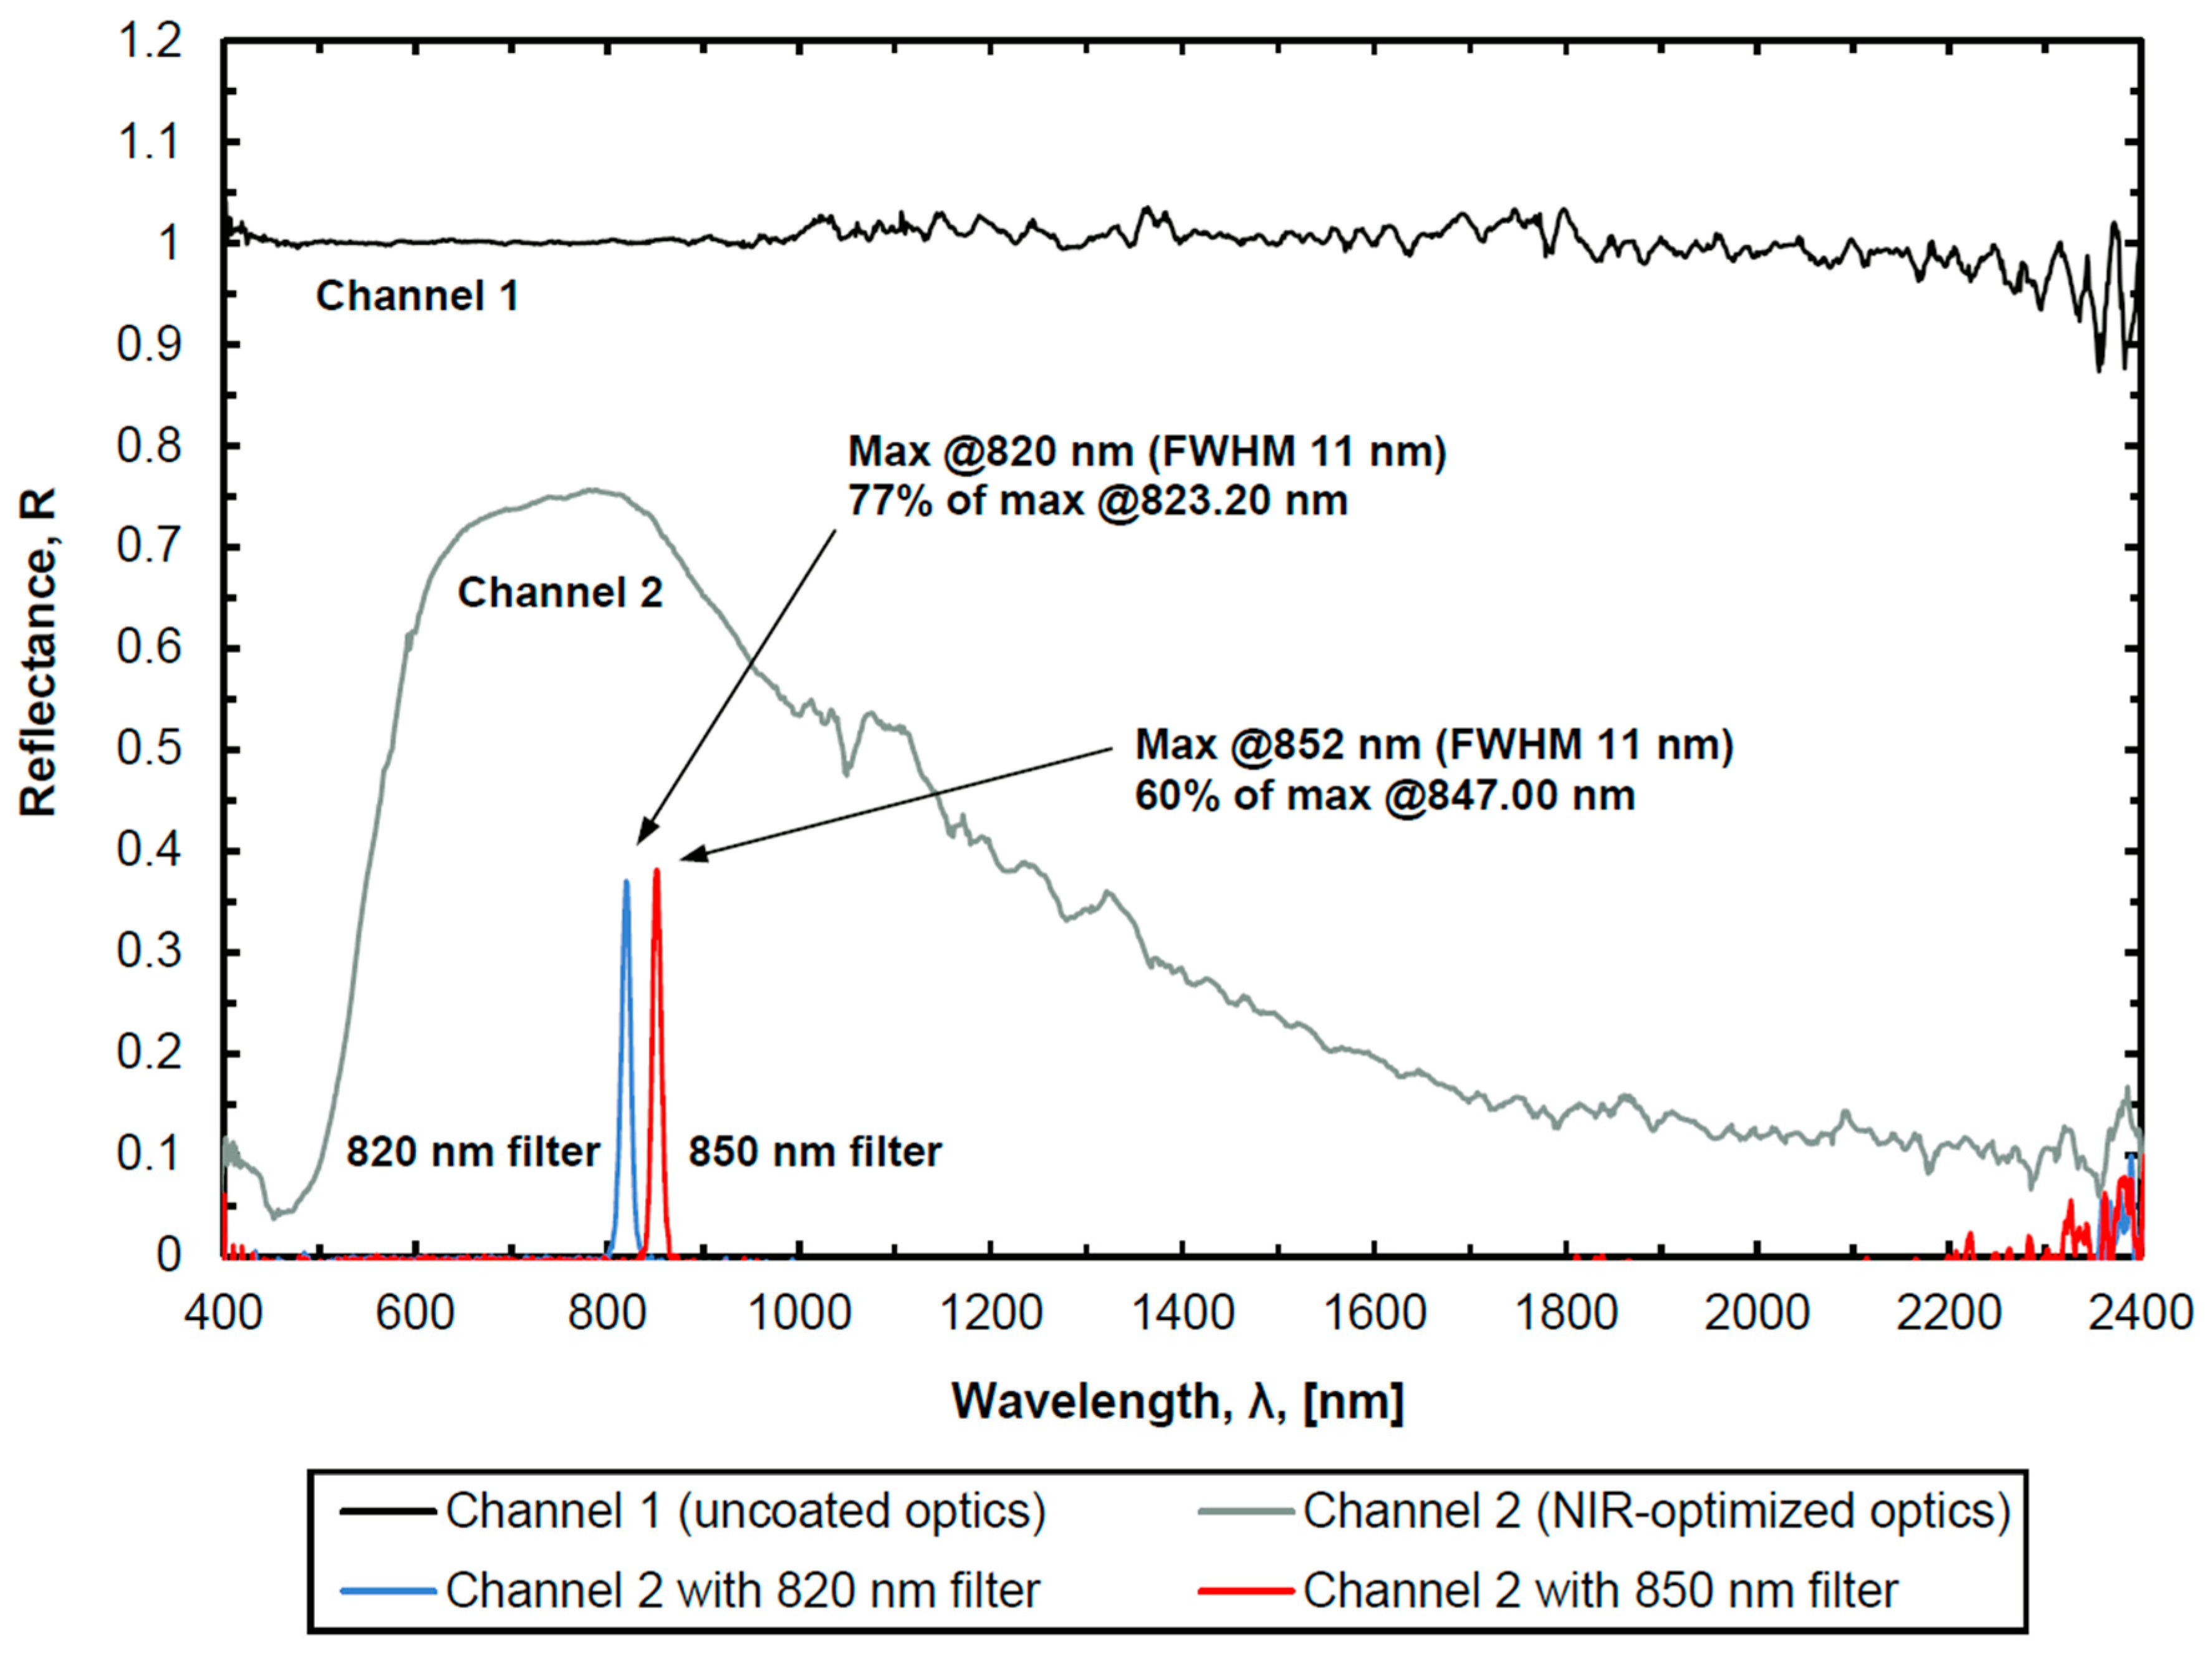
The spectral reflectance of the reference panel, as acquired via each of the receiver channels, is presented as a function of wavelength in Figure 4. The reflectance spectrum collected via Channel 1 was characteristic of a Lambertian reflector across the range of wavelengths (reflectance values close to 1.0). Although Channel 2 was designed to deliver light to a pair of near-infrared photodetectors used for the LAS measurements, as discussed previously in this paper and in [11], the specifications of the ASD FieldSpec 4 instrument were well suited for also assessing the functionality of the Channel 2 optical design across the near-infrared wavelength range. This also enabled direct comparison between receiver channels. Analysis of the spectrum collected via Channel 2 revealed that transmission was significantly reduced outside of the VNIR range. These findings were explained by the inclusion of the broadband NIR-AR coatings, optimized for the 650–1050 nm range, that exist on the optical elements within Channel 2; Channel 1 delivers light without any additional optical coatings. The spectra collected via Channel 2, with the addition of each of the interchangeable narrow bandpass filter (820 or 850 nm), indicated the effectiveness of the filters, allowing only collection around the wavelengths of interest (λon = 823.20 nm or λoff = 847.00 nm) for the LAS measurements. The filters may be employed to isolate the λon or λoff backscatter in cases where sunlight saturates the returns.
For each of the spectra, increased levels of noise were observed for the wavelengths near the edges of each detector range. The noise was primarily attributed to the lack of sensitivity of the silicon and InGaAs detectors at the edges of the ranges [19,20]. The statistical metrics for each of the three detector ranges of a typical baseline spectrum, as observed via Channel 1 (presented previously in Figure 4), are summarized in Table 2. The SWIR 1 range (1001–1800 nm) was the most stable, followed by the VNIR range (350–1000 nm), and then the SWIR 2 range (1801–2500 nm). The measured signal-to-noise ratio (SNR) was greatest for the VNIR range. These findings matched other findings in the literature [19,20]. Furthermore, it is hypothesized that the mismatch in the FOV between the VNIR and SWIR bands, as illustrated previously in Figure 3, may be a factor in the spectral noise, due to inconsistent specimen uniformity (surface roughness) between different FOV. Although the maximum range tested was 60 m (Figure 5), the effect that the difference in the FOV between the VNIR and SWIR bands has on the SNR is hypothesized to increase at longer distances. This hypothesis will continue to be tested in future work, especially when performing field measurements at long ranges.
Both receiver channels shared common optical elements (“coated” and “uncoated”), namely the UHTC-coated telescope, and the uncoated field lens, collimating lens, and beamsplitter (see Table 1 for specifications). Although the UHTC was optimized by the telescope manufacturer for wavelengths in the visible range (450–700 nm) for astronomic observations, there was no evidence that the UHTC adversely affected transmission of light outside of this range. To maximize the transmission of full-spectrum light through the hyperspectral channel (Channel 1), the remaining optical elements (common field lens, common collimating lens, common beamsplitter, and the focusing lenses within Channel 1) were uncoated. However, the lens substrates reduced transmission efficiency at longer wavelengths. For example, according to data provided by Thorlabs, transmission of light at 2200 nm was reduced by 10.7% and 9.7% from maximum for the common lenses and the Channel 1 lenses, respectively. Furthermore, due to the wavelength-dependent focal length of the lenses, defocusing of the light most likely occurred at the shortest and longest wavelengths in the spectrum. To optimize detection of the λon and λoff backscattered signals for the LAS measurements, the design wavelength of the common lenses, after the light was collected by the telescope, was 835 nm (mean wavelength between absorption lines). Similarly, the focal lengths of the lens pair within Channel 2 were optimized for 835 nm. However, the design wavelength of the hyperspectral channel was 1425 nm (mean wavelength of receiver bandwidth). According to data provided by Thorlabs, the sum of the focal length shifts for the pair of uncoated lenses in the hyperspectral channel was +0.79 mm at 2200 nm and −0.52 mm at 500 nm. The effects of transmission losses and defocusing were noted for completeness, but were considered to have an insignificant impact on the measurements, based on the observed SNR.
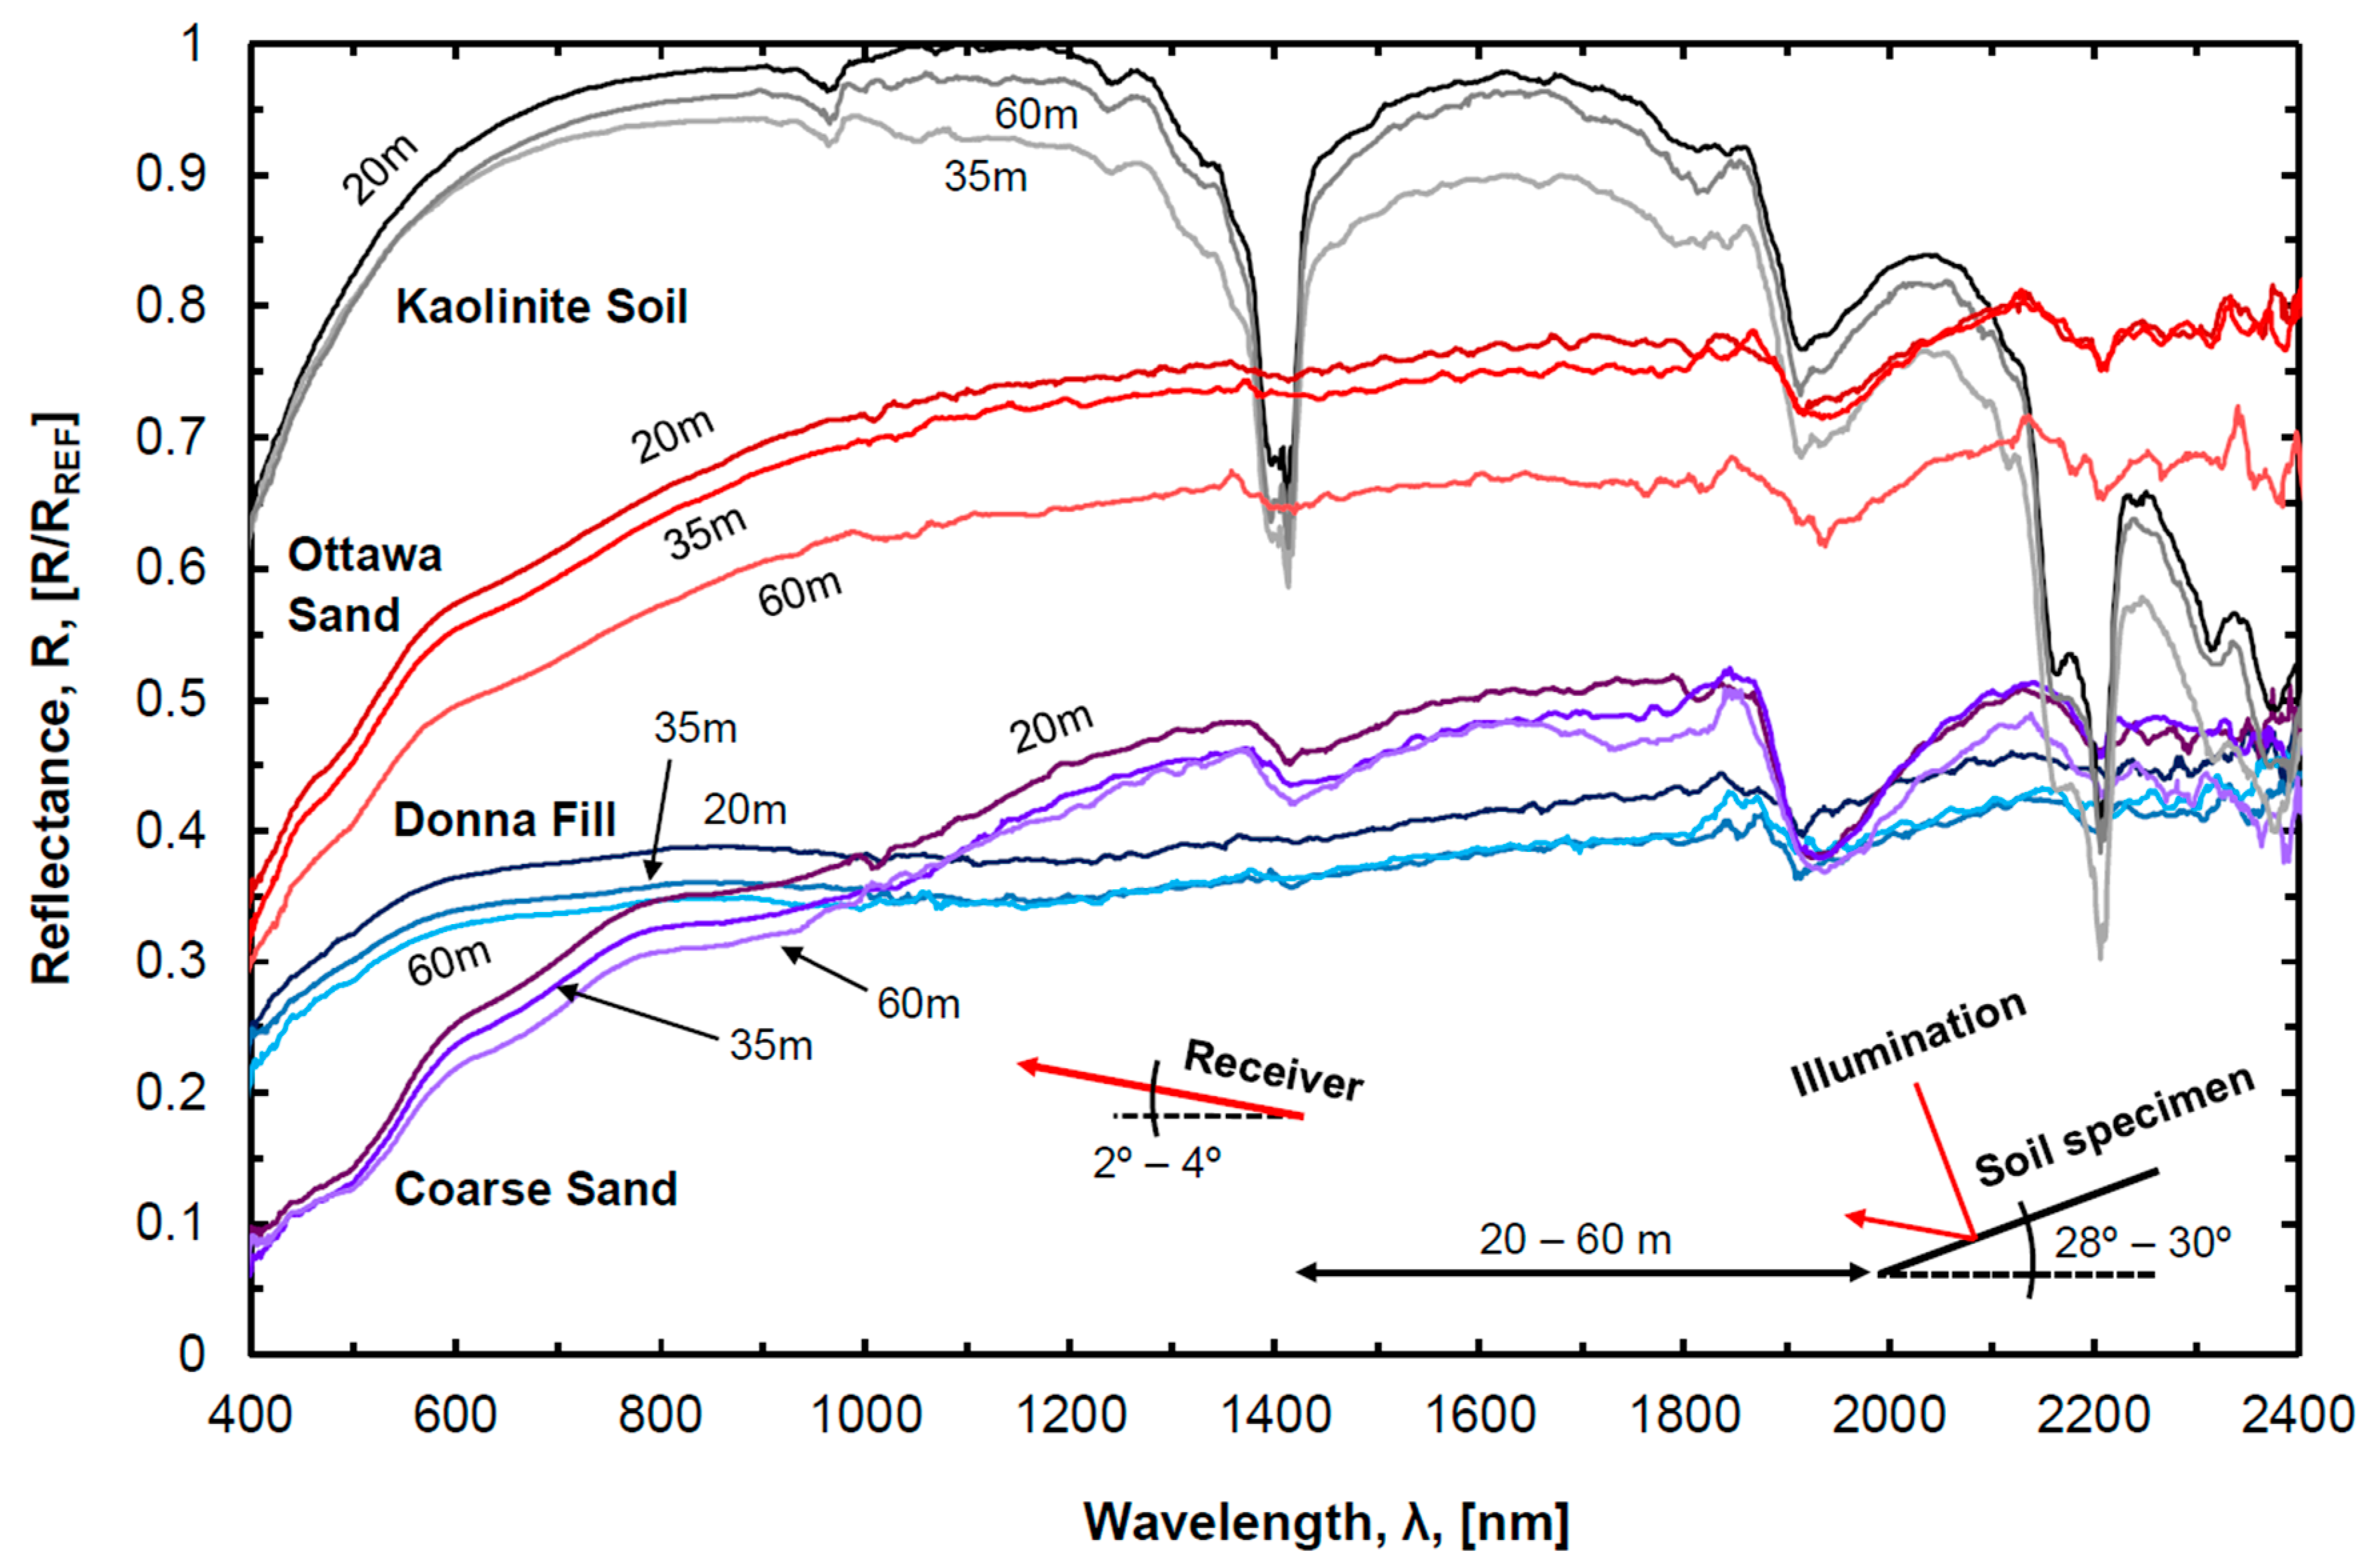
The relative reflectance spectra of the four tested soil specimens, as acquired via the uncoated optical elements on Channel 1 (hyperspectral channel), are presented as a function of wavelength in Figure 5. The kaolinite soil was the most reflective, followed by the Ottawa sand, while the coarse river sand was less reflective than the Donna Fill at wavelengths below 1000 nm and more reflective than the Donna Fill at wavelengths above 1000 nm. The kaolinite soil spectra exhibited water absorption features around the 970 nm, 1400 nm and 1900 nm wavelength bands with characteristic doublets in the 1400 nm and 2200 nm regions. The Ottawa sand, coarse river sand, and the Donna Fill spectra exhibited absorption features around the 1900 nm wavelength band, with otherwise milder or non-distinguishable features. Although the specimens tested in this study were dry, the hygroscopic moisture content likely affected the fine-grained kaolinite soil more than the other specimens. Typical hygroscopic moisture contents (gravimetric) were determined to be ~1% for the kaolinite soil, <0.2% for the Donna Fill, ~0.1% for the Ottawa sand, and <0.1% for the coarse river sand.
As the observation distance increased, the magnitude of the reflectance for each of the tested specimens generally decreased across the range of wavelengths. However, the shape of each of the spectra was consistent, regardless of distance from the receiver, indicating collection of reliable measurements, independent of the range to target, was possible. The relatively large drop in reflectance, observed for the Ottawa sand specimen at a distance of 60 m, was attributed to the specimen sliding gently due to gravity (resulting in a slightly shallower incidence angle for this measurement). As the specimens were tested in an indoor laboratory environment and under direct illumination of an artificial full-spectrum lamp, no long-path atmospheric absorption or solar absorption features were observed [19]. Thus, the presence of absorption features indicated that even under laboratory conditions (low relative humidity), the measurements were sensitive to absorption and scattering en route to the receiver. The general decrease in reflectance with an increase in range is believed to be attributed to the absorption and scattering, while the increase in the FOV diameter may also be a factor. Future experimental verification is required to verify these hypotheses.
The stable environmental conditions of the laboratory setting minimized the temperature-induced radiometric errors [20] that are typical of the spectroradiometer instrument. A 1-hour warm-up period, before measurements were collected, further minimized these errors. Although frequent referencing of the Spectralon® standard to establish a baseline for subsequent measurements is recommended by the manufacturer, only one reference was collected for each range (20, 35, and 60 m). Future measurements performed in an outdoor field setting will be more sensitive to changes in temperature and illumination conditions (solar irradiation) and may require more frequent referencing of the Spectralon® panel or a companion spectrometer to measure a reference simultaneously. Atmospheric attenuation, due to absorption and scattering by water vapor and other aerosols along the receiver path, will necessitate corrections to derive exact reflectance measurements. These corrections will be achieved using the LAS measurement system of the SOLAS instrument, as described previously [11], and will be addressed in future work.
4. Conclusions
A multi-channel optical receiver was designed and tested for inclusion within a new ground-based, topographic, hyperspectral lidar instrument, called the soil observation laser absorption spectrometer (SOLAS). The primary aperture of the receiver is a 203-mm diameter telescope that focuses backscattered light into an optical beamsplitting array to enable simultaneous data collection via two channels. One of the channels collects hyperspectral radiometric measurements across the visible near-infrared (VNIR) and shortwave infrared (SWIR) ranges (350–2500 nm), while the other channel directs light into a pair of near-infrared photodetectors for range-resolved, laser absorption spectrometry (LAS) measurements in the 820–850 nm region. Testing of each of the channels, in a laboratory setting, demonstrated the suitability of the receiver design for measurements of the wavelengths of interest. Specifically, the hyperspectral channel was optimized to collect light from 350 nm to 2500 nm, while the LAS channel was optimized to detect backscattered energy from transmitted laser absorption lines of 823.20 nm and 847.00 nm.
Testing of four different soil specimens (kaolinite, Ottawa sand, Donna Fill, and coarse river sand), at various distances from the receiver (20, 35, and 60 m), indicated that reliable hyperspectral measurements could be collected, independent of the range to target. Increased noise was observed in the VNIR and SWIR bands, particularly for the wavelengths near the edges of each detector measurement range (350, 1000, 1800, and 2500 nm), which was attributed to lack of instrument sensitivity in these bands. Some of the observed noise was also attributed to diverging fields of view for the VNIR and SWIR bands and wavelength-dependent transmission losses and defocusing of the received light. Future development of the LAS channel will enable atmospheric corrections for long-range hyperspectral measurements (up to 1 km or greater) and has the potential to improve ground-based optical remote sensing practices. Envisioned applications for the receiver, as part of the SOLAS instrument, include rapid classification of soils, rocks and minerals, and vegetation for ecological or agronomic research, forensic investigations of natural hazards (e.g., wildfire-induced erosion and debris flows), or monitoring of earth construction sites (e.g., mine tailings). Future measurements from the terrestrial platform of the SOLAS may provide ground-truth data for airborne or forthcoming spaceborne missions, such as PRISMA, EnMAP, HISUI, and HyspIRI [12,13,14,15]. More information on the complete SOLAS instrument is available in Salazar et al. [11].
Author Contributions
Conceptualization: S.E.S. and R.A.C.; Methodology: S.E.S.; Software: S.E.S.; Validation: S.E.S. and R.A.C.; Formal Analysis: S.E.S.; Investigation: S.E.S. and R.A.C.; Resources: R.A.C.; Data Curation: S.E.S.; Writing—Original Draft Preparation: S.E.S.; Writing—Review and Editing: S.E.S. and R.A.C.; Visualization: S.E.S.; Supervision: R.A.C.; Project Administration: R.A.C.; Funding Acquisition: S.E.S. and R.A.C.
Funding
This project was funded by the U.S. Department of Transportation (USDOT) through the Office of the Assistant Secretary for Research and Technology (OST-R) under USDOT Cooperative Agreement No. OASRTRS-14-H-UARK. The views, opinions, findings and conclusions reflected in this publication are solely those of the authors and do not represent the official policy or position of the USDOT/OST-R, or any State or other entity. USDOT/OST-R does not endorse any third party products or services that may be included in this publication. This material is also based upon work supported by the National Science Foundation Graduate Research Fellowship Program under Grant No. DGE-1450079. Any opinions, findings, and conclusions or recommendations expressed in this material are those of the authors and do not necessarily reflect the views of the National Science Foundation.
Conflicts of Interest
The authors declare no conflict of interest. The funders had no role in the design of the study; in the collection, analyses, or interpretation of data; in the writing of the manuscript, or in the decision to publish the results.
Abbreviations
The following abbreviations are used in this manuscript:
| AM | Amplitude Modulation |
| AR | Anti-Reflective |
| ASD | Analytical Spectral Devices Inc. (a Malvern Panalytical Company, Longmont, CO, USA) |
| CW | Continuous-Wave |
| CWL | Center Wavelength |
| D | Diameter of Primary Mirror (Telescope) |
| Df | Diameter of the Fiber (Core) |
| Dfov | Diameter of the Field of View |
| DIAL | Differential Absorption Lidar |
| EnMAP | Environmental Mapping and Analysis Program (Germany) |
| f | Focal Length |
| feff | Effective Focal Length |
| FMCW | Frequency-Modulated Continuous-Wave |
| FWHM | Full-Width at Half-Maximum |
| FOV | Field of View (Angular) |
| HISUI | Hyperspectral Imager SUIte (Japan) |
| HyspIRI | Hyperspectral Infrared Imager (USA) |
| θa | Acceptance Angle |
| InGaAs | Indium Gallium Arsenide |
| λ | Wavelength (Light) |
| λon | On-Line Wavelength |
| λoff | Off-Line Wavelength |
| LAS | Laser Absorption Spectrometry |
| LIDAR | Light Detection and Ranging (commonly Lidar) |
| MM | Multimode (Fiber) |
| N | F-Number |
| NIR | Near-Infrared |
| PRISMA | PRecursore IperSpettrale della Missione Applicativa (Italy) |
| R | Range to Target |
| R | Reflectance |
| RREF | Reference (Reflectance) |
| SNR | Signal-to-Noise Ratio |
| SOLAS | Soil Observation Laser Absorption Spectrometer |
| SWIR | Shortwave Infrared |
| TL | Thorlabs Inc. (Newton, NJ, USA) |
| UHTC | Ultra-High Transmission Coating (Meade Instruments Corporation, Irvine, California, USA) |
| VNIR | Visible Near-Infrared |
References
- Hardesty, R.M. Coherent DIAL Measurement of Range-Resolved Water Vapor Concentration. Appl. Opt. 1984, 23, 2545–2553. [Google Scholar] [CrossRef] [PubMed]
- Little, L.M.; Papen, G.C. Fiber-Based Lidar for Atmospheric Water-Vapor Measurements. Appl. Opt. 2001, 40, 3417–3427. [Google Scholar] [CrossRef] [PubMed]
- Machol, J.; Ayers, T.; Schwenz, K.; Koenig, K.; Hardesty, R.; Senff, C.; Krainak, M.; Abshire, J.; Bravo, H.; Sandberg, S. Preliminary Measurements with an Automated Compact Differential Absorption LIDAR for Profiling Water Vapor. Appl. Opt. 2004, 43, 3110–3121. [Google Scholar] [CrossRef] [PubMed]
- Spuler, S.M.; Repasky, K.S.; Morley, B.; Moen, D.; Hayman, M.; Nehrir, A.R. Field-Deployable Diode-Laser-Based Differential Absorption Lidar (DIAL) for Profiling Water Vapor. Atmos. Meas. Tech. 2015, 8, 1073–1087. [Google Scholar] [CrossRef]
- Moore, A.S.; Brown, K.E.; Hall, W.M.; Barnes, J.C.; Edwards, W.C.; Petway, L.B.; Little, A.D.; Luck, W.S.; Jones, I.W.; Antill, C.W.; et al. Development of the Lidar Atmospheric Sensing Experiment (LASE)—An Advanced Airborne DIAL Instrument. In Advances in Atmospheric Remote Sensing with Lidar: Selected Papers of the 18th International Laser Radar Conference (ILRC), Berlin, Germany, 22–26 July 1996; Ansmann, A., Neuber, R., Rairoux, P., Wandinger, U., Eds.; Springer: Berlin/Heidelberg, Germany, 1996; pp. 281–288. ISBN 9783540618874. [Google Scholar]
- Repasky, K.S.; (Montana State University, Bozeman, MT, USA). Personal Correspondence, 19 July 2016.
- Moen, D.R. Two Channel Receiver Design and Implementation for a Ground Based Micro-Pulse Differential Absorption Lidar (DIAL) Instrument. Master’s Thesis, Montana State University, Bozeman, MT, USA, 2016. [Google Scholar]
- Grant, W.B. Effect of Differential Spectral Reflectance on DIAL Measurements Using Topographic Targets. Appl. Opt. 1982, 21, 2390–2394. [Google Scholar] [CrossRef] [PubMed]
- Nehrir, A.R. Development of an Eye-Safe Diode-Laser-Based Micro-Pulse Differential Absorption Lidar (MP-DIAL) for Atmospheric Water-Vapor and Aerosol Studies. Ph.D. Thesis, Montana State University, Bozeman, MT, USA, 2011. [Google Scholar]
- Ishii, S.; Koyama, M.; Baron, P.; Iwai, H.; Mizutani, K.; Itabe, T.; Sato, A.; Asai, K. Ground-Based Integrated Path Coherent Differential Absorption Lidar Measurement of CO2: Foothill Target Return. Atmos. Meas. Tech. 2013, 6, 1359–1369. [Google Scholar] [CrossRef]
- Salazar, S.E.; Garner, C.D.; Coffman, R.A. Development of a Multimode Field Deployable Lidar Instrument for Topographic Measurements of Unsaturated Soil Properties: Instrument Description. Remote Sens. 2019, 11, 289. [Google Scholar] [CrossRef]
- Loizzo, R.; Ananasso, C.; Guarini, R.; Lopinto, E.; Candela, L.; Pisani, A.R. The PRISMA Hyperspectral Mission. In Proceedings of the Living Planet Symposium 2016, Prague, Czech Republic, 9–13 May 2016. [Google Scholar]
- Guanter, L.; Kaufmann, H.; Segl, K.; Foerster, S.; Rogass, C.; Chabrillat, S.; Kuester, T.; Hollstein, A.; Rossner, G.; Chlebek, C.; et al. The EnMAP Spaceborne Imaging Spectroscopy Mission for Earth Observation. Remote Sens. 2015, 7, 8830–8857. [Google Scholar] [CrossRef] [Green Version]
- Tanii, J.; Kashimura, O.; Ito, Y.; Iwasaki, A. Flight Model of HISUI Hyperspectral Sensor Onboard ISS (International Space Station). In Sensors, Systems, and Next-Generation Satellites XXI, Proceedings of SPIE Remote Sensing, Warsaw, Poland, 11–14 September 2017; Neeck, S.P., Bézy, J.-L., Kimura, T., Eds.; SPIE Proceedings: Bellingham, WA, USA, 2017. [Google Scholar] [CrossRef]
- HyspIRI Mission Concept Team. HyspIRI Final Report; Jet Propulsion Laboratory, California Institute of Technology: Pasadena, CA, USA, 2018.
- Chourdakis, G.; Papayannis, A.; Porteneuve, J. Analysis of the Receiver Response for a Noncoaxial Lidar System with Fiber-Optic Output. Appl. Opt. 2002, 41, 2715–2723. [Google Scholar] [CrossRef] [PubMed]
- Danner, M.; Locherer, M.; Hank, T.; Richter, K. Spectral Sampling with the ASD FieldSpec 4—Theory, Measurement, Problems, Interpretation; EnMAP Field Guides Technical Report; GFZ Data Services: Potsdam, Germany, 2015. [Google Scholar]
- Savitzky, A.; Golay, M.J.E. Smoothing and Differentiation of Data by Simplified Least Squares Procedures. Anal. Chem. 1964, 36, 1627–1639. [Google Scholar] [CrossRef]
- Analytical Spectral Devices. ASD Technical Guide, 3rd ed.; Hatchell, D., Ed.; Analytical Spectral Devices, Inc.: Boulder, CO, USA, 1999. [Google Scholar]
- Hueni, A.; Bialek, A. Cause, Effect, and Correction of Field Spectroradiometer Interchannel Radiometric Steps. IEEE J. Sel. Top. Appl. Earth Obs. Remote Sens. 2017, 10, 1542–1551. [Google Scholar] [CrossRef]
Figure 1.
Labeled photograph of the multi-channel optical receiver for the soil observation laser absorption spectrometer (SOLAS).
Figure 1.
Labeled photograph of the multi-channel optical receiver for the soil observation laser absorption spectrometer (SOLAS).

Figure 2.
Schematic of the multi-channel optical receiver for the soil observation laser absorption spectrometer (SOLAS) instrument (not to scale). Key: 1 Primary aperture (Meade Instruments LX200-ACF telescope), Ø 203 mm, feff = 2032 mm, f/10; 2 Uncoated biconvex lens (Thorlabs (TL) LB1471), f = 50 mm; 3 Adjustable iris diaphragm (TL SM1D25), Ø 0.8–25 mm; 4 Uncoated spherical singlet lens (TL LBF254-050), f = 50 mm; 5 Uncoated broad transmission 50:50 polka-dot beamsplitter (TL BPD254-G); 6 Narrow bandpass filters (NBF): 820 nm (TL FB820-10) or 850 nm (TL FB850-10); 7 Near-infrared anti-reflective (NIR-AR) coated aspheric lens fiber-coupling stage (TL PAF-SMA-5-B), 4.9 mm clear aperture, f = 4.6 mm; 8 AR coated multi-mode (MM) fiber optic cable (TL M50L02S-B), Ø 50 μm, numerical aperture = 0.22; 9 NIR-AR coated achromatic doublet lenses, f = 25 mm (TL AC127-050-B), f = 10 mm (TL AC080-10-B); 10 Uncoated aspheric lenses, f = 12 mm (TL AL1512), f = 8 mm (TL AL108); 11 MM fiber optic bundle to ASD FieldSpec 4 Hi-Res spectroradiometer.

Figure 3.
Diameter of the field of view as a function of range for each of the soil observation laser absorption spectrometer (SOLAS) receiver channels including graphical representation of the field of view cross-sections for the three range distances (20, 35, and 60 m) tested in this paper (transmitted laser beam evolution as a function of range shown for reference). Key: SWIR = Shortwave Infrared (1001–2500 nm); VNIR = Visible Near-Infrared (350–1000 nm); LAS = Laser Absorption Spectrometry; R = Range; FOV = Field of View.

Figure 4.
Spectral reflectance as a function of wavelength for Spectralon® white reference panel, as acquired with the ASD FieldSpec 4 spectroradiometer through (1) receiver Channel 1 (uncoated, full-spectrum optics), and (2) receiver Channel 2 (NIR-optimized optics) without additional filtering, and (3) receiver Channel 2 with interchangeable narrowband filters (measured transmission peaks of 820 nm and 852 nm and full-width at half-maximum (FWHM) of 11 nm).

Figure 5.
Relative spectral reflectance as a function of wavelength for four soil types (kaolinite, Ottawa sand, Donna Fill, and coarse river sand), as acquired with the ASD FieldSpec 4 spectrometer through receiver Channel 1, in a laboratory setting, for distances of 20, 35, and 60 m and an incidence angle of 32°.


Table 1.
Specifications for the SOLAS instrument multi-channel receiver.
| Primary aperture | Unit | Specification |
| Telescope | - | Schmidt-Cassegrain |
| Diameter (D) | (mm) | 203 |
| Focal length (f) | (mm) | 2032 |
| N (f/D) | - | 10 |
| Common channel | Unit | Specification |
| Field lens (uncoated) | - | Thorlabs LB1471 |
| Iris (adjustable) | - | Thorlabs SM1D25 |
| Diaphraghm diameter | (mm) | 0.8–25.0 |
| Collimating lens (uncoated) | Thorlabs LBF254-050 | |
| f (at λ = 835 nm) | (mm) | 50.4 |
| Beamsplitter | - | Thorlabs BPD254-G |
| Type | - | 50:50 Polka-Dot, B270 glass |
| Hyperspectral channel (Channel 1) | Unit | Specification |
| Field of view (FOV) | (mrad) | 0.32 (VNIR); 0.61 (SWIR) |
| Focusing lenses (uncoated) | - | Thorlabs AL1512 and AL108 |
| f (at λ = 1425 nm) | (mm) | 12.2 and 8.2 |
| Fiber optic cable | - | Multimode bundle (57 fibers) |
| Core diameter (Df) | (μm) | 105 (VNIR); 200 (SWIR) |
| Acceptance angle (θa) | (rad) | 0.22 |
| LAS channel (Channel 2) | Unit | Specification |
| FOV | (mrad) | 0.27 |
| Focusing lenses (NIR-AR coated) | - | Thorlabs AC127-025-B and AC080-010-B |
| f (at λ = 835 nm) | (mm) | 25.0 and 10.0 |
| Narrow bandpass filters | - | Thorlabs FB820-10 and FB850-10 |
| CWL | (nm) | 820 and 852 (tested) |
| FWHM | (nm) | 11.0 and 10.7 (tested) |
| Fiber-coupling stage (NIR-AR coated) | - | Thorlabs PAF-SMA-5-B |
| f (at λ = 835 nm) | (mm) | 4.6 |
| Fiber optic cable | - | Thorlabs M50L02S-B |
| Type | - | Step-index multimode (AR-coated) |
| Core diameter (Df) | (μm) | 50 |
| Acceptance angle (θa) | (rad) | 0.22 |
Key: N = F-number; VNIR = Visible Near-Infrared (350–1000 nm); SWIR = Shortwave Infrared (1001–2500 nm); ASD = Analytical Spectral Devices; InGaAs = Indium Gallium Arsenide; LAS = Laser Absorption Spectrometry; NIR = Near-Infrared; AR = Anti-Reflective; CWL = Center Wavelength; FWHM = Full-Width at Half-Maximum.
Table 2.
Statistical metrics for the baseline spectrum (Spectralon® panel) observed via Channel 1.
| Statistical Metric | VNIR Range * | SWIR 1 Range | SWIR 2 Range * |
|---|---|---|---|
| (Reflectance Units) | (350–1000 nm) | (1001–1800 nm) | (1801–2500 nm) |
| Mean | 1.00 | 1.01 | 0.976 |
| Variance | 1.11 × 10⁻³ | 2.00 × 10⁻⁴ | 4.10 × 10⁻³ |
| Sum of Squares of Deviations | 7.07 × 10⁻¹ | 1.60 × 10⁻¹ | 2.83 |
| Standard Deviation | 3.34 × 10⁻² | 1.41 × 10⁻² | 6.40 × 10⁻² |
| Noise Equivalent Radiance (W⋅cm−2⋅nm−1⋅sr−1) † | 9.2 × 10⁻¹⁰ | 1.7 × 10⁻⁹ | 7.5 × 10⁻¹⁰ |
| Signal-to-Noise Ratio (Radiance Units) † | 42 | 25 | 26 |
* Erroneous reflectance values greater than 1.2 at the near (350 nm) and far (2500 nm) edges of the wavelength range were excluded from the statistical summary (approximately 1% of the 2151 individual wavelength bands). † Typical values for the midpoint of each wavelength range (measured at 700, 1400, and 2100 nm).
© 2019 by the authors. Licensee MDPI, Basel, Switzerland. This article is an open access article distributed under the terms and conditions of the Creative Commons Attribution (CC BY) license (http://creativecommons.org/licenses/by/4.0/).
Share and Cite
MDPI and ACS Style
Salazar, S.E.; Coffman, R.A. Multi-Channel Optical Receiver for Ground-Based Topographic Hyperspectral Remote Sensing. Remote Sens. 2019, 11, 578. https://0-doi-org.brum.beds.ac.uk/10.3390/rs11050578
AMA Style
Salazar SE, Coffman RA. Multi-Channel Optical Receiver for Ground-Based Topographic Hyperspectral Remote Sensing. Remote Sensing. 2019; 11(5):578. https://0-doi-org.brum.beds.ac.uk/10.3390/rs11050578
Chicago/Turabian StyleSalazar, Sean E., and Richard A. Coffman. 2019. "Multi-Channel Optical Receiver for Ground-Based Topographic Hyperspectral Remote Sensing" Remote Sensing 11, no. 5: 578. https://0-doi-org.brum.beds.ac.uk/10.3390/rs11050578
Note that from the first issue of 2016, this journal uses article numbers instead of page numbers. See further details here.