Description Generation for Remote Sensing Images Using Attribute Attention Mechanism


1
Key Laboratory of Intelligent Perception and Image Understanding of Ministry of Education, International Research Center for Intelligent Perception and Computation, Joint International Research Laboratory of Intelligent Perception and Computation, School of Artificial Intelligence, Xidian University, Xi’an 710071, China
2
Department of Informatics, University of Leicester, Leicester LE1 7RH, UK
3
Computer Science Department, Xi’an Jiaotong University, Xi’an 710049, China
*
Author to whom correspondence should be addressed.
Remote Sens. 2019, 11(6), 612; https://0-doi-org.brum.beds.ac.uk/10.3390/rs11060612
Submission received: 31 January 2019
/
Revised: 3 March 2019
/
Accepted: 9 March 2019
/
Published: 13 March 2019
(This article belongs to the Special Issue Analysis of Big Data in Remote Sensing)
Abstract
:Image captioning generates a semantic description of an image. It deals with image understanding and text mining, which has made great progress in recent years. However, it is still a great challenge to bridge the “semantic gap” between low-level features and high-level semantics in remote sensing images, in spite of the improvement of image resolutions. In this paper, we present a new model with an attribute attention mechanism for the description generation of remote sensing images. Therefore, we have explored the impact of the attributes extracted from remote sensing images on the attention mechanism. The results of our experiments demonstrate the validity of our proposed model. The proposed method obtains six higher scores and one slightly lower, compared against several state of the art techniques, on the Sydney Dataset and Remote Sensing Image Caption Dataset (RSICD), and receives all seven higher scores on the UCM Dataset for remote sensing image captioning, indicating that the proposed framework achieves robust performance for semantic description in high-resolution remote sensing images.
1. Introduction
With the development of computers and sensors, modern remote sensing technologies have seen rapid successful progress. Remote sensing images have become an important tool for people to access geospatial information. In recent years, remote sensing images have played a very significant role not only in military applications but also in the field of business applications. The applications cover a wide range of vital areas such as national census, geological survey, water conservancy construction, oil exploration, map mapping, environmental testing, earthquake prediction, railway, and highway location, and archaeological research [1,2,3].
Nowadays, remote sensing images are of high resolution. However, their interpretation and understanding are still limited to the feature level, such as scene classification [4,5,6] and object detection [7,8] with little reasoning and understanding of the scene. This handling cannot solve the “semantic gap” problem between low-level features and high-level abstract or summarization. Therefore, correctly interpreting high-resolution remote sensing images at different levels in a large dataset has become one of the most challenging scientific problems in the field.
Furthermore, due to the high complexity of the scene and the difficulty of sample labeling, there are very few studies on semantic description of remote sensing images, and the existing results are concentrated on image semantic extraction and image retrieval. Liu et al. [9] proposed a semantic mining-based remote sensing image retrieval model. Zhu et al. [10] proposed a new strategy of SAL-LDA (Semantic Allocation Level-Latent Dirichlet allocation) at the semantic distribution level. Yang et al. [11] used the Conditional Random Field (CRF) Framework to model the underlying features and context information of remote sensing images. Wang et al. [12] proposed a semantic-based remote sensing image data retrieval solution. Chen et al. [13] proposed to construct a typical object semantic relation network based on the graph model theory. Li et al. [14] proposed a target semantic model based on the target detection method, with a better reflection of the essential difference between the target themes of the semantic meaning of the target category. The methods are obtained through statistical learning methods.
In order to solve the “semantic gap” problem and make better use of remote sensing images, for example, remote sensing images understanding and description can help to analyze battlefield images to achieve a real-time interpretation of the geographical environment. Therefore, we first need to understand the image content and generate a natural language description of the content, namely image captioning. Approaches in a multimodal space have achieved significant progress [15,16,17,18]. These methods combine image features with text description data, and generate the description of a new image by learning the corresponding relationship between them.
For remote sensing image captioning, very few research works have been published. Notable among the modest literature, Qu et al. [19] proposed a multimodal neural network model for semantic understanding of high resolution remote sensing images. Shi et al. [20] presented a remote sensing image captioning framework using a convolutional neural network (CNN). Lu et al. [21] explored some models with multimodal and attention mechanism, and exposed a dataset, Remote Sensing Image captioning Dataset (RSICD).
Visual attention [22] comes from the study of human vision. In cognitive science, due to the bottleneck of information processing, humans will selectively focus on some part of the scene while ignoring other information, which is referred to as the attention mechanism. In image captioning, attention mechanisms can be introduced to process visual information selectively, which allow the computer to place computational resources on an object at a time, guided by image attributes. Attention mechanisms have been widely used [21,23,24,25]. For example, before an attention mechanism is introduced into an encoder-decoder framework, the encoder can only convert the image features into one intermediate vector, which is decoded to generate all the words in the target sentence. When there are many or complex objects in an image, one intermediate vector is not sufficient to represent the corresponding image features. The attention mechanism enables the encoder to look at different regions in the image and generate multiple intermediate vectors, thus improving the quality of the generated sentences. This is especially important when there is confusion in the image. For remote sensing images, a large number of ground objects with multiple scales, as well as the mutual occlusion between various objects, lead to the confusion of information in the image. Therefore, the attention mechanism pays much attention to the dynamic representation of images. Furthermore, as high-level concepts, attributes are able to represent global features [25,26,27]. Unlike natural images in which specific objects attract the attention, many items in remote sensing images need to be taken into account. Due to the complex presentation of remote sensing images, the original attention mechanism in processing remote sensing images lacks attention to some inconspicuous objects. Therefore, we need to integrate global information to the model in order to improve the attention accuracy.
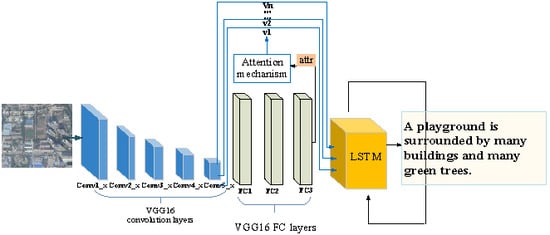
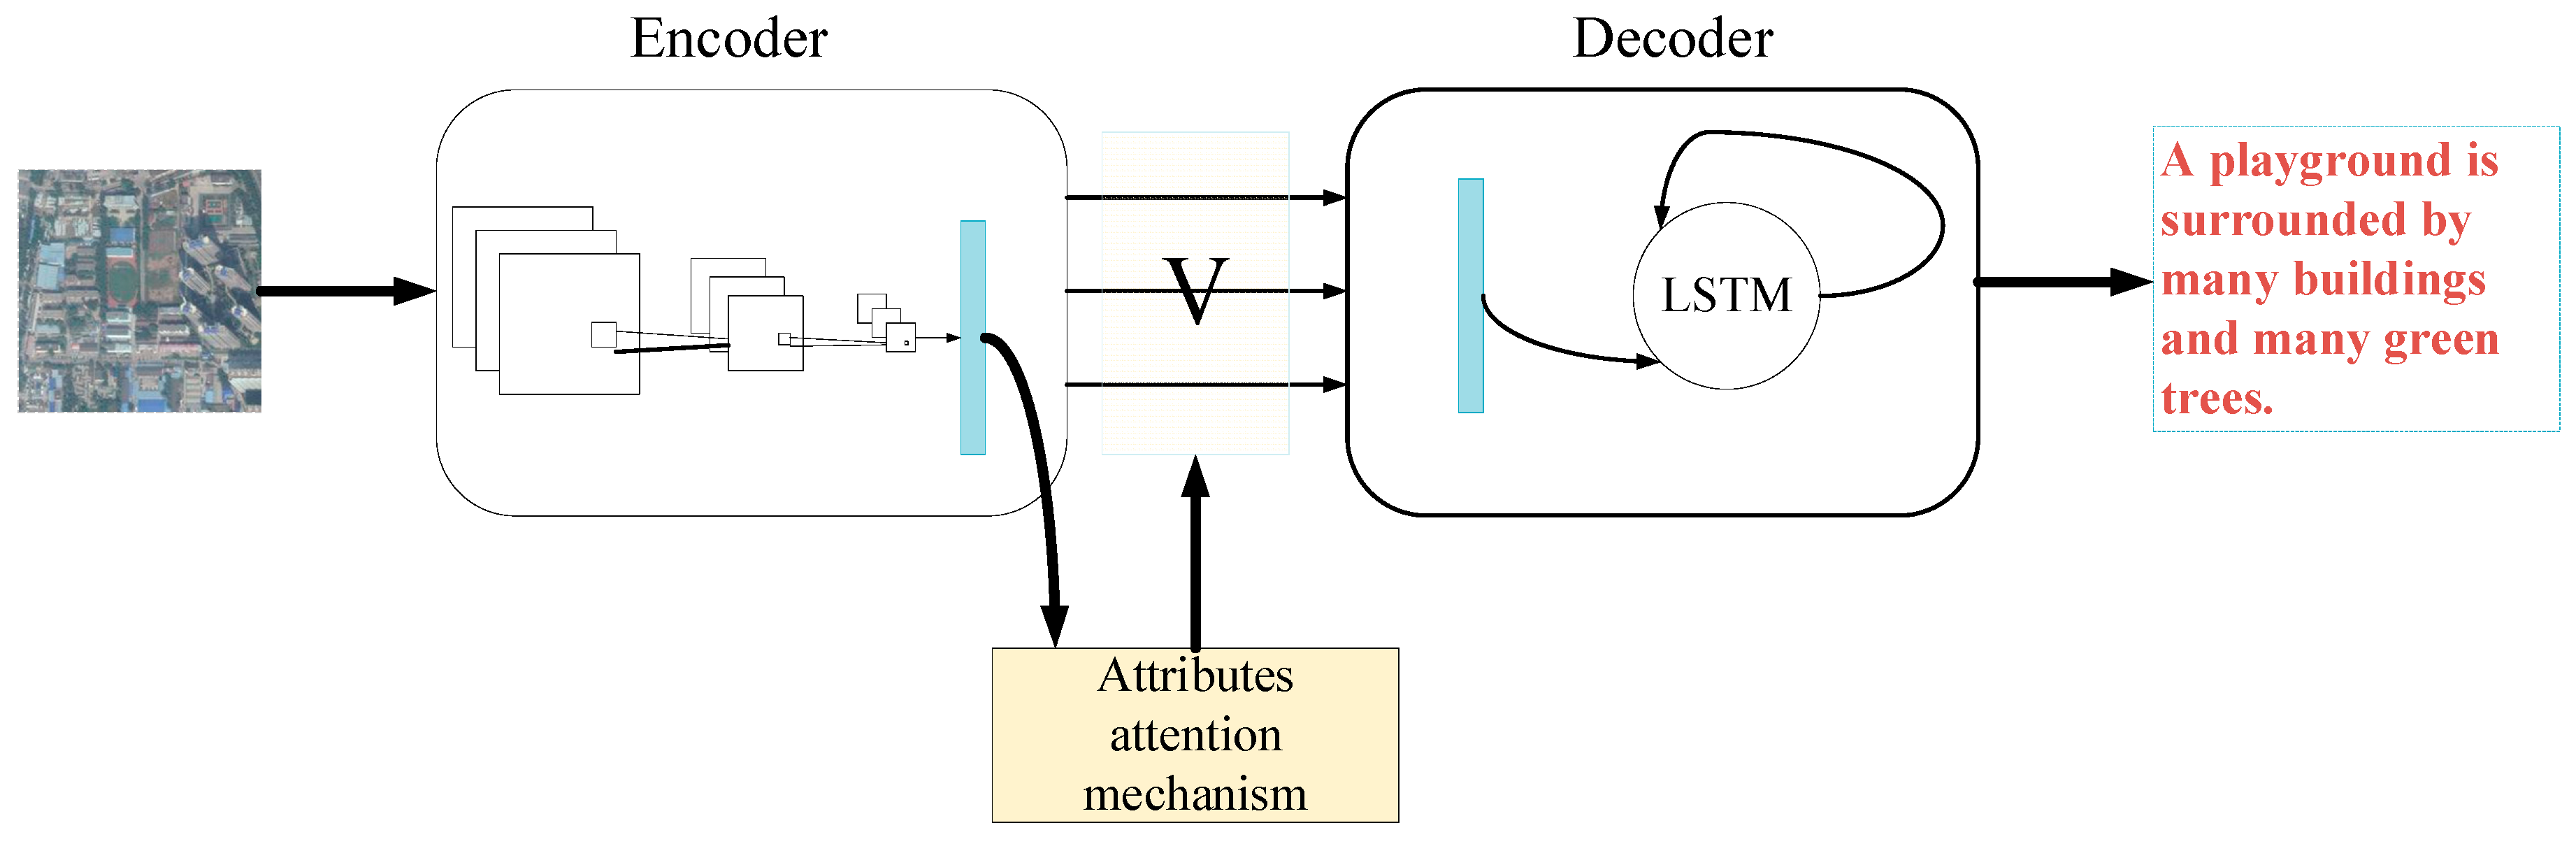
In this paper, we propose a new model with an attribute attention mechanism for remote sensing image captioning. In this field, compared with the attention mechanism used in Lu et al. [21], the proposed model can: (1) focus on the whole image information while paying attention to the relationship between the input images and the word that the decoder generates, (2) weight the relative strength of the attention paid onto different attributes, and (3) use features that correspond to the detected visual attributes rather than the pre-trained features at a particular spatial location [21]. Using an encoder-decoder framework, our model is shown in Figure 1. First, the input remote sensing image is mapped onto the feature maps using CNN. Then, the feature maps are passed to the fully connected layer of CNN, and we take the output of the last fully connected layer (or softmax layer) as attributes. By introducing the attributes, the attention mechanism perceives the whole image while knowing the correspondence between regions and words. Due to the existence of the attention mechanism, at each moment, different intermediate vectors can be generated. Finally, the intermediate vectors and the embedded texts are input into the long short-term memory network (LSTM) for training. We chose LSTM rather than the standard recurrent neural network (RNN) as the decoder because it is a four-layer network with a special way to interact in the repetitive module of LSTM which uses a very simple structure e.g., a tanh layer in the standard RNN. Furthermore, the gate structure is applied to LSTM to discard and store the information and determine the state of the cell. In [15, 21], the reported experiments also showed that an LSTM performs better than a standard RNN.
2. Related Work
2.1. Progress on Natural Image Captioning
With the rapid development of computer vision and natural language processing, the generation of natural language descriptions for an image has attracted the attention of the community. In recent years, many deep learning models adapted to this problem have been proposed. There are three main categories of the existing image captioning methods [28]: template, retrieval, and encoder-decoder-based image captioning.
Template-based methods generate sentences by filling up blanks with various targets, attributes, and behaviors extracted in the image. [29,30,31] started by extracting or inferring various objects from the image before filling the blanks. Sentences generated in this way are grammatically correct but inflexible and stereotyped due to its predefined templates.
Retrieval-based approaches build a database which includes pairs of images and their corresponding text descriptions. For a given image, the similar images and their descriptions are obtained from the database first; then, the sentences for the query image are chosen from those captions [32,33,34]. Obviously, the sentences can be correct in syntax and different in sentence structure if the database is constructed properly.
The last category, encoder-decoder methods, are the most widely used in the field. These methods use a CNN as an encoder to extract image features and adopt an RNN or LSTM as a decoder to generate sentences with those image features. Mao et al. [16] proposed a multimodal recurrent neural network (m-RNN) to generate captions with a CNN and RNN interacting with each other in a multimodal layer. However, compared with RNN, LSTM solves the problem of gradient dissipation while retaining the correlation of long time series. Vinyals et al. [15] proposed a neural image captioning (NIC) generator replacing the RNN in [16] with an LSTM to make the model handle long sentences. In the encoder-decoder structure of the NIC model, an encoder encodes all the image features into one unified semantic feature vector whose length has become a bottleneck problem which restricts the performance of the model. To solve this problem, Xu et al. [23] first introduced an attention mechanism into the encoder-decoder framework to generate different semantic feature vectors at different time steps, and the model concentrates on different regions of the image during the word generation. In addition to using the attention mechanism to improve encoder-decoder structure, high-level semantic features also provide an improved solution. Wu et al. [35] considered the role did of the explicit high level concepts play in image captioning, and they found high level concepts had achieved greater better performance than image feature maps. As high-level image features, the importance of semantics or attributes in images is discussed in [25,26,27].
2.2. Progress on Remote Sensing Image Captioning
With regards to natural image captioning, researchers have carried out thorough study on remote sensing image captioning.
Qu et al. [19] proposed a multimodal neural network model using visual and textual information of high resolution remote sensing images to describe images. It used an encoder-decoder framework, and demonstrated that a framework suitable for natural images can also achieve good performance for processing remote sensing images. In addition, Qu et al. [19] also studied the currently CNN and RNN model combination and found that the system with Vgg19 as the encoder and LSTM as the decoder obtained satisfactory results on the UC Merced (UCM) [36] and Sydney [37] datasets. Unlike Qu’s method, Shi et al. [20] stated that using LSTM as the language model was not suitable for generating captions for remote sensing images due to the inadequate training. Therefore, they reported a template-based approach to generate captions instead. It is convenient to design different templates and generate new rules according to the characteristics of remote sensing images. Recognizing the lack of datasets in remote sensing image captioning, Lu et al. [21] disclosed a dataset named RSICD for research work on remote sensing images caption. Furthermore, they revealed several models with an encoder-decoder framework and an attention mechanism, and found that these methods for handling natural images can be transferred to the process of remote sensing images. All of the above methods are encoder-decoder-based or template-based methods. Recently a retrieval-based method was proposed. Wang et al. [38] used latent semantic embedding by metric learning and a learned Mahalanobis matrix to compute the distance between the image and the collective sentences to accomplish the multi-sentence captioning task.
3. Remote Sensing Image Captioning with Feature Extraction and Attribute Attention
In this section, we introduce the overall framework of our method and focus on the rationale of using attribute attention mechanisms. In Section 3.1, the process of extracting image and sentence features is presented. A CNN and an LSTM that extract image and sentence features respectively constitute the main body of our model. In Section 3.2, we first briefly introduce the original attention mechanism, and then introduce the principle of the attribute attention mechanism.
3.1. Feature Extraction
3.1.1. Image Feature Extraction
The description of remote images is related to the features and attributes extracted in the remote images, so we use CNN to extract image features and attributes in each remote sensing image. CNN is composed of convolution, pooling, activation function, and fully connected layers. The different features of CNN are designed to encode different levels of information. High-level features focus more on semantic information and less on details, while low-level features contain more details. We expect to use a simple and effective method to take advantage of high and low level characteristics and complement each other. Therefore, in our method, both low-level feature extracted from the relatively shallow convolution layer and high-level feature extracted from the relatively deep fully connected layer or softmax layer are used, which can be written as:
where represents the input images, and , , represent the output of the convolution layer, fully connected layer and softmax layer in CNN, respectively. Instead of simply fusing and , we use the attention mechanism to combine these two features, which will be described in Section 3.2.
In [35], attributes obtained by a trained multi-label CNN replace feature maps as the input image feature. Different from [35], our proposed attributes do not require particularly precise multi-label training and are applied to the attention mechanism, rather than directly going to the decoder as feature maps. In the field of natural image captioning, [25,26,35] used semantic concepts. However, those methods cascade the high-level semantics with feature maps or substitute the feature map as the input of the LSTM. They do not take into account the introduction of high-level semantics (attributes) into the attention mechanism used to re-weight the objects. These are the distinctions in the construction and use of attributes between the previous research works and our method.
3.1.2. Sentence Feature Extraction
Similar to [15,23,35], we cannot import the descriptive sentences into our model directly, so each word in sentences is represented as a one-hot vector whose dimension equals the vocabulary size of words. For example, the vocabulary is built based on the top 2000 words in terms of their occurring frequency in the RSICD training set. Therefore, all the sentences can be represented in the form of , and our goal is to maximize the log-likelihood of the sentences:
where is the probability of generating word Si given previous words S1:i−1, image low-level feature h and image high-level feature attr.
3.1.3. Overall Framework
In the training process of our model, we chose Vgg16 as the encoder and the standard LSTM as the decoder. LSTM is a special type of RNN that can learn long-term dependency information, so it is widely used in fields such as natural language processing and image captioning. In our model, LSTM, as the decoder, utilizes the information of sentences , image features and attributes to generate words one by one for the description of remote sensing images. In the beginning, we used the mean of to initialize the memory state and the last output value of the LSTM. Our training objective was to learn all the training parameters in CNN and LSTM by minimizing the following loss function:
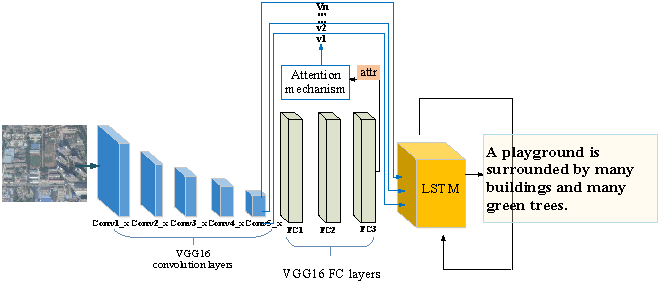
where N is the number of the images in the training set and is the length of the sentence for the nth training example. is a regularization term. Furthermore, the CNN and LSTM are trained at the same time. The flow-chart of the model is shown in Figure 2.
3.2. Attribute Attention Model
Bahdanau et al. [39] were pioneers in introducing the attention mechanism into the field of natural language processing. In [39], the attention mechanism is demonstrated by a series of attention allocation coefficients, that is, a series of weight parameters. Corresponding to the field of image caption, the attention mechanism assigns different weights to different regions of the image, which associates the intermediate variables generated by the encoder change with the change of the region of interest. The ith intermediate vector can be expressed as:
where represents the jth region that we attend. The weight of each is computed by:
where
can be calculated by the alignment model , which is based on the correlation between the jth region of the image and the ith word in the generated sentence. In other words, is the weight calculated by measuring the relationship between hidden state in the decoder and hidden state in the encoder.
The attention mechanism can bring improvements in image captioning due to the fact that the encoder generates different intermediate variables, based on different regions of images, to generate target words in different positions. It is shown that the intermediate vector is affected by , which is the output of through the softmax function. Therefore, we are able to ameliorate to influence , which in turn improves the performance of the model. In Equation (7), is affected by the state at the last moment of the decoder and the state at this moment of the encoder, representing the degree of the correlation between and .
Many previous works related to the attention mechanism that were derived from or inspired by [39], such as [21,23], only used low-level image features represented by Equation (1); high-level image features were often ignored. Due to the richness and complexity of remote sensing image content, it may miss the target in the image if we overlook the high-level features. Therefore, global features are required to support the image analysis. As the convolution layers increase, the receptive field becomes larger, which tends to contain the global information [20]. Hence, the top layer of CNN, e.g., a fully connected or softmax layer, concerns global information. Inspired by that, we present our model based on a different attention mechanism with a new means to construct , written as:
where is the output of the last fully connected or softmax layer of CNN, which is defined as the attributes of the input image. is a function that concatenates with . So Equation (8) can be written as:
where and are trainable weight matrices. contains a number of parameters for adjusting the matrix multiplication of and to obtain a reasonable corresponding relation, and can change the weight of attributes so that attributes can focus on different objects in the images. By substituting Equation (9) into Equation (6) and Equation (5), we can obtain the intermediate vector , different from [21] and [23].
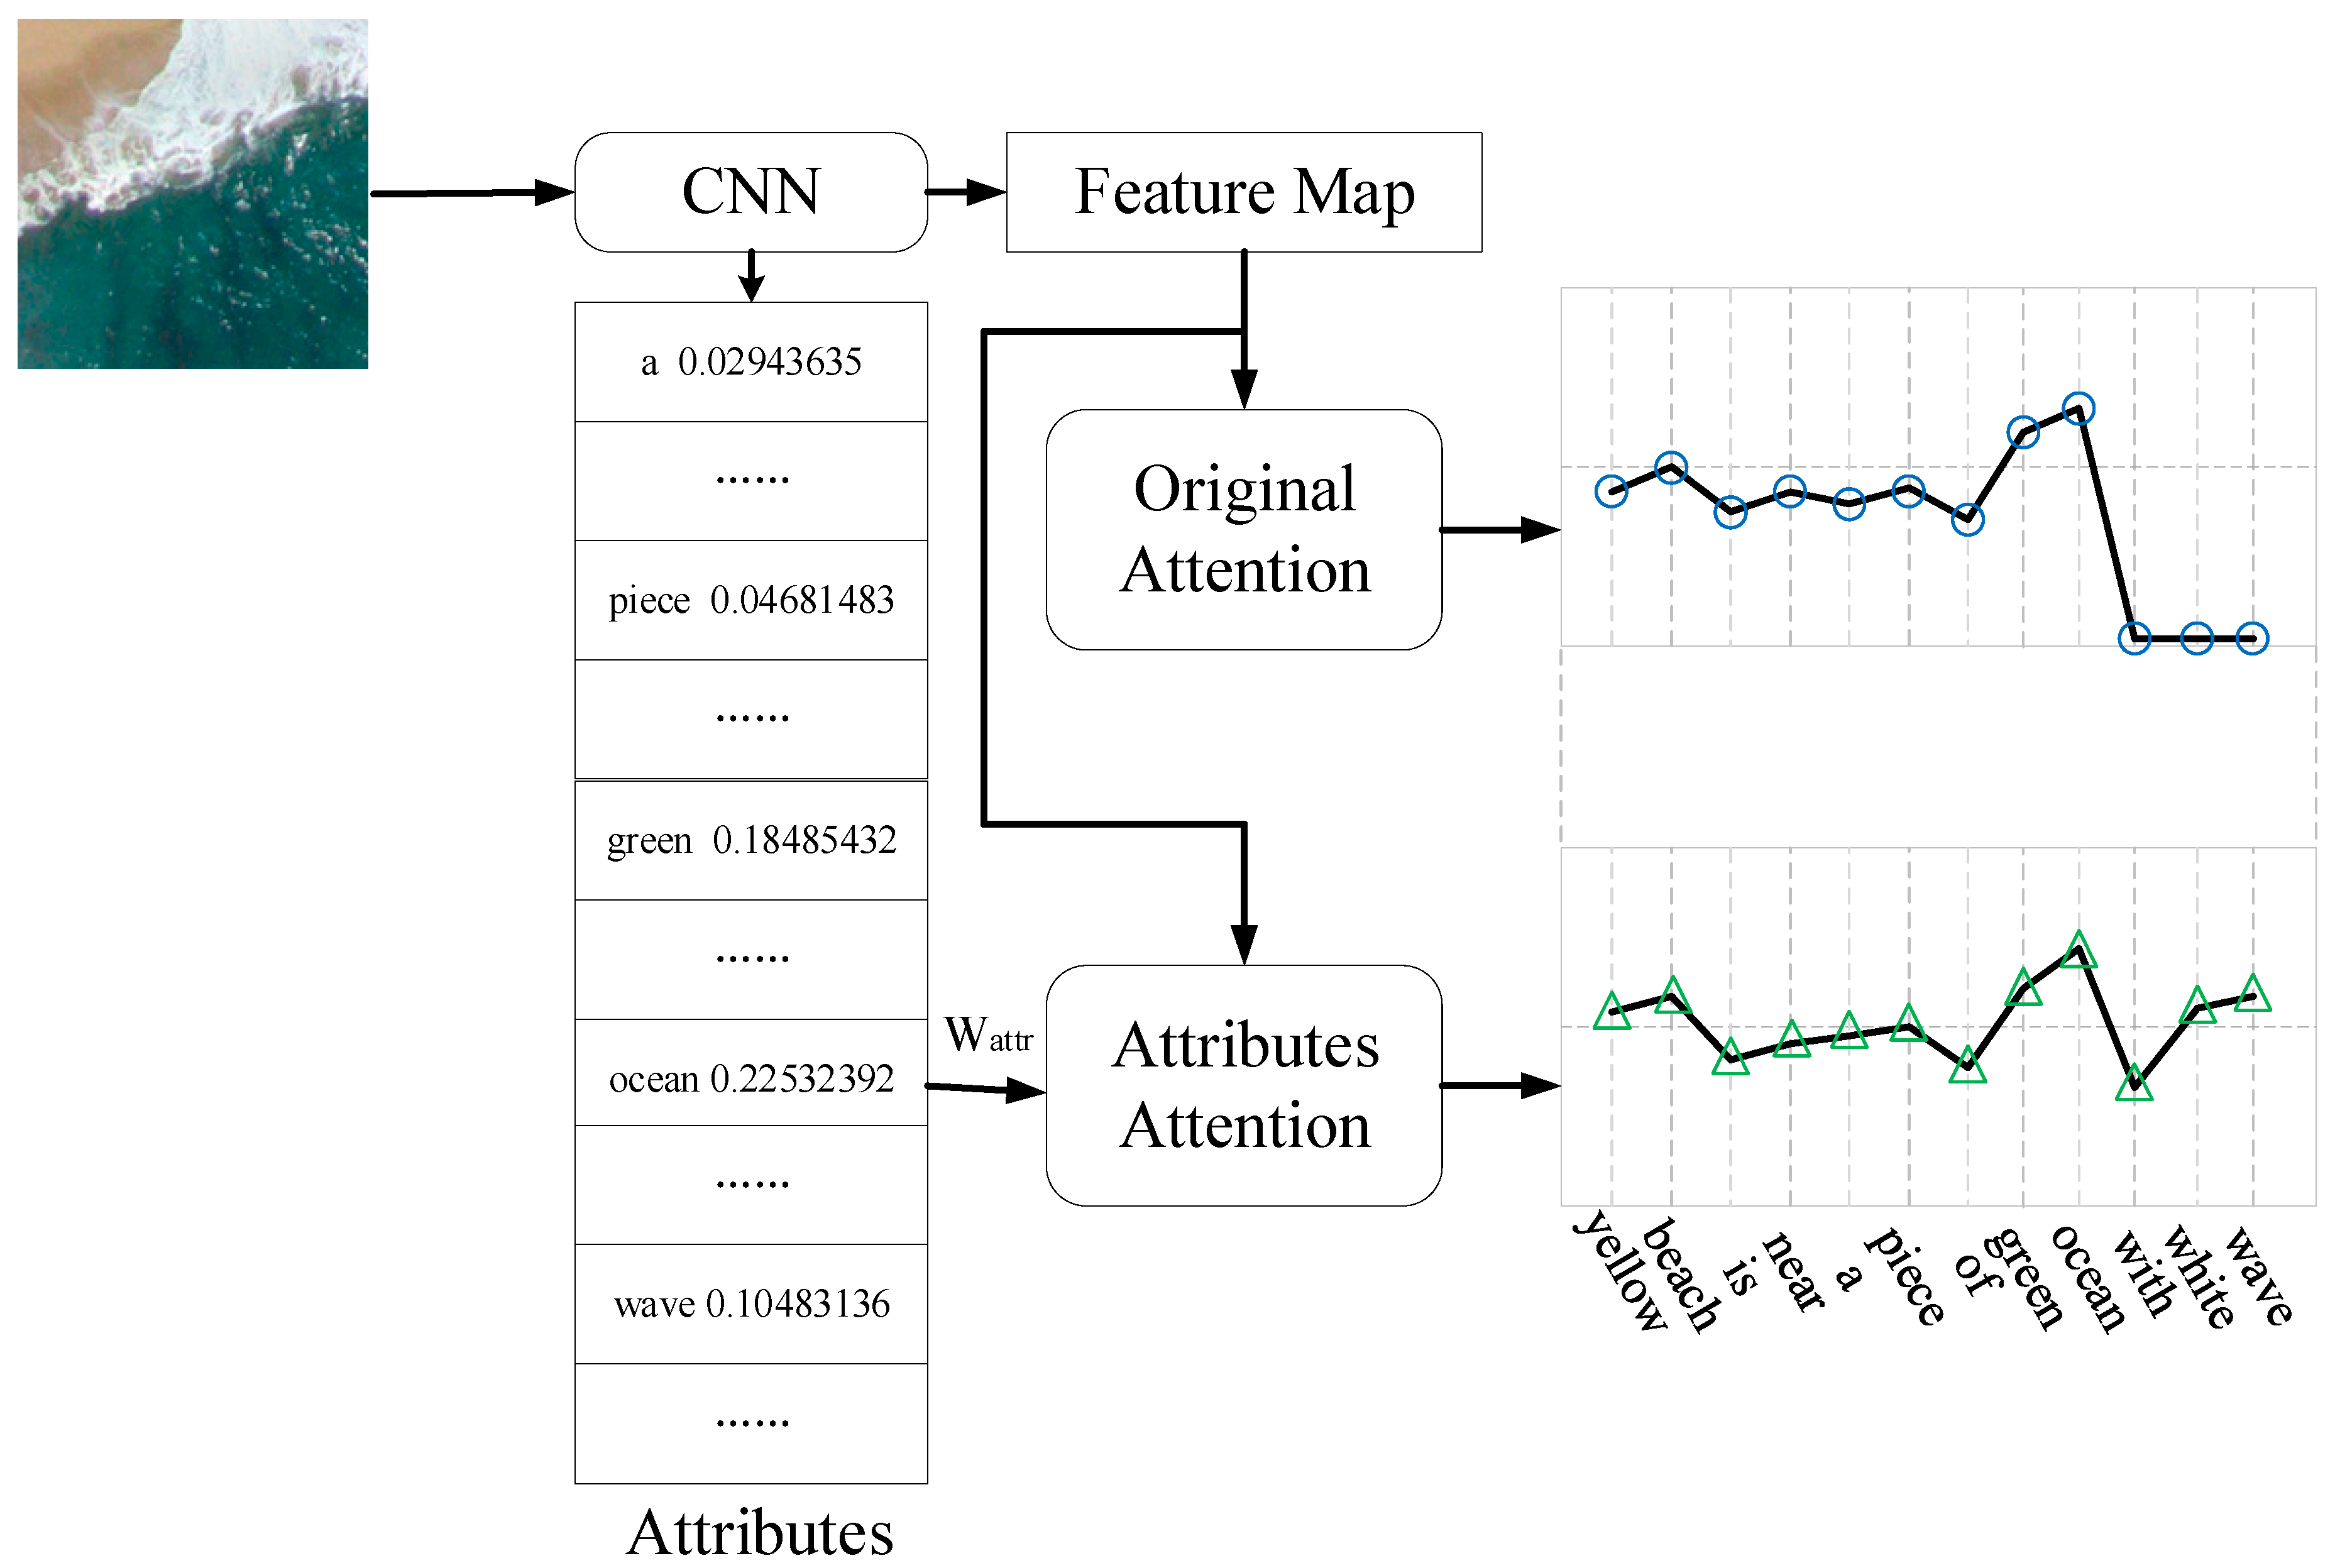
Figure 3 shows the differences between the original attention and our attribute attention models. For visual simplicity, we omit the LSTM part related to the attention mechanisms. The left part of Figure 3 shows the construction of the two mechanisms. The original attention model uses the feature map information while our attribute attention model utilizes attributes in addition to the feature map, represented by Equations (7) and (9). The right part of Figure 3 shows two line charts, respectively showing the weight of the corresponding words of the original attention mechanism and the proposed attribute attention mechanism in generating descriptive sentences. We see that due to the existence of attributes, the likelihood of some words (such as yellow) is increased, and some ignored words (such as wave) are generated with high possibility. In addition, the attributes may contain interfering information. For example, attributes may contain the weight of desert and yellow beach in the image is likely to be identified as yellow desert. Therefore, is important because it can make the weights of attributes trainable and reweight the attributes for better sentences generation.
4. Experiments
4.1. Dataset
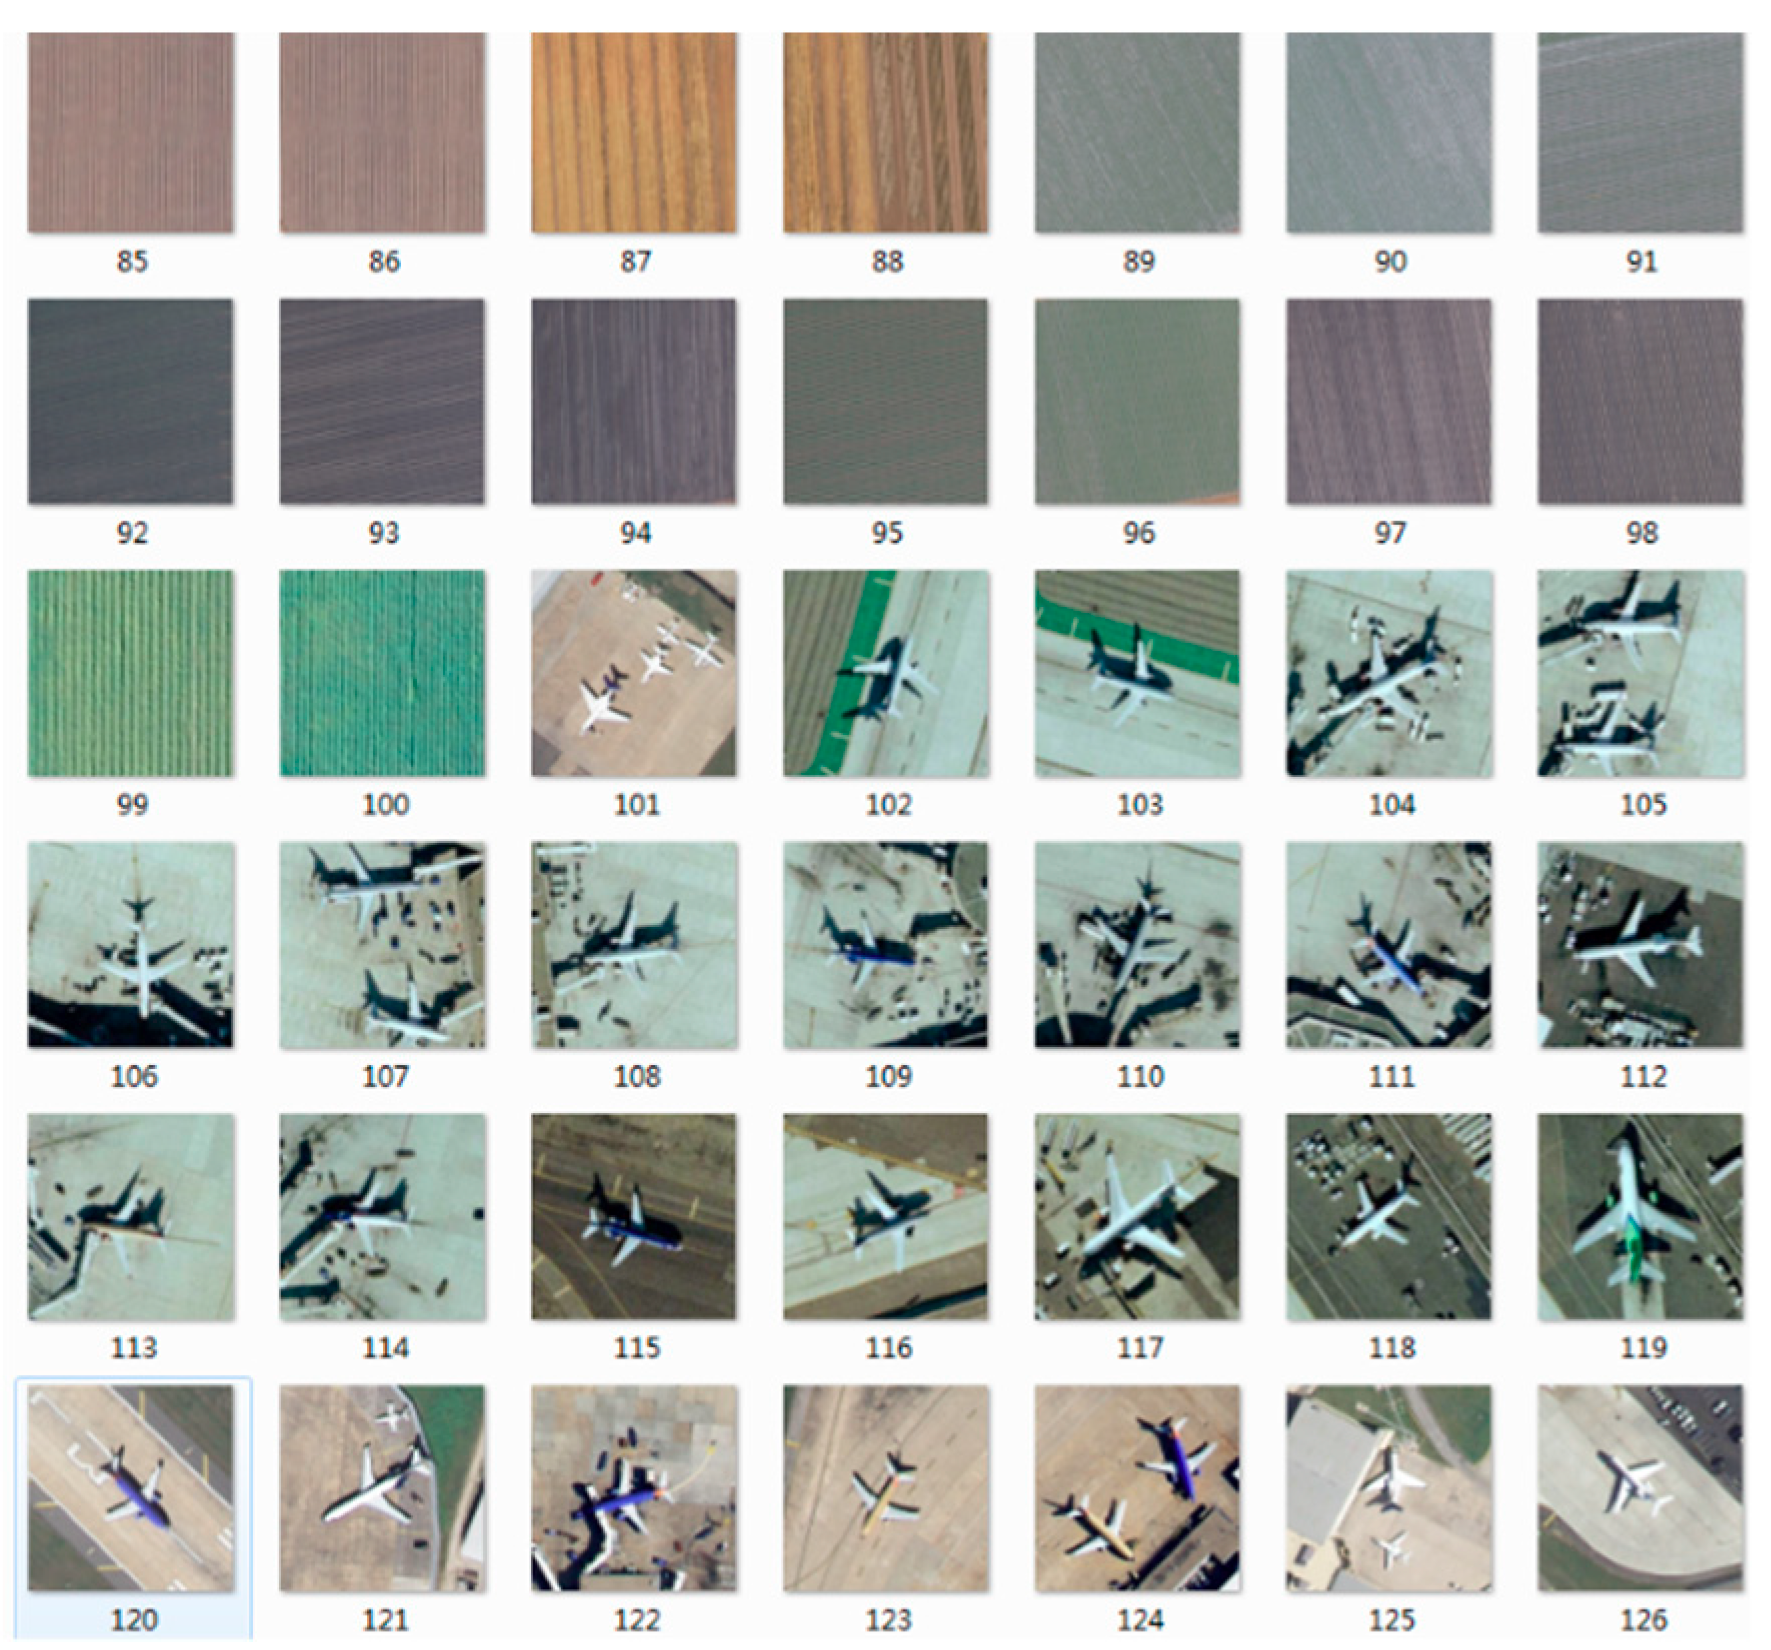
In the experiment, we use three public datasets for image description generation. UCM-Captions Dataset [19,36], of 2100 images, is based on the UC Merced Land Use data, and contains 21 classes including agricultural, airplane, baseball diamond, beach, buildings, chaparral, dense residential, forest, freeway, golf course, harbor, intersection, medium residential, mobile home park, overpass, parking lot, river, runway, sparse residential, storage tanks, and tennis court. There are 100 images for each class and every image is with a size of 256 × 256 pixels and five different sentences are exploited to describe every image. The phrasing of five sentences for one image is different, but the meaning is the same. All the images were extracted from large images of the United States Geological Survey National Map Urban Area Imagery. The examples of the UCM Dataset are shown in Figure 4.
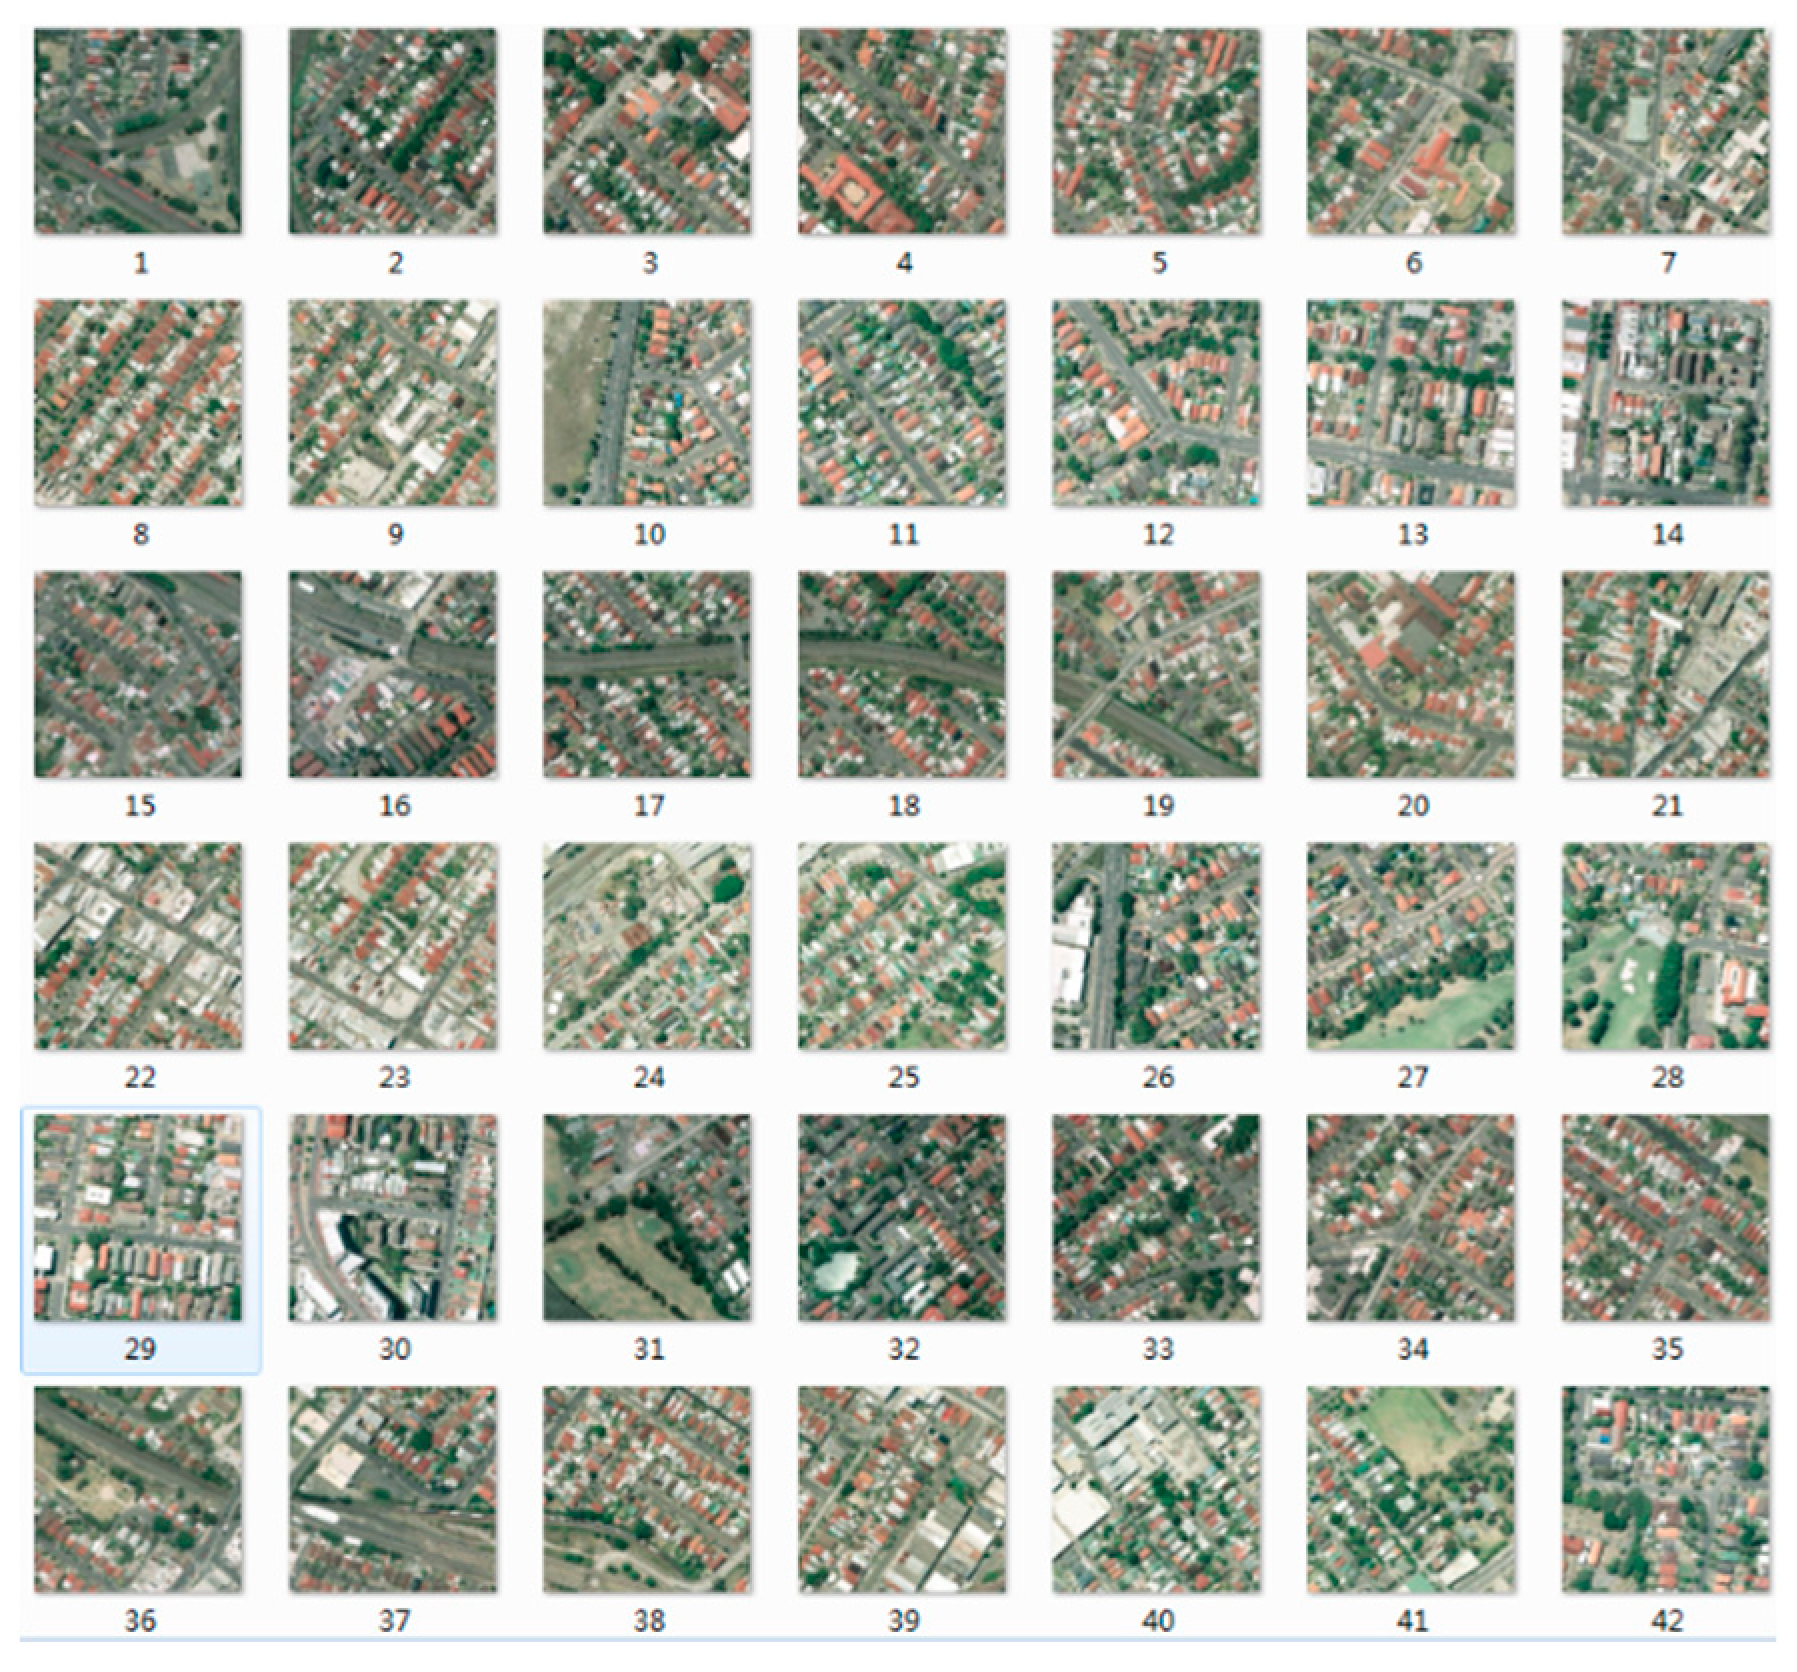
Sydney-Captions Dataset [19,37] is based on the Sydney Dataset, and contains seven classes, including residential, airport, meadow, rivers, ocean, industrial and runway. There are 613 images and every image is with a size of 500 × 500 pixels, and five different sentences are exploited to describe every image. Each image has five different descriptive sentences with the same meaning. All the images were extracted from the 18,000 × 14,000 pixels image of Sydney, Australia, which were produced on Google Earth. Some examples of the Sydney Dataset are exhibited in Figure 5.
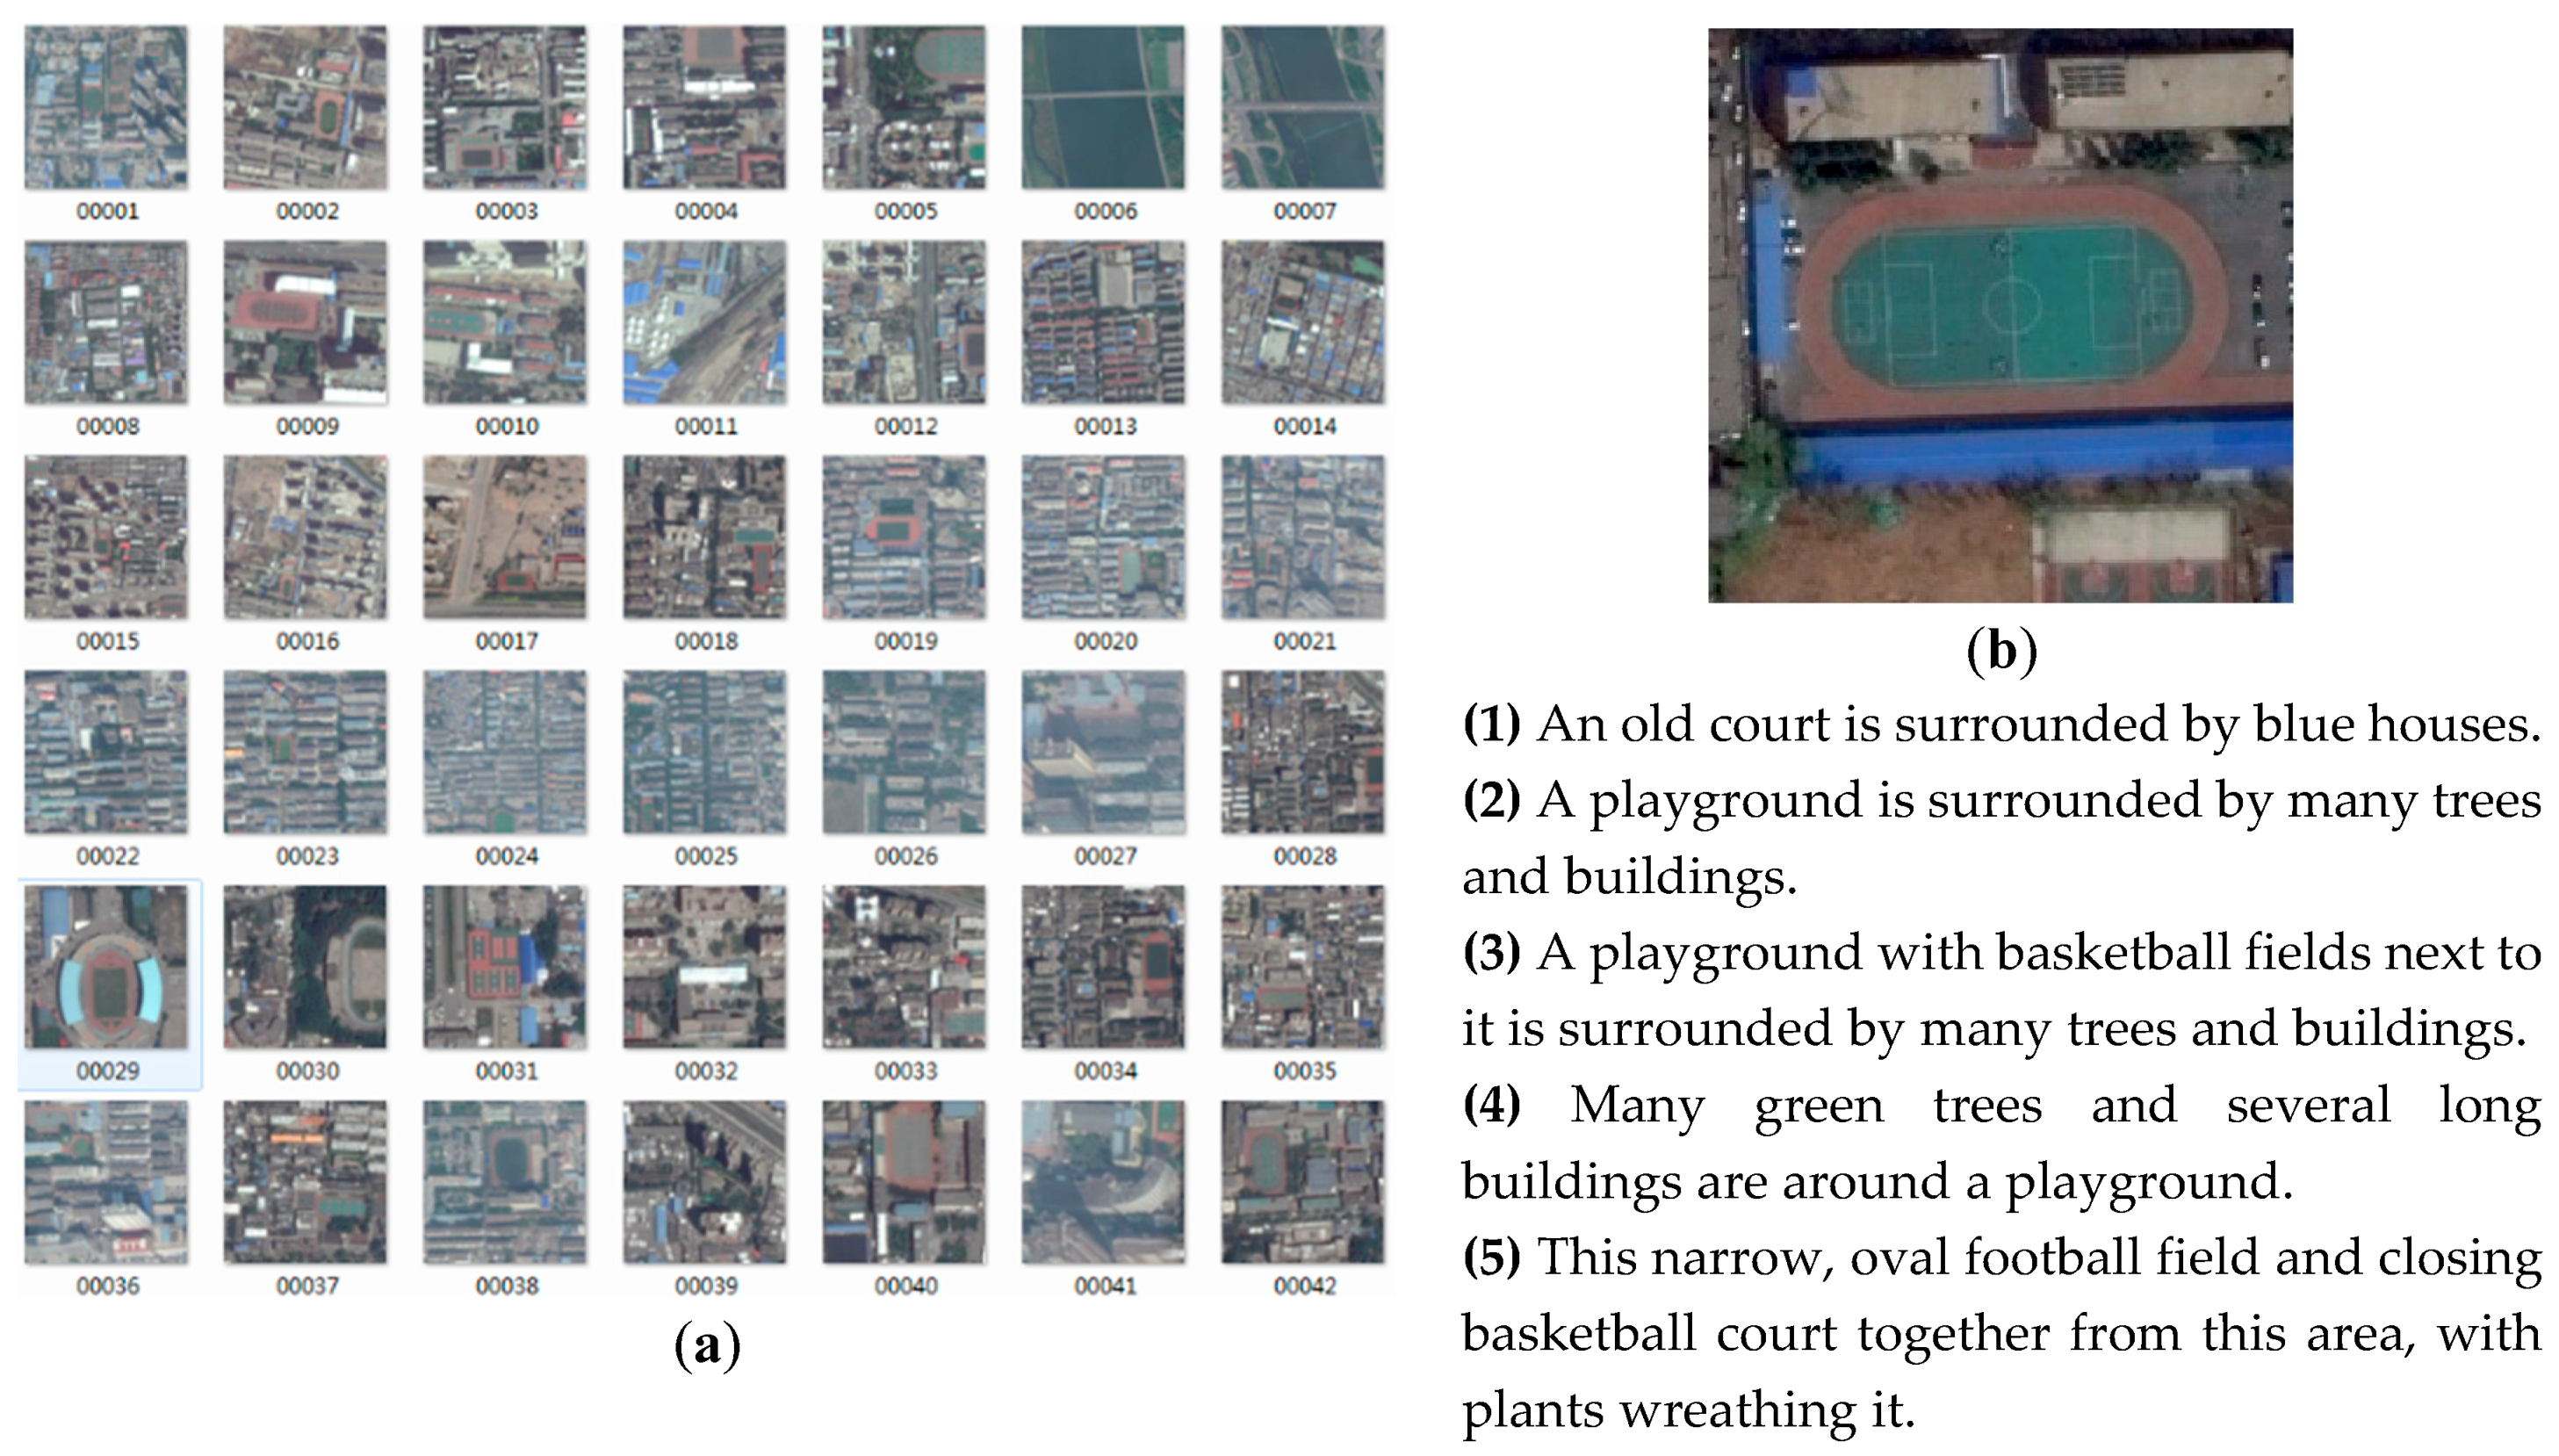
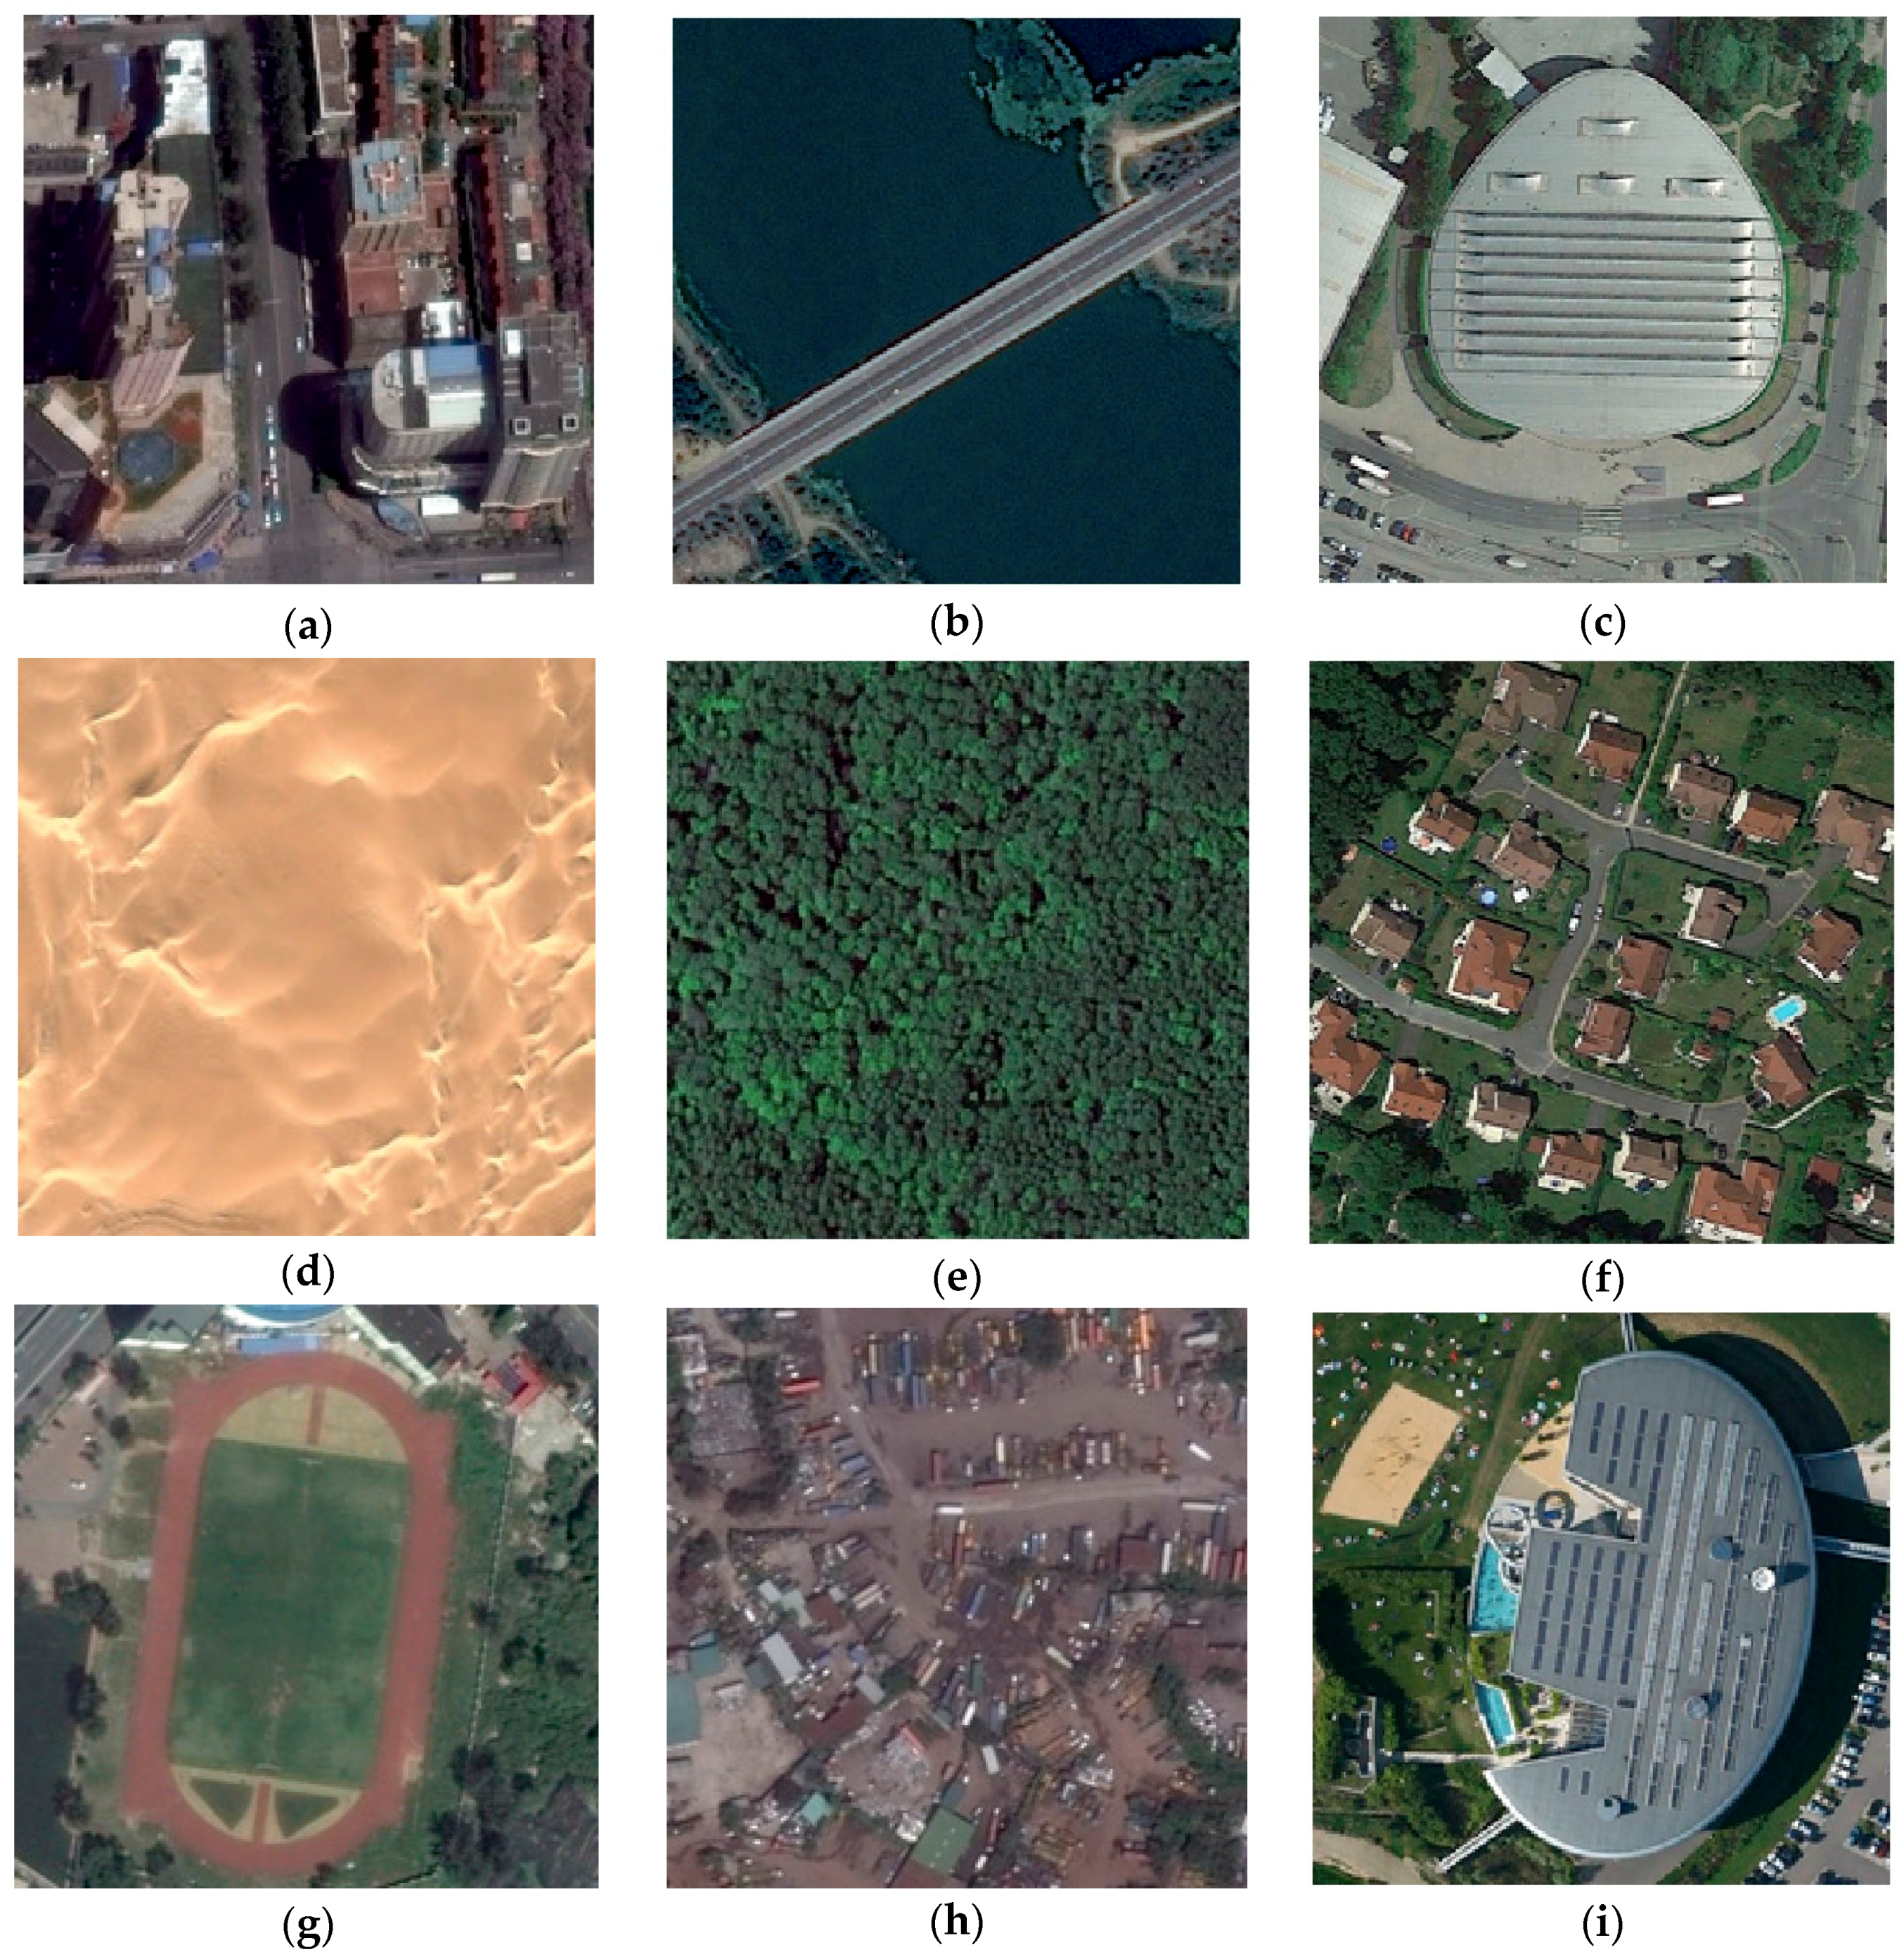
RSICD is provided by [21]. All the images in the dataset come from Google earth and were set to 224 × 224 sizes with different resolutions. The dataset contains a total of 10,921 remote sensing images, each of which is artificially annotated with 5 descriptive sentences. RSICD is by far the largest dataset that has been made public in terms of remote sensing images captions. There are 30 types of scenes, including airport, bridge, beach, baseball field, open land, commercial, center, church, desert, dense residential, forest, farmland, industrial, mountain, medium residential, meadow, port, pond, parking, park, playground, river, railway station, resort, storage tanks, stadium, sparse residential, square, school, and viaduct. Figure 6a shows exemplar images of RSICD. Figure 6b displays an image and its five captions.
4.2. Metrics and Baselines
We use the following metrics to evaluate the results. BLEU [40] scores can measure the fraction of n-gram (n = 1,2,3,4) in common between the references and the generated sentences; this focuses on the precision. ROUGE [41] focuses on the recall and calculates it between the reference sentences and the generated sentences based on the n-gram. METEOR [42] calculates the harmonic mean F-measure according to the matching degree including synonym matching, and returns the highest score as a quality indicator to a set of references. CIDEr [43] measures the similarities by adding a Term Frequency–Inverse Document Frequency (TF-IDF) weighting for n-gram, so it can reduce the weight of high frequency words and non-keywords.
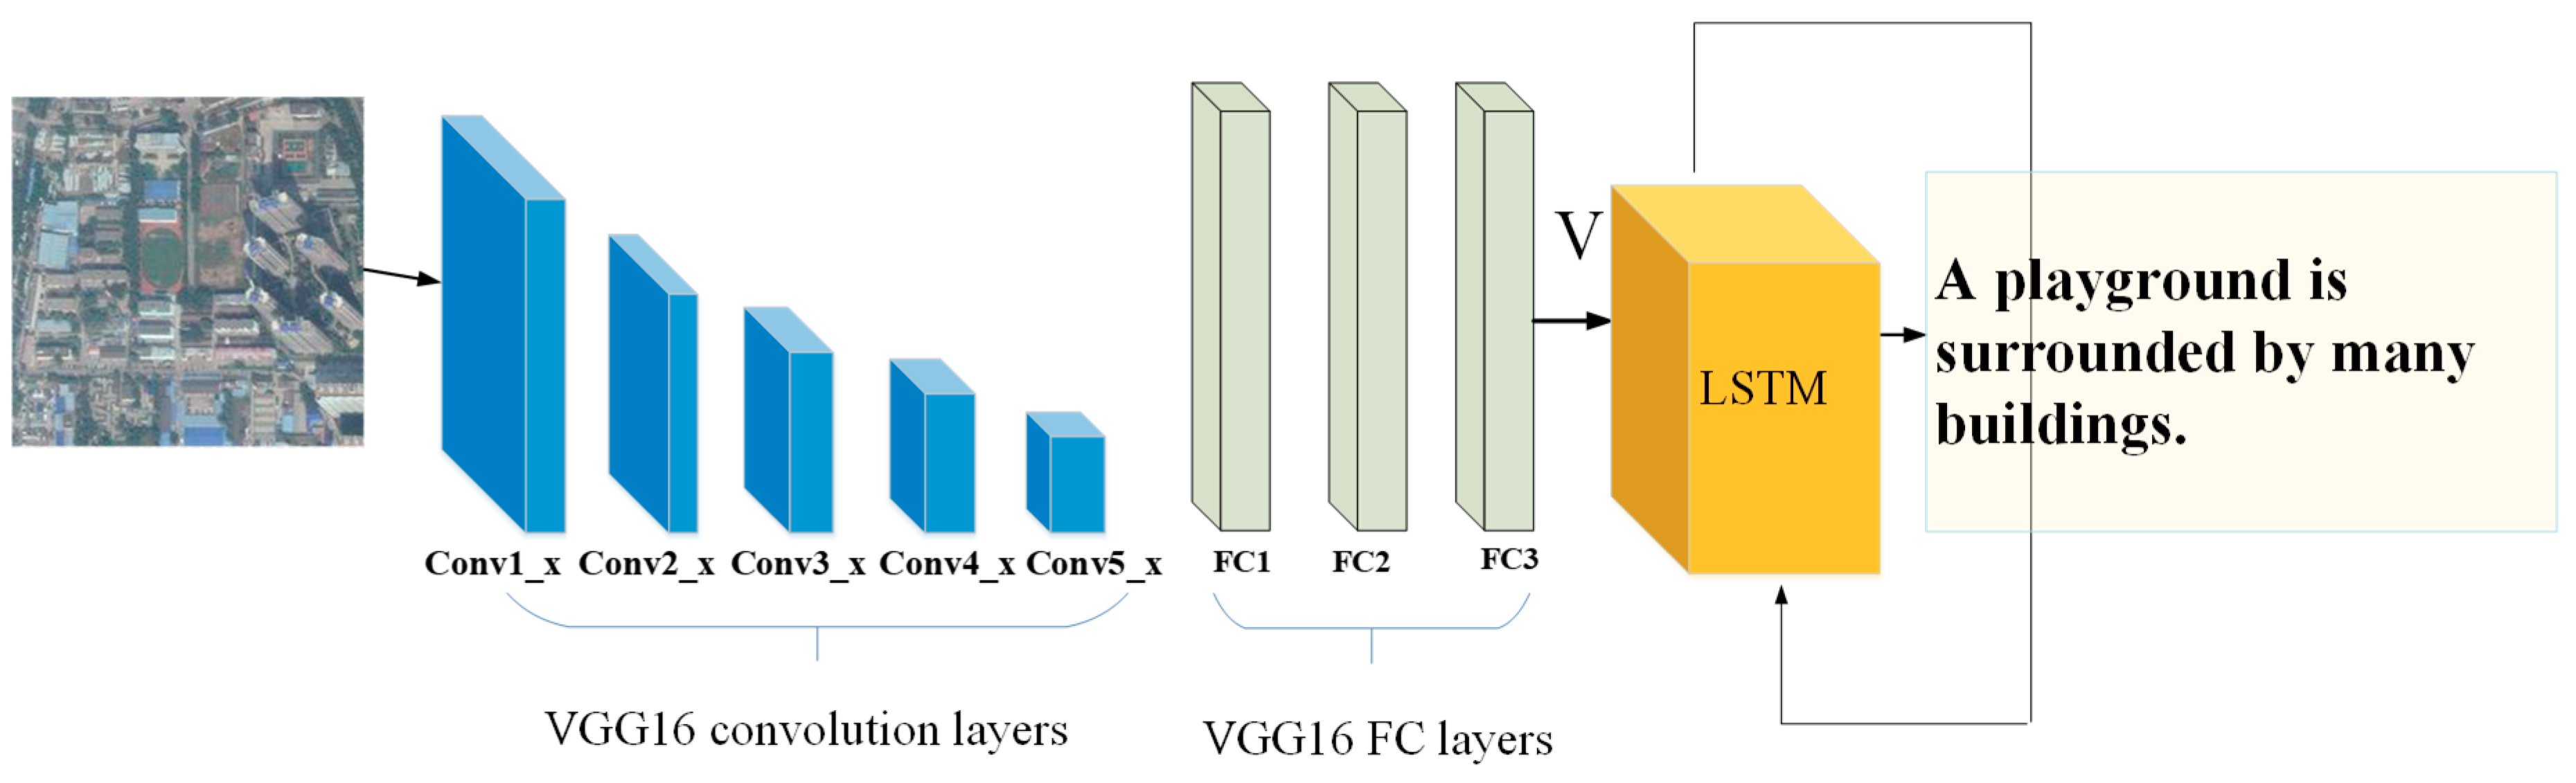
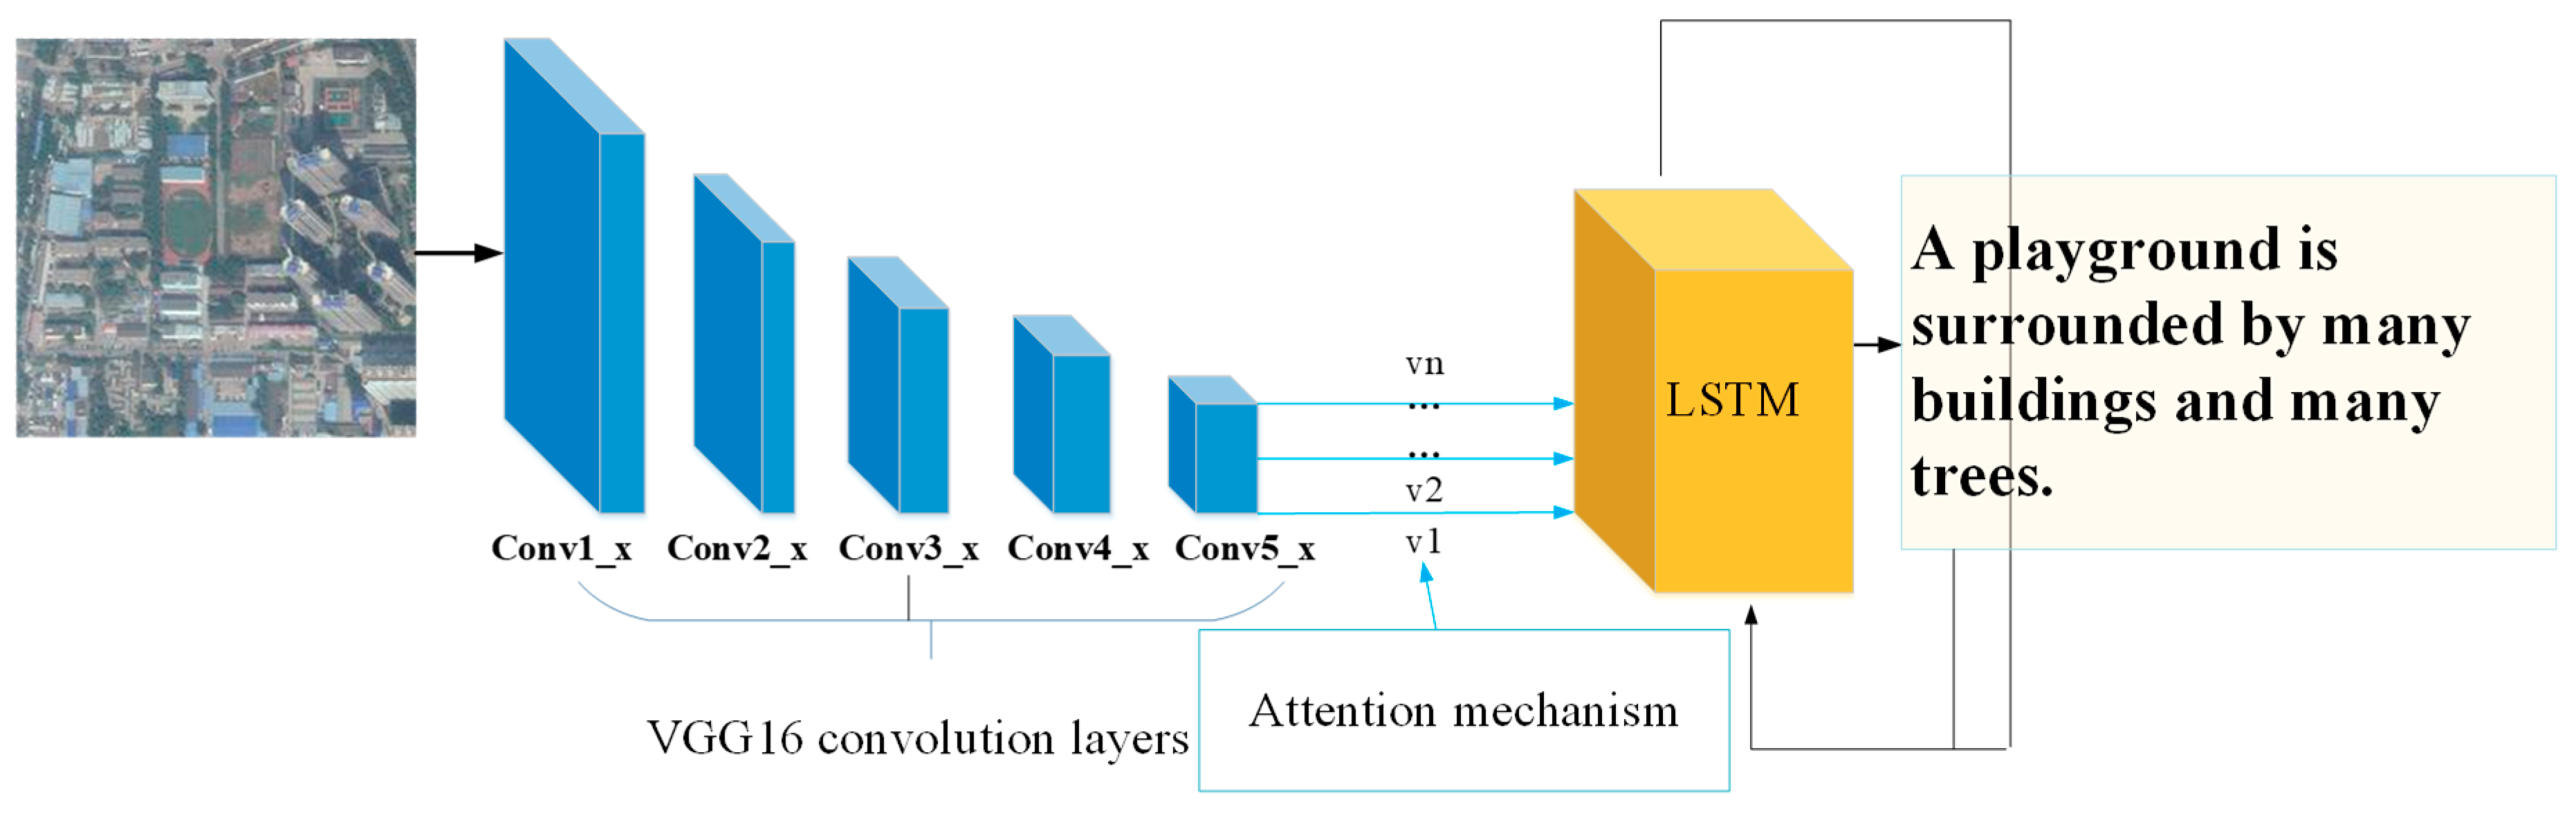
In order to verify the effectiveness of our model, we also use several available models to obtain the scores of various metrics for the comparison. The multimodal method shown in [19] used information from different modes including visual and textual information of high resolution remote sensing images. It used a CNN as the encoder to encode an image to a vector and an RNN as the decoder to decode the vector and textual features to a sentence, and the structure is shown in Figure 7. For the unity of all the experiments, we use Vgg16 and LSTM. For the attention-based method shown in [21], the attention mechanism was applied to construct the vectors between the encoder and decoder, so this model could improve the attention of those objects in images whose structure is shown in Figure 8. We should note in this method that the image features were extracted by the convolution layers rather than the fully-connected layers. For CSMLF [38], collective semantic metric learning was used for generating sentences. It embedded an image onto the semantic space by CNN, then computed the distance between the image and the collective sentences by the learned Mahalanobis matrix, and finally, the closest collective sentence as the caption for the given image.
The structure of our method is shown in Figure 2. We evaluate two variants of our approach, FC-Att+LSTM and SM-Att+LSTM. The FC-Att+LSTM model is in the framework of encoder-decoder with an attribute attention mechanism used. It utilizes the output of the last fully connected layer of Vgg16 as the high-level attributes to affect the attention mechanism, while the feature maps of the last convolution layer of Vgg16 are fed into the LSTM as image features. The SM-Att+LSTM model is identical to the FC-Att+LSTM model except that it uses the output of the softmax layer of Vgg16 as attributes. Furthermore, we changed the dimensions of the last fully connected layer of Vgg16 from 1000 to 512 in order to extract 512 attributes.
It should be noted that there are clear differences among the baseline methods and our method. All five methods use a CNN to obtain image features, but in the CSMLF [38] method, sentences are embedded into a semantic space to measure the distance between images and sentences to train the model, while other methods use an LSTM to process image and sentence features. The remaining four methods are in an encoder-decoder structure, but the multimodal method [19] does not use the attention mechanism, while the others do. In addition, due to introducing attributes of images, our methods use the attribute attention mechanism which differs from the one used in the attention-based method [21].
4.3. Results on Three Datasets
Table 1, Table 2 and Table 3 report image captioning results of the Sydney Dataset, UCM Dataset, and RSICD respectively. There are certain differences between the three datasets, the biggest being the number of images. As described above, the Sydney Dataset has only 613 images in total, while RSICD has more than 10,000 images and UCM is with 2,100 images. A different number of images bring different scales of sentences data and also bring training difficulties, so it is normal that metrics may produce different scores on different datasets.
4.3.1. Results on Sydney Dataset
In this experiment, about 81% images are randomly selected from each class for training (497 images in total), and both validation and test sets have 58 images. Table 1 shows the results of seven metrics including BLEU1~4, METEOR, ROUGE, and CIDEr by different methods, i.e., CSMLF method [38], multimodal method [19], attention-based method [21], SM-Att+LSTM method, and FC-Att+LSTM method on the Sydney Dataset. In the table, the best results are marked in bold. For the Sydney Dataset, we make its vocabulary size 214, i.e., equal the number of words in all the sentences in the training set, which is also equal to the dimension of the attributes.
From Table 1, we clearly see that CSMLF method [38] does not perform very well, while multimodal method [19] has an average score. The attention-based method [21] has better, but also average, performance in every metric, which means the attention-based method [21] has the ability to generate sentences roughly matching remote sensing images. However, SM-Att+LSTM and FC-Att+LSTM have better performance than the attention-based method [21] on METEOR and CIDEr. Moreover, all the improvements of these indicators are greater than 0.02 on BLEU-1~4 by the SM-Att+LSTM method. These results further confirm the effectiveness of our attribute attention-based image captioning model and the significance of the attributes. The results also show the information which is the output of the fully connected layer is inferior to that of the softmax layer.
4.3.2. Results on UCM Dataset
In this section, we evaluate the proposed methods on the UCM Dataset while comparing it with the aforementioned methods. Around 80% samples from each class are randomly chosen for training (in total 1680 samples) and the validation set is the same in terms of the images numbers, which is 210. Table 2 shows the results on the seven metrics mentioned above on the UCM Dataset used by the same five methods in the last section. Due to the small quantity in the sentences data, like the Sydney Dataset, all the words shown in the UCM training set are used to build vocabulary and the dimension of the attributes is 320, which is equal to the vocabulary size.
From Table 2, we can draw the same conclusion as that shown in the last section: the methods with attention perform better than those without attention, and using attribute attention demonstrates its better performance compared to the systems of the original attention. The FC-Att+LSTM method surpasses the attention-based method [21] on BLEU1~4 and ROUGH, and lags behind slightly on METEOR and CIDEr but very close to attention-based method [21]. The SM-Att+LSTM method is even better and achieves satisfactory results on all seven metrics on UCM Dataset.
4.3.3. Results on RSICD
For the RSICD dataset, 8734 images are selected from all kinds of classes to form the training set, which have 80% of the total images. The validation and test sets account for 10% respectively. The results are shown in Table 3, with the best results annotated in bold. Due to the large number of the images and sentences, we do not need all the words in the training set to form the vocabulary. Instead, the vocabulary is built based on the top 2000 words in terms of the occurring frequency in the training set. We set the dimension of the attributes to be 512 as RSICD is quite larger than the two above.
From Table 3, we can see that models with the attention mechanism have better performance than those without it. Like the two datasets above, we can find that our attribute attention models generate better results. The SM-Att+LSTM model generates the best results on BLEU-1~4 and ROUGH, and the FC-Att+LSTM model performs the best in CIDEr. The attention model [21], which does not use the attributes information, is far behind our two models in several metrics, and only shows a little superiority in METEOR. It is worth mentioning that our models have a very high score in CIDEr, which has been improved to more than 0.1 on all three datasets.
4.4. Results Analysis
From Table 1, Table 2 and Table 3, it may be seen that CSMLF [38] performs much worse than the other four methods, which shows the validity of LSTM, and it explains the popularity of the encoder-decoder structure in this field. The multimodal method [19] does not perform as well as the other three methods because of the absence of the attention mechanism. Additionally, the attention-based method [21] has high scores but is still lower than our methods, which validates the effectiveness of the model with attributes and the attention mechanism. SM-Att+LSTM scores higher than FC-Att+LSTM in most cases, and it indicates that the type of the attributes also affects the system performance.
Figure 9 shows partial but typical sentence results generated by our method on RSICD. From Figure 9, we can see that most of the generated sentences can describe the corresponding images well, such as Figure 9a–f. For example, even the color features (like green in Figure 9c and yellow in Figure 9d) can be accurately identified and described in the generated sentences. Therefore, it is effective to use the attribute attention mechanism to generate description for remote sensing images.
However, there are also some inaccurate examples, such as Figure 9g–i, which is discussed below:
- The generated content is not in the image. There is no building in Figure 9g, but the word “buildings” is in its generated sentence. Due to the high frequency of some words appearing together in the training set, the proposed model may misclassify them. For example, a parking lot often appears in the same image with trees, so there are a large number of reference sentences in which both “parking lot” and “trees” appear at the same time. If an image contains a parking lot in the test set, the generated sentence tends to have "trees" whether or not there are trees in the image.
- Misrecognition. In Figure 9h, the scene is misrecognized as the commercial area while the ground truth is an industrial area as they are very similar. Both industrial and commercial areas in remote sensing images have the same characteristics of dense and crowded buildings. This is a challenge in the field of remote sensing image/scene classification, which is called the small interclass dissimilarity problem [44]. More work needs to be done to get over around this problem.
- Both above problems occurred. In Figure 9i, the key object is a center but it is recognized as a circle square. In addition, a square often appears with buildings around in the training set, which leads to “buildings” shown in the generated sentence.
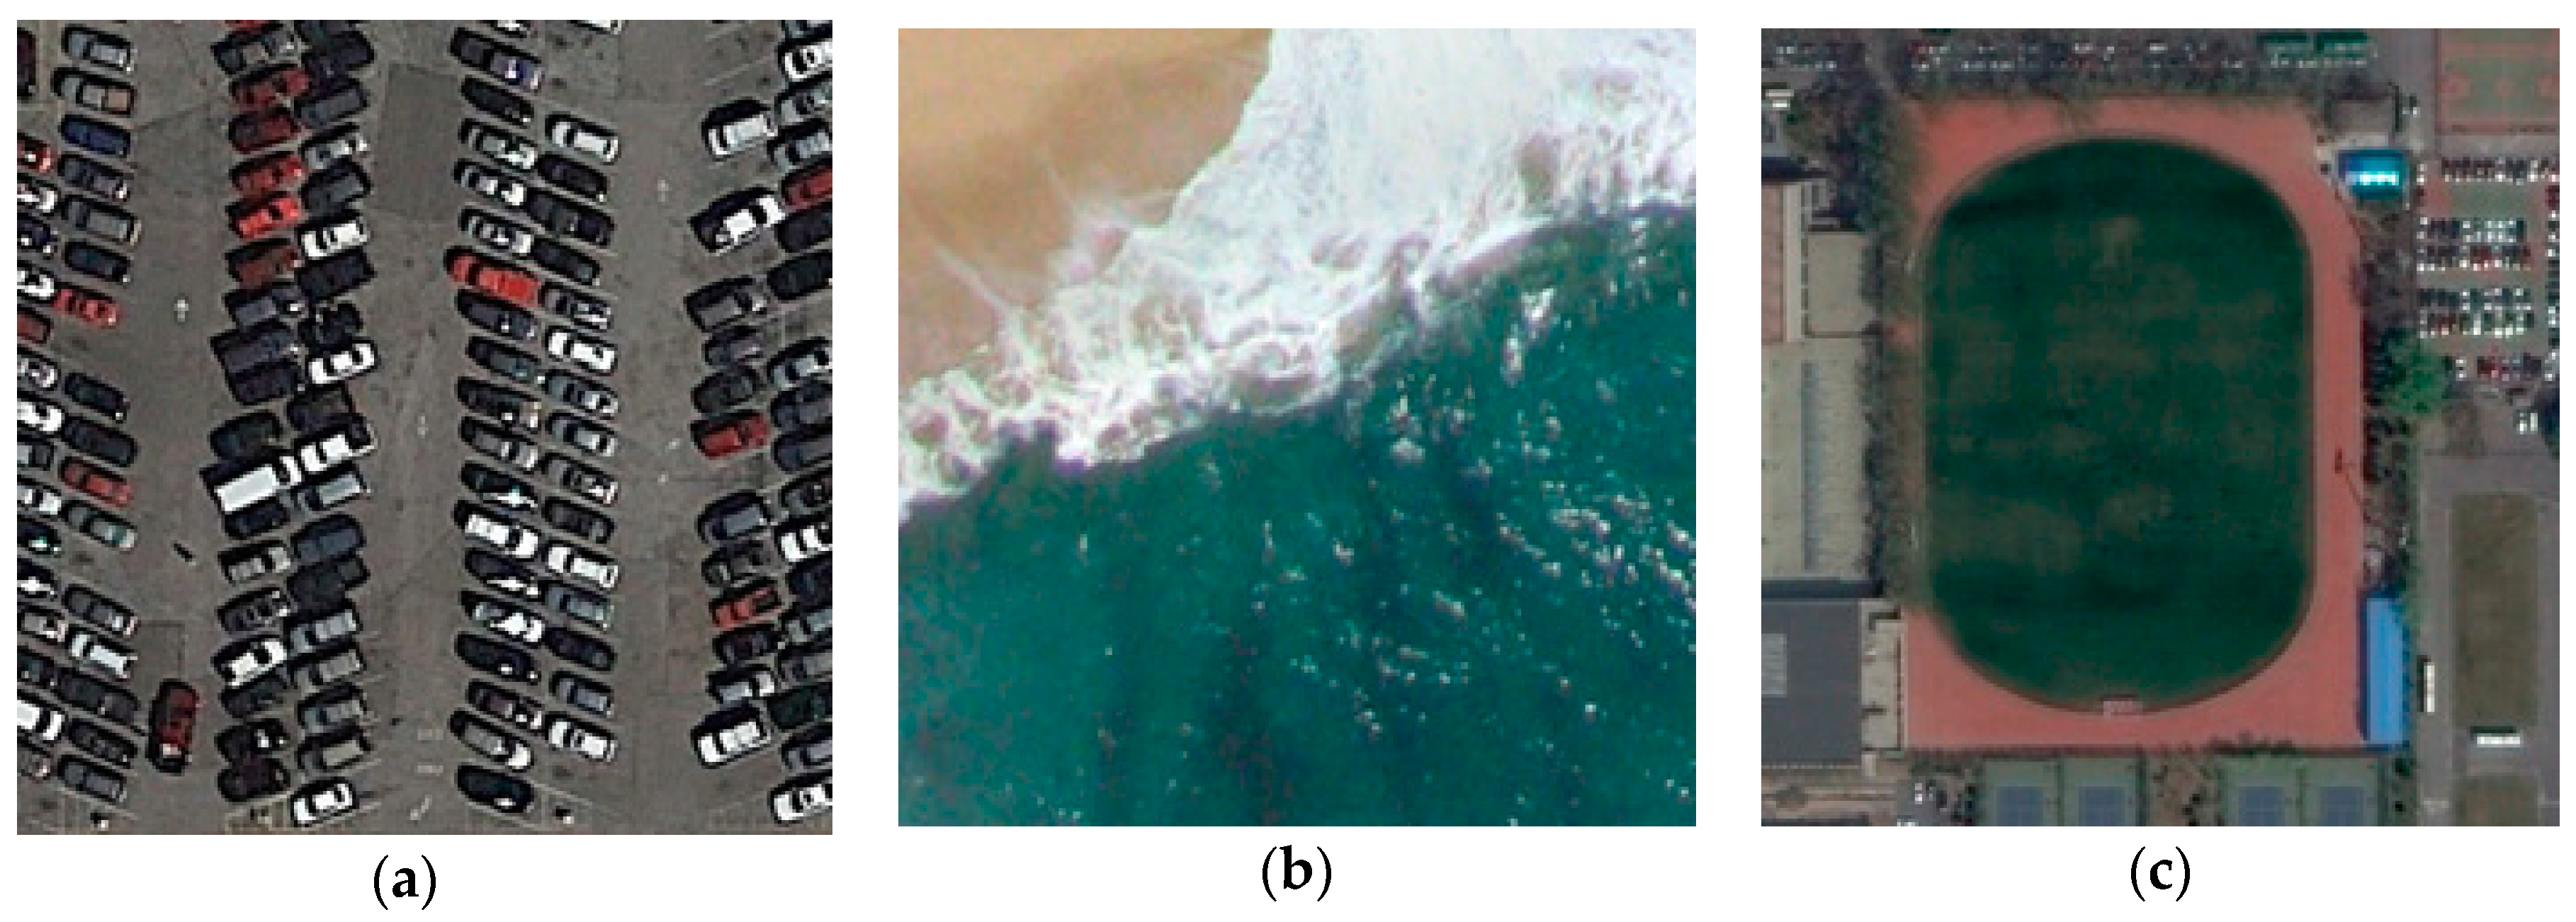
Figure 10 shows some results in the sentences generated by attention-based method [21] and SM-Att+LSTM. For Figure 10a, “near several green trees” in the sentence generated by the attention-based method [21] is not the content of the image while SM-Att+LSTM generates a correct sentence. Meanwhile, both methods generate the sentence containing “buildings”, even if there is no building in Figure 10c. In fact, by observing the results of the whole test set, we find that our model, in some cases such as parking lot images, can well restrain the generation of words that are not the content of the image, while in other cases such as playground images, our model may produce the same error of generating some words that are not shown in the image, as the attention-based method [21] does. The above observation shows that attributes can indeed improve the understanding of image contents, but further research and improvement on attributes is needed. As we can see in Figure 10b, our model picks up the white wave in the image while the baseline dose not. Therefore, our model is superior to the attention-based method [21] in generating semantics that are present in the image.
4.5. Parameter Analysis
In this section, we investigate the effects of changing the size of the attributes in our model with the seven metrics on the RSICD dataset. We conduct the experiments with =256, 512. The seven metrics values for different are shown in Table 4.
256-FC, 256-SM, 512_FC, and 512_SM represent FC-Att+LSTM with = 256, SM-Att+LSTM with = 256, FC-Att+LSTM with = 512, and SM-Att+LSTM with = 512 respectively. Table 4 revels that the size of the attributes can influence the performance of the model. We can see that the best results are obtained when the attributes size is equal to 512. A smaller size allows us to focus on fewer attributes and add less global information to the attention mechanism, which may cause weaker performances. However, it remains to be verified whether or not it is true that the larger the size of the attribute, the better of the results.
4.6. Computational Cost
We performed our method on a server with 128G RAM and an Nvidia GeForce GTX 1080Ti graphics card under the Linux system. Like other studies for this task, the offline training process is time consuming due to the large amount of the parameters of the CNN and the LSTM. Taking RSICD, the largest dataset in our experiments for example, one epoch including more than 8000 images and 40000 sentences costs about 3.3 hours, and our optimal model was obtained after the training of more than 20 epochs. After the model training, the test process is fast. For a 224 × 224 sized input image, our model takes about 300 millisecond to finish the whole captioning process.
5. Conclusions
This paper presented a novel framework for description generation of remote sensing images based on the attribute attention model. We use a CNN to produce image features, which are the feature maps of the last convolution layer region proposals for the input remote sensing image. In the encoder-decoder framework with the attention mechanism, the attention mechanism is able to influence the intermediate vector by assigning different weights to different areas of the image, which compensates the deficiency of the original attention mechanism in complex remote sensing images. To apply the high-level features of remote sensing images, we use suitable attributes to embed the global information so that it can affect the parameter of the attention mechanism, focusing on more objects and scenes. We feed the intermediate vector into the decoder and adopt the LSTM to generate the description of the given remote sensing image. We observed that better results can be achieved if the attribute size is appropriate.
From the observation of the experiments, our model can reach high scores on the different assessment criteria, and obtained satisfactory results when the remote sensing image is less complicated. In the future, we will focus on understanding semantics information, and use this to better train our models.
Author Contributions
Conceptualization, X.Z. and X.W.; methodology, X.Z.; software, X.W.; validation, X.Z., X.W. and X.T.; formal analysis, X.Z. and X.T.; investigation, X.W. and X.T.; resources, X.Z.; data curation, X.W.; writing—original draft preparation, X.W.; writing—review and editing, X.Z., X.W., X.T., H.Z and C.L.; visualization, X.W.; supervision, X.Z and X.T.; project administration, X.Z.; funding acquisition, X.Z.
Funding
This research was funded by the National Natural Science Foundation of China under Grant 61772400, Grant 61801351, Grant 61501353, Grant 61772399, and Grant 61573267. H. Zhou was supported by UK EPSRC under Grant EP/N011074/1, Royal Society Newton Advanced Fellowship under Grant NA160342, and European Union’s Horizon 2020 research and innovation program under the Marie-Sklodowska-Curie grant agreement no. 720325. The APC was funded by the National Natural Science Foundation of China under Grant 61772400, Grant 61501353, Grant 61772399, and Grant 61573267.
Conflicts of Interest
The authors declare no conflict of interest.
References
- Toth, C.; Jóźków, G. A survey, journal of photogrammetry and remote sensing. Remote Sens. Platforms Sens. 2016, 115, 22–36. [Google Scholar]
- Rahaman, K.R.; Hassan, Q.K. Application of remote sensing to quantify local warming trends: A review. In Proceedings of the 5th International Conference on Informatics, Electronics and Vision (ICIEV), Dhaka, Bangladesh, 13–14 May 2016; pp. 256–261. [Google Scholar]
- Aroma, R.J.; Raimond, K. A review on availability of remote sensing data. In Proceedings of the IEEE Technological Innovation in ICT for Agriculture and Rural Development (TIAR), Chennai, India, 10–12 July 2015; pp. 150–155. [Google Scholar]
- Maggiori, E.; Tarabalka, Y.; Charpiat, G.; Alliez, P. Convolutional neural networks for large-scale remote-sensing image classification. IEEE Trans. Geosci. Remote Sens. 2017, 55, 645–657. [Google Scholar] [CrossRef]
- Cheng, G.; Yang, C.; Yao, X.; Guo, L.; Han, J. When deep learning meets metric learning: Remote sensing image scene classification via learning discriminative CNNs. IEEE Trans. Geosci. Remote Sens. 2018, 56, 2811–2821. [Google Scholar] [CrossRef]
- Lu, X.; Zheng, X.; Yuan, Y. Remote sensing scene classification by unsupervised representation learning. IEEE Trans. Geosci. Remote Sens. 2017, 99, 1–10. [Google Scholar] [CrossRef]
- Han, X.; Zhong, Y.; Zhang, L. An efficient and robust integrated geospatial object detection framework for high spatial resolution remote sensing imagery. Remote Sens. 2017, 9, 666. [Google Scholar] [CrossRef]
- Zhang, L.; Zhang, Y. Airport detection and aircraft recognition based on two-layer saliency model in high spatial resolution remote-sensing images. IEEE J. Sel. Top. Appl. Earth Observ. Remote Sens. 2017, 10, 1511–1524. [Google Scholar] [CrossRef]
- Liu, T.T.; Li, P.X.; Zhang, L.P.; Chen, X. A remote sensing image retrieval model based on semantic mining. Geomatics Inf. Sci. Wuhan Univ. 2009, 34, 684–687. [Google Scholar]
- Zhu, Q.; Zhong, Y.; Zhang, L. Multi-feature probability topic scene classifier for high spatial resolution remote sensing imagery. In Proceedings of the 2014 IEEE Geoscience and Remote Sensing Symposium, Quebec, QC, Canada, 13–18 July 2014; pp. 2854–2857. [Google Scholar]
- Yang, J.; Jiang, Z.; Quan, Z. Remote sensing image semantic labeling based on conditional random field. Acta Aeronaut. Et Astronaut. Sin. 2015, 36, 3069–3081. [Google Scholar]
- Wang, J.; Zhou, H. Research on key technologies of remote sensing image data retrieval based on semantics. Comput. Digit. Eng. 2012, 40, 48–50. [Google Scholar]
- Chen, K.M.; Zhou, Z.X.; Guo, J.E.; Zhang, D.B.; Sun, X. Semantic scene understanding oriented high resolution remote sensing image change information analysis. In Proceedings of the Annual Conference on High Resolution Earth Observation, Beijing, China, 1 December 2013; pp. 1–12. [Google Scholar]
- Li, Y. Target Detection Method of High Resolution Remote Sensing Image Based on Semantic Model; Graduate University of Chinese Academy of Sciences: Beijing, China, 2012. [Google Scholar]
- Vinyals, O.; Toshev, A.; Bengio, S.; Erhan, D. Show and tell: Lessons learned from the mscoco image captioning challenge. IEEE Trans. Pattern Anal. Mach. Intell. 2017, 39, 652–663. [Google Scholar] [CrossRef] [PubMed]
- Mao, J.; Xu, W.; Yang, Y.; Wang, J.; Huang, Z.; Yuille, A. Deep caption with multimodal recurrent neural networks (m-rnn). arXiv, 2014; arXiv:1412.6632. [Google Scholar]
- Chen, X.; Lawrence Zitnick, C. Mind’s eye: A recurrent visual representation for image captioning generation. In Proceedings of the IEEE Conference on Computer Vision and Pattern Recognition, Boston, MA, USA, 7–12 June 2015; pp. 2422–2431. [Google Scholar]
- Karpathy, A.; Joulin, A.; Fei-Fei, L.F. Deep fragment embeddings for bidirectional image sentence mapping. In Proceedings of the Advances in Neural Information Processing Systems, Montreal, QC, Canada, 8–13 December 2014; pp. 1889–1897. [Google Scholar]
- Qu, B.; Li, X.; Tao, D.; Lu, X. Deep semantic understanding of high resolution remote sensing image. In Proceedings of the 2016 International Conference on Computer, Information and Telecommunication Systems (CITS), Kunming, China, 6–8 July 2016; pp. 1–5. [Google Scholar]
- Shi, Z.; Zou, Z. Can a machine generate humanlike language descriptions for a remote sensing image? IEEE Trans. Geosci. Remote Sens. 2017, 55, 3623–3634. [Google Scholar] [CrossRef]
- Lu, X.; Wang, B.; Zheng, X.; Li, X. Exploring models and data for remote sensing image caption generation. IEEE Trans. Geosci. Remote Sens. 2018, 56, 2183–2195. [Google Scholar] [CrossRef]
- Spratling, M.W.; Johnson, M.H. A feedback model of visual attention. J. Cogn. Neurosci. 2004, 16, 219–237. [Google Scholar] [CrossRef] [PubMed]
- Xu, K.; Ba, J.; Kiros, R.; Cho, K.; Courville, A.; Salakhudinov, R.; Zemel, R.; Bengio, Y. Show, attend and tell: Neural image captioning generation with visual attention. In Proceedings of the International Conference on Machine Learning, Lille, France, 6–11 July 2015; pp. 2048–2057. [Google Scholar]
- Lu, J.; Xiong, C.; Parikh, D.; Socher, R. Knowing when to look: Adaptive attention via a visual sentinel for image captioning. In Proceedings of the 2017 IEEE Conference on Computer Vision and Pattern Recognition (CVPR), Honolulu, HI, USA, 21–26 July 2017; pp. 3242–3250. [Google Scholar]
- You, Q.; Jin, H.; Wang, Z.; Fang, C.; Luo, J. Image captioning with semantic attention. In Proceedings of the IEEE Conference on Computer Vision and Pattern Recognition, Las Vegas, NV, USA, 26 June–1 July 2016; pp. 4651–4659. [Google Scholar]
- Yao, T.; Pan, Y.; Li, Y.; Qiu, Z.; Mei, T. Boosting image captioning with attributes. In Proceedings of the 2017 IEEE International Conference on Computer Vision (ICCV), Venice, Italy, 22–29 October 2017; pp. 4904–4912. [Google Scholar]
- Wu, Q.; Shen, C.; Wang, P.; Dick, A.; van den Hengel, A. Image captioning and visual question answering based on attributes and external knowledge. IEEE Trans. Pattern Anal. Mach. Intell. 2018, 40, 1367–1381. [Google Scholar] [CrossRef] [PubMed]
- Hossain, M.D.; Sohel, F.; Shiratuddin, M.F.; Laga, H. A Comprehensive Survey of Deep Learning for Image Captioning. Available online: https://arxiv.org/pdf/1810.04020.pdf (accessed on 13 March 2019).
- Farhadi, A.; Hejrati, M.; Sadeghi, M.A.; Young, P.; Rashtchian, C.; Hockenmaier, J.; Forsyth, D. Every picture tells a story: Generating sentences from images. In Proceedings of the 11th European Conference on Computer Vision: Part IV, ECCV’10, Crete, Greece, 5–11 September 2010; pp. 15–29. [Google Scholar]
- Li, S.; Kulkarni, G.; Berg, T.L.; Berg, A.C.; Choi, Y. Composing simple image descriptions using web-scale n-grams. In Proceedings of the Fifteenth Conference on Computational Natural Language Learning, Portland, OR, USA, 23–24 June 2011; pp. 220–228. [Google Scholar]
- Kulkarni, G.; Premraj, V.; Dhar, S.; Li, S.; Choi, Y.; Berg, A.C.; Berg, T.L. Baby talk: Understanding and generating image descriptions. In Proceedings of the 24th CVPR, Colorado Springs, CO, USA, 20–25 June 2011; pp. 1601–1608. [Google Scholar]
- Gong, Y.; Wang, L.; Hodosh, M.; Hockenmaier, J.; Lazebnik, S. Improving image-sentence embeddings using large weakly annotated photo collections. In European Conference on Computer Vision; Springer: Cham, Switzerland, 2014; pp. 529–545. [Google Scholar]
- Sun, C.; Gan, C.; Nevatia, R. Automatic concept discovery from parallel text and visual corpora. In Proceedings of the IEEE International Conference on Computer Vision, Santiago, Chile, 13–16 December 2015; pp. 2596–2604. [Google Scholar]
- Hodosh, M.; Young, P.; Hockenmaier, J. Framing image description as a ranking task: Data, models and evaluation metrics. J. Artif. Intell. Res. 2013, 47, 853–899. [Google Scholar] [CrossRef]
- Wu, Q.; Shen, C.; Liu, L.; Dick, A.; Van Den Hengel, A. What value do explicit high level concepts have in vision to language problems? In Proceedings of the IEEE Conference on Computer Vision and Pattern Recognition, Las Vegas, NV, America, 26 June–1 July 2016; pp. 203–212. [Google Scholar]
- Yang, Y.; Newsam, S. Bag-of-visual-words and spatial extensions for land-use classification. In Proceedings of the 18th SIGSPATIAL International Conference on Advances in Geographic Information Systems, San Jose, CA, USA, 2–5 November 2010; pp. 270–279. [Google Scholar]
- Zhang, F.; Du, B.; Zhang, L. Saliency-guided unsupervised feature learning for scene classification. IEEE Trans. Geosci. Remote Sens. 2015, 53, 2175–2184. [Google Scholar] [CrossRef]
- Wang, B.; Lu, X.; Zheng, X.; Li, X. Semantic Descriptions of High-Resolution Remote Sensing Images. IEEE Geosci. Remote Sens. Lett. 2019. [CrossRef]
- Bahdanau, D.; Cho, K.; Bengio, Y. Neural machine translation by jointly learning to align and translate. arXiv, 2014; arXiv:1409.0473. [Google Scholar]
- Papineni, K.; Roukos, S.; Ward, T.; Zhu, W.J. BLEU: A method for automatic evaluation of machine translation. In Proceedings of the 40th Annual Meeting on Association for Computational Linguistics, Philadelphia, PA, USA, 7–12 July 2002; pp. 311–318. [Google Scholar]
- Lin, C.Y. Rouge: A package for automatic evaluation of summaries. In Proceedings of the Text Summarization Branches Out, Barcelona, Spain, 25–26 July 2004; pp. 74–81. [Google Scholar]
- Banerjee, S.; Lavie, A. METEOR: An automatic metric for MT evaluation with improved correlation with human judgments. In Proceedings of the ACL Workshop on Intrinsic and Extrinsic Evaluation Measures for Machine Translation and/or Summarization, Ann Arbor, MI, USA, 11 June 2005; pp. 65–72. [Google Scholar]
- Vedantam, R.; Lawrence Zitnick, C.; Parikh, D. Cider: Consensus-based image description evaluation. In Proceedings of the IEEE Conference on Computer Vision and Pattern Recognition, Boston, MA, USA, 7–12 June 2015; pp. 4566–4575. [Google Scholar]
- Xia, G.S.; Hu, J.; Hu, F.; Shi, B.; Bai, X.; Zhong, Y.; Zhang, L.; Lu, X. AID: A benchmark data set for performance evaluation of aerial scene classification. IEEE Trans. Geosci. Remote Sens. 2017, 55, 3965–3981. [Google Scholar] [CrossRef]
Figure 1.
The framework of the proposed model.

Figure 2.
The structure of our model, and attr can be the output of the last fully connected layer or softmax layer.
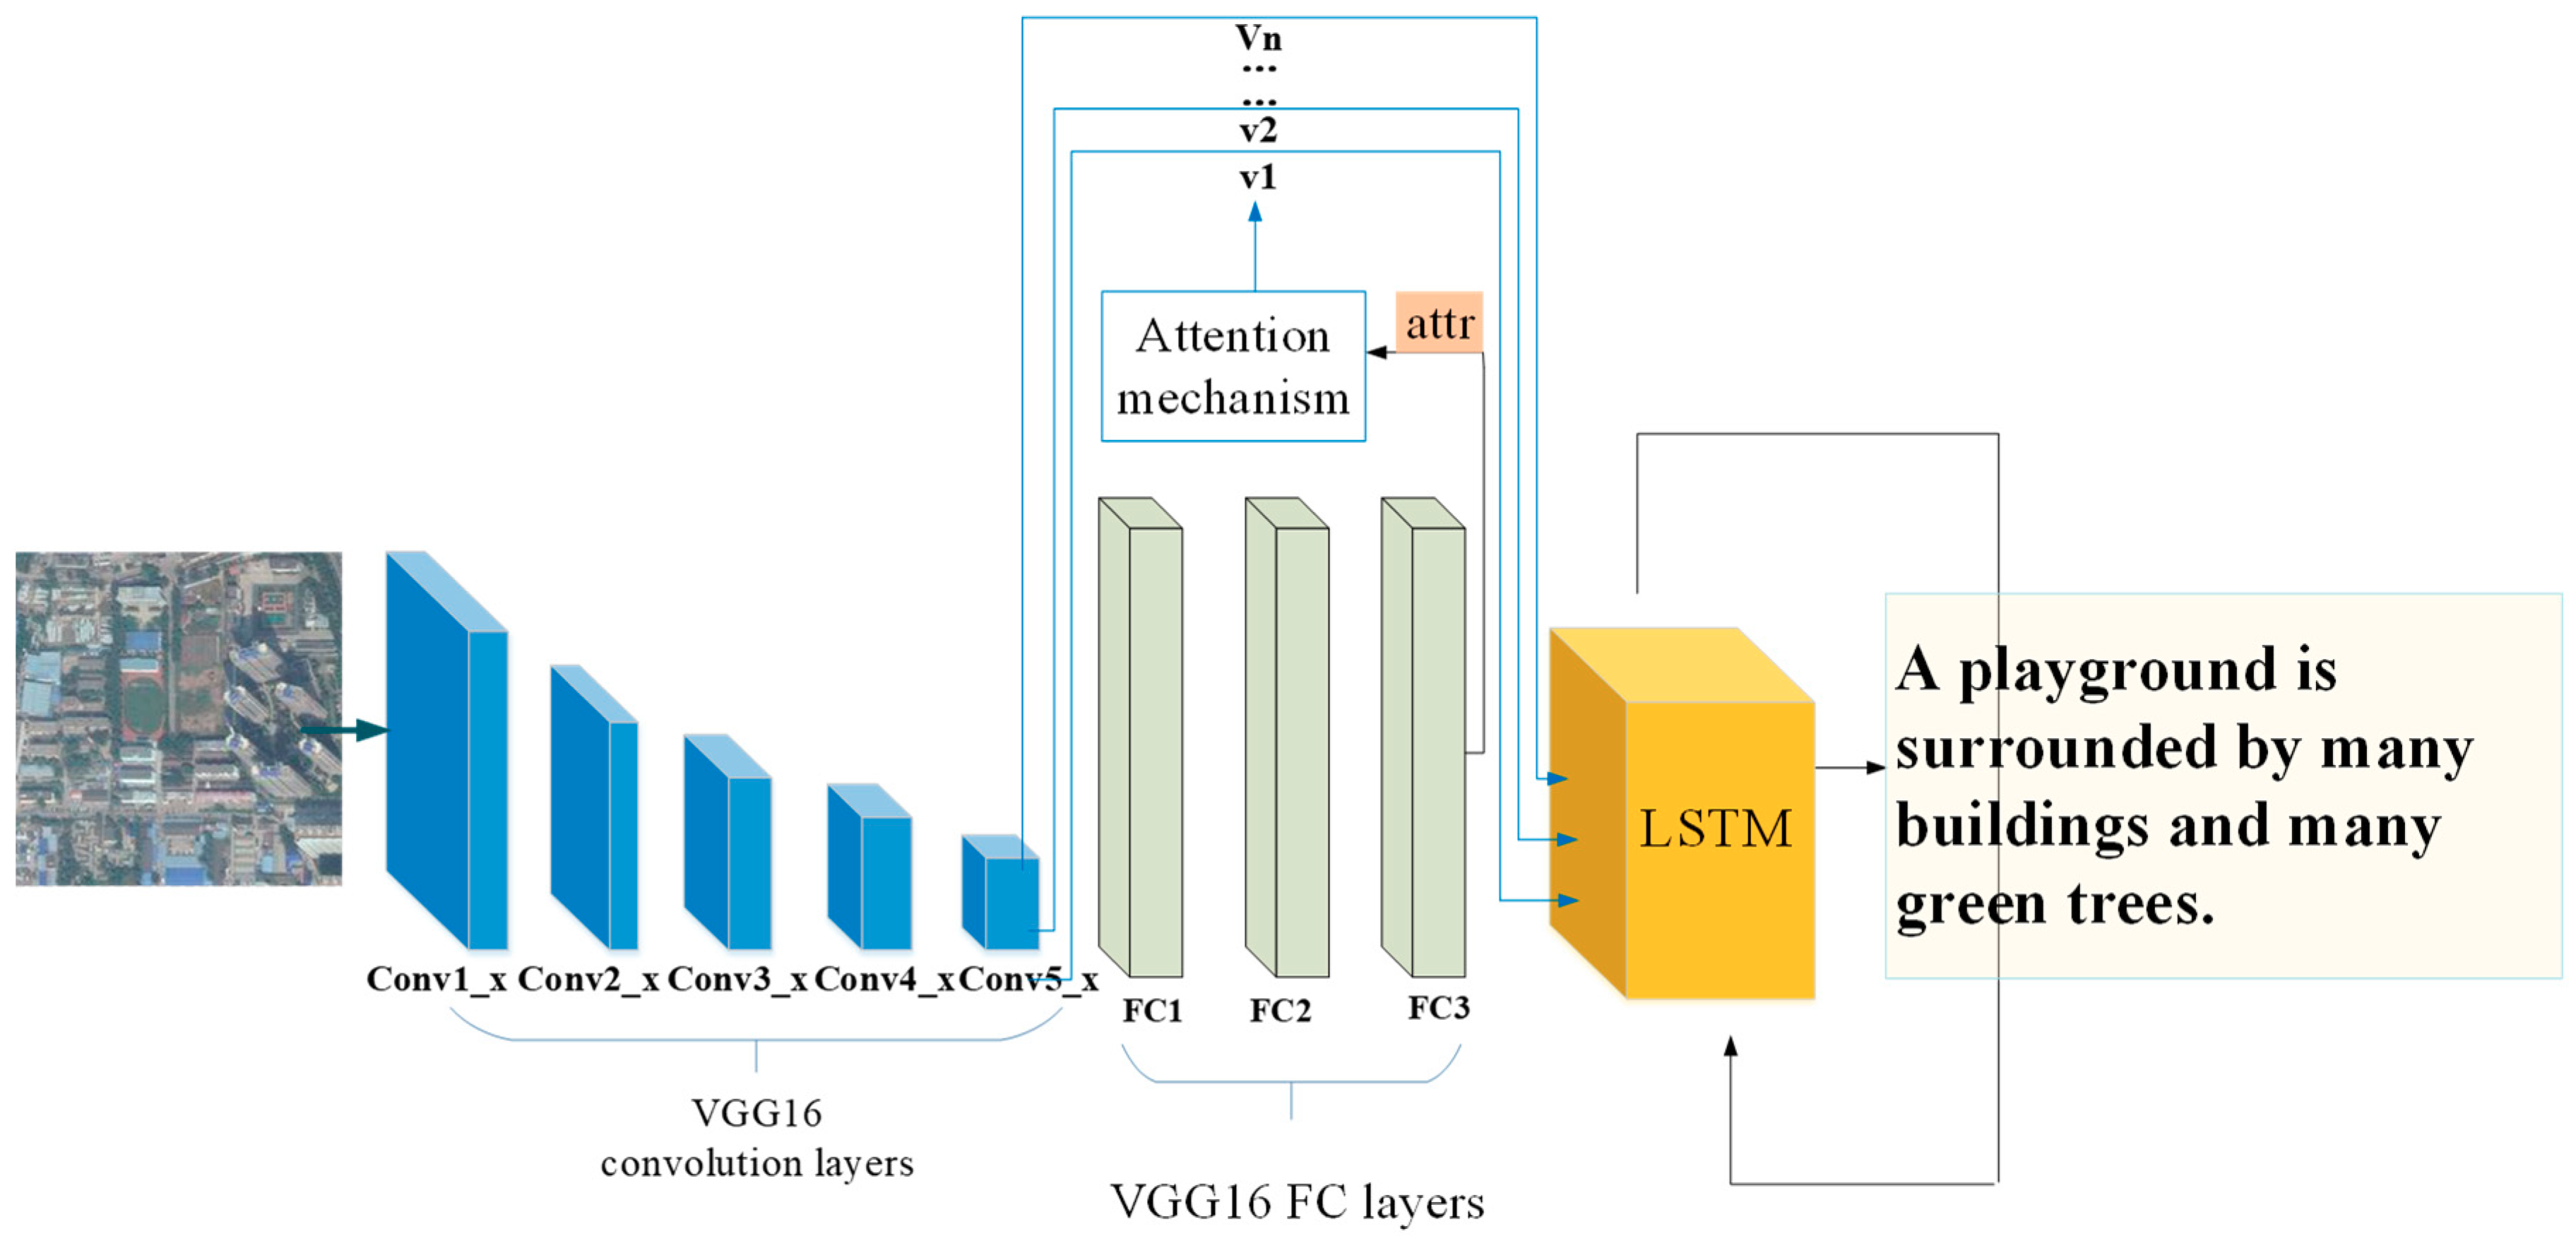
Figure 2.
The structure of our model, and attr can be the output of the last fully connected layer or softmax layer.

Figure 3.
The construction and comparison of the original attention and the proposed attribute attention.
Figure 3.
The construction and comparison of the original attention and the proposed attribute attention.

Figure 4.
Parts of images of UCM Dataset.

Figure 5.
Parts of images of Sydney Dataset.

Figure 6.
(a) Parts of images of RSICD; (b) An image of RSICD and its five captions.

Figure 7.
The structure of multimodal method.

Figure 8.
The structure of attention-based method.

Figure 9.
Some results using our model on RSICD. (a) many buildings and some green trees are in a commercial area. (b) a bridge is on a river with some green trees in two sides of it. (c) some buildings and green trees are around a circle center building. (d) many ripples are in a piece of yellow desert. (e) many green trees are in a piece of forest. (f) many building and green trees are in a medium residential area. (g) a playground is surrounded by many green trees and buildings. (h) many buildings and some green trees are in a commercial area. (i) many buildings are around a circle square.

Figure 10.
Some results using the attention-based method [21] and SM-Att+LSTM. (a) Attention [21]: many cars are parked in a parking lot near several green trees. SM-Att+LSTM: many cars are parked in a parking lot. (b) Attention [21]: yellow beach is near a piece of green ocean. SM-Att+LSTM: yellow beach is near a piece of green ocean with white wave. (c) Attention [21]: some buildings and green trees are around a playground. SM-Att+LSTM: a playground is surrounded by some green trees and buildings.


Table 1.
Results of the baseline and our methods on the Sydney Dataset.
| BLEU-1 | BLEU-2 | BLEU-3 | BLEU-4 | METEOR | ROUGH | CIDEr | |
|---|---|---|---|---|---|---|---|
| CSMLF [38] | 0.5998 | 0.4583 | 0.3869 | 0.3433 | 0.2475 | 0.5018 | 0.7555 |
| Multimodal [19] | 0.6966 | 0.6123 | 0.5431 | 0.5040 | 0.3588 | 0.6347 | 2.2022‘ |
| Attention [21] | 0.7905 | 0.7020 | 0.6232 | 0.5477 | 0.3925 | 0.7206 | 2.2013 |
| FC-Att+LSTM | 0.8076 | 0.7160 | 0.6276 | 0.5544 | 0.4099 | 0.7114 | 2.2033 |
| SM-Att+LSTM | 0.8143 | 0.7351 | 0.6586 | 0.5806 | 0.4111 | 0.7195 | 2.3021 |
Table 2.
Results of the baseline and our methods on the UCM Dataset.
| BLEU-1 | BLEU-2 | BLEU-3 | BLEU-4 | METEOR | ROUGH | CIDEr | |
|---|---|---|---|---|---|---|---|
| CSMLF [38] | 0.4361 | 0.2728 | 0.1855 | 0.1210 | 0.1320 | 0.3927 | 0.2227 |
| Multimodal [19] | 0.7087 | 0.5966 | 0.5521 | 0.4599 | 0.3426 | 0.6612 | 2.9254 |
| Attention [21] | 0.7993 | 0.7355 | 0.6790 | 0.6244 | 0.4174 | 0.7441 | 3.0038 |
| FC-Att+LSTM | 0.8135 | 0.7502 | 0.6849 | 0.6352 | 0.4173 | 0.7504 | 2.9958 |
| SM-Att+LSTM | 0.8154 | 0.7575 | 0.6936 | 0.6458 | 0.4240 | 0.7632 | 3.1864 |
Table 3.
Results of the baseline and our methods on RSICD.
| BLEU-1 | BLEU-2 | BLEU-3 | BLEU-4 | METEOR | ROUGH | CIDEr | |
|---|---|---|---|---|---|---|---|
| CSMLF [38] | 0.5759 | 0.3859 | 0.2832 | 0.2217 | 0.2128 | 0.4455 | 0.5297 |
| Multimodal [19] | 0.6378 | 0.4756 | 0.4004 | 0.3006 | 0.2905 | 0.5333 | 2.2536 |
| Attention [21] | 0.7336 | 0.6129 | 0.5190 | 0.4402 | 0.3549 | 0.6419 | 2.2486 |
| FC-Att+LSTM | 0.7459 | 0.6250 | 0.5338 | 0.4574 | 0.3395 | 0.6333 | 2.3664 |
| SM-Att+LSTM | 0.7571 | 0.6336 | 0.5385 | 0.4612 | 0.3513 | 0.6458 | 2.3563 |
Table 4.
Results with different on RSICD.
| BLEU-1 | BLEU-2 | BLEU-3 | BLEU-4 | METEOR | ROUGH | CIDEr | |
|---|---|---|---|---|---|---|---|
| 256-FC | 0.74467 | 0.62012 | 0.52313 | 0.44390 | 0.34823 | 0.64175 | 2.35417 |
| 256-SM | 0.74189 | 0.62112 | 0.52809 | 0.45019 | 0.33937 | 0.63333 | 2.29751 |
| 512-FC | 0.74592 | 0.62498 | 0.53381 | 0.45740 | 0.33947 | 0.63325 | 2.36639 |
| 512-SM | 0.75711 | 0.63360 | 0.53850 | 0.46118 | 0.35134 | 0.64575 | 2.35632 |
© 2019 by the authors. Licensee MDPI, Basel, Switzerland. This article is an open access article distributed under the terms and conditions of the Creative Commons Attribution (CC BY) license (http://creativecommons.org/licenses/by/4.0/).
Share and Cite
MDPI and ACS Style
Zhang, X.; Wang, X.; Tang, X.; Zhou, H.; Li, C. Description Generation for Remote Sensing Images Using Attribute Attention Mechanism. Remote Sens. 2019, 11, 612. https://0-doi-org.brum.beds.ac.uk/10.3390/rs11060612
AMA Style
Zhang X, Wang X, Tang X, Zhou H, Li C. Description Generation for Remote Sensing Images Using Attribute Attention Mechanism. Remote Sensing. 2019; 11(6):612. https://0-doi-org.brum.beds.ac.uk/10.3390/rs11060612
Chicago/Turabian StyleZhang, Xiangrong, Xin Wang, Xu Tang, Huiyu Zhou, and Chen Li. 2019. "Description Generation for Remote Sensing Images Using Attribute Attention Mechanism" Remote Sensing 11, no. 6: 612. https://0-doi-org.brum.beds.ac.uk/10.3390/rs11060612
Note that from the first issue of 2016, this journal uses article numbers instead of page numbers. See further details here.