Article

Intercomparison of Surface Albedo Retrievals from MISR, MODIS, CGLS Using Tower and Upscaled Tower Measurements

1
Imaging Group, Mullard Space Science Laboratory, University College London, Holmbury St Mary, Dorking, Surrey RH5 6NT, UK
2
Building 801, CSIRO, Black Mountain, Canberra 2601, Australia
*
Author to whom correspondence should be addressed.
Submission received: 3 February 2019 / Revised: 9 March 2019 / Accepted: 11 March 2019 / Published: 16 March 2019
(This article belongs to the Special Issue Remotely Sensed Albedo)

Abstract

:
Surface albedo is of crucial interest in land–climate interaction studies, since it is a key parameter that affects the Earth’s radiation budget. The temporal and spatial variation of surface albedo can be retrieved from conventional satellite observations after a series of processes, including atmospheric correction to surface spectral bi-directional reflectance factor (BRF), bi-directional reflectance distribution function (BRDF) modelling using these BRFs, and, where required, narrow-to-broadband albedo conversions. This processing chain introduces errors that can be accumulated and then affect the accuracy of the retrieved albedo products. In this study, the albedo products derived from the multi-angle imaging spectroradiometer (MISR), moderate resolution imaging spectroradiometer (MODIS) and the Copernicus Global Land Service (CGLS), based on the VEGETATION and now the PROBA-V sensors, are compared with albedometer and upscaled in situ measurements from 19 tower sites from the FLUXNET network, surface radiation budget network (SURFRAD) and Baseline Surface Radiation Network (BSRN) networks. The MISR sensor onboard the Terra satellite has 9 cameras at different view angles, which allows a near-simultaneous retrieval of surface albedo. Using a 16-day retrieval algorithm, the MODIS generates the daily albedo products (MCD43A) at a 500-m resolution. The CGLS albedo products are derived from the VEGETATION and PROBA-V, and updated every 10 days using a weighted 30-day window. We describe a newly developed method to derive the two types of albedo, which are directional hemispherical reflectance (DHR) and bi-hemispherical reflectance (BHR), directly from three tower-measured variables of shortwave radiation: downwelling, upwelling and diffuse shortwave radiation. In the validation process, the MISR, MODIS and CGLS-derived albedos (DHR and BHR) are first compared with tower measured albedos, using pixel-to-point analysis, between 2012 to 2016. The tower measured point albedos are then upscaled to coarse-resolution albedos, based on atmospherically corrected BRFs from high-resolution Earth observation (HR-EO) data, alongside MODIS BRDF climatology from a larger area. Then a pixel-to-pixel comparison is performed between DHR and BHR retrieved from coarse-resolution satellite observations and DHR and BHR upscaled from accurate tower measurements. The experimental results are presented on exploring the parameter space associated with land cover type, heterogeneous vs. homogeneous and instantaneous vs. time composite retrievals of surface albedo.

Graphical Abstract

1. Introduction

Albedo, also known as hemispherical reflectance, is a fundamental radiative parameter for energy partition of incoming solar radiation [1]. Albedo controls the temperature of the Earth’s surface in concert with the effect of greenhouse gases. Around 30% of the total incoming radiation is reflected back into space and this is known as the planetary albedo [2]. Most of this radiation is reflected by clouds, snow and ice. Around 4% of the incoming solar irradiance is reflected by the land and ocean surface, which is some 13% of the total radiation reflected in the shortwave [3].
Systematic measurements of albedo have been acquired since the 1940s [4], although the instruments in use today were invented earlier, in the 1920s. Albedometers use a pair of calibrated pyranometers, one looking skywards and the other groundward. In order for an albedometer to cover a large enough region of the Earth’s land surface, it is usually mounted at the top of a tower, which can vary in height from 10 m up to over a hundred metres. Such towers were extremely rare until the mid 1990s, so most albedo measurements covered only a small patch of ground and, almost invariably, only snow and ice or grass or concrete or tarmac from a height of a few to 10 m. This meant that such albedo measurements could not be employed to study any long-term trends, as the spatial representativeness of such measurements is very limited. Systematic observations from albedometers from the Baseline Surface Radiation Network (BSRN) network [5] started in 1992 from 10-m high towers. Towers are extremely expensive to construct and maintain and the associated electrical power and/or telecommunications infrastructure requirements makes them fairly rare. As part of the National Oceanic and Atmospheric Administration (NOAA) contribution to BSRN, the surface radiation budget network (SURFRAD) [6] tower-based radiation sensor network was founded in 1995, which now includes seven 10-metre towers. BSRN include measurements of total, direct and diffuse downward and upward radiation, mostly in the shortwave region from 300–3000 nm. FLUXNET is a “global network of regional networks” created by scientists across the world to coordinate regional and global observations from micrometeorological tower sites. These flux tower sites use eddy covariance methods to measure the exchanges of carbon dioxide ( CO 2 ), water vapour and energy between terrestrial ecosystems and the atmosphere. FLUXNET include total albedometer measurements, but only a limited number include measurement of the diffuse component. Most FLUXNET sites are located over forests.
Since the earliest days of satellite radiometer observations, methods to retrieve surface albedo from visible and near-infrared (NIR) geostationary images [7] and polar orbiting images have been developed [8]. These early images typically had pixel resolution around 4–5 km and relied on intercomparison with other satellite data products [9], with little, if any, intercomparison using field-measured albedos. The first example of broadband (shortwave) albedo validation using tower albedometer measurements, upscaled by Landsat 30-m inferred albedos, were made in the early 2000s [10]. After this initial work, effort was focused on finding homogeneous sites to directly compare tower albedometer measurements with satellite-derived albedos from 500 m–3 km [11] without the need for upscaling. Historically, there has been a lack of an appropriate upscaling method for comparing multi-scale albedo measurements. In this work, we develop a general framework based on analysing time series of tower albedometers to retrieve bi-directional reflectance distribution function (BRDF) along with bi-hemispherical reflectance (BHR), called in one particular theoretical case “white sky albedo”, with uniform sky irradiance alongside direct hemispherical reflectance (DHR), usually referred to as “black sky albedo” [12]. The materials used in this study include tower measurements derived from the FLUXNET, SURFRAD, and BSRN tower sites, and satellite data products derived by the Copernicus Global Land Service (CGLS) from VEGETATION-2 and Proba-V [13], moderate resolution imaging spectroradiometer (MODIS) [14] and multi-angle imaging spectroradiometer (MISR) [15]. The aim is to develop a new method for comparing ground-level, in situ measurements derived from a tower albedometer against coarse resolution albedos derived from repeat-pass or near-simultaneous multi-angle spaceborne observations. Specific objectives include developing a new method for deriving DHR and BHR from tower albedometer measurements; comparing these derived in situ DHR and BHR tower albedos against CGLS, MODIS and MISR products through a pixel-to-point analysis over a long time-series. A new technique is also developed for upscaling albedo from tower to a coarse resolution based on atmospherically corrected BRFs from high-resolution Earth observation (EO) data, combined with downscaled MODIS BRDF climatology over a larger area. A pixel-to-pixel comparison is presented between DHR and BHR retrieved from CGLS products and DHR and BHR upscaled from in situ measurements using this proposed upscaling technique. The sites are both homogeneous and heterogeneous in land cover and reflectance, and are located on all the continents including Antarctica.

2. Materials and Methods

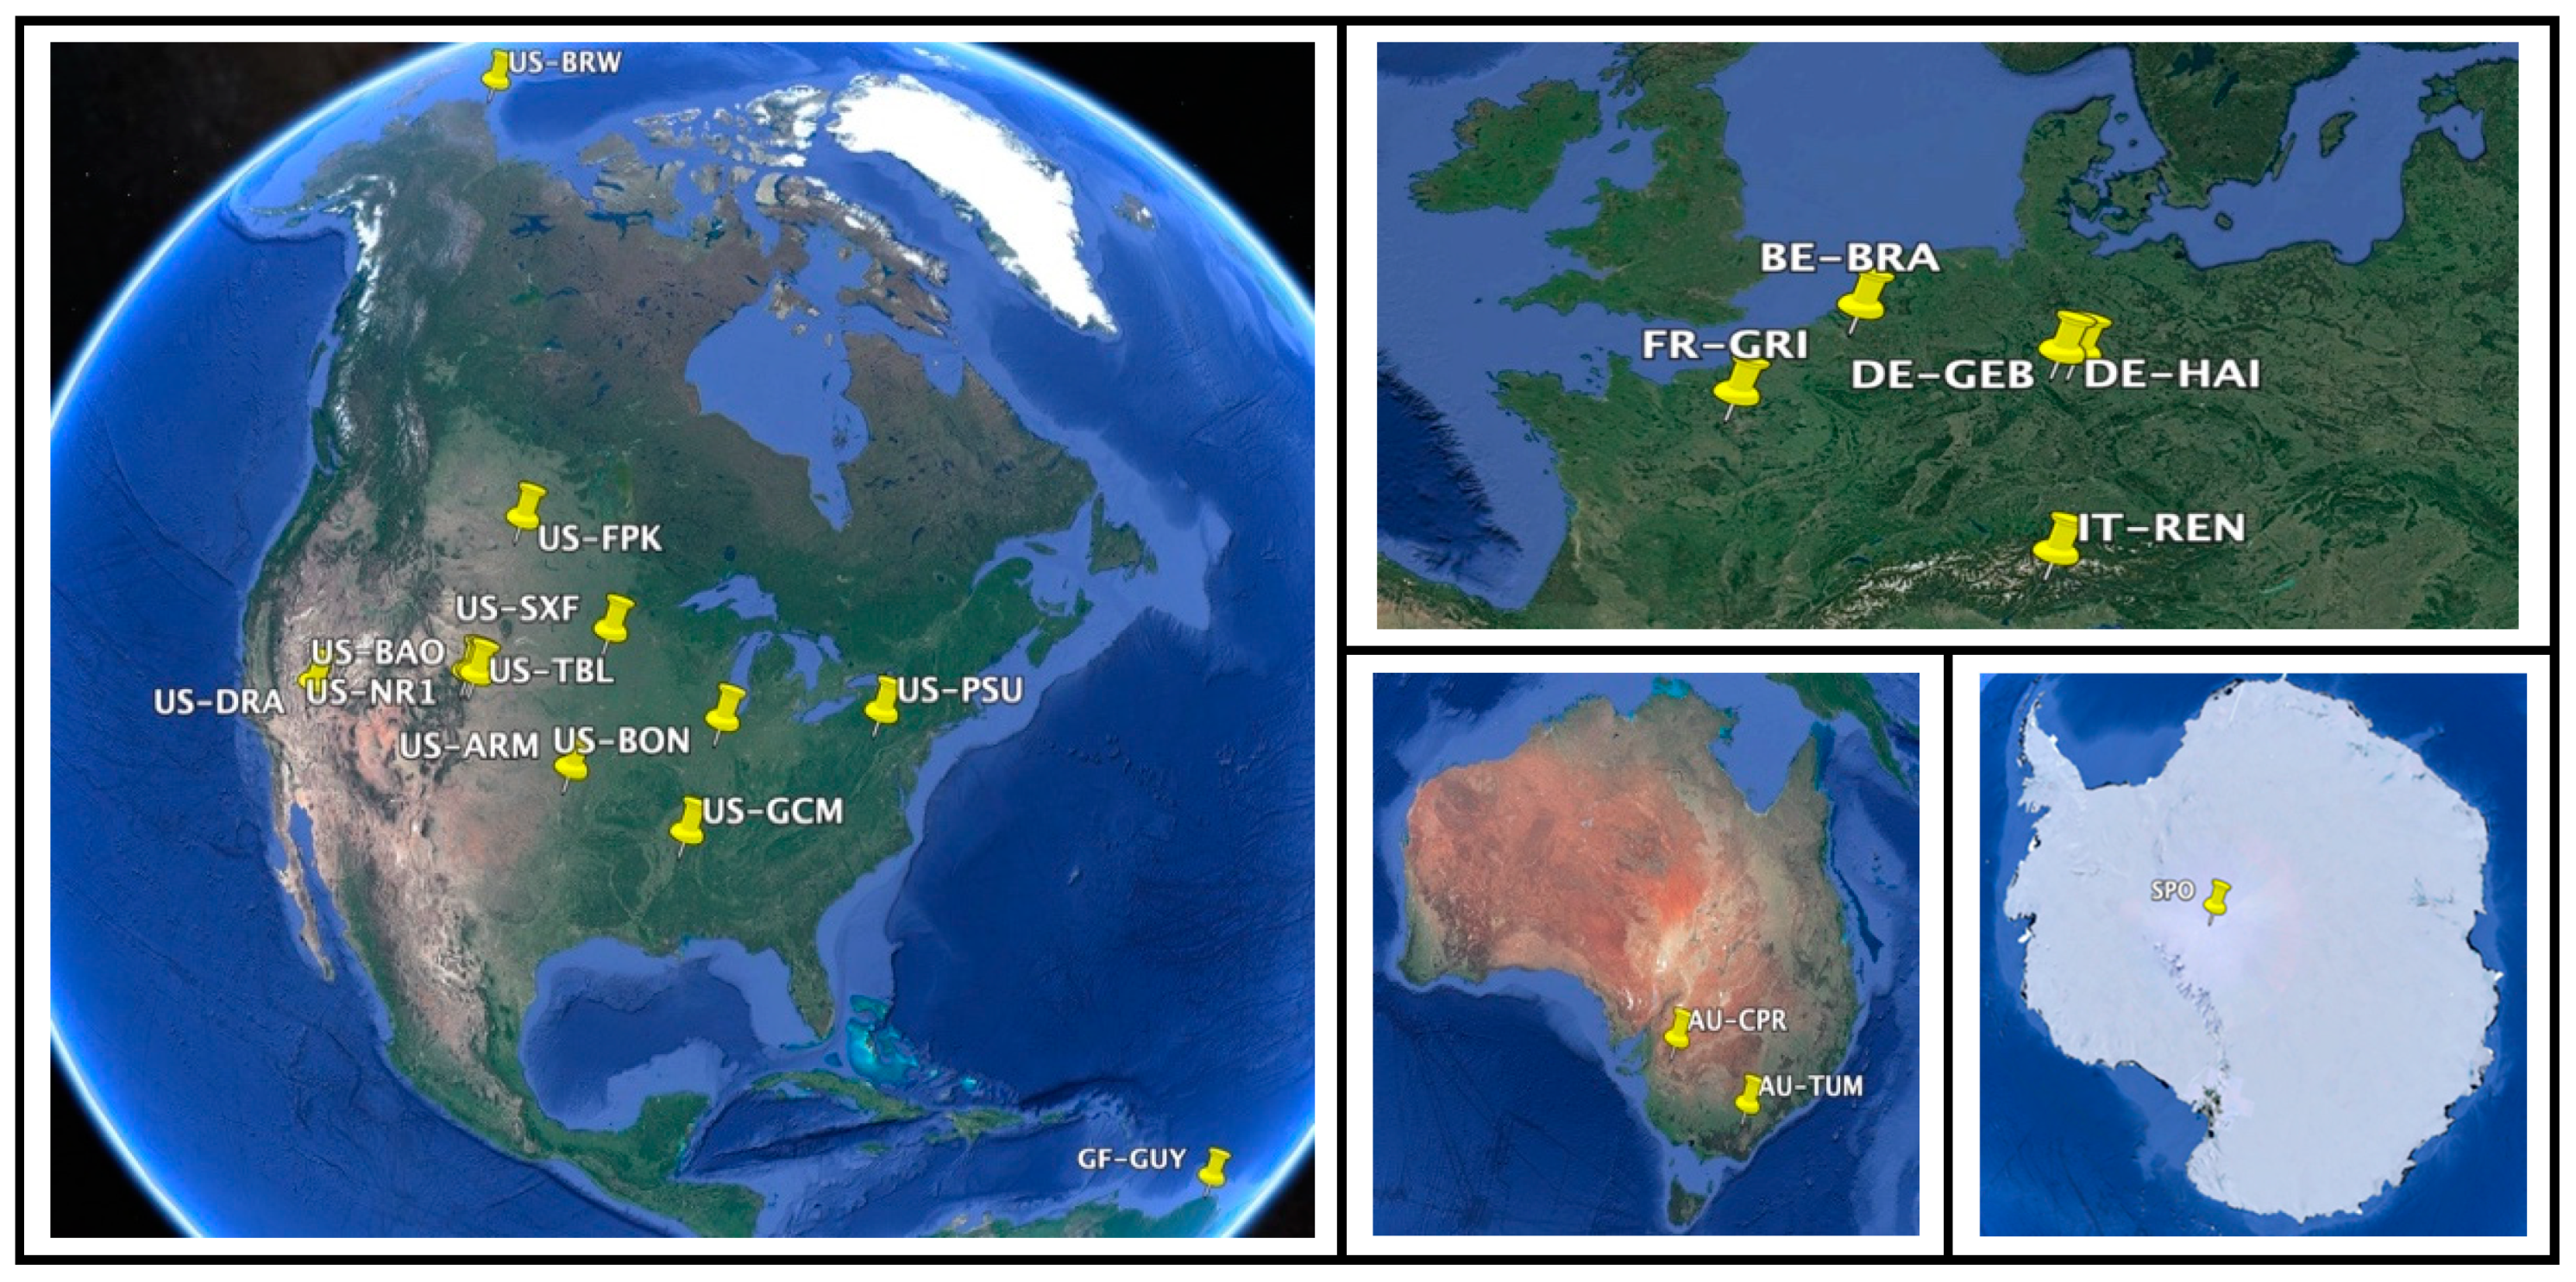
2.1. Ground Measurements

Measurements between year 2012 and 2016 at 20 tower sites from the FLUXNET, SURFRAD and BSRN networks were used in this study. The sites were located over 5 continents as follows: Europe, North America, South America, Australia and Antarctica, as shown in Figure 1. Table 1 lists the key characteristics of the 20 selected sites, including their associated network, geographic coordinates and land cover type. Shortwave radiation is measured by albedometers at these selected tower sites. A broadband (shortwave) albedometer essentially consists of two pyranometers, which measure the total downward and upwelling radiation. Diffuse radiation is measured by an independent shaded pyranometer using a sun tracker to shield the sensor from direct sunlight [16]. Data from the SURFRAD and BSRN sites were taken between year 2012 and 2016 at 1-min resolution, and data from FLUXNET sites were taken between 10-min and 1-h resolution, depending on the site location. We select for presentation one station from each network including two from the USA and one from Australia representing, tundra with snow/ice, grasslands and evergreen broadleaf respectively.

2.2. Satellite Albedo

2.2.1. MODIS BRDF/Albedo Products

Based on the three-parameter RossThick–LiSparse–Reciprocal (RTLSR) model, the MODIS bi-directional reflectance distribution function and albedo (BRDF/albedo) products (MCD43A) provide a collection of 500-m, daily resolution data [14]. Clear-sky and atmospherically-corrected surface reflectances from Terra satellite and Aqua satellite, within a 16-day window, were used to retrieve the BRDF parameters. MCD43A1 provides the 3 BRDF parameters (isotropic, volumetric and geometric) for each of the MODIS bands 1–7, and the visible, near infrared and shortwave bands. The related quality assurance (QA) data are stored in MCD43A2. Based on the retrieved weighting parameters (isotropic, volumetric, and geometric), MCD43A3 derives both DHR (black sky albedo) and BHR (white sky albedo) 500-m data for the corresponding bands. In this study, the 500-m shortwave DHR and BHR from 2012 to 2016, covering the 19 tower sites (except for the SPO), were directly extracted from the MCD43A3 products. For the sites (e.g., the US-BRW and AU-CPR) where there were missing values in the MCD43A3, the DHR and BHR were calculated from the MCD43A1 BRDF parameters. A cross-check was performed to ensure consistency between the two.

2.2.2. Copernicus Global Land Service

The European Union CGLS operates a “a multi-purpose service component” that produces a series of qualified bio-geophysical products on the status and evolution of the land surface at global scale (https://land.copernicus.eu/global/). The land surface parameters produced from the CGLS include the leaf area index (LAI), the fraction of absorbed photosynthetically active radiation (FAPAR) absorbed by the vegetation, the surface albedo, the land surface temperature, the soil moisture, etc. The CGLS albedo products are solely derived from the VEGETATION instrument up until 2014, and since then from the PROBA-V sensors. They are updated every 10 days using a 30-day window. The DHR and BHR are projected onto a regular latitude/longitude grid with a resolution of 1/112° (approx. 1 km at the equator) covering the area from 180°E to 180°W and from 75°N to 60°S. In this study, 1-km CGLS shortwave DHR and BHR products from 2012 to 2016 covering the 19 tower sites were used (no CGLS data over the SPO).

2.2.3. MISR

The multi-angle imaging spectroradiometer (MISR) [17] sensor onboard NASA’s Earth Observing System (EOS) Terra satellite provides high accuracy surface albedo products from near simultaneous multi-angular views. The MISR level 2 land/surface albedo products provide land DHR and BHR over four narrow bands: blue (446 ± 21 nm), green (558 ± 15 nm), red (672 ± 11 nm) and near infrared (866 ± 20 nm), at a resolution of 1.1 km. Liang’s model [18] is used here to retrieve the total shortwave broadband albedo by linearly combining the spectral albedos as follows:
α M I S R = 0.126 · α 2 + 0.343 · α 3 + 0.415 · α 4 + 0.0037
where α 2 , α 3 and α 4 represent MISR spectral albedos for band 2, 3 and 4, α M I S R is the total broadband shortwave albedo. In this study, MISR pixels near each of the tower sites were extracted between 2012 and 2016. It should be noted that, the BHR products from MISR are different to MODIS and CGLS, because they represent the actual blue-sky albedo rather than an idealised white-sky.

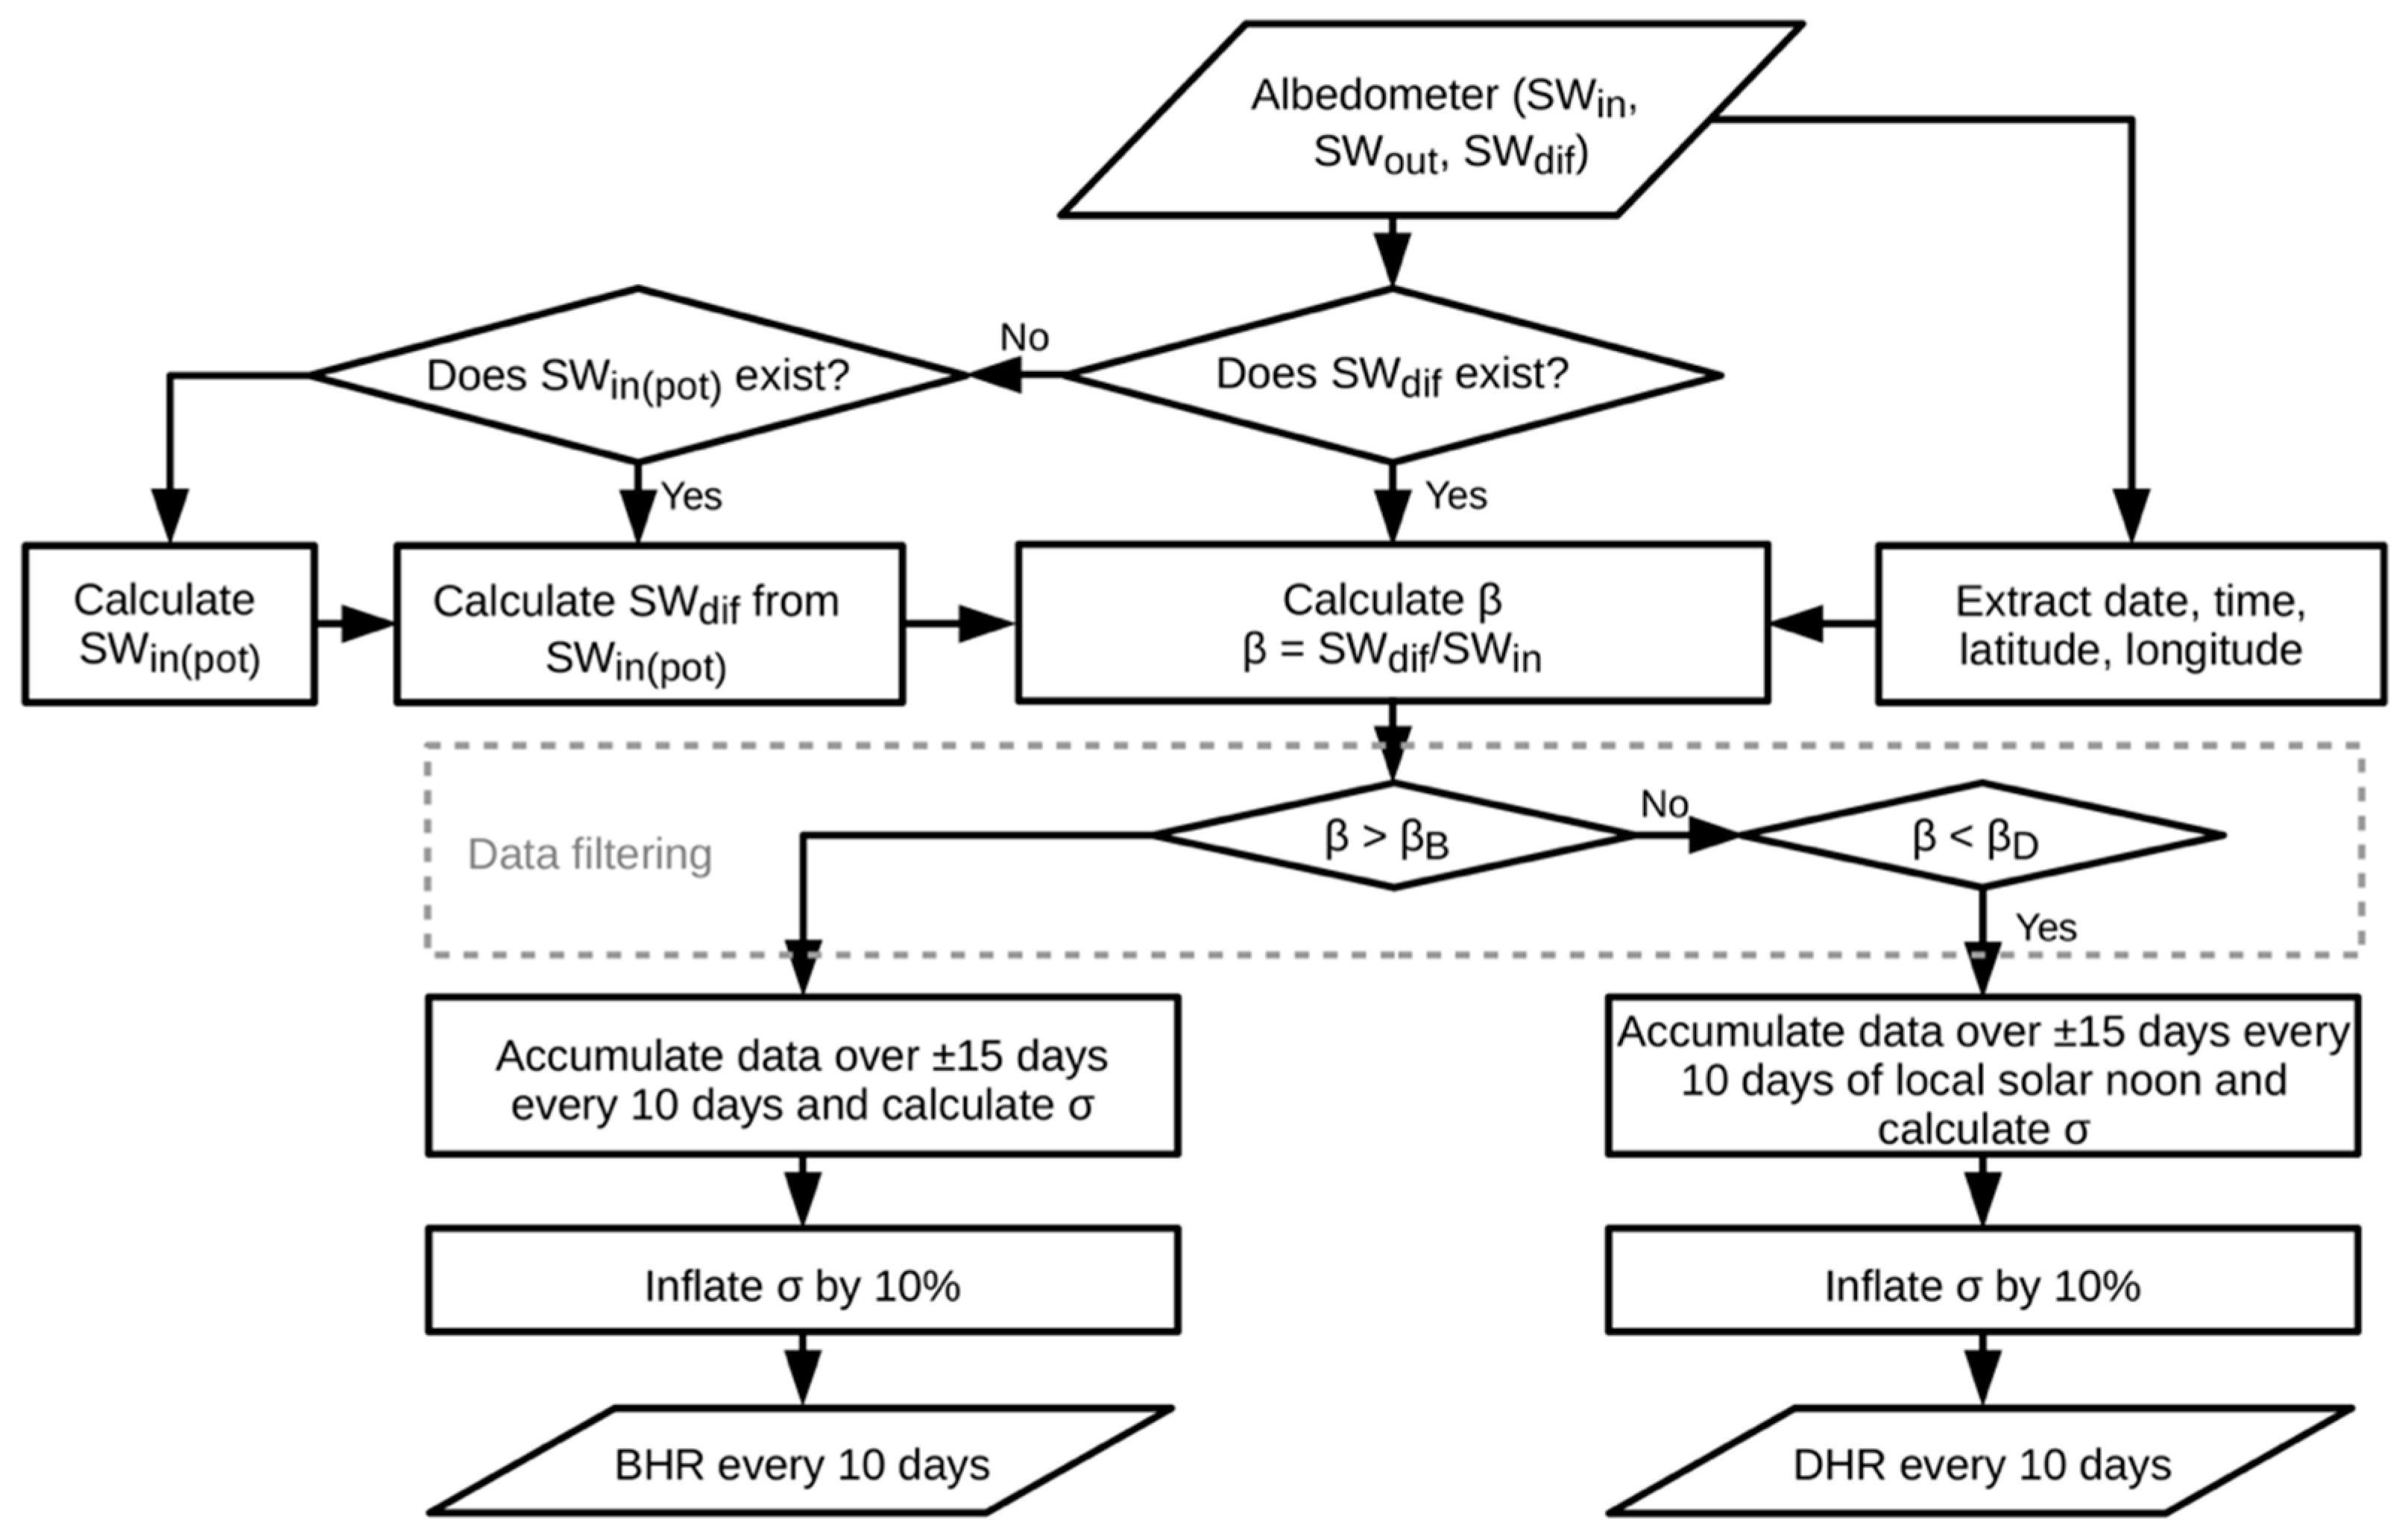
2.3. Surface Albedo from Tower Measurements

DHR and BHR [19] are calculated from the ratios of the measured upwelling and downwelling solar radiant fluxes, but they are based on different assumptions about how the atmospheric scattering processes can affect the intensity of downwelling diffuse radiation. If the atmospheric scattering effects are removed, then the illumination can be assumed to originate from a single infinitesimally small point source. In this case, the measured ratio between the upwelling and downwelling radiations becomes the DHR. If the atmospheric scattering effects are included, then the illumination is assumed to be uniform from all angles and this is known as the “white sky”. This results in the BHR being calculated from the measured ratio between the upwelling and downwelling radiation. Both DHR and BHR represent extreme cases that rarely exist in the physical “real world”. In all previous works of satellite-derived albedo validation using in situ measurements, a compromised value between DHR and BHR has been used for an indirect comparison [20,21]. This compromised value is intended to represent the in situ albedo, which is called the blue-sky (or clear sky) albedo and can be computed as follows:
B l u e S k y A l b e d o = β · BHR + ( 1 β ) · DHR
where β denotes the proportion of diffuse component in downwelling solar radiation. Normally, β is measured at ground-tower sites by a separate pyranometer, which is independent from the pyranometers that measure the total downwelling and upwelling radiations. This independent pyranometer is mounted with a sun tracker that shields the sensor from direct sunlight. If the ground-based pyranometer that measures diffuse radiation is not available, a satellite aerosol product (e.g., MOD04/MYD04 of MODIS or the aerosol optical depth (AOD) retrieved as part of the GlobAlbedo (http://www.globalbedo.org/) product [22]) can be used to estimate β, but this is with high temporal and spatial uncertainties.
Blue-sky albedo can be estimated by combining the DHR and BHR data from satellite measurements and the β value from tower measurements. In this way, the estimated albedo value at local solar noon can be used directly for comparison with the ground-based albedo. However, there are two major critical issues in this inter-comparison: (1) β is measured at local solar noon and, often, under cloud-free conditions. The blue-sky albedo in this case is dominated by the DHR because the β value is close to zero under cloud-free conditions. (2) DHR and BHR cannot be assessed separately from the blue-sky albedo using this method. To overcome these issues, a new strategy is proposed in which albedo is derived into the DHR and BHR components separately, solely from in situ tower data. A conceptual flowchart of this processing chain is illustrated in Figure 2, and details are introduced in Section 2.3.1 and Section 2.3.2.

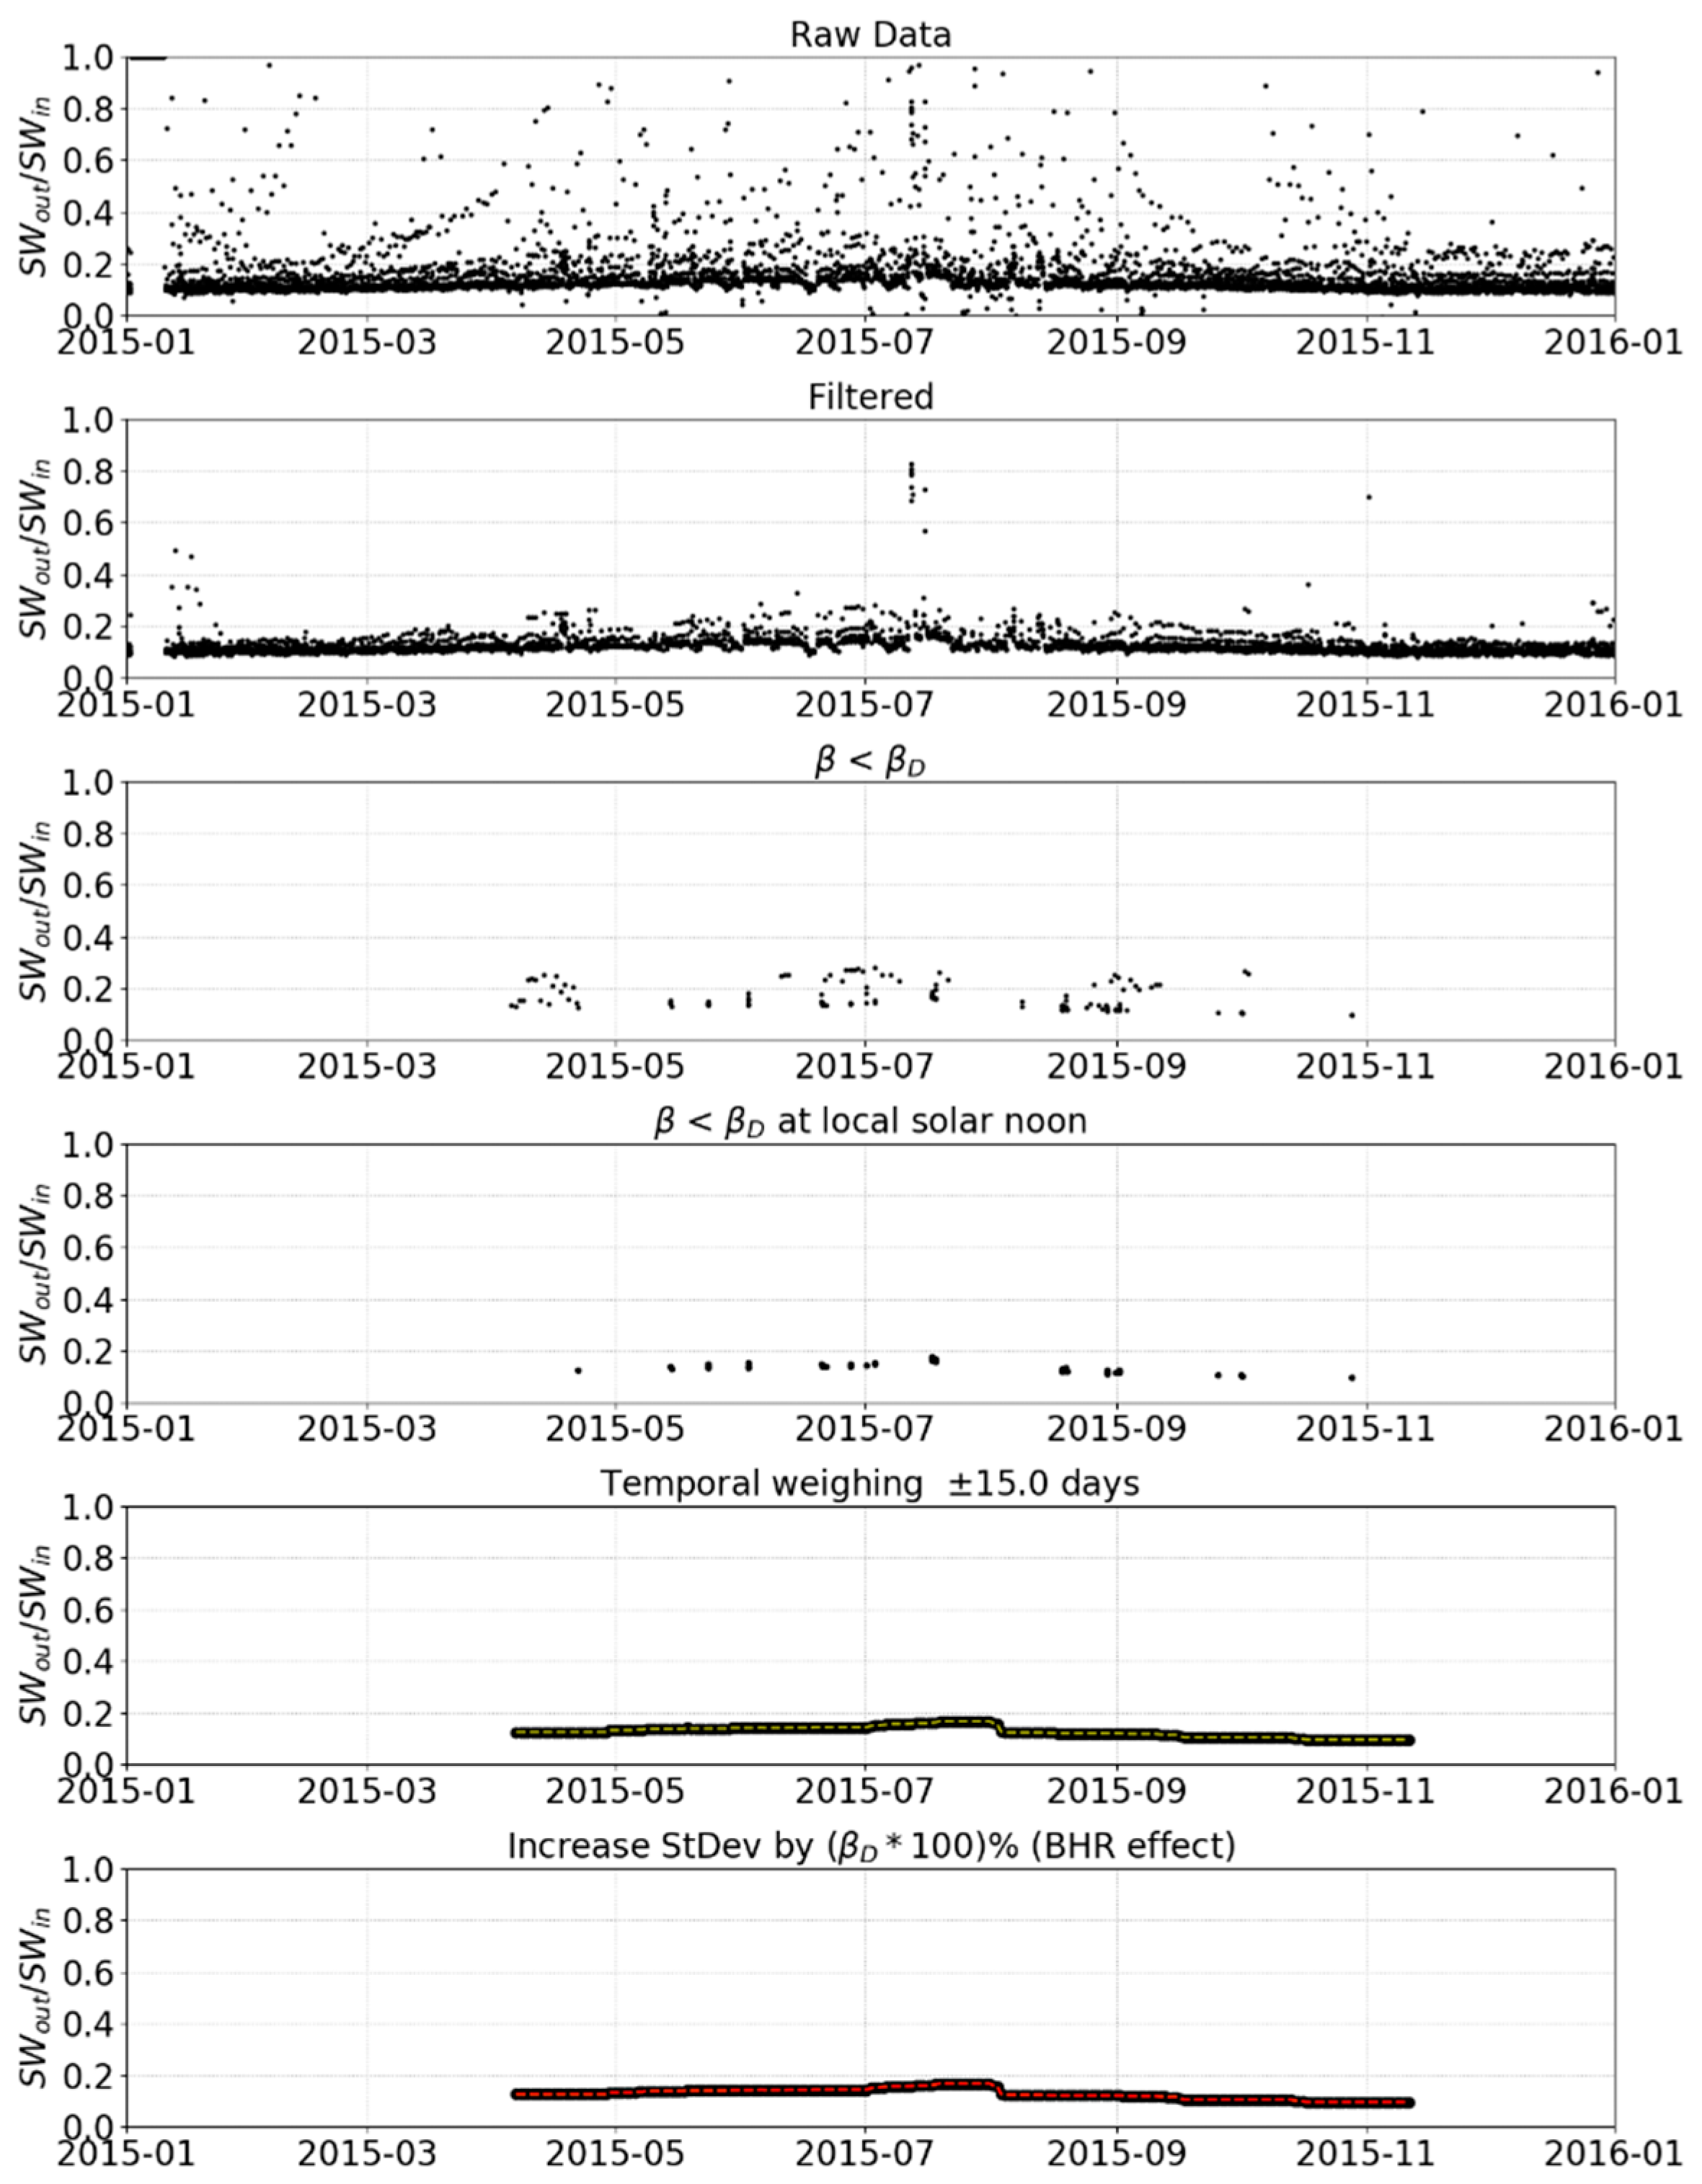
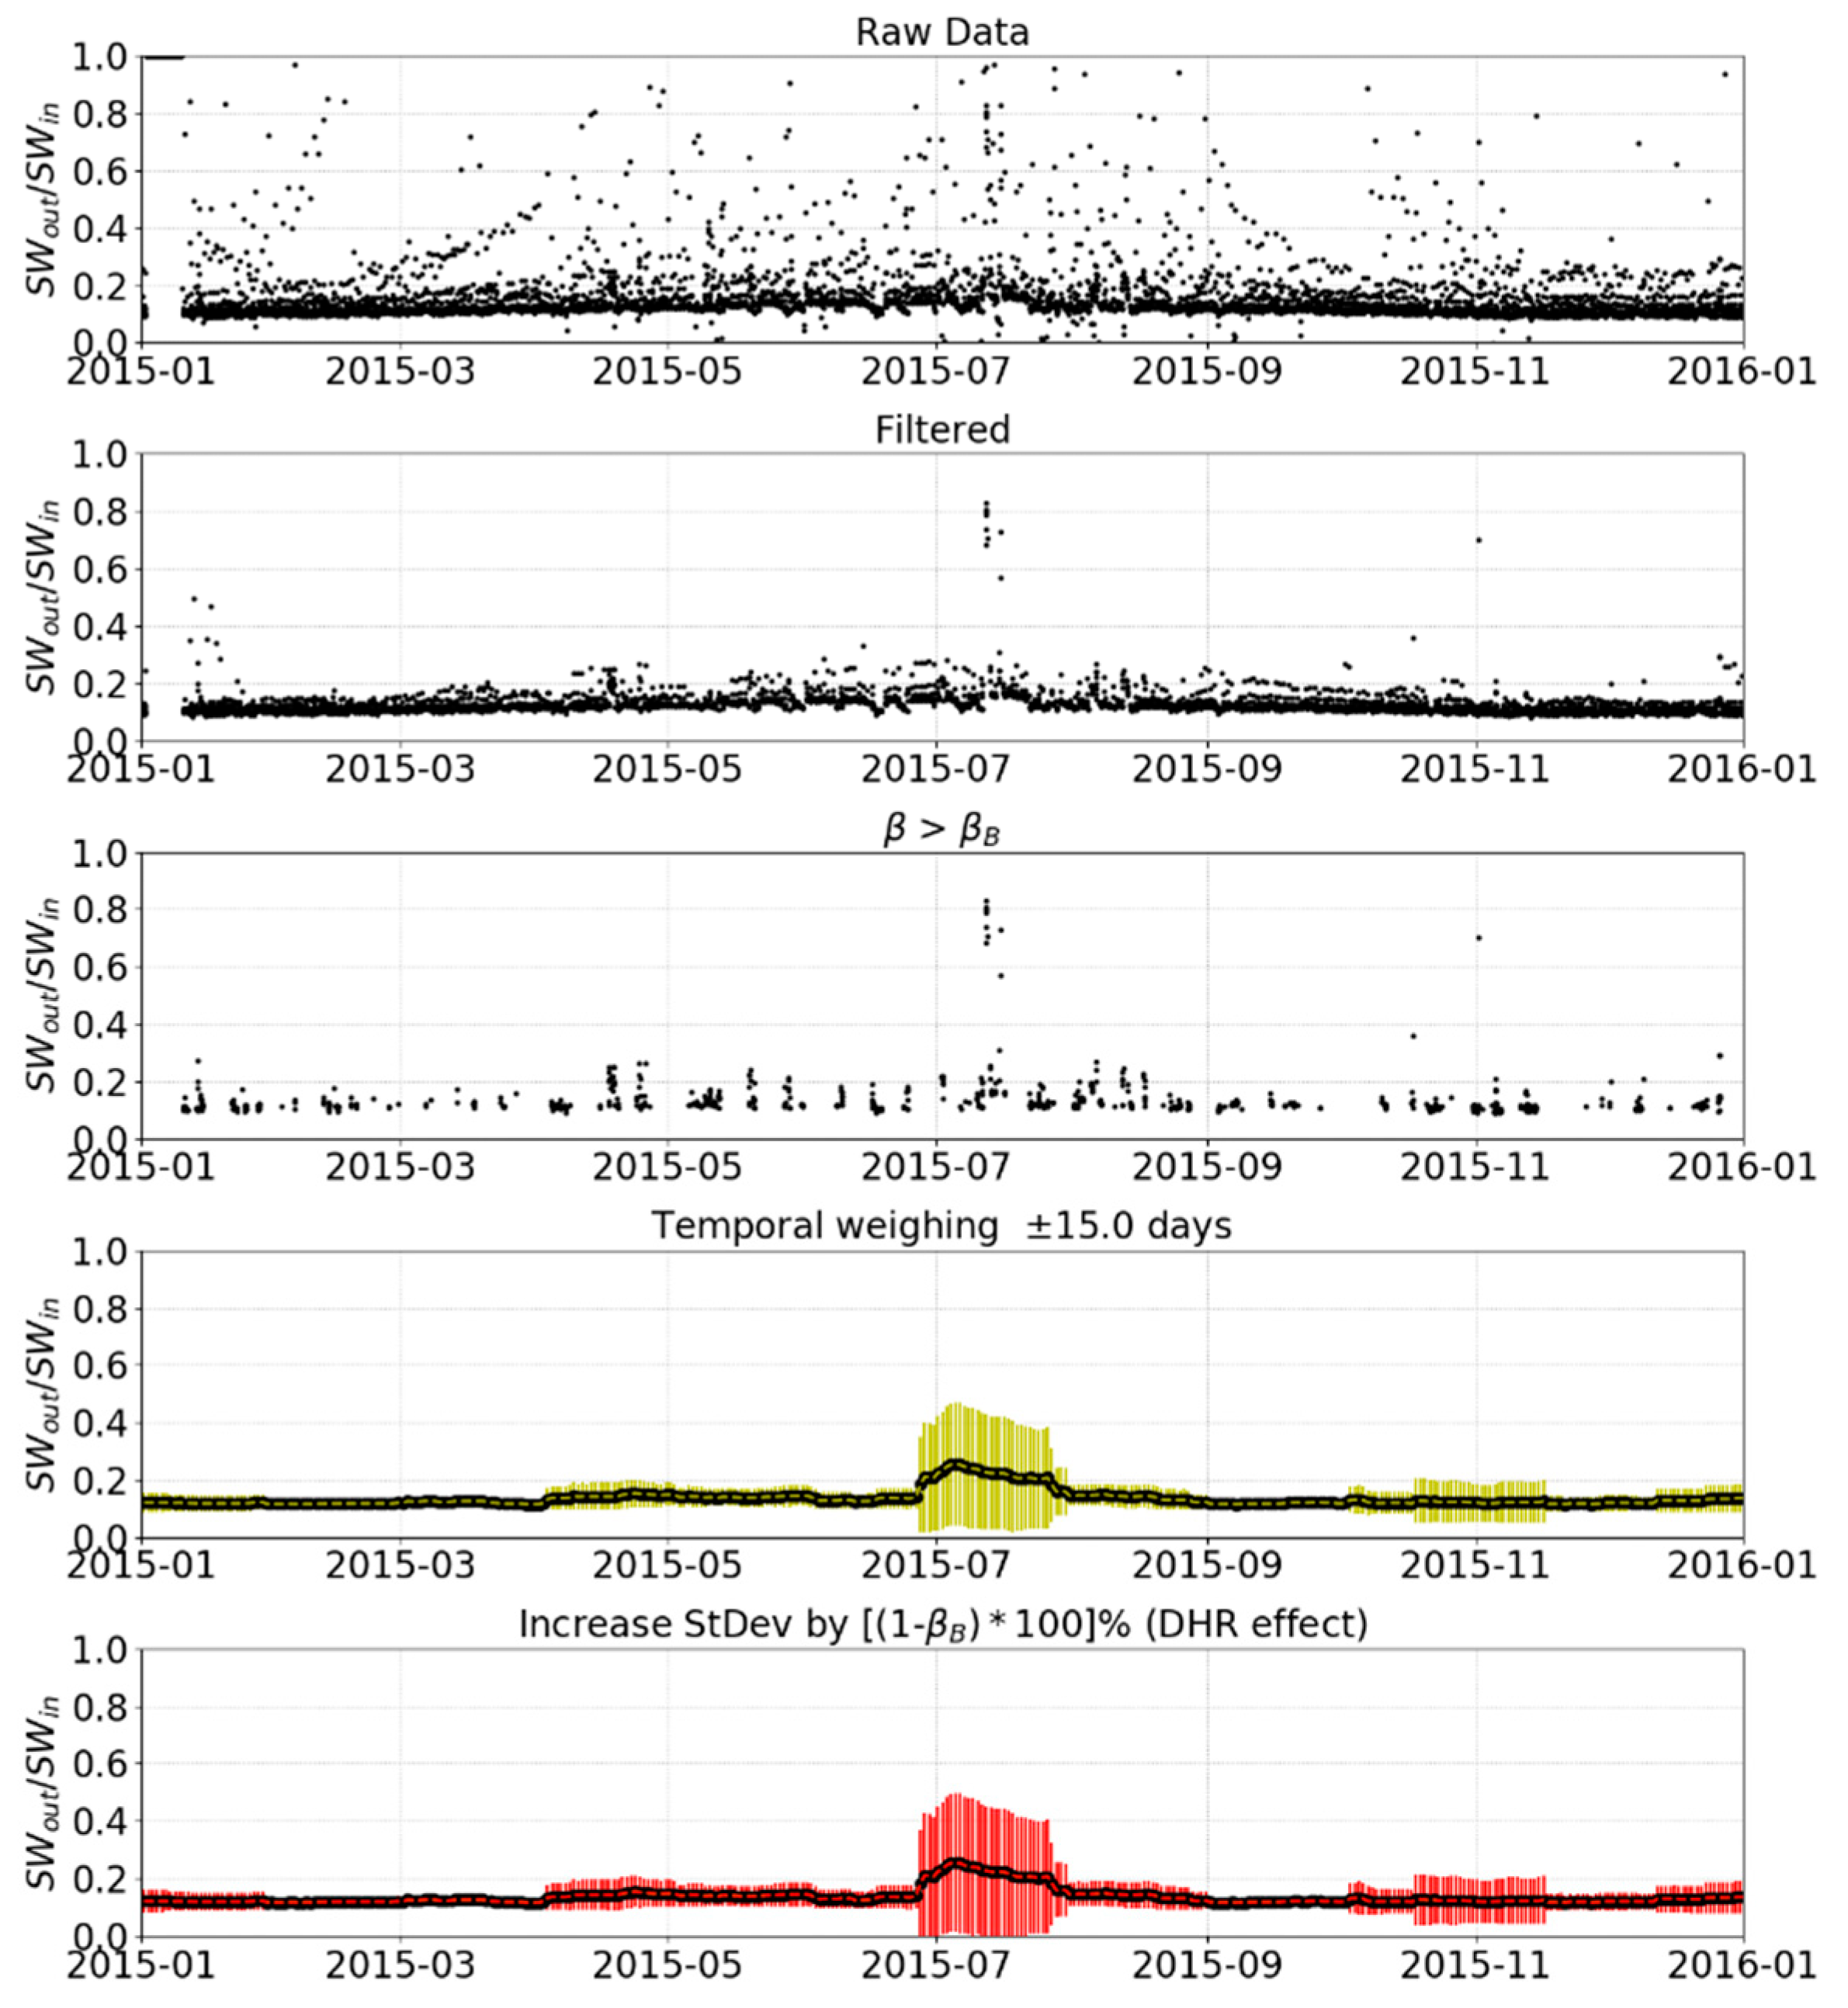
2.3.1. Directional Hemispherical Reflectance (DHR)

In Figure 2, the S W i n , S W o u t and S W d i f represent the downwelling total, upwelling total, and downwelling diffuse shortwave radiation measured from the tower sites, respectively. The downwelling diffuse radiation was measured at all of the selected SUFRAD and BSRN tower sites, but was unavailable at three FLUXNET tower sites (i.e., the Calperum, Guyaflux and Niwot Ridge sites). To deal with this challenge, we calculated β from the potential top of atmosphere radiance S W i n ( p o t ) using Equation (3). The parameter S W i n ( p o t ) is provided in the FLUXNET dataset, or, if not, can be estimated based on the geographic location of the tower and the sun-tower geometry [23]. Experimental results demonstrated that diffuse ratios estimated from Equation (3) had a good agreement with real measurements when β was very low or very high.
β = ( S W i n ( p o t ) S W i n ) / S W i n ( p o t )
According to Equation (2), the DHR can be well approximated by the blue-sky albedo when β tends towards zero. Such low values of β can be reached under completely cloudless conditions with a very low level of aerosol at local solar noon. From empirical heuristic studies we verified that a threshold of β D = 0.1 was suitable for screening out undesired tower measurements, because data that meet the condition of β β D within ±1 h local solar noon, for all sites, can be considered sufficient to perform the validation of DHR derived from satellite measurements. A threshold of β D lower than 0.1 can reduce the amount of remaining data dramatically, because β does not often reach such a low level within the specified ±1 h at local solar noon, due to broken cloud cover.
Once the ±1 h local solar noon data are screened by the condition β β D , the mean and standard deviation (σ) over a sliding time-window of 30 days can be calculated. In this example the time-window for averaging the tower data was set as 30 days for CGLS, so that the in situ DHR and BHR could be compared with these CGLS products. However, a narrower time-window can also be adopted if enough data can be collected for estimating DHRs using this strategy. This method can cause a bias in the derived DHR values because the effect of BHR in the blue-sky albedo is ignored. However, the effect of BHR in the blue-sky albedo will not exceed the predefined threshold of β D . Therefore, in order to estimate the uncertainty of the DHRs, the σ of the final in situ DHRs is dilated by β D , so as to represent the effect of BHR on DHR. Figure 3 shows an example of ground-based albedo ( S W o u t / S W i n ) at different stages of in situ DHR creation from the data of FLUXNET Tumbarumba site in 2015. The main steps of producing in situ DHRs can be summarised as follows: (1) Calculating S W o u t / S W i n for all the data points; (2) filtering data with negative upwelling or downwelling radiation values; (3) filtering data with solar zenith angle larger than 75°, because the linear BRDF model does not work for these zenith angles; (4) retaining data that meet the condition β β D ; (5) retaining data within ±1 h of local solar noon; (6) applying a weighting function over the time window of 30 days; and (7) including the estimation of uncertainty values.

2.3.2. Bi-Directional Hemispherical Reflectance (BHR)

In contrast, the in situ BHR can be approximated by the blue-sky albedo when β tends towards 1. This high diffusion ratio can only be reached under certain conditions, such as under thick unbroken stratus clouds, which are often formed before sunrise and after sundown. Under this assumption, a lower threshold of β B = 0.9 was used to filter undesirable measurements from the raw data. Once the data are filtered by this condition ( β β B ), the BHR was calculated from the S W o u t / S W i n from the remaining data. Similarly, the mean and the standard deviation over a sliding time-window, which is 30 days in this example, were calculated. The effect of DHR on in situ BHR should be taken into account when assuming the BHR, and can be approximated by the blue-sky albedo. From trial-and-error, the σ of the final in situ BHR need to be increased by 1 β B to represent its uncertainty. Figure 4 shows an example of ground-based albedos at different stages of in situ BHR creation from the data of FLUXNET Tumbarumba site in 2015. The processing and filtering steps were the same as specified above for DHR.

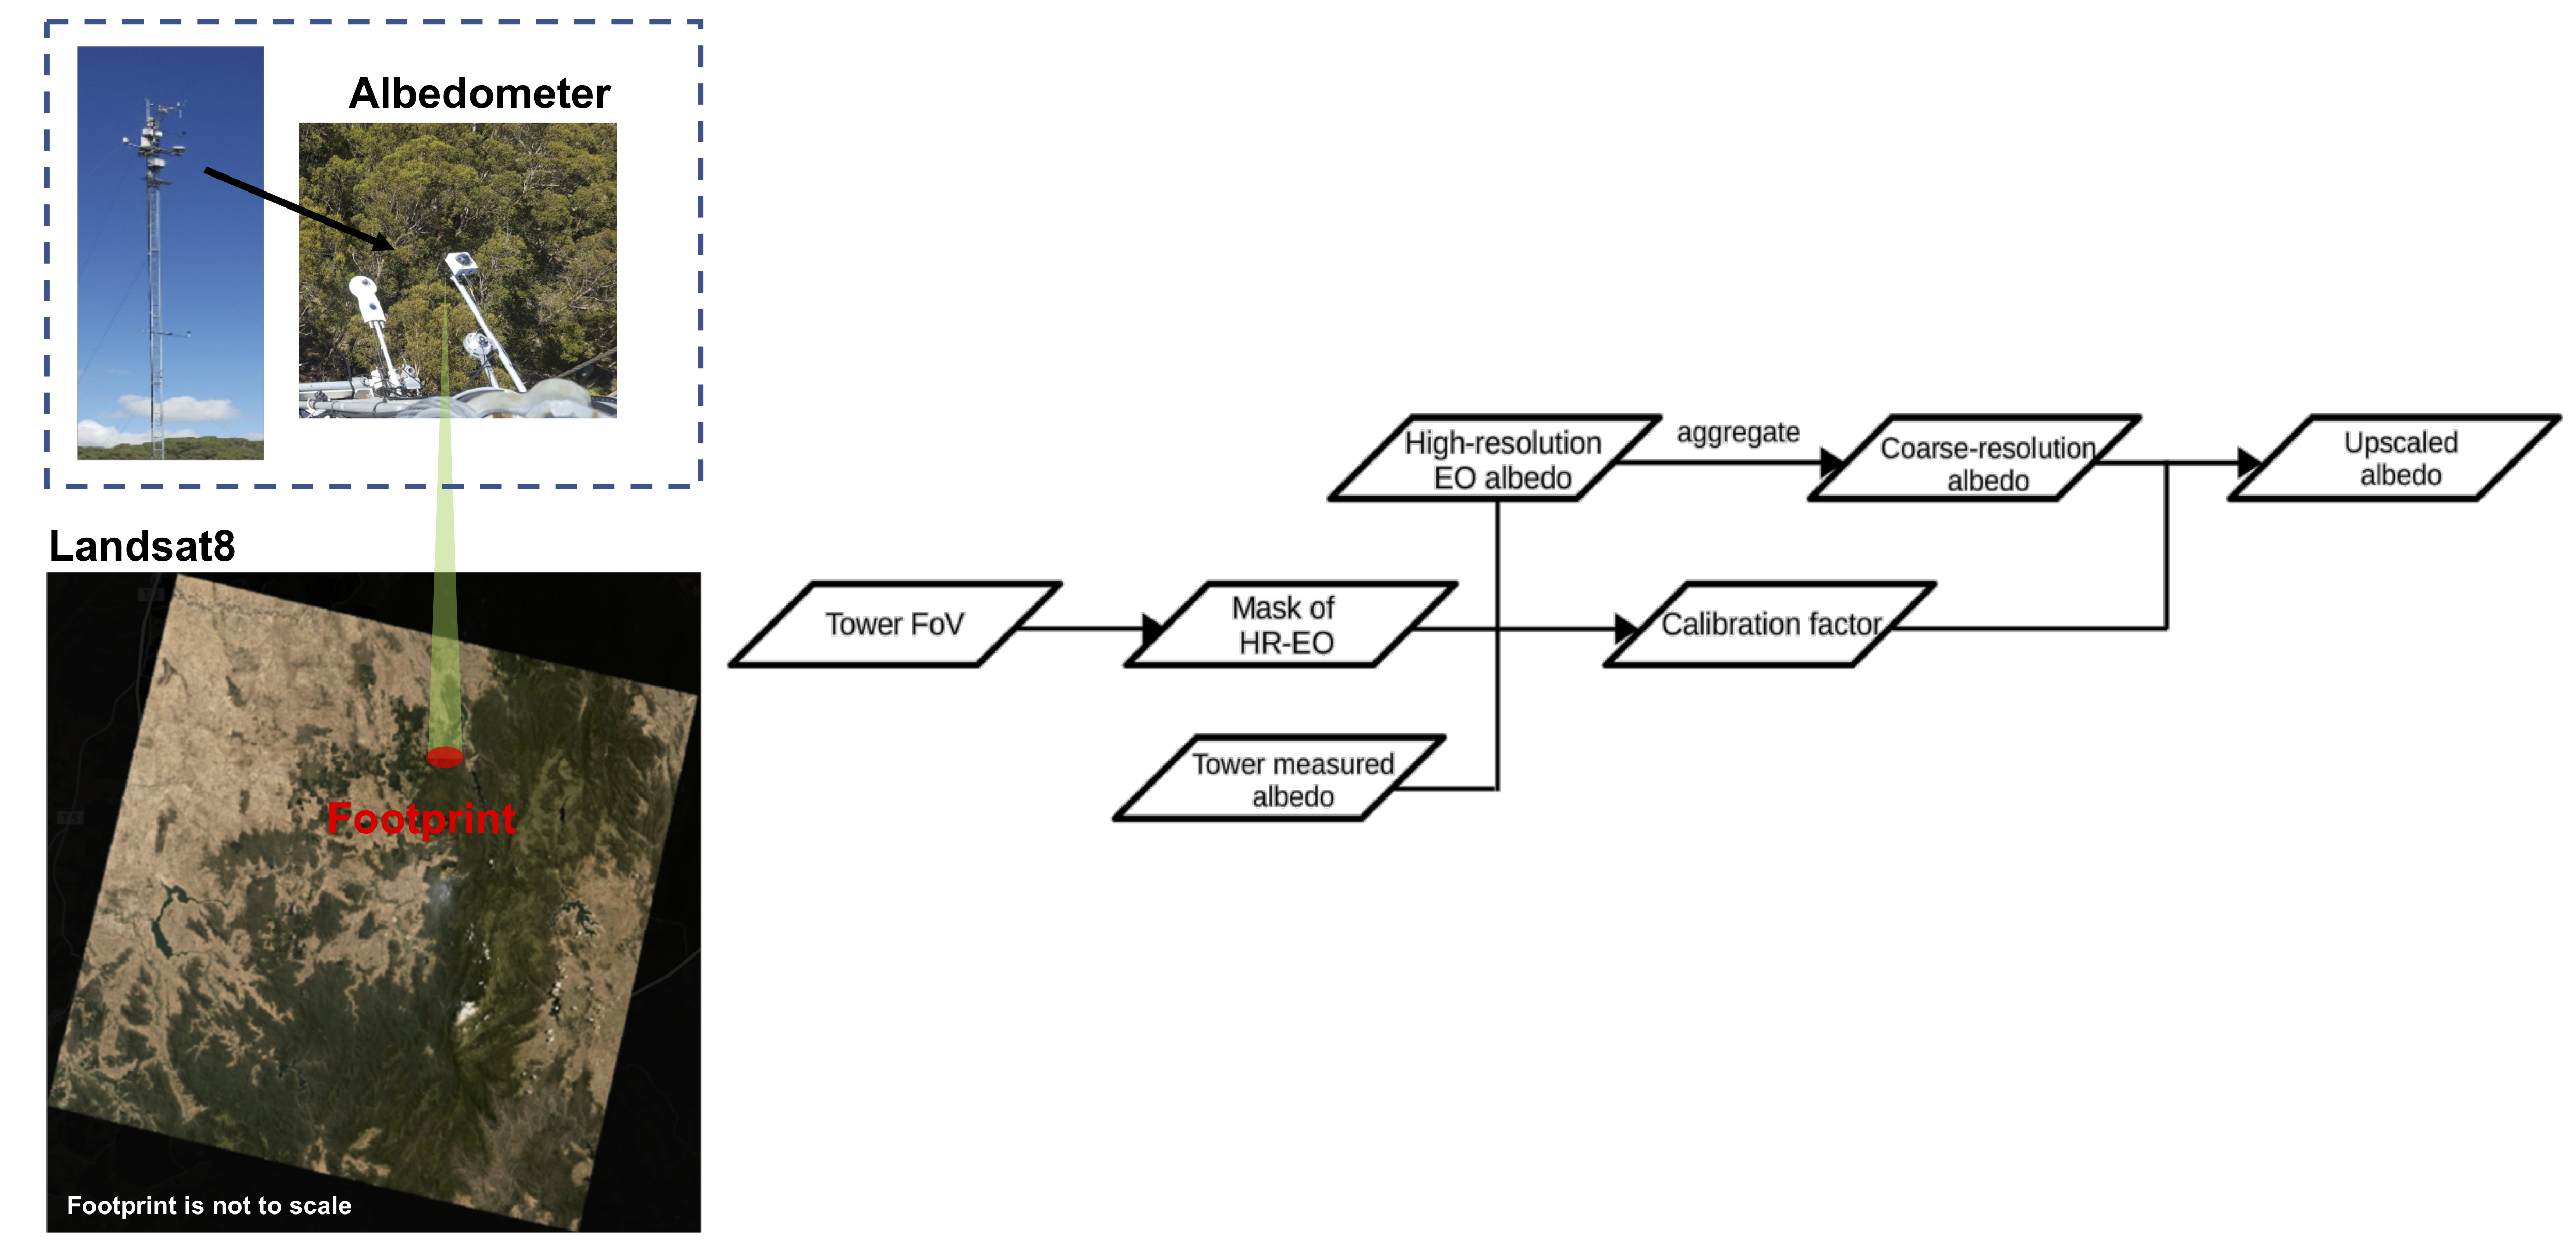
2.4. Albedo Upscaling

According to Liang [10], unless the surface area is large and sufficiently homogeneous or a sufficient number of measurements is obtained during the period of satellite overpass, “point” measurements are not feasible to validate coarse-scale albedo products through a direct comparison. The in situ-based measurements are considered to be spatially representatively at homogenous land surfaces, and; therefore, can be directly used [11]. However, the in situ measurements and coarse-scale albedo are generally at an unmatched scale over heterogeneous land surfaces [24]. In order to validate satellite-derived coarse resolution albedo products from in situ measurements, upscaling from ground “point” data to the coarse resolutions is essential. This upscaling process consists of two steps. First, a “calibration factor” needs to be calculated based on the “point” measurements and the high-resolution EO pixels within the projected field-of-view (FoV) of the tower albedometer. Second, the high-resolution albedo products need to be upscaled to coarse-resolution using the pre-calculated “calibration factor”.
High-resolution (<100 m) albedo products are not currently available from EO satellites. However, they can be derived using the methods described in [25], and in [26] for the Chinese HuanJing (HJ) satellite sensor. Their method used early machine learning (neural networks) based on numerous radiative transfer simulations. In this study, atmospherically corrected bi-directional reflectance factors (BRFs), from high-resolution EO, alongside coarse-resolution albedos, predicted from a MODIS BRDF climatology over a larger area, were employed as inputs. Firstly, pure endmembers for the corresponding area of the reference albedometer measurements were extracted based on the high-resolution spectral reflectance data. This was followed by aggregating the derived high-resolution spectral BRFs to coarse resolutions. In the next step, a linear regression was established between the endmember abundance and MODIS BRDF-derived albedo-to-nadir-reflectance ratios. This linear regression was established based on the data at coarse resolutions, but could be used to assign each high-resolution pixel around the tower with a corresponding albedo value. This was based on the assumption that over a larger area, coarse-resolution BRDFs can be represented by high-resolution mosaics of pixel BRDFs, weighted by their coverage proportions. Then, the high-resolution spectral reflectance values were converted to shortwave reflectance values through the use of narrowband to broadband conversion coefficients. In the end, a “calibration factor” was obtained by calculating the ratio of shortwave albedo derived from the albedometer and that from the high-resolution EO. This factor could then be applied to upscale the shortwave albedo from high resolutions to coarser resolution.

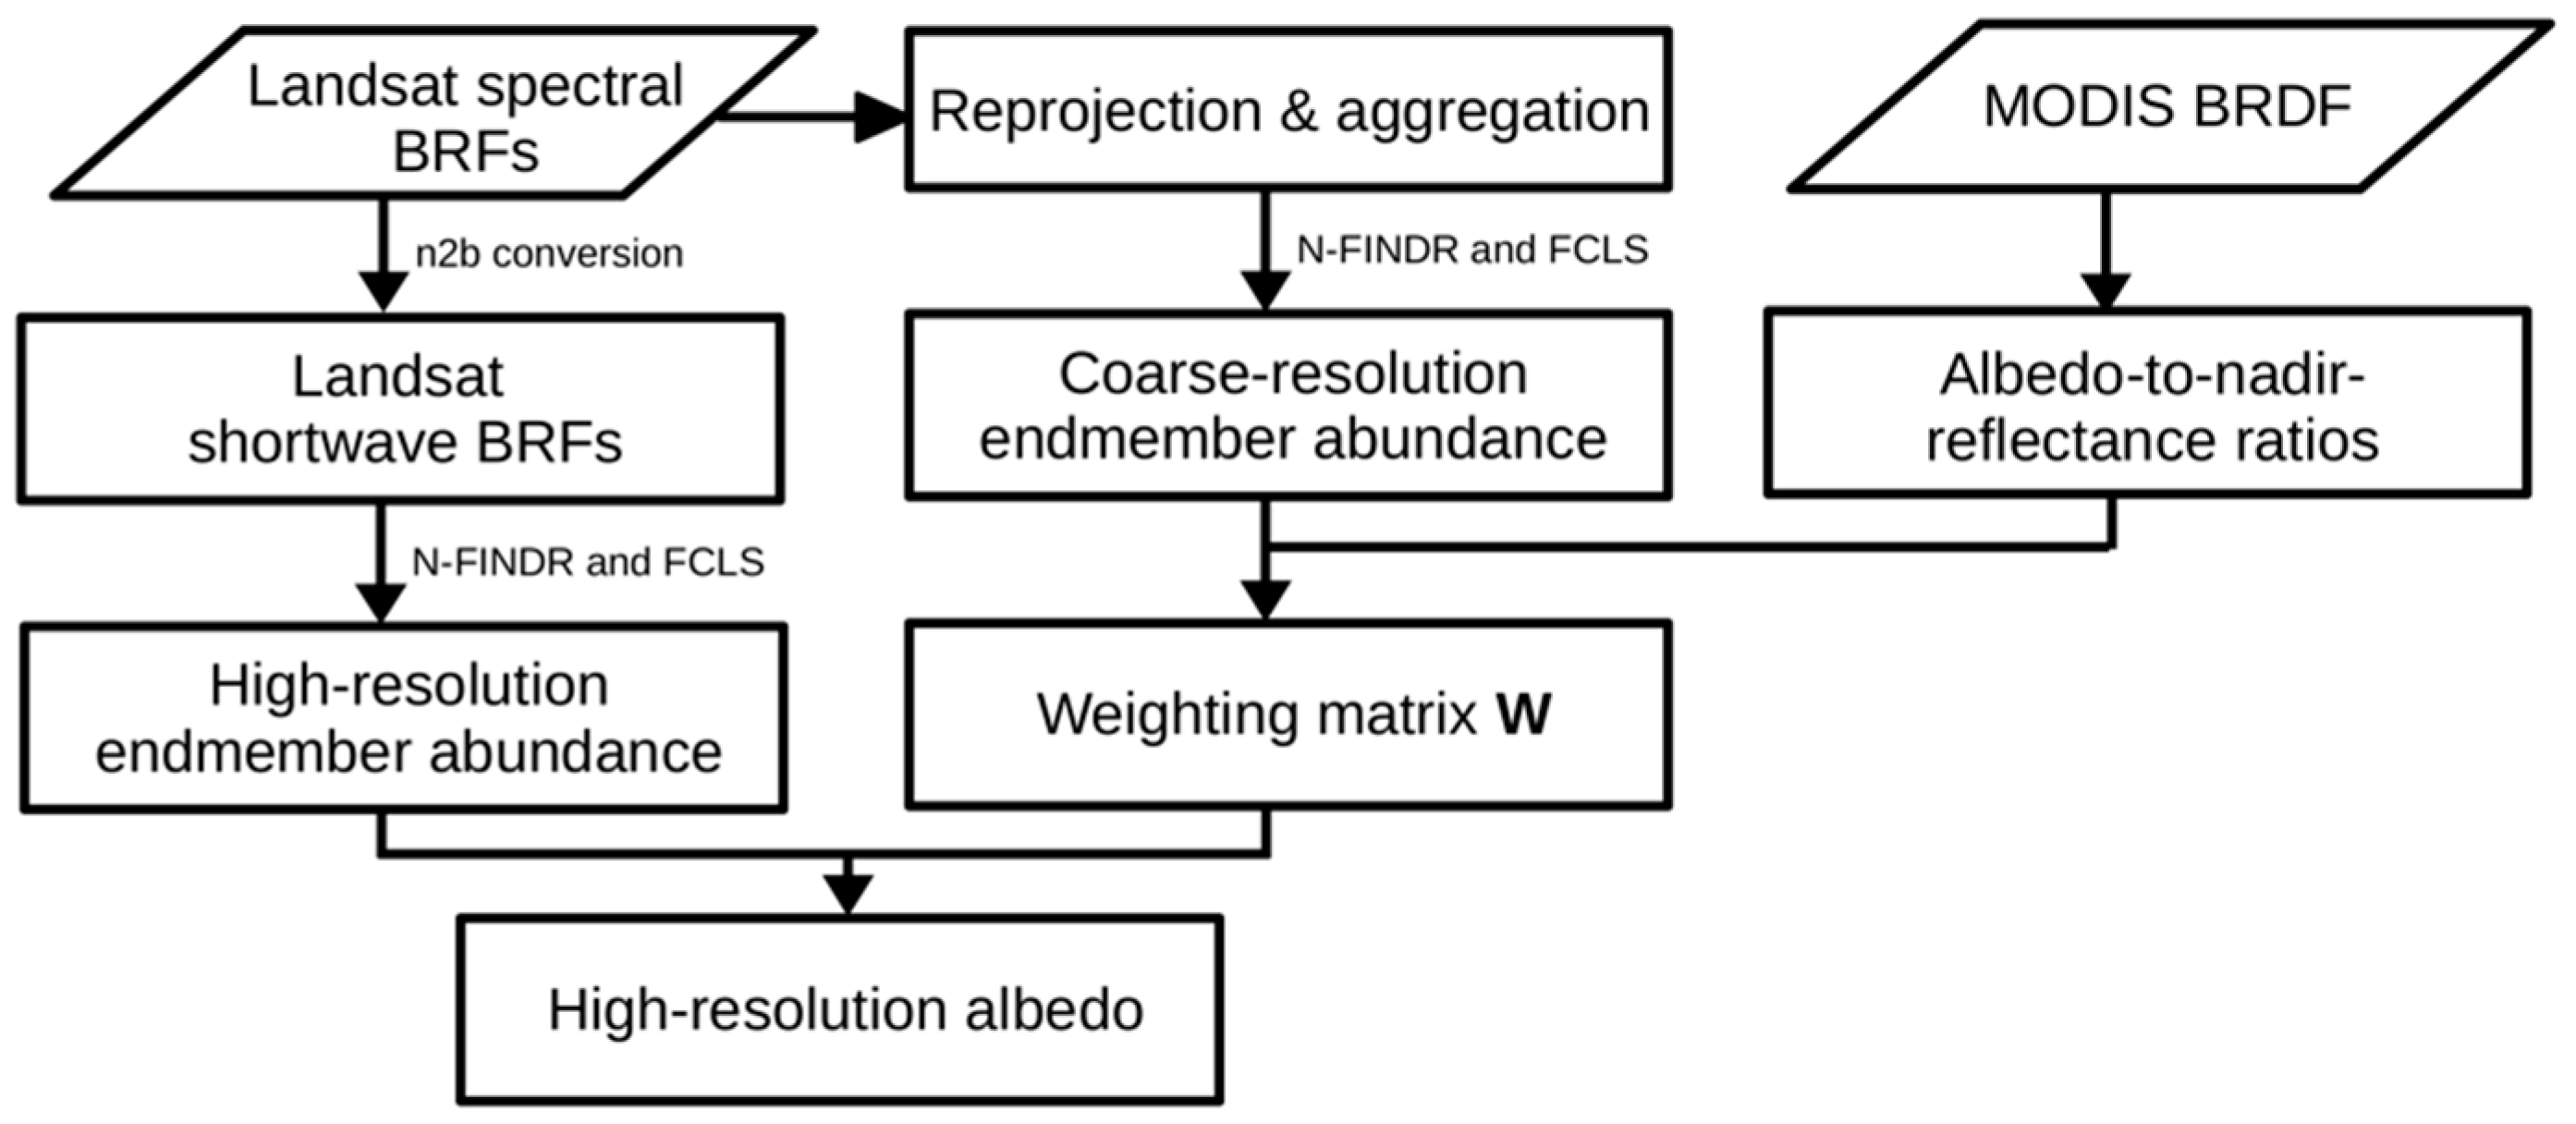
2.4.1. Retrieval of High-Resolution Shortwave Albedos

We modified the method proposed by Shuai et al. [27] and used it to retrieve high-resolution shortwave albedos from Landsat-8 high-resolution BRFs and coarse-resolution MODIS BRDF climatology. The idea of Shuai’s method is to first classify the spectral features of the land surface through unsupervised classifications, using 6 non-thermal bands of 30-m Landsat data. The Landsat data are then re-projected and aggregated to MODIS resolution, such that the albedo-to-nadir-reflectance ratios can be calculated for the “pure” pixels defined from the classification. Finally, the high-resolution albedo is produced for each of the Landsat pixel using the derived ratios. In Shuai’s method, the detection of “pure pixels” from coarse-resolution pixels is an essential requirement for the subsequent calculation of albedo-to-nadir-reflectance ratios. However, this approach is unlikely to find “pure pixels” for each of the classes at a coarse resolution image, especially for heterogeneous land surfaces. In the modified retrieval method, the albedo-to-nadir-reflectance ratios still play a key role in deriving the high-resolution albedos, but the existence of “pure pixels” in coarse resolutions is not necessarily required.
The 1-km MODIS BRDF climatology parameters were produced from the 500-m MCD43A1 products [28]. The surfaces reflectances derived from this kernel-driven BRDF model are described as:
R ( λ , θ i n , θ o u t , ϕ ) = f i s o ( λ ) + f v o l ( λ ) k v o l ( θ i n , θ o u t , ϕ ) + f g e o ( λ ) k g e o ( θ i n , θ o u t , ϕ )
where λ is the bandpass of a given spectral channel; θ i n , θ o u t and ϕ are the solar zenith, view zenith and relative azimuth angles, respectively. k is the BRDF RossThick–LiSparse–Reciprocal (RTLSR) kernel and f is the spectrally-dependent kernel weighting, with subscripts i s o , v o l and g e o representing the isotropic, volumetric and geometric-optical components, respectively. Integration of the BRFs over all view angles results in a DHR, and a further integration over all illumination angles results in a BHR:
DHR M ( θ in ( L 8 ) ) = 1 π 0 2 π d φ 0 1 R M ( λ ,   θ in ( L 8 ) ,   θ out ,   φ ) u v du v
BHR M = 1 π 0 2 π d φ 0 1 DHR M ( θ in ( L 8 ) ) u s du s
where u v (= sin θ o u t ) and u s (= sin θ i n ) are the variables of integration. The shortwave BRFs at MODIS 1-km resolution for the Landsat-8 solar zenith and view zenith angle are given by
R M ( Ω ( L 8 ) ) = R M ( λ ,   θ in = θ in ( L 8 ) ,   θ out = θ out ( L 8 ) ,   φ = φ ( L 8 ) )
where Ω ( L 8 ) is the Landsat-8 sun and sensor geometry. Then, the ratios between the shortwave albedo and shortwave reflectance values can be computed for all the pixels at 1-km MODIS resolution:
α D = D H R M ( θ i n ( L 8 ) ) R M ( Ω L ) ;   α B = B H R M R M ( Ω L )
An endmember is defined as a land “type” that is assumed to have a unique spectral signature. Here, the N-FINDR endmember extraction algorithm [29] was adopted to extract the pure endmembers from the 30-m Landsat-8 spectral reflectance data. This was followed by re-projecting the Landsat-8 data from Universal Transverse Mercator (UTM) to MODIS (sinusoidal) projection, and aggregating the pixels from 30-m to 1-km resolution. Then the proportion of each endmember was calculated for each of the aggregated 1-km pixel using a fully constrained least squares (FCLS) linear un-mixing method [30]. Then, the following equation was established:
A   W = R
where A is a (m, n) matrix with m being the number aggregated pixels, and n being the number of endmembers. Each row of the matrix A contains the proportions of derived endmembers. W is a (n, 1) matrix containing the weighting parameters. R is a (m, 1) matrix with the elements representing the MODIS BRDF climatology albedo-to-nadir-reflectance ratios. The weighting function W is solved as,
W = ( A T   A ) 1   A T   R
where the superscript T refers to matrix transpose. Given the Landsat-8 spectral reflectance values, the shortwave reflectance values can be calculated through the use of a set of narrowband to broadband conversion coefficients [18]:
α L 8 = 0.356 α 2 + 0.13 α 4 + 0.373 α 5 + 0.085 α 6 + 0.072 α 7 0.0018
where α 2 , α 4 , α 5 , α 6 and α 7 represent the Landsat-8 blue, red, NIR, SWIR-1 and SWIR-2 narrow bands, respectively. The shortwave reflectance is transformed to shortwave albedo through the following formula:
B = ( C   W ) L
where C is (k, n) matrix with k being the number of 30-m Landsat-8 pixels. Each row of C contains the derived endmember proportions of Landsat-8 pixels. L is a (k, 1) matrix that contains the shortwave reflectance derived from Equation (11) for each pixel, and is the Hadamard product. The processing chain for generating high-resolution albedo using Landsat-8, as an example, is illustrated in Figure 5.

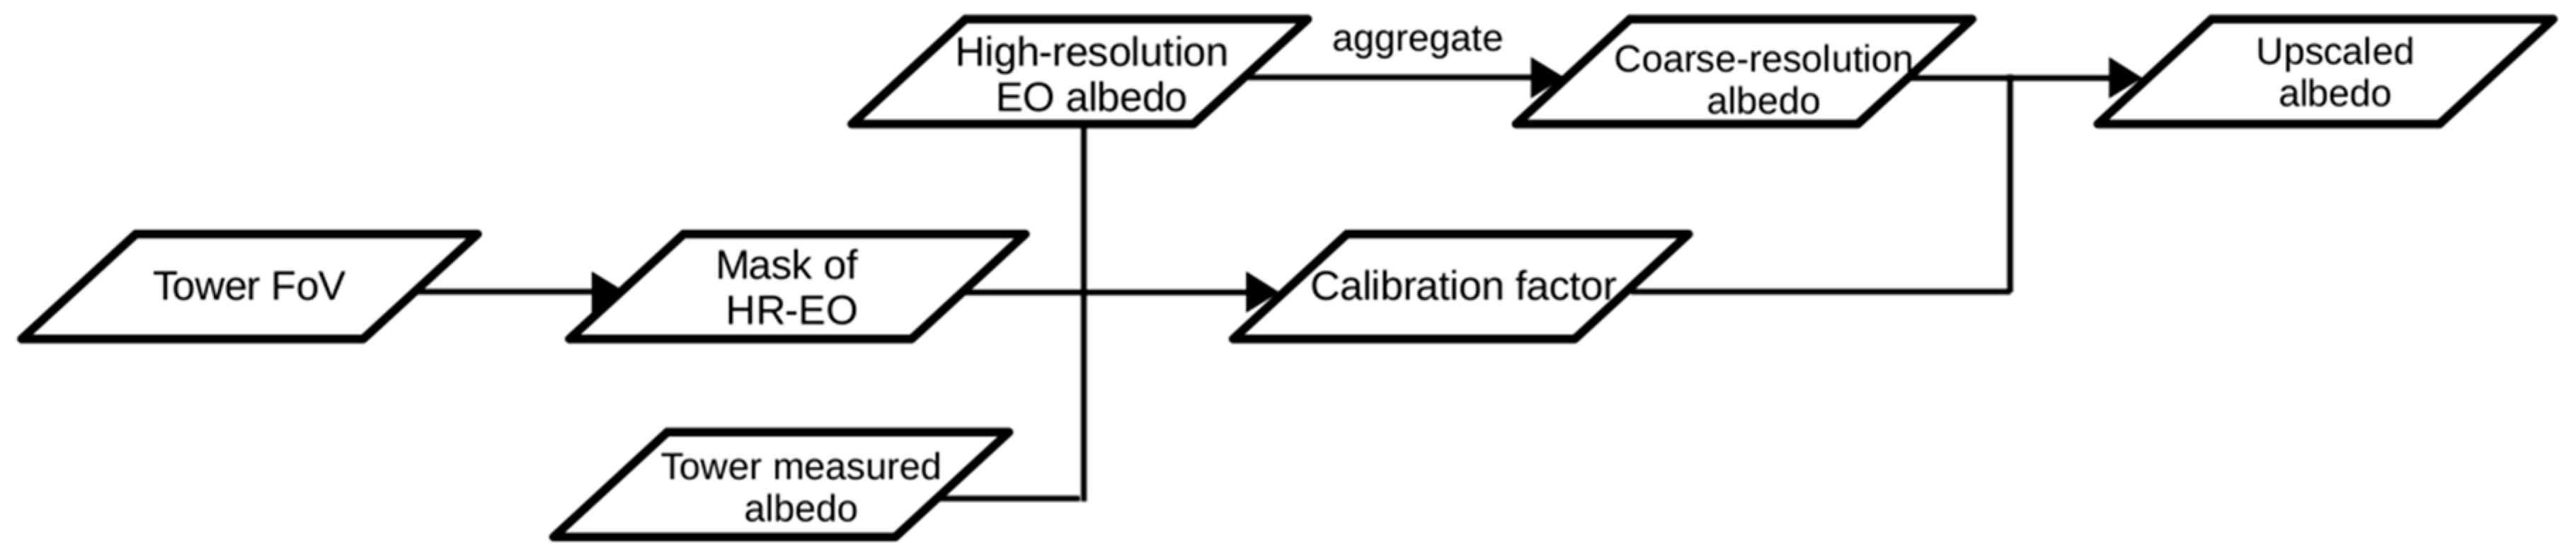
2.4.2. Upscaling of Albedo from Tower to Coarse Resolutions

The pyranometers that measure downwelling and upwelling radiation are mounted on towers with a fixed height of 10 m at the SURFRAD sites, while the BSRN and FLUXNET sites utilize towers at different heights, usually dependent on the height of the canopy-top. The reference albedo was located by assuming the albedometer measures a circular area from the top of the tower [31]. The diameter of this circular area, which represents the effective projected FoV of the tower albedometer, was estimated as:
D = 2 tan ( F o V ° / 2 ) · ( h t o w e r h T o C )
where h t o w e r and h T o C are the height of tower and averaged height of vegetation, respectively. F o V /2 is half of the effective field of view in degrees, which is 81° [32]. For a pyranometer mounted on a 10-m tower, the projected FoV on the surface is 126 m. The values for all the sites are given in Table 1. The reference albedo was approximated by averaging the corresponding albedo values of pixels within a high-resolution EO shortwave albedo product. Then, a “calibration factor” could be derived from the ratio between the in situ albedo and the reference albedo. To produce the coarse-resolution albedos, the high-resolution albedo product needed to be aggregated to a coarse resolution first, and then modified with this “calibration factor”. The above-mentioned process for producing coarse-resolution albedo product is illustrated in Figure 6.

3. Results

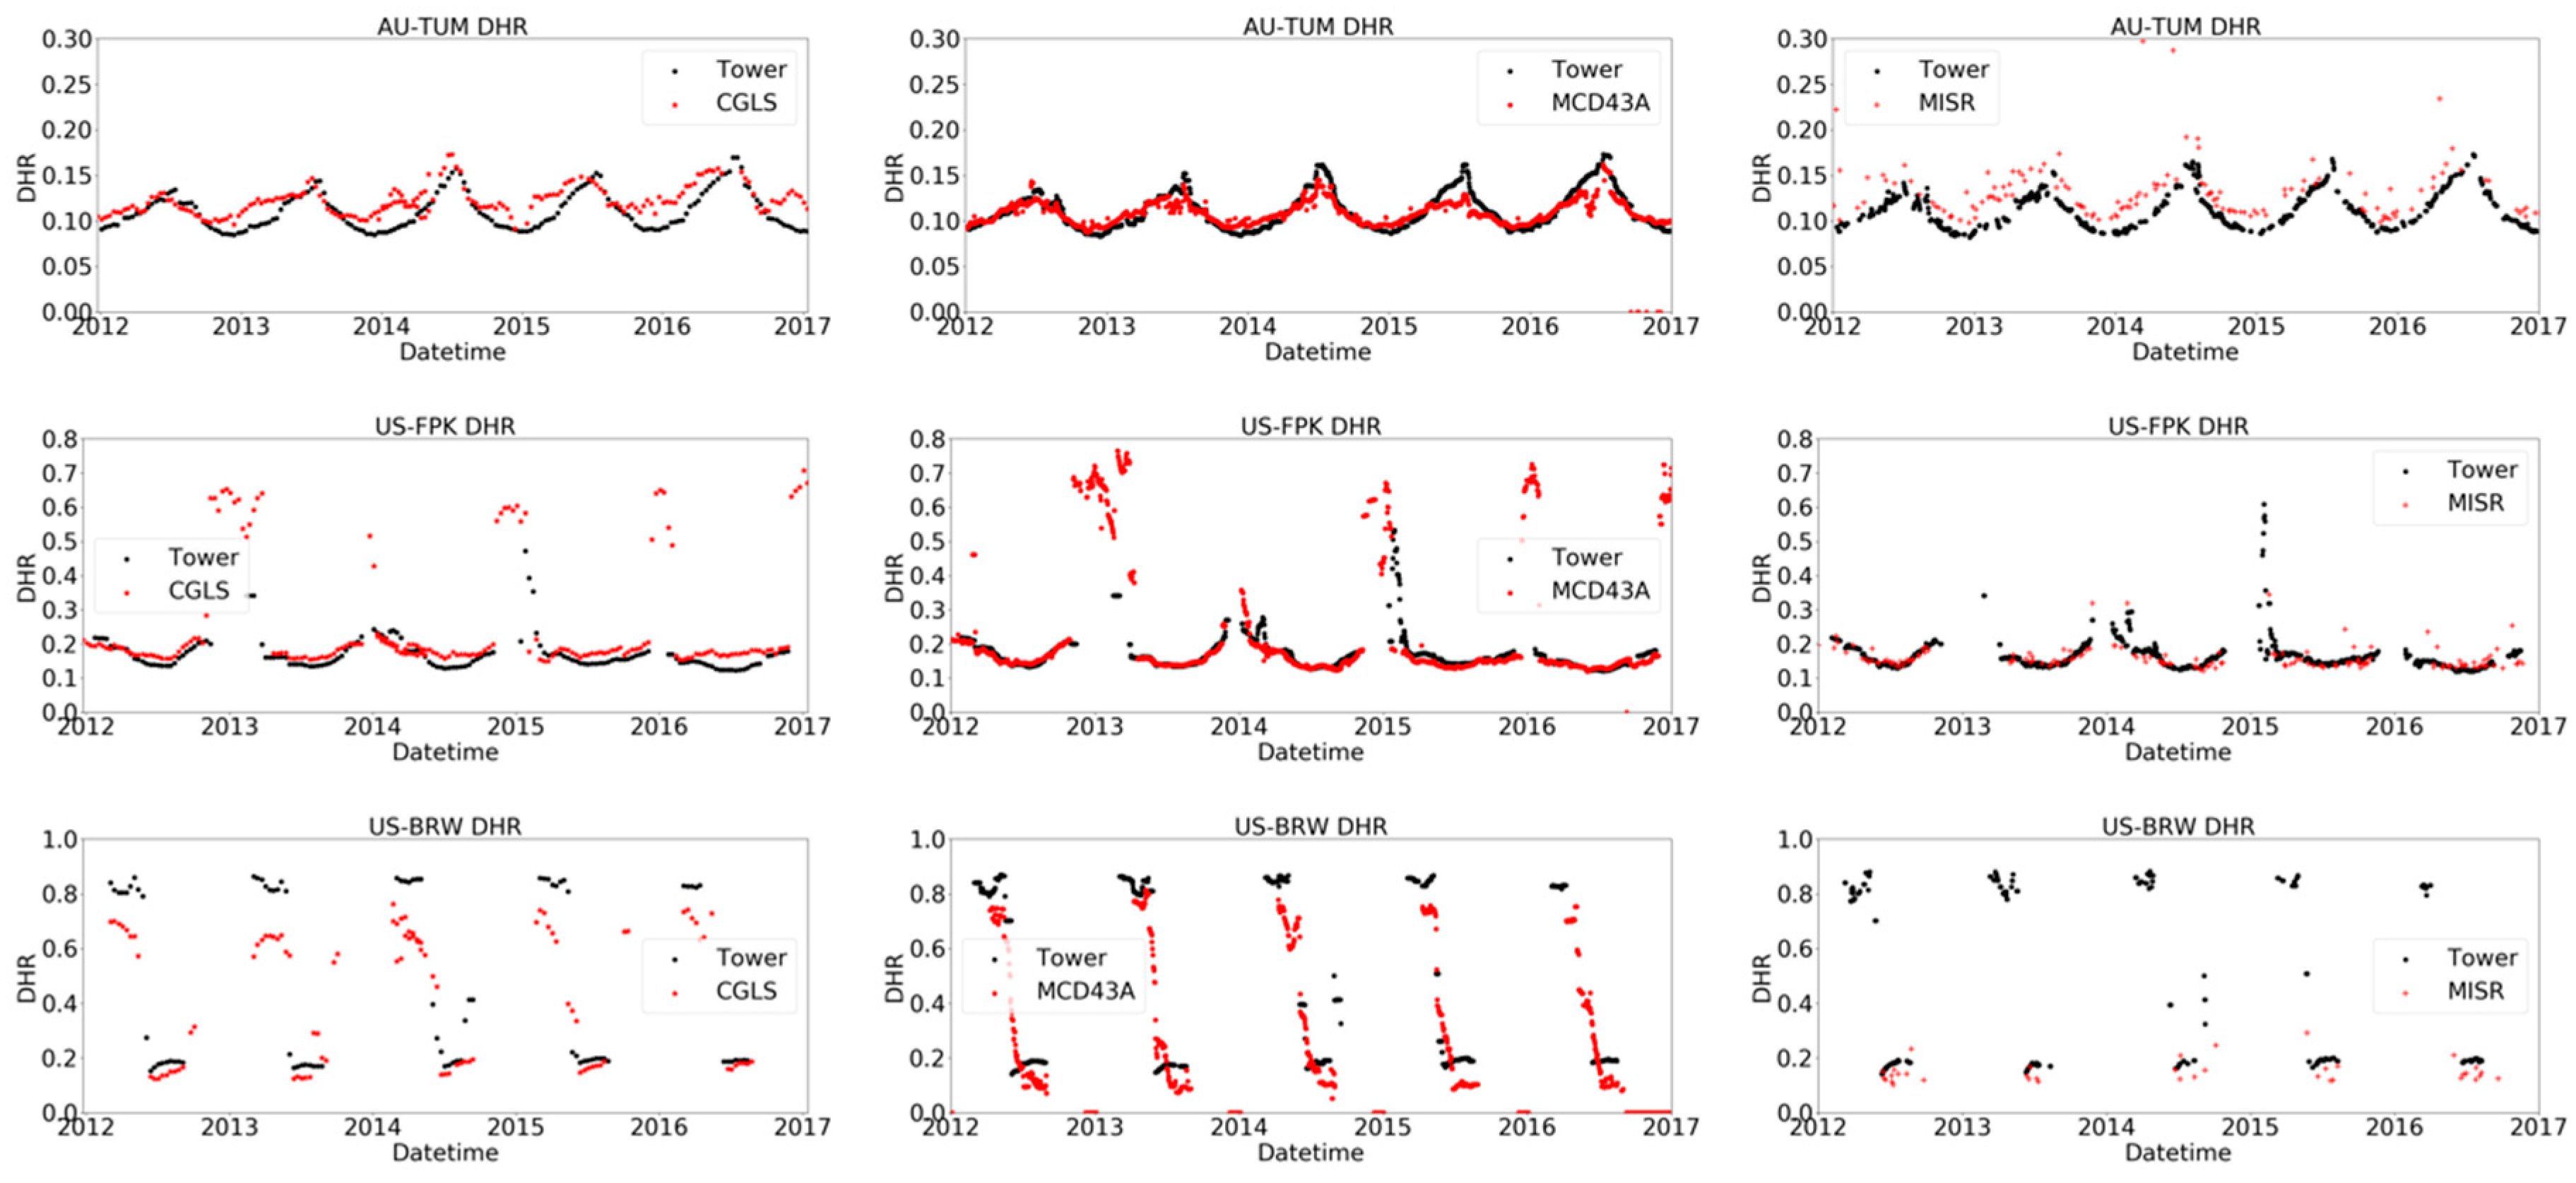
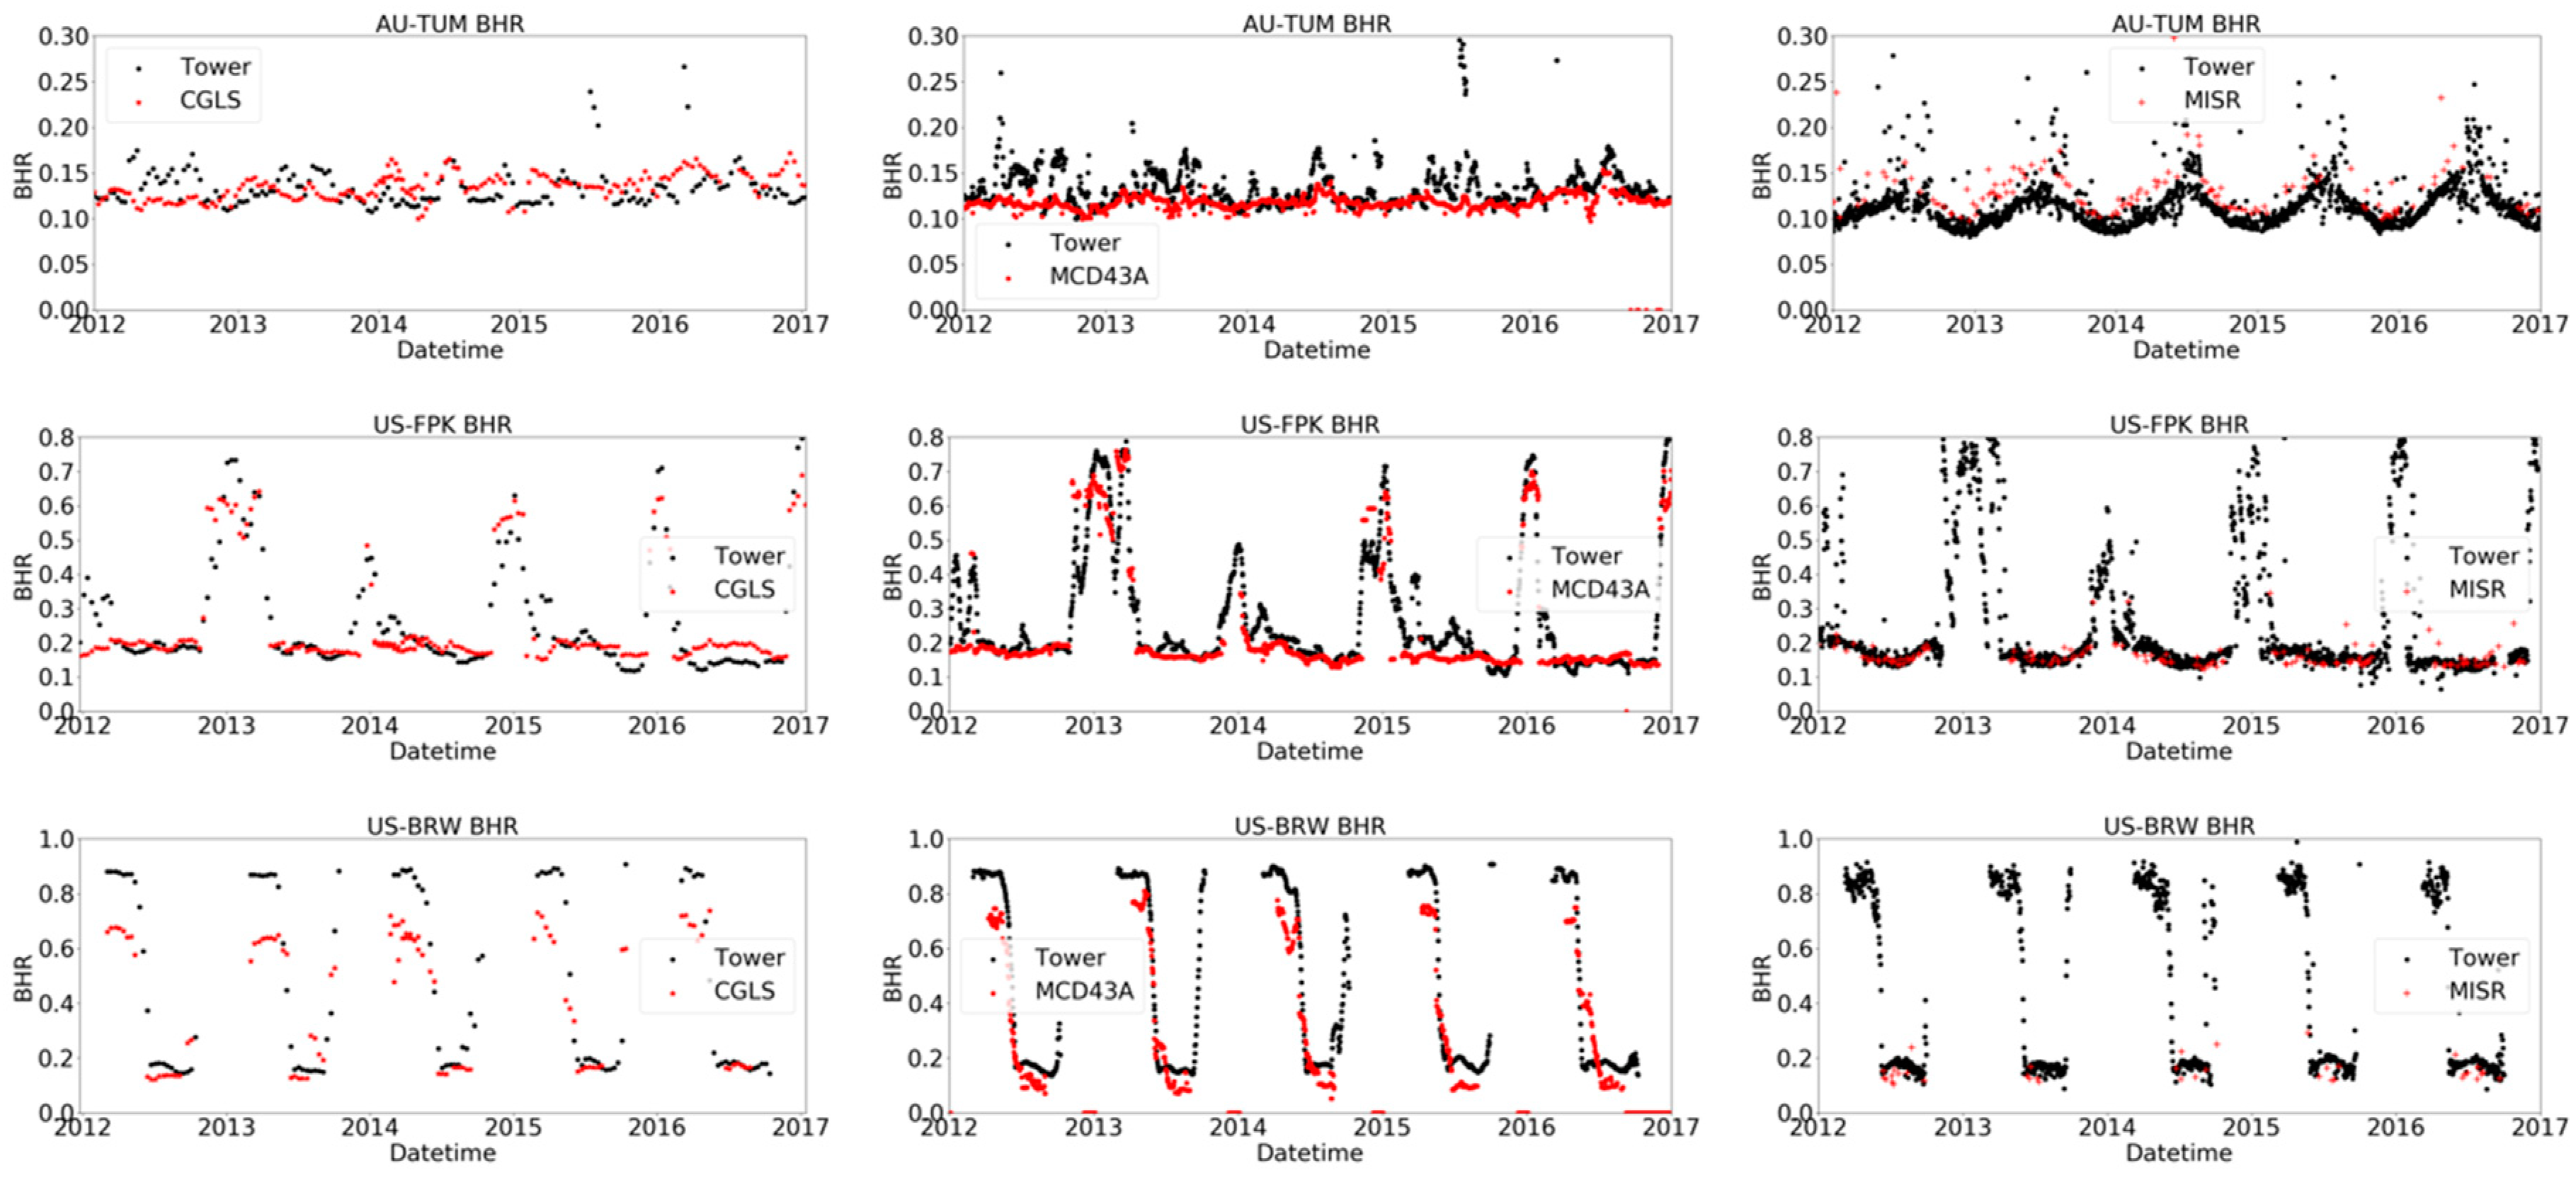
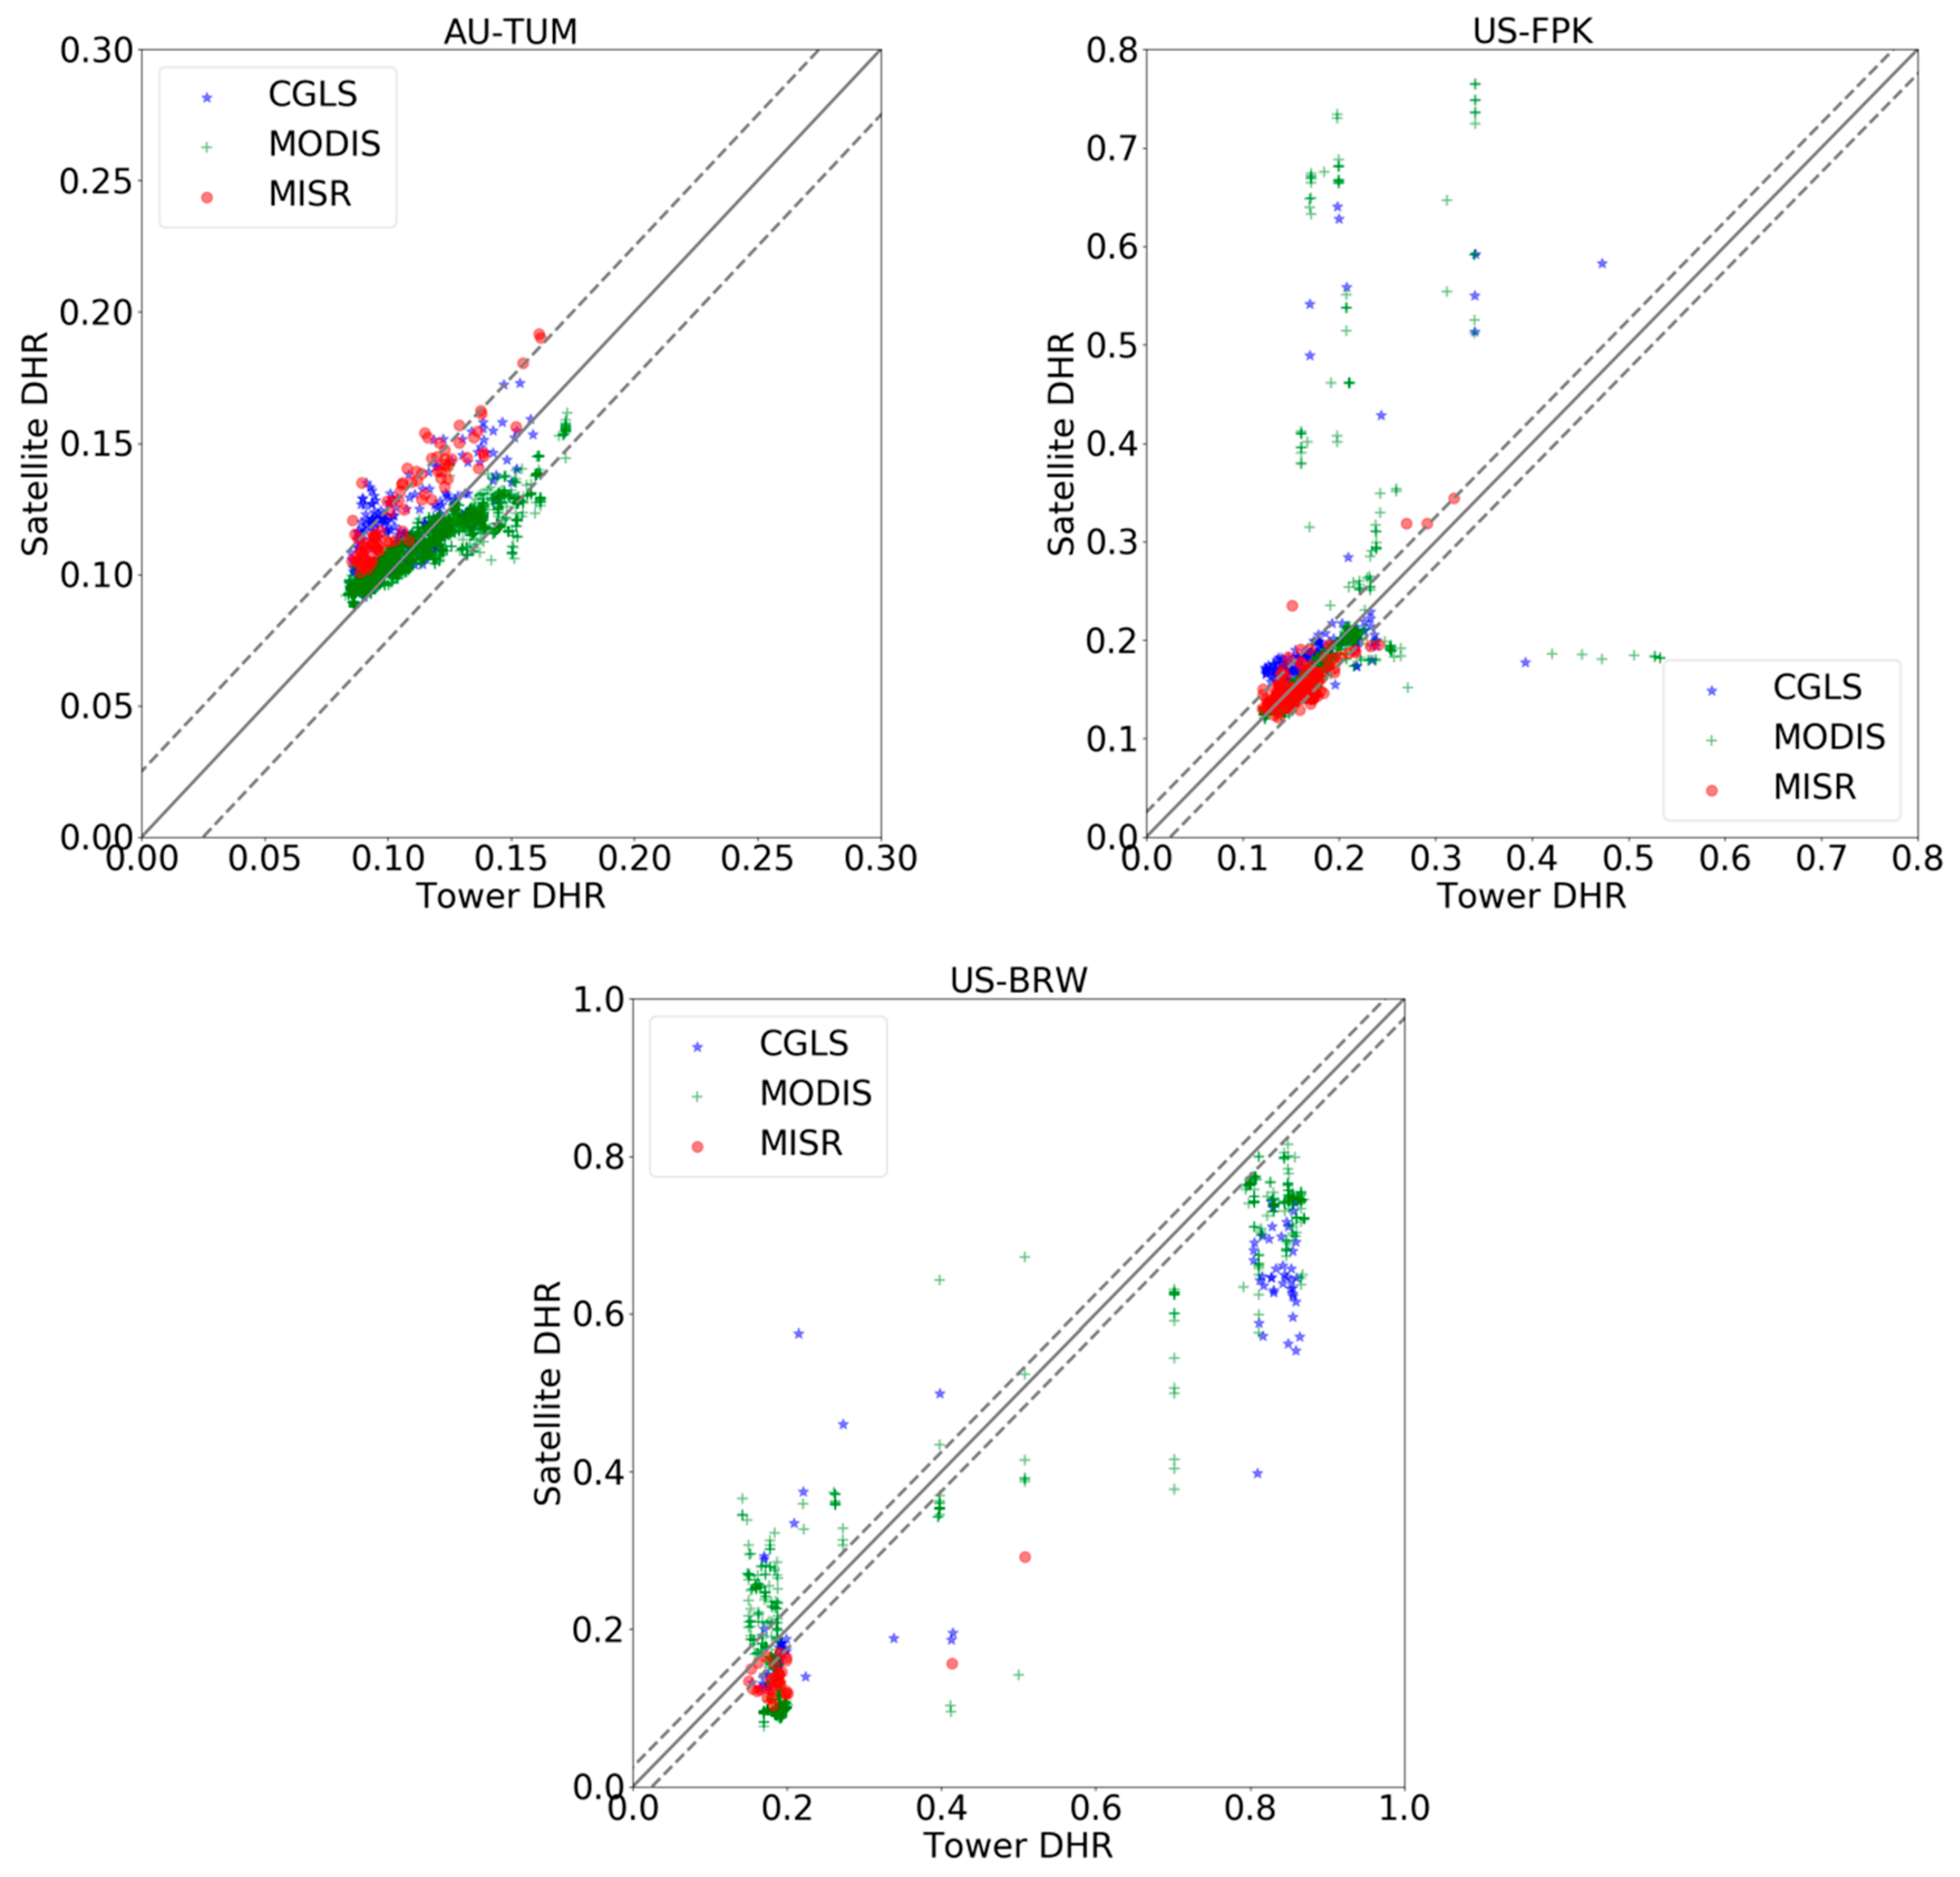
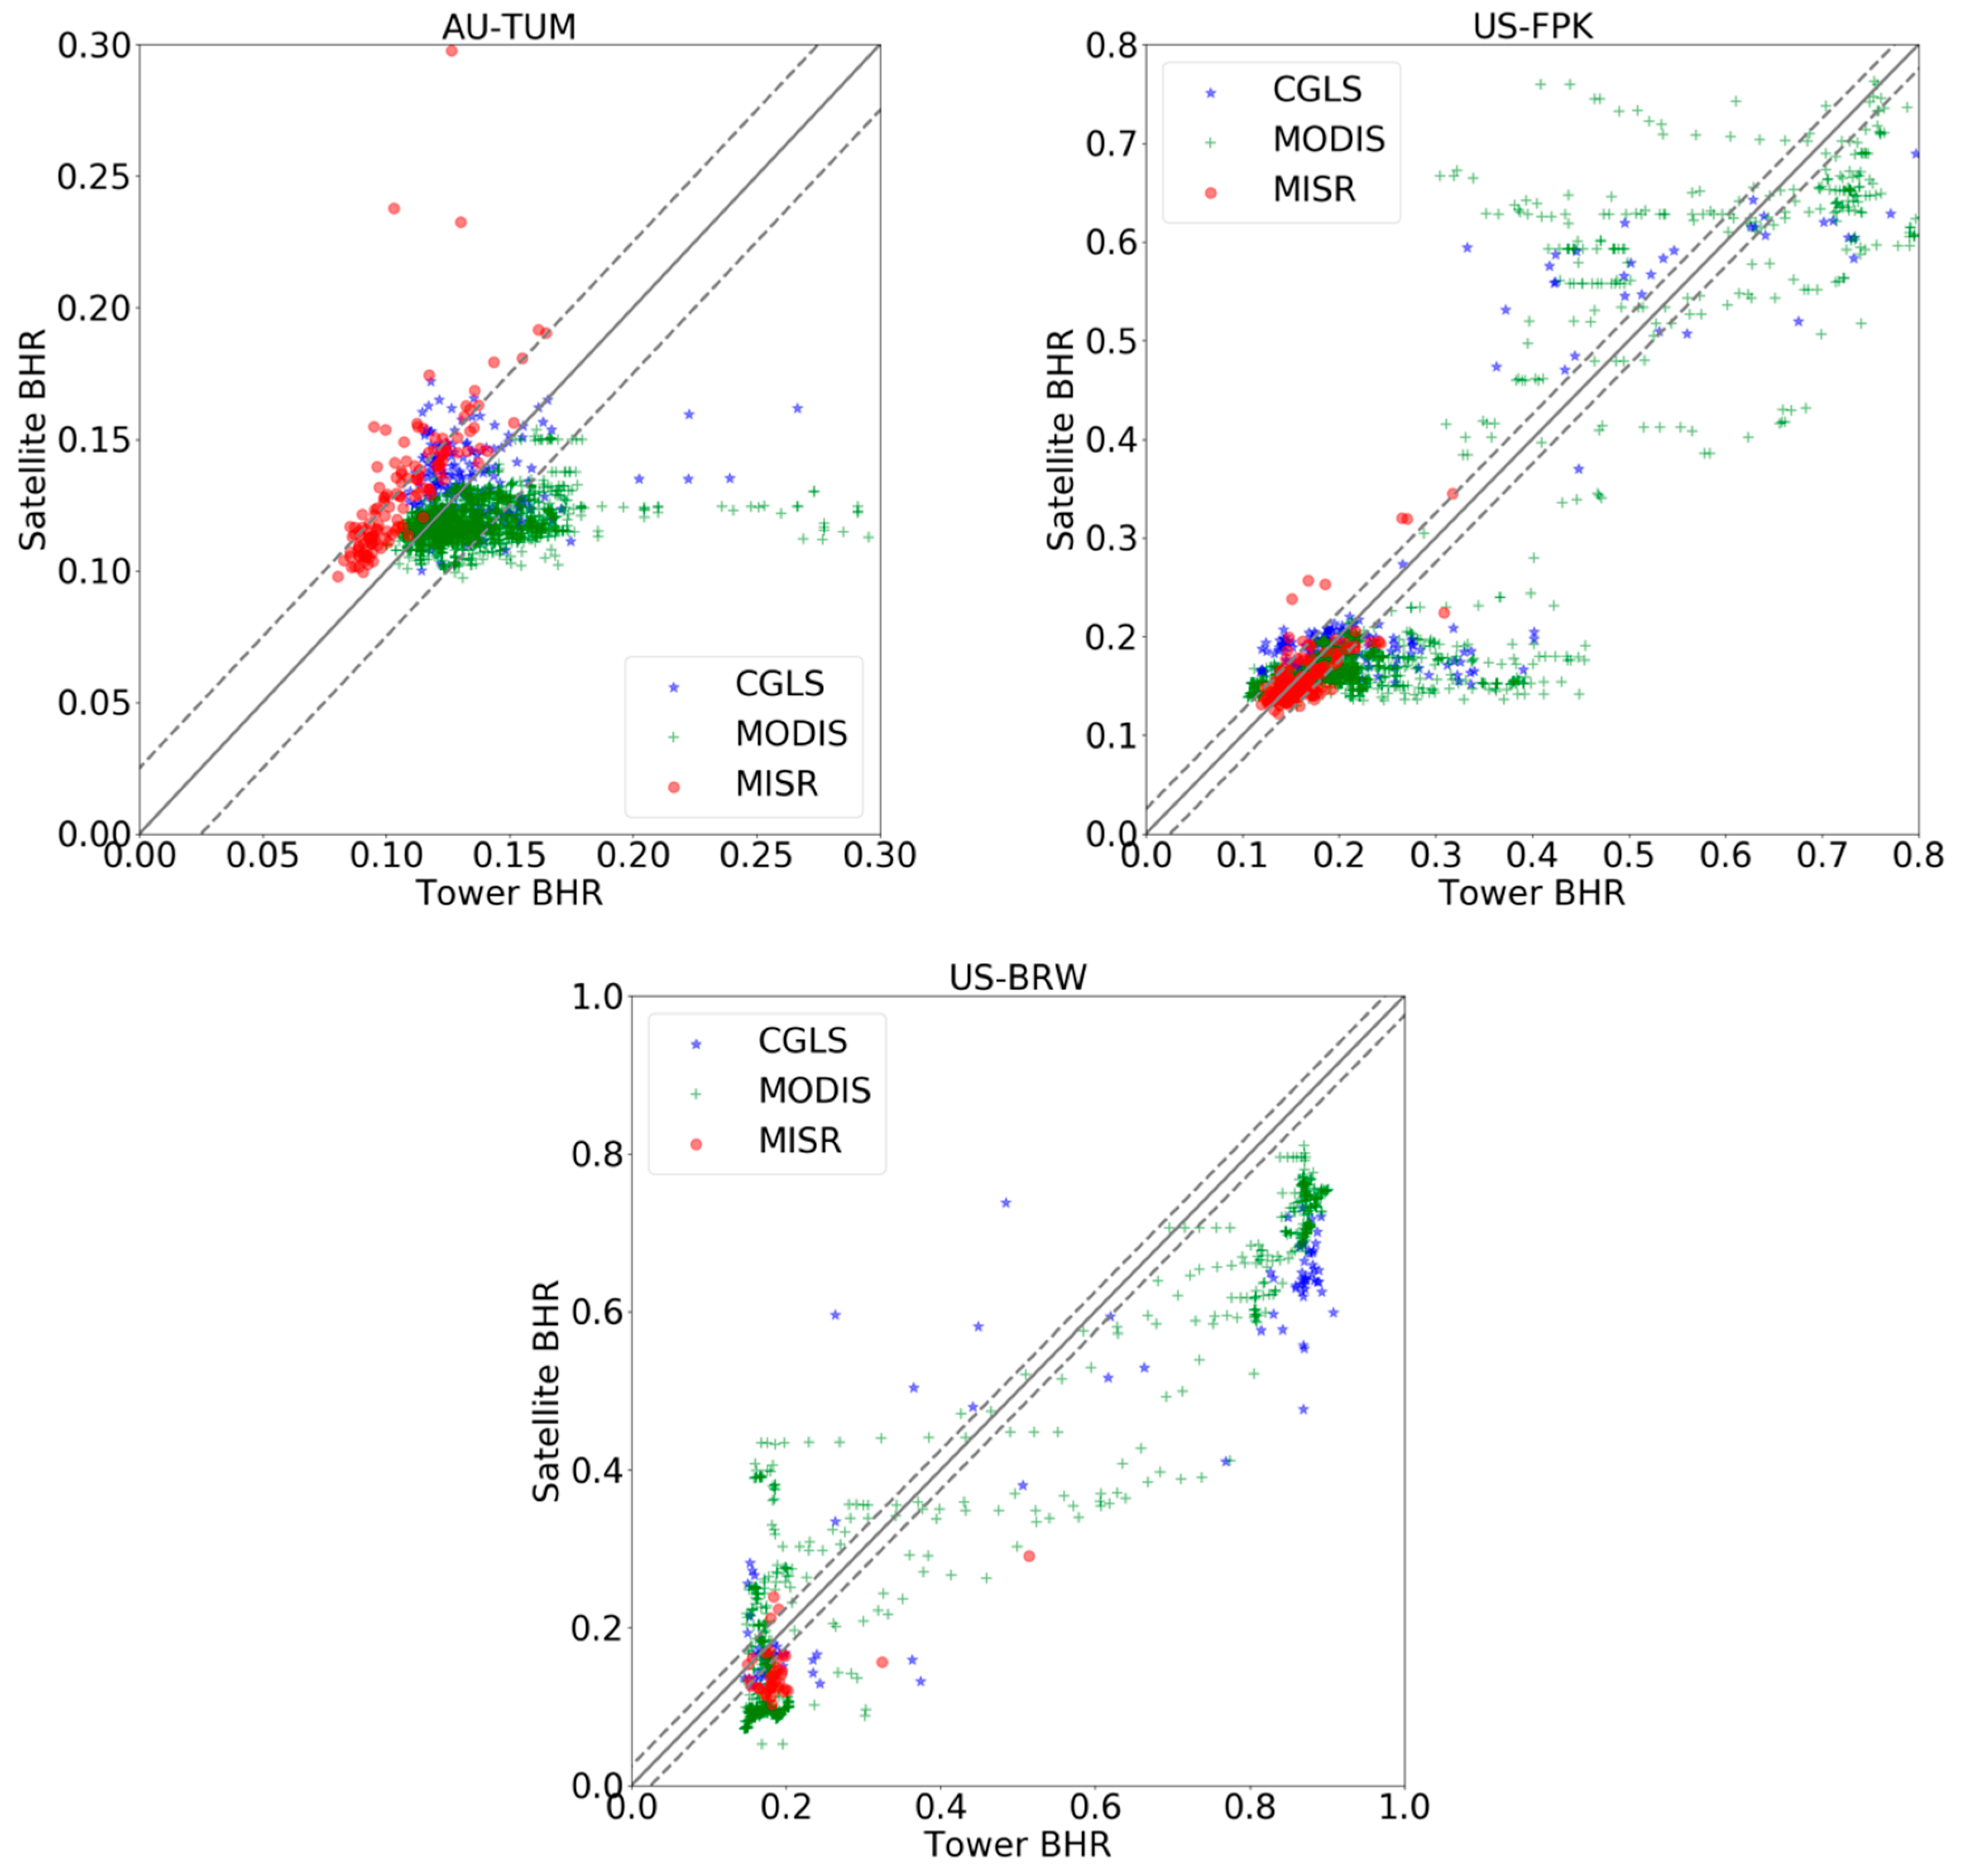
3.1. Comparison of Surface Albedo between Satellite Products and In Situ Retrievals

Tower measured shortwave radiation data from 19 sites were used to estimate both DHRs and BHRs and evaluate the accuracy of satellite derived values. There were no intercomparison results at the SPO site presented here, due to the lack of higher resolution satellite data covering this region. In Figure 7 and Figure 8, DHRs and BHRs retrieved from tower albedometers were compared with the CGLS, MODIS and MISR products for the following sites: AU-TUM (evergreen broadleaf), US-FPK (grasslands) and US-BRW (snow and ice). The intercomparison of time-series tower and satellite-derived albedo for the other SURFRAD and BSRN sites is provided in the Supplementary Figure S1. Albedo products from satellite observations were produced using different time windows (i.e., 30 days for CGLS, 16 days for MODIS and near simultaneously for MISR (~7 min)). Here, three different time windows (30, 16 and three days) were used in tower albedo retrieval for the corresponding intercomparison with CGLS, MODIS and MISR products, respectively. A three-day rather than a one-day window was used in tower albedo retrievals when comparing with MISR products, because the effective number of measurements acquired from a one-day window was often insufficient to retrieve DHRs or BHRs after data screening.
At some sites (e.g., Tumbarumba and Fort Peck sites), the DHR intercomparison showed a good match in terms of absolute values and seasonal variations. The DHRs at the Barrow site showed a better match during the snow-free season than the snow-covered season. Among the three satellite DHR products, MODIS showed the best agreement with the in situ measurements. At the Tumbarumba site, both CGLS and MISR retrievals showed a systematic overestimation of the DHR, while the MODIS retrievals agreed fairly well with in situ measurements in all time periods. At the Ford Peck site, the MISR DHRs were comparable with MODIS DHRs, whereas the CGLS retrievals were still overestimated during the snow-free season. It is interesting to note that the MODIS retrievals had better performance in picking up the albedo of snow points. At the Barrow site, the MISR retrievals were closer to the in situ measurements during the snow-free season than the CGLS and MODIS retrievals.
The intercomparison of BHR measurements at the four sites discussed above are displayed in Figure 8, and results for the other sites can be found in Supplementary Figure S2. It should be noted that the BHR products provided in MISR were a very close approximation to the blue-sky albedo, rather than the white-sky albedo. Therefore, the tower albedos were directly retrieved from the ratio between the upwelling and downwelling radiation for this specific comparison with MISR retrievals. The tower data for the purpose of MISR BHR comparison were screened over a ±1-h window at local solar noon during one day. The variation of surface albedo was dependent on the solar zenith angles, please see [33] in more details for an explanation of why solar noon is employed.
Generally speaking, the DHR retrievals showed better agreement between satellite and in situ measurements than the BHR retrievals. In our method for BHR retrievals, the illumination was assumed to be uniform from all angles when the diffuse ratio was larger than β B . However, not all the tower data screened for BHR retrievals could meet this condition. This was the error source that may reduce the accuracy of BHR retrievals. Similarly, the MODIS DHR retrievals showed the best agreement with tower measurements, followed by the MISR retrievals, and then followed by the CGLS retrievals.
The albedo values derived from satellite products and tower retrieval are summarised in the 2D scatterplots shown in Figure 9. for DHRs for three selected sites. At the Tumbarumba site, all the satellite products were well-correlated with the in situ retrievals, with a bias value less than 0.025. The Fort Peck site also showed a good correlation, except for some points which were incorrectly identified as snow in CGLS and MODIS. The MISR products showed a better performance at the Barrow site during the snow-free season, while the CGLS and MODIS were better in picking up snow, although the snow-covered DHRs were often underestimated.
The albedo values derived from satellite products against corresponding tower retrievals are summarised in Figure 10 for BHRs. Again, the satellite products and tower retrievals showed a better agreement of DHR values than BHR values. Large biases occured during the snow-covered season, which could be observed at the Fort Peck and Barrow sites.

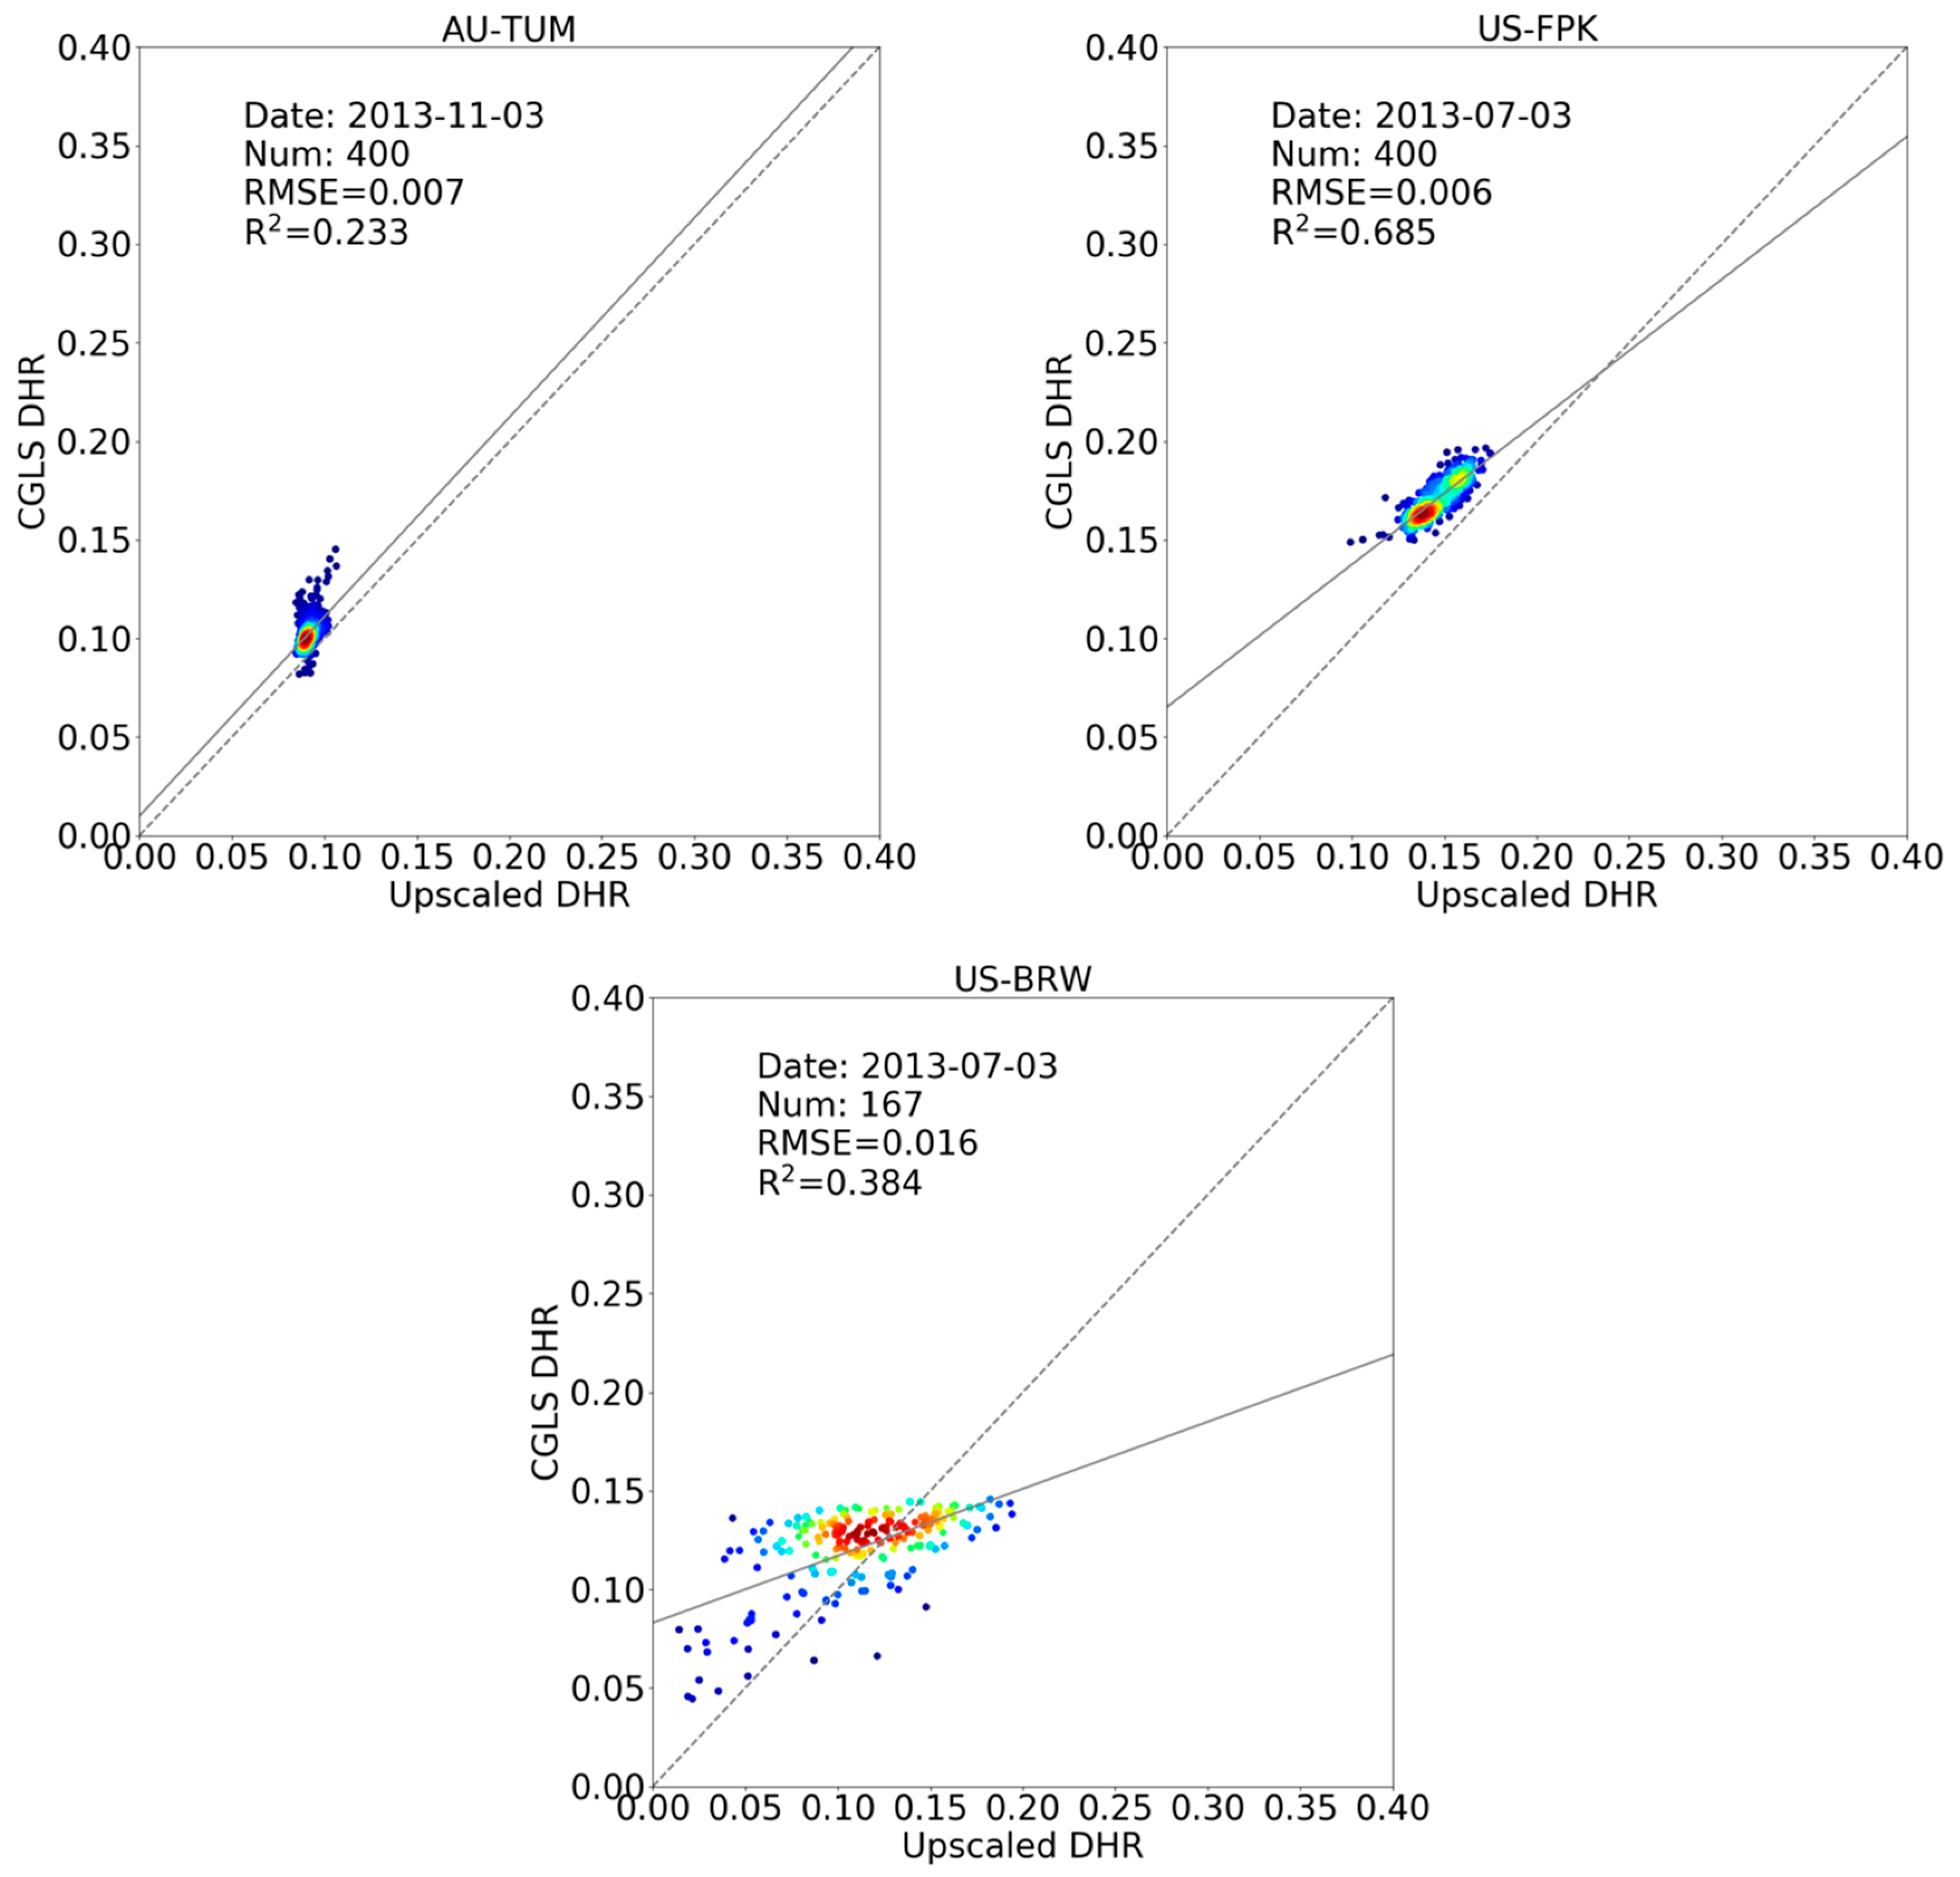
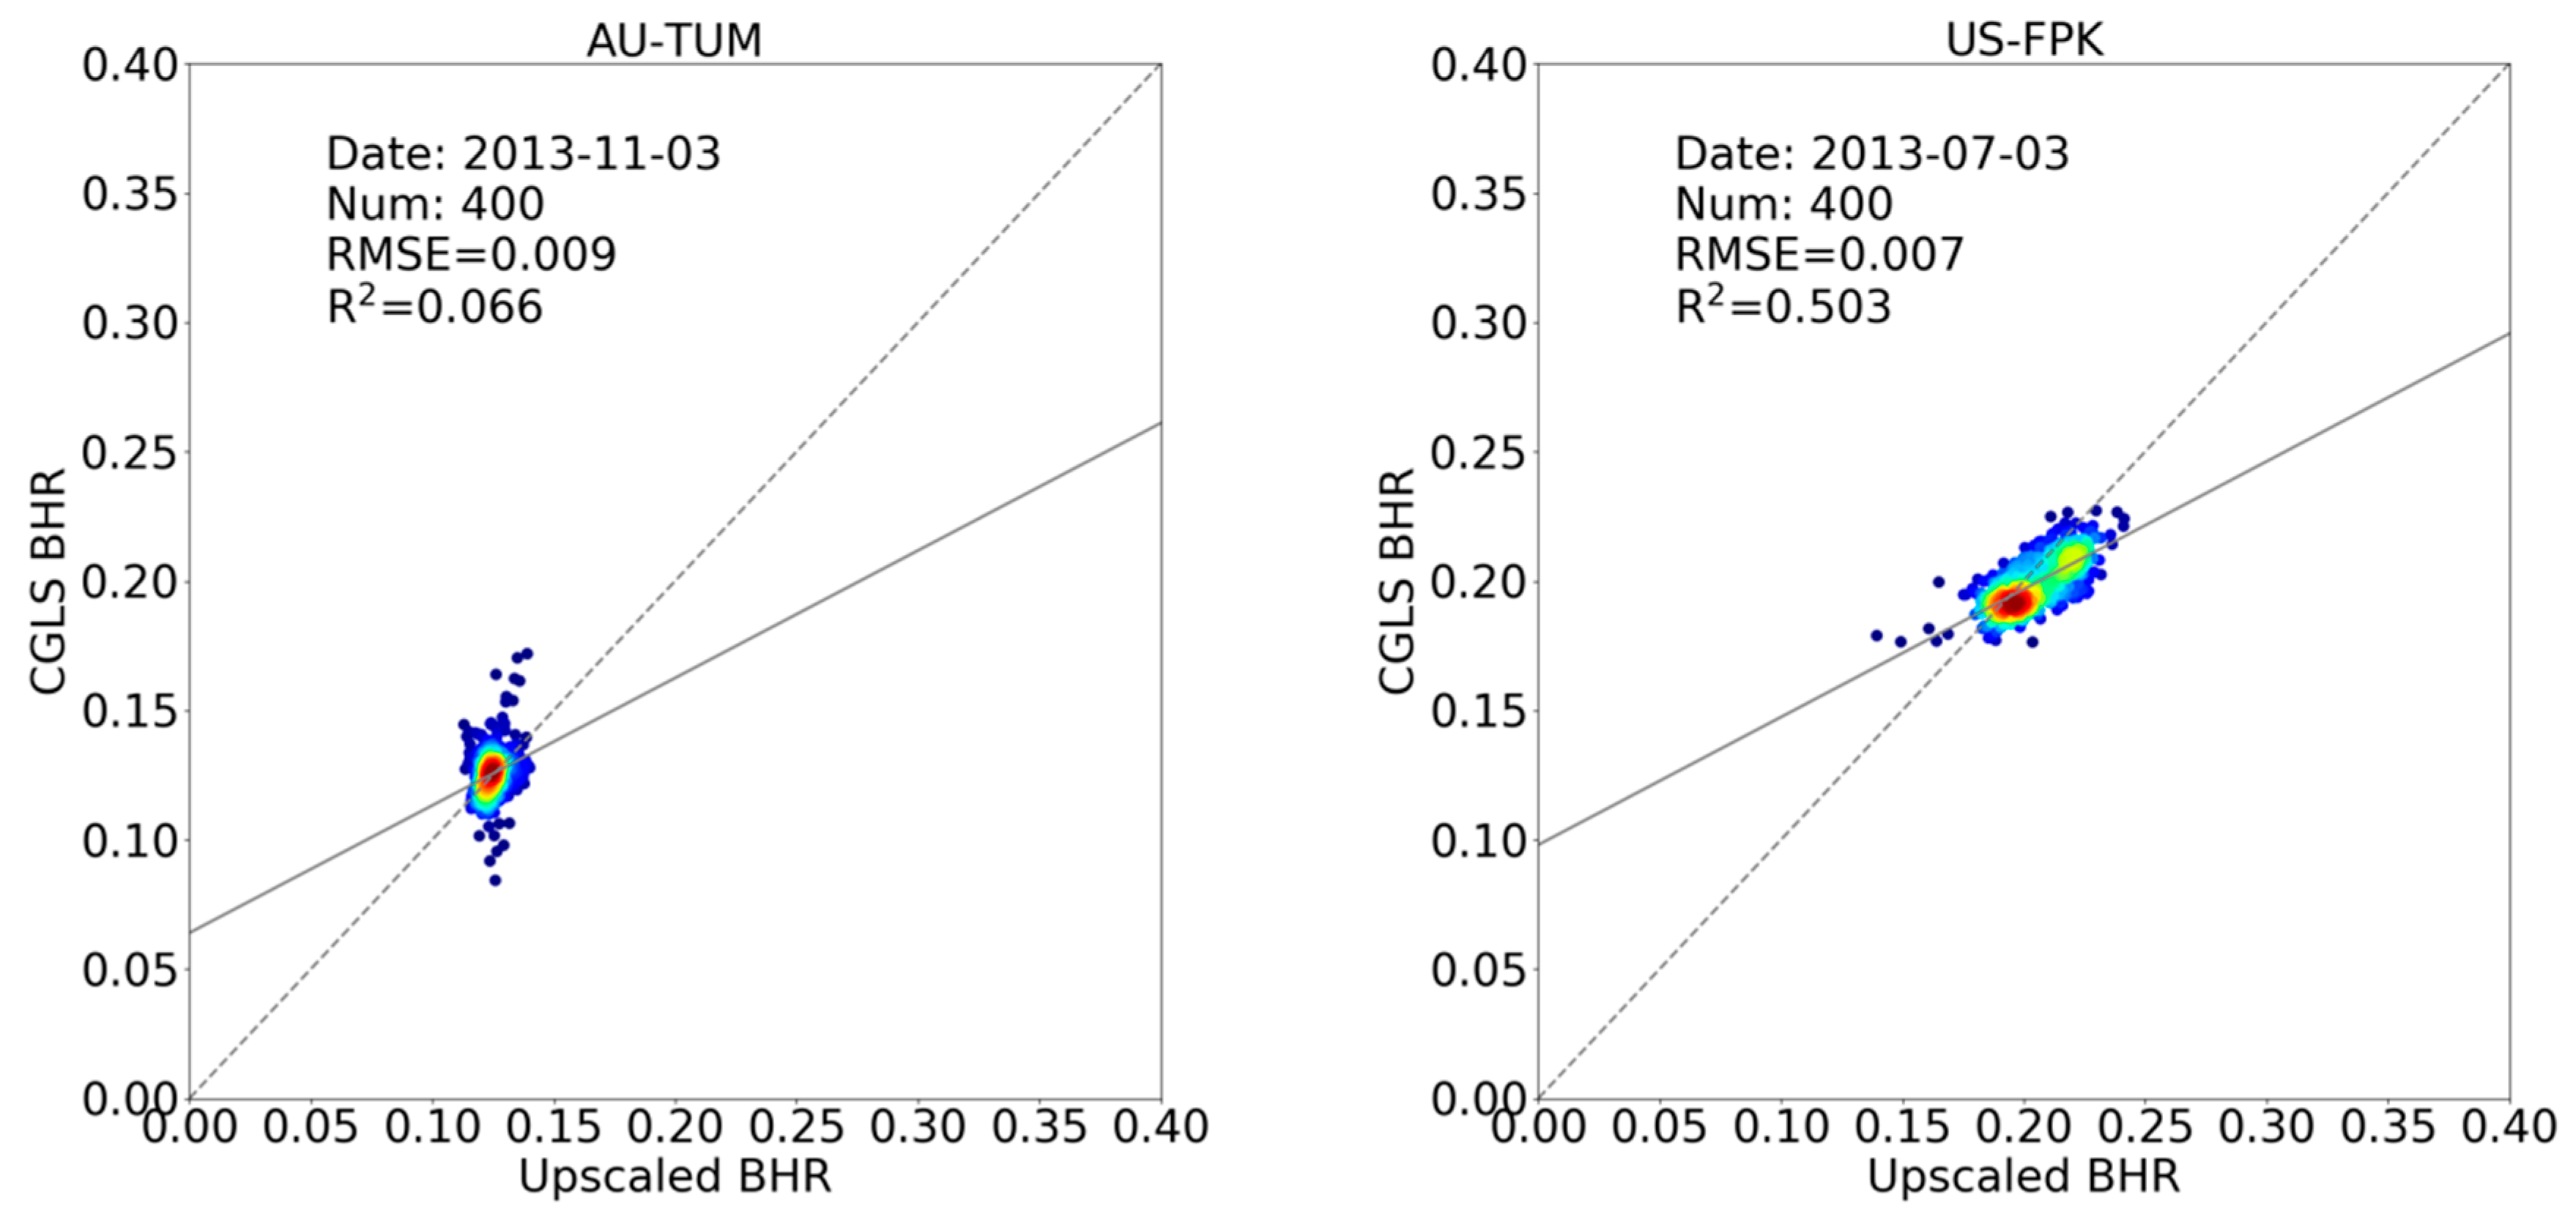
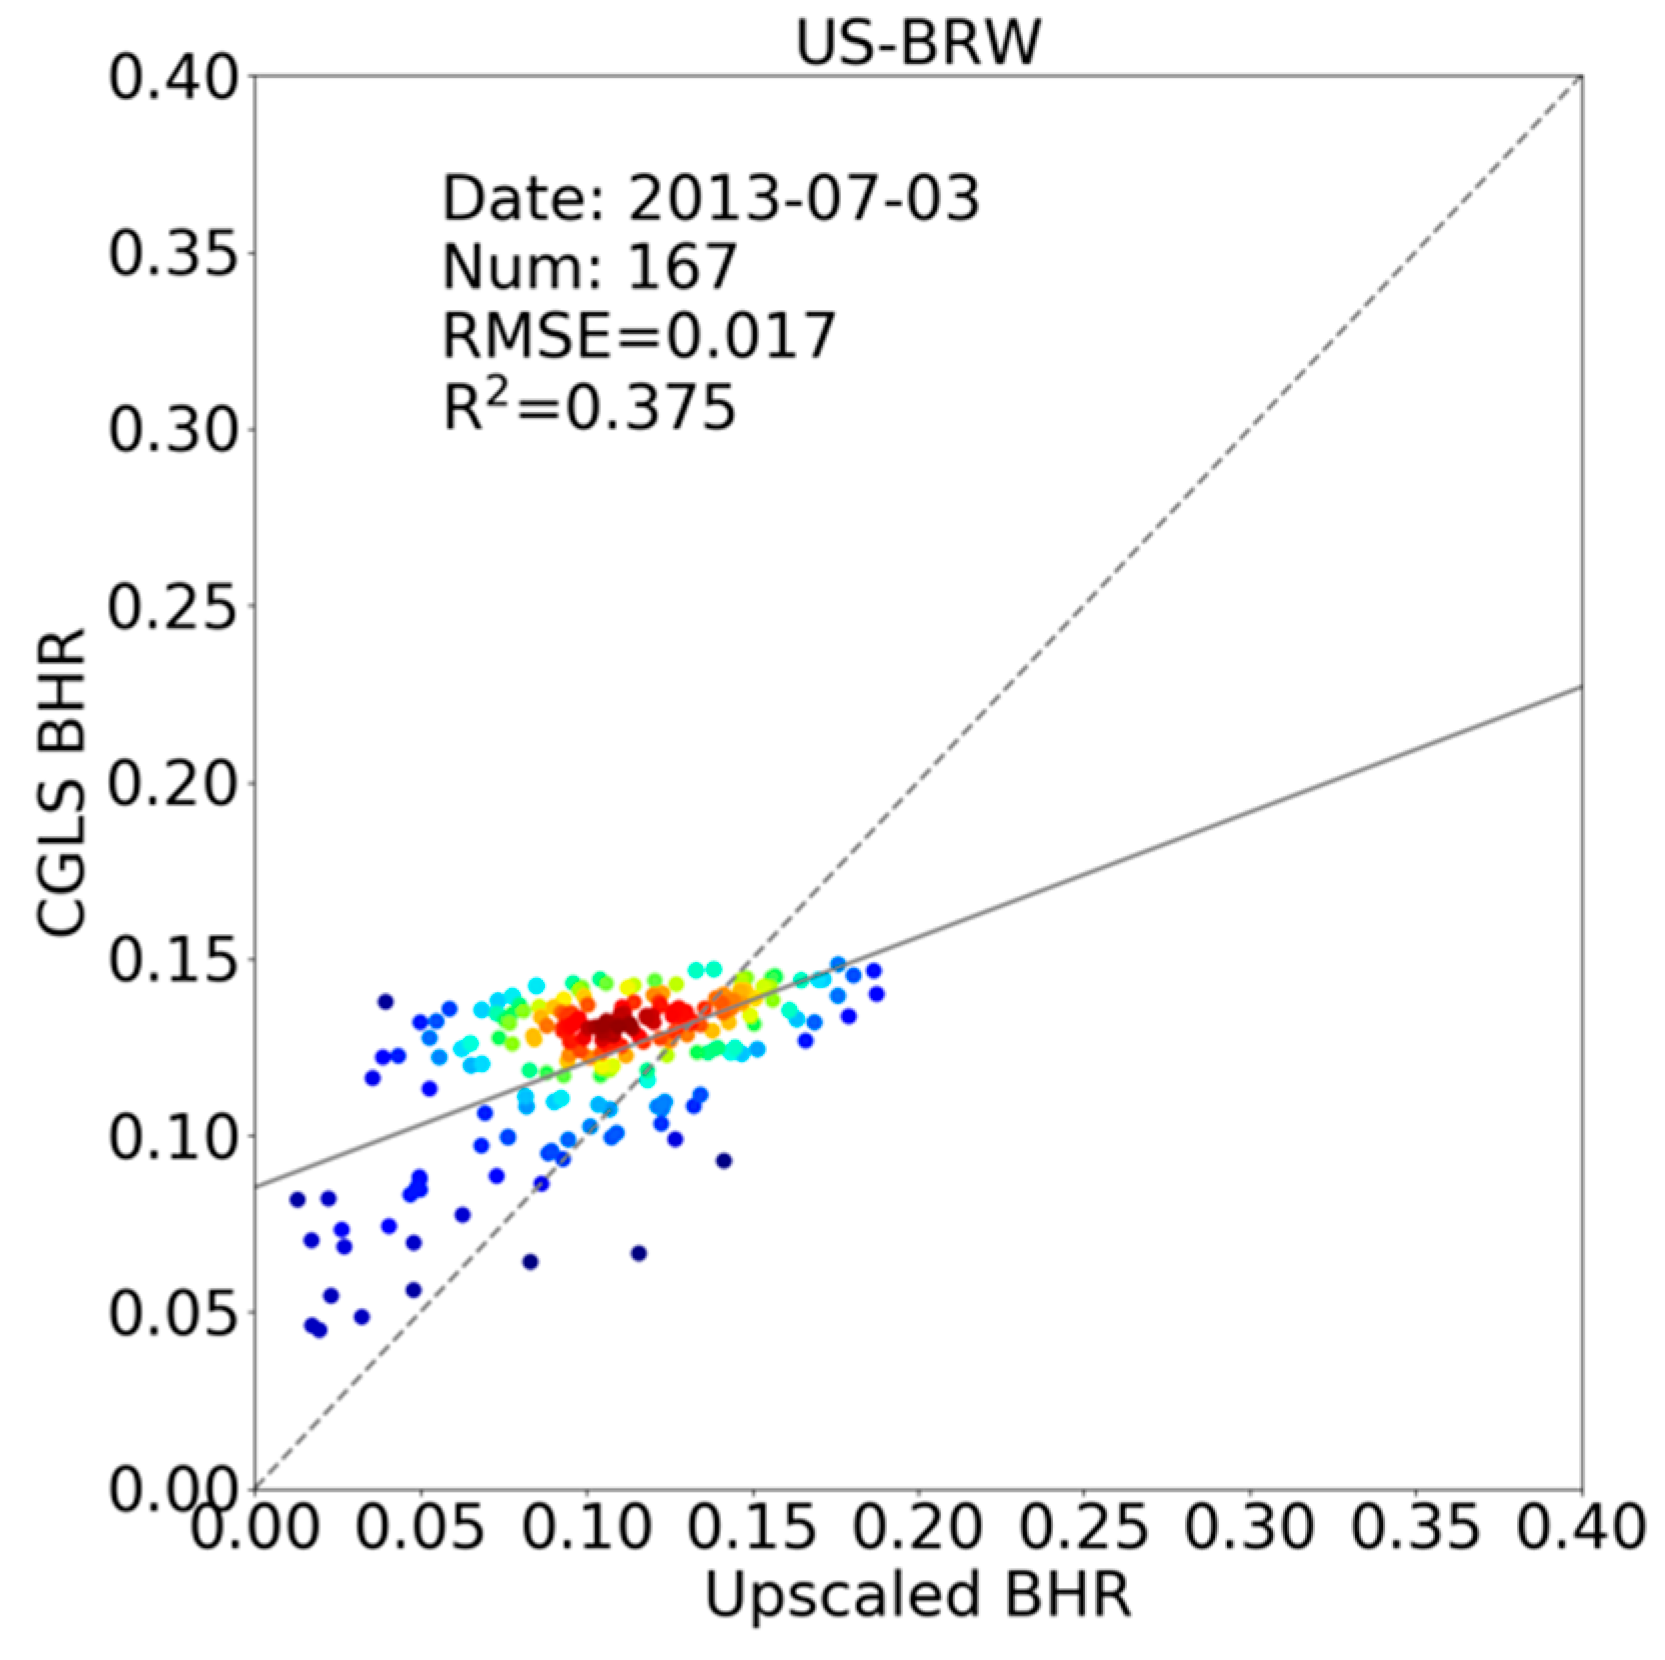
3.2. Comparison of Surface Albedo between Coarse-Resolution Satellite Products and Upscaled Tower Values

DHRs and BHRs retrieved from tower data were upscaled to 1-km resolution and compared with CGLS products to assess the performance of this upscaling strategy. Coincident Landsat-8 30-m albedo data, which are used as a bridge to fill gaps between the small footprint tower measurements and the coarse-resolution measurements, were produced using the method introduced in Section 2.4.1. Scatter plots between the upscaled albedo and CGLS 1-km albedo are displayed in Figure 11 for DHR comparisons and Figure 12 for BHR comparisons, respectively. Comparisons for other sites are given in the Supplementary Figure S5. MODIS BRDF climatology data were used as input in the upscaling process; therefore, here the upscaled values were not directly compared with the MODIS albedo products. The sparsity of MISR albedo products severely increased the difficulty of finding cloudless Landsat-8 data.
At the Fort Peck site, the upscaled DHRs were well correlated with the CGLS DHRs, with a R-squared ( R 2 ) of 0.685 and root-mean-square-error (RMSE) of 0.006. The Barrow site had fewer pixels upscaled to coarse resolution than the other sites, and the upscaled DHRs showed larger differences with CGLS for the pixels with smaller albedo values, due to melt-ponds and tundra in this region. At the Tumbarumba site, most pixels were clustered around the 1:1 line, because of the good agreement in “point-to-pixel” time series analysis. But the upscaled DHRs had a relatively small value of R 2 (0.233) when compared with CGLS DHRs, which suggests that the upscaling coefficient was not suitable for upscaling to a region covering 20 × 20 pixels around the tower. The BHR upscaling results were close to the DHR upscaling results in terms of R 2 and RMSE.

4. Discussion

The DHR and BHR values retrieved from the tower albedometer data were first directly compared with satellite values derived from the pixel near the tower location. Generally speaking, the homogeneous sites had a better agreement between tower and satellite retrievals than the heterogenous sites. For the homogeneous sites, except for the US-BAO site that appears to have anomalous tower data since the year 2016, all the other sites (AU-TUM, US-TBL, US-FPK, US-DRA, US-BRW) showed good agreement with the satellite retrievals during the snow-free season. Among the heterogenous sites, the US-BON, US-GCM and US-PSU had large differences between the tower and satellite retrievals, while the US-SXF showed good agreement.
MODIS products showed the best agreement with tower retrievals, followed by MISR products, and then followed by CGLS products. The MODIS products appeared to have a good performance in picking up snow-covered points, which can be seen from the time-series analysis at the US-FPK, US-SXF and US-TBL sites. The MISR products were comparable with MODIS products at most of the sites studied in this work, and better than MODIS products at sites like US-BRW during the snow-free season. However, the MISR products were produced using a near-simultaneous retrieval, and compared with tower DHRs generated over a three-day window and tower BHRs generated in one day. In this case, the agreement between the MISR and tower retrieval suggests that the MISR products were closer to the actual surface albedo values.
The albedo values retrieved from both homogeneous and heterogenous sites were upscaled to coarse resolutions through the use of Landsat-8 spectral reflectance and MODIS BRDF climatology data. There was no obvious difference in the agreement between upscaled albedos and coarse-resolution albedos over homogeneous and heterogenous sites. But relatively better correlations could be still be found at homogeneous sites, such as US-DRA with a R 2 of 0.81 for DHR comparisons. There are several sources that can affect the accuracy of upscaled albedo values. First of all, the accuracy of the generation of the high-resolution albedo values plays an important role in the upscaling process. Secondly, the upscaling coefficient calculated from the tower FoV is accurate for a local area because of the high coherence. If it is applied to a larger area, errors are more likely to be introduced at pixels further away from the tower. This can explain why at some homogeneous sites (e.g., AU-TUM with a R 2 of 0.233 on DHRs) the upscaled albedos appeared to have a poor correlation with coarse-resolution albedos. However, for heterogenous sites, such as US-GCM, a R 2 value larger than 0.5 could be found between the upscaled albedos and coarse-resolution albedos. This suggests that an optimal sample size for maximising this upscaling can be determined, and that this upscaling method can be applied to both homogeneous and heterogenous surfaces.

5. Conclusions

In this study, a new method is introduced which allows the derivation of DHR and BHR values from tower albedometer measurements. This method was applied to derive DHRs and BHRs over 20 tower sites, including both homogeneous and heterogenous land surfaces from the FLUXNET, SURFRAD and BSRN networks between the years 2012 and 2016. The retrieved DHR and BHR values were directly compared with the satellite albedo values, including CGLS, MODIS and MISR retrievals. The MODIS 16-day albedo products show the best agreement with in situ retrievals, whilst the MISR near-simultaneous measurements show a similar good agreement with in situ retrievals for a smaller time-window. The CGLS 30-day products have larger biases than MODIS and MISR products. Overall, the direct intercomparison with tower albedometer derived values shows a better match over the homogeneous sites than the heterogenous sites. The agreement between tower and satellite retrieved DHR values are better than the BHR values. This is because DHRs are only measured at local solar noon, whereas BHRs are derived from measurements at all possible solar zenith angles.
A surface albedo upscaling method, for tower FoV albedos to coarse resolutions, is described. This method employs atmospherically corrected BRFs from high-resolution EO alongside coarse-resolution albedos predicted from a MODIS BRDF climatology over a larger area as inputs. The high-resolution albedo values are retrieved from the MODIS BRDF derived albedo-to-nadir-reflectance ratios. This method was applied to upscale tower measured DHR and BHR values to 1-km resolutions and compared with the CGLS products. These results imply that this surface albedo upscaling strategy can be applied to both homogeneous and heterogenous surfaces if the optimal sample size for optimising this upscaling is known. For example, one of the sites, where 3 × 3 km were compared, shows that the pixel to the north-west of where the tower is located yields a better correlation than the pixel containing the tower, which appears to be associated with the observation that the land cover changes in the south-east. This will be explored in more detail in future.

Supplementary Materials

The following are available online at https://0-www-mdpi-com.brum.beds.ac.uk/2072-4292/11/6/644/s1, Figure S1: CGLS, MODIS and MISR DHR products compared with tower derived DHRs. Figure S2: CGLS, MODIS and MISR BHR compared with tower derived BHRs. Figure S3: Scatter plot of DHR values retrieved from CGLS, MODIS and MISR between 2012 and 2016. Figure S4: Scatter plot of BHR values retrieved from CGLS, MODIS and MISR between 2012 and 2016. Figure S5: Density plot of DHR and BHR upscaled from tower FoV to CGLS resolution over a 20*20 pixel region.

Author Contributions

Conceptualization, J.-P.M. (Jan-Peter Muller); methodology, R.S. (Rui Song), S.K. (Said Kharbouche); software, R.S., S.K.; validation, R.S.; formal analysis, R.S.; investigation, R.S.; resources, J.-P.M.; data curation, J.-P.M.; writing—original draft preparation, R.S.; writing—review and editing, J.-P.M., S.K., and W.W. (William Woodgate); visualization, R.S.; supervision, J.-P.M.; project administration, J.-P.M.; funding acquisition, J.-P.M.

Funding

This research was funded by the European Commission Joint Research Centre grant number [FWC932059], part of the Global Component of the European Union’s Copernicus Land Monitoring Service.

Acknowledgments

This work used JASMIN, the UK’s collaborative data analysis environment http://jasmin.ac.uk. This work has been undertaken using data from the Global Component of the European Union’s Copernicus Land Monitoring Service, European Commission Joint Research Centre FWC [932059]. We would like to thank Nadine Gobron and Christian Lanconelli of JRC Ispra for fruitful discussions. We would like to thank NOAA for access to their datasets through SURFRAD (http://www.esrl.noaa.gov/gmd/grad/surfrad/) and the BSRN (http://bsrn.awi.de) [5] for access to their datasets. This work also used tower albedometer data acquired by the FLUXNET community and in particular by the following networks: AmeriFlux (U.S. Department of Energy, Biological and Environmental Research, Terrestrial Carbon Program (DE-FG02-04ER63917 and DE-FG02-04ER63911), CarboEuropeIP, CarboItaly, CarboMont, OzFlux, USCCC. This study has been undertaken using data from GBOV “Ground Based Observation for Validation” (https://land.copernicus.eu/global/gbov), part of the Global Component of the European Union’s Copernicus Land Monitoring Service. GBOV product developments are managed by ACRI-ST from the research work of University College London, University of Leicester, University of Southampton, University of Valencia and Informus GmbH. We acknowledge the financial support to the tower albedometer data harmonization provided by CarboEuropeIP, FAO-GTOS-TCO, iLEAPS, Max Planck Institute for Biogeochemistry, National Science Foundation, University of Tuscia, Université Laval and Environment Canada and US Department of Energy and the database development and technical support from Berkeley Water Center, Lawrence Berkeley National Laboratory, Microsoft Research eScience, Oak Ridge National Laboratory, University of California-Berkeley, University of Virginia.

Conflicts of Interest

The authors declare no conflict of interest.

Abbreviations

The following abbreviations are used in this manuscript:
AODAerosol Optical Depth
BHRBi-Hemispherical Reflectance
BRFBi-Directional Reflectance Factor
BRDFReflectance Distribution Function
BSRNBaseline Surface Radiation Network
CGLSCopernicus Global Land Service
DHRDirectional Hemispherical Reflectance
EOSEarth Observing System
FCLSFully Constrained Least Squares
FoVField-of-View
FAPARFraction of Absorbed Photosynthetically Active Radiation
HR-EOHigh-Resolution Earth Observation
HJHuanJing
IGBPInternational Geosphere-Biosphere Programme
LAILeaf Area Index
MODISModerate Resolution Imaging Spectroradiometer
MISRMulti-Angle Imaging Spectroradiometer
NIRNear-Infrared
NOAANational Oceanic and Atmospheric Administration
QAQuality Assurance
RTLSRRossThick–LiSparse–Reciprocal
RMSERoot-Mean-Square-Error
SURFRADSurface Radiation Budget Network
UTMUniversal Transverse Mercator

References

  1. Dickinson, R.E. Land surface processes and climate-surface albedos and energy balance. Adv. Geophys. 1983, 25, 305–353. [Google Scholar] [CrossRef]
  2. Harrison, E.F.; Minnis, P.; Barkstrom, B.R.; Gibson, G. Radiation budget at the top of the atmosphere. In Atlas of Satellite Observations Related to Global Change; Gurney, R.J., Foster, J.L., Parkinson, C.L., Eds.; Cambridge University Press: London, UK, 1993; pp. 19–38. [Google Scholar]
  3. Myneni, R.B.; Asrar, G.; Tanre, D.; Choudhury, B.J. Remote sensing of solar radiation absorbed and reflected by vegetated land surfaces. IEEE Trans. Geosci. Remote Sens. 1992, 30, 302–314. [Google Scholar] [CrossRef]
  4. Fritz, S. The Albedo of the Ground and Atmosphere. Bull. Am. Meteorol. Soc. 1948, 29, 303–312. [Google Scholar] [CrossRef]
  5. Driemel, A.; Augustine, J.; Behrens, K.; Colle, S.; Cox, C.; Cuevas-Agulló, E.; Denn, F.M.; Duprat, T.; Fukuda, M.; Grobe, H.; et al. Baseline Surface Radiation Network (BSRN): Structure and data description (1992–2017). Earth Syst. Sci. Data 2018, 10, 1491–1501. [Google Scholar] [CrossRef]
  6. Augustine, J.A.; Hodges, G.B.; Cornwall, C.R.; Michalsky, J.J.; Medina, C.I.; Augustine, J.A.; Hodges, G.B.; Cornwall, C.R.; Michalsky, J.J.; Medina, C.I. An update on SURFRAD--the GCOS Surface Radiation Budget Network for the Continental United States. J. Atmos. Ocean. Technol. 2005, 22, 1460–1472. [Google Scholar] [CrossRef]
  7. Pinty, B.; Szejwach, G. A New Technique for Inferring Surface Albedo from Satellite Observations. J. Appl. Meteorol. Climatol. 1985, 24, 741–750. [Google Scholar] [CrossRef] [Green Version]
  8. Gutman, G. A Simple Method for Estimating Monthly Mean Albedo of Land Surfaces from AVHRR Data. J. Appl. Meteorol. 1988, 27, 973–988. [Google Scholar] [CrossRef]
  9. Csiszar, I.; Gutman, G. Mapping global land surface albedo from NOAA AVHRR. J. Geophys. Res. Solid Earth 1999, 104, 6215–6228. [Google Scholar] [CrossRef] [Green Version]
  10. Liang, S.; Fang, H.; Chen, M.; Shuey, C.J.; Walthall, C.; Daughtry, C.; Morisette, F.; Schaaf, C.; Strahler, A. Validating MODIS land surface reflectance and albedo products: Methods and preliminary results. Remote Sens. Environ. 2002, 83, 149–162. [Google Scholar] [CrossRef]
  11. Cescatti, A.; Marcolla, B.; Vannan, S.K.S.; Pan, J.Y.; Román, M.O.; Yang, X.; Ciais, P.; Cook, R.B.; Law, B.E.; Matteucci, G.; et al. Intercomparison of MODIS albedo retrievals and in situ measurements across the global FLUXNET network. Remote Sens. Environ. 2012, 121, 323–334. [Google Scholar] [CrossRef] [Green Version]
  12. Strahler, A.; Muller, J.-P.; Lucht, W.; Schaaf, C.; Tsang, T.; Gao, F.; Xiaowen, L.; Lewis, P.; Barnsley, M.J. MODIS BRDF Albedo Product Algorithm Theoretical Basis Document Version 5.0. Available online: https://modis.gsfc.nasa.gov/data/atbd/atbd_mod09.pdf (accessed on 12 January 2019).
  13. Lacaze, R.; Smets, B.; Trigo, I.; Calvet, J.C.; Jann, A.; Camacho, F.; Baret, F.; Kidd, R.; Defourny, P.; Tansey, K.; et al. The Copernicus Global Land Service: Present and future. In Proceedings of the EGU General Assembly, Vienna, Austria, 7–12 April 2013. [Google Scholar]
  14. Schaaf, C.B.; Gao, F.; Strahler, A.H.; Lucht, W.; Li, X.W.; Tsang, T.; Strugnell, N.C.; Zhang, X.Y.; Jin, Y.F.; Muller, J.P.; et al. First operational BRDF, albedo nadir reflectance products from MODIS. Remote Sens. Environ. 2002, 83, 135–148. [Google Scholar] [CrossRef] [Green Version]
  15. Martonchik, J.V.; Diner, D.J.; Pinty, B.; Verstraete, M.M.; Myneni, R.B.; Knyazikhin, Y.; Gordon, H.R. Determination of land and ocean reflective, radiative, and biophysical properties using multiangle imaging. IEEE Trans. Geosci. Remote Sens. 1998, 36, 1266–1281. [Google Scholar] [CrossRef] [Green Version]
  16. NOAA. SURFRAD Overview: Surface Radiation Budget Monitoring. 2017. Available online: https://www.esrl.noaa.gov/gmd/grad/surfrad/overview.html (accessed on 1 September 2018).
  17. Diner, D.J.; Beckert, J.C.; Reilly, T.H.; Bruegge, C.J.; Conel, J.E.; Kahn, R.A.; Martonchik, J.V.; Ackerman, T.P.; Davies, R.; Gerstl, S.A.; et al. Multi-angle Imaging SpectroRadiometer (MISR) instrument description and experiment overview. IEEE Trans. Geosci. Remote Sens. 1998, 36, 1072–1087. [Google Scholar] [CrossRef]
  18. Liang, S. Narrowband to broadband conversions of land surface albedo: I Algorithms. Remote Sens. Environ. 2000, 76, 213–238. [Google Scholar] [CrossRef]
  19. Schaepman-Strub, G.; Schaepman, M.E.; Painter, T.H.; Dangel, S.; Martonchik, J.V. Reflectance quantities in optical remote sensing—definitions and case studies. Remote Sens. Environ. 2006, 103, 27–42. [Google Scholar] [CrossRef]
  20. Lucht, W.; Schaaf, C.B.; Strahler, A.H. An algorithm for the retrieval of albedo from space using semiempirical BRDF models. IEEE Trans. Geosci. Remote Sens. 2000, 38, 977–998. [Google Scholar] [CrossRef]
  21. Román, M.O.; Gatebe, C.K.; Shuai, Y.M.; Wang, Z.S.; Gao, F.; Masek, J.G.; He, T.; Liang, S.L.; Schaaf, C.B. Use of in situ and airborne multiangle data to assess MODIS- and Landsat-based estimates of directional reflectance and albedo. IEEE Trans. Geosci. Remote Sens. 2013, 51, 1393–1404. [Google Scholar] [CrossRef]
  22. Muller, J.-P. GlobAlbedo Final Product Validation Report 2012. Available online: http://www.globalbedo.org/docs/GlobAlbedo_FVR_V1_2_web.pdf (accessed on 10 January 2019).
  23. Mousavi Maleki, S.A.; Hizam, H.; Gomes, C. Estimation of Hourly, Daily and Monthly Global Solar Radiation on Inclined Surfaces: Models Re-Visited. Energies 2017, 10, 134. [Google Scholar] [CrossRef]
  24. Wu, X.D.; Wen, J.G.; Xiao, Q.; Liu, Q.; Peng, J.J.; Dou, B.C.; Li, X.H.; You, D.Q.; Tang, Y.; Liu, Q.H. Coarse scale in situ albedo observations over heterogeneous snow-free land surfaces and validation strategy: A case of MODIS albedo products preliminary validation over northern China. Remote Sens. Environ. 2016, 184, 25–39. [Google Scholar] [CrossRef]
  25. Liang, S. A direct algorithm for estimating land surface broadband albedos from MODIS imagery. IEEE Trans. Geosci. Remote Sens. 2003, 41, 136–145. [Google Scholar] [CrossRef] [Green Version]
  26. Qu, Y.; Liang, S.; Liu, Q.; He, T.; Liu, S.; Li, X. Mapping surface broadband albedo from satellite observations: A review of literatures on algorithms and products. Remote Sens. 2015, 7, 990–1020. [Google Scholar] [CrossRef]
  27. Shuai, Y.; Masek, J.G.; Gao, F.; Schaaf, C.B. An algorithm for the retrieval of 30-m snow-free albedo from Landsat surface reflectance and MODIS BRDF. Remote Sens. Environ. 2011, 115, 2204–2216. [Google Scholar] [CrossRef]
  28. Muller, J.P.; Lopez-Saldana, G.; Kharbouche, S.; Danne, O.; Lattanzio, A.; Schulz, J.; Lewis, P. Optimal estimation for the retrieval of traceable and validated albedo: Lessons learnt from the ESA-GlobAlbedo and EU-QA4ECV projects. 2019; in preparation. [Google Scholar]
  29. Winter, M.E. N-FINDR: An algorithm for fast autonomous spectral end-member determination in hyperspectral data. In Proceedings of the SPIE 3753, Imaging Spectrometry V, Denver, CO, USA, 27 October 1999. [Google Scholar] [CrossRef]
  30. Heinz, D.; Chang, C.-I.; Althouse, M.L.G. Fully constrained least-squares based linear unmixing hyperspectral image classification. In Proceedings of the IEEE 1999 International Geoscience and Remote Sensing Symposium, Hamburg, Germany, 28 June–2 July 1999; pp. 1401–1403. [Google Scholar] [CrossRef]
  31. Adams, J.; Gobron, N.; Widlowski, J.-L.; Mio, C. A model-based framework for the quality assessment of surface albedo in situ measurement protocols. J. Quant. Spectrosc. Radiat. Transf. 2016, 180, 126–146. [Google Scholar] [CrossRef] [Green Version]
  32. Michalsky, J.J.; Harrison, L.C.; Berkheiser, W.E. Cosine response characteristics of some radiometric and photometric sensors. Sol. Energy 1995, 54, 397–402. [Google Scholar] [CrossRef]
  33. Román, M.O.; Schaaf, C.B.; Lewis, P.; Gao, F.; Anderson, G.P.; Privette, J.L.; Strahler, A.H.; Woodcock, C.E.; Barnsley, M. Assessing the coupling between surface albedo derived from MODIS and the fraction of diffuse skylight over spatially-characterized landscapes. Remote Sens. Environ. 2010, 114, 738–760. [Google Scholar] [CrossRef]
Figure 1. Geographical distribution of selected sites (Google Earth).
Remotesensing 11 00644 g001
Figure 2. Flowchart illustrating the algorithm for retrieving directional hemispherical reflectance (DHR) and bi-hemispherical reflectance (BHR) from tower measurements. β B and β D represent the threshold of the diffuse ratio for filtering BHR and DHR, respectively. σ represents the standard deviation of the calculated BHR and DHR values. S W i n , S W o u t and S W d i f represent the downwelling total, upwelling total and downwelling diffuse shortwave radiation, respectively.
Remotesensing 11 00644 g002
Figure 3. An example of processed FLUXNET Tumbarumba tower data showing the steps in the production of in situ DHRs.
Remotesensing 11 00644 g003
Figure 4. A sample of processed FLUXNET Tumbarumba tower data for producing in situ BHRs.
Remotesensing 11 00644 g004
Figure 5. Processing chain for calculating high-resolution albedo from Landsat BRFs and MODIS BRDFs.
Remotesensing 11 00644 g005
Figure 6. Steps of upscaling high-resolution albedo to coarse-resolution pixel size. The process of calculating high-resolution EO shortwave albedo is illustrated in Figure 5.
Remotesensing 11 00644 g006
Figure 7. CGLS (column 1), MODIS (column 2) and MISR (column 3) DHR products compared with tower derived DHRs at the Tumbarumba, Fort Peck and Barrow sites.
Remotesensing 11 00644 g007
Figure 8. CGLS (column 1), MODIS (column 2) and MISR (column 3) BHR products compared with tower derived BHRs at the Tumbarumba, Fort Peck and Barrow sites.
Remotesensing 11 00644 g008
Figure 9. Scatterplots for DHRs from CGLS, MODIS and MISR. All the data are summarised from all the results from 2012-01-01 to 2016-12-31 for all four selected sites. The blue, green and red lines indicate CGLS, MODIS and MISR DHR products. The central solid lines are 1:1 lines (perfect correlation), and the outer dashed lines are 0.025 offset dashed lines.
Remotesensing 11 00644 g009
Figure 10. Scatterplots for BHRs from CGLS, MODIS, and MISR. The data are summarised from all the results from 2012-01-01 to 2016-12-31. The blue, green and red lines indicate CGLS, MODIS and MISR BHR products. The central solid lines are 1:1 lines, and the outer dashed lines are 0.025 offset dashed lines.
Remotesensing 11 00644 g010
Figure 11. Density plot of DHR upscaled from tower FoV to CGLS resolution over a 20 × 20 CGLS pixel region.
Remotesensing 11 00644 g011
Figure 12. Density plot of BHR upscaled from tower FoV to CGLS resolution over a 20 × 20 CGLS pixel region.
Remotesensing 11 00644 g012aRemotesensing 11 00644 g012b
Table 1. List of tower sites with key characteristics: acronyms, geographical coordinates, network, footprint (see Equation (12)) and land cover type, defined by International Geosphere-Biosphere Programme (IGBP). Station names in bold are those whose results are shown below.
StationAcronymLatitude (°)Longitude (°)NetworkFootprintLand Classification (IGBP)
Barrow **US-BRW71.323−156.607BSRN (http://bsrn.awi.de)51 mSnow and Ice
Niwot Ridge #US-NR140.033−105.546FLUXNET (https://FLUXNET.ornl.gov)158 mEvergreen Needleleaf
Sioux FallsUS-SXF43.730−96.620SURFRAD (https://www.esrl.noaa.gov/gmd/grad/surfrad/)126 mCroplands
ARM Southern Great PlainsUS-ARM36.606−97.489FLUXNET25 mCroplands
BondvilleUS-BON40.052−88.373SURFRAD126 mCroplands
Boulder atmospheric observatory *US-BAO40.050−105.004BSRN3788 mCropland Mosaics
Desert Rock *US-DRA36.624−116.019SURFRAD126 mOpen Shrublands
Fort Peck *US-FPK48.308−105.102SURFRAD126 mGrasslands
Goodwin CreekUS-GCM34.255−89.873SURFRAD126 mDeciduous Broadleaf
Penn StateUS-PSU40.720−77.931SURFRAD126 mDeciduous Broadleaf
Table Mountain *US-TBL40.125−105.237SURFRAD126 mBare soil and Rocks
Gebesee *DE-GEB51.10010.914FLUXNET76 mCroplands
Hainich *DE-HAI51.07010.450FLUXNET265 mMixed Forest
GrignonFR-GRI48.8441.952FLUXNET67 mCroplands
Guyaflux *#GF-GUY5.279−52.925FLUXNET290 mEvergreen Broadleaf
BrasschaatBE-BRA51.3094.521FLUXNET240 mMixed Forest
RenonIT-REN46.58711.434FLUXNET152 mEvergreen Needleleaf
Tumbarumba *AU-Tum−35.657148.152FLUXNET505 mEvergreen Broadleaf
Calperum #AU-CPR−34.003140.588FLUXNET215 mClosed Shrublands
South Pole *SPO−9059BSRN25 mSnow and ice
Sites marked with * are claimed to be spatially representative, which is sometimes referred to as homogeneous by [11]. ** US-BRW is spatially representative during snow covered periods, but heterogeneous during the snow melt season. N.B. The three sites marked with # do not have diffuse radiation measurements, so the method introduced in Section 2.3.1 is used to estimate diffuse radiation [23].

