Article

An Overview of the Science Performances and Calibration/Validation of Joint Polar Satellite System Operational Products

1
NOAA/NESDIS Center for Satellite Applications and Research (STAR), College Park, MD 20740, USA
2
IM Systems Group, 3206 Tower Oaks, Rockville, MD 20852, USA
3
NOAA JPSS Program Office, Lanham, MD 20706, USA
*
Author to whom correspondence should be addressed.
Submission received: 4 February 2019 / Revised: 8 March 2019 / Accepted: 18 March 2019 / Published: 22 March 2019
(This article belongs to the Collection Visible Infrared Imaging Radiometers and Applications)

Abstract

:
The Suomi National Polar-orbiting Partnership (S-NPP) satellite, launched in October 2011, initiated a series of the next-generation weather satellites for the National Oceanic and Atmospheric Administration (NOAA) Joint Polar Satellite System (JPSS) program. The JPSS program at the Center for Satellite Applications and Research (JSTAR) leads the development of the algorithms, the calibration and validation of the products to meet the specified requirements, and long-term science performance monitoring and maintenance. All of the S-NPP products have been validated and are in successful operation. The recently launched JPSS-1 (renamed as NOAA-20) satellite is producing high-quality data products that have been available from S-NPP, along with additional products, as a direct result of the instrument upgrades and science improvements. This paper presents an overview of the JPSS product suite, the performance metrics achieved for the S-NPP, and the utilization of the products by NOAA stakeholders and user agencies worldwide. The status of NOAA-20 science data products and ongoing calibration/validation (Cal/Val) efforts are discussed for user awareness. In addition, operational implementation statuses of JPSS enterprise (multisensor and multiplatform) science algorithms for product generation and science product reprocessing efforts for the S-NPP mission are discussed.

Graphical Abstract

1. Introduction

The Joint Polar Satellite System (JPSS) is the National Oceanic and Atmospheric Administration’s (NOAA) operational program that provides continuity of global environmental data from multiple polar-orbiting satellites. The Suomi National Polar-orbiting Partnership (S-NPP) satellite, launched in October 2011, was the first JPSS satellite and serves as the predecessor to the JPSS-1 satellite (renamed as NOAA-20 after being handed over to NOAA for operations). NOAA-20 was launched on 18 November 2017. The S-NPP satellite, orbiting in a 1:30 AM/PM polar orbit, has been extremely successful in operations for the last seven years and has produced an array of high-quality products in the areas of atmospheric, land, ocean, and cryosphere data products. These products are built on measurements from five major instruments: the Visible Infrared Imaging Radiometer Suite (VIIRS), the Cross-track Infrared Sounder (CrIS), the Advanced Technology Microwave Sounder (ATMS), the Ozone Mapping and Profiler Suite (OMPS) and Clouds and the Earth’s Radiant Energy System [1]. The NOAA-20 satellite is also in 1:30AM/PM orbit with a 50-min separation from the S-NPP orbit. NOAA-20 features five similar instrument complements currently operating on S-NPP and provides continuity for the high-quality data products along with additional products as a direct result of instrument upgrades and science improvements. The JPSS-2 and the Polar Follow-On (PFO) satellites (JPSS-3, JPSS-4) will continue to host similar instrument complements for consistent long-term science products. The JPSS program also supplements these datasets with long-term agreements with the European Organisation for the Exploitation of Meteorological Satellites (EUMETSAT), the Japan Aerospace Exploration Agency (JAXA), and other international agencies to provide increased temporal and spatial coverages and types of satellite products. The JPSS constellation of polar-orbiting satellites provides a diverse set of ultraviolet (UV), visible and near infrared (VIS/NIR), infrared (IR), and microwave (MW) sensors, as well as essential observations for many important applications for operational weather forecasting, environmental monitoring, and climate research.
The JPSS program at the center for SaTellite Applications and Research (JSTAR) led the development and calibration/validation (Cal/Val) of JPSS science algorithms to generate a vast number of products [2], which are operationally available to NOAA stakeholders and users worldwide through NOAA Product Distribution and Access (PDA), Comprehensive Large Array-data Stewardship System (CLASS, [3]), and Direct Broadcast (DB), respectively. JSTAR includes a large team of scientists and engineers from government, academia, and industry. Details on the JPSS algorithms, performance, team leads and members, and data product access are available at the JSTAR website [4].
The S-NPP products served as a gateway to introduce algorithm upgrades and mitigations during the pre-launch phase of NOAA-20. As a result of the lessons learned through S-NPP product operationalization, and based on pre-launch characterization of the NOAA-20 instruments, the JSTAR teams developed necessary algorithm upgrades and mitigations to ensure NOAA-20 data product readiness. The JSTAR teams also developed the NOAA-20 Cal/Val plans for use during the Early Orbit Checkout (EOC), Intensive Cal/Val (ICV) and Long-Term Monitoring (LTM) phases for the NOAA-20 data products. The Integrated Calibration and Validation System (ICVS) and the Long-Term Monitoring System (LTM) developed for S-NPP have been augmented on NOAA-20 for spacecraft/sensor health and satellite product display/monitoring. The JSTAR teams are currently focusing on NOAA-20 data product Cal/Val and performance evaluation. The generation and dissemination of the NOAA-20 satellite products follow the same protocols as the S-NPP.
One of the major strengths of polar-orbiting satellites is the collection of global observations needed for the Numerical Weather Prediction (NWP) assimilation worldwide. CrIS and ATMS observations are assimilated into NWP models on a routine basis and have been found to improve 5–7 day forecasts and hurricane track predictions [1]. In fact, 85% of all data assimilated into forecast models are from infrared and microwave sounders on polar orbiting satellites contributing to about 60% of forecast error reduction [5,6]. The availability of two down-link stations (Svalbard and McMurdo) for NOAA-20 coupled with the implementation of Community Satellite Processing Packages (CSPP, [7]) implemented at the DB network of stations enables improved latency for many real-time applications [8]. The S-NPP and NOAA-20 satellite data products have been proven to be invaluable over the data-sparse polar regions [9]. To complement these data products, the JPSS Program Science Office has established the Proving Ground and Risk Reduction (PGRR) Program [10] initiatives to address data needs for near-real-time (NRT) applications and retrospective evaluations across NOAA line offices and other user agencies. The JSTAR teams have developed plans for an enterprise algorithms approach for S-NPP and NOAA-20, as well as future mission data processing. Enterprise algorithms use the same scientific methodology and software base to create the same classification of product from differing input data (e.g., satellite, in situ, ancillary) [11]. The teams have also made significant progress in the mission-long reprocessing of S-NPP data products generated using the most mature algorithms to achieve long-term consistency of data product quality.
In this paper, we present an overview of the JPSS product suite, its validation results for the SNPP products and science applications. We briefly introduce the status of NOAA-20 science products and ongoing Cal/Val efforts. In addition, the operational implementation statuses of JPSS enterprise science algorithms for product generation and science product reprocessing efforts for the S-NPP mission are discussed.

2. Science Data Products, Calibration/Validation, and Algorithm Management

2.1. Science Data Products

The JPSS data products include Temperature Data Records (TDRs), Sensor Data Records (SDRs), and Environmental Data Records (EDRs). Raw Data Records (RDRs) refer to the raw data generated by the sensors on the satellites. Science algorithms that perform calibration and geo-location are applied on the RDRs to produce geo-located, radiometrically and spectrally calibrated radiances (or reflectance) with annotated quality indicators to generate SDRs and TDRs. EDRs are geophysical parameters that are derived by applying retrieval algorithms to the SDRs. EDRs provide global measurements of quantities, such as temperature and moisture profiles, ozone and trace gases, aerosols, clouds, wind speeds, land surface properties, snow and ice cover, sea surface temperature, ocean color, and other products.
Figure 1 shows a list of the JPSS TDR, SDR, and EDR operational products (hereafter referred to as xDRs). The NESDIS operational EDR products derived from Global Change Observation Mission-Water (GCOM-W)/JAXA are also part of the JPSS product suite. Based on the utility of these science data products by customers and user community, ATMS TDRs, CrIS SDRs, and some of the VIIRS imagery EDRs are prioritized as Key Performance Parameters (KPPs). The remaining are prioritized as priority 2, 3, and 4 products. Documents, such as the Algorithm Theoretical Basis Documents (ATBDs), Cal/Val Plans, algorithm requirements and status documents, user guides and other science documents related to all of the SDR/EDR products are available at the JSTAR website [4]. The SDRs and imagery EDR products identified as Mission Unique Products are produced at the Interface Data Processing Segment (IDPS). The other EDRs are produced at the NOAA Data Exploitation (NDE) using enterprise algorithms.

2.2. Science Data Products Calibration and Validation (Cal/Val)

For each JPSS satellite mission (S-NPP, NOAA-20, and future missions), the JSTAR SDR/EDR Cal/Val activities are planned and executed for all Cal/Val phases: pre-launch, EOC, ICV, and LTM [2]. The major objective is to evaluate and ensure that the operational SDR/EDRs meet Beta, Provisional, and Validated maturity requirements [4]. Beta maturity designates an early release product that is minimally validated and may have significant errors. The beta product is made available to users to gain familiarity with the data format. Provisional maturity indicates that the product is deemed ready for operational evaluation. Versioning control commences as the product continues to undergo improvements, and user participation in quality assurance is encouraged. Validated maturity occurs when the product performance is well-defined over a range of representative conditions using a widely distributed set of statistically robust independent measurements (from many locations and time periods) representing global conditions. Each product’s Cal/Val maturity is determined by validating the algorithm’s performance with truth data sets and comparing the performance with the requirements. Details of various Cal/Val tasks for each xDR product, as well as the roles and responsibilities of team members are discussed in xDR-specific Cal/Val plan documents [4].
Product validation maturity reviews are performed by review panels comprised of JPSS Program and Project Scientists, NOAA customers (National Weather Service, NWS; National Ocean Service, NOS; National Marine Fisheries Service, NMFS; Office of Oceanic and Atmospheric Research, OAR), external users, Low-earth Orbiting Working Group (LORWG) advisors, product development managers, and the JSTAR program manager. Following the Cal/Val maturity science reviews presented by the Cal/Val teams, the review board assesses the product performance, makes an overall assessment of each algorithm, and approves the maturity status according to the criteria for Beta, Provisional, and Validated Maturity. Currently, most S-NPP data products have passed the Cal/Val validation maturity stage, and are in the LTM phase. The NOAA-20 data products are progressing through the Cal/Val maturity according to the Cal/Val plans.
The next section provides comprehensive details of the S-NPP product performance. The preliminary results of NOAA-20 product performance are discussed in Section 4.

3. Science Data Product Performance

The JSTAR science teams have performed Cal/Val for the S-NPP SDR and EDR products from the four major instruments: VIIRS, CrIS, ATMS, and OMPS. The Cal/Val efforts validating these products have been published as a compendium of scientific papers by the Journal of Geophysical Research [12] and as individual publications [13,14,15,16,17]. The wide variety of EDR products generated from the S-NPP sensor suite have passed Validated maturity stage and have been proven to be very useful for many atmosphere, land, ocean, and cryosphere applications. Most of the S-NPP EDR products have also been migrated to enterprise algorithms and many of them are in operation at NDE. The following sub-sections provide details of the S-NPP product performance evaluations and science applications for each of the four S-NPP instruments. Product performance summarized in the tables are compiled from the S-NPP/NOAA-20 product maturity review presentations, or from past years’ STAR JPSS Annual Science Meeting presentations. These presentations are available online at the JSTAR website [4].

3.1. The Visible Infrared Imaging Radiometer Suite (VIIRS) Instrument and Science Data Products

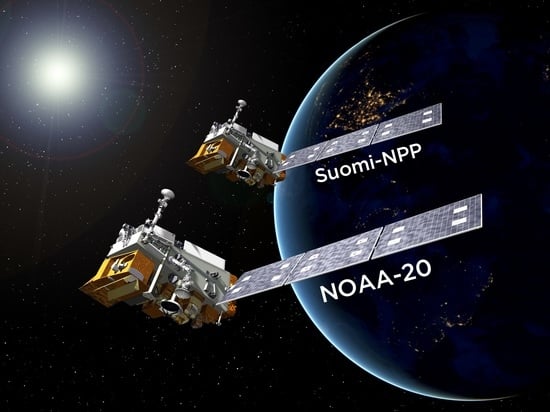
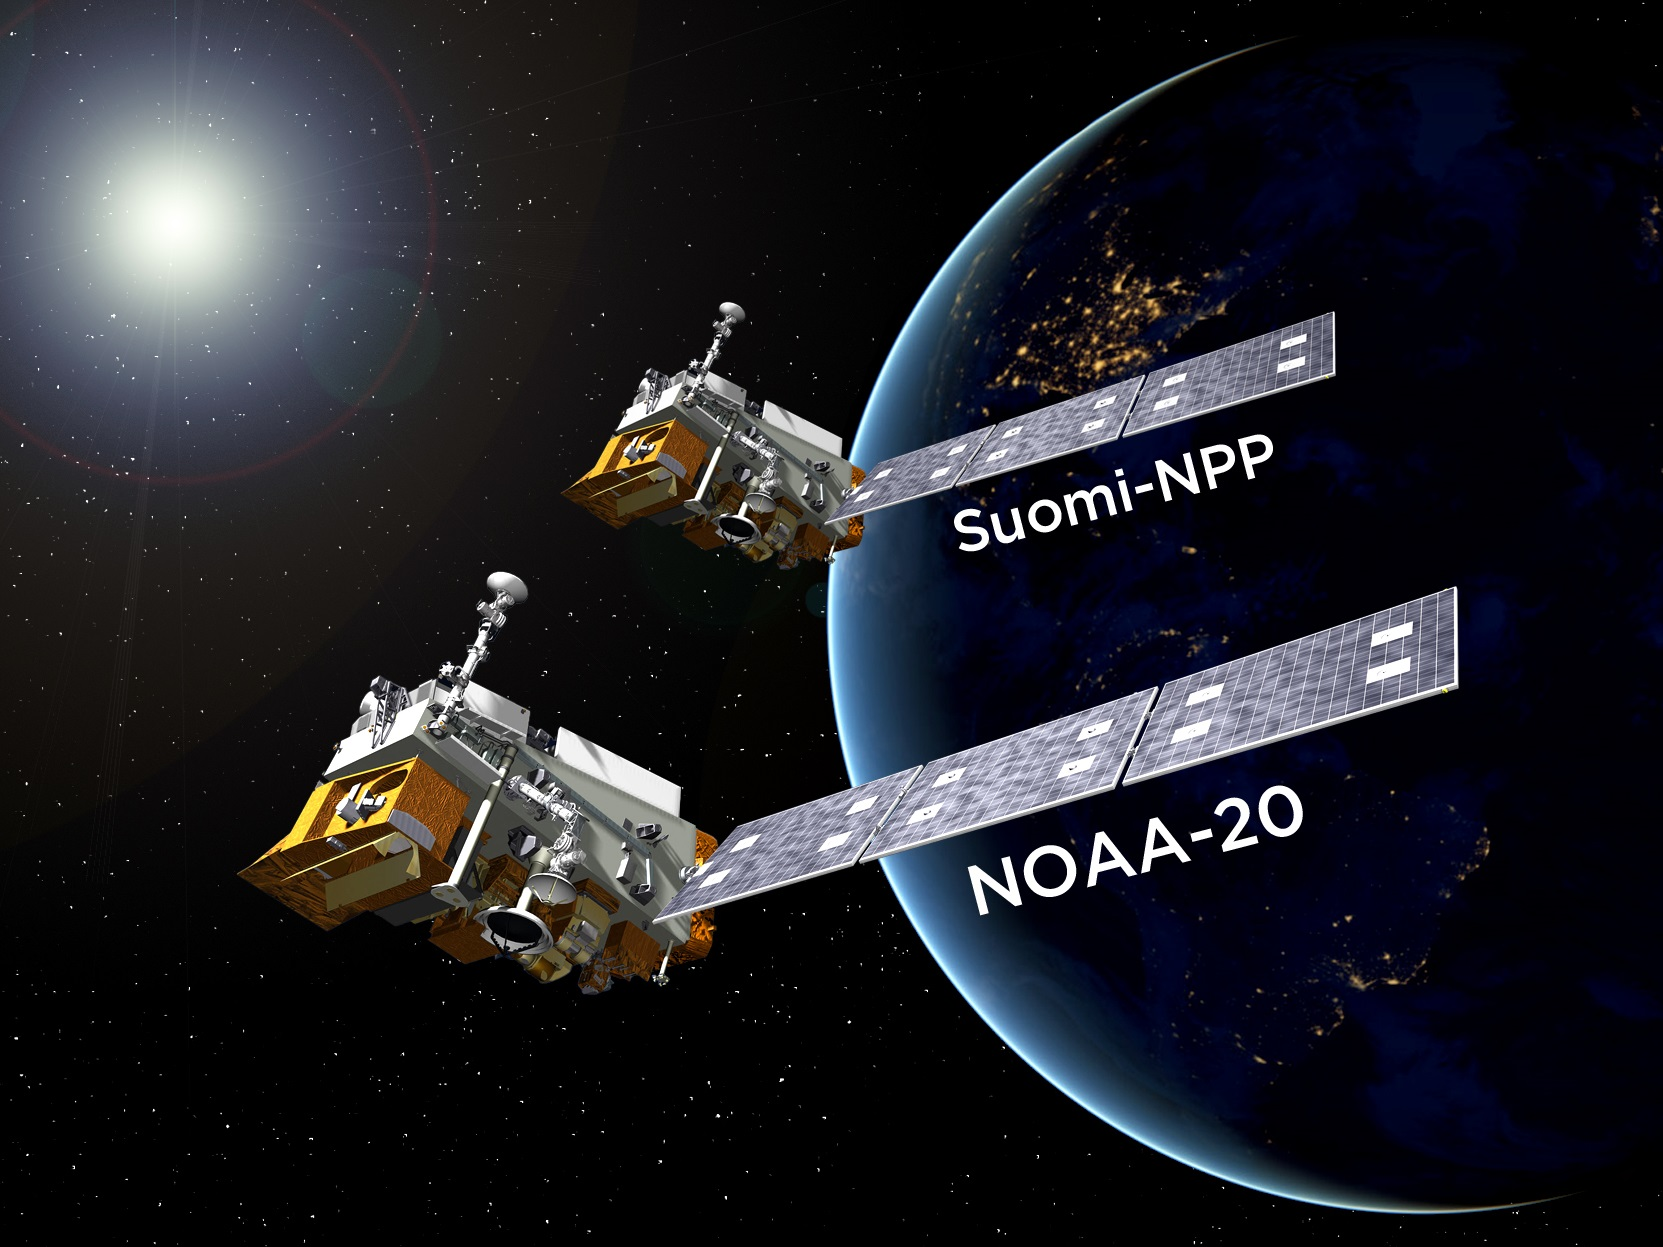
The VIIRS instrument onboard the S-NPP/NOAA-20 satellites has transitioned much of the capability of the experimental MODerate Resolution Imaging Spectroradiometer (MODIS) instrument into the operational domain. The instrument offers a total of 21 (plus one Day Night Band, DNB [18]) bands with similar central wavelengths to MODIS [19] and similar radiometric accuracy [20,21,22]. The VIIRS instrument also provides better spatial resolution (375 m for the Imaging-resolution or I-band and 750 m for Moderate-resolution or M-bands at nadir) and reduced variation over the 3000-km-wide swath. Furthermore, the availability of the DNB offers a wide variety of applications [23,24] and makes the VIIRS JPSS products vital for long-term continuity with greater operational utility.
The S-NPP VIIRS instrument produces more than 20 EDR products and most of the data products have been validated with various truth data sets and the product performances have been verified with the Level-1 Requirement Document Supplement (L1RDS, [25]) requirements for progression through the Beta, Provisional, and Validated Maturity stages. Table 1 summarizes the S-NPP VIIRS SDR performance in meeting the Accuracy, Precision, and Uncertainty (APU) specifications [14,21,26,27]. A compendium of scientific papers published by the Remote Sensing journal (edited by Changyong Cao, [28]) provides complete details of the VIIRS science data products and Cal/Val assessments.
The VIIRS SDRs and imagery EDR products designated as KPPs have been vital to the success of the S-NPP/NOAA-20 missions. The imagery EDR products are comprised of five Imaging-resolution or I-band (375 m resolution) products, six Moderate-resolution or M-band (750 m resolution) products, and Near Constant Contrast (NCC) Imagery derived at 750 m resolution from the DNB sensor [29]. The Alaska region and other high-latitude regions benefit from overlapping swaths from adjacent orbits, which enables the derivation of polar winds products and many cryosphere product composites. VIIRS imagery applications in meteorological operations over the Alaska region are discussed in detail by Don Hillger et al. [9]. In addition to the high-latitude applications, the VIIRS imagery products are being used for nowcasting of severe weather, such as hurricanes and blizzards days in advance and for assessing environmental hazards, such as droughts, floods, forest fires, poor air quality, and harmful coastal waters [30]. 
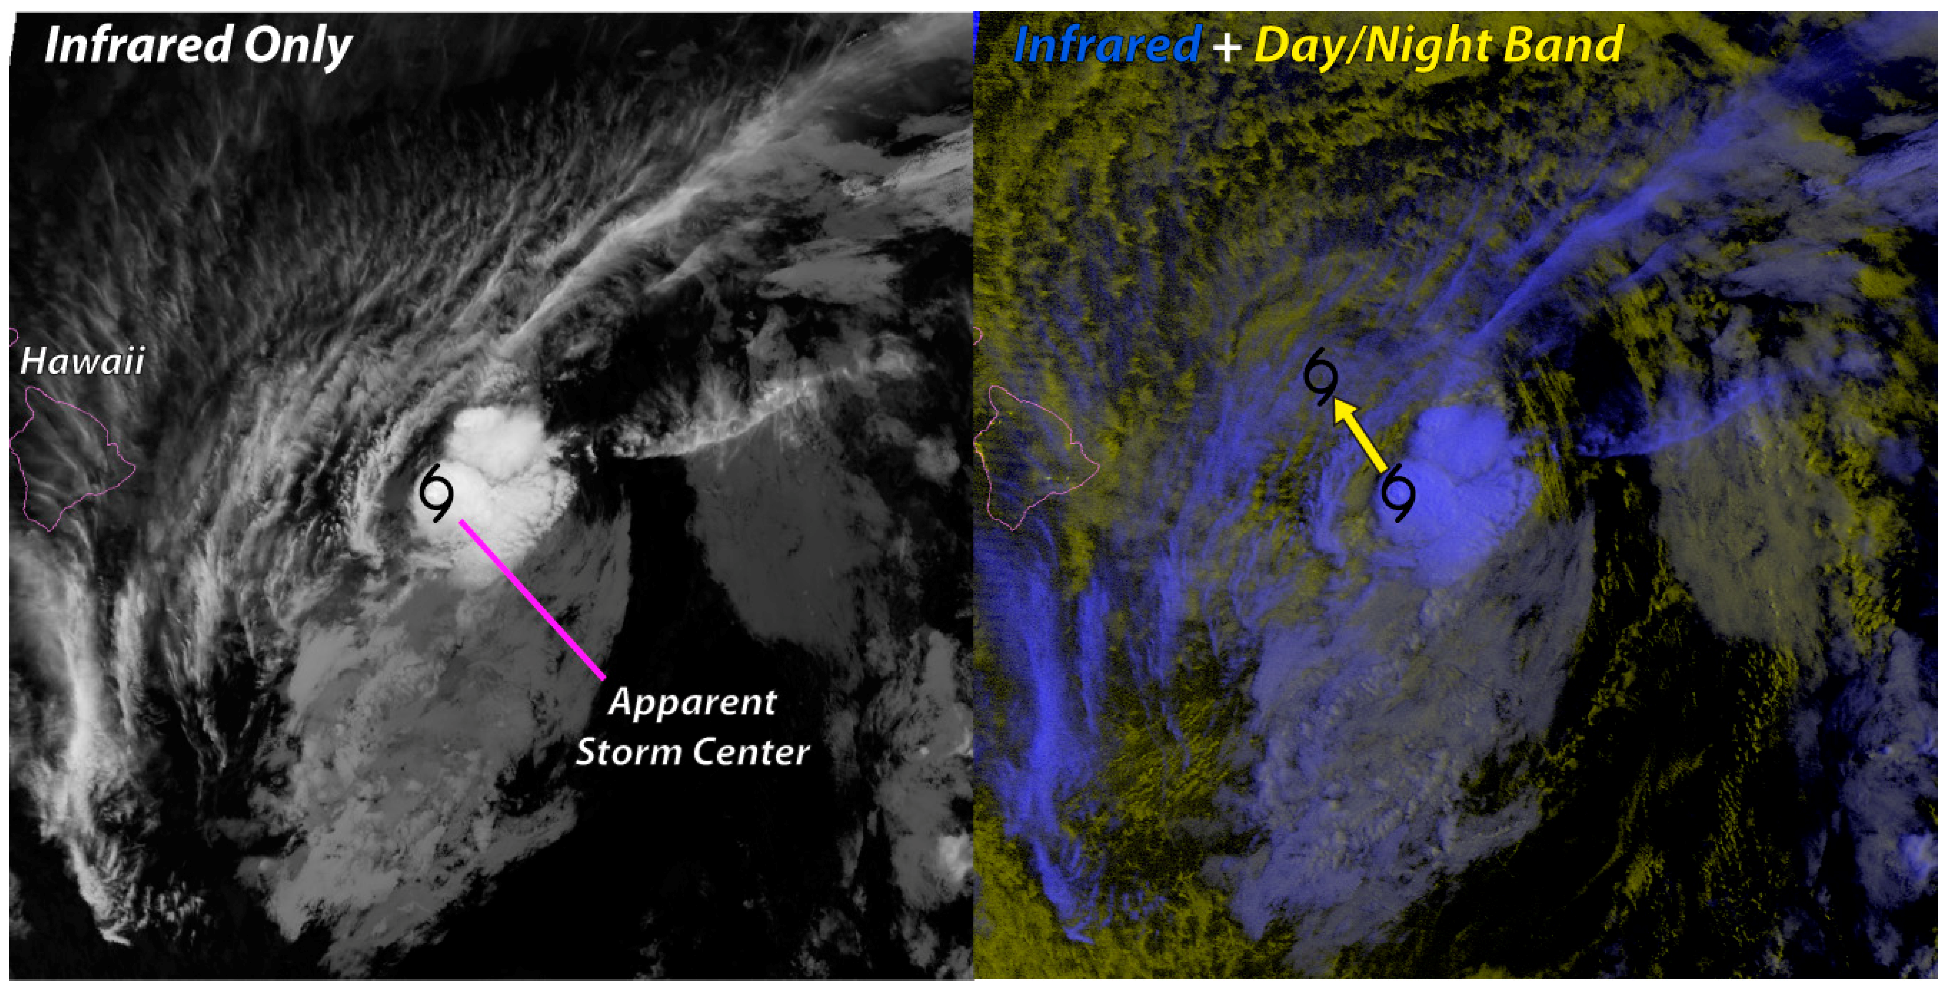
Figure 2 shows the VIIRS imagery product and combined use of the infrared and Day/Night band imageries. Moonlight provides a means of peering through cirrus clouds, which are optically thin at visible light wavelengths. This enabled the VIIRS Day/Night band to detect low cloud structures that revealed the true center of low-level circulation associated with Hurricane Flossie. The DNB has been proved to be useful for many applications including tropical cyclone analysis and forecasting, night fire products, nighttime aerosol retrievals, mapping of city lights/power outage detection, boat detections, and detection of airglow gravity waves, among other events [31,32,33,34,35,36].
In addition to the EDR imagery products, the VIIRS product suite contains a wide variety of geophysical products (i.e., EDRs), include those for atmosphere (e.g., aerosol optical thickness, AOT; aerosol detection products, ADP), land (e.g., variety of vegetation indices, VI; green vegetation fraction, GVF; land surface temperature, LST), ocean (e.g., sea surface temperature, SST; ocean color, OC), and cryosphere (e.g., ice surface temperature, IST; sea ice thickness, concentration; snow fraction, polar winds). Many of these products use the enterprise VIIRS cloud mask (ECM), which is based on heritage from the Advanced Very High Resolution Radiometer (AVHRR) Pathfinder Atmospheres Extended (PATMOS-x) and naïve Bayesian approach [37,38]. The ECM has been applied to multiple sensors (e.g., AVHRR, Geostationary Operational Environment Satellite, GOES-16 Advanced Baseline Imager, ABI), and the cloud products have been tested against the Cloud-Aerosol LiDAR and Infrared Pathfinder Satellite Observation (CALIPSO) and MODIS cloud mask (MYD25) products [39,40]. The primary output from the ECM is cloud probability, along with a 4-level cloud mask derived solely from the cloud probability. In addition, the enterprise cloud algorithm uses a set of seven algorithms to produce a full suite of cloud products, such as cloud phase/type, cloud top/base height, cloud top temperature, cloud top pressure, cloud optical depths, particle sizes, and cloud water path. The VIIRS ECM cloud products are provided to NWS Aviation Weather Center for global monitoring of aviation hazards [41]. NOAA OAR uses the cloud-product information for model verification over Polar Regions, and cloud height information is used in deriving polar atmospheric motion vectors [42,43]. The ECM and cloud height are used in resolving some of the artifacts in the CrIS clear radiance for NWP data assimilations [42,44]. Figure 3 shows an example of the VIIRS daytime cloud-mask derived from the NOAA enterprise cloud product algorithm. The enterprise cloud products performances are provided in Table 2, Table 3, and Table 4.
A suite of land products (e.g., surface reflectance, VIIRS vegetation, surface albedo, land surface temperature, surface type, and active fire products) is derived from the VIIRS instrument channels. These products are used for a wide variety of applications, including land use management and monitoring, ecosystem dynamics, atmospheric chemistry, human health, biomass burning emissions, operational air quality forecasting, etc. [45,46,47]. All S-NPP land products have met the maturity requirements (Table 5) and have been declared validated, and many have been transitioned to enterprise algorithms for NDE operations.
Figure 4 gives a glimpse into the NDE enterprise Vegetation Product Suite (NVPS), which includes a variety of VI products and the GVF product. The GVF product is used for monitoring drought, vegetation health monitoring, crop conditions, and global food supply and demand [47]. The VIIRS VI products consist of the Normalized Difference Vegetation Index (NDVI) derived from top-of-the-atmosphere (TOA) reflectances and the Enhanced Vegetation Index (EVI) derived from atmospherically corrected, top-of-canopy (TOC) reflectances, NDVI from TOC reflectances (an additional product from NOAA-20) [48]. The VIIRS VI and GVF algorithm performance has been evaluated using MODIS products, along with 35 Flux Tower sites providing in situ data from Earth Observing System (EOS) Land Validation Core sites. The GVF products have been validated with the EOS data sets and Google Earth derived GVF [49]. Other land products are at various stages of operational use in weather and climate forecasting systems (e.g., VIIRS GVF, GCOM Soil Moisture in National Center for Environmental Prediction (NCEP) Land and Coupled Models, and High-Resolution Rapid Refresh, HRRR models) and are used in crop forecasts generated by the United States Department of Agriculture (USDA, e.g., Vegetation Health and GCOM Soil Moisture in the US Drought Monitor). The main requirement by the end users (e.g., Land Hydrology group) is to have consistent sets of land products delivered on the same grid resolution (e.g., 1 km). Currently, the land product teams are finalizing the technical details of a land product global gridding system that uses pixel-level granule products and produces a consistent set of global gridded products at 1 km spatial resolution.
A wide variety of ocean data products are derived from the VIIRS instrument. Figure 5 and Figure 6 show two important ocean EDR products, the SST and the ocean color chlorophyll-a (OCC). The SST product is derived using the Advanced Clear-Sky Processor for Ocean (ACSPO) SST algorithm [35,50,51]. The algorithm, a regression algorithm trained with in situ measurements, uses separate sets of VIIRS channels for day and night and retrieves SST at every cloud-free VIIRS pixel. The algorithm produces consistent products from the S-NPP VIIRS, the GOES instruments, as well as NOAA-20 and GOES-16 for many real-time applications. The team also produces a gridded product by mapping the SST EDR product into equal 0.02° grid boxes. The gridded SST product shows comparable performance with SST EDRs, and the product is used by several major international NWP centers. As shown in Figure 5, the SST produced from GOES-16 (on the left panel) and from SNPP (on the right panel) using the same ACSPO algorithm show consistent features between the two satellite platforms. Whereas the higher temporal resolution of GOES-16 allows better coverage of SST for low and middle latitude, the S-NPP allows global coverage including Polar Regions and higher spatial resolution. In addition to using JPSS and GOES observations, the ACSPO system also brings in non-NOAA satellite SST products to produce global 5 km blended SST products benefitting from both the higher spatial resolutions of polar satellite data and the higher temporal resolution of geostationary satellite data [52].
The VIIRS Ocean Color (OC) products are generated using the NOAA Multi-Sensor Level 1 to Level 2 (MSL12) processing system [53,54] for both near real-time applications and for science quality applications [55] for incorporation into longer time series needs such as the integrated ecosystem approach for fisheries management applications [56]. The Ocean Color products from JPSS VIIRS are also reprocessed for the best quality mission-long S-NPP OC products to benefit the users worldwide. Figure 6 shows a five-year climatology of the global distribution of the chlorophyll derived from the reprocessed OC products. Applications of JPSS ocean data products include the use of VIIRS SST products for coral reef watch anomalies, hotspots, and bleaching area alerts [57], and many of these products are distributed through the CoastWatch, OceanWatch, and PolarWatch portals [52,58]. All S-NPP ocean data products have reached validated maturity and Table 6 shows the APU specifications for these products.
The VIIRS Atmospheric composition products include aerosol products, namely, (1) the aerosol optical depth (or aerosol optical thickness, AOD, AOT, quantitative measure of aerosol loading), and (2) the aerosol detection product (ADP, qualitative information on the type of aerosol based on MODIS algorithm) [59]. The AOD product from VIIRS is a pixel-level product at a very high resolution. The JSTAR aerosol team has developed the NOAA enterprise processing system (EPS) aerosol algorithm, which works for both S-NPP/JPSS and GOES-16. The EPS algorithm implemented in NDE [60,61,62,63] requires observed spectral reflectances from a set of VIS and NIR bands and many ancillary data sets. Unlike traditional retrieval algorithms, the AOD algorithm compares the VIIRS observed spectral reflectances for selected VIS and NIR bands with reflectances calculated for a set of AOD and aerosol models. The algorithm then selects the AOD and the aerosol model for which the calculated reflectances best match the observed ones over dark and bright surfaces. The algorithm computes actual exponents at two wavelengths to use as a proxy for the aerosol product itself. The algorithm currently operational for S-NPP meets or exceeds the requirements and has shown improved bias characteristics over the IDPS algorithm and retrieval of the AOD product over an expanded measurement range, including bright surfaces in desert and semi-arid dry regions and over inland water bodies. Many user agencies are using the AOT products for applications, such as air-pollution monitoring and as forecasting.
The ADP enterprise algorithm currently operating on a variety of instruments (S-NPP/NOAA-20 VIIRS, GOES-16 ABI, etc.) identifies volcanic ash, dust, and smoke. The dust and smoke products are based on enterprise algorithms while volcanic ash is a separate algorithm [64]. The volcanic ash algorithm identifies pixels that have ash, and estimates ash height and ash loading using an optimal estimation technique. The quality flag associated with volcanic ash detection is bundled with the ADP product quality flags to identify ash. The ADP product shows about 85% and 92% probability of correct detection for smoke and dust, good agreement with the Multi-angle Imaging SpectroRadiometer (Figure 7), and meets the requirements. The ADP enterprise algorithm has been used to reprocess S-NPP VIIRS 2013-2015 data sets to produce dust and smoke climatology. The team is also working on variants of the aerosol products that can achieve a tradeoff between data consistency and data latency in order to meet the demands of different users for different applications. Table 7 shows the product performance for the AOD, ADP and Volcanic Ash product.
The VIIRS active fire (AF) land product, used together with the aerosol products, has the heritage of the MODIS Collection 4 version of the algorithm [46,65,66], and is an operational M-band product at 750 m resolution identifying fire hot spots or cloudy conditions over either land or water. The AF product also provides the fire radiative power (FRP), a proxy for the intensity of fire, for each fire pixel. The NOAA JSTAR team is also evaluating an experimental/research AF product at I/M-band 375 m resolution, and validation of this experimental product is planned via campaigns of opportunities. 
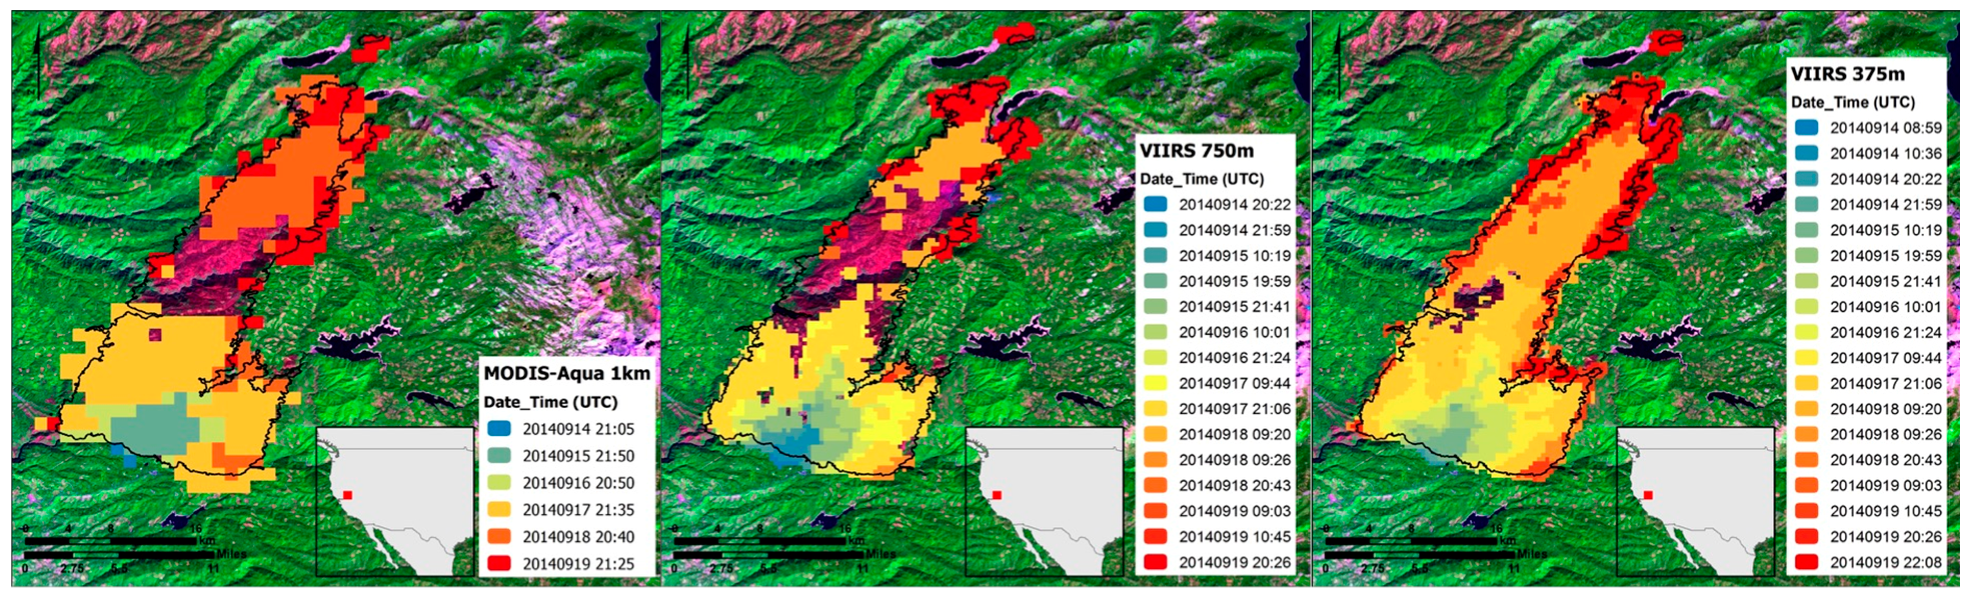
Figure 8 shows an example of the AF products for the King Fire in CA in September 2014 with VIIRS fire product in the middle panel for 750 m resolution, the right panel for 375 m resolution, and MODIS (1 km) fire product in the left panel. The VIIRS fire data product and the MODIS fire data products show good agreement, and the higher spatial resolution VIIRS product shows a higher number of detections, improved mapping capability, and the higher fidelity required for near real-time alert systems.
The S-NPP NDE AF algorithm has been in operations since March 2016. The team is currently optimizing the 375 m enterprise algorithm product, which combines the advantages of high spatial resolution I-band data with the good radiometric signal of M-band for FRP. The aerosol products and the AF products are used routinely for estimating bio-mass burning emissions and operational air quality forecasting [67]. These products, such as the High-Resolution Rapid Refresh (HRRR) and the blended Global Biomass Burning Emissions Product (GBBEPx) [68] are provided to many users with imagery and integrated air quality analysis tools available through the Enhanced Infusing Satellite Data into Environmental Applications (eIDEA) website [69], which blends polar and geostationary fire hot spot data for real-time information.
The VIIRS operational cryosphere products [70,71,72,73] include two snow products (binary snow cover and snow fraction) and three ice products (ice surface temperature, ice concentration, and ice thickness/age), as shown in Figure 9. The VIIRS polar winds product is also considered to be among the cryosphere products. As part of JPSS, the GCOM Advanced Microwave Scanning Radiometer-2 (AMSR2) instrument (see Section 3.4) also provides three snow products (snow cover, snow depth, and snow water equivalent) and two sea ice products (sea ice concentration and sea ice type). These products are operational and meet accuracy and precision requirements (Table 8).
In addition to the products overviewed in this paper, there are more VIIRS EDR products, and the JSTAR website provides a complete description as well as evaluations.

3.2. The CrIS/ATMS Instruments and Science Data Products

The CrIS and the ATMS instruments provide IR and MW radiance products (SDRs) for assimilation into NWP models and have shown considerable impact in reducing medium-range forecast errors [1,74,75]. In addition to NWP model assimilations, radiance observations from the CrIS and ATMS are used individually and together in the sounding product retrieval algorithms to derive a wide variety of surface and atmospheric sounding products (EDRs) for many atmospheric applications. Many of these EDR products are ingested into the Advanced Weather Interactive Processing System (AWIPS-2 [76]), and Weather Forecasting Offices (WFOs) nationwide utilize these products for analyzing atmospheric instabilities, potential outbreaks of severe weather, and in now-casting applications [77].
The CrIS instrument aboard the S-NPP/NOAA-20 is a Fourier Transform Spectrometer (FTS) instrument with channels in three bands covering longwave (LWIR, 650–1095 cm−1), midwave (MWIR, 1210–1750 cm−1), and shortwave (SWIR 2155–2550 cm−1) bands [78]. The instrument is similar to other hyperspectral IR sounding instruments, such as the Infrared Atmospheric Sounding Interferometer (IASI, [79]) and the Atmospheric Infrared Sounder (AIRS, [80,81]).
The Advanced Technology Microwave Sounder (ATMS) is a cross-track scanning passive microwave radiometer used to retrieve atmospheric temperature and moisture profiles under clear and cloudy conditions. The instrument has 22 channels spanning 23.8–183.3GHz and includes most of the channels carried by the Advanced Microwave Sounding Unit (AMSU) and the Microwave Humidity Sounder (MHS or similar instrument such as AMSU-B) instruments flown aboard earlier NOAA polar-orbiting satellites. Details of the ATMS instrument, channel characteristics, calibration and validation of the ATMS SDR products are discussed in detail by Weng et al [15,82].
Figure 10 summarizes ATMS SDR on-orbit NEDT performance and on-orbit biases computed using the European Center for Medium Range Weather Forecasting (ECMWF) forecast/analysis fields. 
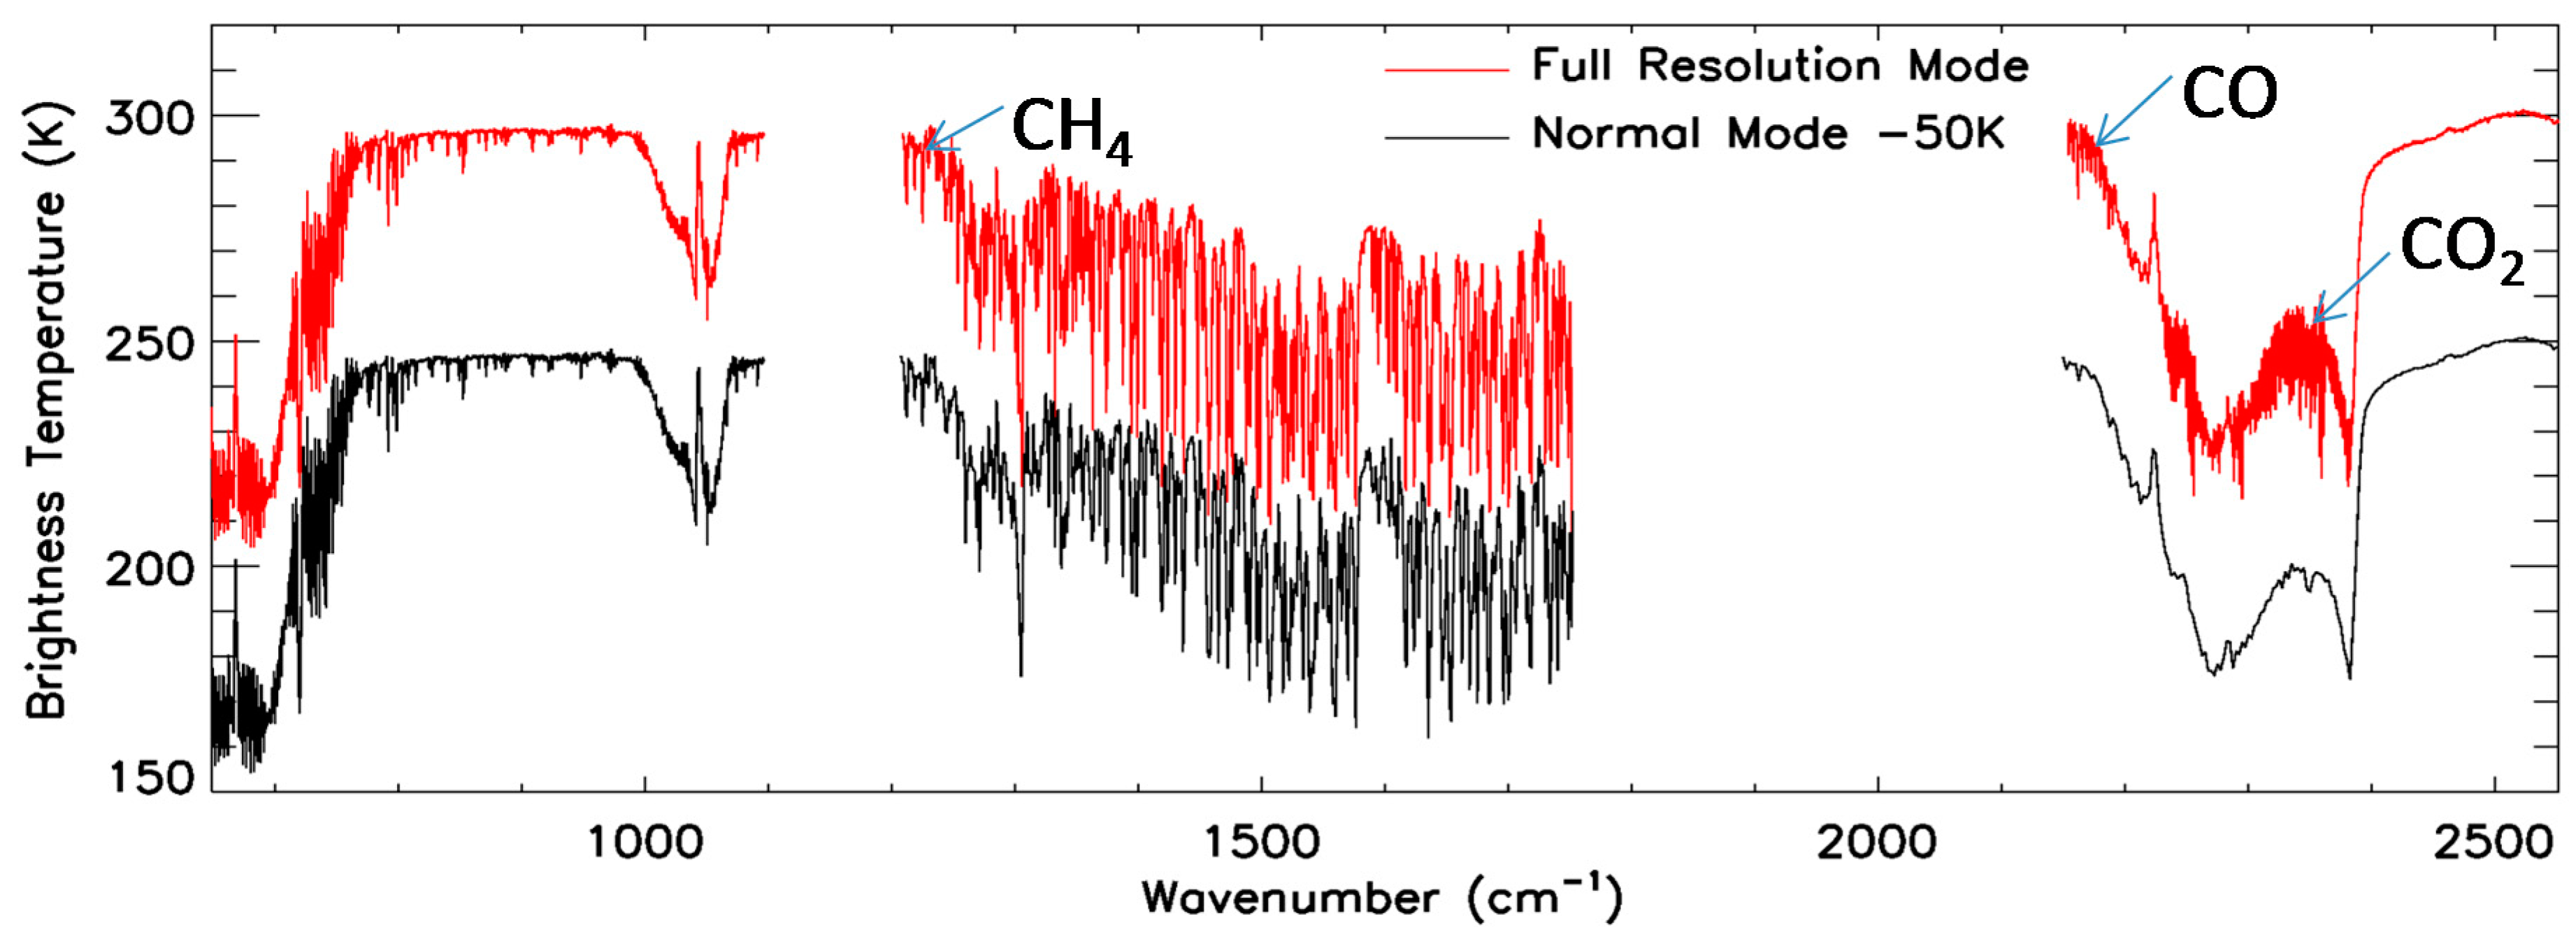
Table 9 shows S-NPP CrIS Nominal Spectral Resolution (NSR) and Full Spectral Resolution (FSR) SDR performance. Until 4 December 2014, the S-NPP CrIS instrument was operated at an NSR of 0.625, 1.25 and 2.5 cm−1 for LWIR, MWIR and SWIR bands, respectively. Since 4 December 2014, the S-NPP CrIS instrument has been operating in FSR mode with a spectral resolution of 0.625 cm−1 in all 3 bands, as shown in Figure 11. The NOAA-20 CrIS instrument has been operating in FSR mode since the beginning of the NOAA-20 mission, and the CrIS SDR processing algorithms for both S-NPP and NOAA-20 have adapted the latest calibration algorithms, which contain major changes to the CrIS calibration equation, self-anodization corrections, resampling matrices, and calibration filter [17].
The availability of MW sounding instruments and the utility of the MW retrievals as the initial guess for the hyper-spectral IR sounding retrievals have alleviated cloud-clearing and allowed generation of high-quality geophysical products in scenes with up to 80% cloud cover [80,83]. Initial development of the microwave-only and microwave/infrared sounding products for the JPSS mission were based on pre-existing microwave/infrared sensor pairs, such as the AMSU-A and MHS paired with the IASI instrument, and the AMSU-A instrument paired with the Aqua-AIRS instrument. Details of these instruments and their channel characteristics have been described in many publications [69,70,71].
These developments led NOAA to define, develop, and operationalize two EDR operational product development systems. The NOAA Unique Combined Atmospheric Processing System (NUCAPS, [84]) uses hyper-spectral CrIS IR observations (aided by ATMS), while the Microwave Integrated Retrieval System (MiRS, [85]) relies solely on ATMS observations.

3.2.1. The NUCAPS CrIS/ATMS EDR Products

The NUCAPS algorithm is built upon heritage from the Atmospheric Infrared Sounder (AIRS) science team retrieval algorithm [83]. In addition to temperature, water vapor, and ozone products, the NUCAPS system operationally produces several trace gas products (e.g., CO, CH4, CO2, Volcanic SO2) from the CrIS/ATMS instruments. CrIS radiances are also used to produce near-real-time Outgoing Longwave Radiation (OLR) product. CrIS-derived OLR values are estimated as a weighted linear combination of CrIS-adjusted “pseudo channel” radiances. The estimation of OLR on a near-real-time basis provides a unique perspective for studying the variability of Earth’s current atmospheric radiation budget [86].
The CrIS instrument NSR/FSR observations have been applied to NUCAPS retrieval algorithm to provide temperature, moisture, ozone profiles, and atmospheric trace gas profiles [84]. The full spectral resolution coupled with low noise in all three bands enable high quality CO and other trace gas retrievals [87]. The FSR observations allow discriminating very strong water lines in the MWIR and this leads to better derivation of upper tropospheric humidity. The increased spectral resolution also improves the calibration of the SWIR and improve temperature sounding, which, in turn, leads to improved sounding products [88].
The NUCAPS algorithm has been adapted as an enterprise solution to work on S-NPP and NOAA-20 CrIS/ATMS, AIRS/AMSU-A, and Meteorological Operational Satellite Program (MetOp) Infrared Atmospheric sounder (IASI)/AMSU-A/AMSU-B instrument complements. The algorithm has been evolved and evaluated over the years using the data from the hyper-spectral IR instruments and using associated MW instruments. The temperature, water vapor, and ozone retrievals have been validated for AIRS [89,90], IASI [91], and CrIS [92,93,94,95]. The CO derived from full resolution SNPP and NOAA-20 CrIS SDR has reached provisional maturity, while CO2 and CH4 remain at beta maturity [4]. Table 10 and Table 11 show the S-NPP NUCAPS products performance for Temperature/Moisture Profiles and for Trace Gases and OLR Products, respectively.
Figure 12 comprises a suite of images from JPSS products; VIIRS Active Fire (a), VIIRS AOD (b), as well as the CO derived from CrIS/NUCAPS at 500 mb (c) and 700 mb (d), over the severe fires in California on 09 November 2018. The retrieved CO product from NUCAPS, while showing a distribution consistent with the fire and smoke observed from VIIRS, also provides information about the vertical distribution and transport of the CO over the downwind regions. NUCAPS Sounding EDRs derived from various satellite missions (S-NPP and NOAA-20 CrIS/ATMS; Aqua-AIRS/AMSU-A; MetOp-A, B, IASI/AMSU-A/AMSU-B) allow for inter-comparison of the products and enterprise validations using common ground truth measurements [89,90,96], development of blended products for consistent mission-agnostic data products, and establishment of future objective requirements.

3.2.2. The MiRS ‘Microwave-Only’ ATMS EDR Products

The MIRS processing system is a ‘microwave-only’ retrieval system based on a 1D variational and physical retrieval algorithm using the Community Radiative Transfer Model (CRTM) as the forward and adjoint operators [85]. The MiRS retrieval algorithm is designed as an enterprise processing system and is applied operationally on several microwave sensors from many satellite platforms, including the ATMS aboard the S-NPP/NOAA-20 satellites. The MiRS product suite includes a wide variety of surface and atmosphere products, such as temperature, water vapor, clouds, rain rate, and cryosphere products [97]. Recently, the MiRS team added snow fall rate (SFR, [98]) to the operational list of products, and most of the MiRS products from the S-NPP ATMS have reached the validated maturity stage, while the NOAA-20 MiRS products have passed through Beta and Provisional maturity reviews. 
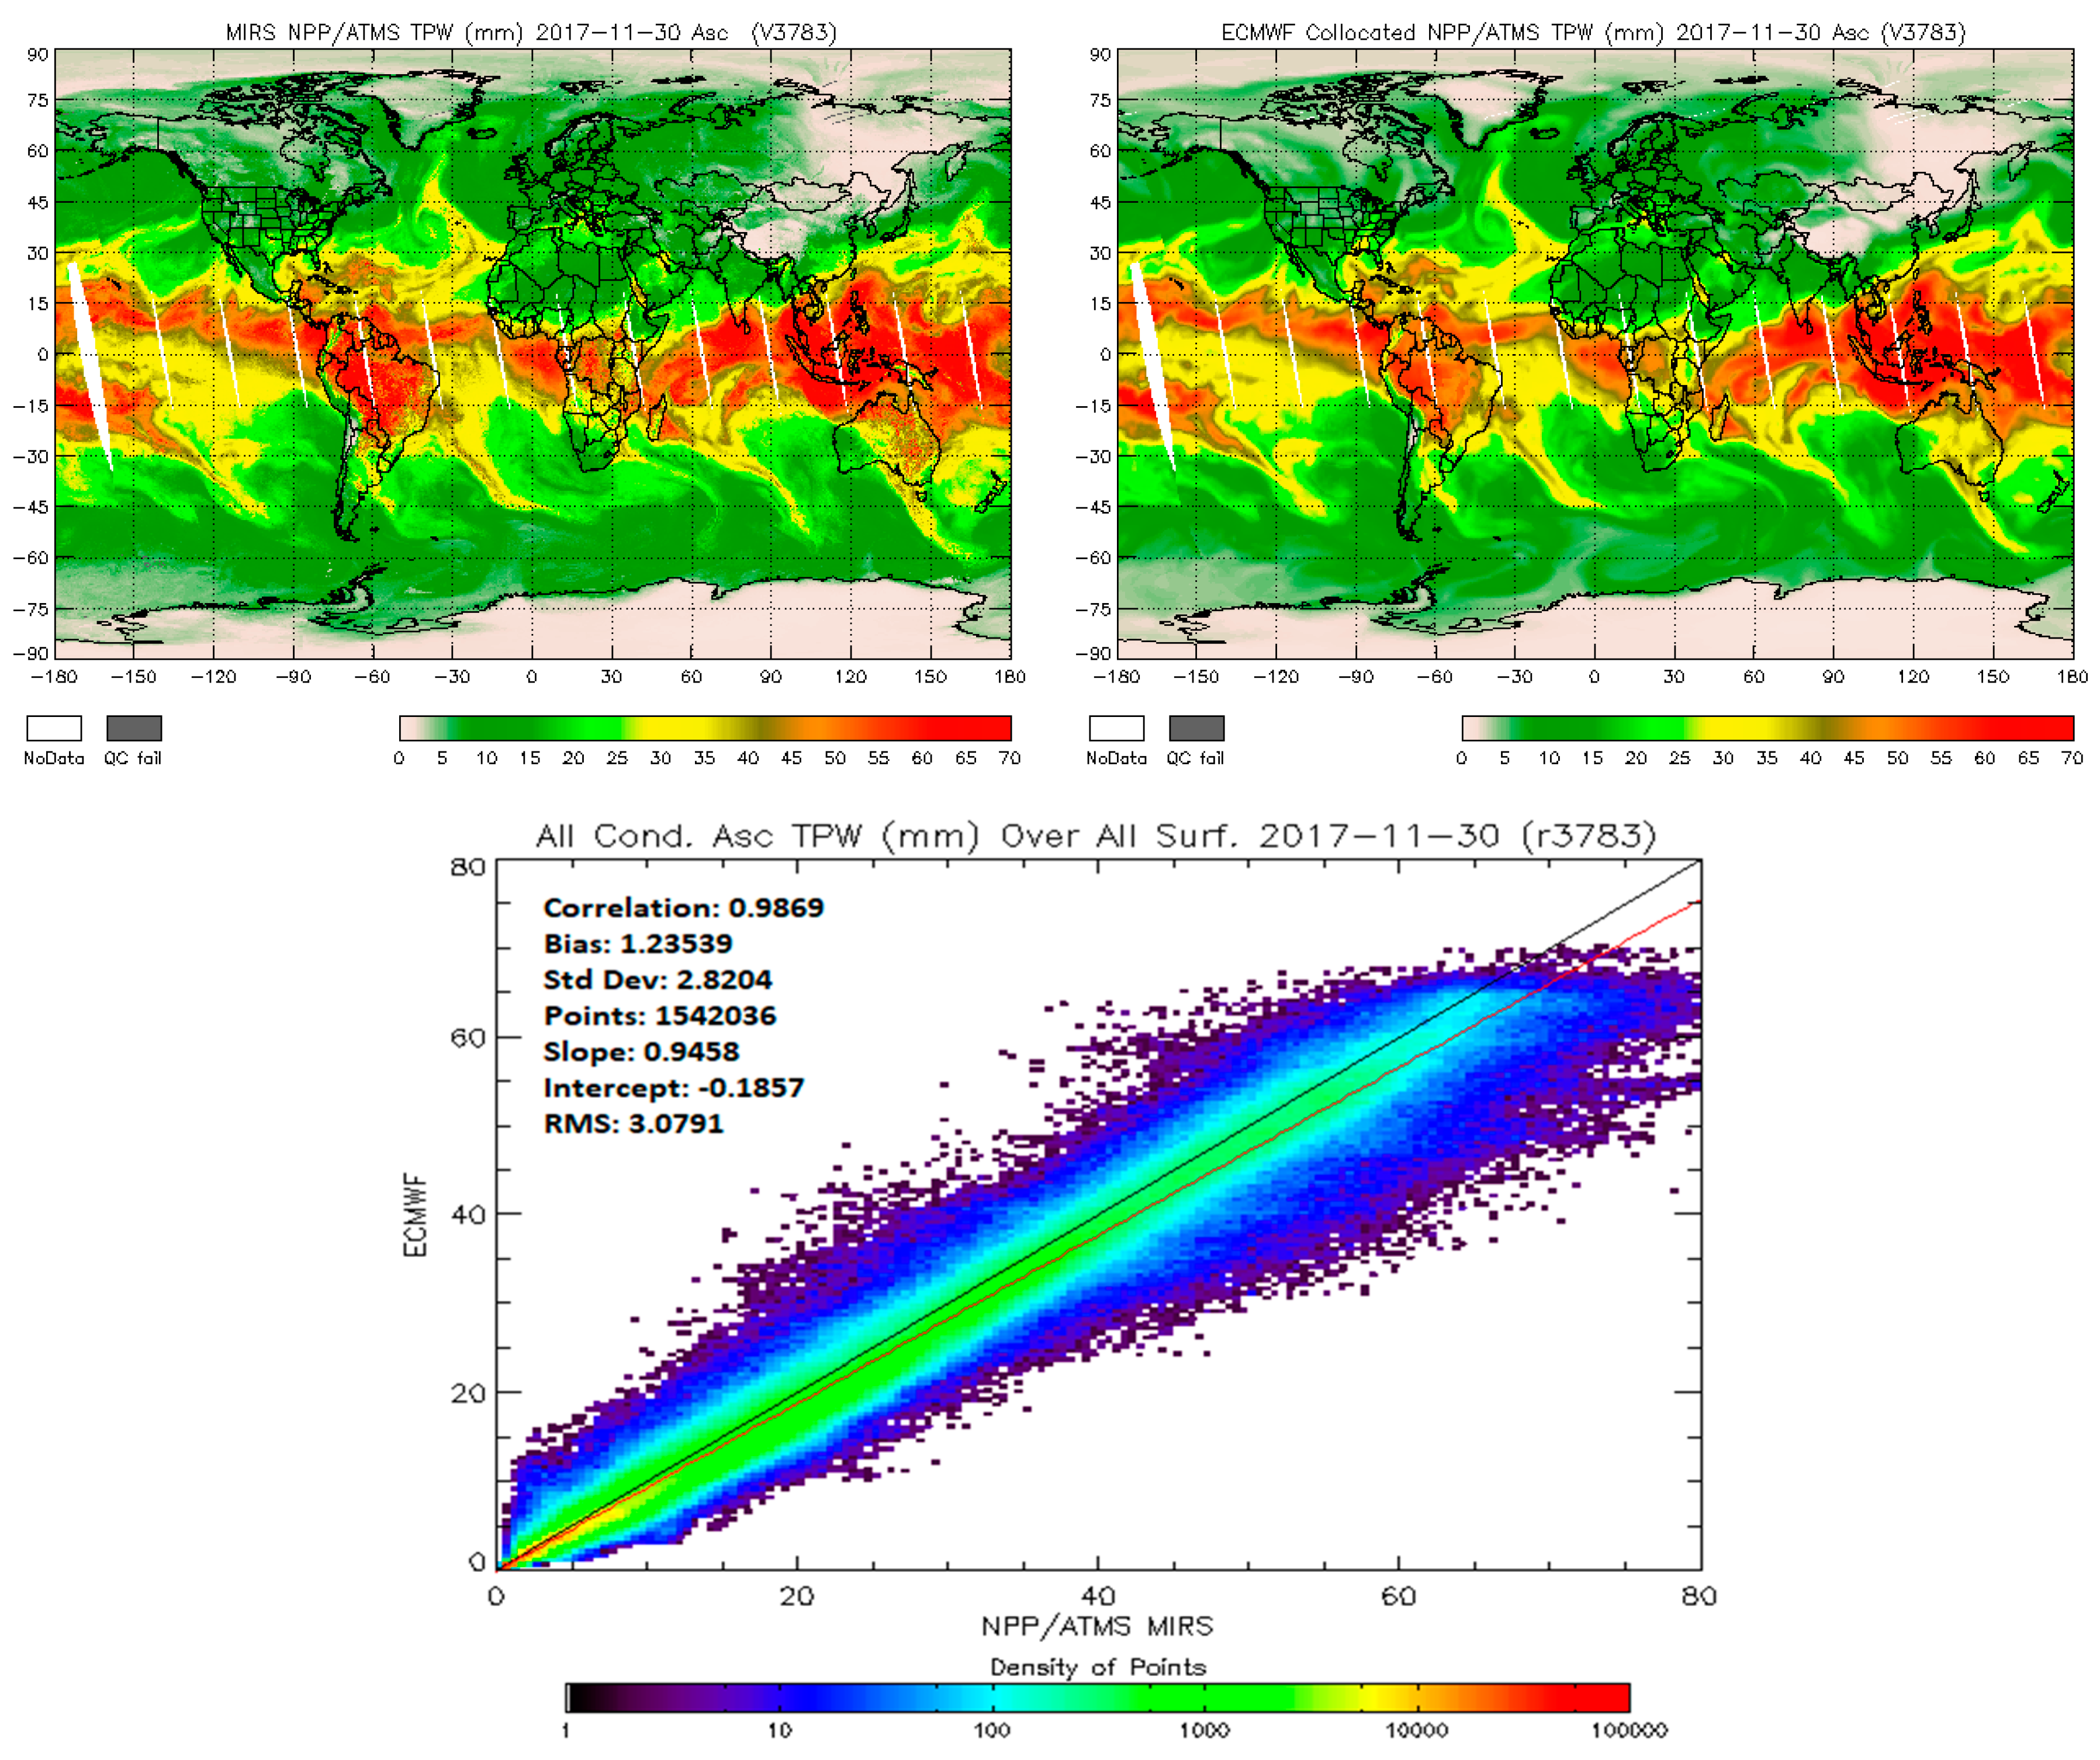
Figure 13 shows an example of the S-NPP ATMS-derived MiRS total precipitable water (left panel) compared with the ECMWF analysis fields (middle panel) with a correlation higher than 0.98, as shown in the corresponding scatter plot. Table 12 and Table 13 provide the APU validation results for the MiRS product suite.

3.3. The Ozone Mapping and Profiler Suite (OMPS) Instrument and Science Data Products

The S-NPP OMPS has three instruments, the Nadir Mapper (OMPS-NM), Nadir Profiler (OMPS-NP), and Limb Profiler (OMPS-LP) that measures scattered solar UV and visible radiance to derive three dimensional distributions of ozone and other atmospheric constituents for daily monitoring. The OMPS Version 8 algorithms for Total Ozone (V8TOz from OMPS-NM) and Ozone Profile (V8Pro from OMPS-NP) have the heritage of the Solar Backscatter Ultra Violet (SBUV) algorithms [99]. The OMPS-LP ozone product algorithm is based on a scattering retrieval technique used for the Shuttle Ozone Limb Sounding experiment [100]. The NM instrument provides total column ozone (TC), UV absorbing aerosol index (UVAI), and total column SO2 at 50 × 50 km2 horizontal resolution at nadir from S-NPP with 2% accuracy. Starting with NOAA-20, these products will be produced at 17 × 17 km2 resolution at nadir. The NP instrument produces middle and upper stratosphere ozone profiles in the orbital track at 250 × 250 km2 (50 × 250 km2 from NOAA-20) resolution with 5% accuracy and 5 to 10 km vertical resolution in the middle and upper stratosphere. The Limb Profiler (LP) currently on S-NPP (and in the future on JPSS-2) provides a high vertical resolution stratospheric ozone product at 5% accuracy and 3 km vertical resolution in the stratosphere. The OMPS-NM total column ozone products have been compared with similar products from ground-based and satellite-based instruments [101], as shown by the comparisons between S-NPP OMPS-NM (NOAA Version 8 algorithm), MetOp-A/B Global Ozone Monitoring Experiment–2 (GOME-2, NOAA Version 8 algorithm), and NASA EOS Aura Ozone Monitoring Instrument (OMI, NASA Version 8.6 algorithm) in Figure 14. The JSTAR ozone teams currently produce daily-, global- and regional-scale TC, UVAI and SO2 products and support UV index forecasts and hazard warning systems in place of OMI (SO2) [102]. The NCEP uses OMPS EDR products towards (i) continuation of the long-term climate data record and climate monitoring that began with the SBUV/2, (ii) near real-time monitoring of the ozone hole, and (iii) UV index forecasts and for stratospheric intrusion/monitoring forecasts. Figure 15 shows an example of the UV index forecast product produced from the S-NPP OMPS observations [103]. Some research products include total column and tropospheric NO2 (from NM), the Mg II index product, which is of interest with respect to solar activity (from NP), and stratospheric aerosol profiles derived from the LP, which help map out stratospheric aerosol loading due to natural eruptions. Table 14 shows the S-NPP OMPS SDR performance.

3.4. The GCOM-AMSR2 Instrument and Science Data Products

The GCOM AMSR2 instrument is a dual-polarized, conical scanning, passive microwave radiometer and provides a variety of products exploiting the availability of dual-polarized measurements with central frequencies at 6.925, 10.65, 18.7, 23.8, 36.5, and 89.0 GHz. AMSR2 provides data continuity with several enhancements for the AMSR for Earth Observing System (AMSR-E) on NASA’s Aqua satellite [104]. Under the collaborative agreements between the JPSS and the JAXA Program, the IDPS processing system generates RDRs from G-COM data received in real time through Svalbard. The NDE operational system generates G-COM AMSR2 Level-1 data sets (equivalent to SDRs) using the software provided by JAXA and derives a variety of Level-1 and Level-2 products that include: calibrated microwave brightness temperatures, total precipitable water, cloud liquid water, precipitation type/rate, sea surface temperature, and sea surface wind speed [105]. Some of these products serve as standalone AMSR2 baseline products, while others are blended products with a multitude of sensors (e.g., ATMS) [106]. The baseline suite of products from AMSR2 includes cloud properties, rain rate, soil moisture, and snow and ice products (Table 15). Examples of blended products include total precipitable water and rain rate. The processing systems of MIRS, Interactive Multisensor Snow and Ice Mapping System (IMS), and Soil Moisture Operational Product System (SMOPS) produce these hydrological products and use enterprise solutions to derive products from JPSS ATMS, GCOM-AMSR2, and other instrument complements. Some JPSS hydrological products have been utilized in Earth system modeling and data assimilation, such as snow cover and soil moisture [107].

4. NOAA-20 Algorithm Upgrades and Science Data Products

Launched on 18 November 2017 with a 50-min separation from the S-NPP orbit, NOAA-20 carries aboard it the same instrument complements currently operating on S-NPP. This provides both continuity of the existing high-quality data products currently produced through S-NPP, and additional products as a direct result of the instrument upgrades and science improvements. Feedback from S-NPP product development, Cal/Val, maturity reviews, and user communities has allowed the JSTAR teams to realize a large number of science improvements and upgrades for both existing S-NPP algorithms and many new products. Some of these science improvements and upgrades have already been implemented as part of S-NPP product upgrades. In addition to the science improvements, the JSTAR teams developed necessary algorithm upgrades and mitigations prior to the NOAA-20 launch based on pre-launch characterizations of the instruments. During the pre-launch phase, the JSTAR teams facilitated performance analysis of pre-launch test data, such as instrument configuration parameters (or calibration LUTs), improvements and refinements to mitigate instrument waivers. The JSTAR teams also verified NOAA-20 science algorithm developments related to instrument upgrades using proxy data sets derived from S-NPP and NOAA-20 pre-launch test data sets. All NOAA-20 SDR pre-launch product algorithms were implemented in the IDPS, and most of the EDR algorithms have been migrated to enterprise algorithms for operationalization in NDE.
Following the launch of the NOAA-20 satellite, various testing activities have allowed the JSTAR teams to successfully monitor, evaluate, and quantify changes from the pre-launch versions of the NOAA-20 science datasets (e.g., radiometric, spectral, and geometric changes). The JSTAR teams accomplished most of the first 90 day planned science activities to achieve Beta and Provisional Maturity for NOAA-20 KPP products using on-orbit performance and calibration data and after accommodating post-launch fixes and updates to calibrate LUTs. All NOAA-20 KPPs (SDRs and imagery products) were declared to have Beta maturity as of 25 January 2018, Provisional maturity as of 16 February 2018, and Validated maturity as of October 2018. NOAA NESDIS promoted all of these SDR products into operation after attaining provisional maturity status. The science teams adapted S-NPP EDR validated maturity algorithms for NOAA-20 and updated the algorithms with the other specific NOAA-20 sensor characteristics to define the NOAA-20 EDR product algorithms. The JSTAR teams initiated the execution of Cal/Val plans and schedules for all of the EDR products.
Figure 16 shows the expedited schedule of the Cal/Val and product validated maturity for NOAA-20 SDR/EDR products. Following the lessons learned through S-NPP product maturity, adapting Cal/Val tools developed during S-NPP Cal/Val process to NOAA-20, and methodologies optimized in collecting the in situ measurements, the teams are expediting the NOAA-20 validated maturity.

5. Quality Assurance and Product Quality Monitoring

To ensure efficient research-to-operation transitions for science product algorithm updates, the JSTAR Program has implemented Quality Assurance (QA) procedures. The QA procedures [2] implemented and time-tested through S-NPP product development, operations, and reactive maintenance phases have been augmented for NOAA-20 to achieve efficient end-to-end product life-cycle operations. As part of the quality assurance and users engagement, JSTAR teams continue to update the website [4] with detailed information on the JPSS instruments, science data products and documents, product maturity status, long term validation, and science monitoring of S-NPP/NOAA-20 SDR/EDR products.
For JPSS product quality monitoring, the JSTAR teams have implemented two performance-monitoring systems for the S-NPP/NOAA-20, namely, the ICVS [108] and the EDR LTM [109] monitoring systems. The ICVS is a web-based system for continuously monitoring the sensors’ performance and the associated data product quality. The JSTAR science teams, as well as Common Ground System and flight teams, have used ICVS for many corrective actions and long-term sustainment of S-NPP/NOAA-20 products. Similar to the ICVS, the EDR LTM integrates science product monitoring and routine validations to aid the operational users and product scientists in monitoring the EDR product quality in near real time routinely, as well as on a long-term basis. The LTM system currently allows users to visualize satellite EDR products from the Suomi NPP and other domestic and international polar-orbiting satellite constellations through a searchable interface to easily access data, products and plots by date, type, and other sorting parameters. Ongoing improvements to the LTM include maps of quality flags, inter-comparisons of products from similar satellite instrument complements from an array of polar orbiting satellites, and overlays of products useful for many user-applications. The JSTAR-Mapper [110] is the latest addition to the LTM, which provides synergistic use of data products in identifying and analyzing near-real time event-based applications.

6. Reprocessing and Enterprise Algorithms

One of the major objectives of the JSTAR teams is to provide consistent long-term high-quality data products derived from four instruments on S-NPP. In the process of achieving Beta, Provisional, and Validated maturity stages, the science teams have implemented periodic updates of algorithms (e.g., fixing shortfalls through processing coefficient table (PCT) updates, improvements to quality flags, and performing mitigations to instrument sensor/channel mal-functions) for real-time product generation. Consequently, although the product accuracy and precision are improved in meeting the requirements for various maturity stages, the operational stream of data products may have varying characteristics, and the science teams recognized the need for science quality reprocessing to remove artifacts and to reduce biases. Based on the recommendations received from NOAA stakeholders and user communities through reprocessing, enterprise algorithm workshops, and STAR Annual Science Team Meetings [4], the JSTAR science teams have updated the SDR algorithms and calibration input parameters with the validated maturity algorithm codes and reprocessed the SDR products for the S-NPP mission. The reprocessed SDR products are currently hosted on the Cooperative Institute for Climate & Satellites (CICS) servers [111] and are going through final quality checks and verification. Meanwhile, the JSTAR science teams have implemented most of the EDR enterprise algorithms at NDE. Since the EDR products are impacted both by upstream SDR product changes as well as EDR algorithm changes (through various maturity stages), the teams are currently working on S-NPP EDR reprocessing using the reprocessed SDRs and NDE operational versions of the enterprise EDR algorithms to generate mission-long consistent EDR products. This will ensure long-term consistency of data product quality and enable users to utilize the high-quality products retroactively to evaluate impacts on user applications and prepare the necessary infrastructure to use the near-real time products.

7. Near Real Time Weather Prediction Applications, User Connectivity Initiatives

7.1. JPSS Data in Numeric Weather Prediction (NWP) Assimilations

The S-NPP ATMS radiances and CrIS FSR data sets are routinely accessed and assimilated by NWP centers worldwide, and forecast experiments conducted with the assimilation of these radiances have shown a positive impact [5]. Following the operational systems development starting with AIRS near-real-time processing using NUCAPS [112], NWP centers worldwide have accessed several hyperspectral radiance products, such as the thinned radiance data sets, principal component scores, and cloud-cleared radiances, etc. The NUCAPS enterprise processing system that runs on Aqua-AIRS, MetOp-A/B-IASI, and S-NPP/NOAA-20 CrIS instruments provide the retrieval products to the forecast users. The NOAA NWS, the ECMWF, and many other operational agencies worldwide assimilate these radiances into their NWP models. Forecast Sensitivity Observation Impact (FSOI) experiments conducted by Jung et. al. [44] with CrIS data assimilation into the Global Forecasting System (GFS) show that utilizing 104 FSR channels from the new channel selection and adjusting assimilation weights has improved the CrIS ranking from 9th to 5th of the total moist energy norm computed from the Global Data Assimilation System (GDAS) ensembles.

7.2. PGRR and NRT Applications and User Connectivity Initiatives

The PGRR science program initiated at the beginning of the JPSS program has been providing vital program functions on (i) addressing data needs across NOAA line offices (e.g., NWS, NMFS, OAR, etc.) and other agencies, (ii) identification of requirements and prioritization via the LORWG, (iii) fostering algorithm development for high-quality data products, Cal/Val, publications, reprocessing and enterprise solutions, and (iv) overseeing deliveries of software packages to operations and CSPP DB services. A wide number of PGI and near-real-time applications are ongoing in Atmospheric Chemistry, River Ice and Flooding, Fire and Smoke, Soundings, Data Assimilation, Imagery/Now casting, Ocean/Coastal applications, Hydrology, Arctic, and Land data assimilations, and details on these activities are published through JPSS Science Seminar Annual Digest publications [113].

8. Summary and Conclusions

The S-NPP satellite has been extremely successful in operations for the last seven years and has produced an array of very high quality atmospheric, land, ocean, and cryosphere data products. The recently launched NOAA-20 is producing high quality data products currently provided through S-NPP, along with additional products as a direct result of the instrument upgrades and science improvements. All of the S-NPP data products have passed through the Cal/Val validated maturity stage, and the products are now at the long-term monitoring and reactive maintenance phase. The NOAA-20 KPP products have all reached validated maturity status as of October 2018. The NOAA-20 EDR products are currently at the Beta/Provisional maturity stages, and most EDRs had reached provisional maturity stage by the end of 2018. The S-NPP/NOAA-20 satellite data products are disseminated through the NOAA’s PDA and CLASS systems for NOAA stakeholders and user agencies worldwide. Progress on using S-NPP products in NWP assimilations worldwide, in support of observing and predicting key weather phenomena (e.g., hurricanes, blizzards), and for event-based applications (e.g., flash floods, volcanic ash, wildfires, etc.), have shown remarkable success. The ability to derive JPSS products regionally at a much higher latency through DB networks using CSPP has been extremely fruitful for many real-time applications. The JPSS-2 and follow-on satellites (JPSS-3, 4) with similar instruments and consistent science products produced from the JPSS constellation provide users with the opportunity to transition from the aging legacy NOAA POES and EOS Aqua and Terra satellites products and keep-up with continuity and connectivity for coordinated science experiments. Commitments and collaborative agreements between the JPSS Program, EUMETSAT, and JAXA are leading to a wide variety of enterprise algorithm solutions for consistent data product generation, demonstration of blended product generation and application, and operationalization towards mission-agnostic data products leading to measurement-based approach. The JSTAR Program will continue the development/improvement of algorithms for both S-NPP and NOAA-20, as well as future JPSS missions. The team is also actively engaged in implementing the enterprise algorithms and in reprocessing the S-NPP SDR/EDR data products with the most mature, validated algorithms towards the generation and archival of science quality data products to advance satellite research and applications. Finally, through the ICVS, EDR-LTM, and JPSS Mapper websites, JSTAR provides much needed real-time product display and evaluations, along with numerous documents and webpage links on S-NPP/NOAA-20 products, ATBDs, maturity reviews, meeting minutes of JSTAR Annual Science Team Meetings and coordinated efforts with NOAA stakeholders and user communities.

Author Contributions

These authors contributed equally to this work.

Funding

The work of the JSTAR program is funded by NOAA JPSS Office (NJO).

Acknowledgments

This paper describes the collective work of government industry and academic teams over the course of many years. The authors would like to acknowledge the hard work and dedication of all contributing individual companies and organizations. The authors would like to thank especially the following JPSS STAR leads for their contributions: Harry Cikanek, Satya Kalluri, Changyong Cao, Paul DiGiacomo, Veronica Lance, Nai-Yu Wang, Trevor Beck, Larry Flynn, Chunhui Pan, Mark Liu, Ninghai Sun, Flavio Iturbide-Sanchez, Yong Chen, Slawomir Blonski, Lin Lin, Don Hillger, Shobha Kondragunta, Istvan Laszlo, Michael Pavolonis, Ivan Csiszar, Jerry Zhan, Bob Yu, Felix Kogan, Andy Heidinger, Jeff Key, Alex Ignatov, Menghua Wang, Ralph Ferraro, Huan Meng, Chris Grasati, Antonia Gambacorta, Juying Warner, Walter Wolf, Thomas.S.King, Valerie Mikles, Mike Wilson, Priyanka Roy, Bigyani Das, Aiwu Li, Hua Xie, Veena Jose, Banghua Yan, Thomas Atkins, Ryan Smith, Tess Valenzuela, Charlie Brown. The manuscript contents are solely the opinions of the authors and do not constitute a statement of policy, decision, or position on behalf of NOAA or the U.S. government.

Conflicts of Interest

The authors declare no conflict of interest.

References

  1. Goldberg, M.D.; Kilcoyne, H.; Cikanek, H.; Mehta, A. Joint Polar Satellite System: The United States next generation civilian polar-orbiting environmental satellite system. J. Geophys. Res. Atmos. 2013, 118, 13463–413475. [Google Scholar] [CrossRef]
  2. Zhou, L.; Divakarla, M.; Liu, X. An Overview of the Joint Polar Satellite System (JPSS) Science Data Product Calibration and Validation. Remote Sens. 2016, 8, 139. [Google Scholar] [CrossRef]
  3. NOAA. Comprehensive Large Array-Data Stewardship System (CLASS) Website. Available online: http://www.nsof.class.noaa.gov (accessed on 23 January 2019).
  4. NOAA; JSTAR. JPSS Center for Satellite Research and Applications (STAR) Website. Available online: https://www.star.nesdis.noaa.gov/jpss/index.php (accessed on 23 January 2019).
  5. Goldberg, M.D. The value of polar satellite direct broadcast data for nowcasting and short range weather forecasting. In Proceedings of the EUMETSAT, Rome, Italy, 2–7 October 2017. [Google Scholar]
  6. Joo, S.; Eyre, J.; Marriott, R. The Impact of MetOp and Other Satellite Data within the Met Office Global NWP System Using an Adjoint-Based Sensitivity Method. Mon. Weather Rev. 2013, 141, 3331–3342. [Google Scholar] [CrossRef]
  7. Cooperative Institute of Meteorological Satellite Studies (CIMSS). Community Satellite Processing Package. Available online: http://cimss.ssec.wisc.edu/cspp/ (accessed on 23 January 2019).
  8. Gumley, L.; Goldberg, M.; Flynn, B.; Santek, D.; Braun, J.; Davies, J. Rapid Acquisition, Processing and Delivery of Advanced Infrared and Microwave Sounder Data from Polar Orbiting Satellites for Numerical Weather Prediction and other Time-Sensitive Applications. In Proceedings of the EUMETSAT, Rome, Italy, 2–7 October 2017. [Google Scholar]
  9. Hillger, D.; Kopp, T.; Seaman, C.; Miller, S.; Lindsey, D.; Stevens, E.; Solbrig, J.; Straka Iii, W.; Kreller, M.; Kuciauskas, A.; et al. User validation of VIIRS satellite imagery. Remote Sens. 2015, 8, 11. [Google Scholar] [CrossRef]
  10. Goldberg, M.; Cikanek, H.A.; Zhou, L.; Price, J. The Joint Polar Satellite System in Comprehensive Remote Sensing: Missions and Sensors; Liang, S., Ed.; Elsevier: Lanham, MD, USA, 2018; Volume 1. [Google Scholar]
  11. Walter Wolf, J.D.; Sampson, S.; Zhou, L.; King, T.; Das, B. Migration to Operational Enterprise Algorithms. In Proceedings of the AMS Annual Meeting: 12th Annual Symposium on New Generation Operational Environmental Satellite Systems, New Orleans, LA, USA, 10–14 January 2016. [Google Scholar]
  12. Powell, A.M., Jr.; Weng, F. Introduction to Special Section on Suomi National Polar-Orbiting Partnership Satellite Calibration, Validation, and Applications. J. Geophys. Res. Atmos. 2013, 118, 12216–12217. [Google Scholar] [CrossRef]
  13. Pan, C.; Kowalewski, M.; Buss, R.; Flynn, L.; Wu, X.; Caponi, M.; Weng, F. Performance and Calibration of the Nadir Suomi-NPP Ozone Mapping Profiler Suite From Early-Orbit Images. IEEE J. Sel. Top. Appl. Earth Obs. Remote Sens. 2013, 6, 1539–1551. [Google Scholar] [CrossRef]
  14. Cao, C.; Xiong, J.; Blonski, S.; Liu, Q.; Uprety, S.; Shao, X.; Bai, Y.; Weng, F. Suomi NPP VIIRS sensor data record verification, validation, and long-term performance monitoring. J. Geophys. Res. Atmos. 2013, 118, 11664–11678. [Google Scholar] [CrossRef]
  15. Weng, F.; Zou, X.; Sun, N.; Yang, H.; Tian, M.; Blackwell, W.J.; Wang, X.; Lin, L.; Anderson, K. Calibration of Suomi national polar-orbiting partnership advanced technology microwave sounder. J. Geophys. Res. Atmos. 2013, 118, 11187–11200. [Google Scholar] [CrossRef]
  16. Han, Y.; Revercomb, H.; Cromp, M.; Gu, D.; Johnson, D.; Mooney, D.; Scott, D.; Strow, L.; Bingham, G.; Borg, L.; et al. Suomi NPP CrIS measurements, sensor data record algorithm, calibration and validation activities, and record data quality. J. Geophys. Res. Atmos. 2013, 118, 12734–12748. [Google Scholar] [CrossRef]
  17. Han, Y.; Chen, Y. Calibration Algorithm for Cross-Track Infrared Sounder Full Spectral Resolution Measurements. IEEE Trans. Geosci. Remote Sens. 2018, 56, 1008–1016. [Google Scholar] [CrossRef]
  18. Liao, L.B.; Weiss, S.; Mills, S.; Hauss, B. Suomi Npp Viirs Day-Night Band on-Orbit Performance. J. Geophys. Res. Atmos. 2013, 118, 12705–12718. [Google Scholar] [CrossRef]
  19. NESDIS. Suomi-NPP VIIRS and Aqua MODIS Intercomparison. Available online: https://ncc.nesdis.noaa.gov/VIIRS/VIIRS_MODIS_Intercomparison.php (accessed on 23 January 2019).
  20. Uprety, S.; Cao, C. Suomi Npp Viirs Reflective Solar Band on-Orbit Radiometric Stability and Accuracy Assessment Using Desert and Antarctica Dome C Sites. Remote Sens. Environ. 2015, 166, 106–115. [Google Scholar] [CrossRef]
  21. Uprety, S.; Cao, C.; Xiong, X.; Blonski, S.; Wu, A.; Shao, X. Radiometric Intercomparison between Suomi-NPP VIIRS and Aqua MODIS Reflective Solar Bands Using Simultaneous Nadir Overpass in the Low Latitudes. J. Atmos. Ocean. Technol. 2013, 30, 2720–2736. [Google Scholar] [CrossRef]
  22. Madhavan, S.; Brinkmann, J.; Wenny, B.N.; Wu, A.; Xiong, X. Evaluation of VIIRS and MODIS Thermal Emissive Band Calibration Stability Using Ground Target. Remote Sens. 2016, 8, 158. [Google Scholar] [CrossRef]
  23. Cao, C.; Bai, Y. Quantitative Analysis of VIIRS DNB Nightlight Point Source for Light Power Estimation and Stability Monitoring. Remote Sens. 2014, 6, 11915–11935. [Google Scholar] [CrossRef]
  24. Miller, S.D.; Straka, W.; Mills, S.P.; Elvidge, C.D.; Lee, T.F.; Solbrig, J.; Walther, A.; Heidinger, A.K.; Weiss, S.C. Illuminating the Capabilities of the Suomi National Polar-Orbiting Partnership (NPP) Visible Infrared Imaging Radiometer Suite (VIIRS) Day/Night Band. Remote Sens. 2013, 5, 6717–6766. [Google Scholar] [CrossRef]
  25. Joint Polar Satellite System (JPSS). Program Level 1 Requirements SUPPLEMENT; Version 2.10; NOAA/NESDIS/DOC: Washington, DC, USA, June 2014.
  26. Cao, C. Validated Maturity Science Review For NOAA-20 VIIRS SDR, Available at JPSS STAR Validated Maturity Review Website. Available online: https://www.star.nesdis.noaa.gov/jpss/documents/AMM/N20/VIIRS_SDR_Validated.pdf (accessed on 7 March 2019).
  27. Joint Polar Satellite System (JPSS). Program Lexicon JPSS-470-00041, Accessible through STAR JPSS Webpage. Available online: https://www.star.nesdis.noaa.gov/jpss/documents/470-00041_JPSS_Program_Lexicon_RevC_January_21_2016.pdf (accessed on 3 March 2019).
  28. Cao, C. (Ed.) Calibration Validation of Visible Infrared Imaging Radiometers and Applications; MDPI: Basel, Switzerland, 2017; ISBN1 978-3-03842-318-8. (Pbk); ISBN2 978-3-03842-319-5. (PDF). [Google Scholar]
  29. Hillger, D.; Kopp, T.; Lee, T.; Lindsey, D.; Seaman, C.; Miller, S.; Solbrig, J.; Kidder, S.; Bachmeier, S.; Jasmin, T.; et al. First-Light Imagery from Suomi NPP VIIRS. Bull. Am. Meteorol. Soc. 2013, 94, 1019–1029. [Google Scholar] [CrossRef]
  30. Hillger, D.; Seaman, C.; Liang, C.; Miller, S.; Lindsey, D.; Kopp, T. Suomi NPP VIIRS Imagery evaluation. J. Geophys. Res. Atmos. 2014, 119, 6440–6455. [Google Scholar] [CrossRef]
  31. Lai, C.; Yue, J.; Xu, J.; Straka, W.C.; Miller, S.D.; Liu, X. Suomi NPP VIIRS/DNB imagery of nightglow gravity waves from various sources over China. Adv. Space Res. 2017, 59, 1951–1961. [Google Scholar] [CrossRef]
  32. McHardy, T.M.; Zhang, J.; Reid, J.S.; Miller, S.D.; Hyer, E.J.; Kuehn, R.E. An improved method for retrieving nighttime aerosol optical thickness from the VIIRS Day/Night Band. Atmos. Meas. Tech. 2015, 8, 4773–4783. [Google Scholar] [CrossRef]
  33. Miller, S.D. A dynamic scaling algorithm for the optimized digital display of VIIRS Day/Night Band imagery AU—Seaman, Curtis J. Int. J. Remote Sens. 2015, 36, 1839–1854. [Google Scholar]
  34. Mills, S.; Miller, S. VIIRS Day/Night Band—Correcting Striping and Nonuniformity over a Very Large Dynamic Range. J. Imaging 2016, 2, 9. [Google Scholar] [CrossRef]
  35. Gladkova, I.; Ignatov, A.; Shahriar, F.; Kihai, Y.; Hillger, D.; Petrenko, B. Improved VIIRS and MODIS SST Imagery. Remote Sens. 2016, 8, 79. [Google Scholar] [CrossRef]
  36. Zhang, J.; Jaker, S.L.; Reid, J.S.; Miller, S.D.; Solbrig, J.; Toth, T.D. Characterization and application of artificial light sources for nighttime aerosol optical depth retrievals using the VIIRS Day/Night Band. Atmos. Meas. Tech. Discuss. 2018, 2018, 1–45. [Google Scholar] [CrossRef]
  37. Heidinger, A.; Foster, M.; Botambekov, D.; Hiley, M.; Walther, A.; Li, Y. Using the NASA EOS A-Train to Probe the Performance of the NOAA PATMOS-x Cloud Fraction CDR. Remote Sens. 2016, 8, 511. [Google Scholar] [CrossRef]
  38. Heidinger, A.K.; Evan, A.T.; Foster, M.J.; Walther, A. A Naive Bayesian Cloud-Detection Scheme Derived fromCALIPSOand Applied within PATMOS-x. J. Appl. Meteorol. Climatol. 2012, 51, 1129–1144. [Google Scholar] [CrossRef]
  39. Frey, R.A.; Ackerman, S.A.; Liu, Y.; Strabala, K.I.; Zhang, H.; Key, J.R.; Wang, X. Cloud Detection with MODIS. Part I: Improvements in the MODIS Cloud Mask for Collection 5. J. Atmos. Ocean. Technol. 2008, 25, 1057–1072. [Google Scholar] [CrossRef]
  40. Young, S.A.; Vaughan, M.A.; Winker, D.M. Adaptive algorithms for the fully-automated retrieval of cloud and aerosol extinction profiles from CALIPSO lidar data. In Proceedings of the 2003 IEEE International Geoscience and Remote Sensing Symposium (IGARSS 2003) (IEEE Cat. No.03CH37477), Toulouse, France, 21–25 July 2003; pp. 1517–1519. [Google Scholar]
  41. Weinrich, J. Aviation Initive. In Proceedings of the STAR JPSS 2018 Annual Conference, College Park, MD, USA, 27–30 August 2018. [Google Scholar]
  42. Heidinger, A. VIIRS Cloud Product Status. In Proceedings of the STAR JPSS 2018 Annual Conference, College Park, MD, USA, 27–30 August 2018. [Google Scholar]
  43. Key, J. Snow, Ice, and Polar Winds. In Proceedings of the STAR JPSS 2018 Annual Conference, College Park, MD, USA, 27–30 August 2018. [Google Scholar]
  44. Jung, J.A.; Collard, A.; Bathmann, K.; Groff, D.; Heidinger, A.; Goldberg, M. Preparing for CrIS Full Spectral Resolution Radiances in the NCEP Global Forecast System. In Proceedings of the 21st International TOVS Study Conference, Darmstadt, Germany, 29 November–5 December 2017. [Google Scholar]
  45. Wang, R.; Wan, B.; Guo, Q.; Hu, M.; Zhou, S. Mapping regional urban extent using NPP-VIIRS DNB and MODIS NDVI data. Remote Sens. 2017, 9, 862. [Google Scholar] [CrossRef]
  46. Csiszar, I.; Schroeder, W.; Giglio, L.; Ellicott, E.; Vadrevu, K.P.; Justice, C.O.; Wind, B. Active fires from the Suomi NPP Visible Infrared Imaging Radiometer Suite: Product status and first evaluation results. J. Geophys. Res. Atmos. 2014, 119, 803–816. [Google Scholar] [CrossRef]
  47. Kogan, F.; Guo, W.; Yang, W.; Shannon, H. Space-based vegetation health for wheat yield modeling and prediction in Australia. J. Appl. Remote Sens. 2018, 12, 026002. [Google Scholar]
  48. Vargas, M.; Miura, T.; Shabanov, N.; Kato, A. An initial assessment of Suomi NPP VIIRS vegetation index EDR. J. Geophys. Res. Atmos. 2013, 118, 12301–12316. [Google Scholar] [CrossRef]
  49. Vargas, M. SNPP VIIRS Green Vegetation Fraction Validated Maturity Review. Available online: https://www.star.nesdis.noaa.gov/jpss/documents/AMM/VIIRS_GVF_Val.pdf (accessed on 28 February 2019).
  50. Ignatov, A.; Gladkova, I.; Ding, Y.; Shahriar, F.; Kihai, Y.; Zhou, X. JPSS VIIRS level 3 uncollated sea surface temperature product at NOAA. J. Appl. Remote Sens. 2017, 11, 032405. [Google Scholar] [CrossRef]
  51. Petrenko, B.; Ignatov, A.; Kihai, Y.; Stroup, J.; Dash, P. Evaluation and selection of SST regression algorithms for JPSS VIIRS. J. Geophys. Res. Atmos. 2014, 119, 4580–4599. [Google Scholar] [CrossRef]
  52. NOAA. CoastWatch OceanWatch: Satellite Data Products for Understanding and Managing Our Oceans and Coasts. Available online: https://coastwatch.noaa.gov/cw/index.html (accessed on 23 January 2019).
  53. Wang, M.; Liu, X.; Jiang, L.; Son, S.; Sun, J.; Shi, W.; Tan, L.; Naik, P.; Mikelsons, K.; Wang, X.; et al. Evaluation of VIIRS ocean color products. In Proceedings of the SPIE Asia-Pacific Remote Sensing, Beijing China, 13–16 October 2014. [Google Scholar]
  54. Wang, M.; Jiang, L. VIIRS-derived ocean color product using the imaging bands. Remote Sens. Env. 2018, 206, 275–286. [Google Scholar] [CrossRef]
  55. NOAA. STAR Ocean Color Team. Available online: https://www.star.nesdis.noaa.gov/sod/mecb/color/index.php (accessed on 23 January 2019).
  56. Garcia, S.; Cochrane, K. Ecosystem approach to fisheries: A review of implementation guidelines. ICES J. Mar. Sci. 2005, 62, 311–318. [Google Scholar] [CrossRef]
  57. NOAA; STAR. Coral Reef Watch: Satellite Monitoring and Modeled Outlooks. Available online: https://coralreefwatch.noaa.gov (accessed on 23 January 2019).
  58. NOAA. PolarWatch: Providing Access to Ocean Satellite Data in the Arctic and Antarctic. Available online: https://polarwatch.noaa.gov/ (accessed on 23 January 2019).
  59. Ciren, P.; Kondragunta, S. Dust aerosol index (DAI) algorithm for MODIS. J. Geophys. Res. Atmos. 2014, 119, 4770–4792. [Google Scholar] [CrossRef]
  60. Huang, J.; Kondragunta, S.; Laszlo, I.; Liu, H.; Remer, L.; Zhang, H.; Superczynski, S.; Ciren, P.N.; Holben, B.; Petrenko, M. Validation and expected error estimation of suomi-NPP VIIRS aerosol optical thickness and ångström exponent with AERONET: Validation of VIIRS aerosol products. J. Geophys. Res. Atmos. 2016, 121, 7139–7160. [Google Scholar] [CrossRef]
  61. Kondragunta, S.; Laszlo, I.; Ciren, P.; Zhang, H.; Liu, H.; Huang, J.; Huff, A. Exceptional events monitoring using S-NPP VIIRS aerosol products. In Proceedings of the 2017 IEEE International Geoscience and Remote Sensing Symposium (IGARSS), Fort Worth, TX, USA, 23–28 July 2017; pp. 1285–1287. [Google Scholar]
  62. Yu, T.; Wang, W.; Ciren, P.; Sun, R. An assessment of air-quality monitoring station locations based on satellite observations. J. Int. J. Remote Sens. 2018, 39, 6463–6478. [Google Scholar] [CrossRef]
  63. Zhang, H.; Kondragunta, S.; Laszlo, I.; Liu, H.; Remer, L.; Huang, J.; Superczynski, S.; Ciren, P. An enhanced VIIRS aerosol optical thickness (AOT) retrieval algorithm over land using a global surface reflectance ratio database. J. Geophys. Res. Atmos. 2016, 121, 710–717. [Google Scholar] [CrossRef]
  64. Pavolonis, M.J.; Heidinger, A.K.; Sieglaff, J. Automated retrievals of volcanic ash and dust cloud properties from upwelling infrared measurements. J. Geophys. Res. Atmos. 2013, 118, 1436–1458. [Google Scholar] [CrossRef]
  65. Giglio, L.; Descloitres, J.; Justice, C.O.; Kaufman, Y.J. An Enhanced Contextual Fire Detection Algorithm for MODIS. Remote Sens. Environ. 2003, 87, 273–282. [Google Scholar] [CrossRef]
  66. Kaufman, Y.J.; Justice, C.O.; Flynn, L.P.; Kendall, J.D.; Prins, E.M.; Giglio, L.; Ward, D.E.; Menzel, W.P.; Setzer, A.W. Potential global fire monitoring from EOS-MODIS. J. Geophys. Res. Atmos. 1998, 103, 32215–32238. [Google Scholar] [CrossRef]
  67. Huff, A.K.; Kondragunta, S.; Zhang, H.; Hoff, R.M. Monitoring the Impacts of Wildfires on Forest Ecosystems and Public Health in the Exo-Urban Environment Using High-Resolution Satellite Aerosol Products from the Visible Infrared Imaging Radiometer Suite (VIIRS). Environ. Health Insights 2015, 9, 9–18. [Google Scholar] [CrossRef] [PubMed]
  68. OSPO; NOAA. The Blended Global Biomass Burning Emissions Product (GBBEPx V2). Available online: http://www.ospo.noaa.gov/Products/land/gbbepx/index.html (accessed on 23 January 2019).
  69. NOAA; STAR. Enhanced Infusing Satellite Data into Environmental Applications. Available online: http://www.star.nesdis.noaa.gov/smcd/spb/aq/eidea (accessed on 23 January 2019).
  70. Key, J.R.; Mahoney, R.; Liu, Y.; Romanov, P.; Tschudi, M.; Appel, I.; Maslanik, J.; Baldwin, D.; Wang, X.; Meade, P. Snow and ice products from Suomi NPP VIIRS. J. Geophys. Res. Atmos. 2013, 118, 12816–12830. [Google Scholar] [CrossRef]
  71. Liu, Y.; Key, J.; Tschudi, M.; Dworak, R.; Mahoney, R.; Baldwin, D. Validation of the Suomi NPP VIIRS Ice Surface Temperature Environmental Data Record. Remote Sens. 2015, 7, 17258–17271. [Google Scholar] [CrossRef]
  72. Wang, X.; Key, J.; Kwok, R.; Zhang, J. Comparison of Arctic Sea Ice Thickness from Satellites, Aircraft, and PIOMAS Data. Remote Sens. 2016, 8, 713. [Google Scholar] [CrossRef]
  73. Liu, Y.; Key, J.; Mahoney, R. Sea and Freshwater Ice Concentration from VIIRS on Suomi NPP and the Future JPSS Satellites. Remote Sens. 2016, 8, 523. [Google Scholar] [CrossRef]
  74. Weng, F.; Zou, X.; Wang, X.; Yang, S.; Goldberg, M.D. Introduction to Suomi national polar-orbiting partnership advanced technology microwave sounder for numerical weather prediction and tropical cyclone applications. J. Geophys. Res. Atmos. 2012, 117, D19112. [Google Scholar] [CrossRef]
  75. Zou, X.; Weng, F.; Zhang, B.; Lin, L.; Qin, Z.; Tallapragada, V. Impacts of assimilation of ATMS data in HWRF on track and intensity forecasts of 2012 four landfall hurricanes. J. Geophys. Res. Atmos. 2013, 118, 11558–11576. [Google Scholar] [CrossRef]
  76. UCAR, Unidata. Advanced Weather Interactive Processing System. Available online: https://www.unidata.ucar.edu/software/awips2/ (accessed on 23 January 2019).
  77. CIMSS. NUCAPS Soundings Available in AWIPS II. Available online: http://cimss.ssec.wisc.edu/goes/blog/archives/15857 (accessed on 23 January 2019).
  78. Lee, T.F.; Nelson, C.S.; Dills, P.; Riishojgaard, L.P.; Jones, A.; Li, L.; Miller, S.; Flynn, L.E.; Jedlovec, G.; McCarty, W.; et al. NPOESS: Next-Generation Operational Global Earth Observations. Bull. Am. Meteorol. Soc. 2009, 91, 727–740. [Google Scholar] [CrossRef]
  79. Hilton, F.; Armante, R.; August, T.; Barnet, C.; Bouchard, A.; Camy-Peyret, C.; Capelle, V.; Clarisse, L.; Clerbaux, C.; Coheur, P.-F.; et al. Hyperspectral Earth Observation from IASI: Five Years of Accomplishments. Bull. Am. Meteorol. Soc. 2012, 93, 347–370. [Google Scholar] [CrossRef]
  80. Chahine, M.T.; Pagano, T.S.; Aumann, H.H.; Atlas, R.; Barnet, C.; Blaisdell, J.; Chen, L.; Divakarla, M.; Fetzer, E.J.; Goldberg, M.; et al. AIRS: Improving Weather Forecasting and Providing New Data on Greenhouse Gases. Bull. Am. Meteorol. Soc. 2006, 87, 911–926. [Google Scholar] [CrossRef]
  81. Aumann, H.H.; Chahine, M.T.; Gautier, C.; Goldberg, M.D.; Kalnay, E.; McMillin, L.M.; Revercomb, H.; Rosenkranz, P.W.; Smith, W.L.; Staelin, D.H.; et al. AIRS/AMSU/HSB on the Aqua mission: Design, science objectives, data products, and processing systems. IEEE Trans. Geosci. Remote Sens. 2003, 41, 253–264. [Google Scholar] [CrossRef]
  82. Weng, F.; Zou, X. Errors from Rayleigh-Jeans approximation in satellite microwave radiometer calibration systems. Appl. Opt. 2013, 52, 505–508. [Google Scholar] [CrossRef] [PubMed]
  83. Susskind, J.; Barnet, C.; Blaisdell, J.; Iredell, L.; Keita, F.; Kouvaris, L.; Molnar, G.; Chahine, M. Accuracy of geophysical parameters derived from Atmospheric Infrared Sounder/Advanced Microwave Sounding Unit as a function of fractional cloud cover. J. Geophys. Res. Atmos. 2006, 111, D09S17. [Google Scholar] [CrossRef]
  84. Gambacorta, A.; Nalli, N.R.; Tan, C.; Warner, J.X.; Wilson, M.; Bloch, C.; Zhou, L.; Wolf, W.; Goldberg, M. The NOAA Unique Combined Atmospheric Processing System (NUCAPS) Algorithm Theoretical Basis Document. Available online: https://www.star.nesdis.noaa.gov/jpss/documents/ATBD/ATBD_NUCAPS_v2.0.pdf (accessed on 26 February 2019).
  85. Boukabara, S.-A.; Garrett, K.; Chen, W.; Iturbide-Sanchez, F.; Grassotti, C.; Kongoli, C.; Chen, R.; Liu, Q.; Yan, B.; Weng, F.; et al. MiRS: An All-Weather 1DVAR Satellite Data Assimilation and Retrieval System. IEEE Trans. Geosci. Remote Sens. 2011, 49, 3249–3272. [Google Scholar] [CrossRef]
  86. Zhang, K.; Goldberg, M.D.; Sun, F.; Zhou, L.; Wolf, W.W.; Tan, C.; Nalli, N.R.; Liu, Q. Estimation of Near-Real-Time Outgoing Longwave Radiation from Cross-Track Infrared Sounder (CrIS) Radiance Measurements. J. Atmos. Ocean. Technol. 2017, 34, 643–655. [Google Scholar] [CrossRef]
  87. Gambacorta, A.; Barnet, C.; Wolf, W.; King, T.; Maddy, E.; Strow, L.; Xiong, X.; Nalli, N.; Goldberg, M. An Experiment Using High Spectral Resolution CrIS Measurements for Atmospheric Trace Gases: Carbon Monoxide Retrieval Impact Study. IEEE Geosci. Remote Sens. Lett. 2014, 11, 1639–1643. [Google Scholar] [CrossRef]
  88. Barnet, C. Use of CrIS Radiances at NOAA. In Proceedings of the NOAA Satellite Conference, New York, NY, USA, 19 July 2017. [Google Scholar]
  89. Divakarla, M.G.; Barnet, C.D.; Goldberg, M.D.; McMillin, L.M.; Maddy, E.; Wolf, W.; Zhou, L.; Liu, X. Validation of Atmospheric Infrared Sounder temperature and water vapor retrievals with matched radiosonde measurements and forecasts. J. Geophys. Res. 2006, 111, D09S15. [Google Scholar] [CrossRef]
  90. Divakarla, M.; Barnet, C.; Goldberg, M.; Maddy, E.; Irion, F.; Newchurch, M.; Liu, X.; Wolf, W.; Flynn, L.; Labow, G.; et al. Evaluation of Atmospheric Infrared Sounder ozone profiles and total ozone retrievals with matched ozonesonde measurements, ECMWF ozone data, and Ozone Monitoring Instrument retrievals. J. Geophys. Res. 2008, 113, D15308. [Google Scholar] [CrossRef]
  91. Divakarla, M.; Gambacorta, A.; Barnet, C.; Goldberg, M.; Maddy, E.; King, T.; Wolf, W.; Nalli, N.; Zhang, K.; Xie, H. Validation of IASI Temperature and Water Vapor Retrievals with Global Radiosonde Measurements and Model Forecasts. In Proceedings of the Imaging and Applied Optics, Toronto, ON, Canada, 10–14 July 2011; p. JWA25. [Google Scholar]
  92. Nalli, N.R.; Gambacorta, A.; Liu, Q.; Barnet, C.D.; Tan, C.; Iturbide-Sanchez, F.; Reale, T.; Sun, B.; Wilson, M.; Borg, L.; et al. Validation of Atmospheric Profile Retrievals From the SNPP NOAA-Unique Combined Atmospheric Processing System. Part 1: Temperature and Moisture. IEEE Trans. Geosci. Remote Sens. 2018, 56, 180–190. [Google Scholar] [CrossRef]
  93. Nalli, N.R.; Barnet, C.D.; Reale, A.; Tobin, D.; Gambacorta, A.; Maddy, E.S.; Joseph, E.; Sun, B.; Borg, L.; Mollner, A.K.; et al. Validation of satellite sounder environmental data records: Application to the Cross-track Infrared Microwave Sounder Suite. J. Geophys. Res. Atmos. 2013, 118, 13628–13643. [Google Scholar] [CrossRef]
  94. Nalli, N.R.; Gambacorta, A.; Liu, Q.; Tan, C.; Iturbide-Sanchez, F.; Barnet, C.D.; Joseph, E.; Morris, V.R.; Oyola, M.; Smith, J.W. Validation of Atmospheric Profile Retrievals from the SNPP NOAA-Unique Combined Atmospheric Processing System. Part 2: Ozone. IEEE Trans. Geosci. Remote Sens. 2018, 56, 598–607. [Google Scholar] [CrossRef]
  95. Sun, B.; Reale, A.; Tilley, F.H.; Pettey, M.E.; Nalli, N.R.; Barnet, C.D. Assessment of NUCAPS S-NPP CrIS/ATMS Sounding Products Using Reference and Conventional Radiosonde Observations. IEEE J. Sel. Top. Appl. Earth Obs. Remote Sens. 2017, 10, 2499–2509. [Google Scholar] [CrossRef]
  96. Reale, T.; Sun, B.; Tilley, F.H.; Pettey, M. The NOAA Products Validation System (NPROVS). J. Atmos. Ocean. Technol. 2012, 29, 629–645. [Google Scholar] [CrossRef]
  97. Boukabara, S.A.; Garrett, K.; Grassotti, C.; Iturbide-Sanchez, F.; Chen, W.; Jiang, Z.; Clough, S.A.; Zhan, X.; Liang, P.; Liu, Q.; et al. A physical approach for a simultaneous retrieval of sounding, surface, hydrometeor, and cryospheric parameters from SNPP/ATMS. J. Geophys. Res. Atmos. 2013, 118, 12600–12619. [Google Scholar] [CrossRef]
  98. Meng, H.; Dong, J.; Ferraro, R.; Yan, B.; Zhao, L.; Kongoli, C.; Wang, N.-Y.; Zavodsky, B. A 1DVAR-based snowfall rate retrieval algorithm for passive microwave radiometers. J. Geophys. Res. Atmos. 2017, 122, 6520–6540. [Google Scholar] [CrossRef]
  99. Bhartia, P.K.; McPeters, R.D.; Flynn, L.E.; Taylor, S.; Kramarova, N.A.; Frith, S.; Fisher, B.; DeLand, M. Solar Backscatter UV (SBUV) total ozone and profile algorithm. Atmos. Meas. Tech. 2013, 6, 2533–2548. [Google Scholar] [CrossRef]
  100. McPeters, R.D.; Janz, S.J.; Hilsenrath, E.; Brown, T.L.; Flittner, D.E.; Heath, D.F. The retrieval of O3profiles from limb scatter measurements: Results from the Shuttle Ozone Limb Sounding Experiment. Geophys. Res. Lett. 2000, 27, 2597–2600. [Google Scholar] [CrossRef]
  101. Flynn, L.; Long, C.; Wu, X.; Evans, R.; Beck, C.T.; Petropavlovskikh, I.; McConville, G.; Yu, W.; Zhang, Z.; Niu, J.; et al. Performance of the Ozone Mapping and Profiler Suite (OMPS) products. J. Geophys. Res. Atmos. 2014, 119, 6181–6195. [Google Scholar] [CrossRef]
  102. Flynn, L. JPSS-CPO TIM: OMPS Products Summary. Available online: https://www.star.nesdis.noaa.gov/jpss/documents/meetings/2016/JPSS_CPO/2.2_Flynn_OMPS-Products.pdf (accessed on 26 February 2019).
  103. NWS. Climate Prediction Center—Stratosphere: OMPS Total Ozone. Available online: https://www.cpc.ncep.noaa.gov/products/stratosphere/omps/ (accessed on 26 February 2019).
  104. Imaoka, K.; Kachi, M.; Kasahara, M.; Ito, N.; Nakagawa, K.; Oki, T. Instrument performance and calibration of AMSR-E and AMSR2. Int. Arch. Photogramm. Remote Sens. Spat. Inf. Sci. 2010, XXXVIII, 13–16. [Google Scholar]
  105. Chang, P.; Jelenak, Z.; Alsweiss, S.; Soisuvarn, S.; Meyers, P.; Ferraro, R. An overview of NOAA’s GCOM-W1/AMSR-2 product processing and utilization. In Proceedings of the 2017 IEEE International Geoscience and Remote Sensing Symposium (IGARSS), Fort Worth, TX, USA, 23–28 July 2017; pp. 5625–5628. [Google Scholar]
  106. Ferraro, R.; Meyers, P.; Chang, P.; Jelenak, Z.; Grassotti, C.; Liu, S. Application of GCOM-W AMSR2 and S-NPP ATMS Hydrological Products to a Flooding Event in the United States. IEEE J. Sel. Top. Appl. Earth Obs. Remote Sens. 2017, 10, 3884–3891. [Google Scholar] [CrossRef]
  107. Zhou, L.; Divakarla, M.; Archambault, H.; Mariotti, A.; Meng, H.; Mikles, V.; Vargas, M.; Liu, X.; Huang, J.; Lance, V.P. Exploring JPSS Data Application for Earth System Data Assimilation; NOAA JPSS-STAR (JSTAR), 2017. Available online: https://www.star.nesdis.noaa.gov/jpss/documents/meetings/2017/JPSS_CPO_MAPP/JPSS_CPO_MAPP_REPORT.pdf (accessed on 20 March 2019).
  108. NOAA; STAR. Integrated Calibration and Validation System Long-Term Monitoring. Available online: https://www.star.nesdis.noaa.gov/icvs/ (accessed on 23 January 2019).
  109. NOAA. STAR JPSS Environmental Data Records: Product Monitoring for Weather, Climate, and Environmental Applications. Available online: https://www.star.nesdis.noaa.gov/jpss/EDRs/ (accessed on 23 January 2019).
  110. NOAA; STAR. JPSS Mapper for Near Real-Time Environmental Monitoring and Applications. Available online: https://www.star.nesdis.noaa.gov/jpss/mapper (accessed on 23 January 2019).
  111. STAR. S-NPP Reprocessed Sensor Data Records. Available online: http://jlrdata.umd.edu/opendap/thredds (accessed on 23 January 2019).
  112. Goldberg, M.D.; Qu, Y.; McMillin, L.M.; Wolf, W.; Lihang, Z.; Divakarla, M. AIRS near-real-time products and algorithms in support of operational numerical weather prediction. IEEE Trans. Geosci. Remote Sens. 2003, 41, 379–389. [Google Scholar] [CrossRef]
  113. NOAA. JPSS Science Seminar Annual Digest Publications. Available online: http://www.jpss.noaa.gov/assets/pdfs/science_publications/ (accessed on 23 January 2019).
Figure 1. Sensor and Environmental Data (xDR) products from the S-NPP/NOAA-20/GCOM-W1 instruments suite.
Remotesensing 11 00698 g001
Figure 2. Nocturnal Tropical Cyclone tracking using VIIRS IR and DNB band, as presented on S-NPP VIIRS Imagery Validated Maturity Review by JSTAR Imagery EDR Team (Figure courtesy: Don Hillger, NOAA)
Remotesensing 11 00698 g002
Figure 3. An example of VIIRS daytime cloud mask generated using the VIIRS enterprise cloud algorithm (Figure Courtesy: Andy Heidinger, NOAA).
Remotesensing 11 00698 g003
Figure 4. Gridded VIIRS vegetation products. The NDE enterprise Vegetation Product Suite (NVPS) includes a variety of Vegetation Index (VI) products and the GVF product. The product suite contains daily, weekly and biweekly global and regional (North America) products at 4 km and at 1 km spatial resolution, respectively (figure courtesy: Yunyue Yu, STAR VI/GVF team).
Remotesensing 11 00698 g004aRemotesensing 11 00698 g004b
Figure 5. The ACSPO enterprise algorithm produces consistent results when applied on GOES-16 ABI (left) and on the VIIRS (right) for nighttime composites in the same domain. Large areas are cloudy during the S-NPP night overpass at 1:30 am on 29 July 2017; the GOES-16 ABI nighttime composite picks up more clear areas due to the high temporal resolution (every 15 min). The VIIRS SST, on the other hand, provides global coverage, including the polar regions. (Figure courtesy: Alex Ignatov, STAR SST team).
Remotesensing 11 00698 g005
Figure 6. S-NPP ocean color climatology Chl-a (2012–2016). In addition to (MSL12) OC processing system NRT products (meeting latency requirements), the OC team also produces JPSS-VIIRS reprocessed ocean-color products for the best quality mission-long S-NPP OC data products to benefit users worldwide. (Figure courtesy: Menghua Wang, STAR OC team).
Remotesensing 11 00698 g006
Figure 7. The VIIRS Aerosol Detection Product (ADP) (left panel) is found to be in good agreement with Multiangle Imaging Spectroradiometer (MISR) (right panel), with respect the location of dust and smoke. The ADP enterprise algorithm is currently running on S-NPP (NDE) and meets the performance requirements. (Figure courtesy: Shobha Kondragunta/Istvan Laszlo, STAR Aerosol team).
Remotesensing 11 00698 g007
Figure 8. The VIIRS Active Fire Product (middle panel for 750 m and right panel for 375 m) and comparison with MODIS (left panel) King Fire, CA/September 2014. This higher spatial resolution VIIRS product shows higher number of detections, improved mapping capability, and higher fidelity needed for near real-time alerts. (Figure courtesy: Ivan Csiszar, Schroeder, W, STAR Active Fire Team).
Remotesensing 11 00698 g008
Figure 9. The VIIRS Cryosphere products are all operationally produced from the S-NPP and meet APU requirements. (Figure courtesy: Jeff Key, STAR Cryosphere team).
Remotesensing 11 00698 g009
Figure 10. S-NPP ATMS SDR performance. The red and blue bars represent the NEDT on-orbit performance versus the specification for the S-NPP ATMS instrument (left figure). The S-NPP ATMS SDRs show smaller bias between the observed and calculated radiances using the CRTM (O-B) (red) compared to the specifications (blue) (right figure). These figures indicate excellent on-orbit performance of the ATMS instrument. Figures are obtained from 2016 JSTAR Annual Meeting team’s overview presentation available at the JSTAR website [4]. (Figure courtesy: Quanhua Liu, STAR ATMS SDR team).
Remotesensing 11 00698 g010
Figure 11. CrIS NSR/FSR. The full spectral resolution coupled with incredibly low noise in all three bands enables high quality CO and other trace gas retrievals. (Figure courtesy: Flavio Iturbide-Sanchez, STAR CrIS SDR team).
Remotesensing 11 00698 g011
Figure 12. JPSS products captured severe California fire in November 2018: (a) VIIRS Active Fire; (b) VIIRS AOD; (c) CrIS/NUCAPS CO at 500 mb; (d) CrIS/NUCAPS CO at 700 mb. (Figures from JSTAR Mapper website https://www.star.nesdis.noaa.gov/jpss/mapper).
Remotesensing 11 00698 g012
Figure 13. MiRS total precipitable water (upper left panel) compared to ECMWF analysis fields (upper right panel). The scatter plot (lower panel) shows very good agreement with a correlation higher than 0.98 between MiRS retrieved and ECMWF TPW. (Figure courtesy: Quanhua Liu, STAR MiRS team).
Remotesensing 11 00698 g013
Figure 14. OMPS total column ozone products (in Dobson Units) from MetOp-B GOME-2 (NOAA Version 8 algorithm), NASA EOS Aura OMI (NASA Version 8.6 algorithm) and S-NPP OMPS-NM (NOAA Version 8 algorithm) for 1 June 2015. (Figure courtesy: Lawrence E Flynn, STAR OMPS Ozone team).
Remotesensing 11 00698 g014
Figure 15. UV index forecast product (18 November 2016) utilizing S-NPP OMPS observations. (Figure courtesy: Craig Long, NWS).
Remotesensing 11 00698 g015
Figure 16. NOAA-20 validated maturity projections. The red (for S-NPP) and green (for NOAA-20) bars depict validated maturity timelines (Launch/Activation + Months). The lessons learned through S-NPP product maturity, adapting some of the Cal/Val tools developed through S-NPP, methodologies optimized in collecting the in situ measurements are helping to expedite the NOAA-20 validated maturity.
Remotesensing 11 00698 g016
Table 1. S-NPP VIIRS SDR performance meeting the specifications.
BandCenter Wavelength (nm)Specification SNR (RSB & DNB) NEDT (TEB) *Performance (On-Orbit)
RSBM1412316, 352 (LG,HG)1045, 588
M2445409, 380 (LG,HG)1010, 572
M3488414, 416 (LG,HG)988, 628
M4555315, 362 (LG,HG)856, 534
M5672360, 242 (LG,HG)631, 336
M6746199368
M7865340, 215 (LG,HG)631, 457
M8124074221
M9137883227
M101610342586
M1122509022
I1640119214
I2865150264
I316106149
TEBM1237000.3960.12
M1340500.1070.04
M1485500.0910.06
M1510,7630.070.03
M1612,0130.0720.03
I437402.50.4
I511,4501.50.4
DNBDNB7006>10
* Signal-to-noise ratios (SNR) or noise-equivalent Temperature Differences (NEDT) for Reflective Solar Bands (RSB), and Thermal Emissive Bands (TEBs). Radiometric biases for the reflective solar bands are within 2% of MODIS equivalent bands, after bias correction with extensive validation. For the thermal emissive bands, bias is within 0.1 K relative to CrIS on the same spacecraft.
Table 2. S-NPP VIIRS cloud mask performance versus specifications *.
OceanSnow-Free LandDesertSnow-Covered LandSea IceAntarctic and Greenland
Global0.888 (0.87)
Day0.95 (0.92)0.912 (0.90)0.864 (0.85)0.896 (0.88)0.908 (0.82)0.741 (0.80)
Night0.912 (0.90)0.883 (0.88)0.858 (0.85)0.878 (0.85)0.799 (0.72)0.701 (0.70)
* Product performance and specification data (in parenthesis) summarized in the table are obtained from the Enterprise Clouds Algorithms Readiness Review presented on 15 December 2015.
Table 3. S-NPP VIIRS cloud products performance (accuracy: magnitude of the mean measurement errors; precision: the standard deviation of the measurement errors [27]).
ProductRequirementPerformance
Cloud Phase % correct classification data80%>82.6%
Cloud Type % correct classification60%>72.6%
AccuracyPrecisionAccuracyPrecision
Cloud Base Height2 km2 km0.3 km1.7 km
Cloud Optical Depth
Day, water2 or 20%3 or 30%1.59/0.9%4.43/25.7%
Day, ice2 or 20%3 or 30%1.81/3.6%5.02/31.1%
Night30%0.8 or 30%−0.12/7.3%0.63
Cloud Particle Size
Water4 µm4 µm3.03 µm4.30 µm
Ice10 µm10 µm5.69 µm5.23 µm
Table 4. S-NPP VIIRS cloud top products performance.
ProductTypeBiasSTDWithin the Specified AccuracyWithin the Specified Precision
CTH—Cloud Top HeightAll Clouds−0.3 km1.26 km81.9%82.3%
Water−0.02 km0.80 km90.7%90.8%
Ice−0.87 km1.74 km64.5%65.7%
CTT—Cloud Top TemperatureAll Clouds1.65 K9.08 K51.2%36.3%
Water−0.51 K4.08 K70.4%74.5%
Ice4.03 K12.02 K29.8%24.2%
CTP—Cloud Top PressureAll Clouds−11.0 hPa95.7 hPa80.9%80.1%
Water8.8 hPa68.8 hPa89.6%89.4%
Ice−28.6 hPa111.6 hPa73.2%63.7%
Table 5. S-NPP VIIRS land products performance.
ProductRequirementPerformance
Global Gridded Surface Type % correct typing70%77.6 ± 0.6%
AccuracyPrecisionAccuracyPrecision
Land Surface Temperature1.4 K2.5 K−0.08 K2.26 K
Surface Albedo0.080.05−0.0050.05
Surface Reflectance *0.005 + 0.05ρ0.005 + 0.05ρ−0.005600.00563
Green Vegetation Fraction **
Global12%15%8%8.4%
Regional12%15%7.1%7%
Vegetation Index
TOA NDVI0.050.040.0130.012
TOC NDVI0.050.040.0120.018
TOC EVI0.050.040.0200.011
* Surface Reflectance: better than 0.005 + 0.05ρ for M4, M5, M7, I1, I2, I3, M8, M10, M11, shown in table is the Band-5 performance; ρ denotes the retrieved surface reflectance; ** Green Vegetation Fraction: uncertainty requirement 17%; Product performance: 11.6% for global, and 10% for regional
Table 6. S-NPP VIIRS ocean products performance.
ProductRequirementPerformance
AccuracyPrecisionAccuracyPrecision
Ocean ColornLw(410)10%10%1.01530.096
nLw(443)10%10%1.01190.092
nLw(486)10%10%1.01240.088
nLw(551)10%10%1.00980.135
nLw(671)10%10%1.00450.498
Chl-a30%30%1.00160.163
Sea Surface TemperatureDay±0.200.60±0.200.45
Night±0.200.60±0.150.35
Table 7. S-NPP VIIRS atmosphere products performance.
ProductRequirementPerformance
Aerosol Detection (%)
% correct typing, smoke8084.7
% correct typic, dust7092.6
AccuracyPrecisionAccuracyPrecision
Aerosol Optical Depth
Land: AOD < 0.80.060.150.010.05
Land: 0.1 ≤ AOD ≤ 0.80.050.25−0.040.11
Land: AOD > 0.80.200.45−0.190.34
Water: AOD < 0.30.080.150.020.04
Water: AOD ≥ 0.30.150.35−0.010.11
Aerosol Particle Size
550/860 µm, ocean0.30.60.070.39
865/1610 µm, Ocean0.30.6−0.040.33
Volcanic Ash
Height3 km −1.91 km1.37 km
Mass loading2 tons/km22.5 tons/km21.13 tons/km21.40 tons/km2
Table 8. S-NPP VIIRS cryosphere products performance.
ProductRequirementPerformance
Snow cover
Binary Map: % correct typing90%93–94%
Snow fraction: uncertainty20%~17%
Sea ice
Ice surface temperature: uncertainty1 K0.9 K
Ice concentration: uncertainty10%0.9 K
Ice age: % correct typing70%8.9%
AccuracyPrecisionAccuracyPrecision
Ice thickness 0.5 m
VIIRS polar winds7.5 m/s3.8 m/s5.79 m/s3.58 m/s
Table 9. S-NPP CrIS SDR performance *.
ProductBandSpectral Range (cm−1)Number of ChannelsSpectral Resolution (cm−1)NEdN at 287 K BB mW/m2/sr/cm−1Radiometric Uncertainty @287 K BB (%)Frequency Uncertainty (ppm)Geolocation Uncertainty (km)
NSRLW650–10957130.6250.098 (0.14)0.12 (0.45)3 (10)1.2 (1.5)
MW1210–17504331.250.036 (0.06)0.15 (0.58)3 (10)1.2 (1.5)
SW2155–25501592.50.003 (0.007)0.20 (0.77)3 (10)1.2 (1.5)
FSRLW650–10957130.6250.101 (0.14)0.17 (0.45)2 (10)0.25 (1.5)
MW1210–17508650.6250.0522 (0.084)0.21 (0.58)2 (10)0.25 (1.5)
SW2155–25506330.6250.00741 (0.014)0.28 (0.77)2 (10)0.25 (1.5)
* S-NPP CrIS SDR performance and specification (in parenthesis) summary.
Table 10. S-NPP NUCAPS temperature/moisture profile performance and requirements *.
Clear (Cloud < 50%)Cloudy (Cloud ≥ 50%)
Temperature ProfileMoisture ProfileTemperature ProfileMoisture Profile
LayerP (R) KLayerP (R) %LayerP (R) KLayerP (R) %
1–301.5 (1.5)100–30022.7 (35)30–3002.1 (1.5)100–40039.8 (40)
30–3001.1 (1.5)300–60024.9 (35)300–7002.3 (1.5)400–60035.6 (40)
300–Surf1.3 (1.6)600–Surf22.7 (20)700–Surf3.0 (2.5)600–Surf(20)
* S-NPP NUCAPS temperature and moisture profile performance and requirements (in parenthesis) summary.
Table 11. S-NPP NUCAPS trace gases and OLR products performance.
ProductRequirementPerformance
AccuracyPrecisionAccuracyPrecision
IR ozone profile (O3) *
4–260 hPa10%20%−1.8%14.3%
260 hPA - surface10%20%−9.4%21.2%
Carbon Monoxide (CO)±25%35%5.2%5.5%
Carbon Dioxide (CO2)±1% (4 ppmv)0.5% (2 ppmv)
Methane (CH4)±4% (80 ppbv)1% (20 ppbv)
Outgoing Longwave Radiation5 W/m212 W/m21.5 W/m25 W/m2
* Ozone: Uncertainty: 25% (Requirement); Performance: 18.9% (4–260 hPa); 23.2% (260 hPa–Surface).
Table 12. S-NPP MiRS temperature/moisture profile performance *.
ProductSea ClearSea CloudyLand Clear/Cloudy
Temperature ProfileAccuracy (K)Precision (K)Accuracy (K)Precision (K)Accuracy (K)Precision (K)
100 hPa−0.2 (0.2)1.7 (2.0)0.0 (0.8)1.9 (2.0)−0.5 (0.5)1.5 (2.0)
300 hPa0.6 (0.5)1.5 (2.0)0.4 (0.8)1.9 (2.5)0.8 (0.8)1.7 (2.0)
500 hPa−0.5 (0.2)1.1 (2.0)−0.5 (0.6)1.4 (2.0)0.0 (0.2)1.5 (2.5)
900 hPa0.2 (1.5)1.9 (3.0)0.6 (2.0)2.1 (3.0)−0.8 (2.5)2.6 (5.5)
Water Vapor ProfileAccuracy (%)Precision (%)Accuracy (%)Precision (%)Accuracy (%)Precision (%)
400 hPa0 (30)45 (60)0 (30)55 (60)7 (30)45 (60)
500 hPa2 (20)40 (60)2 (20)42 (65)2 (10)35 (60)
700 hPa4 (20)30 (50)2 (10)32 (60)5 (10)30 (50)
900 hPa0 (20)15 (30)0 (20)18 (30)5 (20)25 (50)
700 hPa4 (20)30 (50)2 (10)32 (60)5 (10)30 (50)
900 hPa0 (20)15 (30)0 (20)18 (30)5 (20)25 (50)
* MiRS temperature and water vapor profile performance and requirements (shown in parenthesis) summary.
Table 13. S-NPP MiRS products performance.
ProductRequirementPerformance
Snow cover
Probability of detection (%)8054
Snowfall detection
Probability of detection4051
AccuracyPrecisionAccuracyPrecision
Snowfall rate (mm/h)0.31.00.06
Snow water equivalent (cm)3.06.0−1.2–2.02.1–4.2
Sea ice concentration (%)10252–1010–20
Cloud liquid water (mm)0.030.080.003–0.0090.07
Land surface emissivity (%)
23.8 GHz2.03.00.0–0.42.0–2.3
50.3 GHz1.53.00.1–0.62.7–3.0
165.5 GHz1.54.00.1–0.73.0–3.8
Land surface temperature *4 K7K−1.84 K5.26 K
Total precipitable water (mm)
Sea clear1.52.51.31.8
Sea cloudy0.52.50.21.9
Sea-ice clear/cloudy2.02.0−0.51.6
Land clear /cloudy2.55.5−0.54.8
Snow clear/cloudy0.52.0−0.20.8
Rainfall rate (mm/h)
Sea0.101.00.081.0
Land0.051.50.010.8
* LST performance uncertainty and requirement (shown in parenthesis): 5.58 (8.0) K.
Table 14. S-NPP OMPS SDR performance.
AttributeOMP-NMOMPS-NP
L1RDS ThresholdsPerformanceL1RDS ThresholdsPerformance
Non-linearity accuracy<0.2%<0.2%<0.2%<0.2%
SNR1000>100045–400 channel dependent>1000
Straylight Out-of-band and Out-of-Field response<2%<2%<2%<2%
Orbital thermal wavelength shift0.02 nm~0.006 nm0.02 nm~0.006 nm
Absolute irradiance calibration accuracy<7%<7% for most channels<7%<7% for most channels
Absolute radiance calibration accuracy<8%<8%<8%<8%
Albedo calibration accuracy<2%<2% For most channels<2%<2% For most channels
Table 15. GCOM-AMSR2 products performance.
ProductRequirementPerformance
Cloud Liquid Water
Uncertainty (over ocean)0.05 mm0.03–0.09 mm
Accuracy0.01 mm0.01 mm
Total Precipitable Water
Uncertainty2 mm or 10%1.0–1.8 mm
Accuracy1 mm0.1–0.7 mm
Precipitation (type/rate)
Precision0.05 mm/h0.01 mm/h
Uncertainty, over ocean2 mm/h1.2–1.4 mm/h
Uncertainty, over land5 mm/h3.1–3.6 mm/h
Sea surface temperature
Uncertainty1.0 K0.5–0.7 K
Accuracy0.5 K0.1–0.2 K
Sea surface wind speed
Uncertainty2.0 m/s or 10%0.9–1.5 m/s
Accuracy0.5 m/s0.1–0.3 m/s
Sea ice
Ice concentration, uncertainty10%3.9% NH; 4.4% SH
Ice type, % correct typing70%80–90%, Arctic winter
Snow
Snow depth, uncertainty20 cm15–22 cm
Snow cover, % correct typing80%72–97%
Snow water equivalent
Uncertainty50–70%20–22%
Soil moisture
Uncertainty6%5%

