Letter

Mississippi River and Campeche Bank (Gulf of Mexico) Episodes of Cross-Shelf Export of Coastal Waters Observed with Satellites

by
Daniel B. Otis
1,*,
Matthieu Le Hénaff
2,3,
Vassiliki H. Kourafalou
4,
Lucas McEachron
5 and
Frank E. Muller-Karger
1
1
Institute for Marine Remote Sensing, University of South Florida, College of Marine Science, St. Petersburg, FL 33701, USA
2
University of Miami, Cooperative Institute for Marine and Atmospheric Studies (CIMAS), Miami, FL 33149, USA
3
National Oceanic and Atmospheric Administration, Atlantic Oceanographic & Meteorological Laboratory (AOML), Miami, FL 33149, USA
4
University of Miami, Rosenstiel School of Marine and Atmospheric Science, Miami, FL 33149, USA
5
Florida Fish and Wildlife Conservation Commission, St. Petersburg, FL 33701, USA
*
Author to whom correspondence should be addressed.
Submission received: 25 February 2019 / Revised: 16 March 2019 / Accepted: 22 March 2019 / Published: 26 March 2019
(This article belongs to the Section Ocean Remote Sensing)

Abstract

:
The cross-shelf advection of coastal waters into the deep Gulf of Mexico is important for the transport of nutrients or potential pollutants. Twenty years of ocean color satellite imagery document such cross-shelf transport events via three export pathways in the Gulf of Mexico: from the Campeche Bank toward the central Gulf, from the Campeche Bank toward the Florida Straits, and from the Mississippi Delta to the Florida Straits. A catalog of these events was created based on the visual examination of 7280 daily satellite images. Water transport from the Campeche Bank to the central Gulf occurred frequently and with no seasonal pattern. Transport from Campeche Bank to the Florida Straits occurred episodically, when the Loop Current was retracted. Four such episodes were identified, between about December and June, in 2002, 2009, 2016, and 2017, each lasting ~3 months. Movement of Mississippi River water to the Florida Straits was more frequent and showed near seasonal occurrence, when the Loop Current was extended, while the Mississippi River discharge seems to play only a secondary role. Eight such episodes were identified—in 1999, 2000, 2003, 2004, 2006, 2011, 2014, and 2015—each lasting ~3 months during summer. The 2015 episode lasted 5 months.

1. Introduction

The advective transport of water between different regions is an important mechanism for plankton and larval transport, with relevance to marine biodiversity, coral reef ecosystems, and coastal fisheries. This type of connectivity is of great interest to define ecosystem-based management strategies in the Gulf of Mexico [1,2]. For example, the northeastern perimeter of the Campeche Bank represents the main source of red grouper and lionfish recruits to the northeastern Gulf of Mexico [3]. In addition, it is also relevant for the transport of pollutants, as observed during the 2010 Deepwater Horizon oil spill e.g., [4,5]. An increased understanding of transport mechanisms between coastal areas in the Gulf of Mexico is of value to both the scientific and management communities. In this paper we document cross-shelf export pathways from the Campeche Bank and the Mississippi Delta, providing additional detail to the processes described by [6,7].
The main driver of large-scale circulation in the Gulf of Mexico is the Loop Current System, which consists of the Loop Current and eddies shed by the Loop Current (Figure 1). The Loop Current enters the Gulf as the Yucatan Current (Figure 1, green). From here, its path continuously evolves in time. The Loop Current alternates between a “retracted” state (Figure 1, red), in which the Yucatan current turns to the east as it enters the Gulf of Mexico and flows along northern Cuba to enter Florida Straits, and an “extended” state (Figure 1, blue), where the Loop Current travels north into the central Gulf and retroflects clockwise to turn south along the west Florida shelf and then enters the Florida Straits [8,9,10,11,12]. When extended, the Loop Current eventually sheds a large (>300 km diameter) anticyclonic eddy (Figure 1, orange) that then drifts westward before decaying in the western Gulf [13,14]. As the Loop Current sheds such an eddy, it returns to its retracted state. The shedding period between two consecutive Loop Current Eddy shedding events is variable, from 0.5 to 19 months with a mean value of 8 months [11,15,16,17]. The shedding of an eddy can happen at any time of the year, but various satellite data show that eddies are more typically shed during spring and summer [18].
Surrounding the deep Gulf and the Loop Current, the geography of the continental shelf is of relevance to where cross-shelf transport events typically occur. Here we focus on two such locations, namely, the Campeche Bank and off the Mississippi Delta, but cross-shelf advection occurs in many places around the Gulf [7]. These two locations provide the most visible signature of long-distance export of shelf waters around the Loop Current. Shelf waters are associated with a signature in ocean color, typically in chlorophyll-a content or turbidity, which can be used as a tracer for such water masses. This tracer reveals pathways for surface transport of nutrients, fish and coral larvae, or pollutants, which are of interest in the Gulf.
The Campeche Bank is an inclined carbonate platform, which is relatively narrow (a few kilometers) on the eastern side of the Yucatan Peninsula but much broader (~200 km) along the northern and western Yucatan Peninsula [3]. The Campeche Bank is productive biologically, hosting a diverse array of commercially and ecologically important pelagic, benthic, and reef species [3,19]. Recent genetic and modeling studies have examined the variability in biological connections between the Caribbean Sea, Campeche Bank, and the Gulf of Mexico [19,20], and found that the magnitude and direction of marine taxa recruitment varies widely across the Campeche Bank platform. Wind-driven and topographic upwelling is nearly permanent on the eastern Campeche Bank [21,22,23] and seasonal along the northern side of the Yucatan peninsula. The Campeche Bank hosts the Mexican National Park of Alacranes Reef (Parque Nacional Arrecife Alacranes), and several other marine protected areas are located upstream east of the Yucatan Peninsula, such as Puerto Morelos, Isla Mujeres, and Cozumel, which host coral reef ecosystems, along the western side of the incoming Loop Current.
The Mississippi River is the largest river in North America, with an average discharge rate of over 13,000 cubic meters per second [24,25,26,27]. The Mississippi River also delivers nutrients and organic matter to coastal areas of the Gulf [28]. Most Mississippi River water disperses along the coast to the west, but a large fraction also disperses to the east. Mississippi River water can be transported offshore and carried over long distances into the interior of the Gulf and as far as the Florida Keys [10,29]. There are three mechanisms by which Mississippi River water is entrained offshore and carried toward the Florida Straits. One is by entrainment by the Loop Current in its extended state [10,30,31]. Another is by indirect entrainment by eddies shed by the Loop Current [14,32]. The third mechanism are currents along the outer West Florida Shelf [33,34,35]. The fate of Mississippi River water in the Gulf of Mexico has been the subject of many other observational and modeling studies [25,36,37,38,39].
The goal of this study is to quantitatively assess the timing and duration of episodes when coastal waters are exported into the Gulf of Mexico and examine how the timing of those events relates to discharge levels from the Mississippi River along with the extent of the Loop Current in the Gulf of Mexico. Specifically, three types of export events are quantified: transport of coastal waters from the Campeche Bank into the central Gulf of Mexico, transport of coastal waters from the Campeche Bank to the Florida Straits, and the transport of waters of Mississippi River origin to the Florida Straits. The Florida Keys, located in the Florida Straits, host a very large marine protected area, the Florida Keys National Marine Sanctuary. It is important, for the management of this Sanctuary, to assess how exposed it is to distant water masses, but also to which source its reef population can potentially be connected.
An automated approach to analysis of ocean color satellite images is not sufficient to capture the episodic nature of these events because observations are limited by clouds, sunglint, low solar elevations, and high sensor viewing angles. Visual inspection of images allows for the identification of features, even when only a portion of the feature may be visible. For this study, satellite images of chlorophyll-a (Chl-a) concentrations in the Gulf of Mexico were visually examined for the presence of the three features mentioned above. Chlorophyll-a was used here as a proxy to examine surface expressions of coastal and shelf water transport. In coastal and shelf areas, satellite-derived Chl-a is only an estimate of phytoplankton biomass, due to other optically active constituents present in the water, including colored dissolved organic matter (CDOM) and suspended sediments [10,40,41]. We also note that, once the coastal masses reach the deep Gulf of Mexico, Chl-a is not a passive tracer: cyclonic eddies, such as those found at the edge of the Loop Current, are associated with raised thermocline and nutricline, which promote an increase in Chl-a in the mixed layer that is visible at the surface (e.g., [42]. Although imperfect, Chl-a is still a valid tracer that has been widely used to follow patterns of coastal water export [10,43,44]. We developed a catalog of transport events based on 20 years of daily satellite images of chlorophyll-a concentration from the Sea-Viewing Wide Field of View Sensor (SeaWiFS) for 1998–2003 and the Moderate Resolution Imaging Spectrometer (MODIS-Aqua) sensor from 2004–2017.

2. Materials and Methods

2.1. Satellite Imagery

Level-2 daily pass files from SeaWiFS and MODIS-Aqua (R2014.0 reprocessing) with a spatial resolution of 1-km were obtained for the Gulf of Mexico (18°-31°N; 79°-98°W) from the Ocean Biology Processing Group (OBPG) at NASA’s Goddard Space Flight Center. All satellite overpass files for each day were mapped to an equidistant cylindrical projection covering the Gulf of Mexico using the SeaWiFS Data Analysis Software package (SeaDAS version 7.4). Using a set of MATLAB™ routines, a total of 7280 daily images collected from January 1st, 1998 until December 31st, 2017 were examined visually to create a catalog of events. Images with excessive cloud cover that showed no visible evidence of any type of transport were excluded from further analyses. MODIS-Aqua Chl-a concentrations were also extracted from the maroon polygon shown in Figure 1. To examine the event in 2015 where Mississippi River water was transported to the Florida Straits over a period of several months, daily MODIS-Aqua data were binned to monthly intervals. Monthly chlorophyll-a climatologies were made by creating a composite of all MODIS-Aqua images from a particular month for the years 2003–2017.

2.2. Quantification of Export Events by Visual Inspection

Each daily Chl-a image was visually inspected for evidence of three types of events (northward transport across the Campeche Bank, southward transport of Mississippi River water to the Florida Straits, and transport of Campeche Bank water to the Florida Keys region). As each image was inspected, evidence of each event type was recorded and compiled into a catalog, which was then binned to monthly intervals and reported as a time series of images per month of each event type. If a particular image showed evidence of more than one type of transport, it was included in the catalog for each. This method was utilized in order to observe these types of transport in patchy satellite images that an automated routine would miss. One limitation of this approach is that subjective interpretation is required for some images, which is unavoidable. However, all visual inspections of imagery were carried out by the same analyst and the utmost care was taken to ensure consistency.

2.3. Estimates of Loop Current Extent

The extent of the Loop Current was estimated using satellite altimetry. We used the Mapped Absolute Dynamic Topography (MADT) field from the Copernicus Marine Environment Monitoring Service (CMEMS) from the European Commission (also known as AVISO data). We used the delayed-time products, available since 1993. These are interpolated to a daily temporal resolution on a 0.25° spatial grid. Following the approach from Leben (2005), we identified the contour of the Loop Current on each daily MADT map as the isoline of 17 cm anomaly with respect to the Gulf of Mexico mean value. We considered the Loop Current contour between the entrance of the Gulf of Mexico east of the Campeche Bank at 21.5°N to the exit in the Florida Straits at 81°W. The Loop Current northern extent was estimated as the northernmost latitude reached along the Loop Current contour.

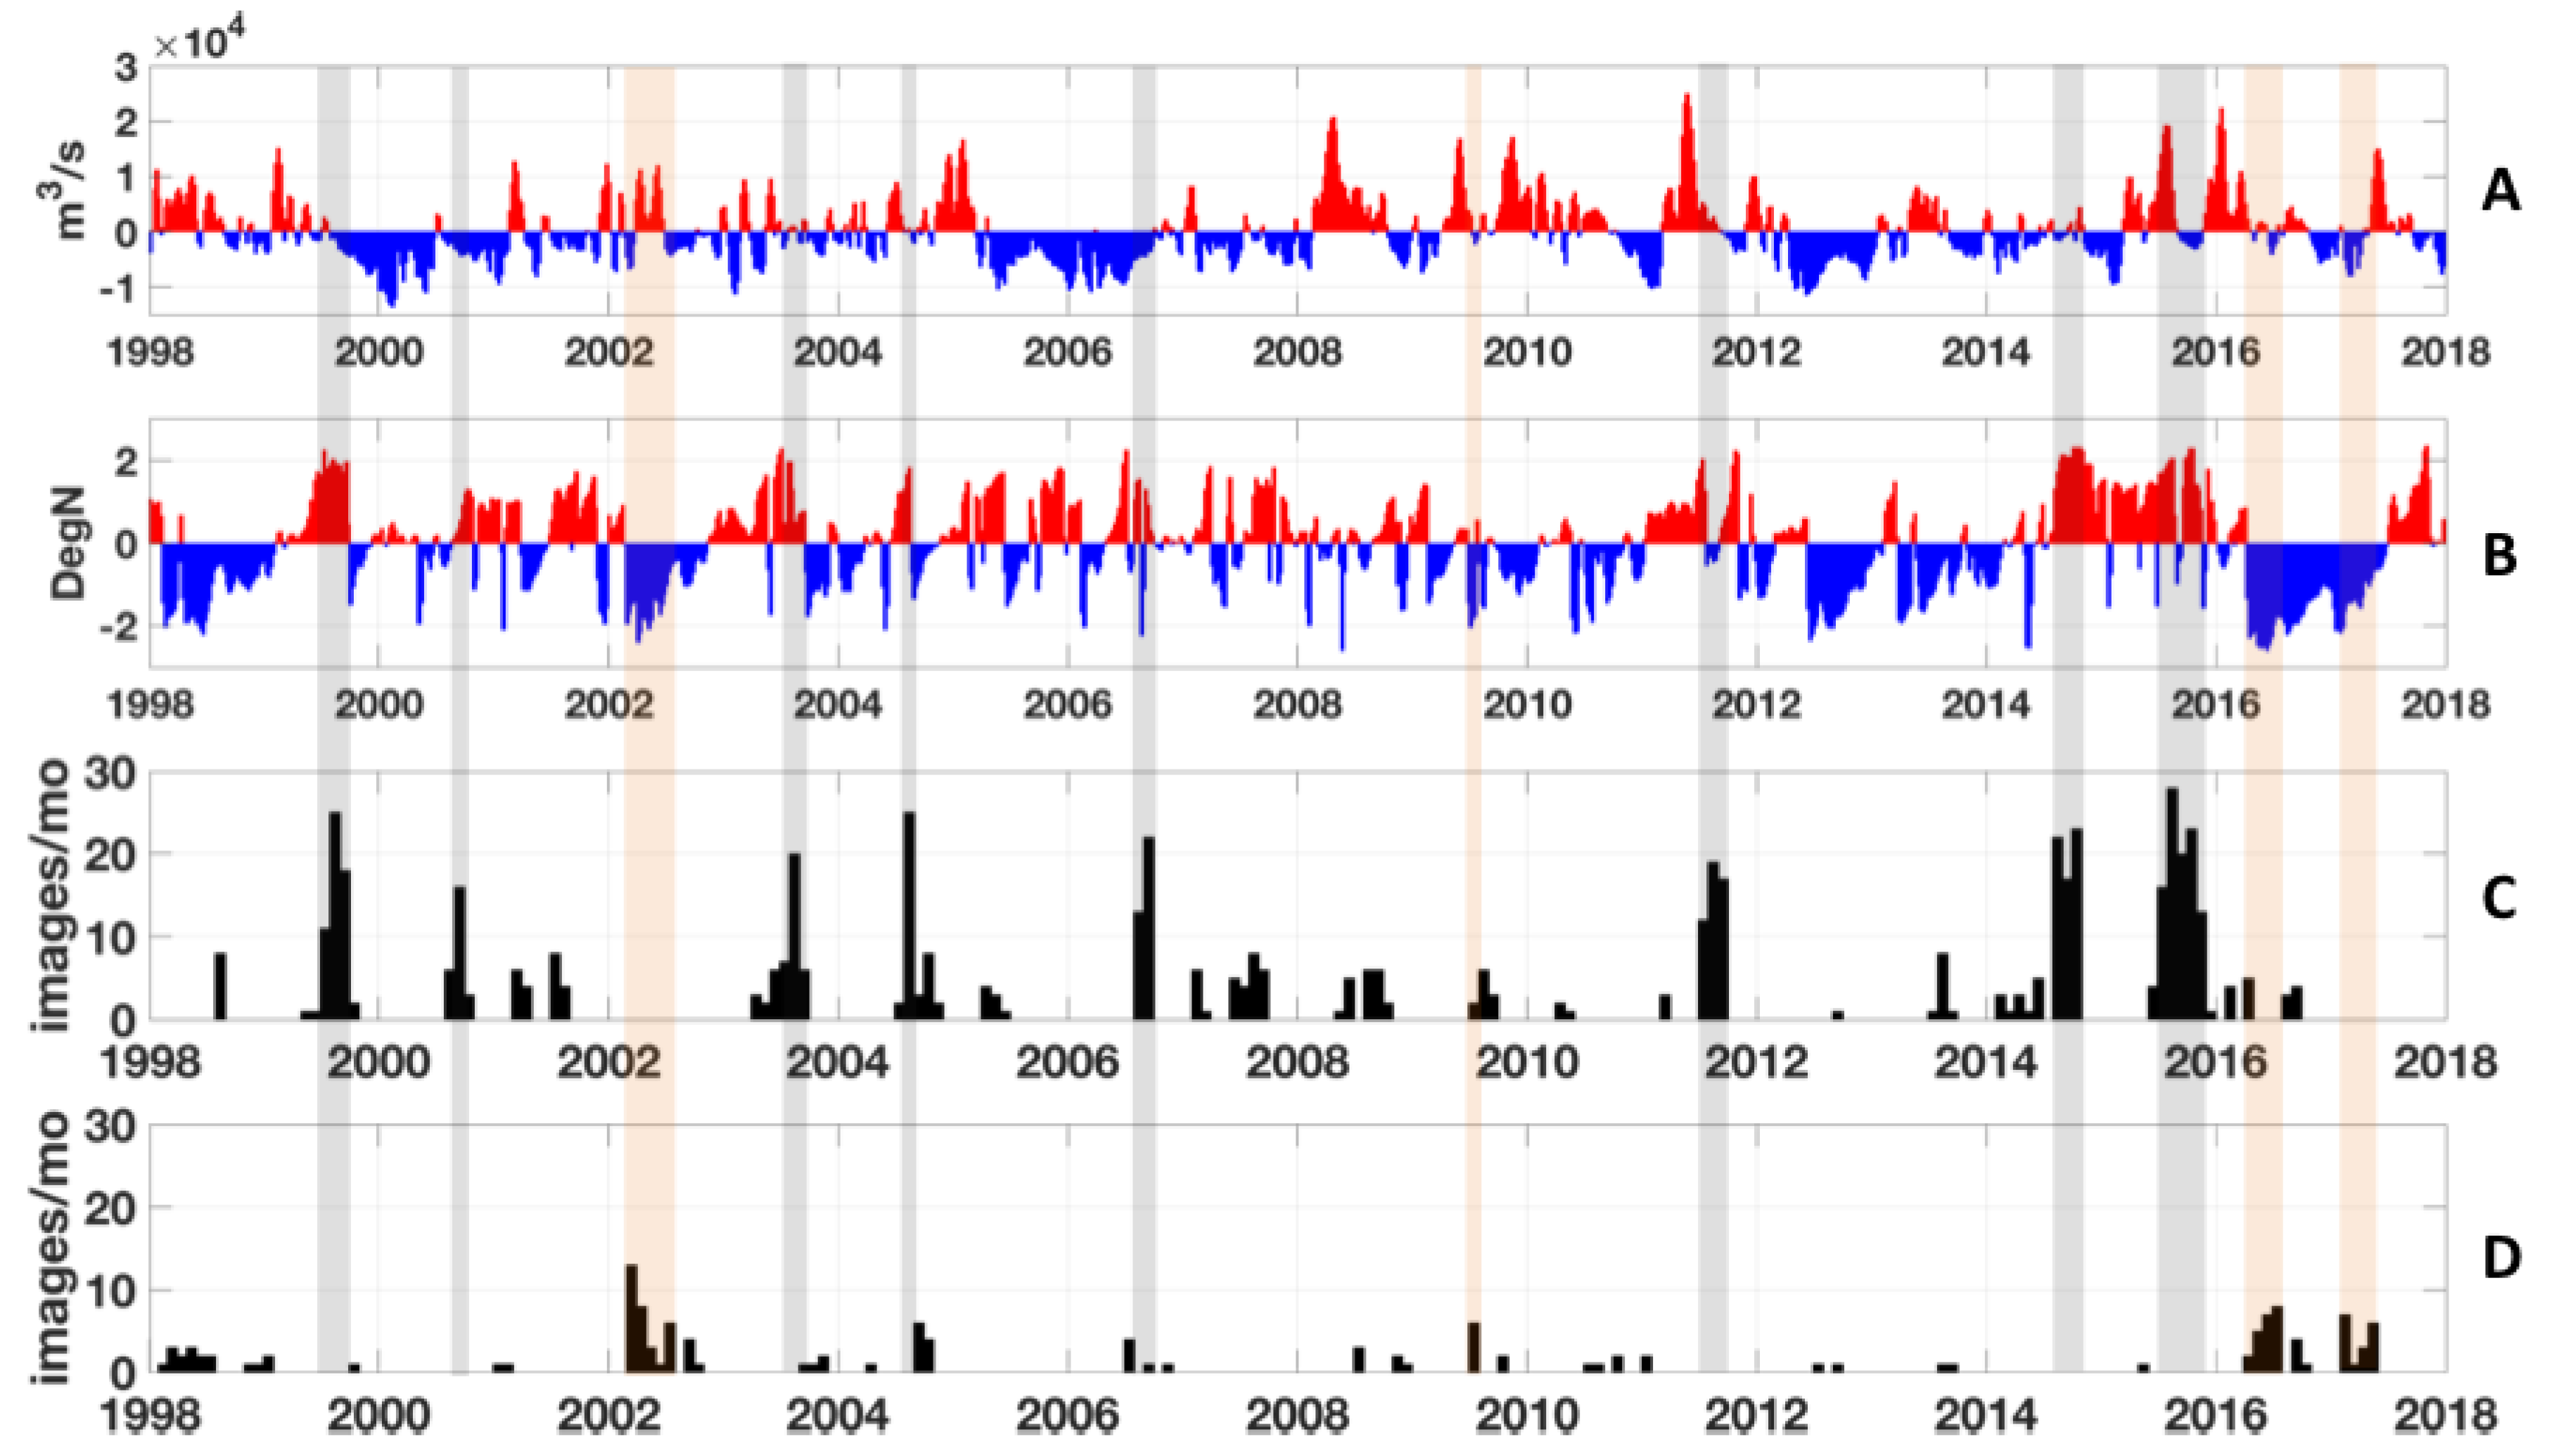
2.4. Mississippi River Discharge

Mississippi River discharge records were obtained from a gaging station at Tarbert Landing, Mississippi. This station is operated by the Army Corps of Engineers. River discharge was reported once per day in ft3/s, which was converted to m3/s.

3. Results

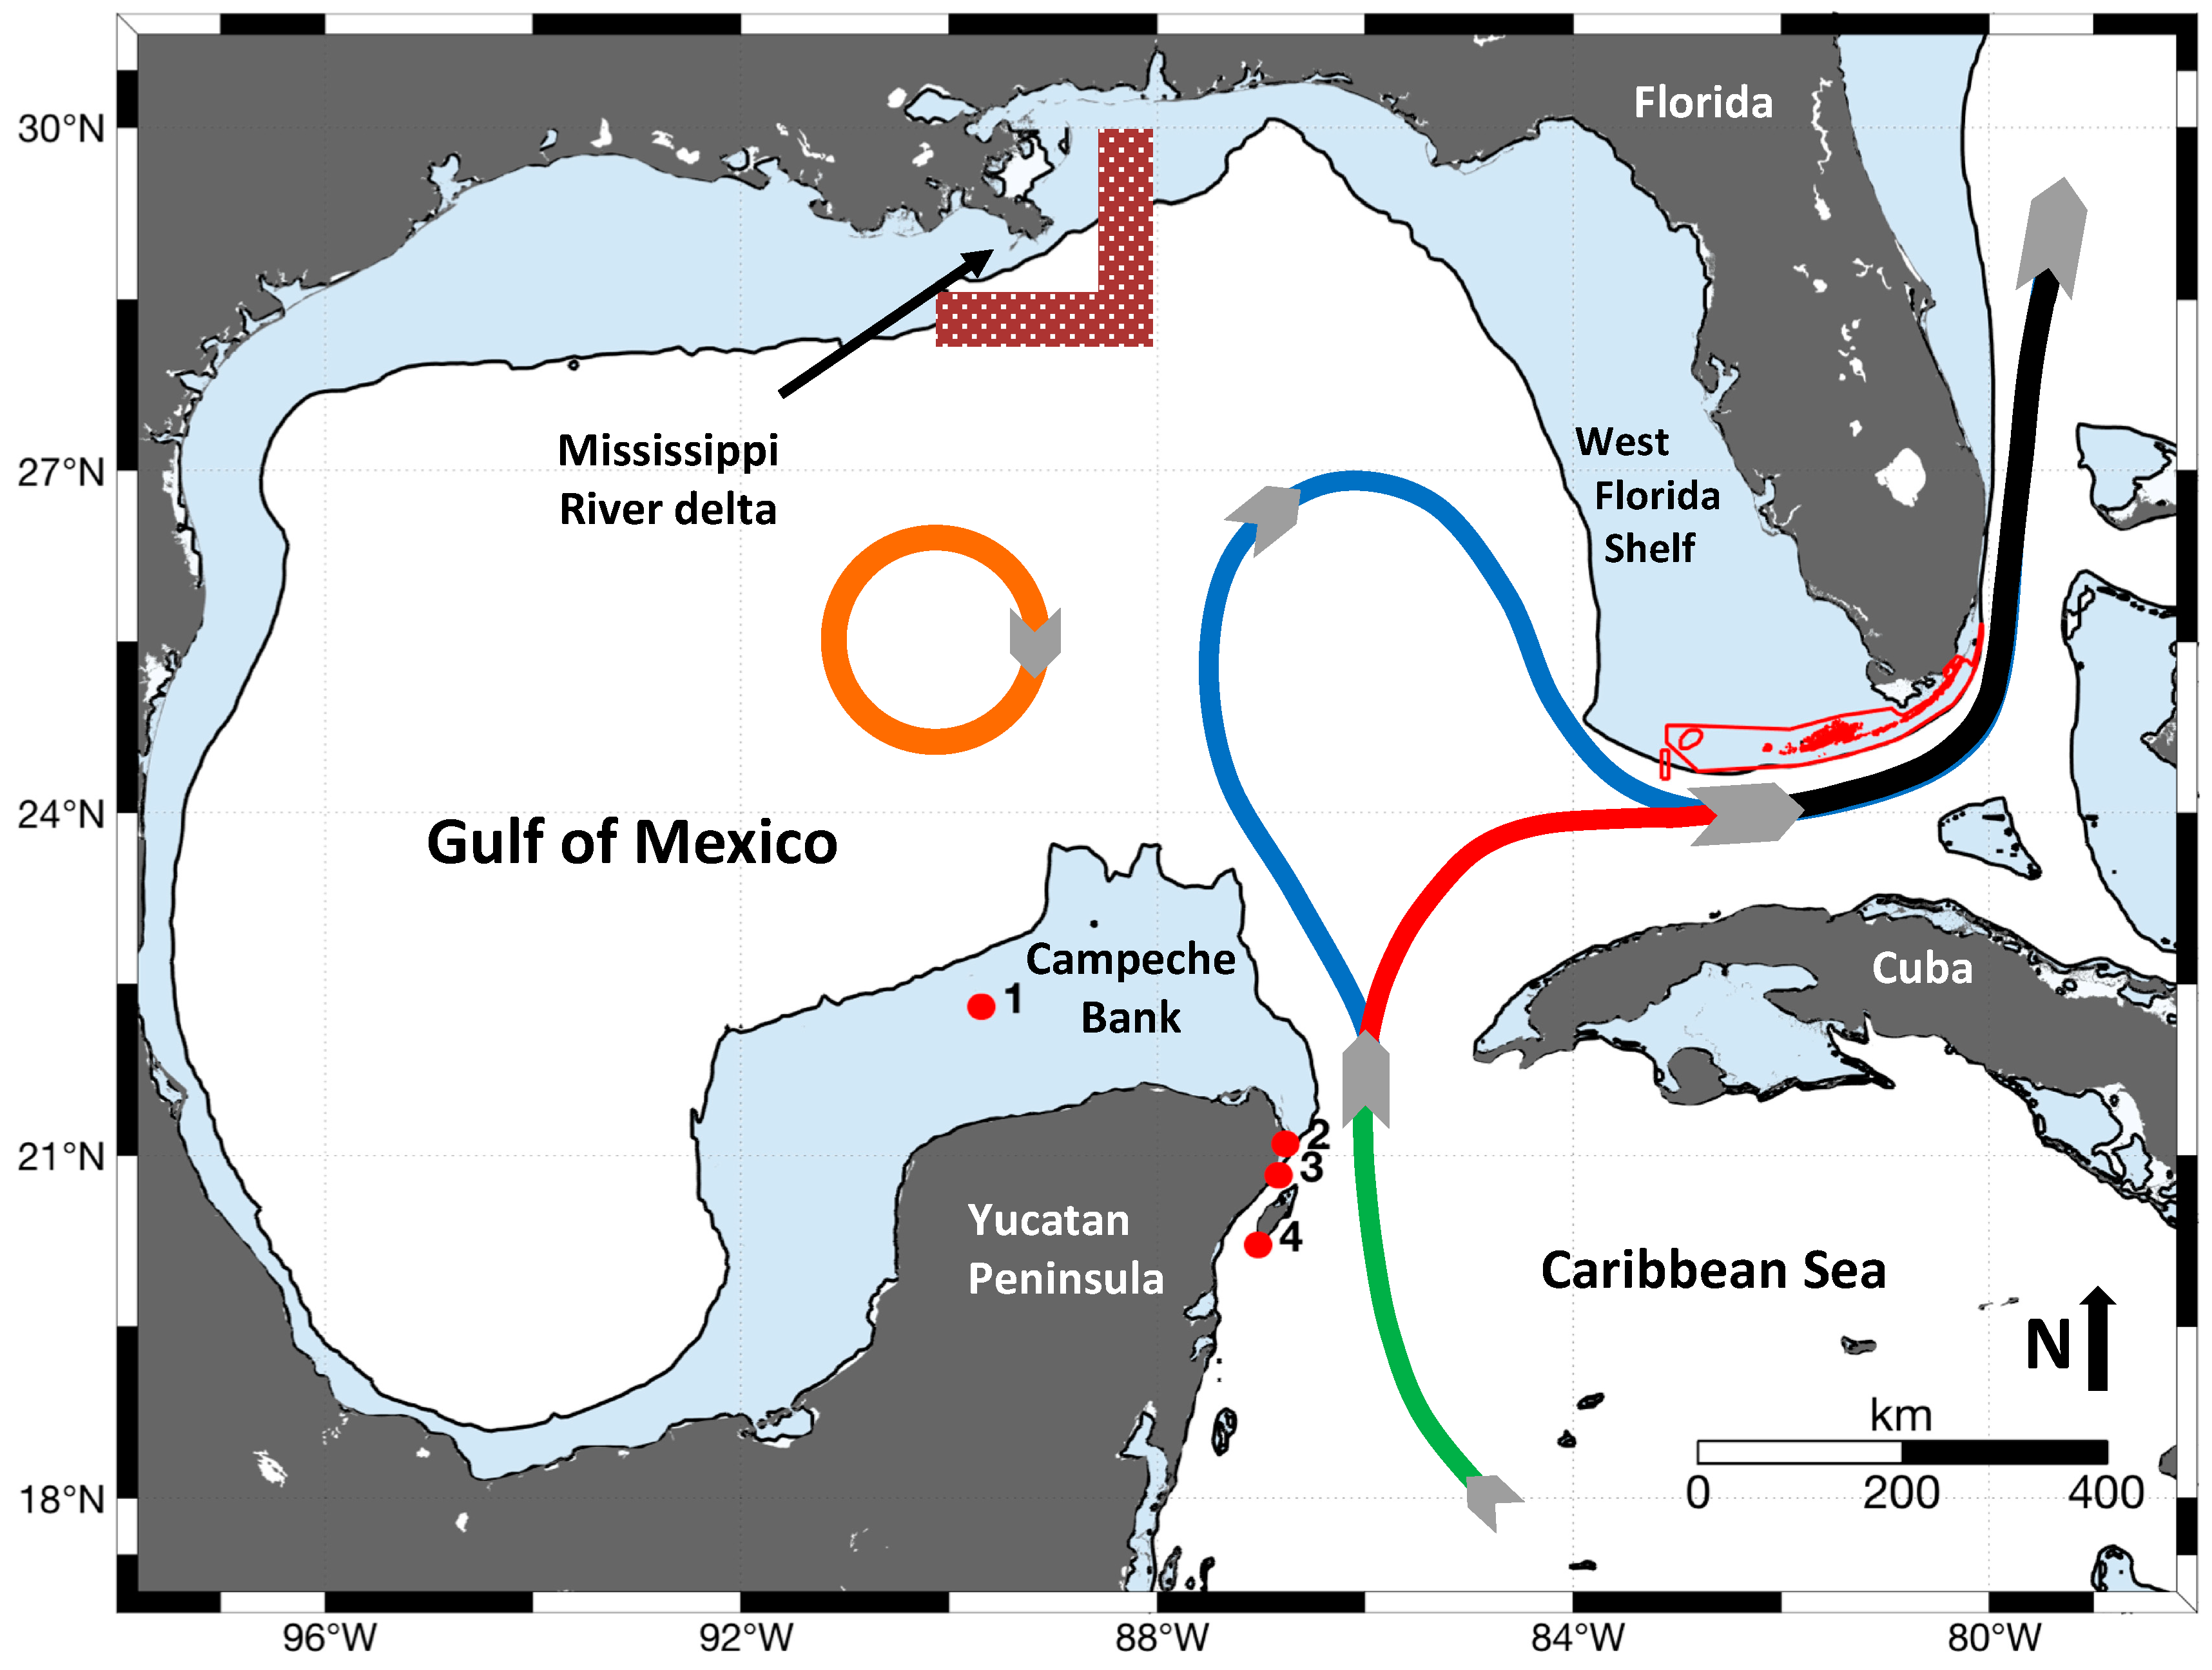
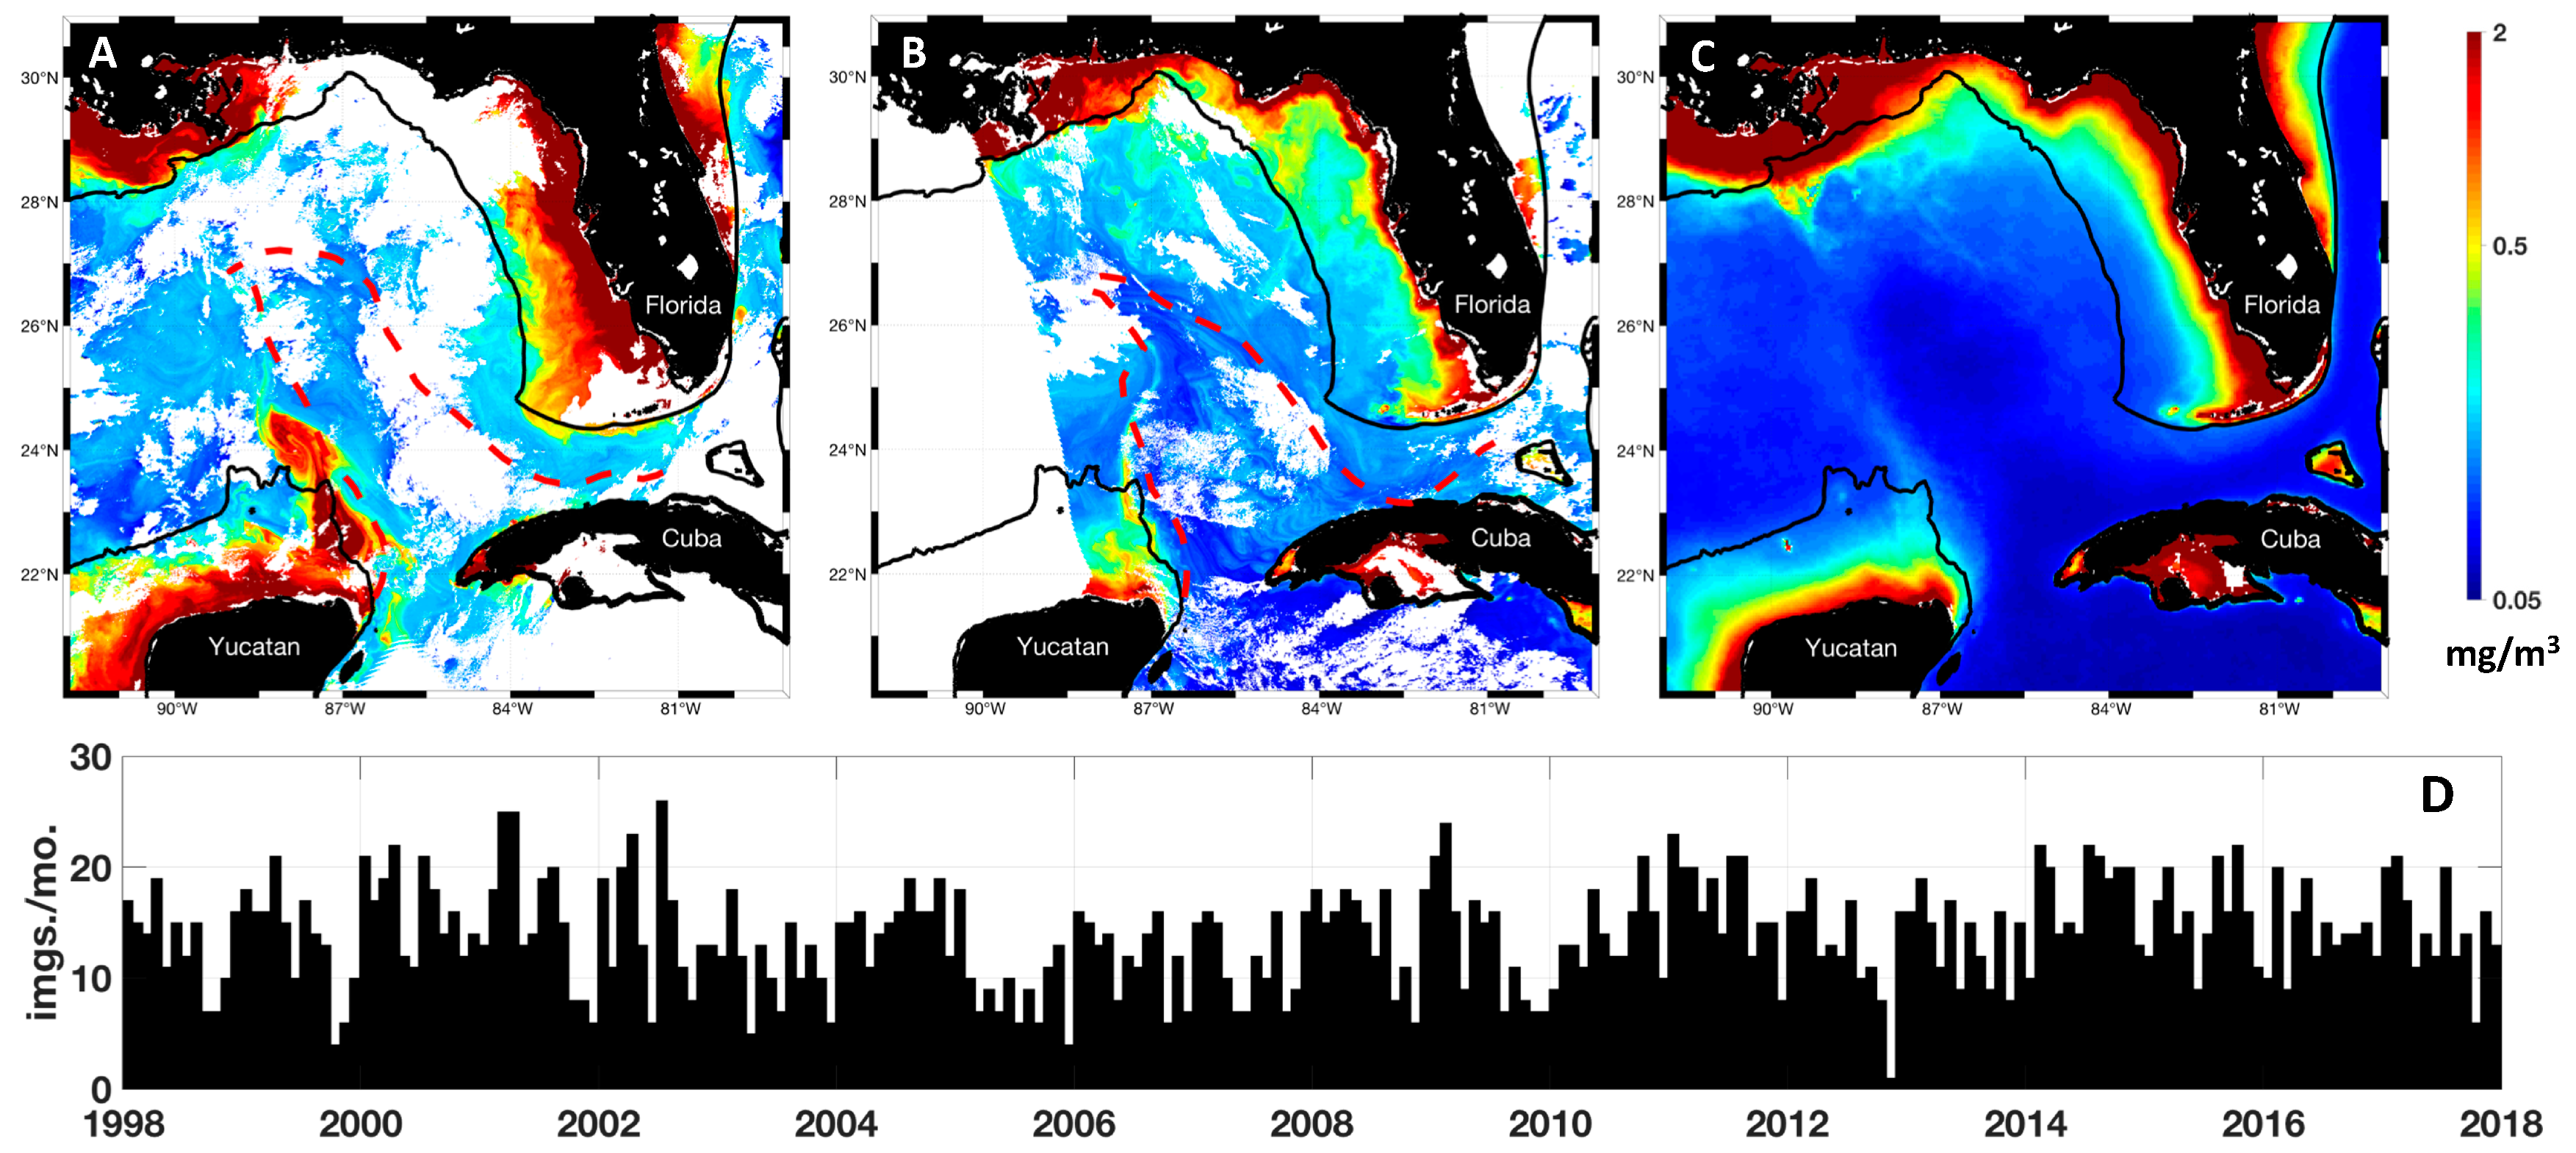
3.1. Transport from the Campeche Bank to the Central Gulf of Mexico

Examples of the three cross-shelf transport events are shown in Figure 2, Figure 3 and Figure 4. Figure 2 shows examples of Campeche Bank water transported into the central Gulf of Mexico. Figure 2A shows an image from October 27th, 2005, it shows a large plume of turbid water advected north into the central Gulf. Image 2b is from March 30th, 2008, it shows a narrower filament of coastal water extending into the central Gulf along the western edge of the Loop Current. This type of transport event occurred frequently, and can be observed in monthly climatologies (e.g., Figure 2C, which shows MODIS-Aqua Chl-a climatology for May 2003–2017). A time series of images per month where evidence of this type of transport was observed (Figure 2D) indicates that they are common and observed throughout the year with no discernable seasonal pattern. Evidence of such transport was observed in 46% of all images, with an average of 13.4 images per month.

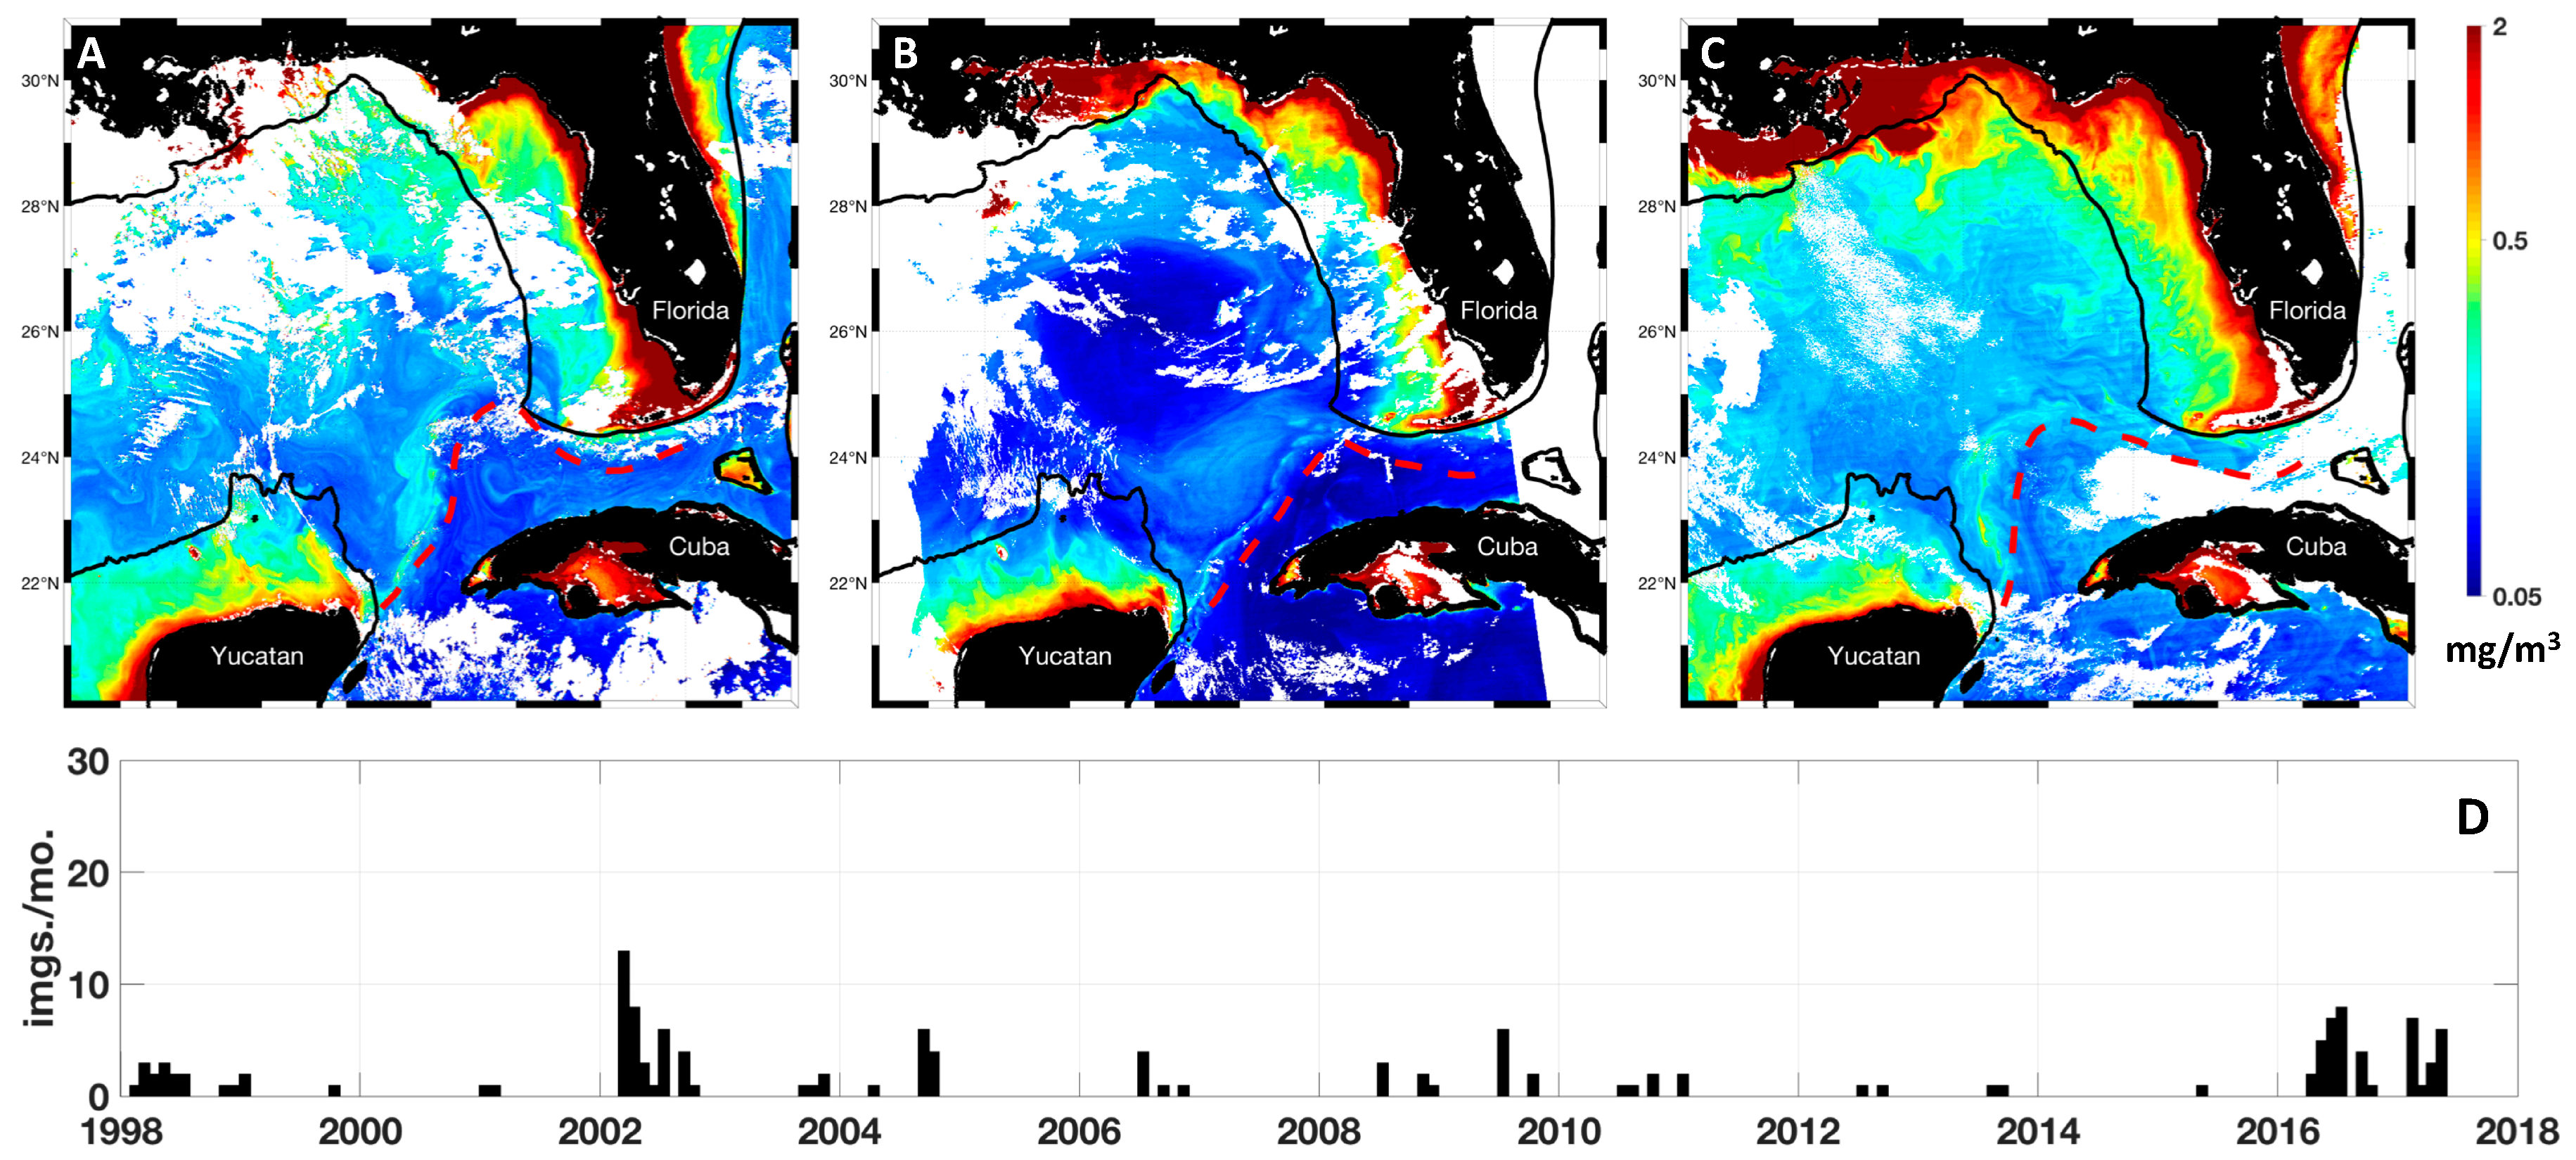
3.2. Transport from the Campeche Bank to the Florida Straits

Examples of the high chlorophyll concentration front extending from Campeche Bank to the Florida Straits are seen in the images in Figure 3. The images in Figure 3 are from March 14th, 2002 (A), May 21st, 2016 (B), and February 10th, 2017 (C). This type of transport was observed far less frequently than transport from the Campeche Bank to the central Gulf of Mexico, as seen in the time series of images per month where evidence of Campeche Bank to Florida Straits transport was observed (Figure 3D). Out of 7280 images analyzed, evidence for such transport was only seen in 150 images, with an average of 0.6 images per month. However, this type of event was not observed uniformly through time and tended to occur most often during late spring. The most noticeable episodes of these events are seen in 2002 and 2016-2017 (Figure 3D). These episodes and their relationship to the northern extent of the Loop Current are discussed below.

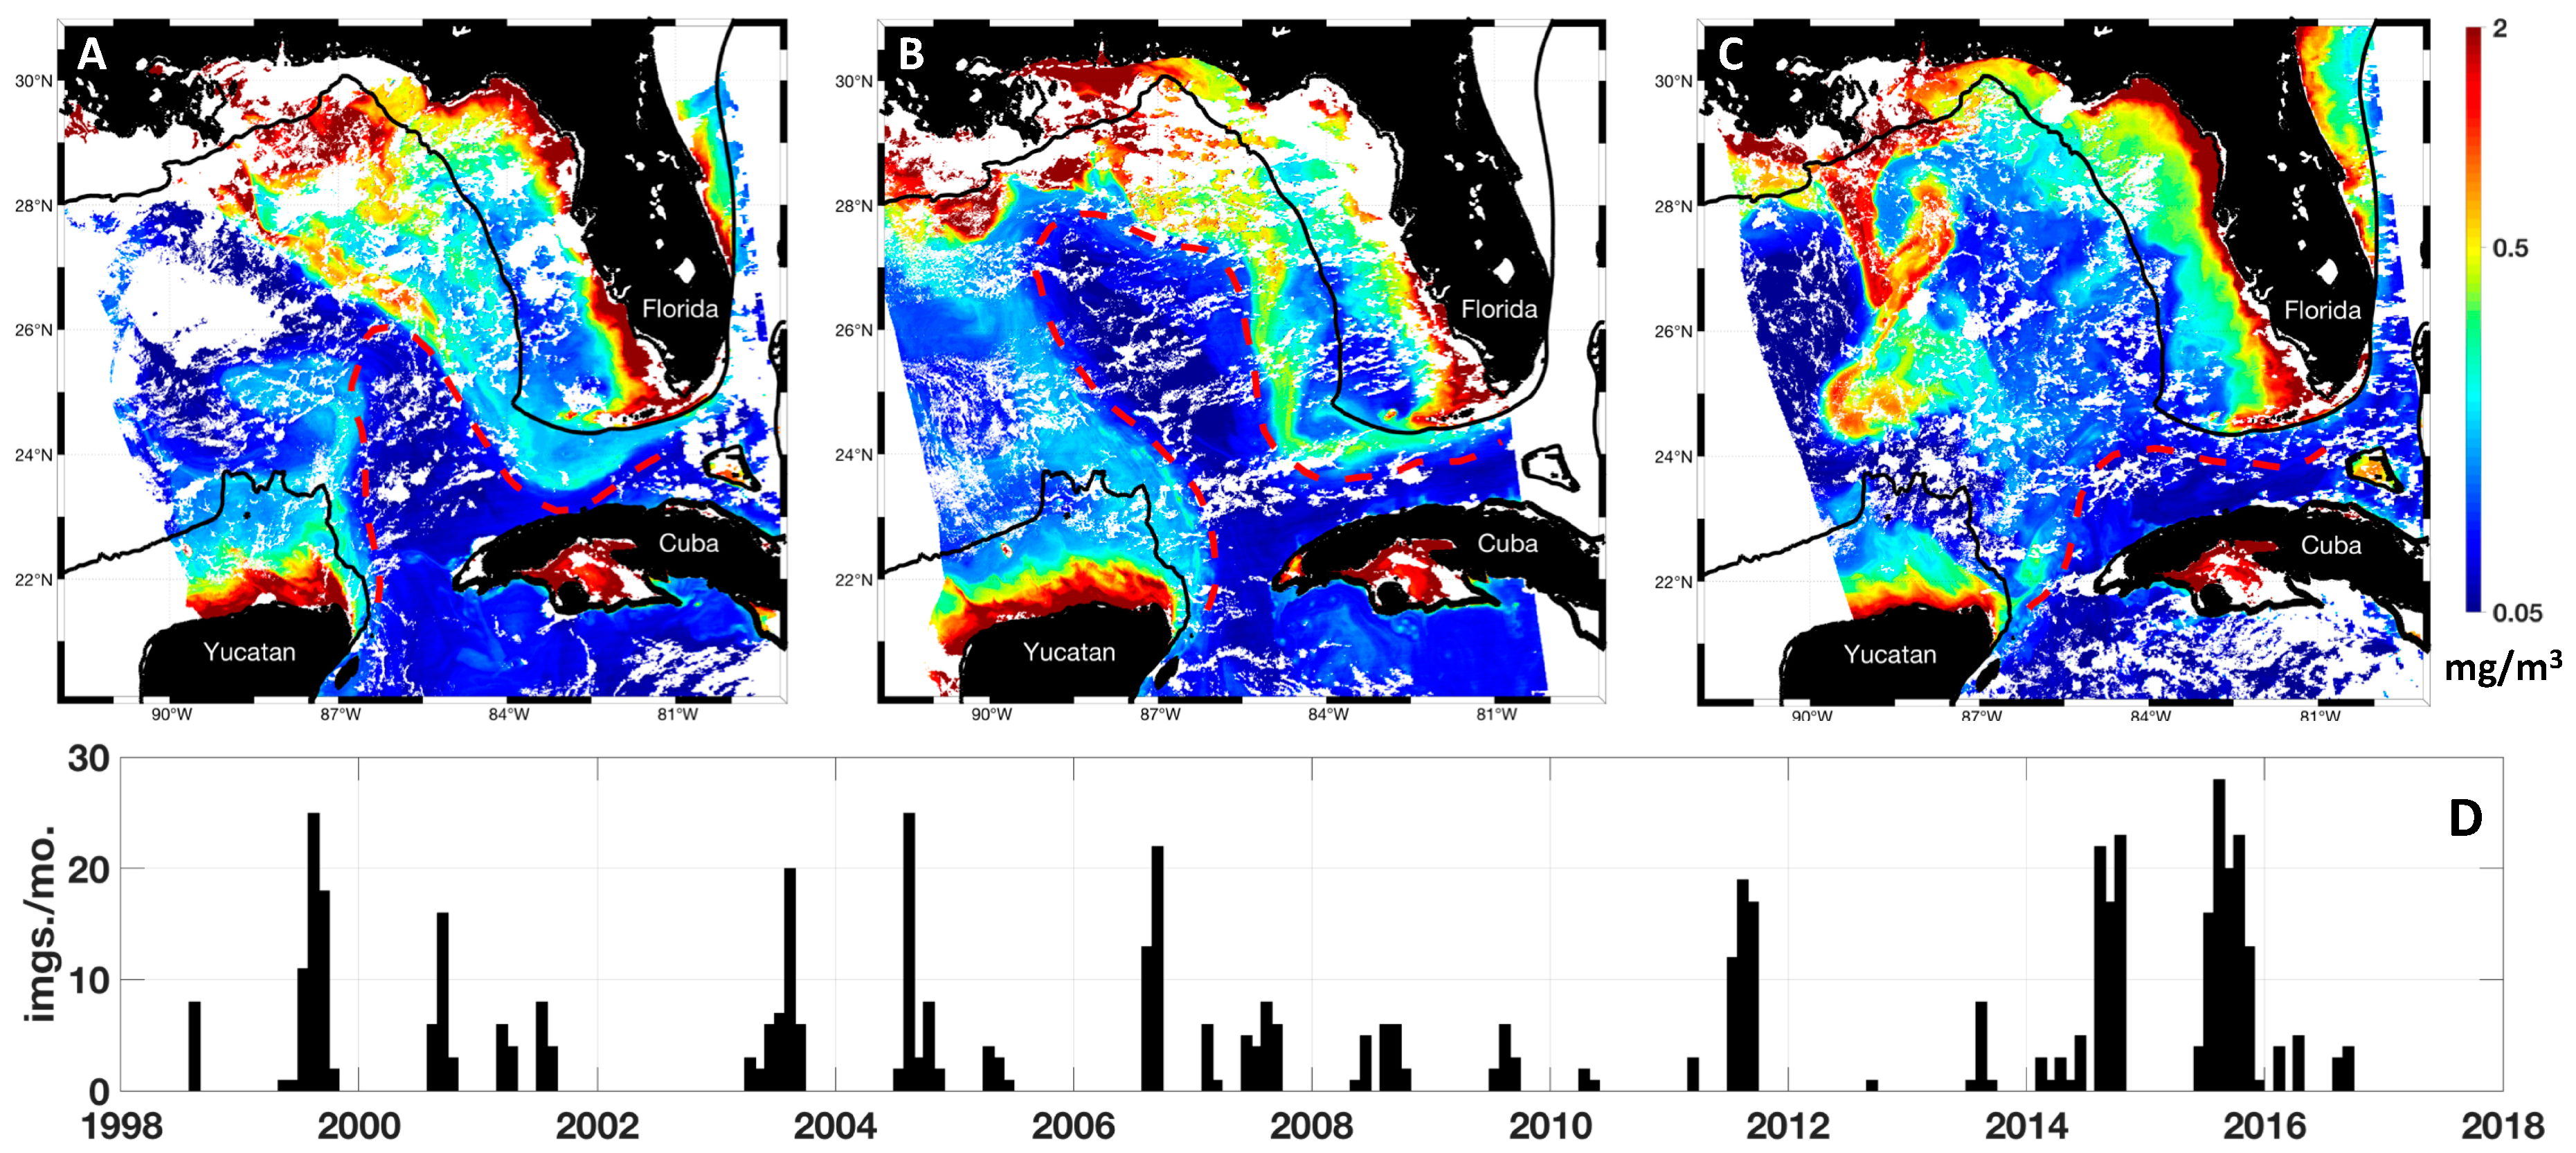
3.3. Transport from the Mississippi Delta to the Florida Straits

Figure 4 shows examples of Mississippi River water transported toward the Florida Straits along the eastern edge of the Loop Current. Figure 4A,B illustrate conditions on March 5th, 2011 and July 22nd, 2015, respectively. Figure 4C, from August 8th, 2016, shows turbid water flowing southward from the Mississippi Delta, but this water did not reach Florida Straits. The difference is that the Loop Current was in an extended state in Figure 4A,B, while it is in a retracted state in Figure 4C. The long-distance transport events to the Florida Straits are episodic but have occurred mainly in summer (Figure 4D). Evidence for this type of transport was observed in 562 of the 7280 images analyzed with an average of 2.2 images per month. Notable episodes of this type of transport were evident in 1999, 2000, 2003, 2004, 2006, 2011, 2014, and 2015. We discuss these events in more detail below.

3.4. Mississippi River Discharge and Loop Current Extent

Figure 5 shows time series of Mississippi River discharge, chlorophyll-a concentrations extracted from an area near the Mississippi Delta (polygon shown in Figure 1), and the northward extent of the Loop Current. The seasonal cycle of Mississippi River discharge (Figure 5A) shows a maximum in spring and a minimum during the fall. Chlorophyll-a concentration estimates extracted from satellite data near the mouth of the river are shown in Figure 5B. The Mississippi River discharge and the log of satellite chlorophyll-a values extracted for the Mississippi Delta area show a significant correlation (R=0.45, with river discharge preceding chlorophyll-a concentration by two weeks).
Mississippi River discharge alone is not sufficient to explain the offshore transport of Mississippi River waters. Other processes play an important role, such as wind [26,32,37] and local mesoscale dynamics [23,36,37,45]. Figure 5C shows a time series plot of the northernmost extent of the Loop Current. The average northward extent of the Loop Current is 26.35°N. Figure 5C shows that the Loop Current extent is variable, with no clear seasonal cycle. The Loop Current northern extent varies from just over 24°N to ~28.5°N, with a standard deviation of 1.25°, in agreement with previous studies [15].

4. Discussion

Anomalies of apparent chlorophyll-a concentration near the Mississippi River mouth, Mississippi River discharge, and Loop Current northern extent were calculated by subtracting a monthly climatology for each variable from monthly average time series. Figure 6A shows the anomaly in Mississippi River discharge, with positive anomalies visible in red (periods when river discharge exceeded climatological values). Above-normal discharge levels occurred in 2004, 2008, 2009, 2011, 2015, and 2016. The number of occurrences of water transport from the Mississippi River Delta to the Florida Straits is shown in Figure 6C. Instances of transport from Campeche Bank to the Florida Straits are shown in Figure 6D. As mentioned previously, there was no distinct seasonal pattern to the northward extent of the Loop Current. However, several periods were visible when the Loop Current existed in an extended or retracted state over periods ranging from several months to over a year. For example, during most of 1998, 2002, 2012–2013, and 2016–2017, the Loop Current was in a retracted state, while for much of 1999 and 2014–2015, the Loop Current was in an extended state.
To quantitatively assess transport events from the Mississippi River Delta to Florida Straits, and from Campeche Bank to Florida Straits, we visually identified periods when (a) 10 or more images per month showed Mississippi River Delta to Florida Straits transport, and (b) five or more images per month showed Campeche Bank to Florida Straits transport. These thresholds were established based on inspection of Figure 6C,D, as well as the distribution of the number images per month of each type of transport. We refer to these episodes as “transport events” (shaded areas in Figure 6). Using these criteria, we observed eight Mississippi River Delta to Florida Straits transport events (in 1999, 2000, 2003, 2004, 2006, 2011, 2014, and 2015), and four Campeche Bank to Florida Straits transport events (in 2002, 2009, 2016, and 2017).
Anomalies of Mississippi River discharge were then calculated starting from two months prior to the start of these transport events until the end of the event, as a delay is expected between increased Mississippi River discharge and the appearance of Mississippi River to Florida Straits transport in satellite imagery. This delay is based on a two month lag between the peaks in the climatology of Mississippi River discharge, which occurs on May 10th (black line, Figure 5A) and the climatological peak of extracted chlorophyll-a values in the Mississippi Delta on July 11th (black line, Figure 5B). Anomalies of northward Loop Current extent were also calculated during these two types of events. Values of the Mississippi River discharge and Loop Current extent anomalies during transport events are given in Table 1. During Mississippi River Delta to Florida Straits transport events, the Mississippi River discharge anomaly is positive during four of the eight events (2003, 2004, 2011, and 2015), negative during three events (1999, 2000, and 2006), and near-normal for one event (2014). The 2014 event was studied by Le Hénaff and Kourafalou (2016).
During all of the observed Mississippi River Delta to Florida Straits transport events, the anomaly of Loop Current northern extent is positive. The positive anomaly can be modest, for example 0.36° in the 2006 episode, which can be due to the separation or detachment of a Loop Current eddy. This would make the Loop Current northern extent suddenly drop during the export episode. At the same time, a newly formed Loop Current eddy might temporarily stay to the north of the Loop Current, near the Mississippi Delta, and also facilitate offshore transport [39]. High Mississippi discharge is also a favorable condition, although not a necessary one [36]. Our findings suggest that an extended state of the Loop Current System (Loop Current and associated eddy field) is required for Mississippi River Delta to Florida Straits transport, whereas elevated levels of Mississippi River discharge seem to play a secondary role.
Direct Campeche Bank to Florida Straits transport was observed only when the Loop Current is in a retracted state (i.e., the anomaly of northward Loop Current extent is negative). Anomalies of Mississippi River discharge are not relevant for this process.
Table 1 shows months of the year during which transport events occurred and how long they persisted. On average, Mississippi River Delta to Florida Straits transport events took place between July and September, except in 2015 when it lasted until November; the events typically occurred in late August, with an average duration of ~3 months. Campeche Bank to Florida Straits transport events typically occurred in late May, with an average duration of ~3 months in the February to July timeframe.

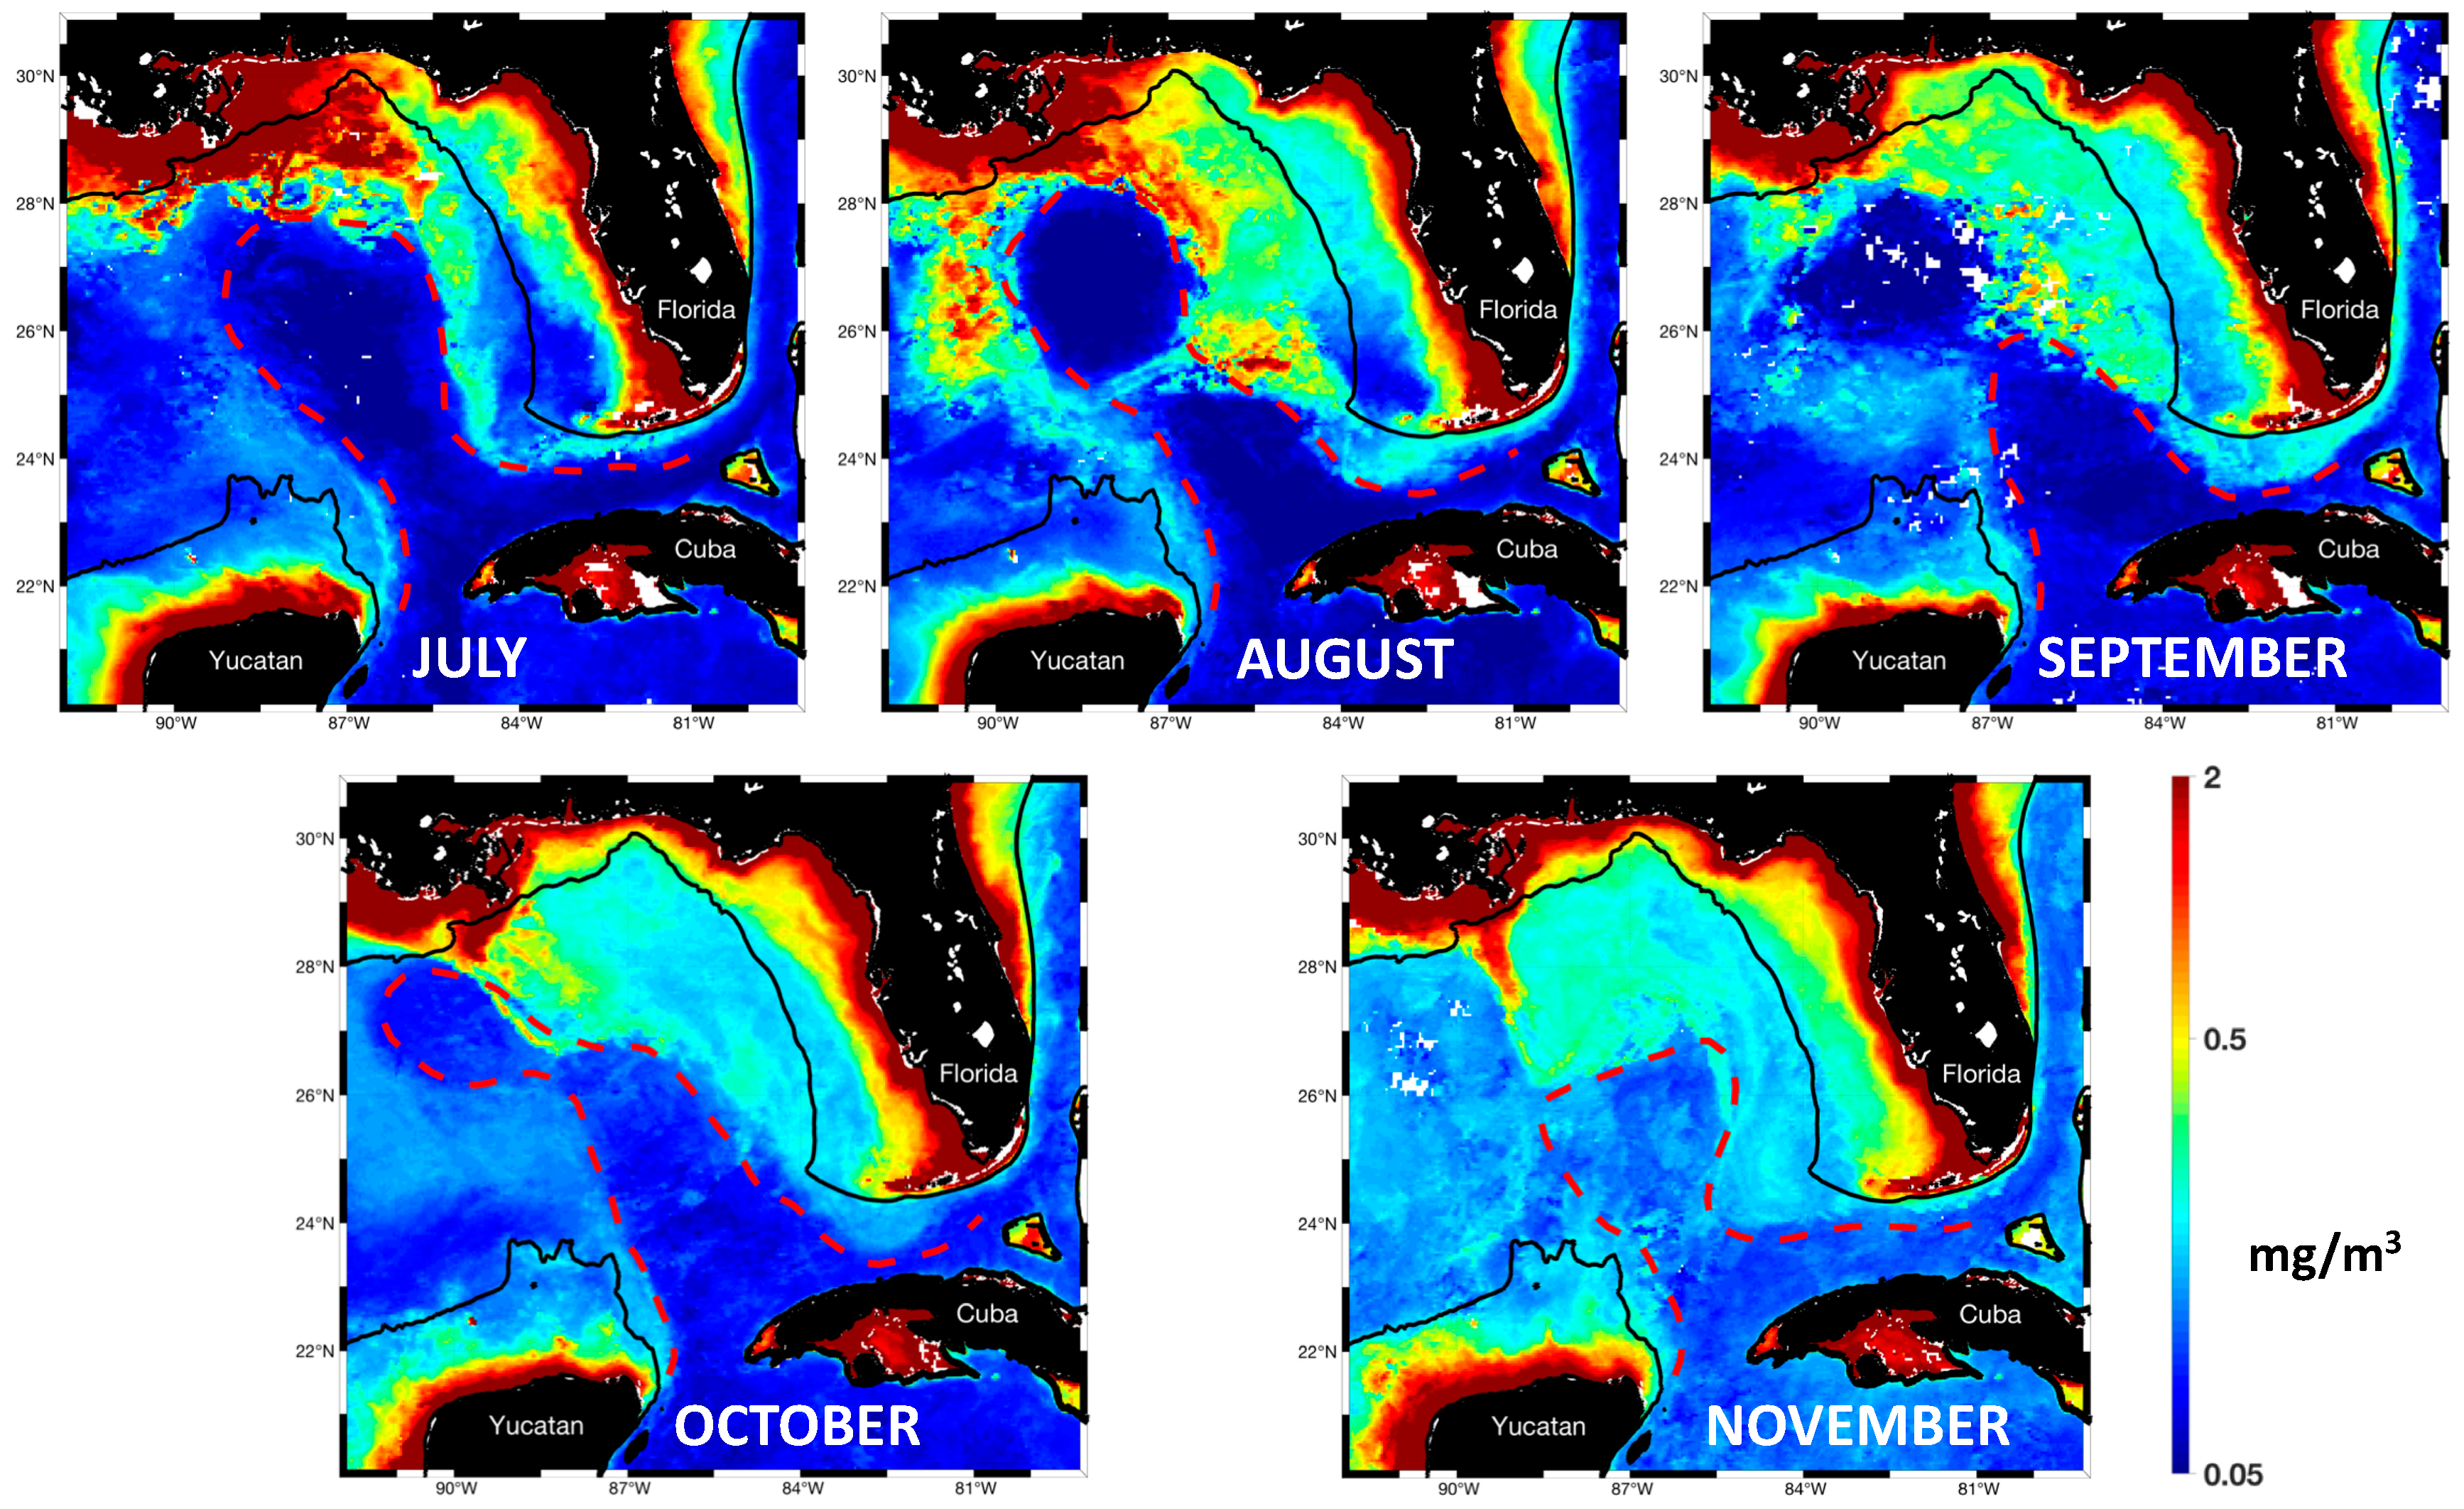
2015 Mississippi River to Florida Straits Transport Event

The 2015 Mississippi River Delta to Florida Straits transport events was the most intense and longest (> 5 months) of those observed between 1998 and 2017 (Figure 7). This event had a large positive anomaly in Mississippi River discharge and coincided with a highly extended Loop Current. Figure 7 shows the accumulation of turbid water around the Mississippi Delta in July after high Mississippi River discharge (Figure 6A). Figure 6B shows that during this time the Loop Current was >1.5° north of its average northward extent, except for two brief periods when the Loop Current extent dropped due to the detachment of a Loop Current eddy in late August and mid-November. These drops were temporary and the Loop Current eddy did not separate fully but reattached, allowing the Loop Current to return to an extended state.
Figure 5 and Figure 6 show that both 2015 and 2016 had above-normal Mississippi River discharge, which led to plumes of turbid water near the Mississippi Delta. However, there was no marked transport event to the Florida Keys in 2016, compared to 2015 (Figure 7). The difference is due to the state of the Loop Current. During 2014 and 2015, the Loop Current was in a predominantly extended state, while starting in early 2016, the Loop Current reverted to a retracted state after separation of a Loop Current eddy. The Loop Current remained retracted until mid-2017.

5. Conclusions

Twenty years of satellite observations were used to quantify the occurrence of offshore transport events and pathways for dispersal of turbid coastal waters into the interior of the eastern half of the Gulf of Mexico. A catalog of river and coastal transport events to offshore waters in the Gulf of Mexico was developed based on ocean color satellite images. Analyses of the catalog shows that the Loop Current plays a key role in defining the type of transport event observed any one year.
Transport from the Mississippi Delta to the Florida Straits, which carries large quantities of river waters, nutrients, and potentially pollutants from the Northern Gulf toward the Florida Keys reef ecosystems, occurred when the Loop Current extended far north into the Gulf of Mexico. These events were mainly observed during the late northern summer and early fall, and most persisted for ~3 months.
Transport from the Campeche Bank to the Florida Straits, which illustrates the short route to the Florida Keys from the Campeche Bank and the reef ecosystems located just upstream along the Yucatan Peninsula, occurred primarily when the Loop Current is retracted (Table 1). These events occurred in the spring and early summer, and also lasted on average ~3 months. Mississippi River discharge does not play a role in defining the mechanism of transport to the Florida Keys, but has significant local effect in the northern Gulf of Mexico.
The pattern of northward Loop Current extent seen in this study did not exhibit any seasonal pattern, but the Loop Current was observed to exist in either an extended or retracted state for long periods of time, particularly during recent years (largely extended in 2014–2015 and retracted for most of 2016 and the first half of 2017). The factors that control Loop Current incursions into the Gulf of Mexico and the shedding of Loop Current Eddies are an active area of current research and have been identified by the National Academy of Sciences as a target area for further studies that must employ both observations and modeling [12].
Future work on coastal transport in the Gulf of Mexico could focus on the ecology of offshore coastal water transport events. Further, focus on the western regions of the Gulf would help understand processes that affect important conservation areas like the Flower Garden Banks off Texas e.g., [46].

Author Contributions

Conceptualization, D.B.O., M.L.H., F.E.M.-K., V.H.K., and L.M.; Methodology, D.B.O., M.L.H., and F.E.M.-K.; Formal Analysis, D.B.O. and M.L.H.; Writing—Original Draft Preparation, D.B.O. and M.L.H.; Writing—Review and Editing, D.B.O., M.L.H., F.E.M.-K., V.H.K., and L.M.

Funding

This paper is a result of research funded by the National Oceanic and Atmospheric Administration’s RESTORE Act Science Program under award NA15NOS4510226 to the University of Miami. It is also the result of research funded by NASA grant NNX14AP62A ‘National Marine Sanctuaries as Sentinel Sites for a Demonstration Marine Biodiversity Observation Network (MBON)’ funded under the National Ocean Partnership Program (NOPP RFP NOAA-NOS-IOOS-2014-2003803 in partnership between NOAA, BOEM, and NASA).

Acknowledgments

This study has been conducted using E.U. Copernicus Marine Service Information. The AVISO mapped altimetry products were produced by Ssalto/Duacs and distributed by the Copernicus Marine Environment Monitoring Service (http://marine.copernicus.eu). M. Le Hénaff received partial support for this work from the base funds of the NOAA Atlantic Oceanographic and Meteorological Laboratory.

Conflicts of Interest

The authors declare no conflicts of interest.

References

  1. Ogden, J.C. Marine managers look upstream for connections. Science 1997, 278, 1414–1415. [Google Scholar] [CrossRef]
  2. Roberts, C.M. Connectivity and management of Caribbean coral reefs. Science 1997, 278, 1454–1457. [Google Scholar] [CrossRef]
  3. Johnston, M.W.; Bernard, A. A bank divided: Quantifying a spatial and temporal connectivity break between the Campeche Bank and the northeastern Gulf of Mexico. Mar. Biol. 2017, 164. [Google Scholar] [CrossRef]
  4. Walker, N.D.; Pilley, C.T.; Raghunathan, V.V.; D’Sa, E.J.; Leben, R.R.; Hoffmann, N.G.; Brickley, P.J.; Coholan, P.D.; Sharma, N.; Graber, H.C.; et al. Impacts of loop current frontal cyclonic eddies and wind forcing on the 2010 Gulf of Mexico Oil spill. In Monitoring and Modeling the Deepwater Horizon Oil Spill: A Record-Breaking Enterprise, Geophysical Monograph Series; Liu, Y., Macfadyen, A., Weisberg, R.H., Eds.; American Geophysical Union: Washington, DC, USA, 2012; Volume 195, pp. 103–116. [Google Scholar] [CrossRef]
  5. Le Hénaff, M.; Kourafalou, V.H.; Paris, C.B.; Helgers, J.; Aman, Z.M.; Hogan, P.J.; Srinivasan, A. Surface evolution of the Deepwater Horizon oil spill patch: Combined effects of circulation and wind-induced drift. Environ. Sci. Technol. 2012, 46, 7267–7273. [Google Scholar] [CrossRef] [PubMed]
  6. D’Sa, E.J.; Korobkin, M. Examining SeaWiFS chlorophyll variability along the Louisiana coast using wavelet analysis. In Proceedings of the OCEANS 2009, Biloxi, MS, USA, 26–29 October 2009. [Google Scholar]
  7. Martínez-López, B.; Zavala-Hidalgo, J. Seasonal and interannual variability of cross-shelf transports of chlorophyll in the Gulf of Mexico. J. Mar. Syst. 2009, 77, 1–20. [Google Scholar] [CrossRef]
  8. Vukovich, F.M.; Crissman, B.M.; Bushnell, M.; King, W.J. Some aspects of the oceanography of the Gulf of Mexico using satellite and in situ data. J. Geophys. Res. 1979, 84, 7749–7768. [Google Scholar] [CrossRef]
  9. Vukovich, F.M. 1988: Loop Current boundary variations. J. Geophys. Res. 1988, 93, 15585–15591. [Google Scholar] [CrossRef]
  10. Muller-Karger, F.E.; Walsh, J.J.; Evans, R.H.; Meyers, M.B. On the Seasonal Phytoplankton Concentration and Sea Surface Temperature Cycles of the Gulf of Mexico as Determined by Satellites. J. Geophys. Res. 1991, 96, 12645–12665. [Google Scholar] [CrossRef]
  11. Muller-Karger, F.E.; Smith, J.P.; Werner, S.; Chen, R.; Roffer, M.; Liu, Y.; Muhling, B.; Lindo-Atichati, D.; Lamkin, J.; Cerdeira-Estrada, S.; et al. Natural Variability of Surface Oceanographic Conditions in the Offshore Gulf of Mexico. Prog. Ocean. 2015. [Google Scholar] [CrossRef]
  12. National Academies of Sciences, Engineering, and Medicine. Understanding and Predicting the Gulf of Mexico Loop Current: Critical Gaps and Recommendations; The National Academies Press: Washington, DC, USA, 2018. [Google Scholar] [CrossRef]
  13. Fratantoni, P.S.; Lee, T.N.; Podesta, G.P.; Muller-Karger, F.E. The influence of Loop Current variability on the formation and evolution of cyclonic eddies in the Southern Straits of Florida. J. Geophys. Res. 1988, 103, 24759–24779. [Google Scholar] [CrossRef]
  14. Toner, M.; Kirwan, A.D., Jr.; Poje, A.C.; Kantha, L.H.; Muller-Karger, F.E.; Jones, C.K.R.T. Chlorophyll dispersal by eddy-eddy interactions in the Gulf of Mexico. J. Geophys. Res. 2003, 108. [Google Scholar] [CrossRef] [Green Version]
  15. Leben, R.R. Altimeter-derived loop current metrics. In Circulation in the Gulf of Mexico: Observations and Models; Sturges, W., Lugo-Fernandez, A., Eds.; American Geophysical Union: Washington, DC, USA, 2005; Volume 161, pp. 181–201. [Google Scholar]
  16. Lindo-Atichati, D.; Bringas, F.; Goni, G.; Muhling, B.; Muller-Karger, F.E.; Habtes, S. Variability of mesoscale structures with effects on larval fish distribution in the northern Gulf of Mexico during spring months. Mar. Ecol. Prog. Ser. 2012, 463, 245–257. [Google Scholar] [CrossRef]
  17. Dukhovskoy, D.S.; Leben, R.R.; Chassignet, E.P.; Hall, C.A.; Morey, S.L.; Nedbor-Gross, R. Characterization of the uncertainty of Loop Current metric using a multidecadal numerical simulation and altimeter observations. Deep Sea Res. I Oceanogr. Res. Pap. 2015, 100, 140–158. [Google Scholar] [CrossRef]
  18. Chang, Y.L.; Oey, L.Y. Why does the Loop Current tend to shed more eddies in summer and winter? Geophys. Res. Lett. 2012, 39, L05605. [Google Scholar] [CrossRef]
  19. Sanvicente-Anorve, L.; Zavala-Hidalgo, J.; Allende-Arandia, M.E.; Hermoso-Salazar, M. Connectivity patterns among coral reef systems in the southern Gulf of Mexico. Mar. Ecol. Prog. Ser. 2014, 49, 27–41. [Google Scholar] [CrossRef]
  20. Johnston, M.W.; Akins, J.L. The Non-native royal damsel (Neopomacentris cyanomos) in the southern Gulf of Mexico. Trans. Am. Fish Soc. 2016, 129, 469–475. [Google Scholar]
  21. Perez, R.; Muller-Karger, F.E.; Victoria, I.; Melo, N.; Cerdeira, S. Cuban, Mexican, US Researchers Probing Mysteries of Yucatan Current. EOS AGU Trans. 1999, 80, 153–158. [Google Scholar] [CrossRef]
  22. Zavala-Hidalgo, J.; Gallegos-Garcia, A.; Martinez-Lopez, E.; Morey, S.L.; O’Brien, J.J. Seasonal upwelling on the Western and Southern Shelves of the Gulf of Mexico. Ocean Dyn. 2006, 56, 333–338. [Google Scholar] [CrossRef]
  23. Androulidakis, Y.S.; Kourafalou, V.H.; Le Hénaff, M. Influence of frontal cyclones evolution on the 2009 (Ekman) and 2010 (Franklin) Loop Current Eddy detachment events. Ocean Sci. 2014, 10, 947–965. [Google Scholar] [CrossRef]
  24. Muller-Karger, F.E. River discharge variability including satellite-observed plume-dispersal patterns. In Climate Change in the Intra-Americas Sea; Maul, G., Ed.; 1993 United Nations Environmental Programme (Wider Caribbean Region) and Intergovernmental Oceanographic Commissions (Caribbean and Adjacent Regions); Edward Arnold Publishers: London, UK, 1993; Chapter 8; pp. 162–192. [Google Scholar]
  25. Hu, C.; Nelson, J.R.; Johns, E.; Chen, Z.; Weisberg, R.H.; Muller-Karger, F.E. Mississippi River water in the Florida Straits and in the Gulf Stream off Georgia in summer 2004. Geophys. Res. Let. 2005, 32. [Google Scholar] [CrossRef] [Green Version]
  26. Kourafalou, V.H.; Androulidakis, Y.S. Influence of Mississippi river induced circulation on the deepwater horizon oil spill transport. J. Geophys. Res. 2013, 118, 3823–3842. [Google Scholar] [CrossRef]
  27. O’Connor, B.S.; Muller-Karger, F.E.; Nero, R.W.; Hu, C.; Peebles, E.B. The role of Mississippi River discharge in offshore phytoplankton blooming in the northeastern Gulf of Mexico during August 2010. Remote Sens. Environ. 2016, 173, 133–144. [Google Scholar] [CrossRef]
  28. Rabalais, N.N.; Turner, R.E.; Wiseman, W.J. Gulf of Mexico Hypoxia, A.K.A. “The Dead Zone”. Annu. Rev. Ecol. Syst. 2002, 33, 235–263. [Google Scholar] [CrossRef]
  29. Muller-Karger, F.E. The Spring 1998 NEGOM Cold Water Event: Remote Sensing Evidence for Upwelling and for Eastward Advection of Mississippi Water (or: How an Errant LC Anticyclone Took the NEGOM for a Spin). Gulf Mexico Sci. 2000, 1, 55–67. [Google Scholar]
  30. Ortner, P.B.; Lee, T.N.; Milne, P.J.; Zika, R.G.; Clarke, M.E.; Podesta, G.P.; Swart, P.K.; Tester, P.A.; Atkinson, L.P.; Johnson, W.R. Mississippi River flood waters that reached the Gulf Stream. J. Geophys. Res. 1995, 100, 13595–13601. [Google Scholar] [CrossRef]
  31. Gilbert, P.S.; Lee, T.N.; Podesta, G.P. Transport of anomalous low-salinity waters from the Mississippi River flood of 1993 to the Straits of Florida. Cont. Shelf Res. 1996, 16, 1056–1085. [Google Scholar] [CrossRef]
  32. Morey, S.L.; Martin, P.L.; O’Brien, J.J.; Wallcraft, A.A.; Zavala-Hidalgo, J. Export pathways for river discharged fresh water in the northern Gulf of Mexico. J. Geophys. Res. 2003, 108. [Google Scholar] [CrossRef]
  33. Gilbes, F.; Tomas, C.; Walsh, J.J.; Muller-Karger, F.E. An episodic chlorophyll plume on the west Florida shelf. Cont. Shelf Res. 1996, 16, 1201–1224. [Google Scholar] [CrossRef]
  34. Weisberg, R.H.; He, R.; Liu, Y.; Virmani, J.I. West Florida Shelf Circulation on Synoptic, Seasonal and Interannual Time Scales; Geophysical Monograph Series; American Geophysical Union: Washington, DC, USA, 2005; Volume 161. [Google Scholar]
  35. Le Hénaff, M.; Kourafalou, V.H. Mississippi waters reaching South Florida reefs under no flood conditions: Synthesis of observing and modeling system findings. Ocean Dyn. 2016, 66, 435–459. [Google Scholar] [CrossRef]
  36. Walker, N.D. Satellite assessment of Mississippi river plume variability: Causes and predictability. Remote Sens. Environ. 1996, 58, 21–35. [Google Scholar] [CrossRef]
  37. Schiller, R.V.; Kourafalou, V.H.; Hogan, P.; Walker, N.D. The dynamics of the Mississippi River plume: Impact of topography, wind and offshore forcing on the fate of plume waters. J. Geophys. Res. 2011, 116. [Google Scholar] [CrossRef]
  38. Schiller, R.V.; Kourafalou, V.H. Loop Current Impact on the Transport of Mississippi River Waters. J. Coastal Res. 2014, 30, 1287–1306. [Google Scholar] [CrossRef]
  39. Weisberg, R.H.; Liu, Y. On the Loop Current Penetration into the Gulf of Mexico. J. Geophys. Res. Oceans 2017, 122. [Google Scholar] [CrossRef]
  40. Hu, C.; Hackett, K.E.; Callahan, M.K.; Andréfouët, S.; Wheaton, J.L.; Porter, J.W.; Muller-Karger, F.E. The 2002 ocean color anomaly in the Florida Bight: A cause of local coral reef decline? Geophys. Res. Lett. 2003, 30. [Google Scholar] [CrossRef]
  41. Nababan, B.; Muller-Karger, F.E.; Hu, C.; Biggs, D.C. Chlorophyll variability in the northeastern Gulf of Mexico. Int. J. Remote Sens. 2011, 32, 8373–8391. [Google Scholar] [CrossRef]
  42. McGillicuddy, D.J., Jr.; Robinson, A.R.; Siegel, D.A.; Jannasch, H.W.; Johnson, R.; Dickey, T.D.; McNeil, J.; Michaels, A.F.; Knap, A.H. Influence of mesoscale eddies on new production in the Sargasso Sea. Nature 1998, 394, 263. [Google Scholar] [CrossRef]
  43. Hu, C.; Muller-Karger, F.E. On the Connectivity and “Black Water” Phenomena near the FKNMS: A Remote Sensing Perspective. In Connectivity: Science, people and policy in the Florida Keys National Marine Sanctuary; Keller, B.D., Wilmot, F.C., Eds.; U.S. Department of Commerce, National Oceanic and Atmospheric Administration: Silver Spring, MD, USA, 2004. [Google Scholar]
  44. Soto, I.; Andrefouet, S.; Hu, C.; Muller-Karger, F.E.; Wall, C.C.; Sheng, J.; Hatcher, B.G. Physical connectivity in the Mesoamerican Barrier Reef System inferred from 9 years of ocean color observations. Coral Reefs 2009. [Google Scholar] [CrossRef]
  45. Walker, N.D.; Leben, R.R.; Balasubramanian, S. Hurricane-forced upwelling and chlorophyll an enhancement within cold-core cyclones in the Gulf of Mexico. Geophys. Res. Lett. 2005, 32, L18610. [Google Scholar] [CrossRef]
  46. Johnston, M.A.; Nutall, M.F.; Eckert, R.J.; Blakeway, R.D.; Sterne, T.K.; Hickerson, E.L.; Schmahl, G.P.; Lee, M.T.; McMillan, J.; Embisi, J.A. Localized coral reef mortality event at East Flower Garden Bank, Gulf of Mexico. Bull. Mar. Sci. 2018. [Google Scholar] [CrossRef]
Figure 1. Map of the Gulf of Mexico and schematic of the Loop Current. The Gulf of Mexico Loop Current System enters the Gulf of Mexico as the Yucatan Current (green) and exits through the Florida Straits (black). The schematic represents two Loop Current states: a retracted state (red) and an extended state (blue). Loop Current Eddies (orange) are shed by the Loop Current while in its extended state. The maroon polygon at top center represents the area where chlorophyll-a values were extracted from satellite data to evaluate the frequency of offshore Mississippi River plume transport events. Depth contour line in black represents the 100m isobath. Areas with water depths less than 100 m are shaded in light blue. Marine protected areas of interest are shown by red circles: (1) Parque Nacional Arrecife Alacranes; (2) Parque Nacional Arrecife de Puerto Morelos; (3) Parque Nacional Costa Occidental de Isla Mujeres; and (4) Parque Nacional Arrecifes de Cozumel. The boundary of the Florida Keys National Marine Sanctuary is shown in red at the southern tip of the Florida peninsula.
Remotesensing 11 00723 g001
Figure 2. MODIS-Aqua chlorophyll-a images showing transport of water from the Campeche Bank into the central Gulf of Mexico. From left, images are from (A) October 27th, 2005, (B) March 30th, 2008, and (C) May climatology from 2003 to 2018. (D) Time series of the number of images per month which showed evidence of transport from Campeche Bank to the central Gulf of Mexico. Solid black line represents the 100 m isobath. Dashed red line in panels A and B represents the contour of the Loop Current estimated from altimetry derived MADT data for the date of the corresponding satellite image.
Remotesensing 11 00723 g002
Figure 3. SeaWiFS and MODIS-Aqua chlorophyll-a images showing transport of water from the Campeche Bank to the Florida Keys. From left, (A) SeaWiFS image from March 14th, 2002, (B) MODIS-Aqua image from May 21st, 2016, and (C) MODIS-Aqua image from February 10th, 2017. (D) Time series of the number of images per month which showed evidence of transport from Campeche Bank to the Florida Straits. Solid black line represents the 100 m isobath. Dashed red line represents the contour of the Loop Current estimated from altimetry derived MADT data for the date of the corresponding satellite image.
Remotesensing 11 00723 g003
Figure 4. MODIS-Aqua chlorophyll-a images showing transport of water from the Mississippi Delta to the Florida Keys. From left, images are (A) August 5th, 2011, (B) July 22nd, 2015, and (C) August 18th, 2016. (D) Time series of the number of images per month which showed evidence of the transport of Mississippi River water to the Florida Straits. Solid black line represents the 100 m isobath. Dashed red line represents the contour of the Loop Current estimated from altimetry derived MADT data for the date of the corresponding satellite image.
Remotesensing 11 00723 g004
Figure 5. (A) Time series of Mississippi River discharge. (B) Time series of SeaWiFS and MODIS-Aqua chlorophyll-a concentration extracted from satellite data representing the Mississippi River plume offshore export (polygon in Figure 1). (C) Time series of the northernmost extent of the Loop Current. In each plot, the red line represents the time series binned to weekly intervals, while the black line represents the weekly climatology calculated using data from years 2003 to 2017.
Remotesensing 11 00723 g005
Figure 6. (A) Time series of anomalies of Mississippi River discharge. (B) Time series of anomalies of the northern extent of the Loop Current. (C) Time series of images per month showing evidence of the transport of water from the Mississippi Delta to the Florida Straits. (D) Time series of images per month showing evidence of transport from the Campeche Bank to the Florida Straits. In panels a–b, positive anomalies where time series values exceed climatological values are shown in red while negative anomalies are shown in blue. Gray shading indicates time periods when transport from the Mississippi Delta to the Florida Straits was prevalent. Orange shading indicates time periods when transport from the Campeche Bank to the Florida Straits was prevalent.
Remotesensing 11 00723 g006
Figure 7. MODIS-Aqua chlorophyll-a monthly composite images from 2015 showing transport of water from the Mississippi Delta to the Florida Keys. Solid black line represents the 100 m isobath. Dashed red line represents the contour of the Loop Current estimated from the monthly average of altimetry derived MADT data for each month.
Remotesensing 11 00723 g007
Table 1. Months of the year (with duration in parentheses), anomalies of Mississippi River (MR) discharge, Loop Current (LC) northward extent during episodes of Mississippi River Delta (MD) to Florida Straits (FS), and Campeche Bank (CB) to FS transport. Shading matches that of transport event types in Figure 6.
YearTransport TypeMonths of YearMR Discharge Anomaly (m3/s)LC Extent Anomaly (deg. N)
1999MR to FSJul-Sep (3)−13901.76
2000MR to FSSep (1)−28030.44
2002CB to FSMar-Jul (5) −1.38
2003MR to FSAug (1)+8270.86
2004MR to FSAug (1)+28781.23
2006MR to FSAug-Sep (2)−59870.36
2009CB to FSJul (1) −1.057
2011MR to FSJul-Sep (3)+72750.38
2014MR to FSAug-Sep (3)+551.85
2015MR to FSJul-Nov (5)+37841.12
2016CB to FSMay-Jul (3) −2.22
2017CB to FSFeb-May (4) −1.27

