Generating High-Quality and High-Resolution Seamless Satellite Imagery for Large-Scale Urban Regions

 ,
,  ,
,
Abstract
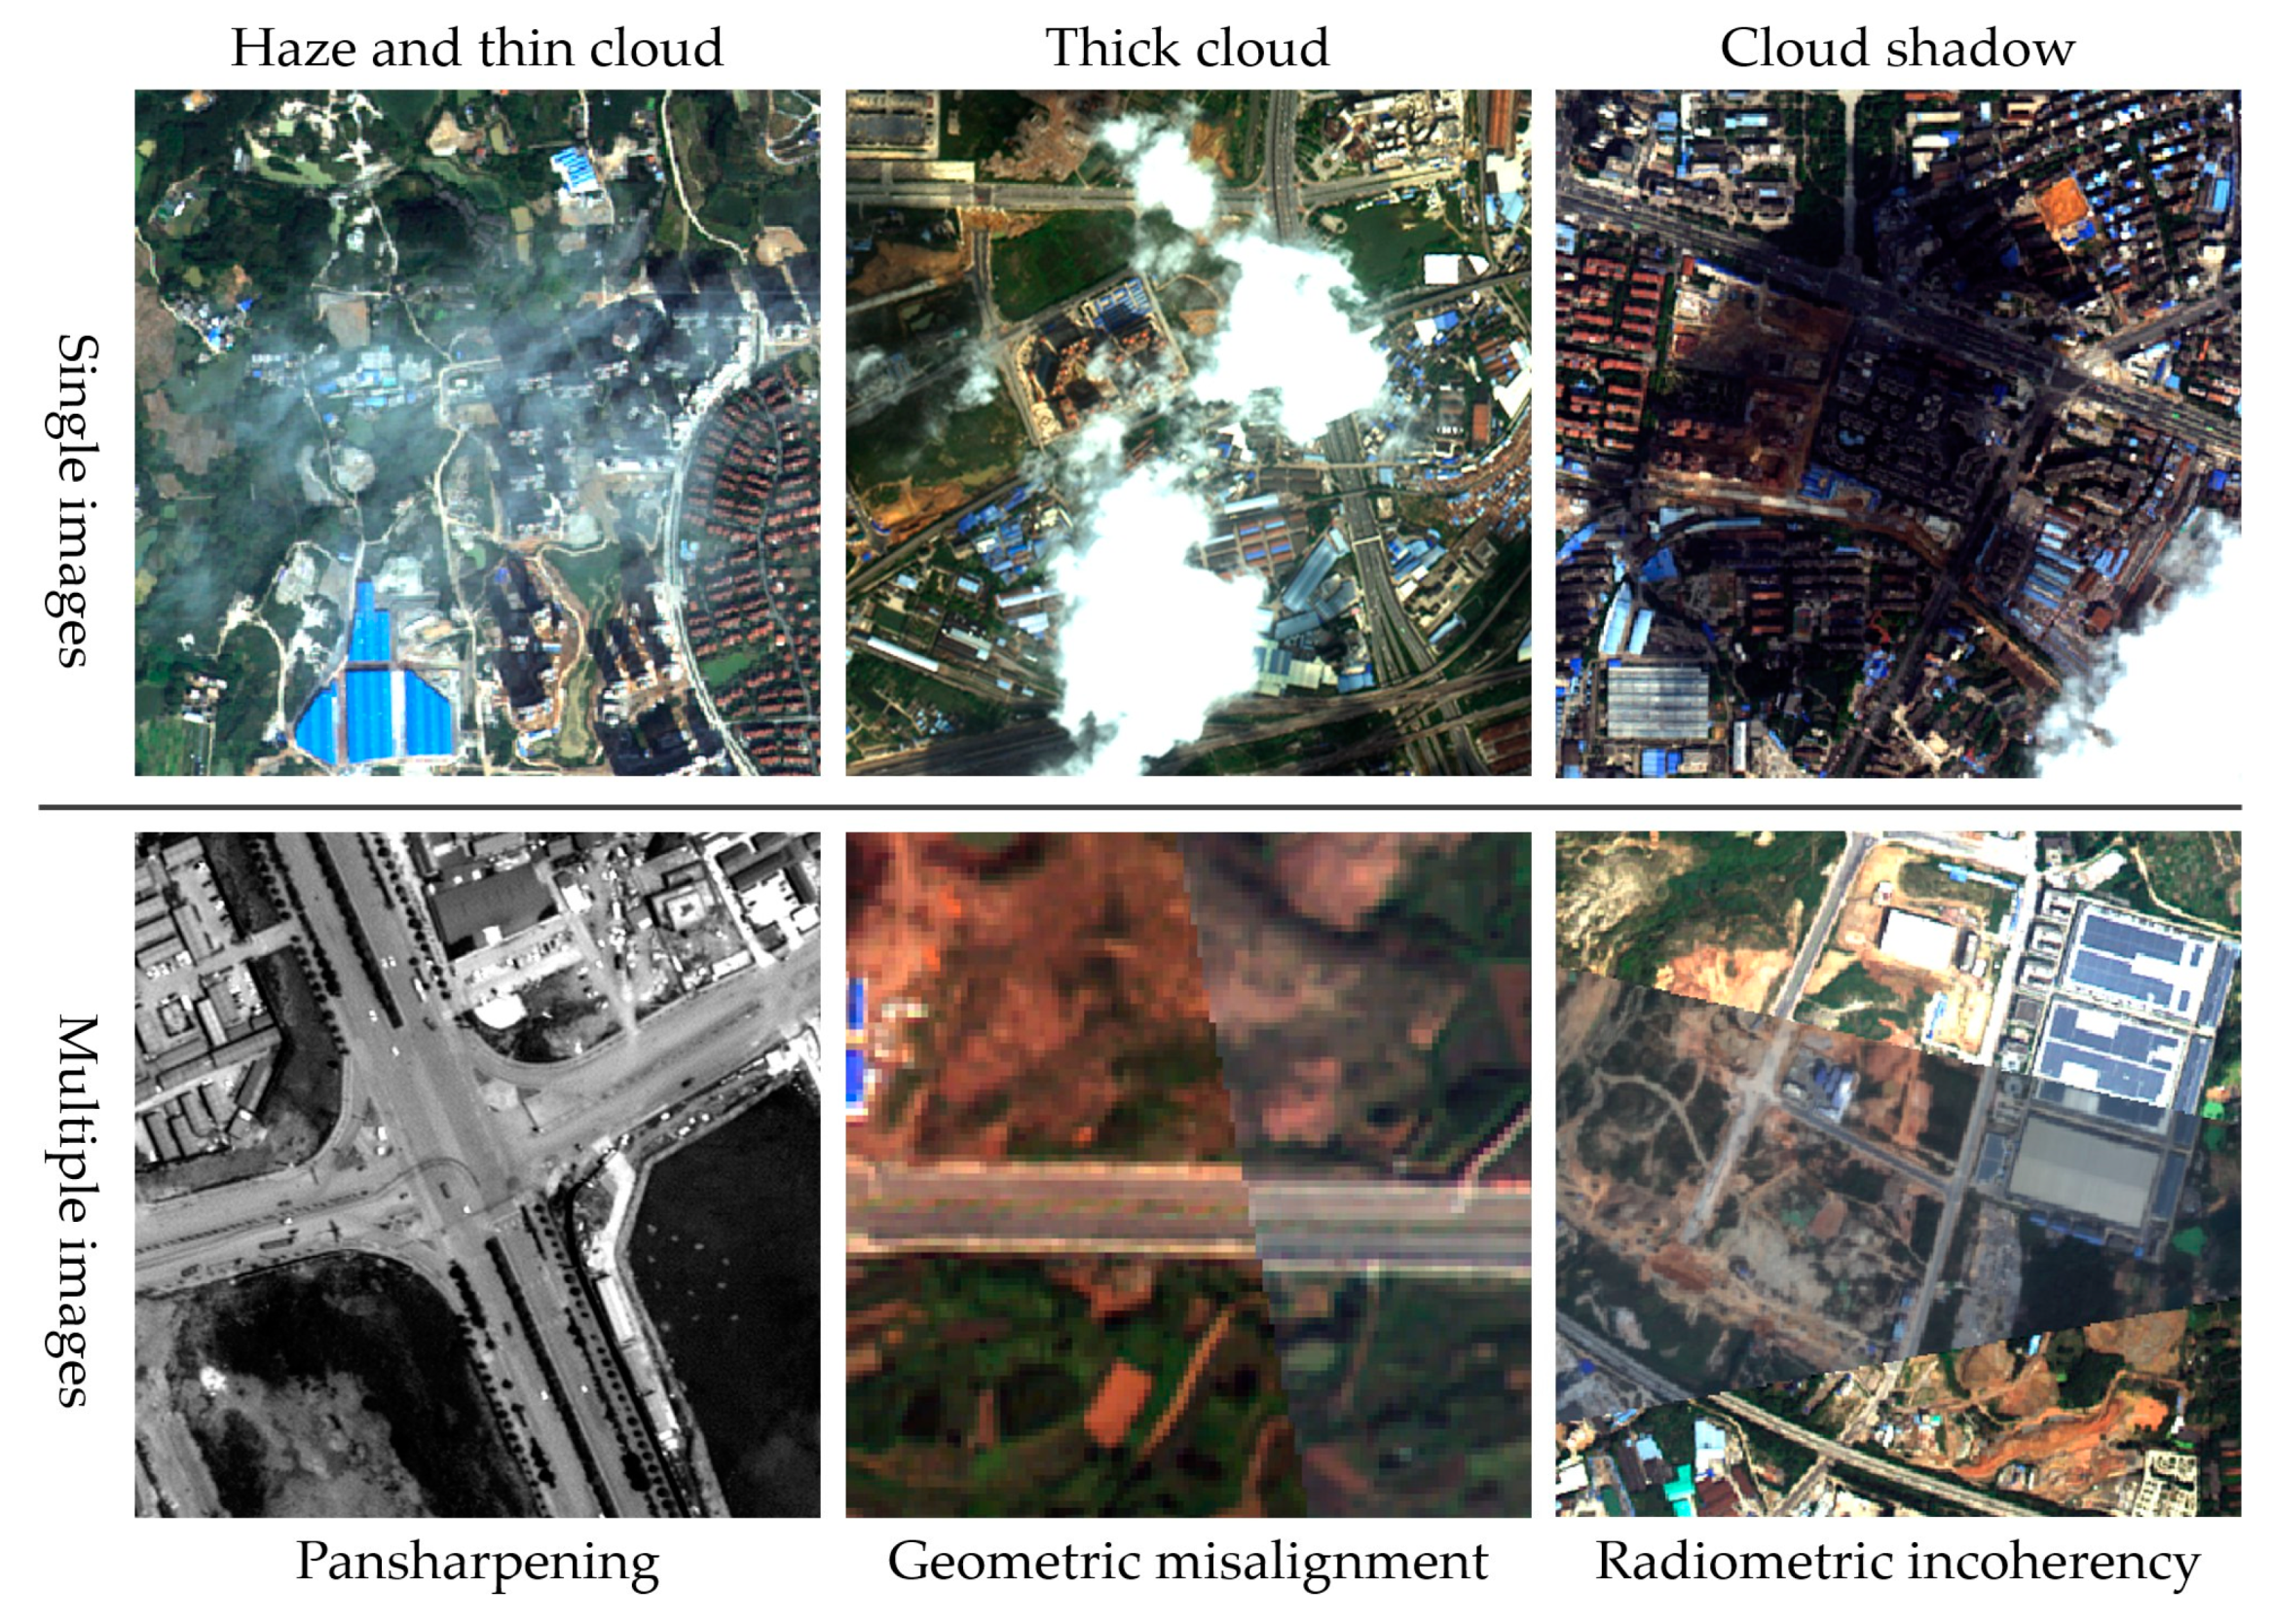
:1. Introduction
2. Related Works
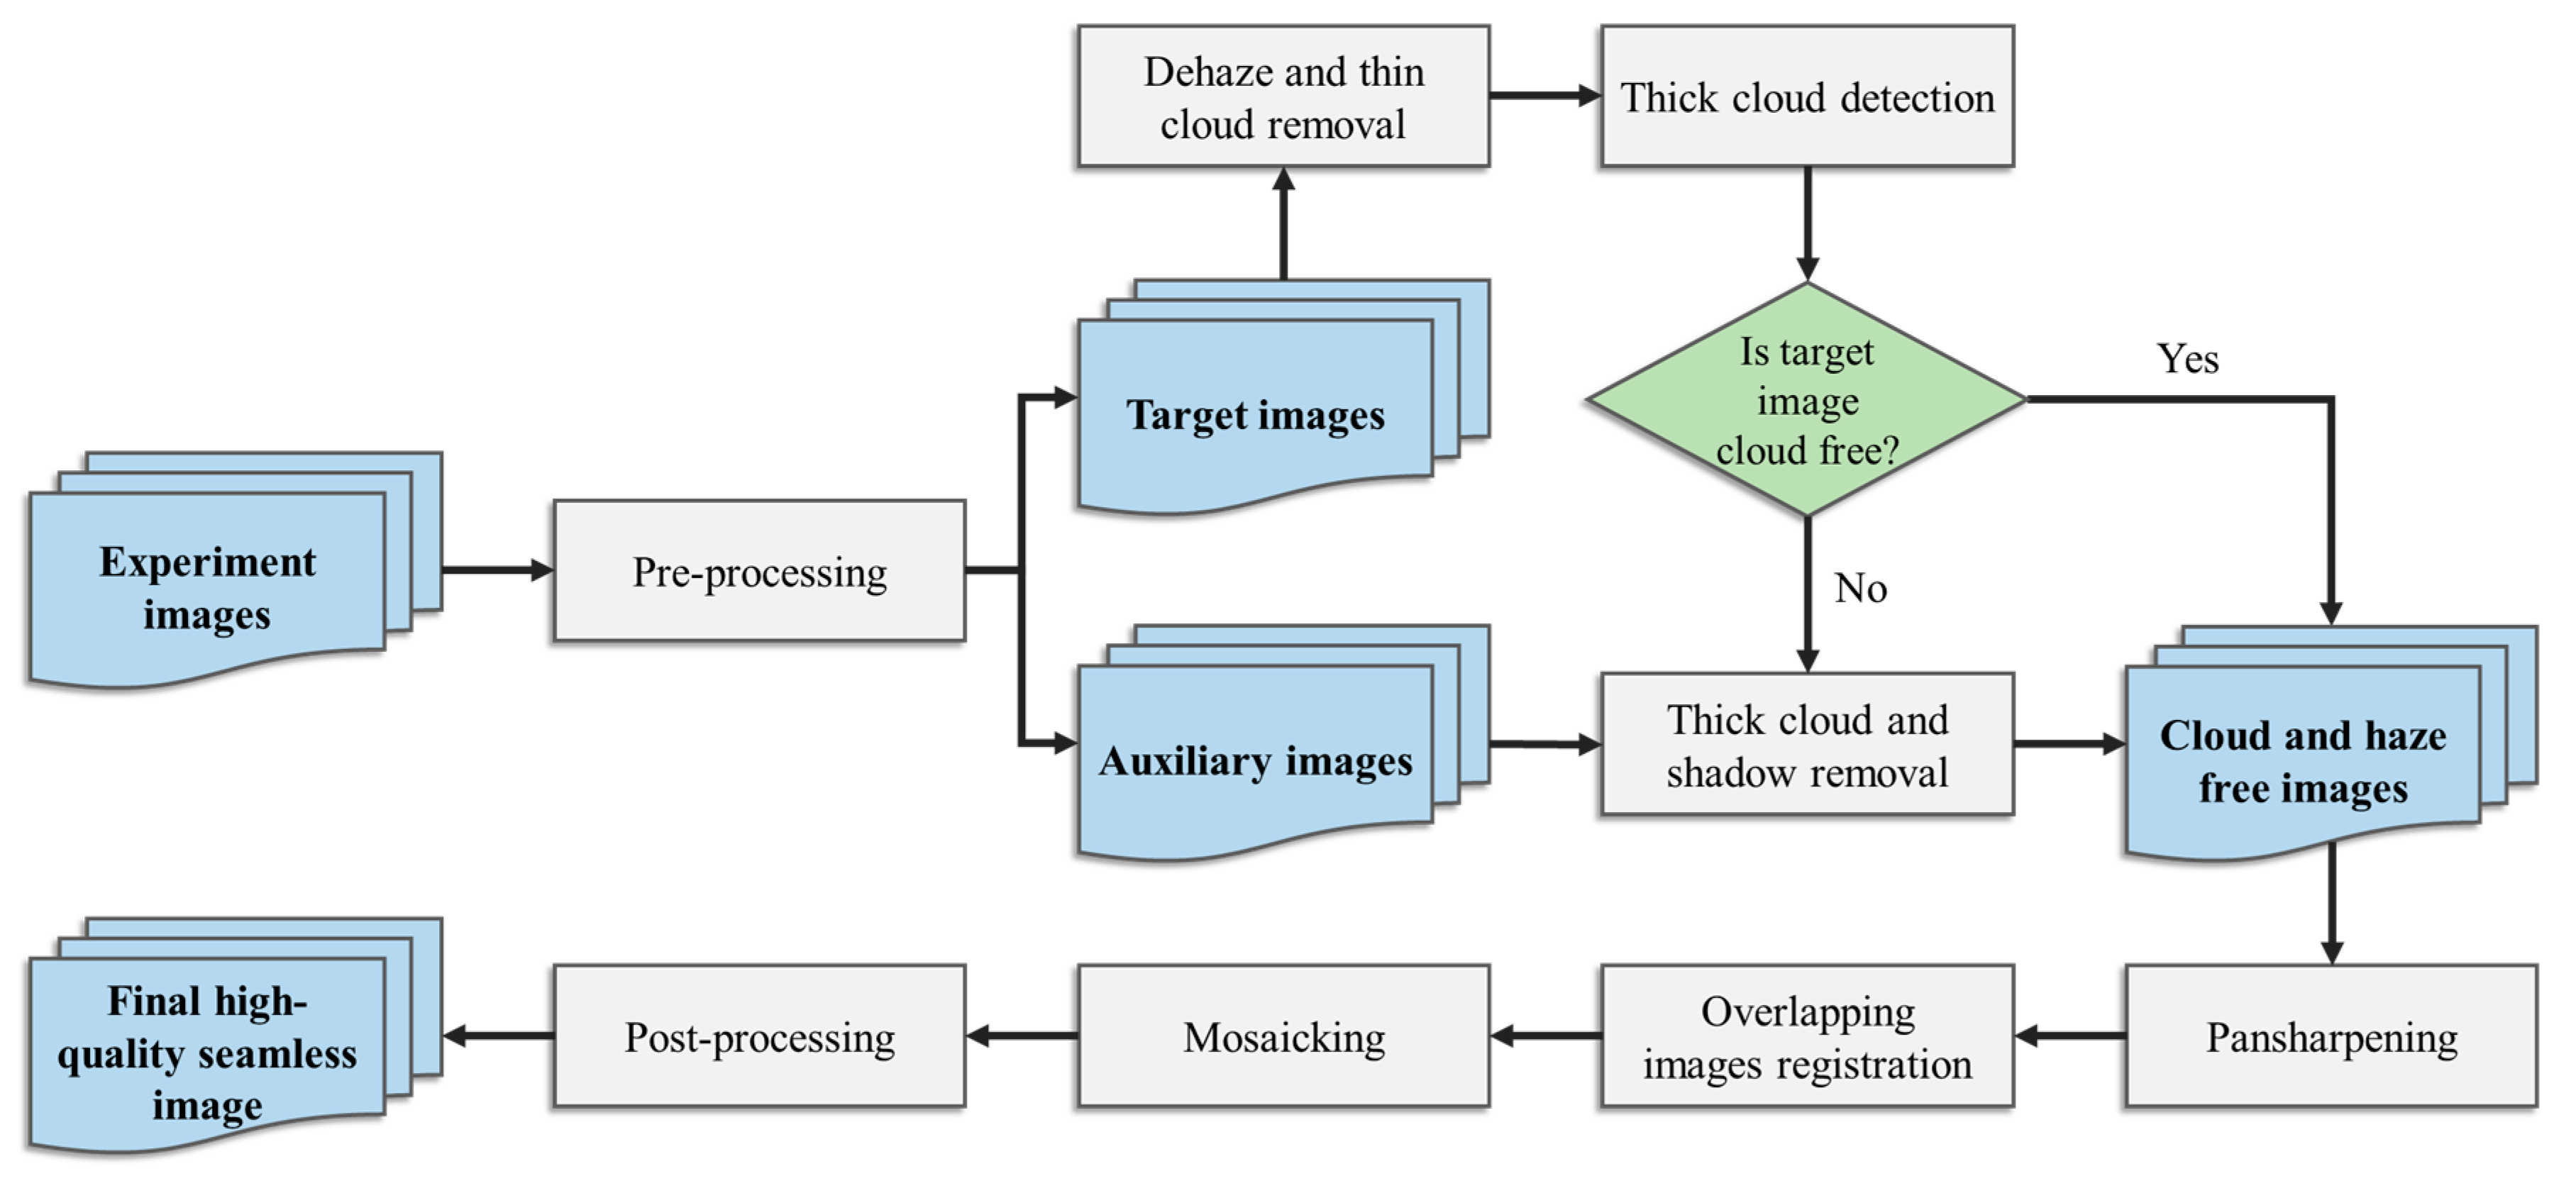
3. Method
3.1. Pre-Processing
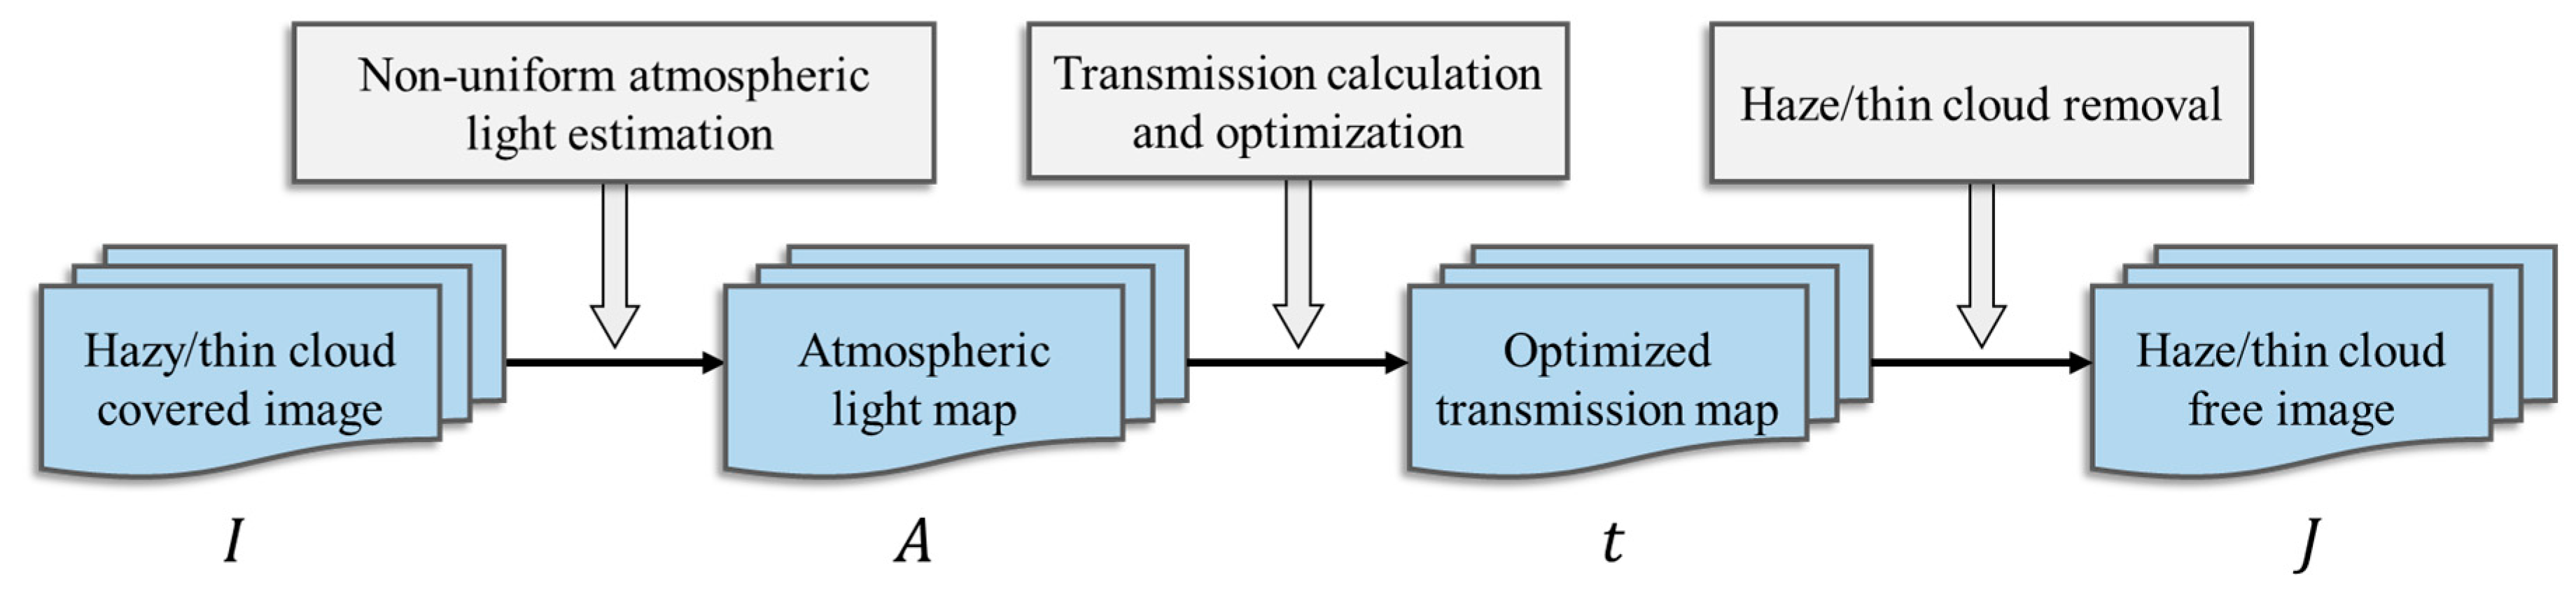
3.2. Dehazing and Thin Cloud Removal
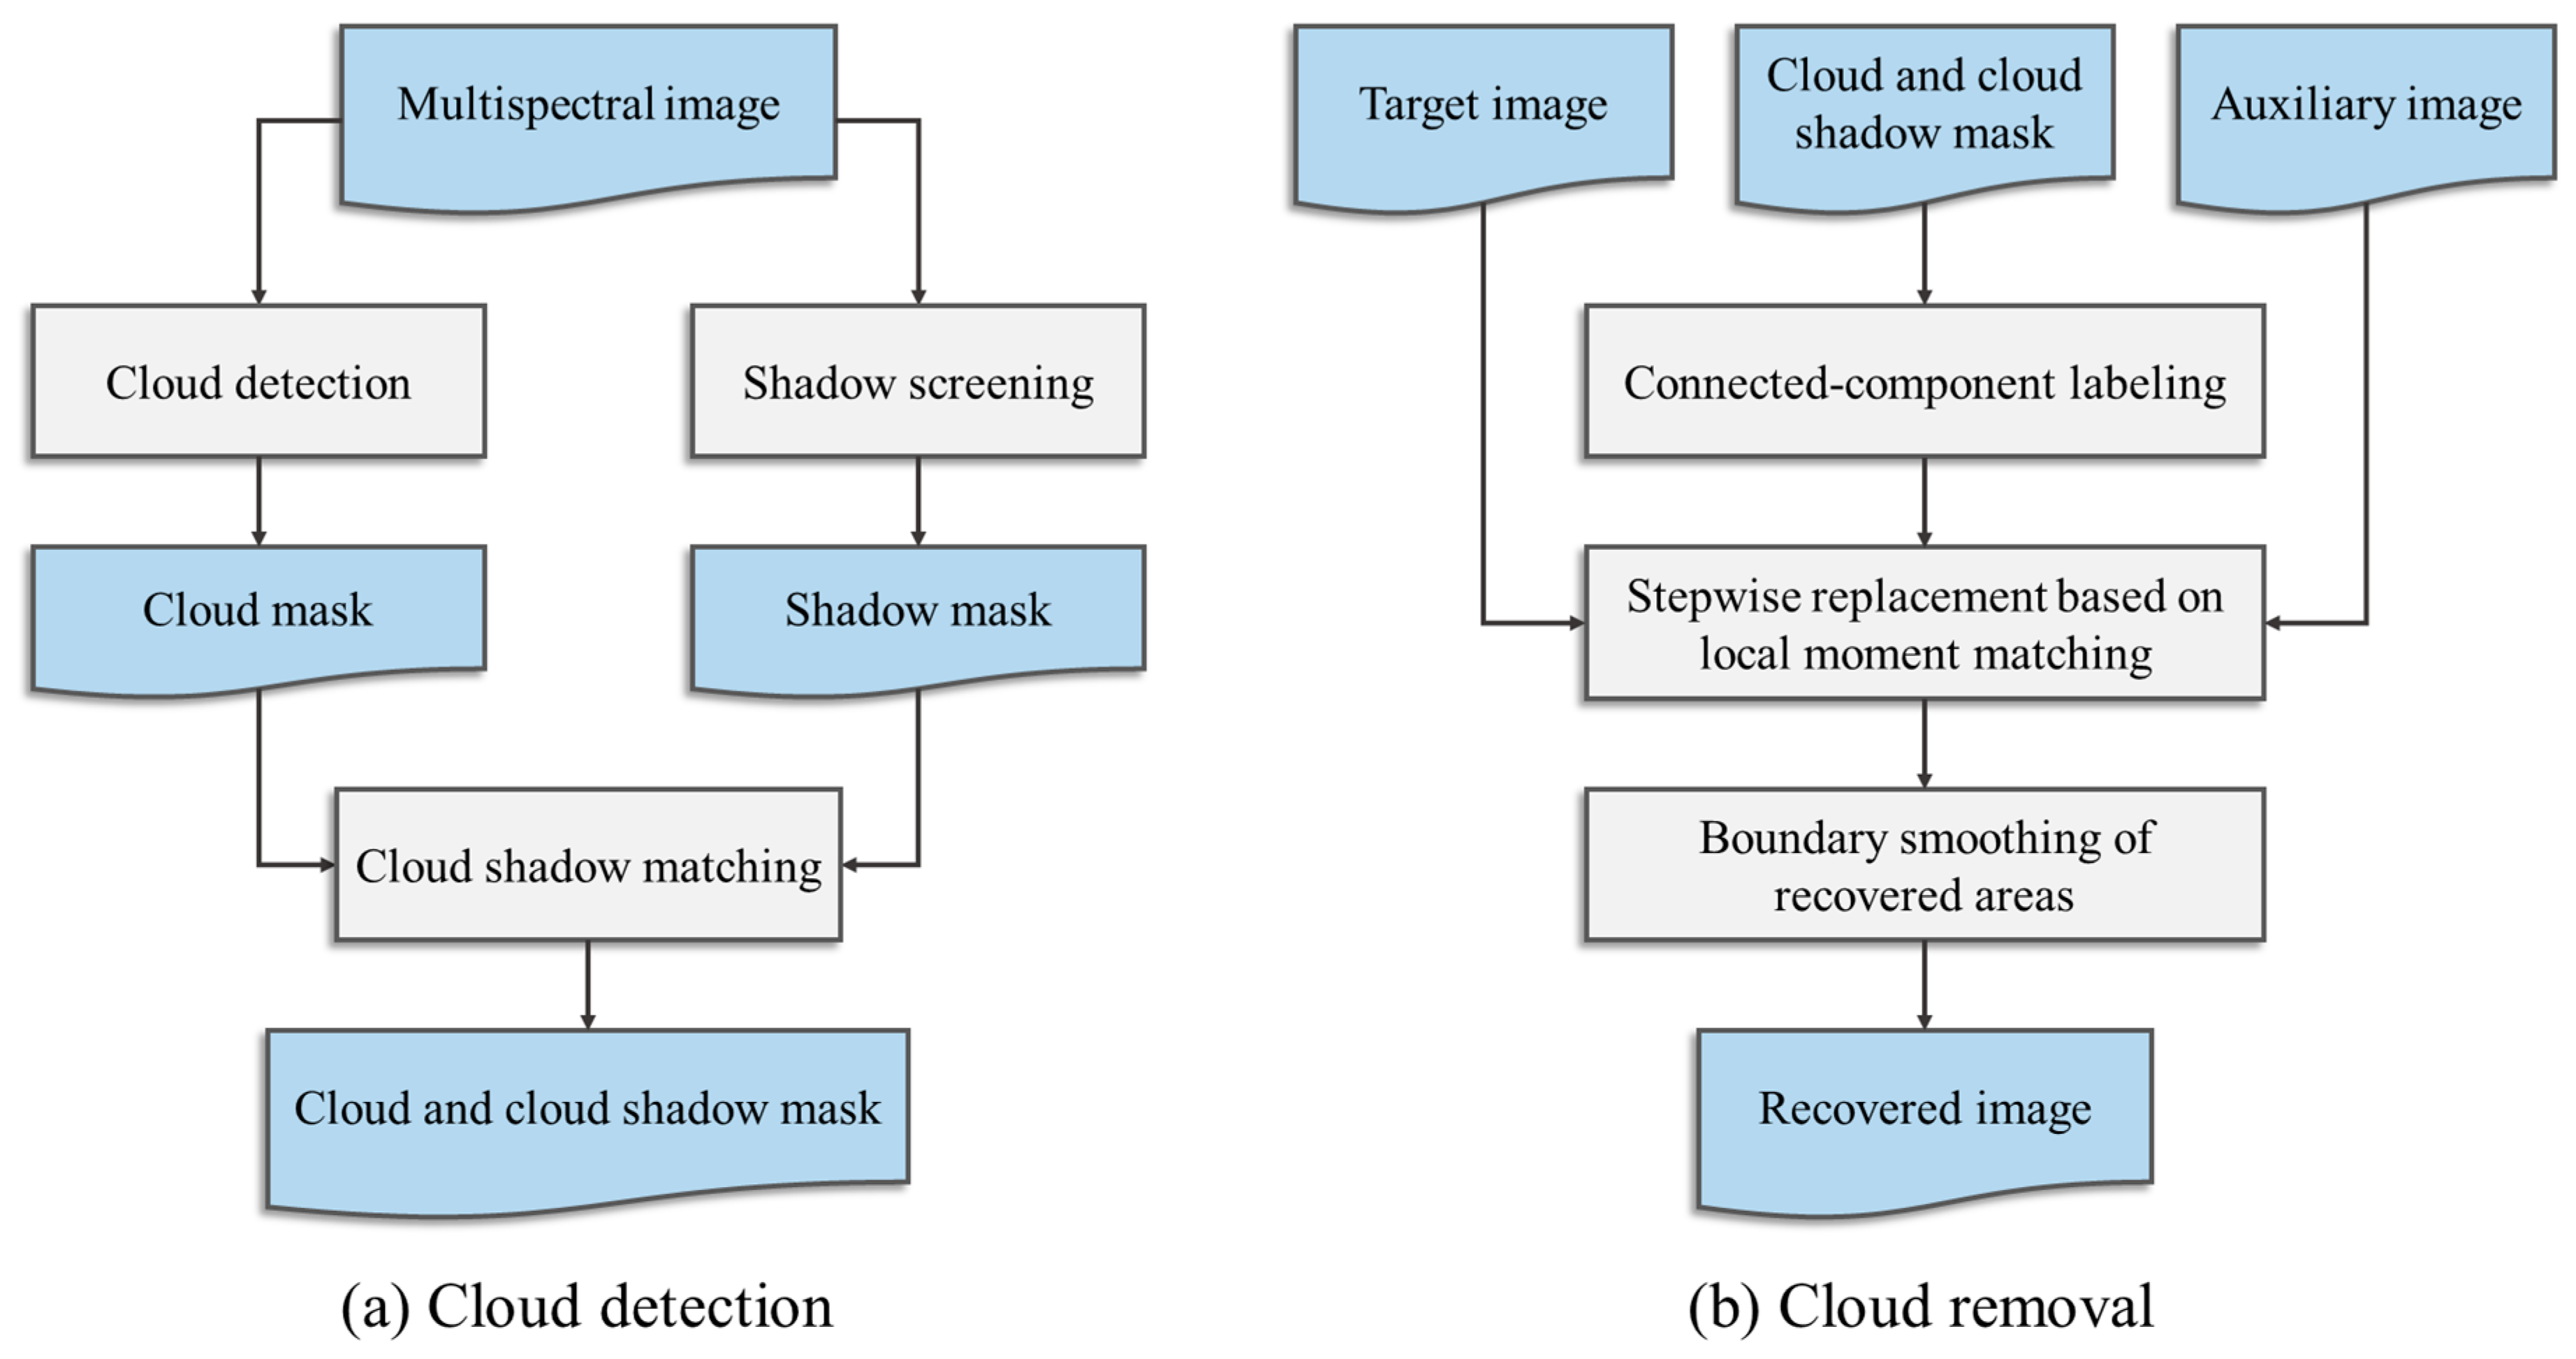
3.3. Thick Cloud Detection and Removal
3.3.1. Thick Cloud Detection
3.3.2. Thick Cloud Removal
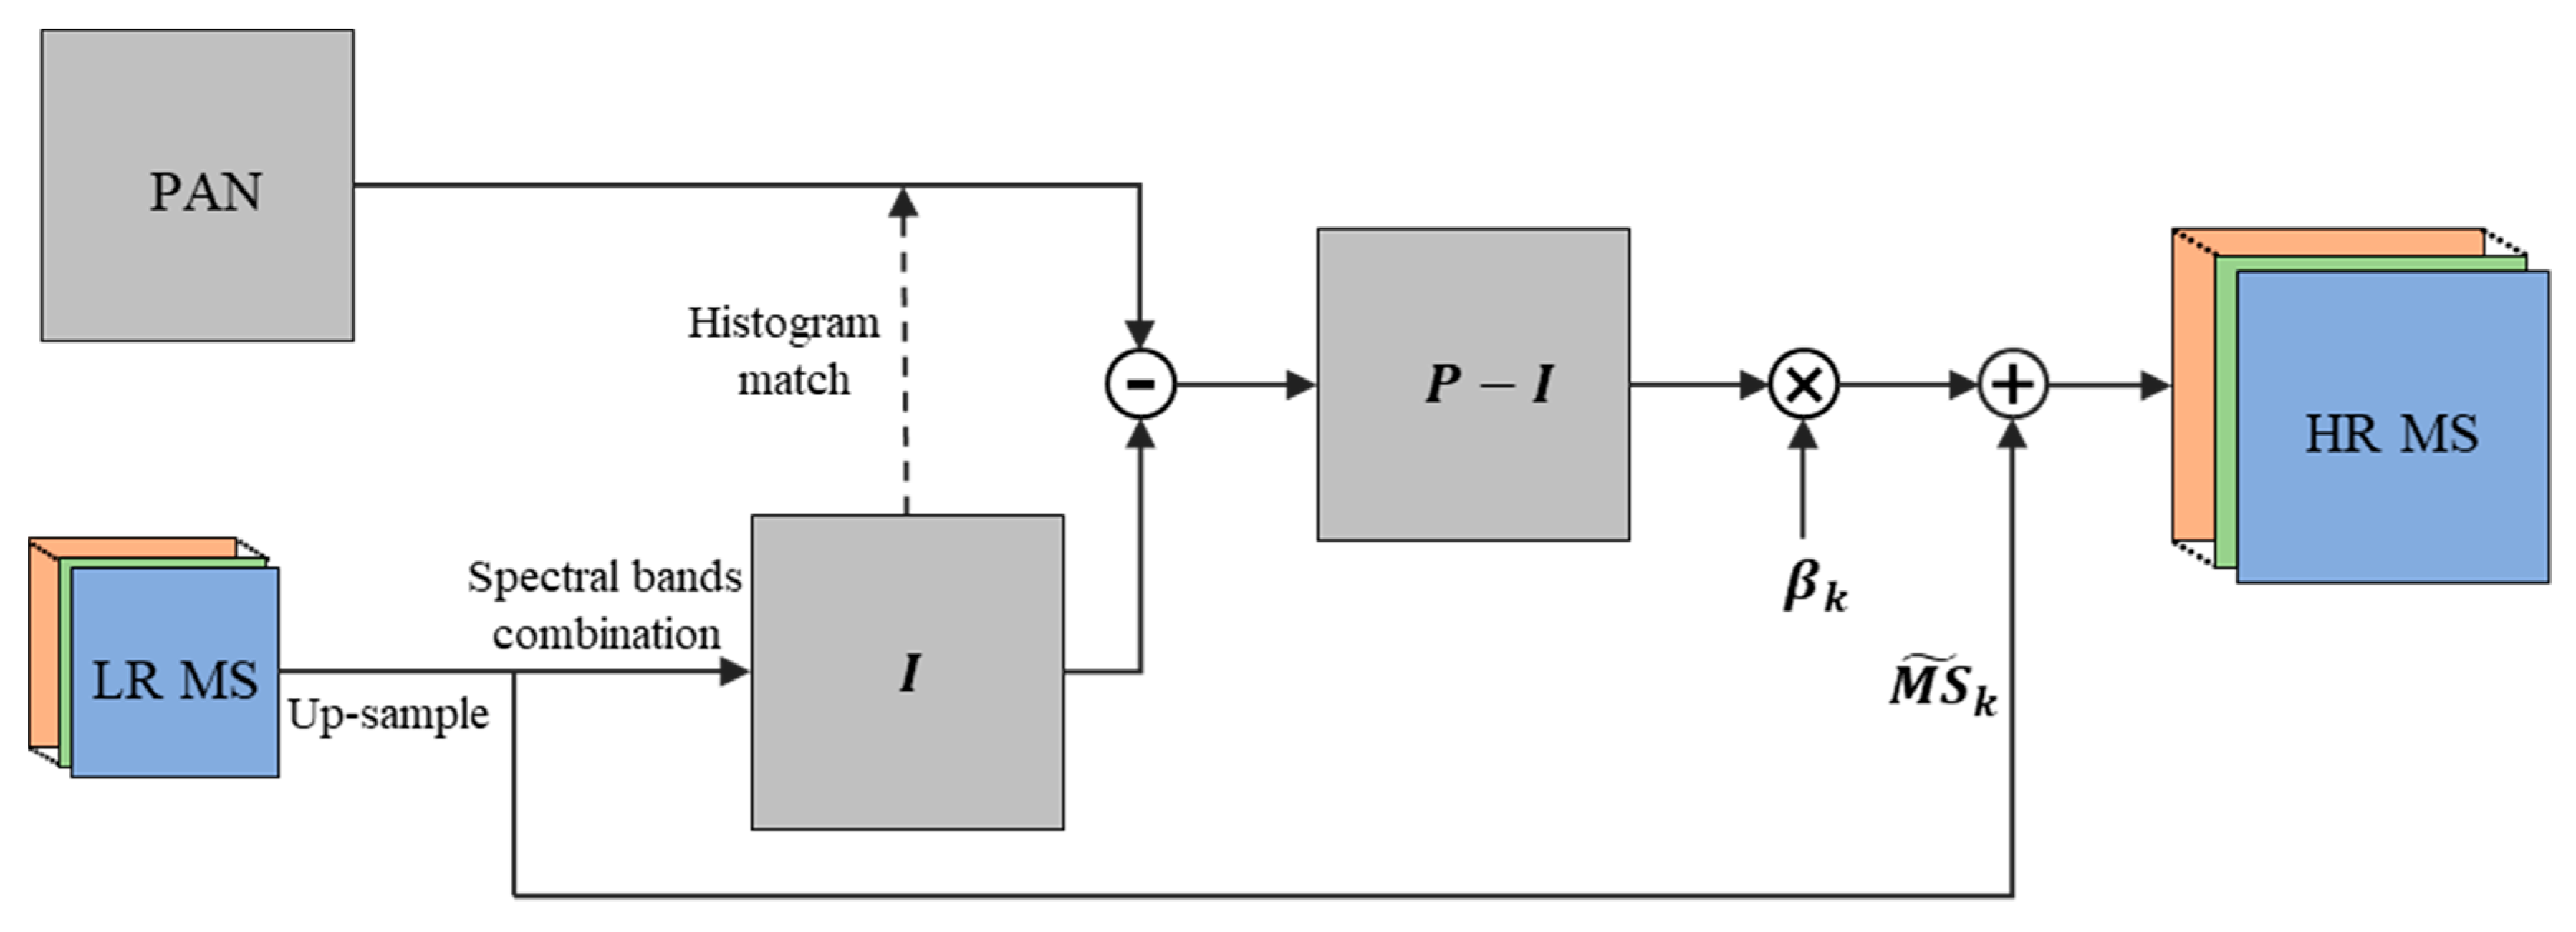
3.4. Pansharpening
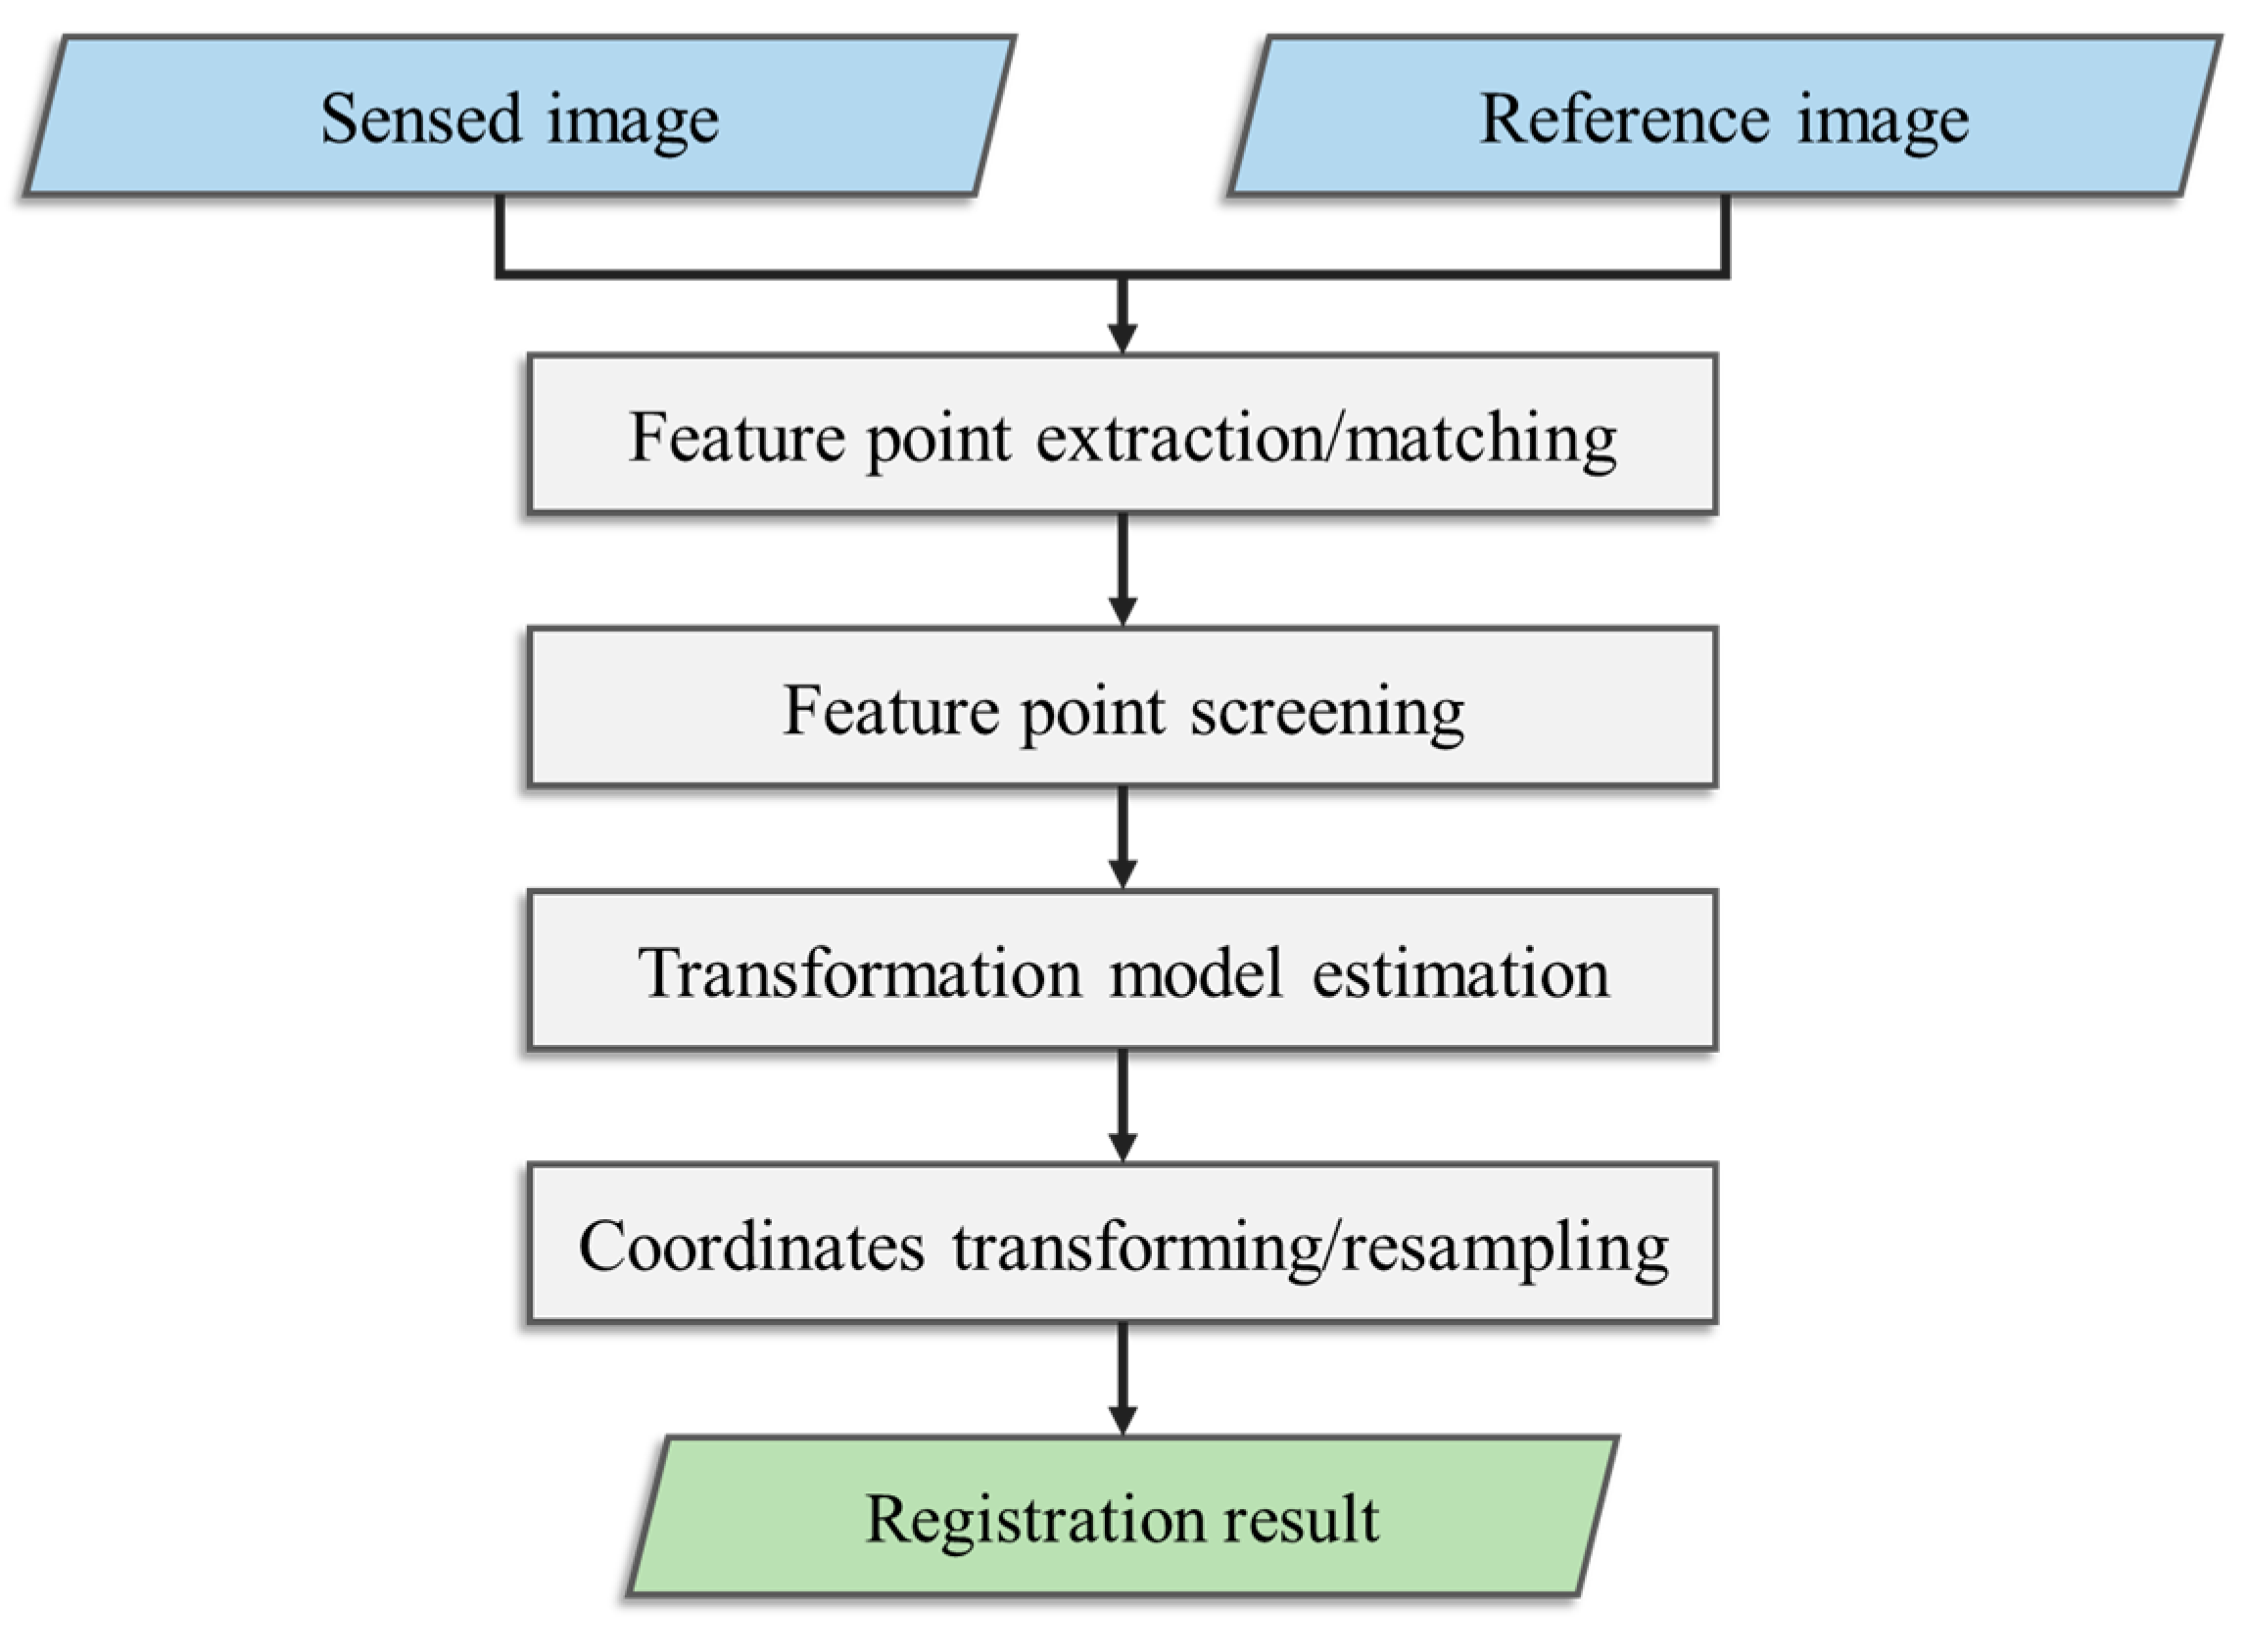
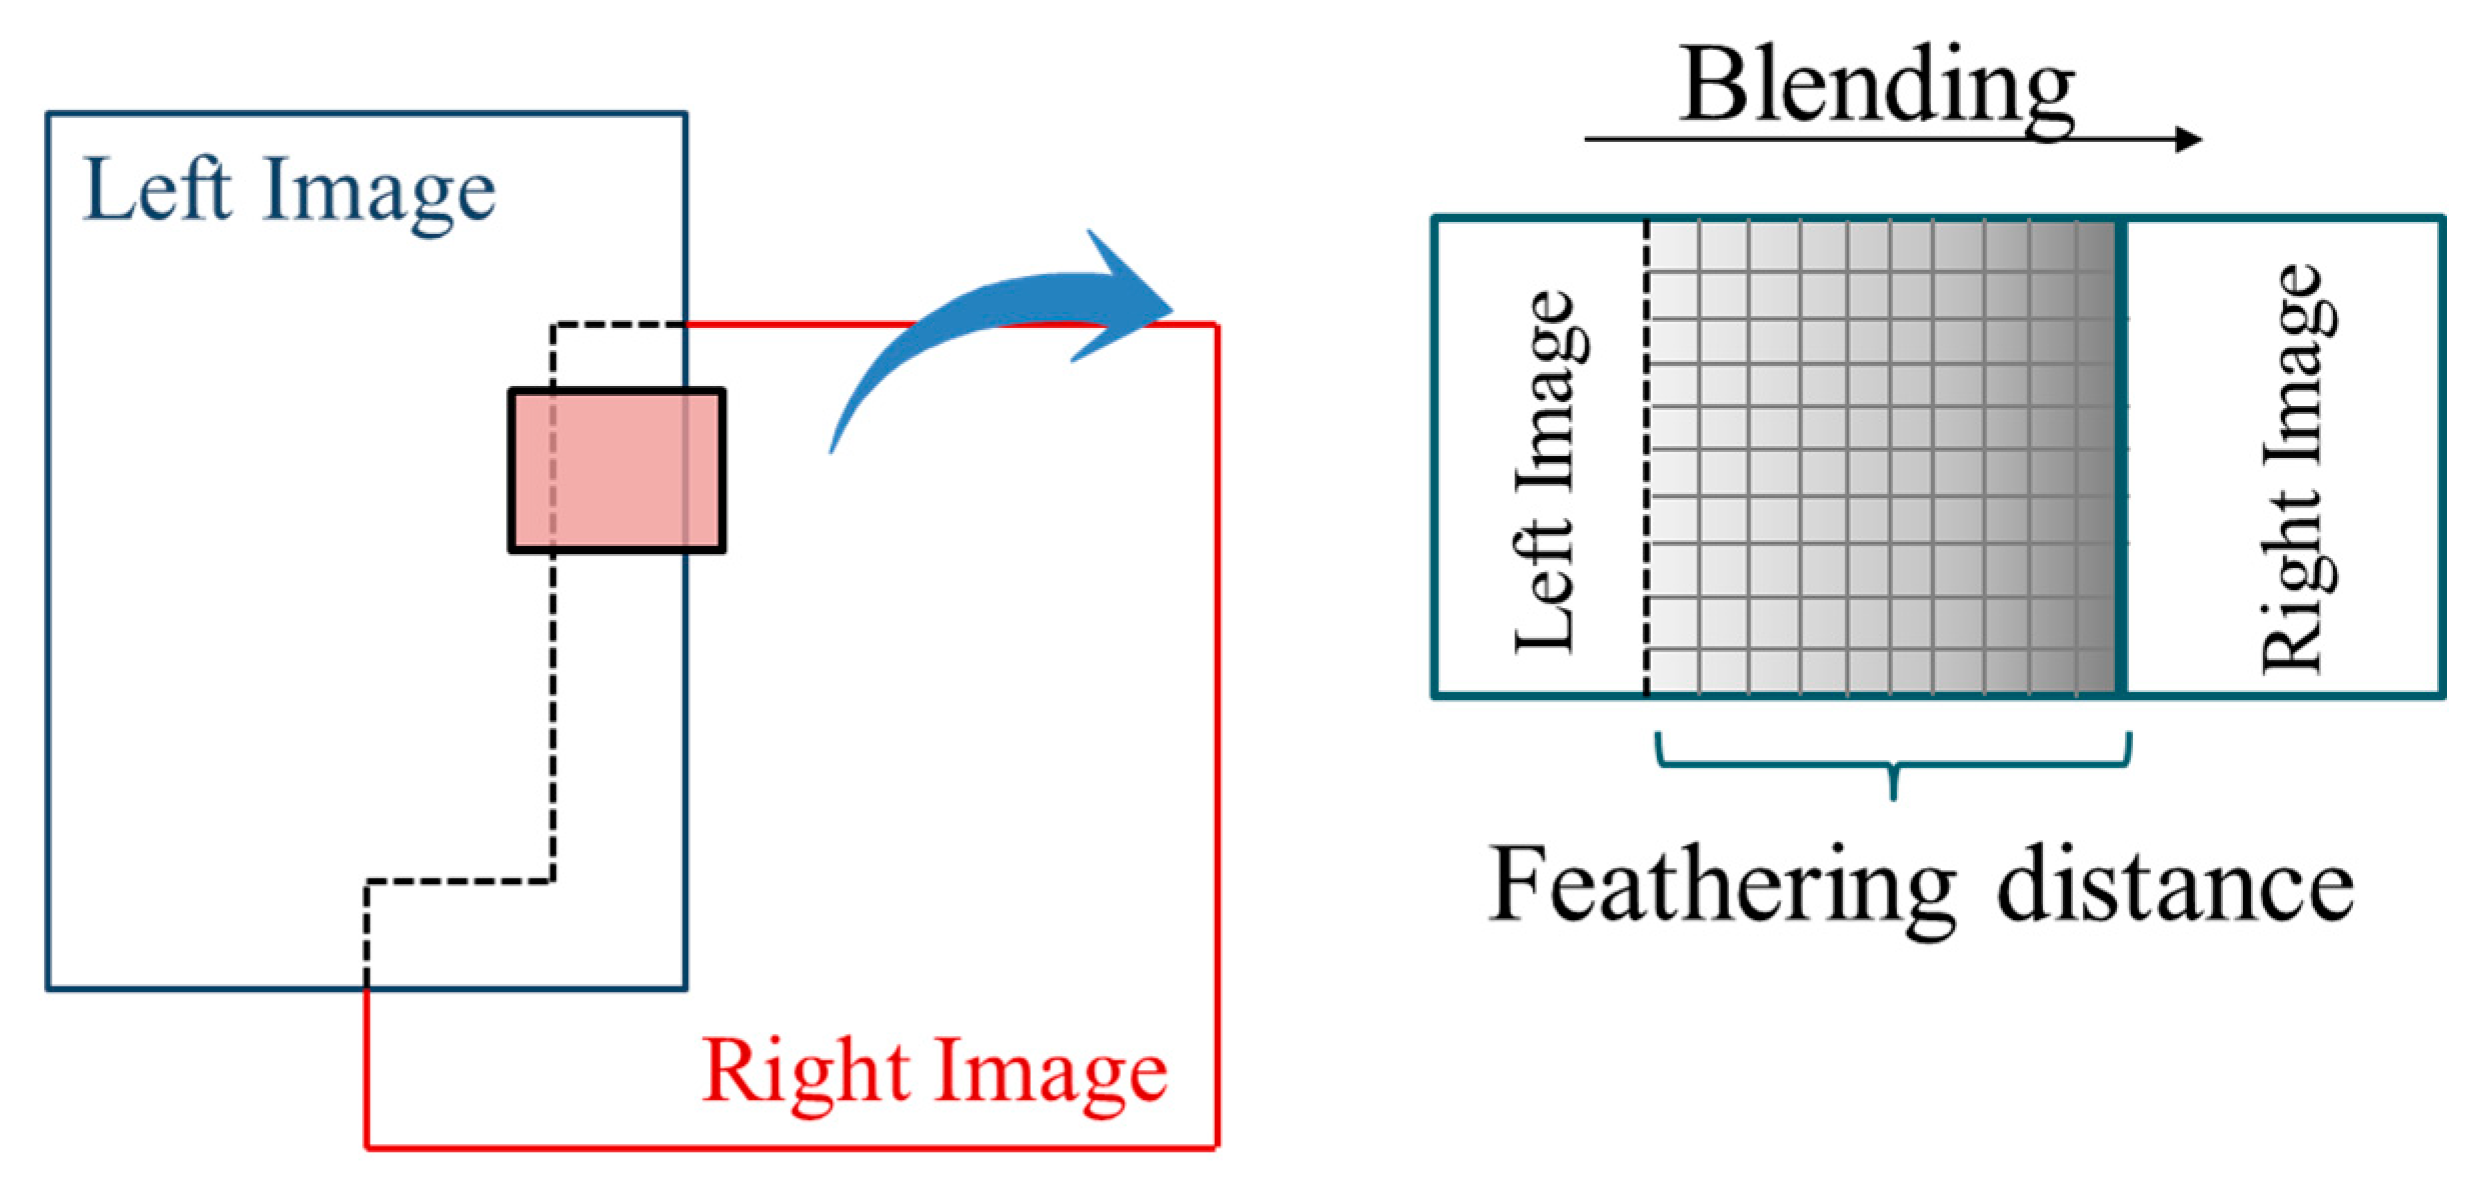
3.5. Mosaicking
3.6. Post-Processing
4. Experiments and Results
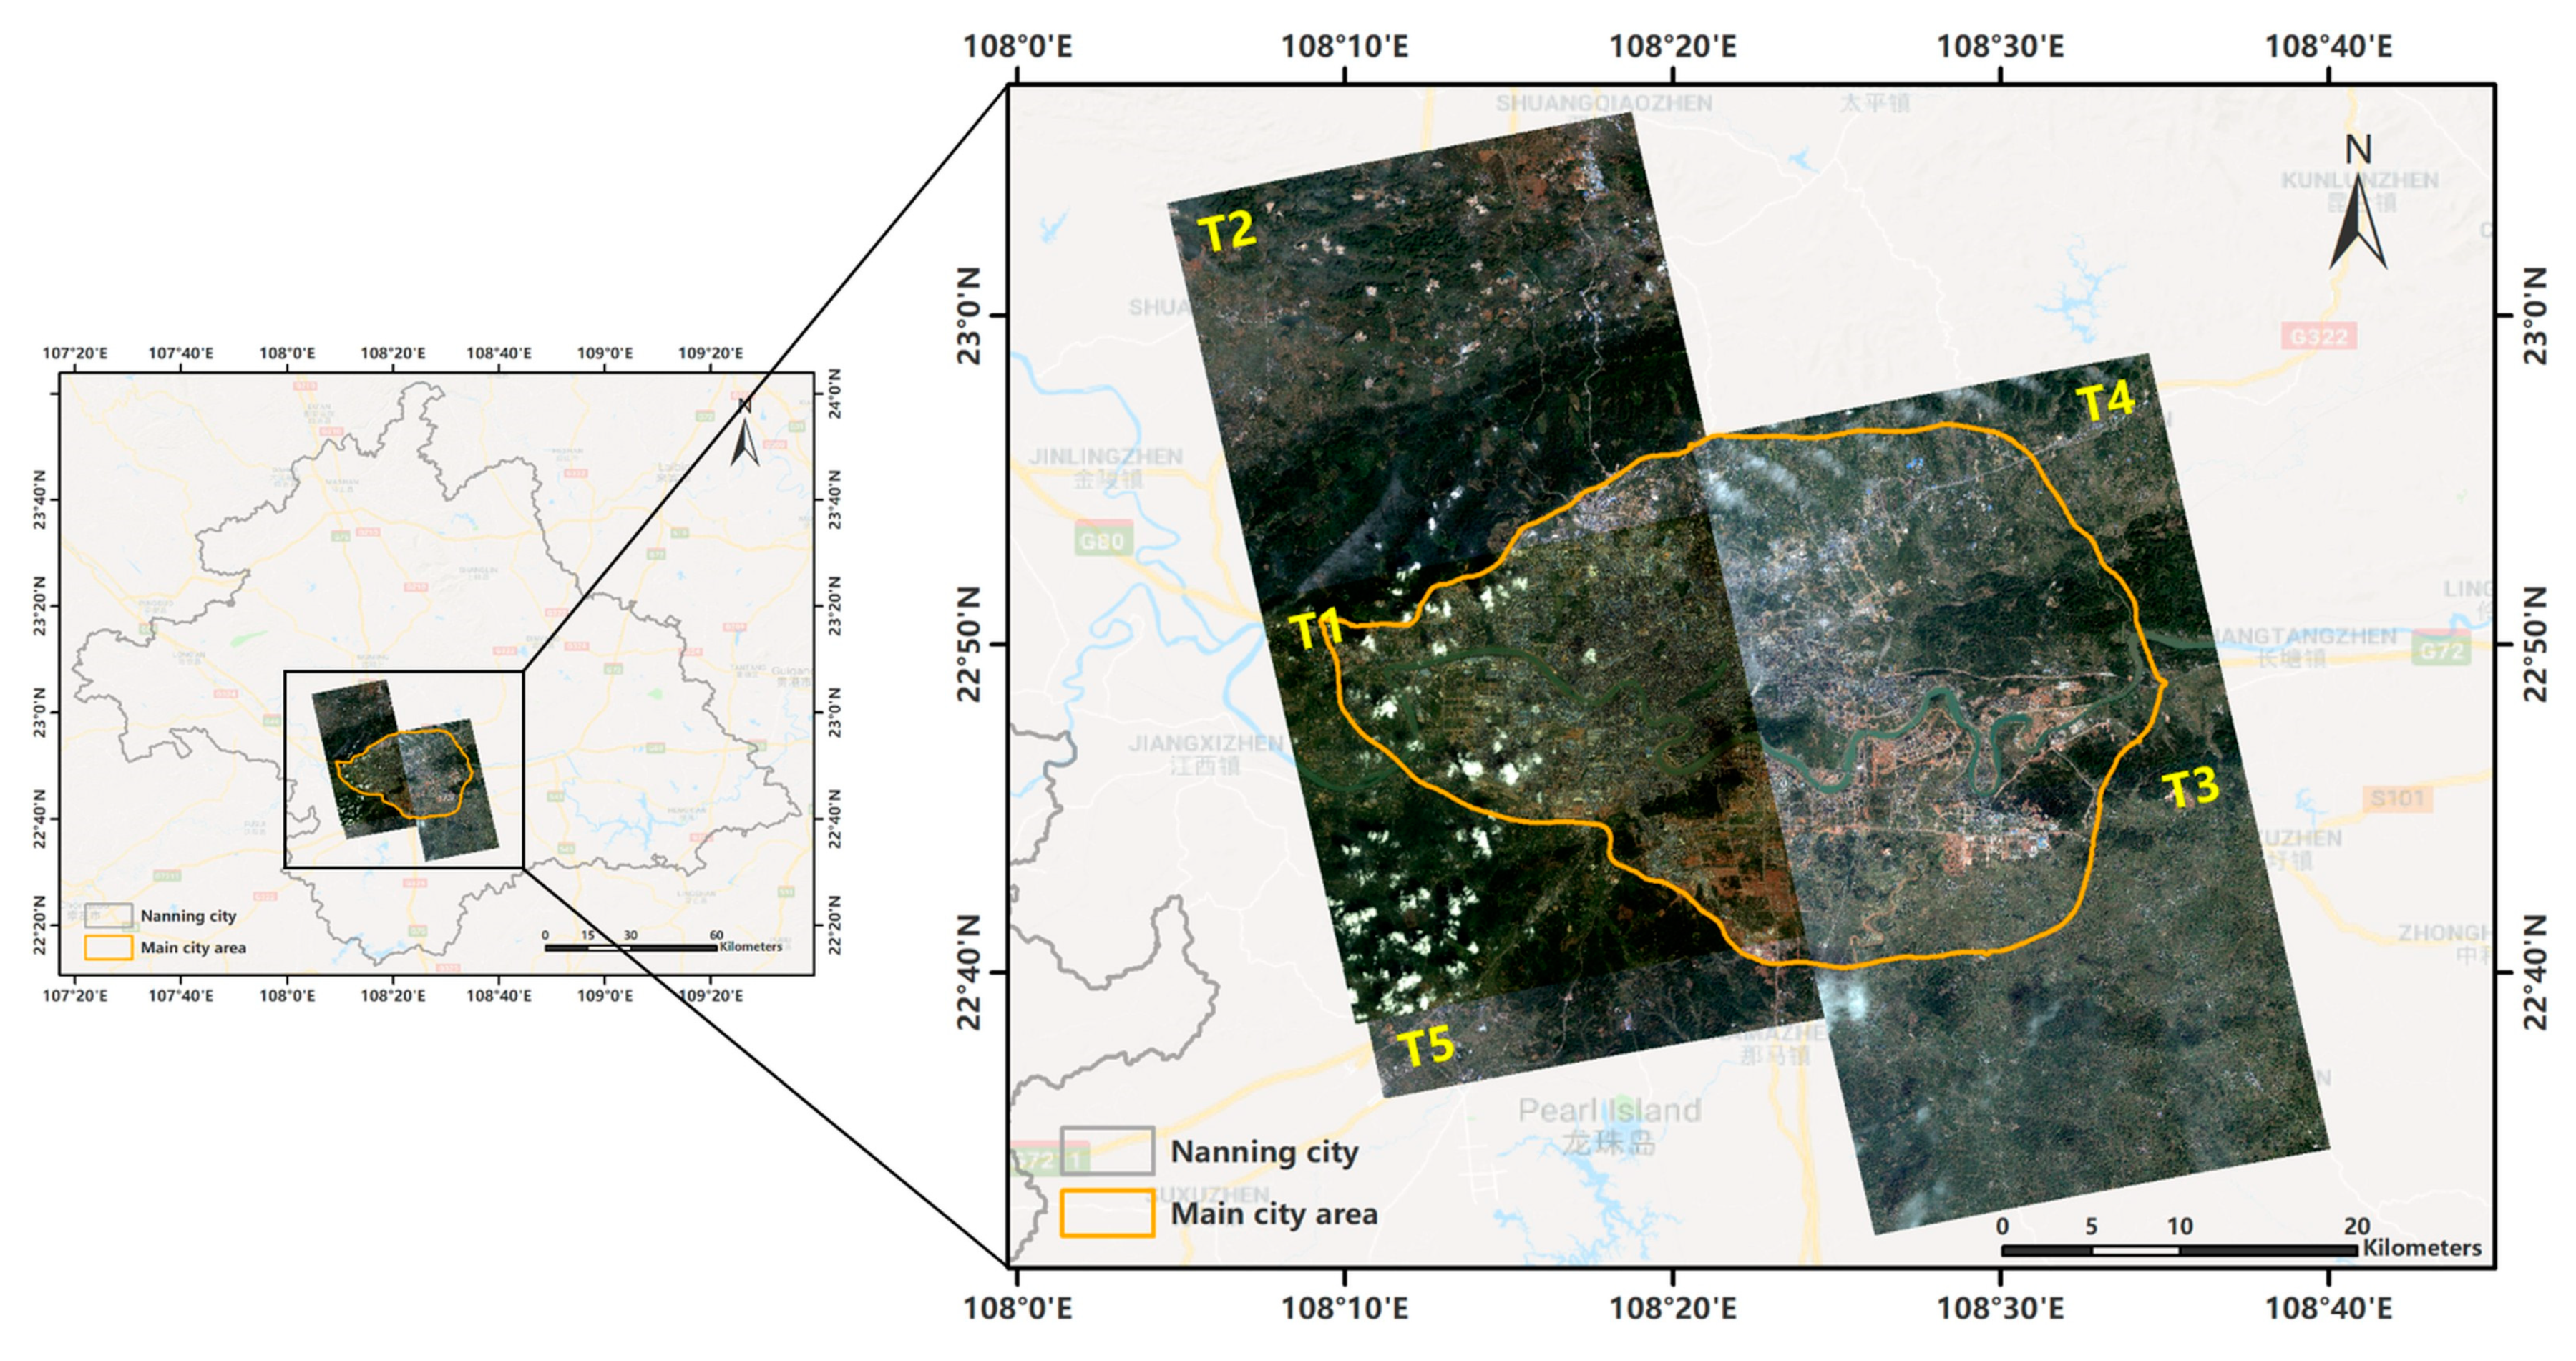
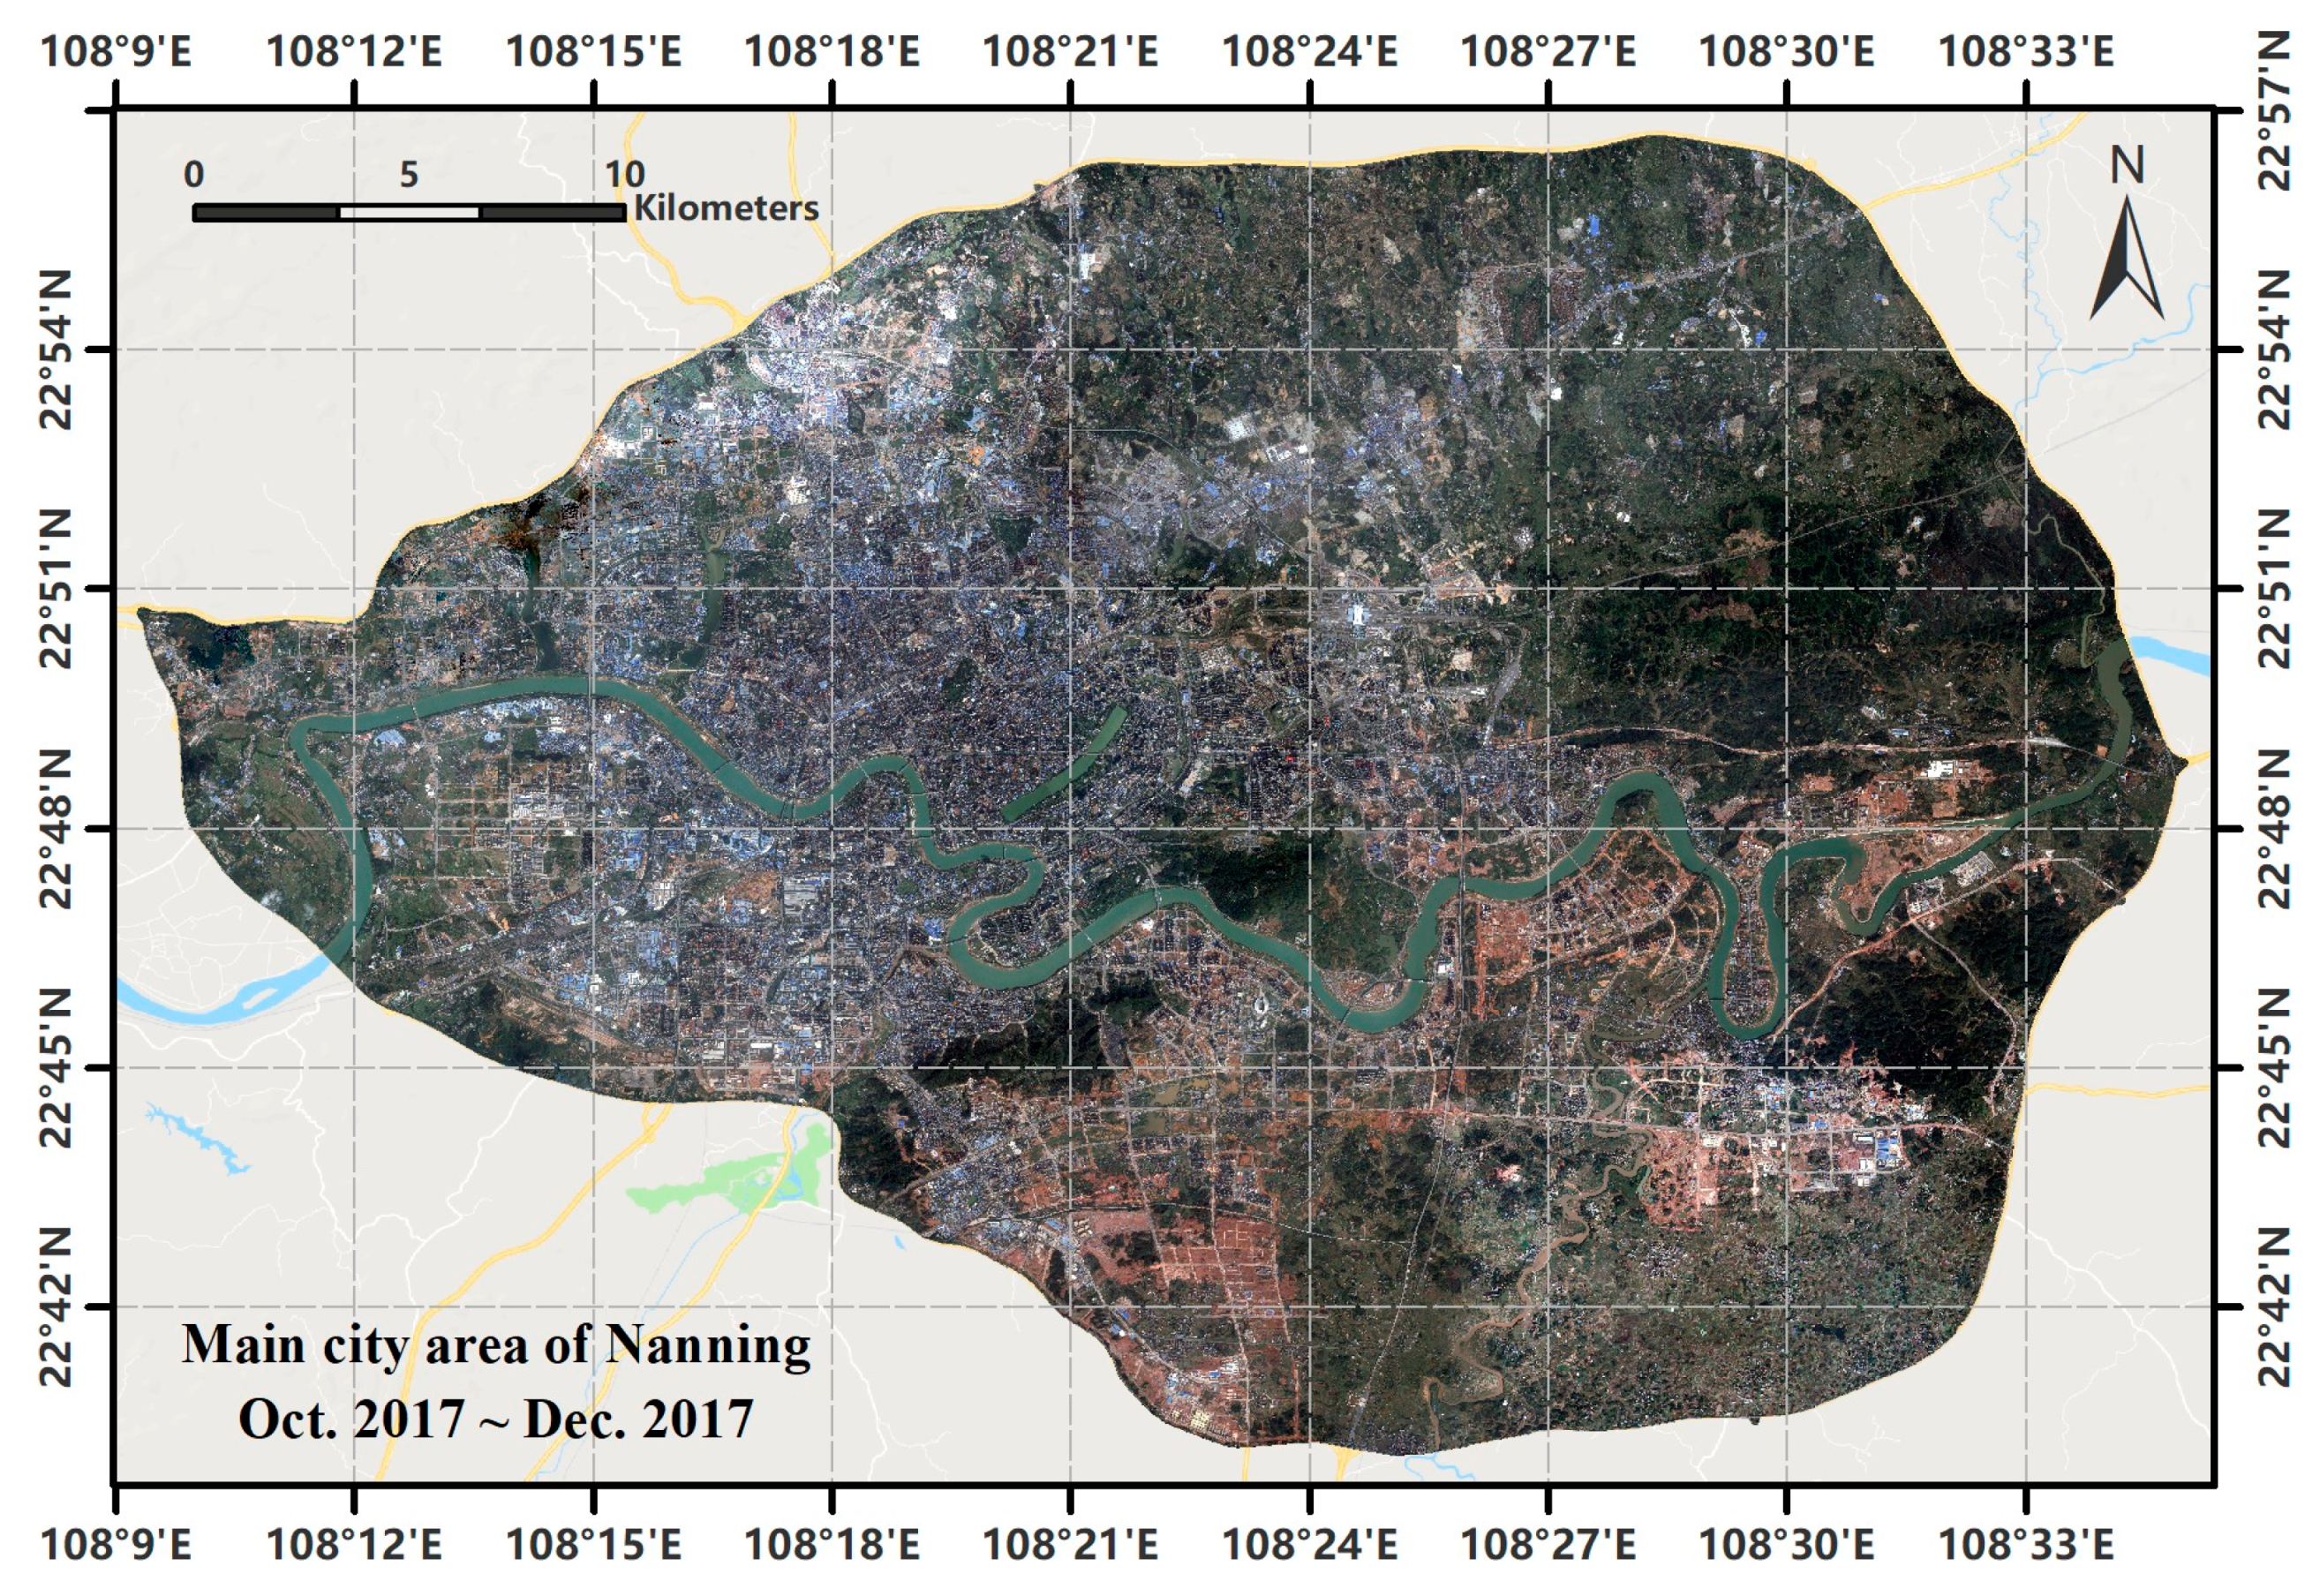
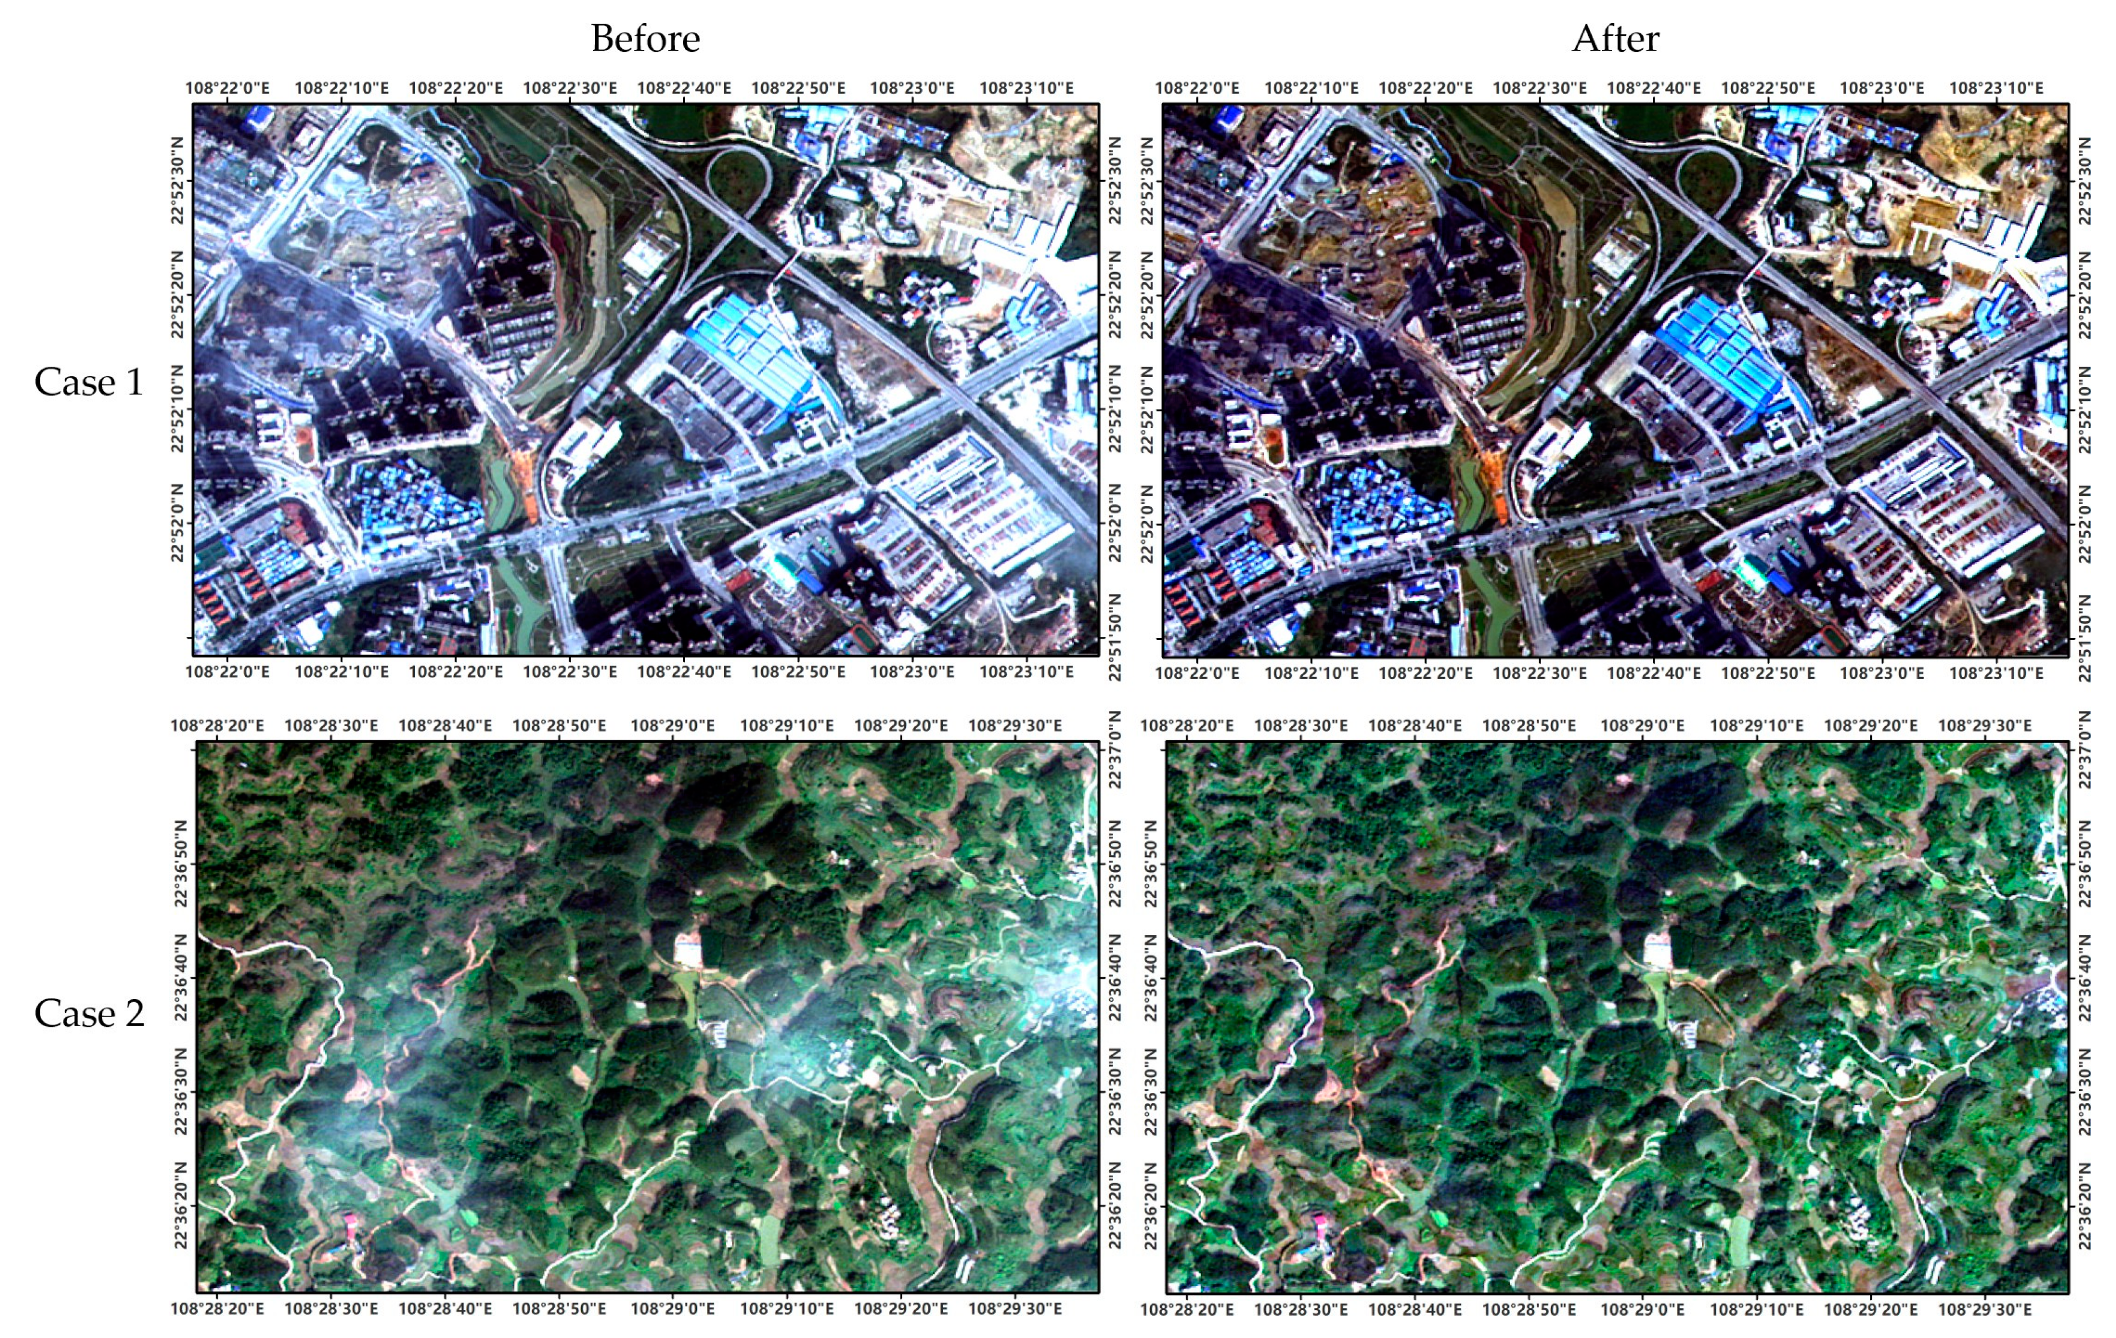
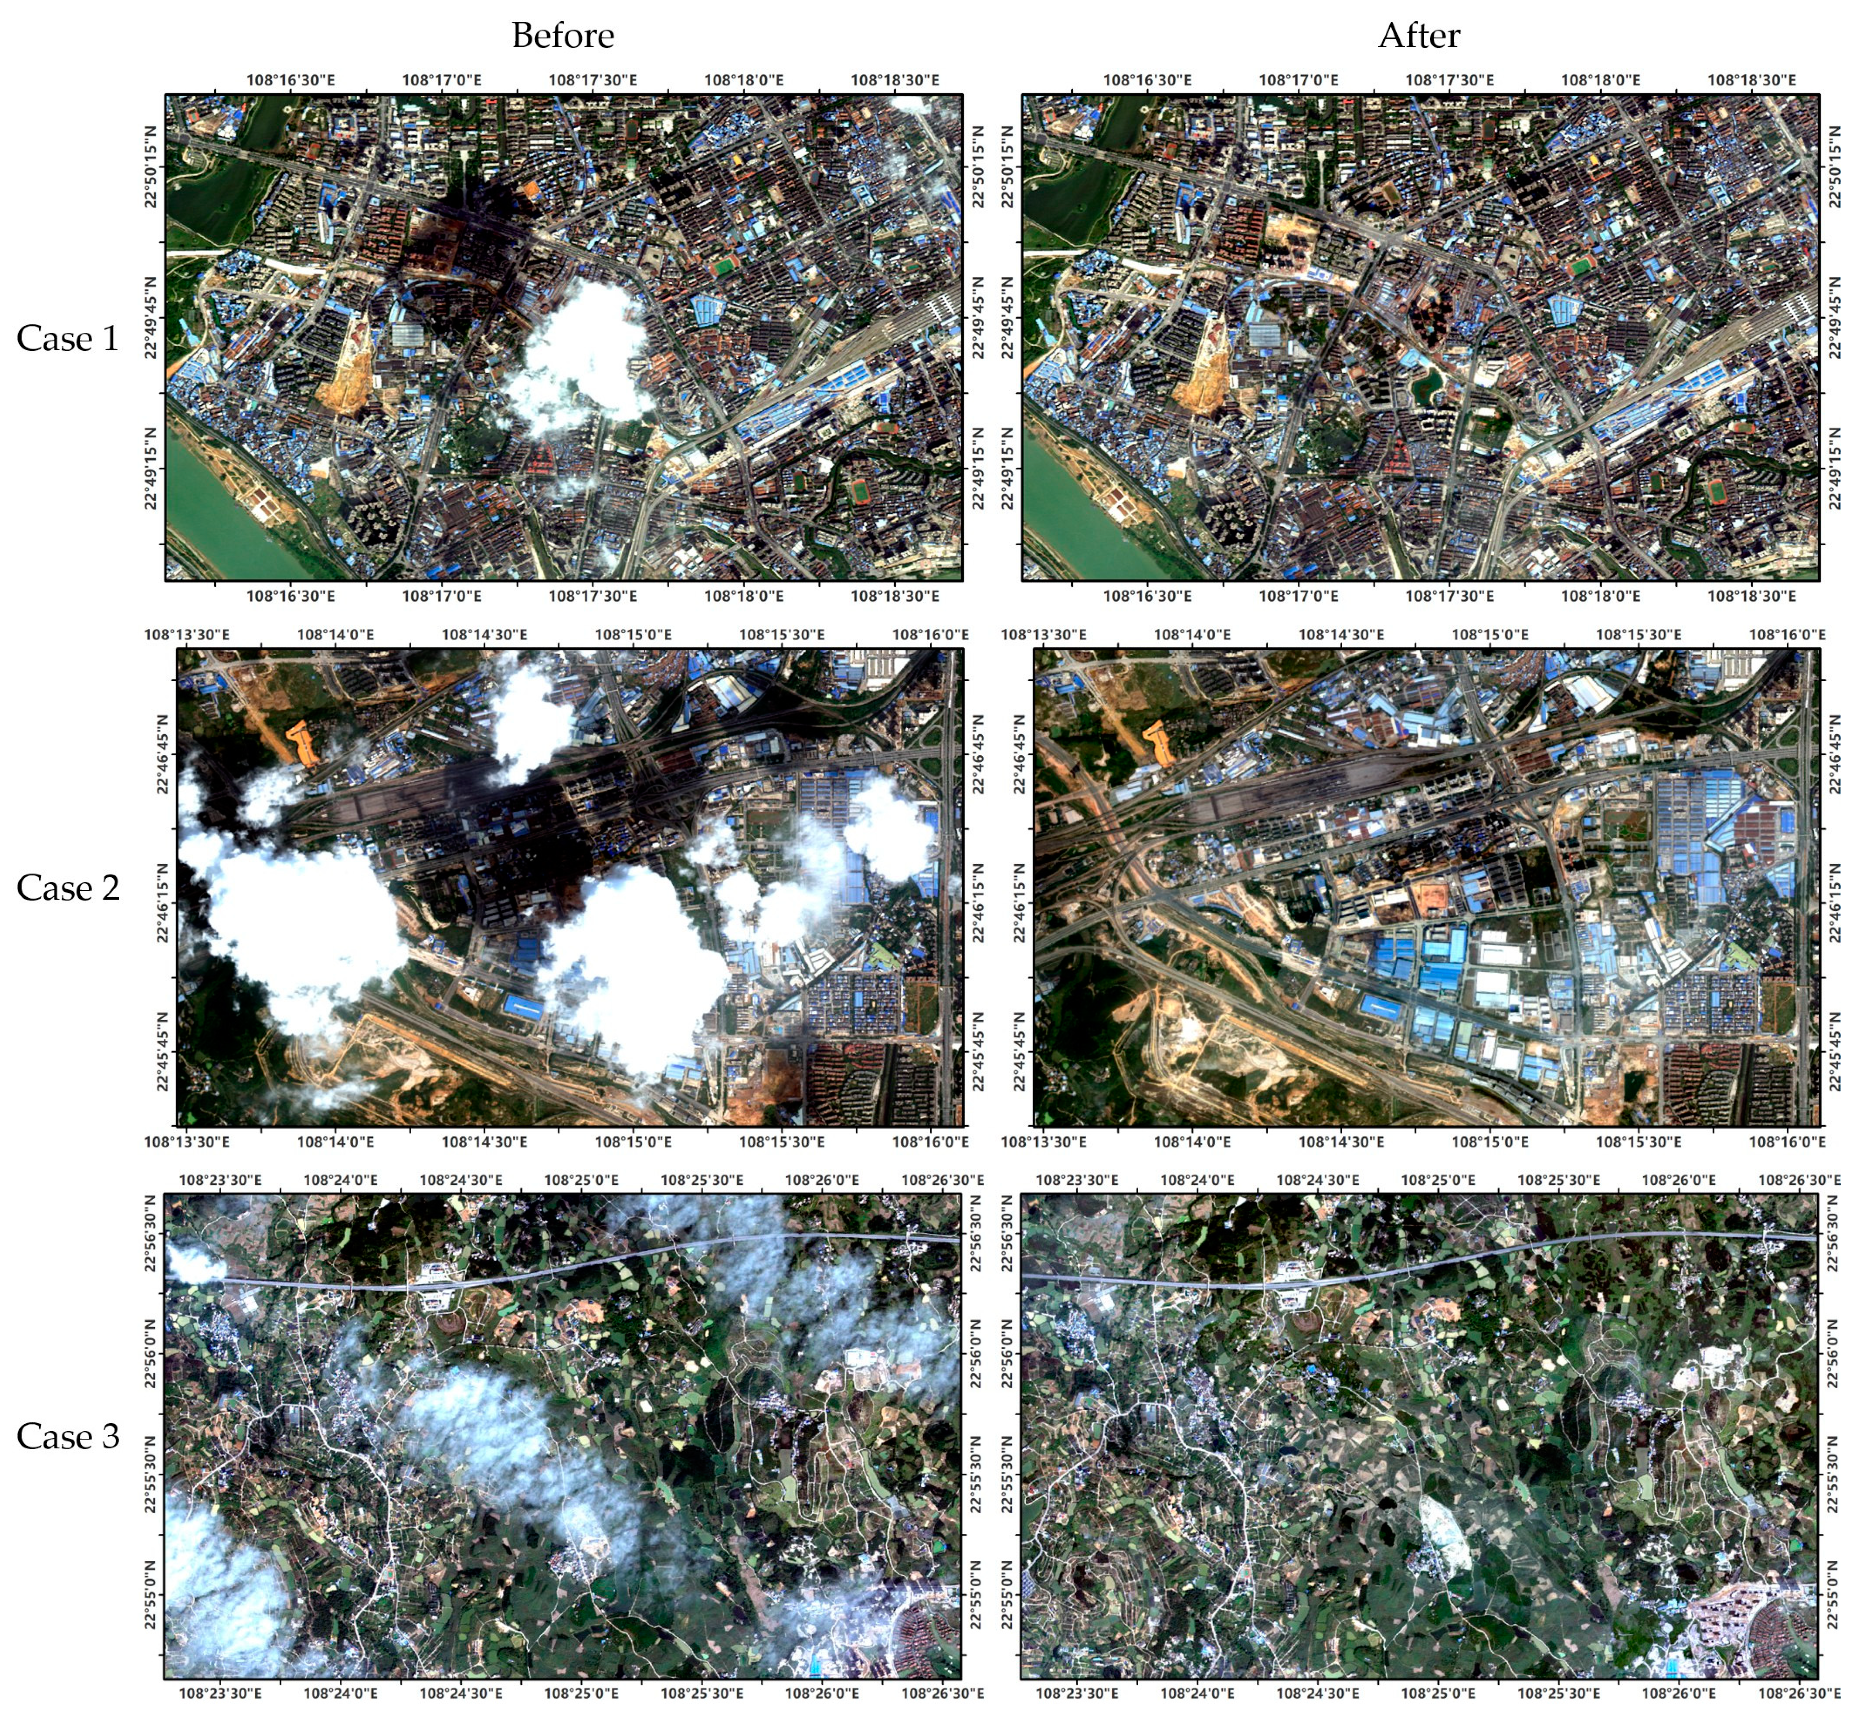
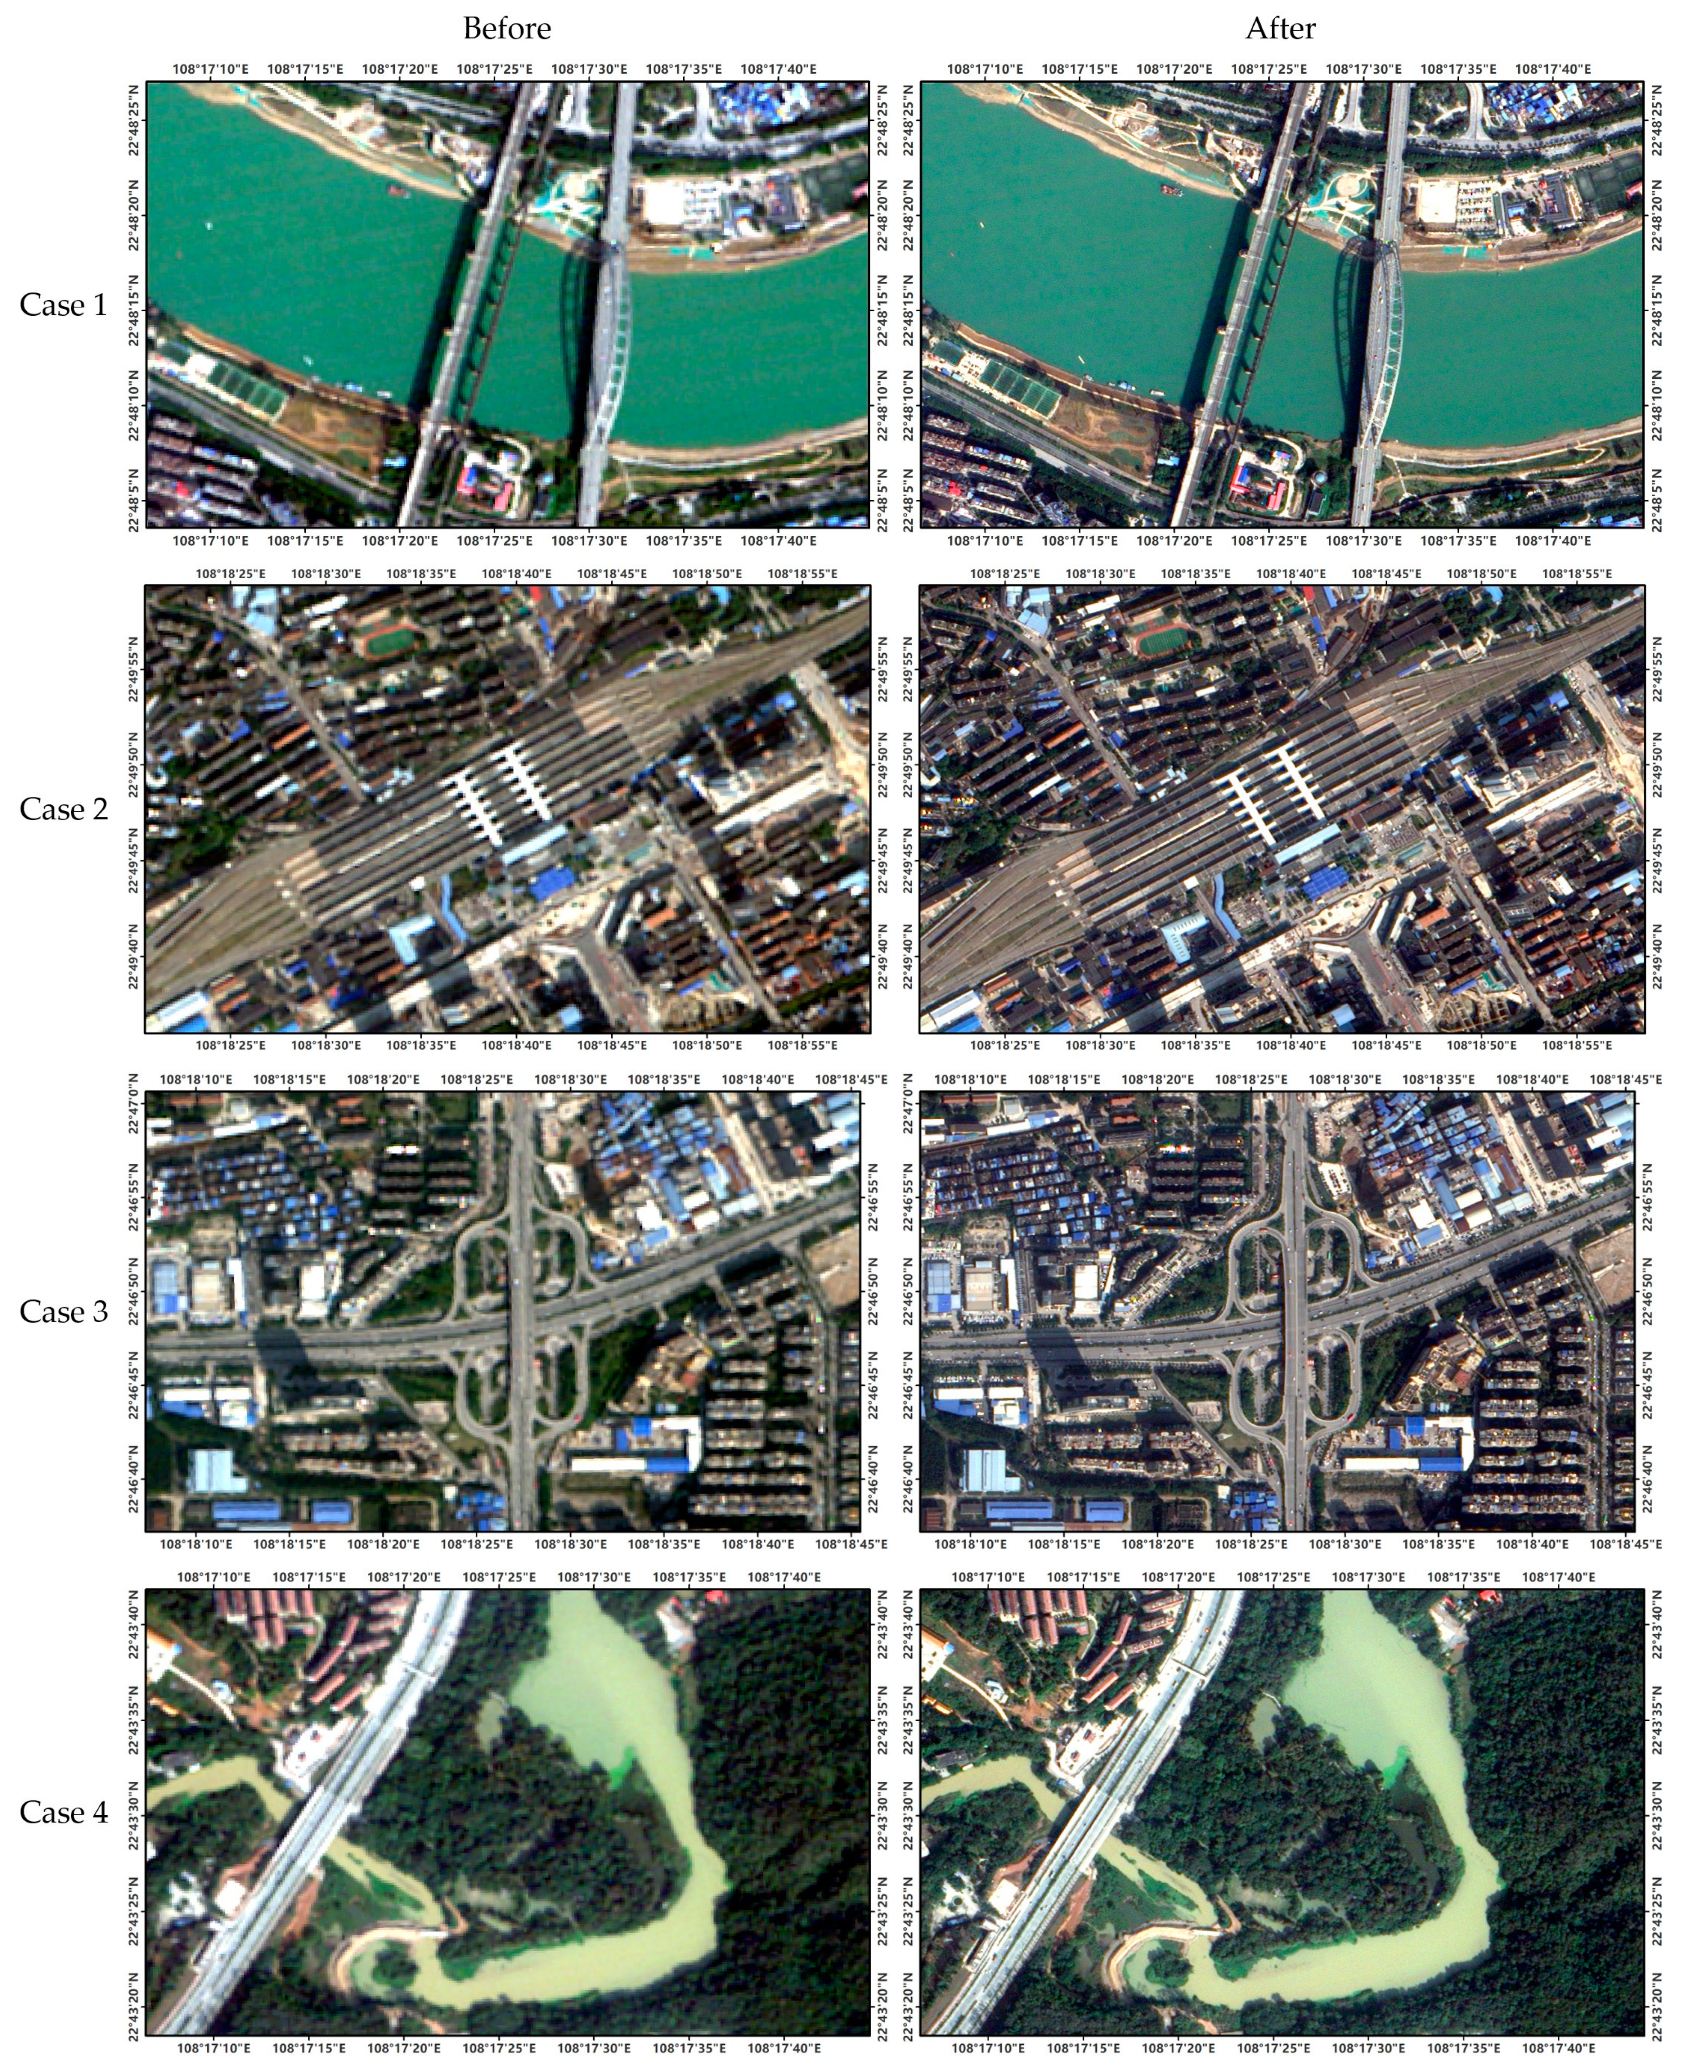
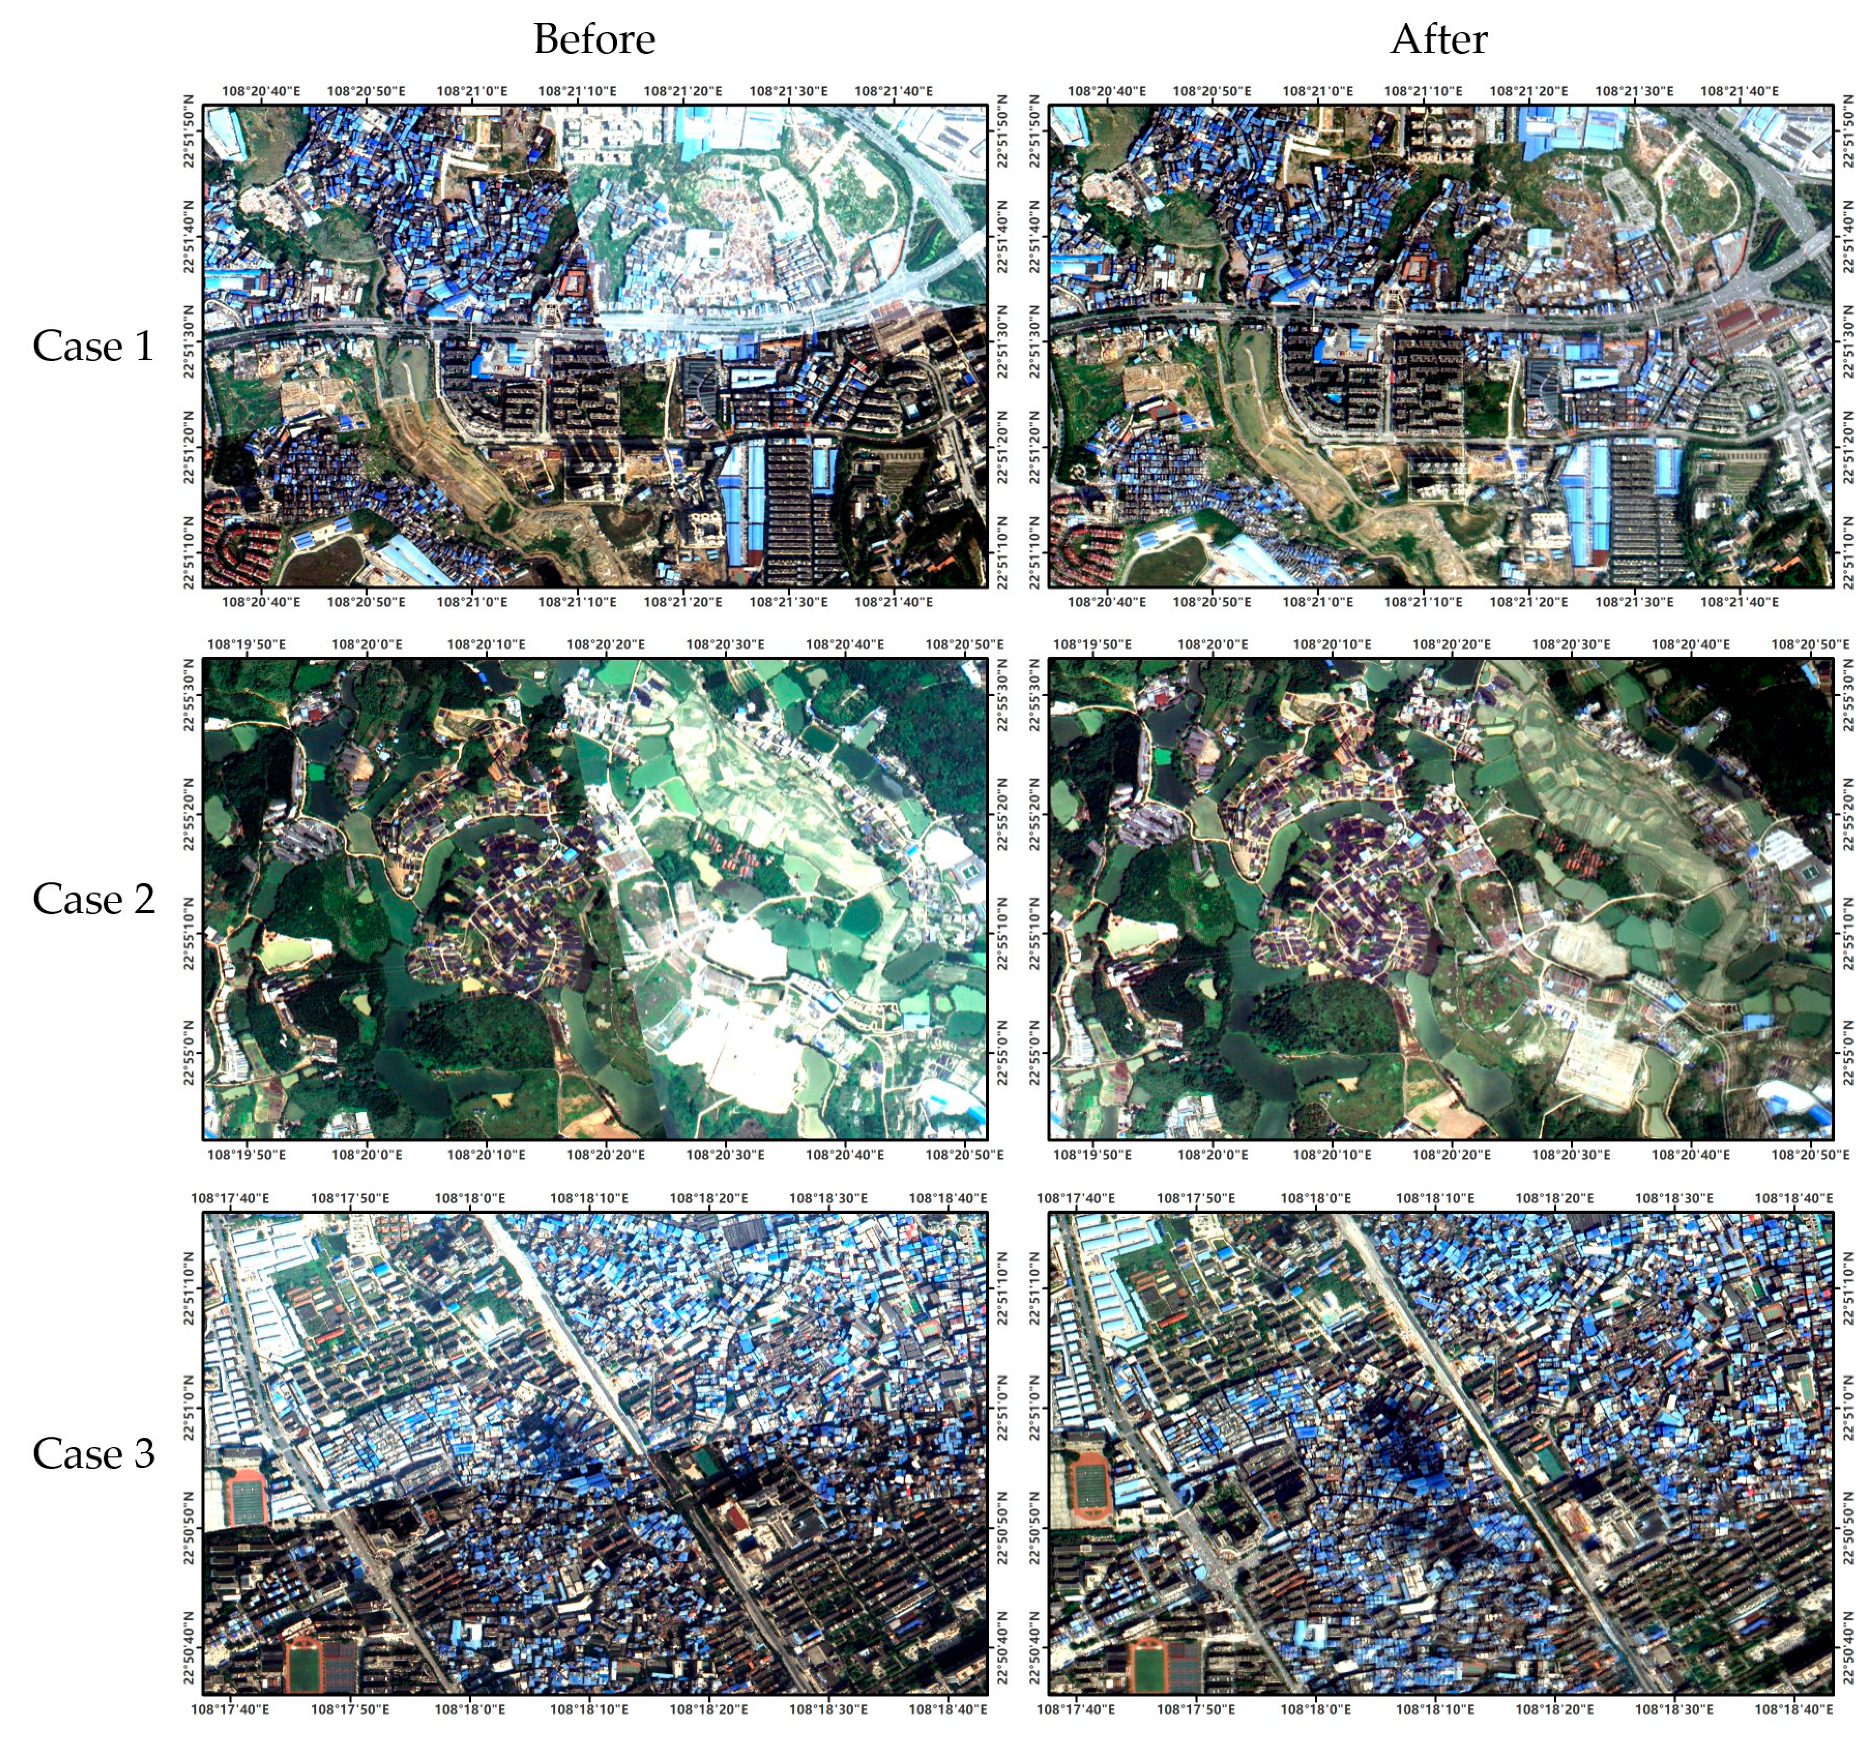
4.1. Urban Map Generation Experiments and Results
4.2. Comparative Experiments and Results
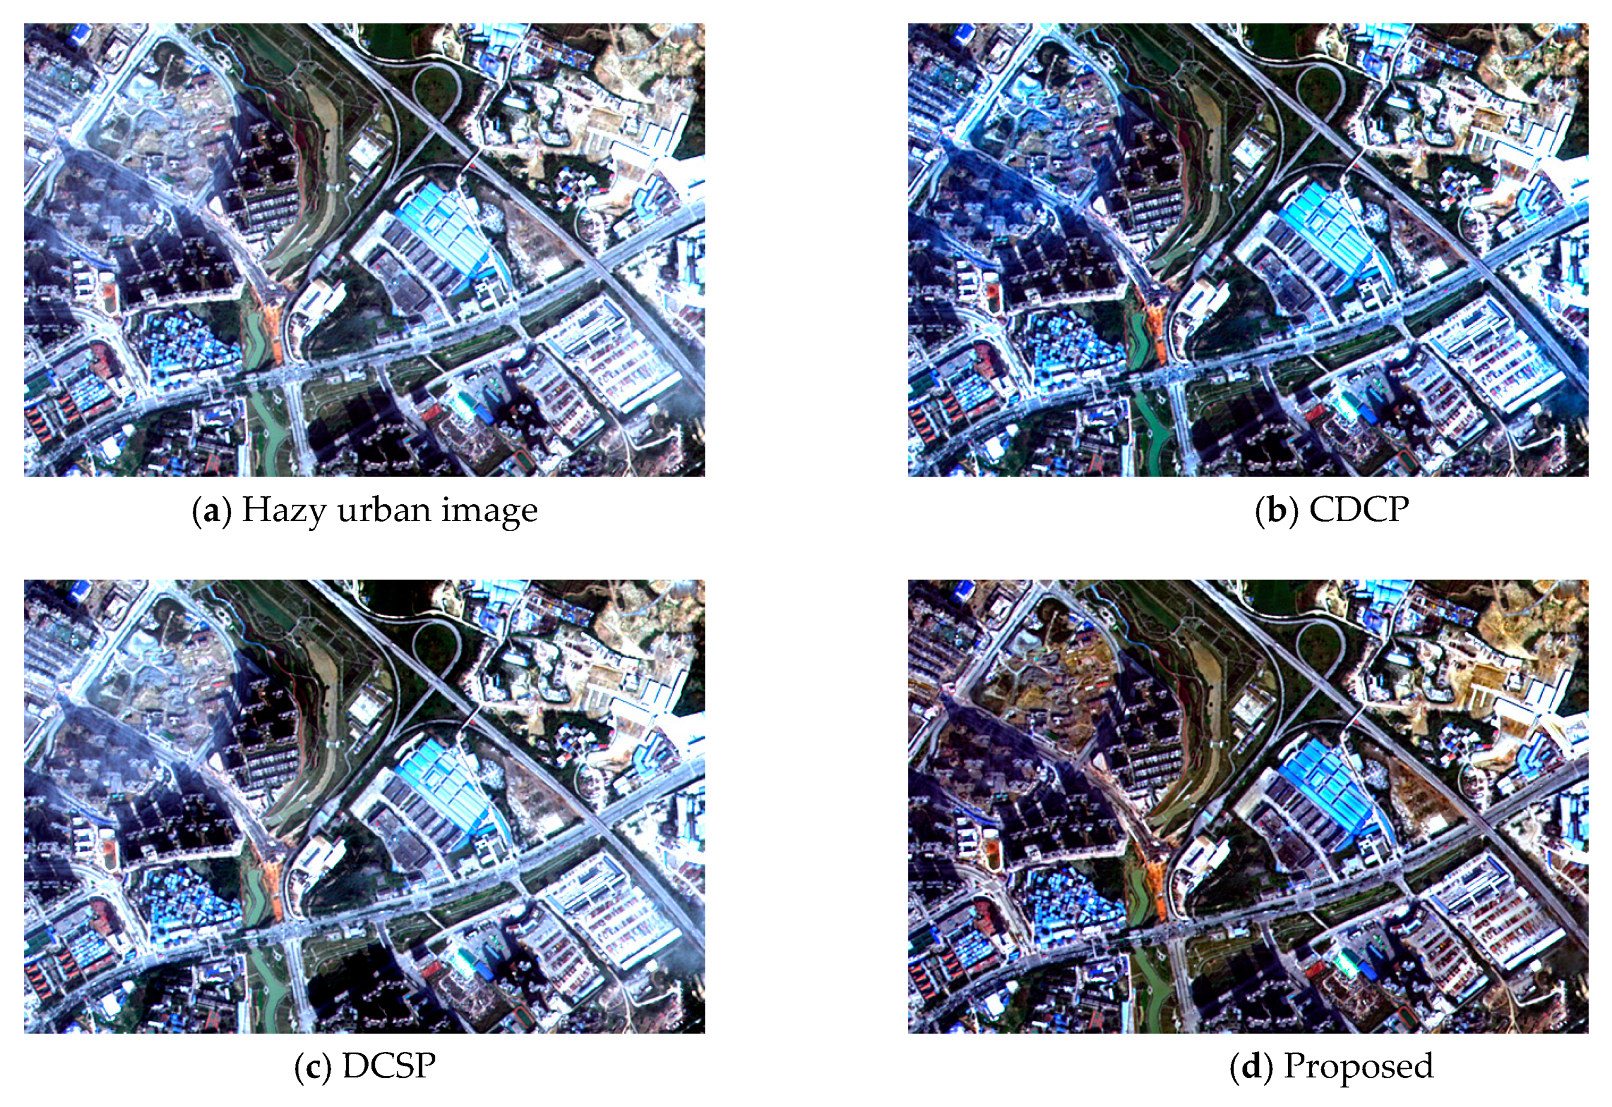
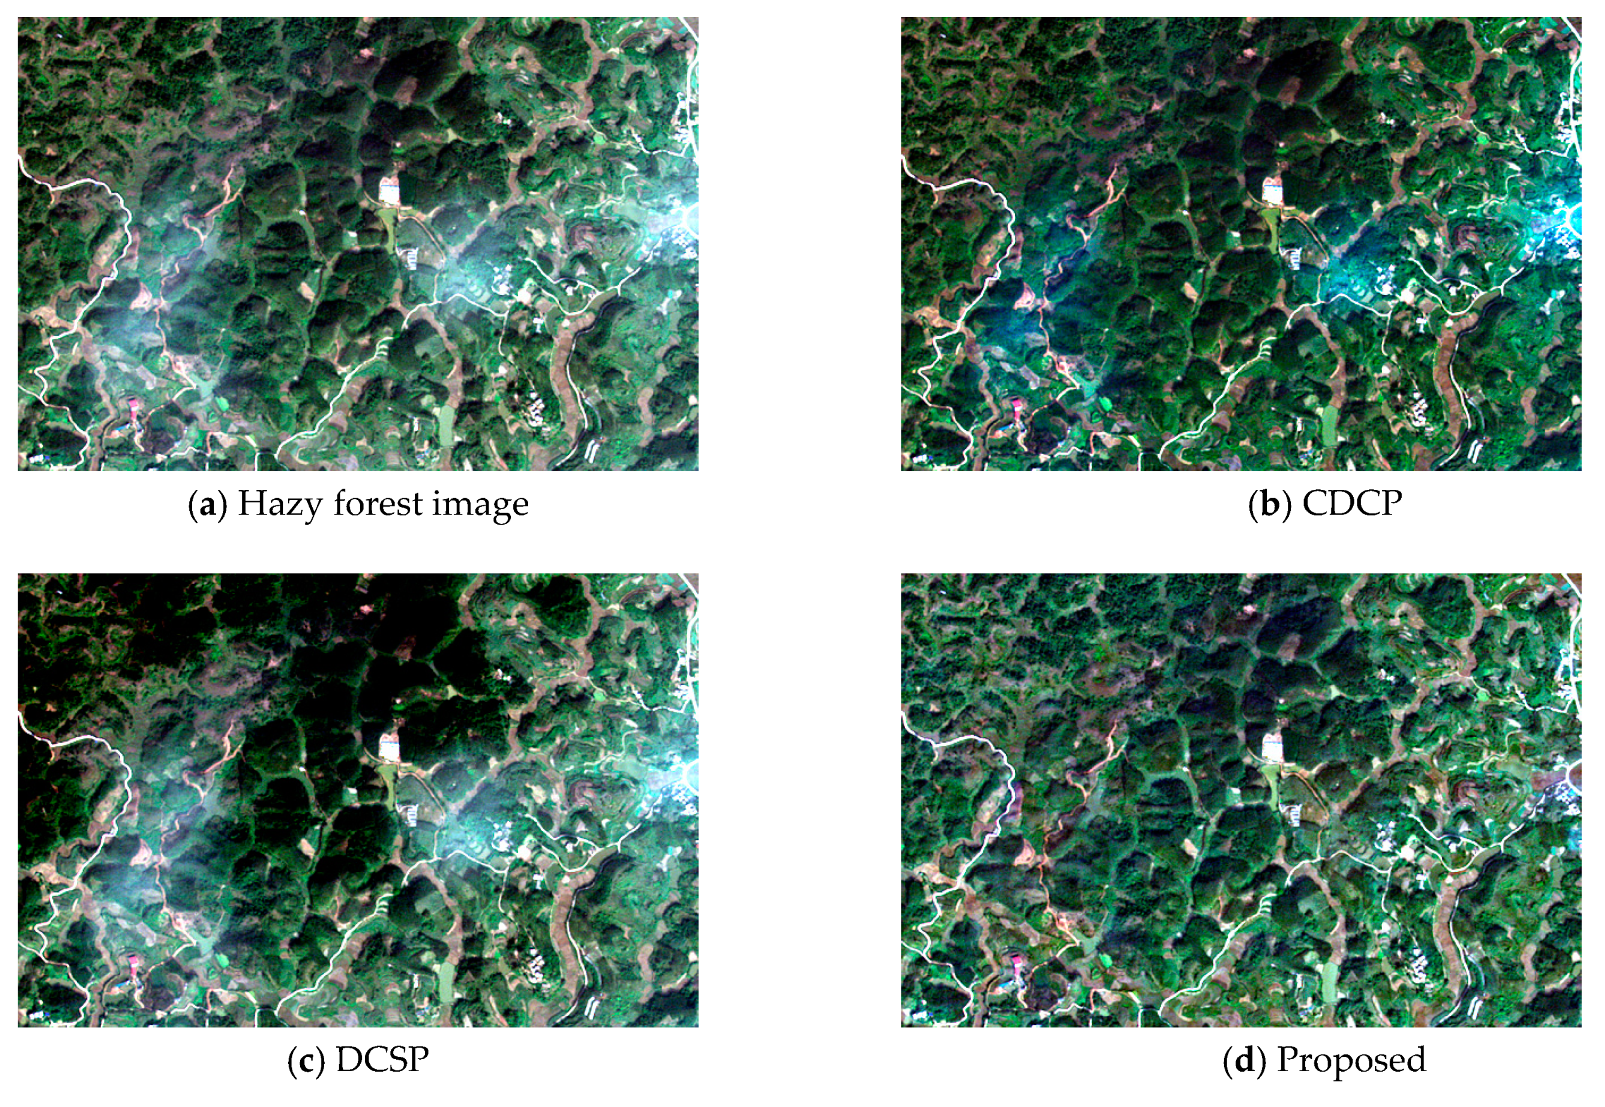
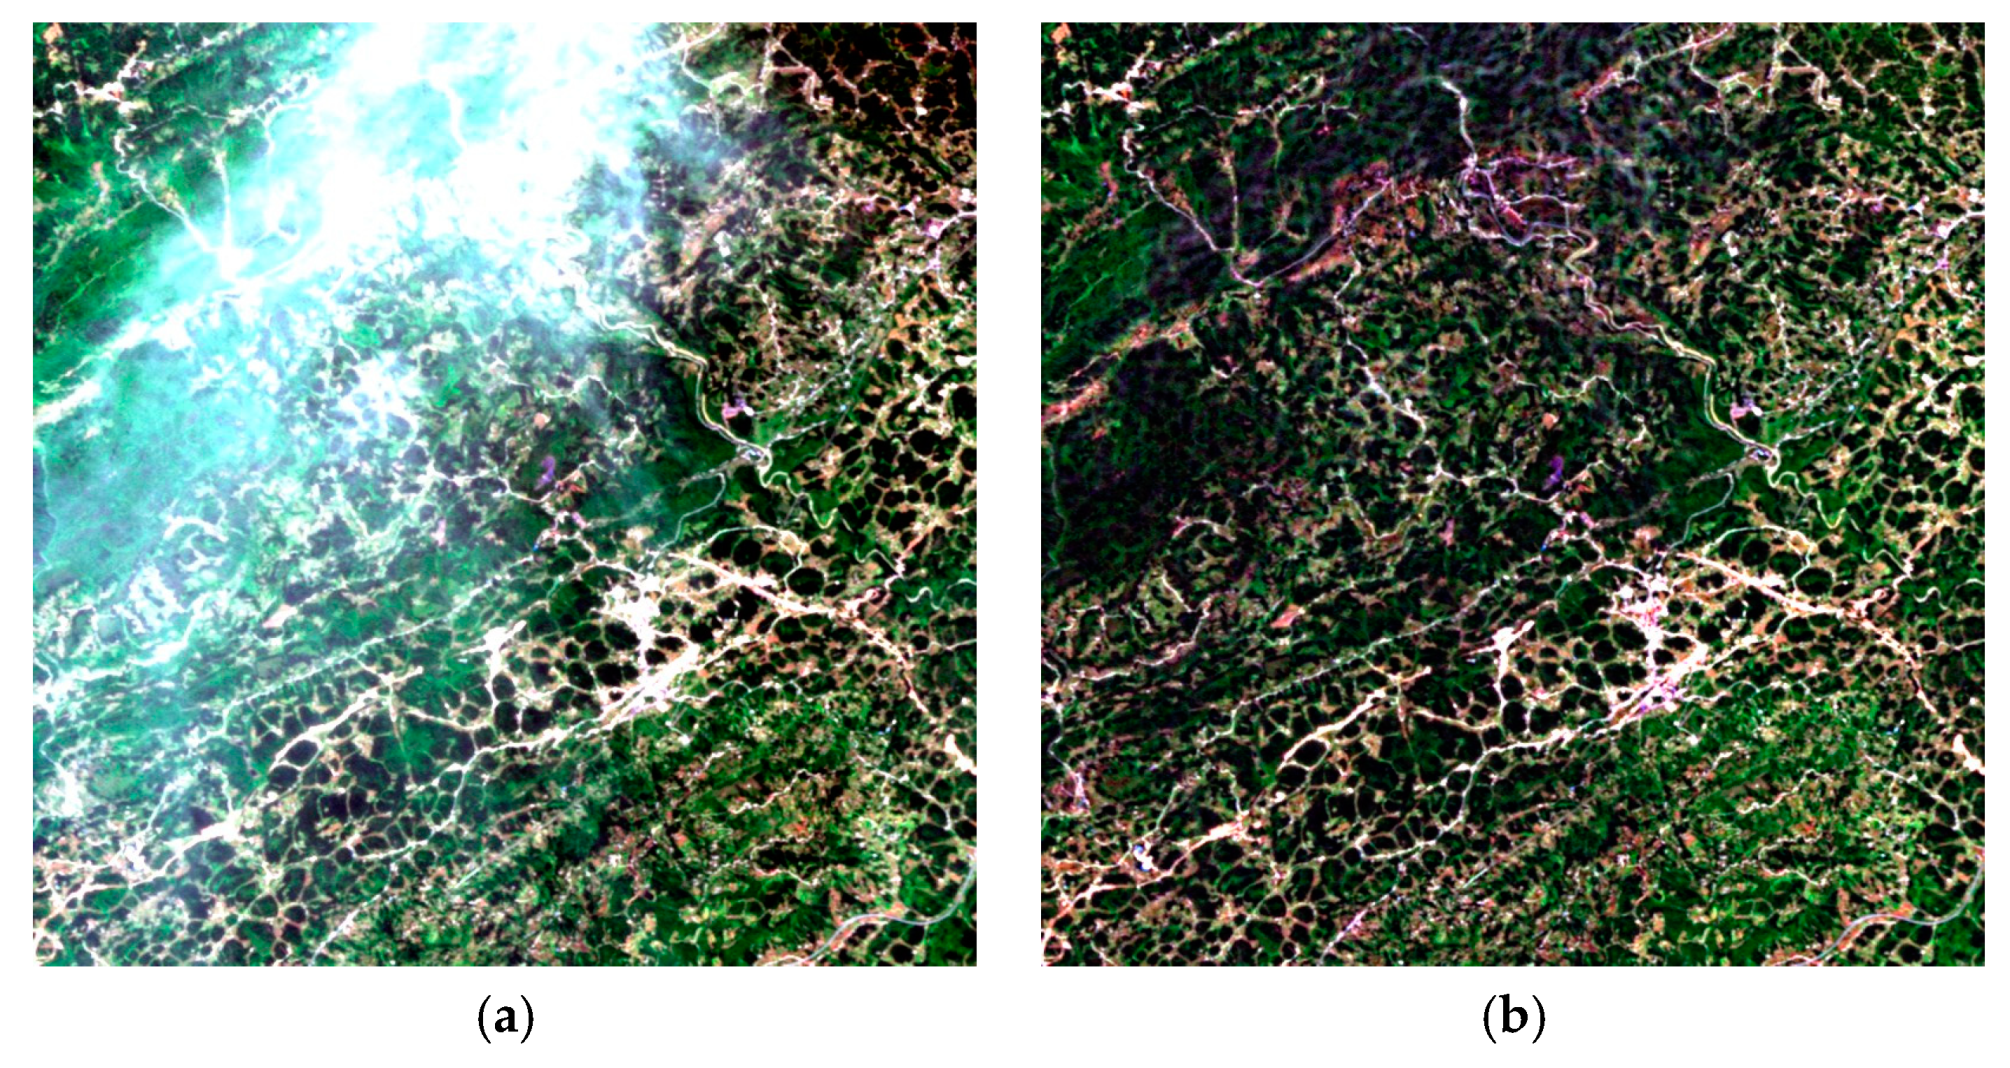
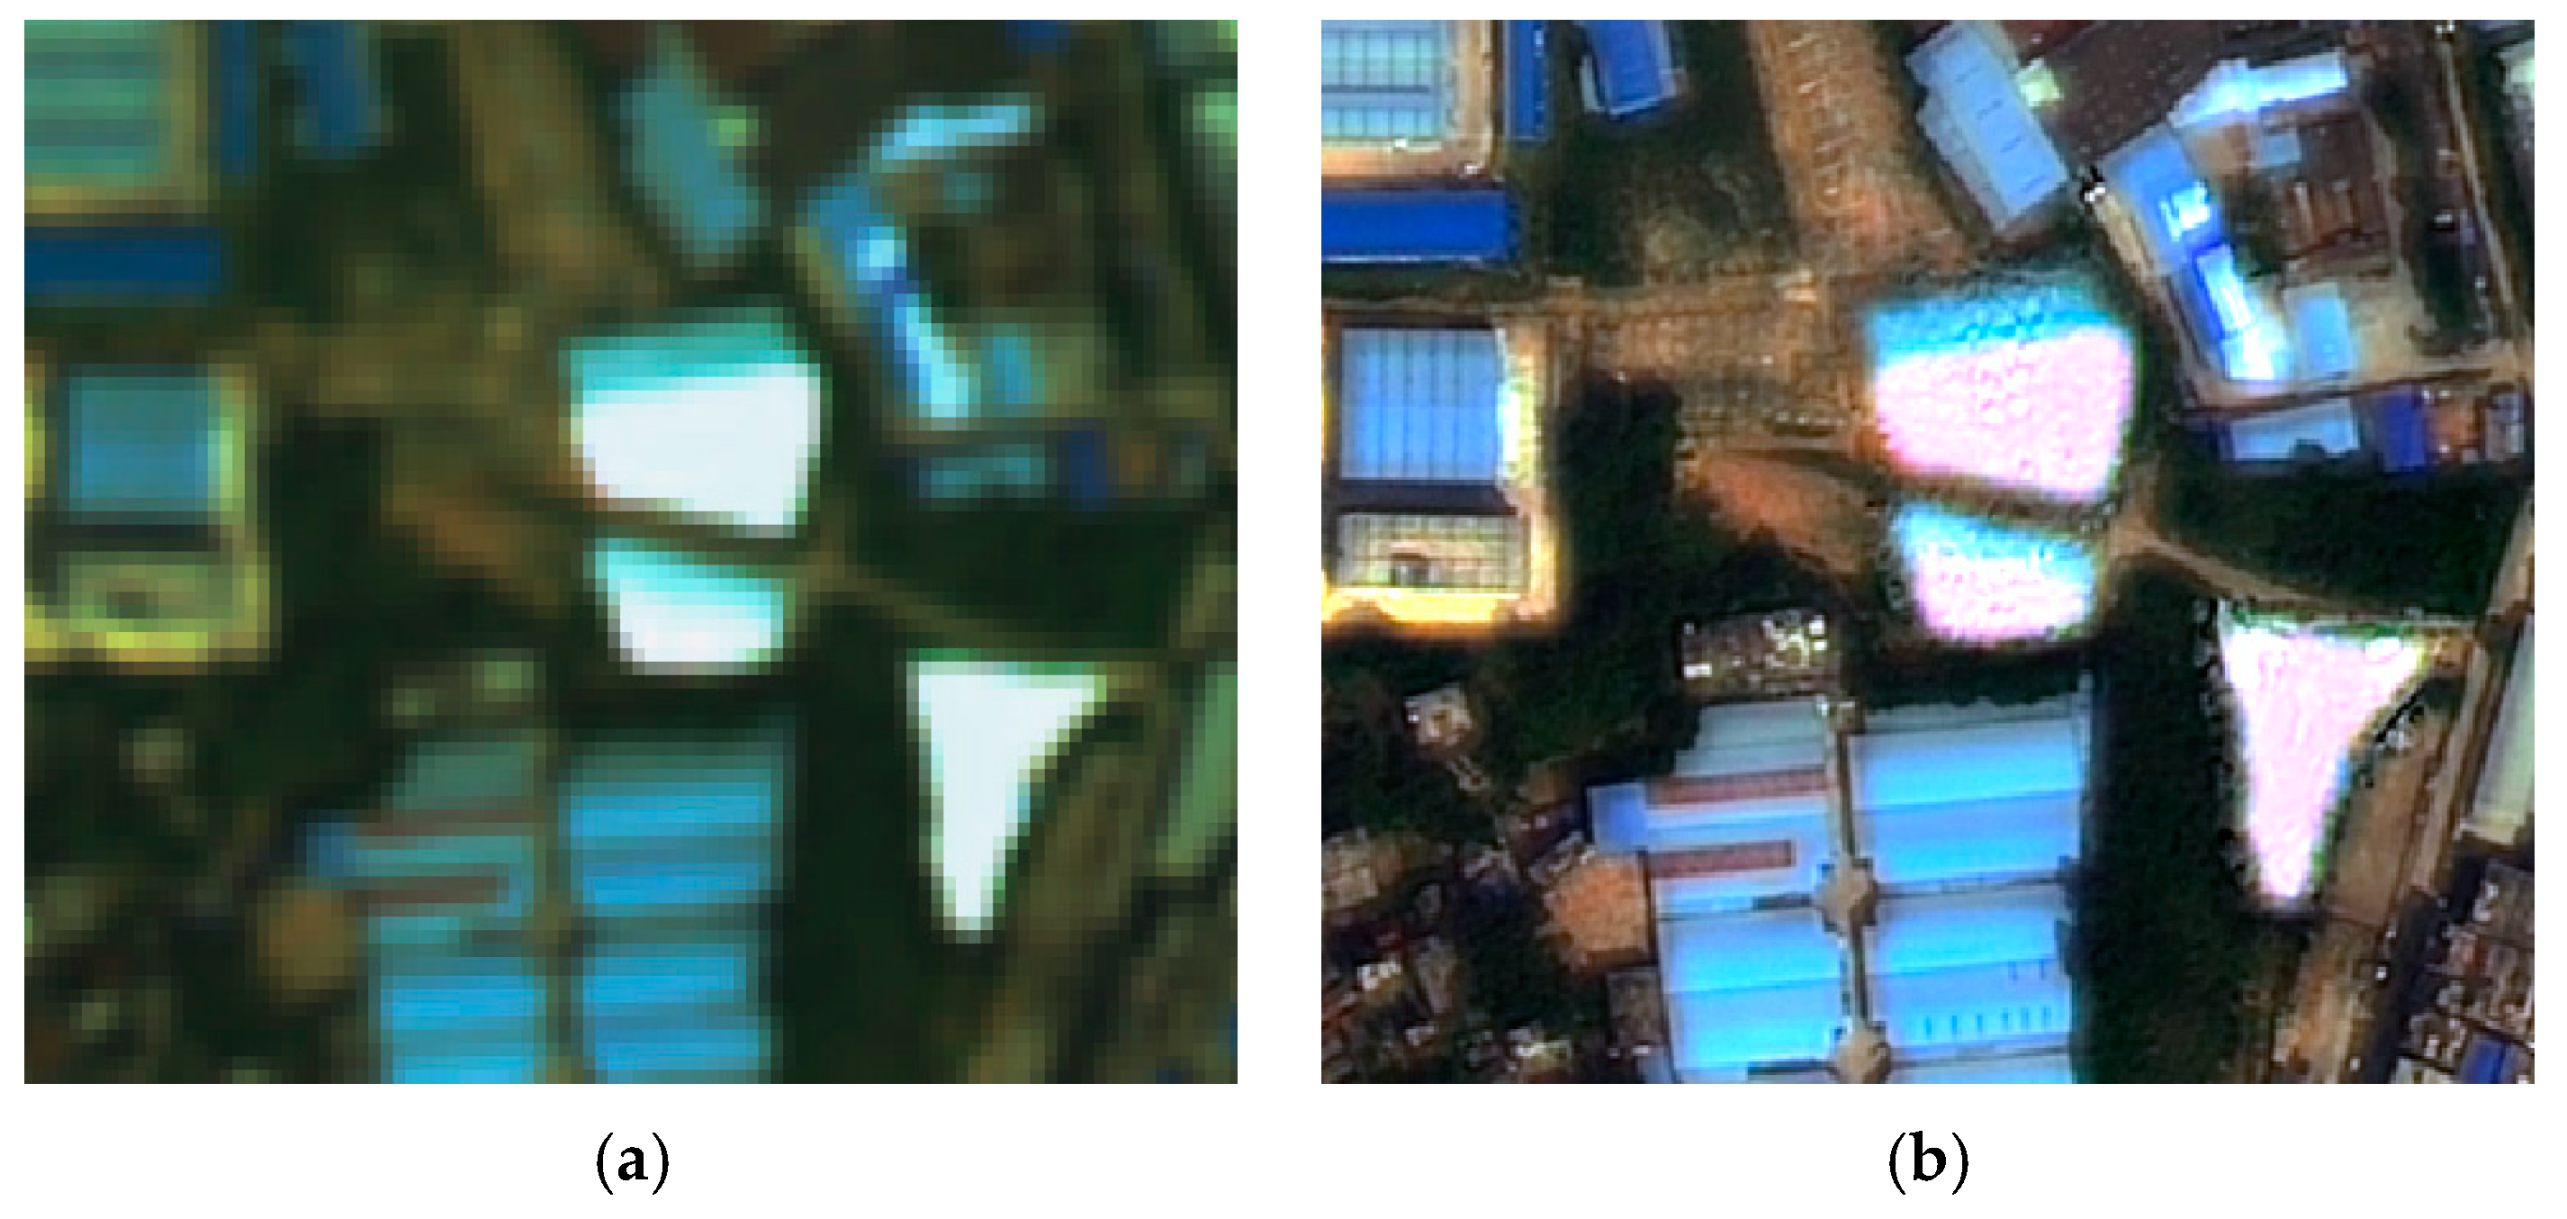
4.2.1. Comparisons of Dehazing and Thin Cloud Removal Methods
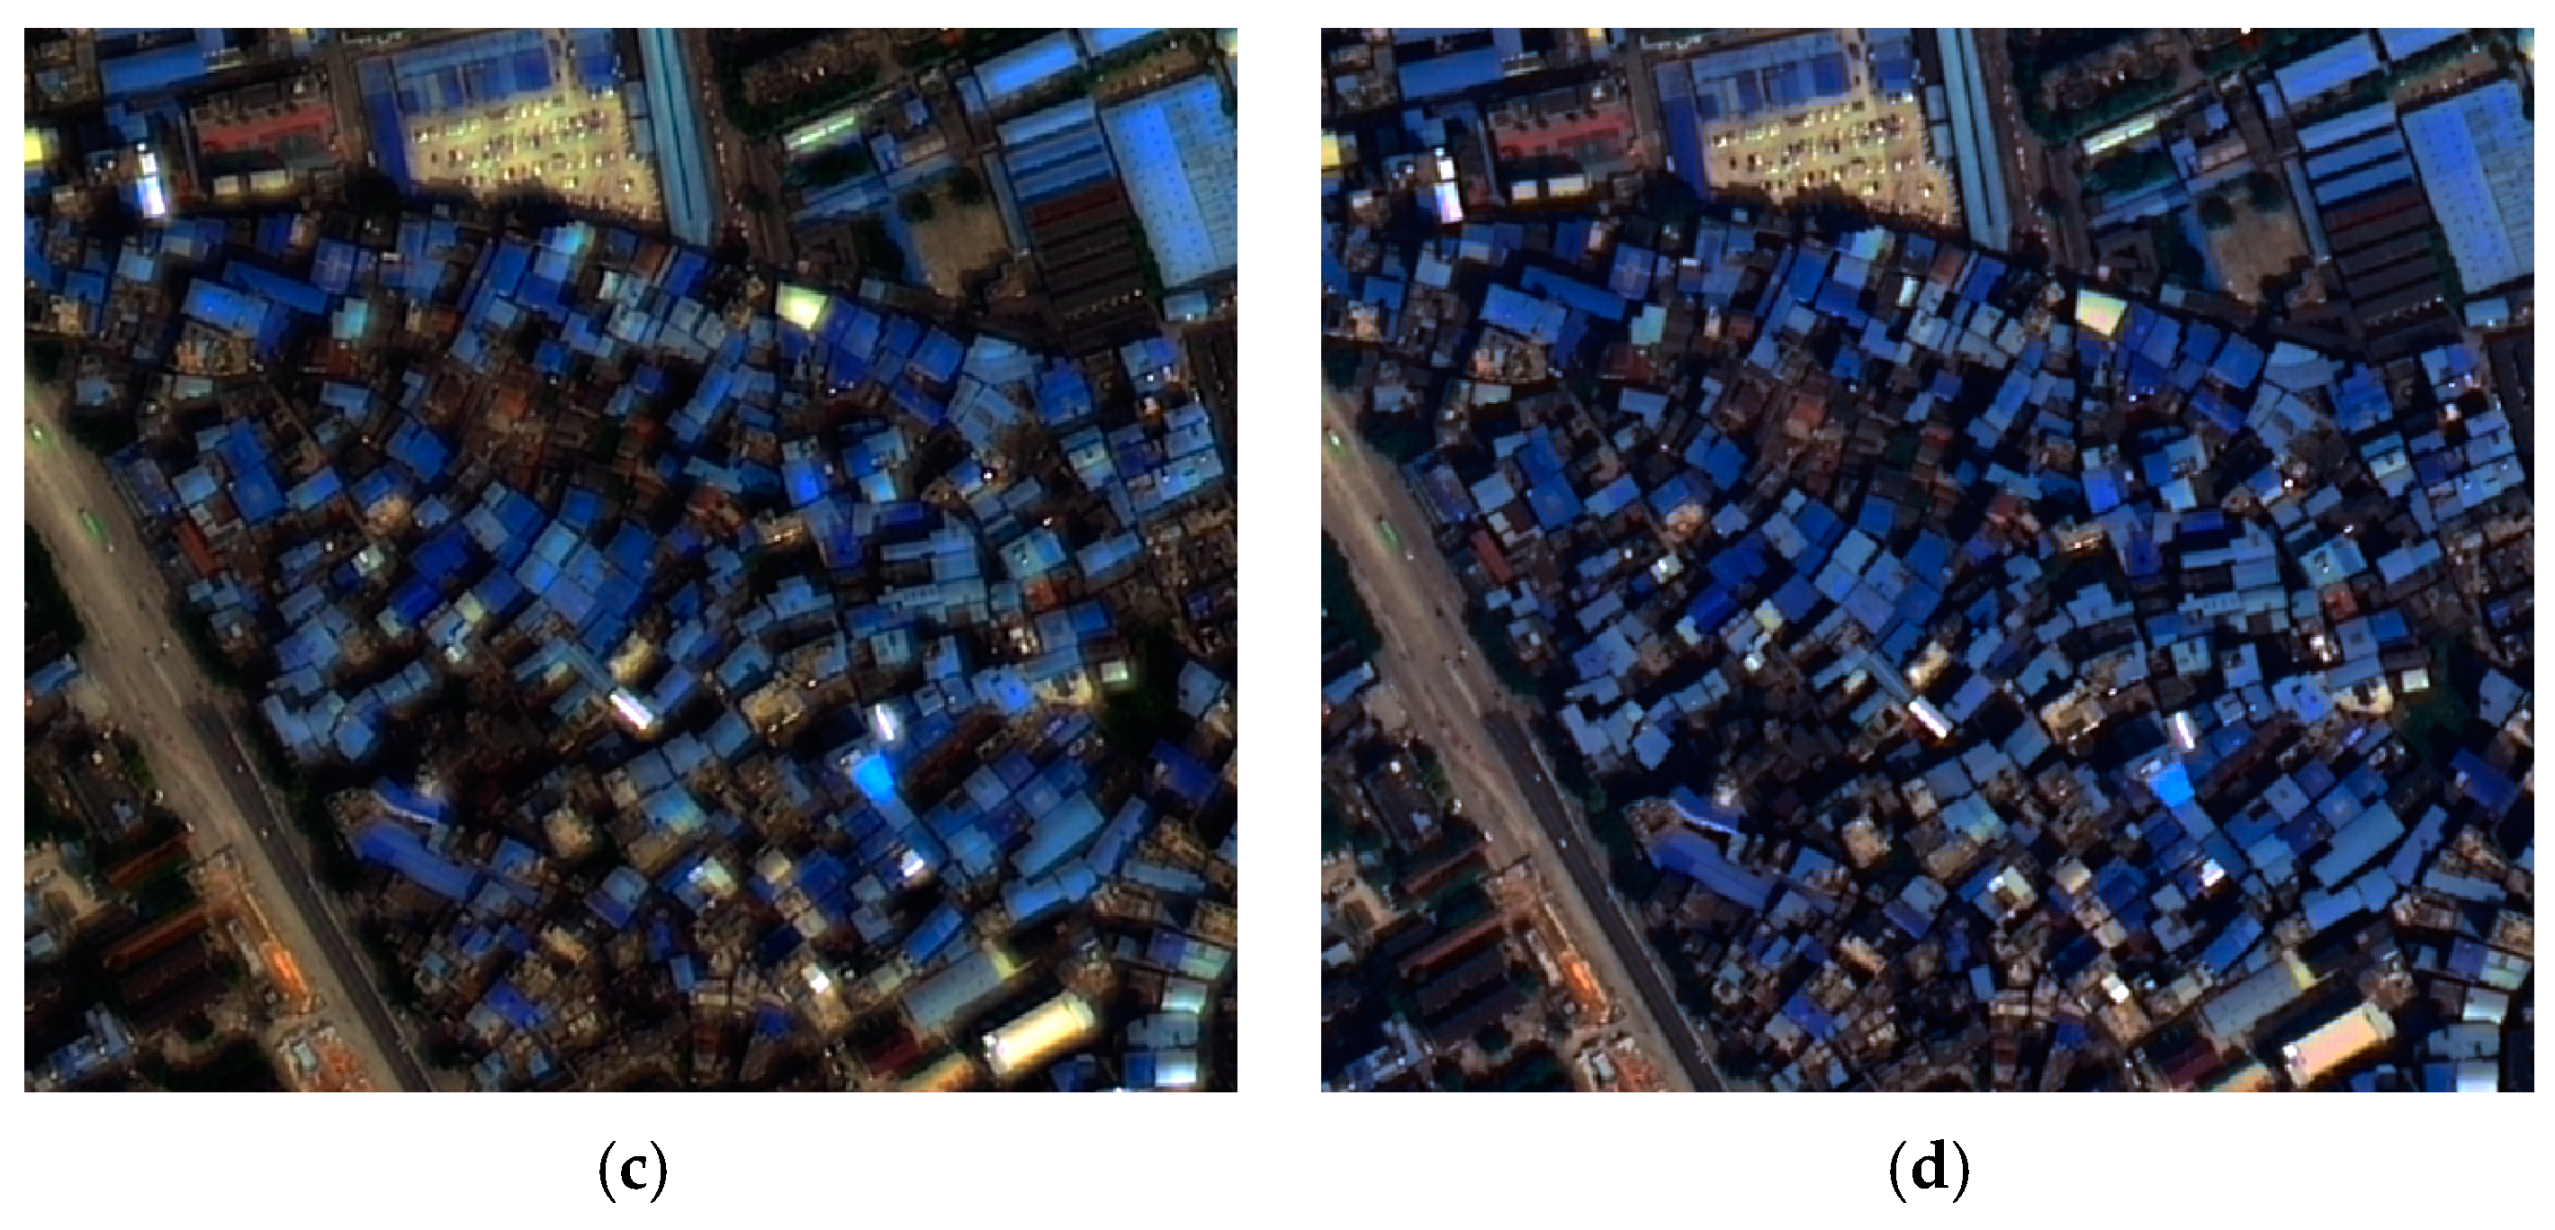
4.2.2. Comparisons Thick Cloud Removal Methods
5. Discussion
6. Conclusions
Author Contributions
Funding
Acknowledgments
Conflicts of Interest
References
- Martinuzzi, S.; Gould, W.A.; Ramos González, O.M. Land development, land use, and urban sprawl in Puerto Rico integrating remote sensing and population census data. Landsc. Urban Plan. 2007, 79, 288–297. [Google Scholar] [CrossRef]
- Xiao, J.; Shen, Y.; Ge, J.; Tateishi, R.; Tang, C.; Liang, Y.; Huang, Z. Evaluating urban expansion and land use change in Shijiazhuang, China, by using GIS and remote sensing. Landsc. Urban Plan. 2006, 75, 69–80. [Google Scholar] [CrossRef]
- Hadeel, A.S.; Jabbar, M.T.; Chen, X. Application of remote sensing and GIS to the study of land use/cover change and urbanization expansion in Basrah province, southern Iraq. Geo-Spat. Inf. Sci. 2009, 12, 135–141. [Google Scholar] [CrossRef]
- Piyoosh, A.K.; Ghosh, S.K. Semi-automatic mapping of anthropogenic impervious surfaces in an urban/suburban area using Landsat 8 satellite data. GISci. Remote Sens. 2017, 54, 471–494. [Google Scholar] [CrossRef]
- Li, X.; Wang, L.; Cheng, Q.; Wu, P.; Gan, W.; Fang, L. Cloud removal in remote sensing images using nonnegative matrix factorization and error correction. ISPRS J. Photogramm. Remote Sens. 2019, 148, 103–113. [Google Scholar] [CrossRef]
- Li, X.; Shen, H.; Li, H.; Zhang, L. Patch matching-based multitemporal group sparse representation for the missing information reconstruction of remote-sensing images. IEEE J. Sel. Top. Appl. Earth Obs. Remote Sens. 2016, 9, 3629–3641. [Google Scholar] [CrossRef]
- Shen, H.; Li, X.; Cheng, Q.; Zeng, C.; Yang, G.; Li, H.; Zhang, L. Missing information reconstruction of remote sensing data: A technical review. IEEE Geosci. Remote Sens. Mag. 2015, 3, 61–85. [Google Scholar] [CrossRef]
- Shen, H.; Meng, X.; Zhang, L. An integrated framework for the spatio-temporal-spectral fusion of remote sensing images. IEEE Trans. Geosci. Remote Sens. 2016, 54, 7135–7148. [Google Scholar] [CrossRef]
- Wei, Y.; Yuan, Q.; Shen, H.; Zhang, L. Boosting the accuracy of multispectral image pansharpening by learning a deep residual network. IEEE Geosci. Remote Sens. Lett. 2017, 14, 1795–1799. [Google Scholar] [CrossRef] [Green Version]
- Vivone, G.; Alparone, L.; Chanussot, J.; Mura, M.D.; Garzelli, A.; Licciardi, G.A.; Restaino, R.; Wald, L. A critical comparison among pansharpening algorithms. IEEE Trans. Geosci. Remote Sens. 2015, 53, 2565–2586. [Google Scholar] [CrossRef]
- Turner, P.J.; Prata, A.J.; Howden, R.T.; Houghton, N.R.; Taylor, A. An ATSR-2 mosaic image of Australia. Int. J. Remote Sens. 2001, 22, 3889–3894. [Google Scholar] [CrossRef]
- Helmer, E.H.; Ruefenacht, B. Cloud-free satellite image mosaics with regression trees and histogram matching. Photogramm. Eng. Remote Sens. 2005, 71, 1079–1089. [Google Scholar] [CrossRef] [Green Version]
- Haas, J.; Ban, Y. Urban growth and environmental impacts in Jing-Jin-Ji, the Yangtze, River Delta and the Pearl River Delta. Int. J. Appl. Earth Obs. Geoinf. 2014, 30, 42–55. [Google Scholar] [CrossRef]
- Li, X.; Hui, N.; Shen, H.; Fu, Y.; Zhang, L. A robust mosaicking procedure for high spatial resolution remote sensing images. ISPRS J. Photogramm. Remote Sens. 2015, 109, 108–125. [Google Scholar] [CrossRef]
- Chon, J.; Kim, H.; Lin, C.-S. Seam-line determination for image mosaicking: A technique minimizing the maximum local mismatch and the global cost. ISPRS J. Photogramm. Remote Sens. 2010, 65, 86–92. [Google Scholar] [CrossRef]
- Wang, M.; Yuan, S.; Pan, J.; Fang, L.; Zhou, Q.; Yang, G. Seamline determination for high resolution orthoimage mosaicking using watershed segmentation. Photogramm. Eng. Remote Sens. 2016, 82, 121–133. [Google Scholar] [CrossRef]
- Shen, H.; Li, H.; Qian, Y.; Zhang, L.; Yuan, Q. An effective thin cloud removal procedure for visible remote sensing images. ISPRS J. Photogramm. Remote Sens. 2014, 96, 224–235. [Google Scholar] [CrossRef]
- Liang, S.; Fang, H.; Chen, M. Atmospheric correction of Landsat ETM+ land surface imagery. I. Methods. IEEE Trans. Geosci. Remote Sens. 2001, 39, 2490–2498. [Google Scholar] [CrossRef]
- Richter, R.; Schläpfer, D. Geo-atmospheric processing of airborne imaging spectrometry data. Part 2: Atmospheric/topographic correction. Int. J. Remote Sens. 2002, 23, 2631–2649. [Google Scholar] [CrossRef]
- Liu, J.; Wang, X.; Chen, M.; Liu, S.; Zhou, X.; Shao, Z.; Liu, P. Thin cloud removal from single satellite images. Opt. Express 2014, 22, 618–632. [Google Scholar] [CrossRef]
- He, K.; Sun, J.; Tang, X. Single image haze removal using dark channel prior. IEEE Trans. Pattern Anal. Mach. Intell. 2011, 33, 2341–2353. [Google Scholar] [CrossRef] [PubMed]
- Liu, Q.; Gao, X.; He, L.; Lu, W. Haze removal for a single visible remote sensing image. Signal Process. 2017, 137, 33–43. [Google Scholar] [CrossRef]
- Makarau, A.; Richter, R.; Müller, R.; Reinartz, P. Haze detection and removal in remotely sensed multispectral imagery. IEEE Trans. Geosci. Remote Sens. 2014, 52, 5895–5905. [Google Scholar] [CrossRef] [Green Version]
- Makarau, A.; Richter, R.; Schläpfer, D.; Reinartz, P. Combined haze and cirrus removal for multispectral imagery. IEEE Geosci. Remote Sens. Lett. 2016, 13, 379–383. [Google Scholar] [CrossRef]
- Chen, S.; Chen, X.; Chen, J.; Jia, P.; Cao, X.; Liu, C. An iterative haze optimized transformation for automatic cloud/haze detection of Landsat imagery. IEEE Trans. Geosci. Remote Sens. 2016, 54, 2682–2694. [Google Scholar] [CrossRef]
- Chen, S.; Chen, X.; Chen, X.; Chen, J.; Cao, X.; Shen, M.; Yang, W.; Cui, X. A novel cloud removal method based on IHOT and the cloud trajectories for Landsat imagery. Remote Sens. 2018, 10, 1040. [Google Scholar] [CrossRef] [Green Version]
- Shen, Y.; Wang, Y.; Lv, H.; Qian, J. Removal of thin clouds in Landsat-8 OLI data with independent component analysis. Remote Sens. 2015, 7, 11481–11500. [Google Scholar] [CrossRef] [Green Version]
- Zhang, Y.; Guindon, B.; Cihlar, J. An image transform to characterize and compensate for spatial variations in thin cloud contamination of Landsat images. Remote Sens. Environ. 2002, 82, 173–187. [Google Scholar] [CrossRef]
- Lv, H.; Wang, Y.; Shen, Y. An empirical and radiative transfer model based algorithm to remove thin clouds in visible bands. Remote Sens. Environ. 2016, 179, 183–195. [Google Scholar] [CrossRef]
- Braaten, J.D.; Cohen, W.B.; Yang, Z. Automated cloud and cloud shadow identification in Landsat MSS imagery for temperate ecosystems. Remote Sens. Environ. 2015, 169, 128–138. [Google Scholar] [CrossRef] [Green Version]
- Zhai, H.; Zhang, H.; Zhang, L.; Li, P. Cloud/shadow detection based on spectral indices for multi/hyperspectral optical remote sensing imagery. ISPRS J. Photogramm. Remote Sens. 2018, 144, 235–253. [Google Scholar] [CrossRef]
- Zhu, Z.; Woodcock, C.E. Object-based cloud and cloud shadow detection in Landsat imagery. Remote Sens. Environ. 2012, 118, 83–94. [Google Scholar] [CrossRef]
- Li, Z.; Shen, H.; Li, H.; Xia, G.; Gamba, P.; Zhang, L. Multi-feature combined cloud and cloud shadow detection in GaoFen-1 wide field of view imagery. Remote Sens. Environ. 2017, 191, 342–358. [Google Scholar] [CrossRef] [Green Version]
- Bai, T.; Li, D.; Sun, K.; Chen, Y.; Li, W. Cloud detection for high-resolution satellite imagery using machine learning and multi-feature fusion. Remote Sens. 2016, 8, 715. [Google Scholar] [CrossRef] [Green Version]
- Li, Z.; Shen, H.; Cheng, Q.; Liu, Y.; You, S.; He, Z. Deep learning based cloud detection for medium and high resolution remote sensing images of different sensors. ISPRS J. Photogramm. Remote Sens. 2019, 150, 197–212. [Google Scholar] [CrossRef] [Green Version]
- Li, X.; Shen, H.; Zhang, L.; Zhang, H.; Yuan, Q.; Yang, G. Recovering quantitative remote sensing products contaminated by thick clouds and shadows using multitemporal dictionary learning. IEEE Trans. Geosci. Remote Sens. 2014, 52, 7086–7098. [Google Scholar] [CrossRef]
- Chen, B.; Huang, B.; Chen, L.; Xu, B. Spatially and temporally weighted regression: A novel method to produce continuous cloud-free Landsat imagery. IEEE Trans. Geosci. Remote Sens. 2017, 55, 27–37. [Google Scholar] [CrossRef]
- Padhee, S.K.; Dutta, S. Spatio-temporal reconstruction of MODIS NDVI by regional land surface phenology and harmonic analysis of time-series. GISci. Remote Sens. 2019, 56, 1261–1288. [Google Scholar] [CrossRef]
- Cheng, Q.; Shen, H.; Zhang, L.; Yuan, Q.; Zeng, C. Cloud removal for remotely sensed images by similar pixel replacement guided with a spatio-temporal MRF model. ISPRS J. Photogramm. Remote Sens. 2014, 92, 54–68. [Google Scholar] [CrossRef]
- Lin, C.; Tsai, P.; Lai, K.; Chen, J. Cloud removal from multitemporal satellite images using information cloning. IEEE Trans. Geosci. Remote Sens. 2013, 51, 232–241. [Google Scholar] [CrossRef]
- Li, Z.; Shen, H.; Cheng, Q.; Li, W.; Zhang, L. Thick cloud removal in high-resolution satellite images using stepwise radiometric adjustment and residual correction. Remote Sens. 2019, 11, 1925. [Google Scholar] [CrossRef] [Green Version]
- Aiazzi, B.; Baronti, S.; Selva, M. Improving component substitution pansharpening through multivariate regression of MS+Pan data. IEEE Trans. Geosci. Remote Sens. 2007, 45, 3230–3239. [Google Scholar] [CrossRef]
- Xu, Q.; Li, B.; Zhang, Y.; Ding, L. High-fidelity component substitution pansharpening by the fitting of substitution data. IEEE Trans. Geosci. Remote Sens. 2014, 52, 7380–7392. [Google Scholar] [CrossRef]
- Meng, X.; Li, J.; Shen, H.; Zhang, L.; Zhang, H. Pansharpening with a guided filter based on three-layer decomposition. Sensors 2016, 16, 1068. [Google Scholar] [CrossRef]
- Shahdoosti, H.R.; Javaheri, N. Pansharpening of Clustered MS and pan images considering mixed pixels. IEEE Geosci. Remote Sens. Lett. 2017, 14, 826–830. [Google Scholar] [CrossRef]
- Wald, L.; Ranchin, T. Liu ‘Smoothing filter-based intensity modulation: A spectral preserve image fusion technique for improving spatial details’. Int. J. Remote Sens. 2002, 23, 593–597. [Google Scholar] [CrossRef]
- Aiazzi, B.; Alparone, L.; Baronti, S.; Garzelli, A.; Selva, M. MTF-tailored multiscale fusion of high-resolution MS and pan imagery. Photogramm. Eng. Remote Sens. 2006, 72, 591–596. [Google Scholar] [CrossRef]
- Zhang, L.; Shen, H.; Gong, W.; Zhang, H. Adjustable model-based fusion method for multispectral and panchromatic images. IEEE Trans. Syst. Man Cybern. Part B (Cybern.) 2012, 42, 1693–1704. [Google Scholar] [CrossRef]
- Liu, P.; Xiao, L.; Zhang, J.; Naz, B. Spatial-Hessian-feature-guided variational model for pan-sharpening. IEEE Trans. Geosci. Remote Sens. 2016, 54, 2235–2253. [Google Scholar] [CrossRef]
- Jiang, C.; Zhang, H.; Shen, H.; Zhang, L. Two-step sparse coding for the pan-sharpening of remote sensing images. IEEE J. Sel. Top. Appl. Earth Obs. Remote Sens. 2014, 7, 1792–1805. [Google Scholar] [CrossRef]
- Masi, G.; Cozzolino, D.; Verdoliva, L.; Scarpa, G. Pansharpening by convolutional neural networks. Remote Sens. 2016, 8, 594. [Google Scholar] [CrossRef] [Green Version]
- Yuan, Q.; Wei, Y.; Meng, X.; Shen, H.; Zhang, L. A Multiscale and multidepth convolutional neural network for remote sensing imagery pan-sharpening. IEEE J. Sel. Top. Appl. Earth Obs. Remote Sens. 2018, 11, 978–989. [Google Scholar] [CrossRef] [Green Version]
- Brown, M.; Lowe, D.G. Automatic panoramic image stitching using invariant features. Int. J. Comput. Vis. 2007, 74, 59–73. [Google Scholar] [CrossRef] [Green Version]
- Feng, R.; Du, Q.; Li, X.; Shen, H. Robust registration for remote sensing images by combining and localizing feature- and area-based methods. ISPRS J. Photogramm. Remote Sens. 2019, 151, 15–26. [Google Scholar] [CrossRef]
- Li, X.; Feng, R.; Guan, X.; Shen, H.; Zhang, L. Remote sensing image mosaicking: Achievements and challenges. IEEE Geosci. Remote Sens. Mag. 2019, 7, 8–22. [Google Scholar] [CrossRef]
- Wong, A.; Clausi, D.A. ARRSI: Automatic registration of remote-sensing images. IEEE Trans. Geosci. Remote Sens. 2007, 45, 1483–1493. [Google Scholar] [CrossRef]
- Cole-Rhodes, A.A.; Johnson, K.L.; LeMoigne, J.; Zavorin, I. Multiresolution registration of remote sensing imagery by optimization of mutual information using a stochastic gradient. IEEE Trans. Image Process. 2003, 12, 1495–1511. [Google Scholar] [CrossRef]
- Hel-Or, Y.; Hel-Or, H.; David, E. Fast template matching in non-linear tone-mapped images. In Proceedings of the International Conference on Computer Vision (ICCV), Barcelona, Spain, 6–13 November 2011; pp. 1355–1362. [Google Scholar]
- Lowe, D.G. Distinctive image features from scale-invariant keypoints. Int. J. Comput. Vis. 2004, 60, 91–110. [Google Scholar] [CrossRef]
- Bay, H.; Tuytelaars, T.; Van Gool, L. SURF: Speeded up robust features. In Proceedings of the Computer Vision—ECCV 2006 9th European Conference on Computer Vision, Graz, Austria, 7–13 May 2006; pp. 404–417. [Google Scholar]
- Xie, R.; Xia, M.; Yao, J.; Li, L. Guided color consistency optimization for image mosaicking. ISPRS J. Photogramm. Remote Sens. 2018, 135, 43–59. [Google Scholar] [CrossRef]
- Yu, L.; Zhang, Y.; Sun, M.; Zhou, X.; Liu, C. An auto-adapting global-to-local color balancing method for optical imagery mosaic. ISPRS J. Photogramm. Remote Sens. 2017, 132, 1–19. [Google Scholar] [CrossRef]
- Oliveira, M.; Sappa, A.D.; Santos, V. A probabilistic approach for color correction in image mosaicking applications. IEEE Trans. Image Process. 2015, 24, 508–523. [Google Scholar] [CrossRef] [PubMed]
- Chen, C.; Chen, Z.; Li, M.; Liu, Y.; Cheng, L.; Ren, Y. Parallel relative radiometric normalisation for remote sensing image mosaics. Comput. Geosci. 2014, 73, 28–36. [Google Scholar] [CrossRef]
- Storey, E.A.; Stow, D.A.; Plummer, M.J. Normalizing shadows in multi-temporal aerial frame imagery using relative radiometric adjustments to support near-real-time change detection. GISci. Remote Sens. 2019, 56, 22–42. [Google Scholar] [CrossRef]
- Li, L.; Yao, J.; Lu, X.; Tu, J.; Shan, J. Optimal seamline detection for multiple image mosaicking via graph cuts. ISPRS J. Photogramm. Remote Sens. 2016, 113, 1–16. [Google Scholar] [CrossRef]
- Chen, G.; Chen, S.; Li, X.; Zhou, P.; Zhou, Z. Optimal seamline detection for orthoimage mosaicking based on DSM and improved JPS algorithm. Remote Sens. 2018, 10, 821. [Google Scholar] [CrossRef] [Green Version]
- Pan, J.; Zhou, Q.; Wang, M. Seamline determination based on segmentation for urban image mosaicking. IEEE Geosci. Remote Sens. Lett. 2014, 11, 1335–1339. [Google Scholar] [CrossRef]
- Nguyen, T.L.; Byun, Y.; Han, D.; Huh, J. Efficient seamline determination for UAV image mosaicking using edge detection. Remote Sens. Lett. 2018, 9, 763–769. [Google Scholar] [CrossRef]
- Du, Q.; Raksuntorn, N.; Orduyilmaz, A.; Bruce, L.M. Automatic registration and mosaicking for airborne multispectral image sequences. Photogramm. Eng. Remote Sens. 2008, 74, 169–181. [Google Scholar] [CrossRef]
- Merson, R.H. An AVHRR mosaic image of Antarctica. Int. J. Remote Sens. 1989, 10, 669–674. [Google Scholar] [CrossRef]
- Roy, D.P.; Ju, J.; Kline, K.; Scaramuzza, P.L.; Kovalskyy, V.; Hansen, M.; Loveland, T.R.; Vermote, E.; Zhang, C. Web-enabled Landsat data (WELD): Landsat ETM+ composited mosaics of the conterminous United States. Remote Sens. Environ. 2010, 114, 35–49. [Google Scholar] [CrossRef]
- Fraser, A.D.; Massom, R.A.; Michael, K.J. A method for compositing polar MODIS satellite images to remove cloud cover for Landfast sea-ice detection. IEEE Trans. Geosci. Remote Sens. 2009, 47, 3272–3282. [Google Scholar] [CrossRef]
- Fraser, A.D.; Massom, R.A.; Michael, K.J. Generation of high-resolution East Antarctic landfast sea-ice maps from cloud-free MODIS satellite composite imagery. Remote Sens. Environ. 2010, 114, 2888–2896. [Google Scholar] [CrossRef]
- Hewson, R.D.; Cudahy, T.J.; Mizuhiko, S.; Ueda, K.; Mauger, A.J. Seamless geological map generation using ASTER in the Broken Hill-Curnamona province of Australia. Remote Sens. Environ. 2005, 99, 159–172. [Google Scholar] [CrossRef]
- Zhang, Y.; Wan, Y.; Wang, B.; Kang, Y.; Xiong, J. Automatic processing of Chinese GF-1 wide field of view images. Int. Arch. Photogramm. Remote Sens. Spat. Inf. Sci. 2015, XL-7/W3, 729–734. [Google Scholar] [CrossRef] [Green Version]
- Li, M.; Liew, S.C.; Kwoh, L.K. Producing cloud free and cloud-shadow free mosaic from cloudy IKONOS images. In Proceedings of the International Geoscience and Remote Sensing Symposium (IGARSS), Toulouse, France, 21–25 July 2003. [Google Scholar] [CrossRef]
- Du, Y.; Cihlar, J.; Beaubien, J.; Latifovic, R. Radiometric normalization, compositing, and quality control for satellite high resolution image mosaics over large areas. IEEE Trans. Geosci. Remote Sens. 2001, 39, 623–634. [Google Scholar] [CrossRef]
- Scheidt, S.; Ramsey, M.; Lancaster, N. Radiometric normalization and image mosaic generation of ASTER thermal infrared data: An application to extensive sand sheets and dune fields. Remote Sens. Environ. 2008, 112, 920–933. [Google Scholar] [CrossRef]
- Jiang, H.; Lu, N.; Yao, L.; Zhang, X. Single image dehazing for visible remote sensing based on tagged haze thickness maps. Remote Sens. Lett. 2018, 9, 627–635. [Google Scholar] [CrossRef]
- Narasimhan, S.G.; Nayar, S.K. Vision and the atmosphere. Int. J. Comput. Vis. 2002, 48, 233–254. [Google Scholar] [CrossRef]
- Narasimhan, S.G.; Nayar, S.K. Contrast restoration of weather degraded images. IEEE Trans. Pattern Anal. Mach. Intell. 2003, 25, 713–724. [Google Scholar] [CrossRef] [Green Version]
- Meng, X.; Shen, H.; Li, H.; Zhang, L.; Fu, R. Review of the pansharpening methods for remote sensing images based on the idea of meta-analysis: Practical discussion and challenges. Inf. Fusion 2019, 46, 102–113. [Google Scholar] [CrossRef]
- Xie, F.Y.; Chen, J.J.; Pan, X.X.; Jiang, Z.G. Adaptive haze removal for single remote sensing image. IEEE Access 2018, 6, 67982–67991. [Google Scholar] [CrossRef]
- Scaramuzza, P.; Barsi, J. Landsat 7 scan line corrector-off gap-filled product development. In Proceedings of the Pecora 16 Conference on Global Priorities in Land Remote Sensing, Sioux Falls, SD, USA, 23–27 October 2005; pp. 23–27. [Google Scholar]
- Zhu, X.; Gao, F.; Liu, D.; Chen, J. A modified neighborhood similar pixel interpolator approach for removing thick clouds in Landsat images. IEEE Geosci. Remote Sens. Lett. 2011, 9, 521–525. [Google Scholar] [CrossRef]


| Image Type | No. | Image ID | Centre Location | Date | Cloud Coverage * |
|---|---|---|---|---|---|
| Target | T1 | TRIPLESAT_2_PMS_0010DDVI_007 | E108.3_N22.8 | 9 October 2017 | 4.8% |
| T2 | TRIPLESAT_2_PMS_0010DDVI_008 | E108.2_N33.0 | 9 October 2017 | 0.3% | |
| T3 | TRIPLESAT_3_PMS_001397VI_006 | E108.5_N22.7 | 2 December 2017 | 0.1% | |
| T4 | TRIPLESAT_3_PMS_001397VI_007 | E108.5_N22.9 | 2 December 2017 | 0.3% | |
| T5 | TRIPLESAT_3_PMS_0013D6VI_007 | E108.3_N22.7 | 17 December 2017 | Clear | |
| Auxiliary | A1 | TRIPLESAT_1_PMS_000F58VI_002 | E108.5_N22.9 | 27 May 2017 | Clear |
| A2 | GF2_PMS1_0001881842 | E108.3_N22.8 | 11 October 2016 | 1.0% |
| Method | CC (↑) | RMSE (↓) | UIQI (↑) | SSIM (↑) | |
|---|---|---|---|---|---|
| Exp. 1 in Figure 17 | LLHM | 0.747 | 0.045 | 0.735 | 0.820 |
| MNSPI | 0.816 | 0.032 | 0.809 | 0.823 | |
| SLMM | 0.835 | 0.031 | 0.833 | 0.850 | |
| Exp. 2 in Figure 17 | LLHM | 0.818 | 0.026 | 0.814 | 0.863 |
| MNSPI | 0.860 | 0.020 | 0.847 | 0.879 | |
| SLMM | 0.886 | 0.019 | 0.886 | 0.890 |
© 2019 by the authors. Licensee MDPI, Basel, Switzerland. This article is an open access article distributed under the terms and conditions of the Creative Commons Attribution (CC BY) license (http://creativecommons.org/licenses/by/4.0/).
Share and Cite
Li, X.; Li, Z.; Feng, R.; Luo, S.; Zhang, C.; Jiang, M.; Shen, H. Generating High-Quality and High-Resolution Seamless Satellite Imagery for Large-Scale Urban Regions. Remote Sens. 2020, 12, 81. https://0-doi-org.brum.beds.ac.uk/10.3390/rs12010081
Li X, Li Z, Feng R, Luo S, Zhang C, Jiang M, Shen H. Generating High-Quality and High-Resolution Seamless Satellite Imagery for Large-Scale Urban Regions. Remote Sensing. 2020; 12(1):81. https://0-doi-org.brum.beds.ac.uk/10.3390/rs12010081
Chicago/Turabian StyleLi, Xinghua, Zhiwei Li, Ruitao Feng, Shuang Luo, Chi Zhang, Menghui Jiang, and Huanfeng Shen. 2020. "Generating High-Quality and High-Resolution Seamless Satellite Imagery for Large-Scale Urban Regions" Remote Sensing 12, no. 1: 81. https://0-doi-org.brum.beds.ac.uk/10.3390/rs12010081