A Deep Hashing Technique for Remote Sensing Image-Sound Retrieval


1
Key Laboratory of Spectral Imaging Technology CAS, Xi’an Institute of Optics and Precision Mechanics, Chinese Academy of Sciences, Xi’an 710119, China
2
University of Chinese Academy of Sciences, Beijing 100049, China
*
Author to whom correspondence should be addressed.
Remote Sens. 2020, 12(1), 84; https://0-doi-org.brum.beds.ac.uk/10.3390/rs12010084
Submission received: 30 October 2019
/
Revised: 16 December 2019
/
Accepted: 18 December 2019
/
Published: 25 December 2019
(This article belongs to the Special Issue Content-Based Remote Sensing Image Retrieval)
Abstract
:With the rapid progress of remote sensing (RS) observation technologies, cross-modal RS image-sound retrieval has attracted some attention in recent years. However, these methods perform cross-modal image-sound retrieval by leveraging high-dimensional real-valued features, which can require more storage than low-dimensional binary features (i.e., hash codes). Moreover, these methods cannot directly encode relative semantic similarity relationships. To tackle these issues, we propose a new, deep, cross-modal RS image-sound hashing approach, called deep triplet-based hashing (DTBH), to integrate hash code learning and relative semantic similarity relationship learning into an end-to-end network. Specially, the proposed DTBH method designs a triplet selection strategy to select effective triplets. Moreover, in order to encode relative semantic similarity relationships, we propose the objective function, which makes sure that that the anchor images are more similar to the positive sounds than the negative sounds. In addition, a triplet regularized loss term leverages approximate l1-norm of hash-like codes and hash codes and can effectively reduce the information loss between hash-like codes and hash codes. Extensive experimental results showed that the DTBH method could achieve a superior performance to other state-of-the-art cross-modal image-sound retrieval methods. For a sound query RS image task, the proposed approach achieved a mean average precision (mAP) of up to 60.13% on the UCM dataset, 87.49% on the Sydney dataset, and 22.72% on the RSICD dataset. For RS image query sound task, the proposed approach achieved a mAP of 64.27% on the UCM dataset, 92.45% on the Sydney dataset, and 23.46% on the RSICD dataset. Future work will focus on how to consider the balance property of hash codes to improve image-sound retrieval performance.
1. Introduction
With the development of remote sensing (RS) observation technologies, the amount of RS data is increasing rapidly [1,2]. Nowadays, RS data retrieval has attracted wide attention in the RS research field [3,4]. It can retrieve useful information in large scale RS data and has wide application prospects in disaster rescue scenarios [5,6]. Generally speaking, RS data retrieval can be roughly divided into uni-modal RS retrieval methods and cross-modal RS retrieval methods. Uni-modal RS retrieval methods [7,8,9,10,11,12,13] aim to search the RS data with a similar concept to queried RS data where all RS data come from the same modality. For example, Ye et al. [13] developed a flexible multiple-feature hashing learning framework, which maps multiple features of the RS image to the low-dimensional binary feature. Demir et al. [4] developed a hashing-based search approach to perform RS image retrieval in large RS data archives. Li et al. [5] presented a novel partial randomness strategy for hash codes learning in large-scale RS image retrieval. Cross-modal RS retrieval methods [14] aim to search the RS data with a similar concept to queried RS data, where queried RS data and the RS data of the searching dataset belong to different modalities. Compared with uni-modal RS retrieval, cross-modal RS retrieval is full of challenges and difficulties due to the heterogeneity gap of cross-modal samples. On the other hand, the research of cross-modal retrieval mainly focuses on image-text research [2,15,16,17] and image-sound research [18,19,20,21,22,23]. Nevertheless, only a few cross-modal RS retrieval methods have been studied in recent years. For example, Li et al. [24] introduced a cross-source large-scale remote sensing image retrieval approach, which leverages deep hashing convolutional neural networks to perform image retrieval. Guo et al. [14] proposed a novel cross-modal RS image-voice retrieval approach, which integrates deep feature learning and multi-modal learning into a unified framework for speech-to-image retrieval.
Among cross-modal RS retrieval, cross-modal RS image-sound retrieval has attracted more and more attention in recent years. The goal of cross-modal RS image-sound retrieval is to leverage RS images (respectively, RS sounds) to retrieve relevant RS sounds (respectively, RS images). For example, Zhang et al. [18] proposes a correlation-based similarity reinforcement approach for images and sounds. Song et al. [20] leverages kernel canonical correlation analysis (KCCA) and multi-view hidden conditional random fields (MV-HCRF) to learn nonlinear projections.However, these methods learn the relationship between sounds and images by using shallow projects, which cannot capture complex semantic information of sounds and images [24]. To tackle this issue, some deep image-voice retrieval methods [14,25] are proposed to utilize deep neural networks to capture complex semantic information of sounds and images. Nevertheless, there are several challenges for existing image-sound retrieval methods. Figure 1 shows the difference between existing image-sound retrieval methods and the proposed DTBH approach. First, these methods perform cross-modal image-sound retrieval by leveraging high-dimensional, real-valued features, which cost more storage than low-dimensional binary features (i.e., hash codes). Second, these methods learn the relationship between sounds and images by using pairwise labels, which capture the intra-class variations and inter-class variations, respectively, and cannot directly encode relative semantic similarity relationships.
In fact, queried RS images (respectively, sounds) are better matched with relevant RS sounds (respectively, RS images) if more relative similarity relationships of RS images (respectively, sounds) are understood by humans [26]. Clearly, the above issues can be tackled if we teach relative semantic similarity relationships and low-dimensional binary features simultaneously. Inspired by this idea, a deep cross-modal RS triplet-based hashing method was developed to perform relative semantic similarity relationship learning and hash codes learning simultaneously for an image–sound retrieval application.
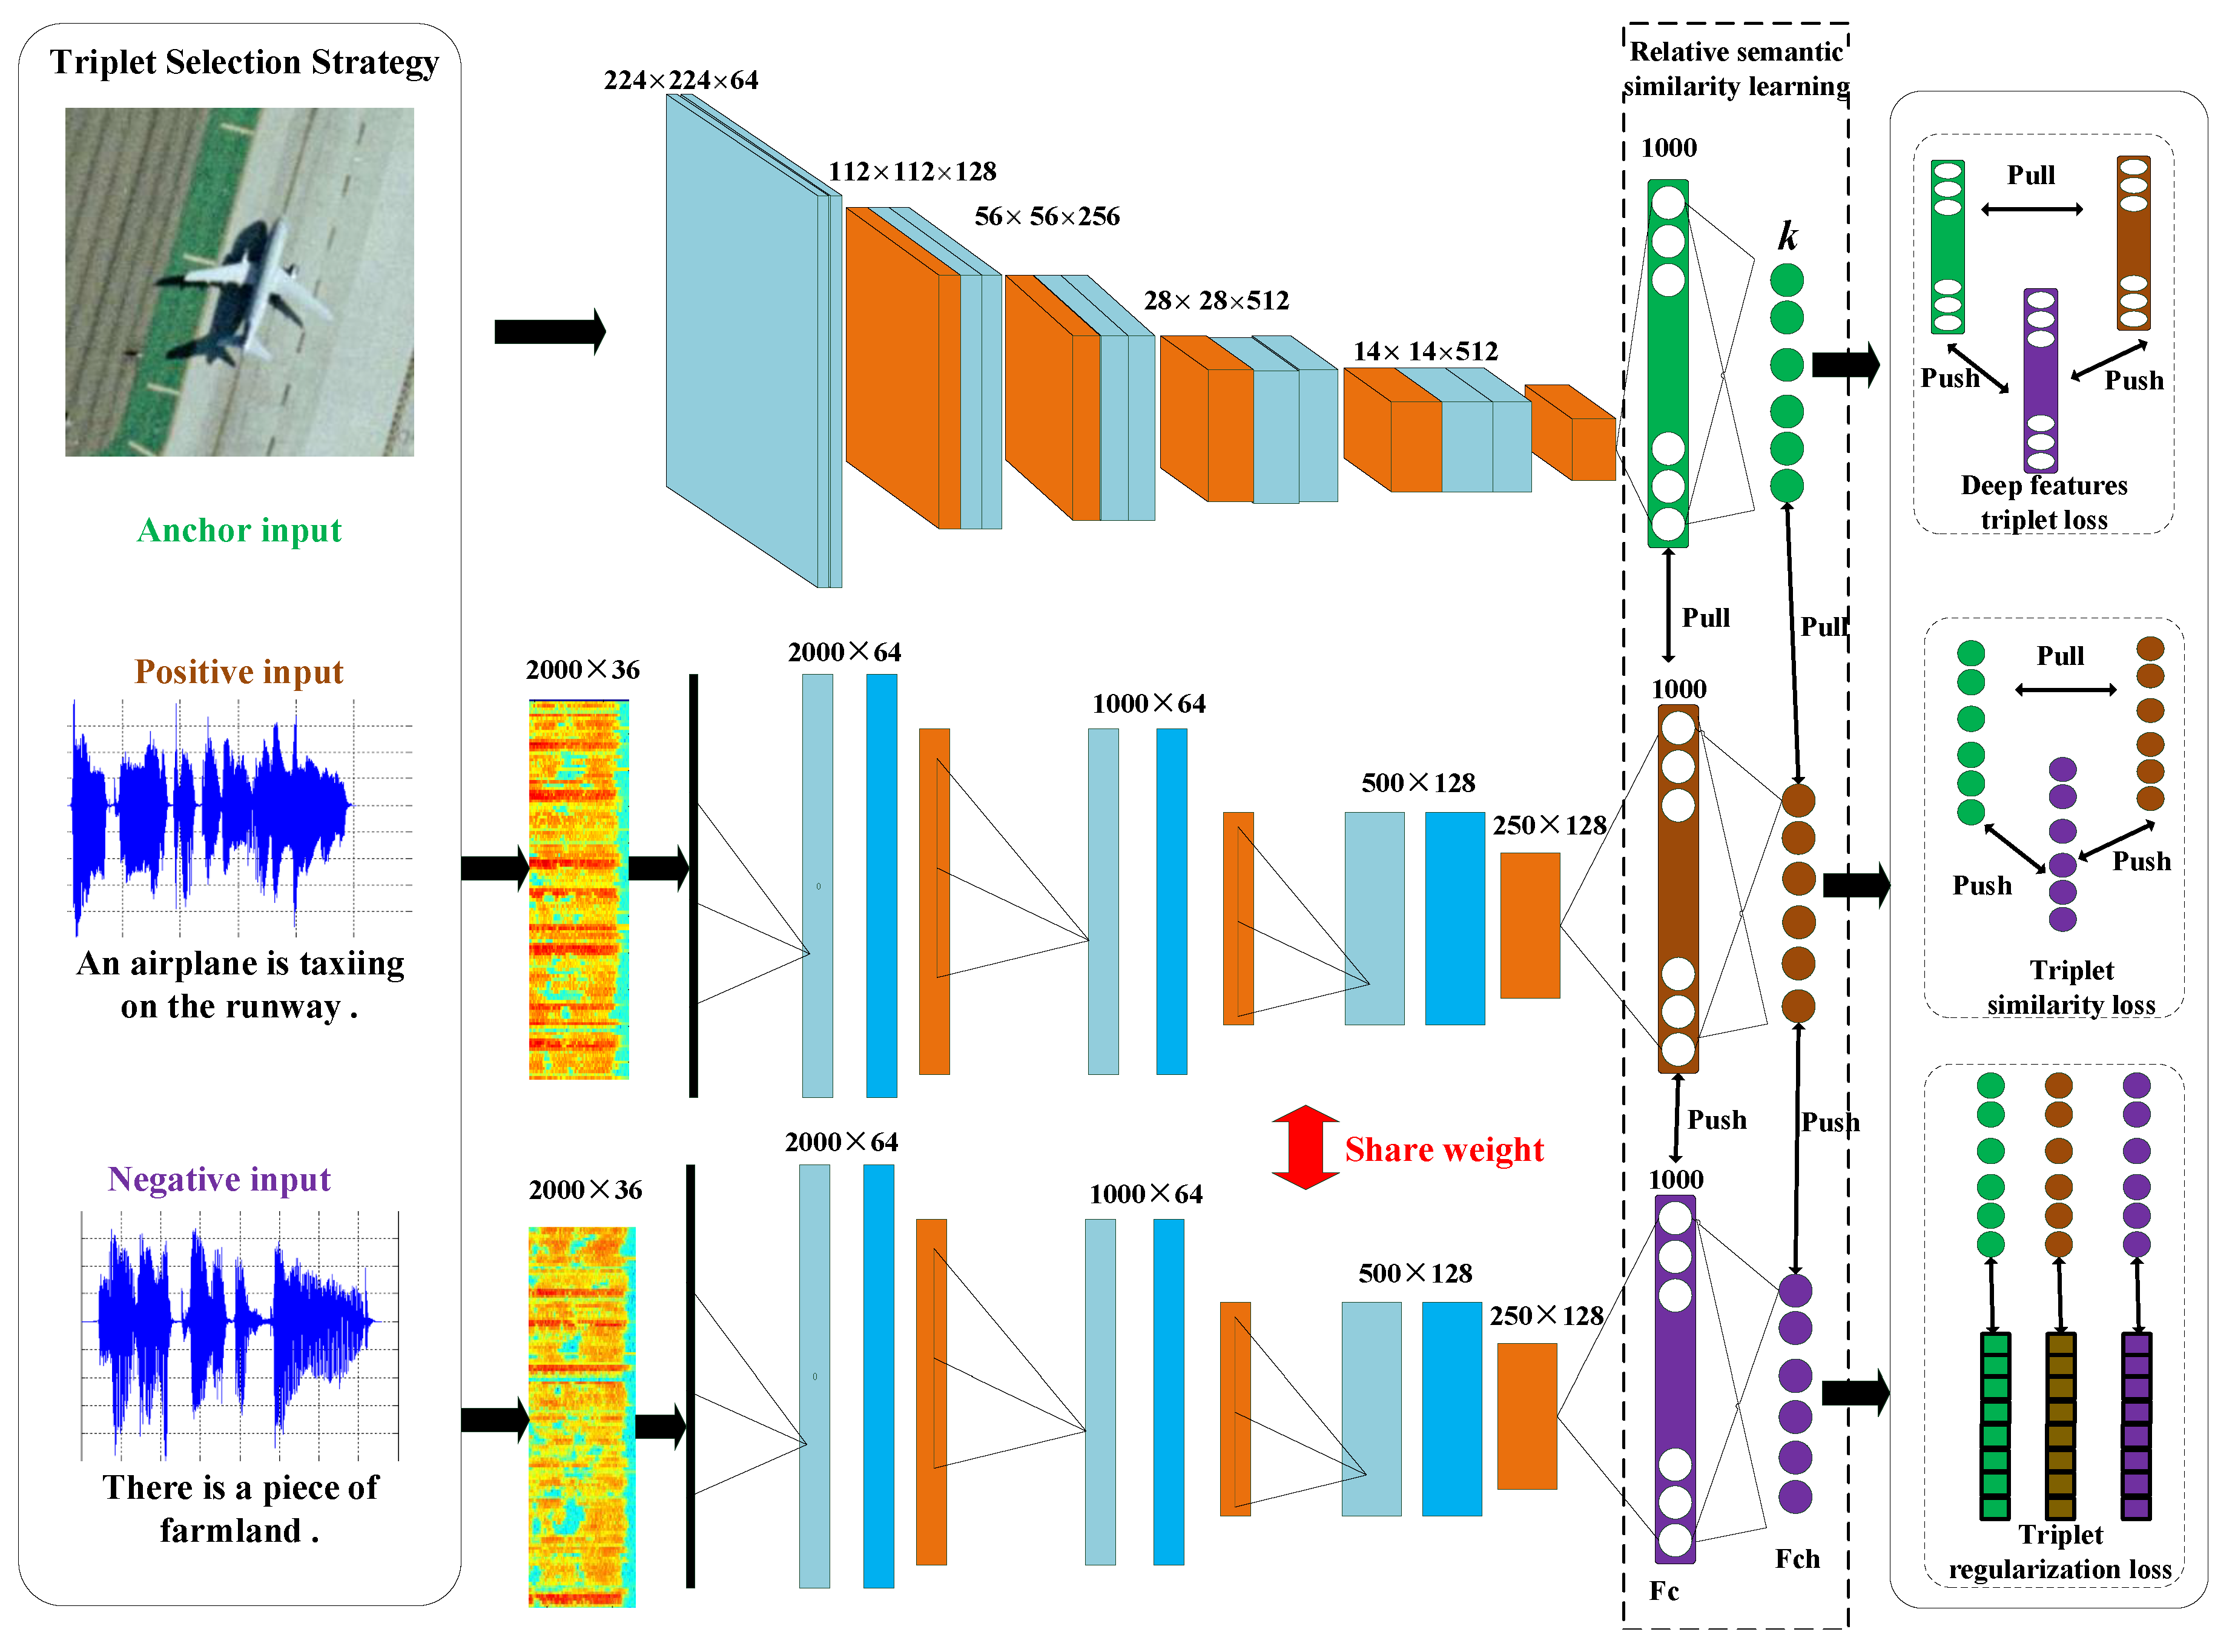
In this paper, we propose a new deep cross-modal RS image-sound hashing approach, called deep triplet-based hashing (DTBH), to integrate hash code learning and relative semantic similarity relationship learning into an end-to-end network, as shown in Figure 2. The whole framework contains the RS image branch, the positive RS sound branch, and the negative RS sound branch. To reduce storage costs, our proposed method exploits deep nonlinear mapping to project RS images and sounds into the common Hamming space. Then, we implement cross-modal image-sound retrieval by using hash codes, which speeds up low storage. To learn relative semantic similarity relationships, we utilize triplet labels to supervise hash code learning. Compared with pairwise labels, triplet labels can capture higher-level similarities in various situations, rather than only the similar/dissimilar situations, as in the circumstance of pairs. Furthermore, a triplet selection strategy was also designed to capture the intra-class and inter-class variations, which is helpful for learning hash codes. In addition, we designed a new objective function, which consists of the triplet similarity loss function, the triplet regularized loss function, and deep feature triplet loss function. The deep feature triplet loss function ensures that the anchor deep features are more similar to the positive deep features than to the negative deep features. The triplet regularized loss function makes hash-like codes more and more similar to hash codes by reducing the information loss. Extensive experimental results show that DTBH method can achieve superior performance to other cross-modal image-sound retrieval methods.
The contributions can be summarized in the following four aspects:
- A new deep cross-modal triplet-based hashing framework is proposed to leverage triplet similarity of deep features and triplet labels to tackle the issue of insufficient utilization of relative semantic similarity relationships for RS image-sound similarity learning. To the best of our knowledge, it is the first work to use hash codes to perform cross-modal RS image-sound retrieval.
- A new triplet selection strategy was developed to select effective triplets, which is helpful for capturing the intra-class and inter-class variations for hash codes learning.
- The objective function was designed to learn deep features’ similarities and reduce the information loss between hash-like codes and hash codes.
- Extensive experimental results of three RS image-sound datasets showed that the proposed DTBH method can achieve superior performance to other state-of-the-art cross-modal image-sound retrieval methods.
2. The Proposed Method
In this part, Section 2.1 clarifies the problem definition. The details of multimodal architecture are presented in Section 2.2. Section 2.3 introduces the triplet selection strategy. Section 2.4 elucidates the objective function of the proposed DTBH method.
2.1. Problem Definition
Let be M triplet units. denotes the set of the RS anchor images; denotes the set of the RS positive sounds; and denotes the set of the RS negative sounds, where denotes that the RS anchor image is more similar to the RS positive sound than the RS negative sound . , and contains similar concepts. And and contain dissimilar concepts. The aim of the proposed DTBH method is to learn a hash function that can project samples into hash codes while maintaining the similarity of matched RS images and sounds. More specially, need be smaller than , where denotes the Hamming distance [27]. The definitions of some symbols are shown in Table 1.
2.2. Multimodal Architecture
The proposed deep triplet-based hashing approach for RS cross-modal image-sound retrieval is shown in Figure 2. The whole approach consists of RS image modality and RS sound modality.
RS Image Modality: The configuration of the RS image modality is demonstrated in Figure 2. We leverage the convolution architecture of VGG16 [14] as the convolution architecture of the RS image branch. Then, the following layers of the RS image modality consist of two fully connected layers. The first fully connected layer is deep features layer, which consists of 1000 units and utilizes a sigmoid function as the activation function [28,29,30]. The second fully connected layer is a hash layer, which consists of K units and leverages tanh function as the activation function [31]. The second fully connected layer can generate K-bits hash-like codes, which can be utilized to produce K-bits hash codes by the quantization function [32]. Then hash codes of the RS anchor image can be given by
where denotes the element-wise sign function; i.e., if ; otherwise, . represents K-bits hash codes. represents K-bits hash-like codes, which are the outputs of the hash layer. represents the tanh function. represents deep features, which are the outputs of the deep features layer. represents the weights of the second fully connected layer.
RS Sound Modality: Similar to [33,34], Mel-frequency cepstral coefficients (MFCC) are utilized to delegate the RS voices, because MFCC uses cepstrum feature extraction [35,36], which is more in line with the principle of human hearing. So it is the most common and effective voice feature extraction algorithm [37,38]. We use a sixteen millisecond window size with five millisecond shift to compute MFCC. Furthermore, the size of MFCC is compulsively extracted as the length g, truncated more than the length g, and padded zero less than the length g. The configuration of the RS sound modality is demonstrated in Figure 2. The RS sound modality contains two identical subnetworks. And the convolution architecture of the subnetwork shares weight parameters. The first convolution layer of the subnetwork utilizes the filters with the width of one frame across the whole frequency axis. Then, the following layer of the subnetwork contains three 1D convolutions with max-pooling. The filters of three convolutions exploit 32, 32, and 64, respectively. The respective widths of three convolutions use 11, 17, and 19, respectively. All max-pooling operations utilize two strides. The last two layers of the subnetwork consist of two fully connected layers, which do not share weight parameters. The first fully connected layer is the deep features layer, which consists of 1000 units and utilizes the sigmoid function as the activation function. The second fully connected layer is hash layer, which consists of K units and leverages the tanh function as the activation function. The second fully connected layer can generate K-bits hash-like codes, which can be utilized to produce K-bits hash codes by the quantization function. For the RS positive sound, hash codes of the RS positive sound can be given by
where represents k-bits hash codes of the RS positive sound . represents k-bits hash-like codes, which is the output of the hash layer. represents deep features, which is the output of the deep features layer for the RS positive sound as input. represents the weights of the second fully connected layer for the RS positive sound as input. For the RS negative sound, hash codes of the RS positive sound can be given by
where represents K-bits hash codes of the RS positive sound . represents K-bits hash-like codes, which is the output of the hash layer. represents deep features, which is the output of the deep features layer for the RS negative sound as input. represents the weights of the second fully connected layer for the RS negative sound as input.
2.3. Triplet Selection Strategy
Previous cross-modal RS retrieval approaches [14,39] did not consider the construction of samples. And these approaches cannot achieve superior cross-modal retrieval performance. To improve cross-modal retrieval performance, we designed a novel triplet selection strategy that randomly selects one hard negative sound for positive image-sound pair in a negative sound set. The triplet selection strategy can be formulated as
where represents the RS anchor images; represents the RS positive sounds. represents the random function, which randomly choose one negative sound from the hard negative sounds set . and represents the -norm vector and the margin parameter, respectively. represents deep features for the image . represents deep features for the positive sound . represents deep features for the negative sound . Triplet selection strategy is helpful to grasping the relative relationship between samples and contributes to learning effective hash codes.
2.4. Objective Function
Compared with cross-modal retrieval approaches using pairwise loss [14,39], the proposed DTBH method leverages the triple loss to learn the relative similarity relationship between RS images and sounds, because the relative similarity relationship established by the triple loss can be more reasonable than the absolute similarity relationship exploited by the pairwise loss. The pairwise loss captures the intra-class variations and inter-class variations, respectively. But the triple loss can capture the intra-class variations and inter-class variations simultaneously. The goal of the proposed DTBH method is to learn a hash function that can project samples into hash codes while maintaining the similarity of matched RS images and sounds. For this goal, the anchor image and the positive sound are as close as possible, while the anchor image and the negative sound are as far apart as possible. Inspired by [40], the triplet similarity loss function can be defined as
where represents the triplet similarity loss, which ensures that the anchor images are more similar to the positive sounds than the negative sounds. represents the Hamming distance; represents the hash code of the anchor image . represents the hash code of the negative sound . represents the hash code of the positive image . represents the margin parameter. represents the maximum function.
Directly optimizing Equation (5), it is difficult to calculate derivatives in network training process. To solve this problem, the new relaxation strategy is adopted to replace the Hamming distance of discrete hash codes with -norm of hash-like codes [41]. Then, the triplet similarity loss function is redefined as
where represents the margin parameter. represents the -norm vector. And represents the hash-like code of the anchor image , which is defined as , where represents the tanh function. represents deep features, which are the outputs of the deep features layer. represents the weights of the second fully connected layer for the anchor image . And represents the hash-like code of the anchor image , which is defined as , where represents deep features for the positive sound . represents the weights of the second fully connected layer for the positive sound . And represents the hash-like code of the positive sound , which is defined as , where represents deep features for the negative sound . represents the weights of the second fully connected layer for the negative sound .
Nevertheless, the new relaxation strategy above will lead to the information loss between hash-like codes and hash codes. It is necessary to design a regularized term between hash-like codes and hash codes to reduce the information loss. Motivated by iterative quantization (ITQ) [42], a new triplet regularized loss was developed to reduce the information loss. The triplet regularized loss is given as
where represents the triplet regularized loss, which makes hash-like codes more and more similar to hash codes by reducing the information loss. represents -norm vector.
The above Equation (7) utilizes -norm to reduce the information loss. Compared with -norm, -norm requires less computation and encourages sparsity for hash code learning [43,44]. Then, Equation (7) can be reformulated as
where represents the -norm vector. Furthermore, reveals that the minimization of -norm between hash-like codes and hash codes is the upper bound of the -norm between hash-like codes and hash codes. The detailed proof of is presented below.
Proof.
The binary codes , , and are relaxed into continuous real values , , and , respectively. Hence, and contain the same sign, and contain the same sign, , and contains the same sign. The relationship between and can be given as
The relationship between and can be given as
and the relationship between and can be given as
However, makes it difficult to calculate derivatives for the network architecture of the DTBH approach. Inspired by [45], the smooth surrogate of the absolute function is exploited in the network architecture of the DTBH approach. Equation (8) can be written as
where denotes the k-th position of hash codes for RS image ; denotes the k-th position of hash-like codes for RS image . K represents the length of hash codes. represents the absolute value operation. and represent the k-th position of and the k-th position of for RS negative sound , respectively. and represents the k-th position of and the k-th position of for RS positive sound , respectively.
To further enhance the relationship between hash codes of RS images and hash codes of RS sounds, the similarity of deep features is taught in the network architecture of the DTBH approach, because the similarity of deep features will promote the learning of similarity relations between RS images and RS sounds. Then, deep features’ triplet loss can be given as
where denotes deep feature triplet loss, which can preserve the similarity of deep features. represents the -norm vector. represents the margin parameter. represents deep features of the image . represents deep features for the positive sound . represents deep features for the negative sound .
By considering Equations (6), (16) and (17), the overall objective function ℑ of the DTBH approach can be defined as
where and denote the trade-off parameters. ℑ denotes the overall objective function, which consists of the triplet similarity loss function , the triplet-regularized loss , and deep feature triplet loss . The objective function was optimized by Adam [46]. The detailed algorithmic procedure of DTBH is shown in Algorithm 1. The triplet similarity loss function ensures that the RS anchor images are more similar to the RS positive sounds than to the RS negative sounds. The triplet regularized loss makes hash-like codes more and more similar to hash codes by reducing the information loss. Deep features triplet loss can preserve the similarity of deep features. □
| Algorithm 1 Optimization algorithm for learning DTBH. |
| Input: M triplet units Output: The parameters W of the DTBH approach; Initialization: Utilize glorot_uniform distribution to initialize W. Repeat: 1: Utilize triplet selection strategy to select triplet units , 2: Use e millisecond window size with f millisecond shift to compute MFCC for the RS sounds, 3: Compute , , , , and by forward propagation; 4: Compute hash codes , and by using Equations (1)–(3); 5: Utilize , , , , , , , and to compute ℑ according to Equation (18); 6: Update W by exploiting Adam; Until: a fixed number of iterations or a stopping criteria is satisfied Return: W |
3. Experiments
In this section, Section 3.1 describes three RS image-sound datasets and evaluation protocols. Section 3.2 introduces the detailed implementation of the proposed DTBH method. Section 3.3 presents evaluation of different factors for the proposed DTBH method. Section 3.4 describes the experimental results. Section 3.5 discusses the parameter analysis of the proposed DTBH method.
3.1. Dataset and Evaluation Protocols
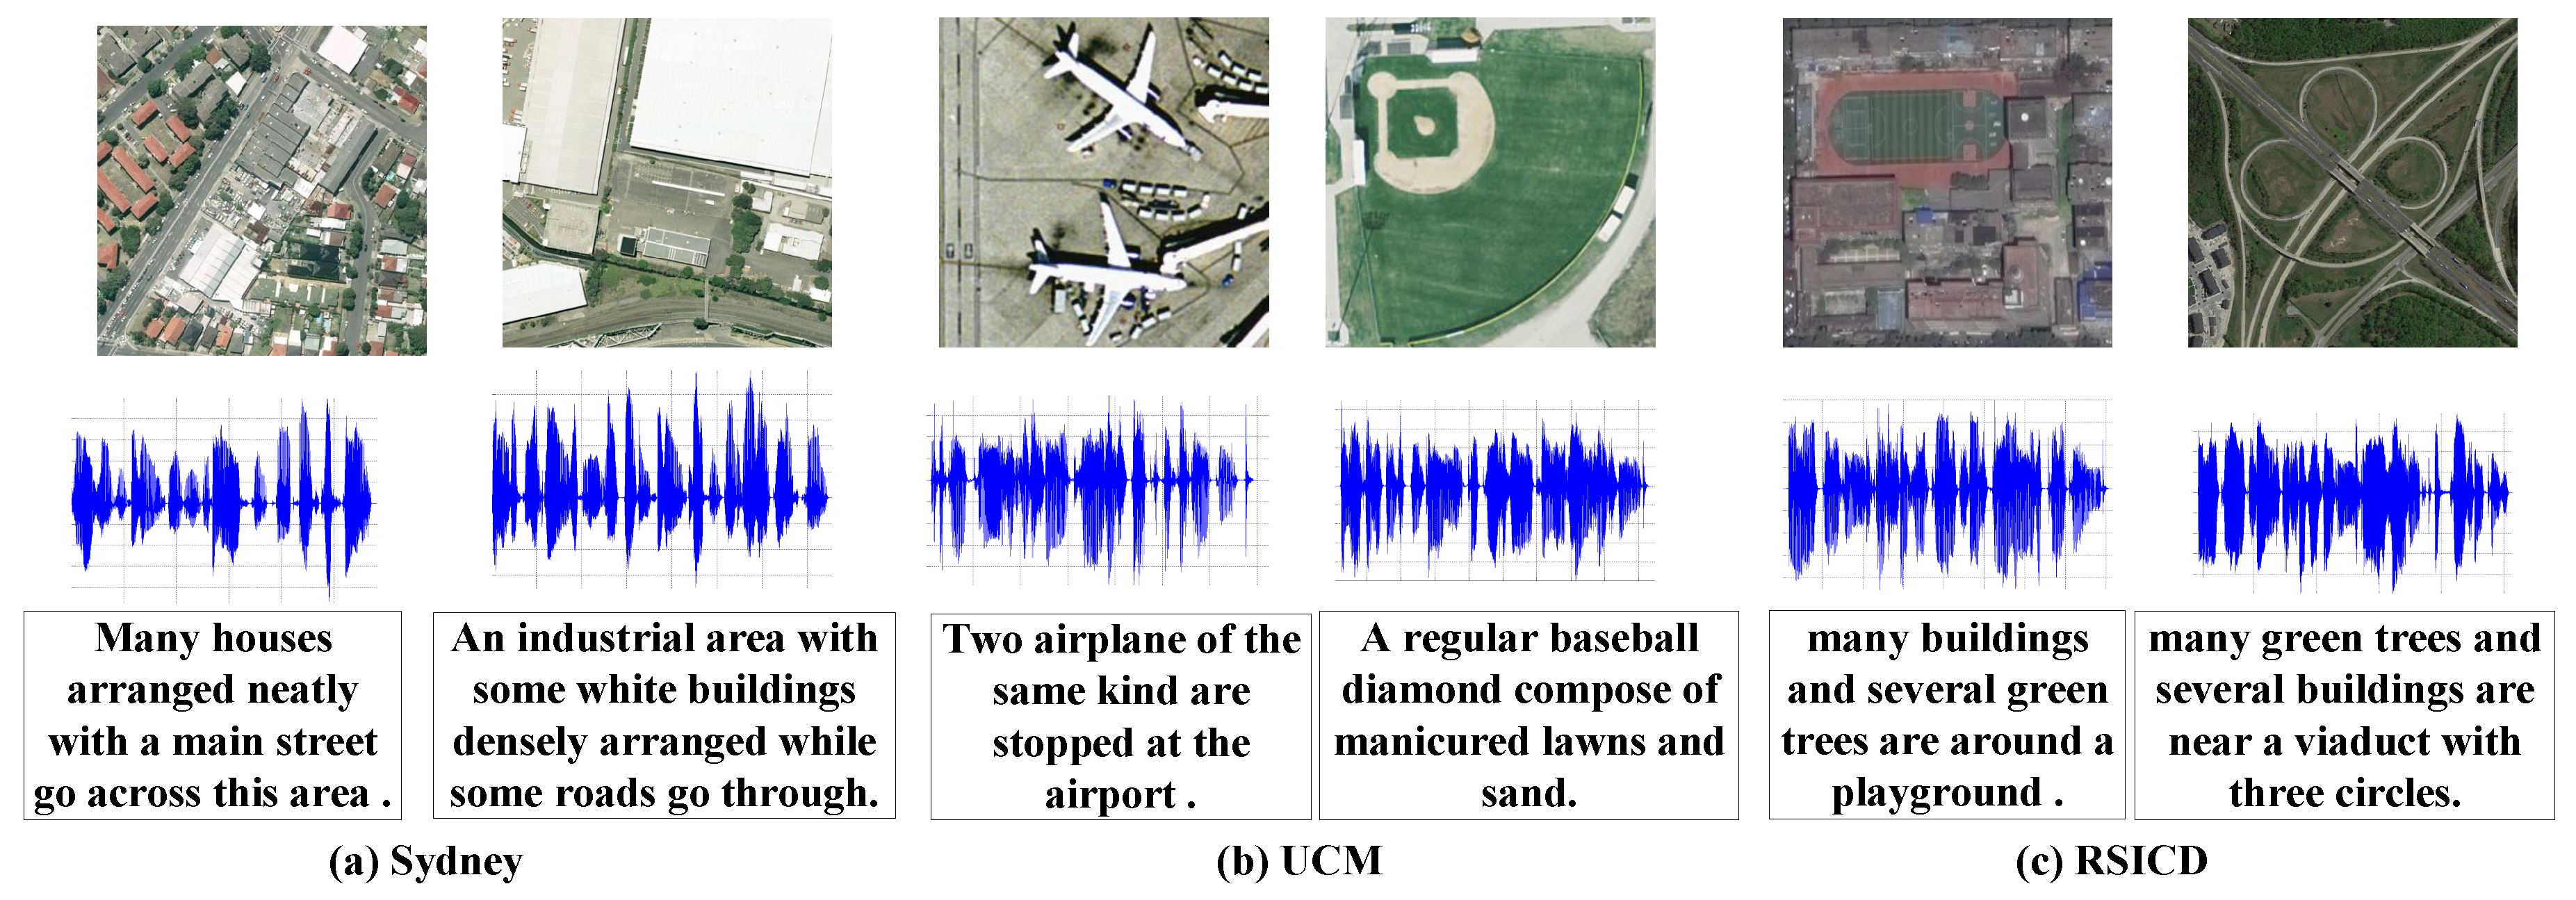
To prove the validity of the proposed DTBH method, three RS image-voice datasets were exploited to compare the DTBH method with other cross-modal image-voice methods. (1) UCM dataset [47] contains 2100 RS image-sound pairs. Note that the dataset consists of 2100 RS images of 30 classes; each RS image has one corresponding sound. We leveraged the triplet selection strategy to construct 6300 triplet units. (2) The Sydney dataset [47] consists of 613 RS image-sound pairs. Note that the dataset consists of 613 RS images of seven classes; each RS image has one corresponding sound. Triplet selection strategy is leveraged to construct 1839 triplet units. (3) RSICD dataset [48] consists of 10,921 RS image-sound pairs. Note that the dataset consists of 10,921 RS images of 30 classes; each RS image has one corresponding sound. We exploited the triplet selection strategy to construct 32,763 triplet units. Following [14], we randomly selected 80% RS image-sound triplets as the training data and the other 20% RS image-sound triplets as the testing data for these three datasets. In the testing process, we use testing RS images (resp. sounds) as the query data and testing RS sounds (resp. RS images) as the gallery data. Some example images and sounds from three RS image-sound datasets are shown in Figure 3. Moreover, to evaluate the validity of the proposed DTBH method, the DTBH method was compared with SIFT+M, DBLP [39], convolutional neural network and spectrogram (CNN+SPEC) [22], and deep visual-audio network (DVAN) [14]. Note that the DTBH method uses 64 bit hash codes; the method SIFT+M projects SIFT features of images and MFCC features of voices into a common feature space by exploiting deep neural networks.These methods—DBLP [39], CNN+SPEC [22], and DVAN [14]—were implemented in this study. Following [14], similar images and sounds can be considered as the ground-truth neighbors. These evaluating metrics—mean average precision (mAP) and the precision in top m of the ranking list (precision@m)—were exploited for assessing the experimental results [49,50,51,52]. Precision represents the proportion of the correct number of samples to the total number of samples in the ranking list [53]. If the real-values of these metrics are bigger, the retrieval results of the method are better [54].
3.2. Implementation Details
The proposed DTBH method was carried out by the open-source KERAS library. The experiments were implemented on workstation with GeForce GTX Titan X GPU, Inter Core i7-5930K, with a 3.50 GHZ CPU and 64 GB RAM. For MFCC, the parameter g was fixed as 2000. The overall objective function ℑ can be optimized by Adam [46] with the learning rate . The initial weights of the DTBH approach exploited the glorot_uniform distribution. The batch size of the DTBH approach was fixed as 64. The parameter was fixed as 1. The parameter was fixed as . To produce {16, 24, 36, 48, 64}-bit binary codes, K values were make to be from 8 to 64, respectively. The proposed DTBH approach can be trained for 5000 epoches, or to keep training until the loss does not diminish [55].
3.3. Evaluation of Different Factors
To evaluate the effectiveness of the proposed DTBH method, we analyzed three important factors: deep feature similarity, triplet selection strategy and triplet regularized term.
The experiments were implemented four ways: Firstly, we used the proposed DTBH method without leveraging the triplet selection strategy (i.e., DTBH-S). Secondly, we used the proposed DTBH method without exploiting the triplet regularized term (i.e., DTBH-R). Thirdly, we utilized the proposed DTBH method without considering deep feature similarity (i.e., DTBH-D). Finally, we leveraged the proposed DTBH method without using the deep feature similarity, triplet selection strategy, and triplet regularized term (i.e., DTBH-T).
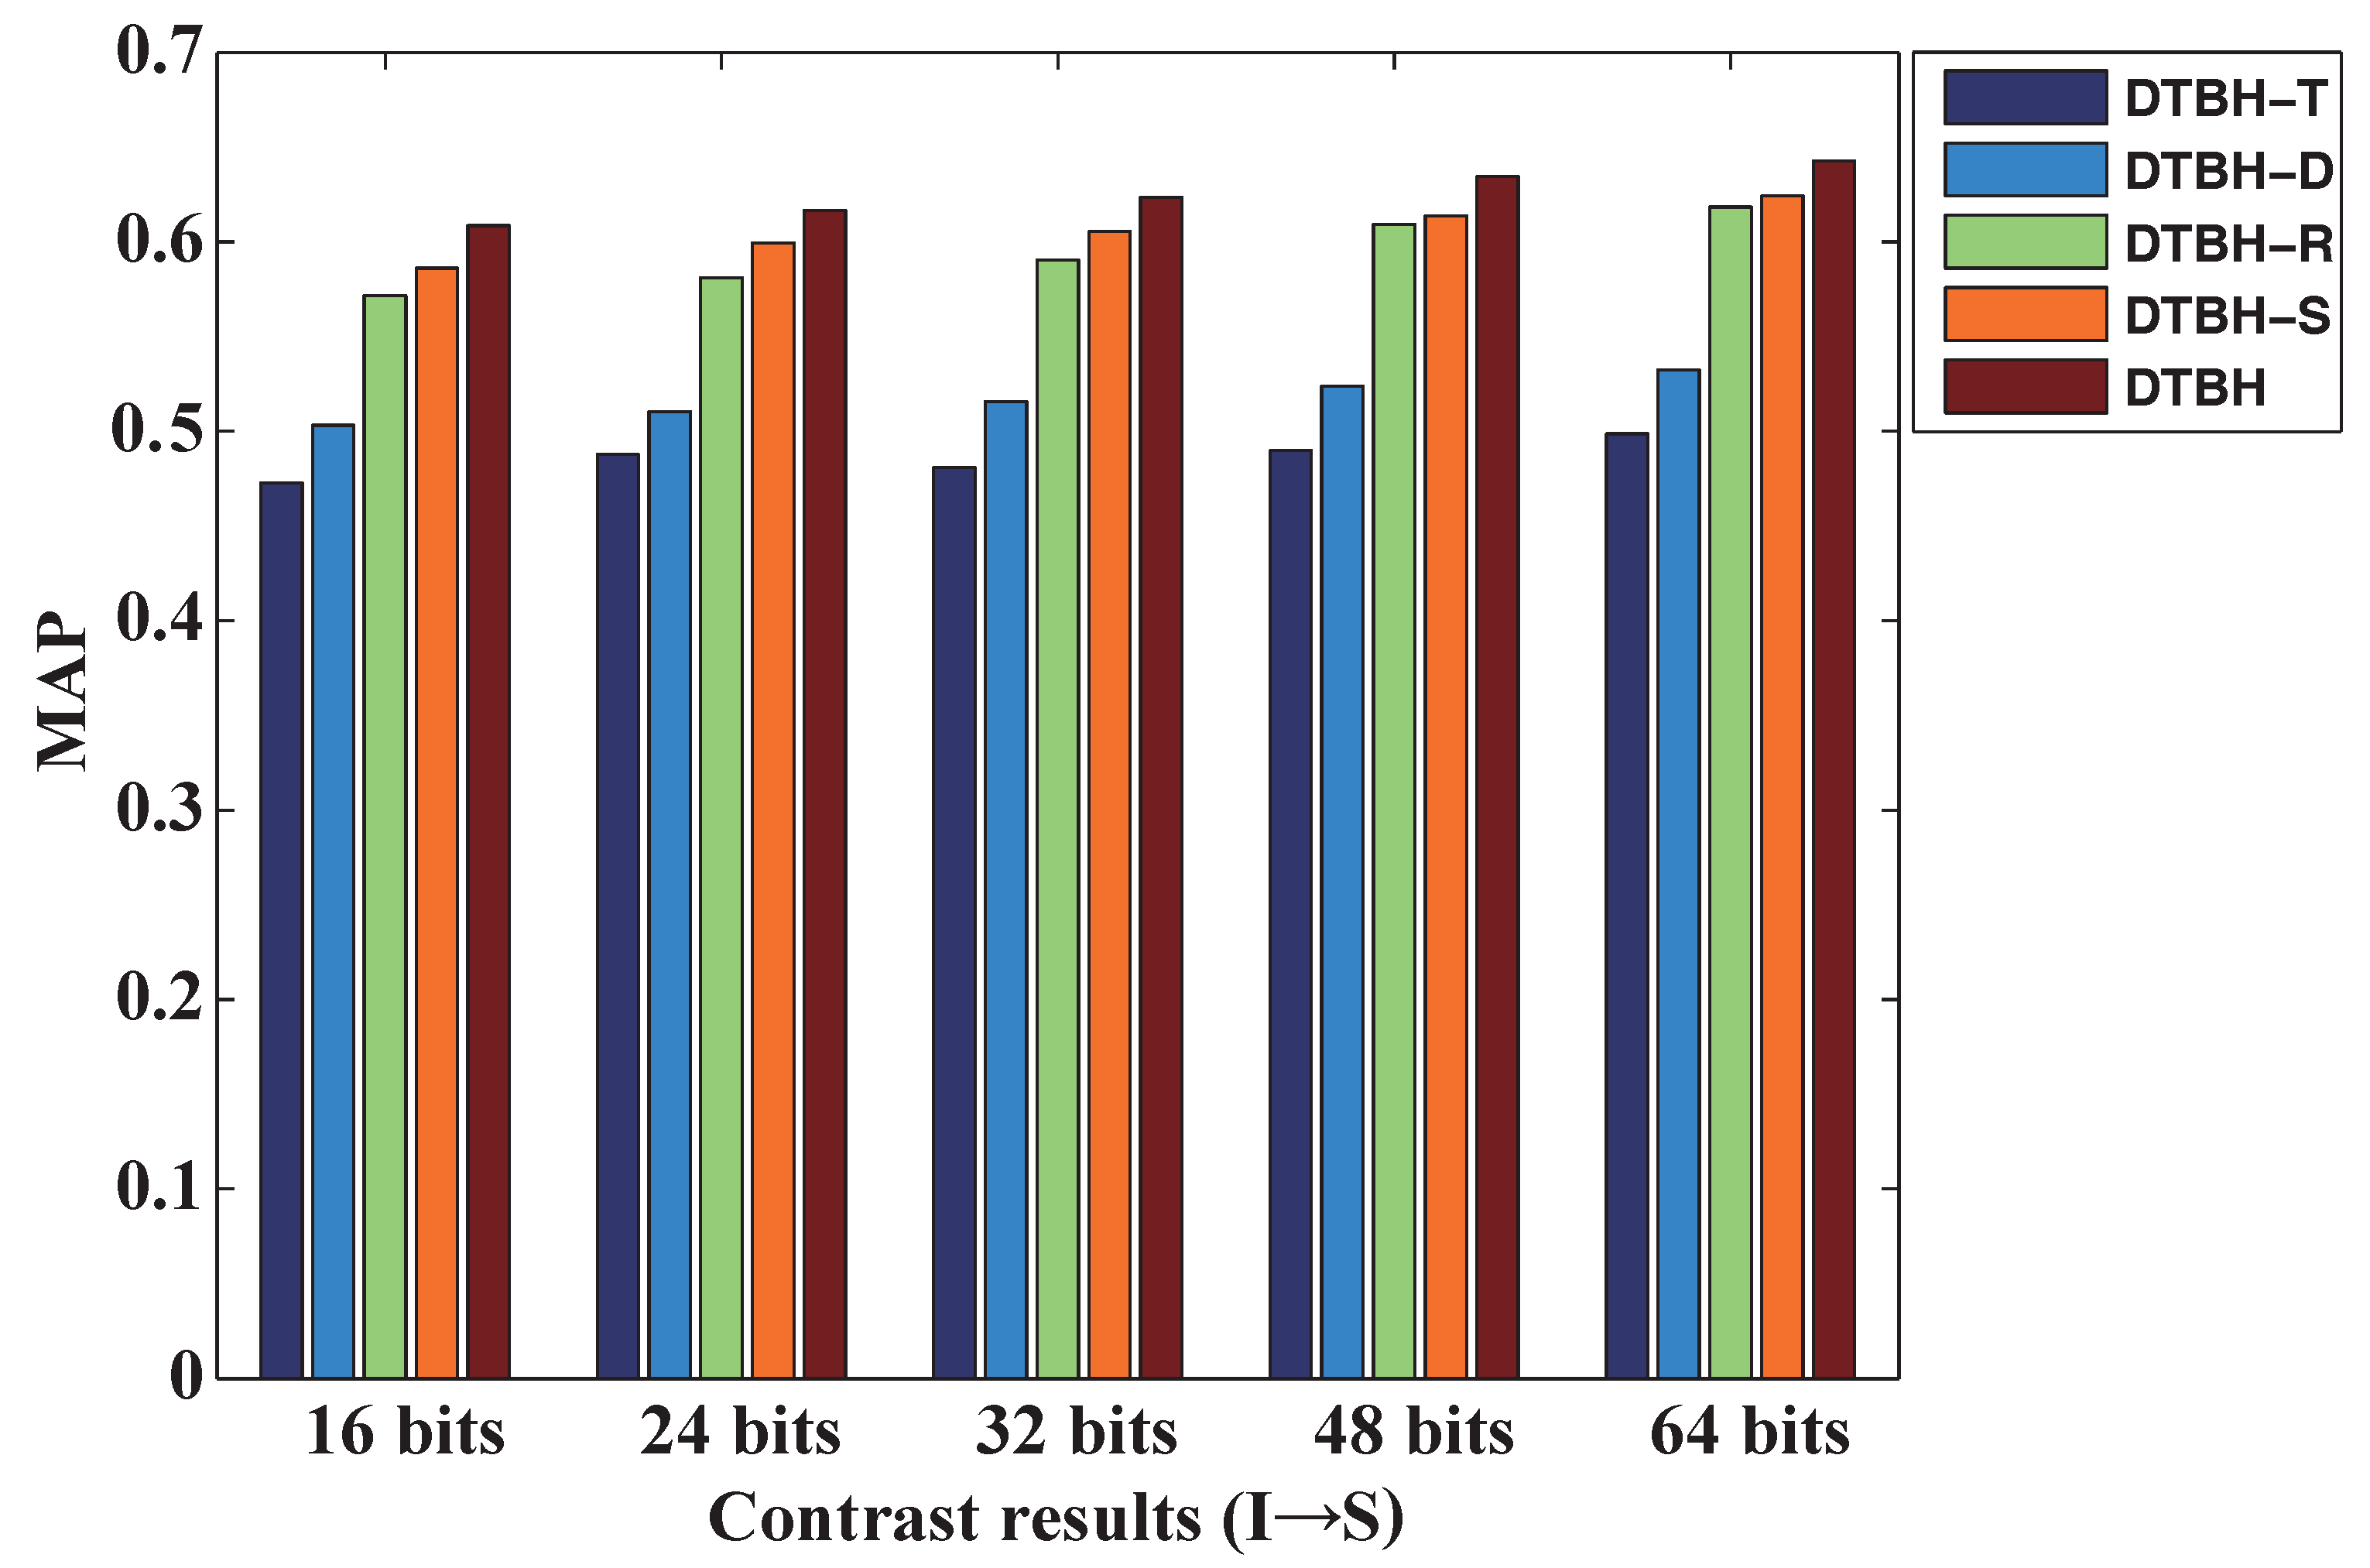
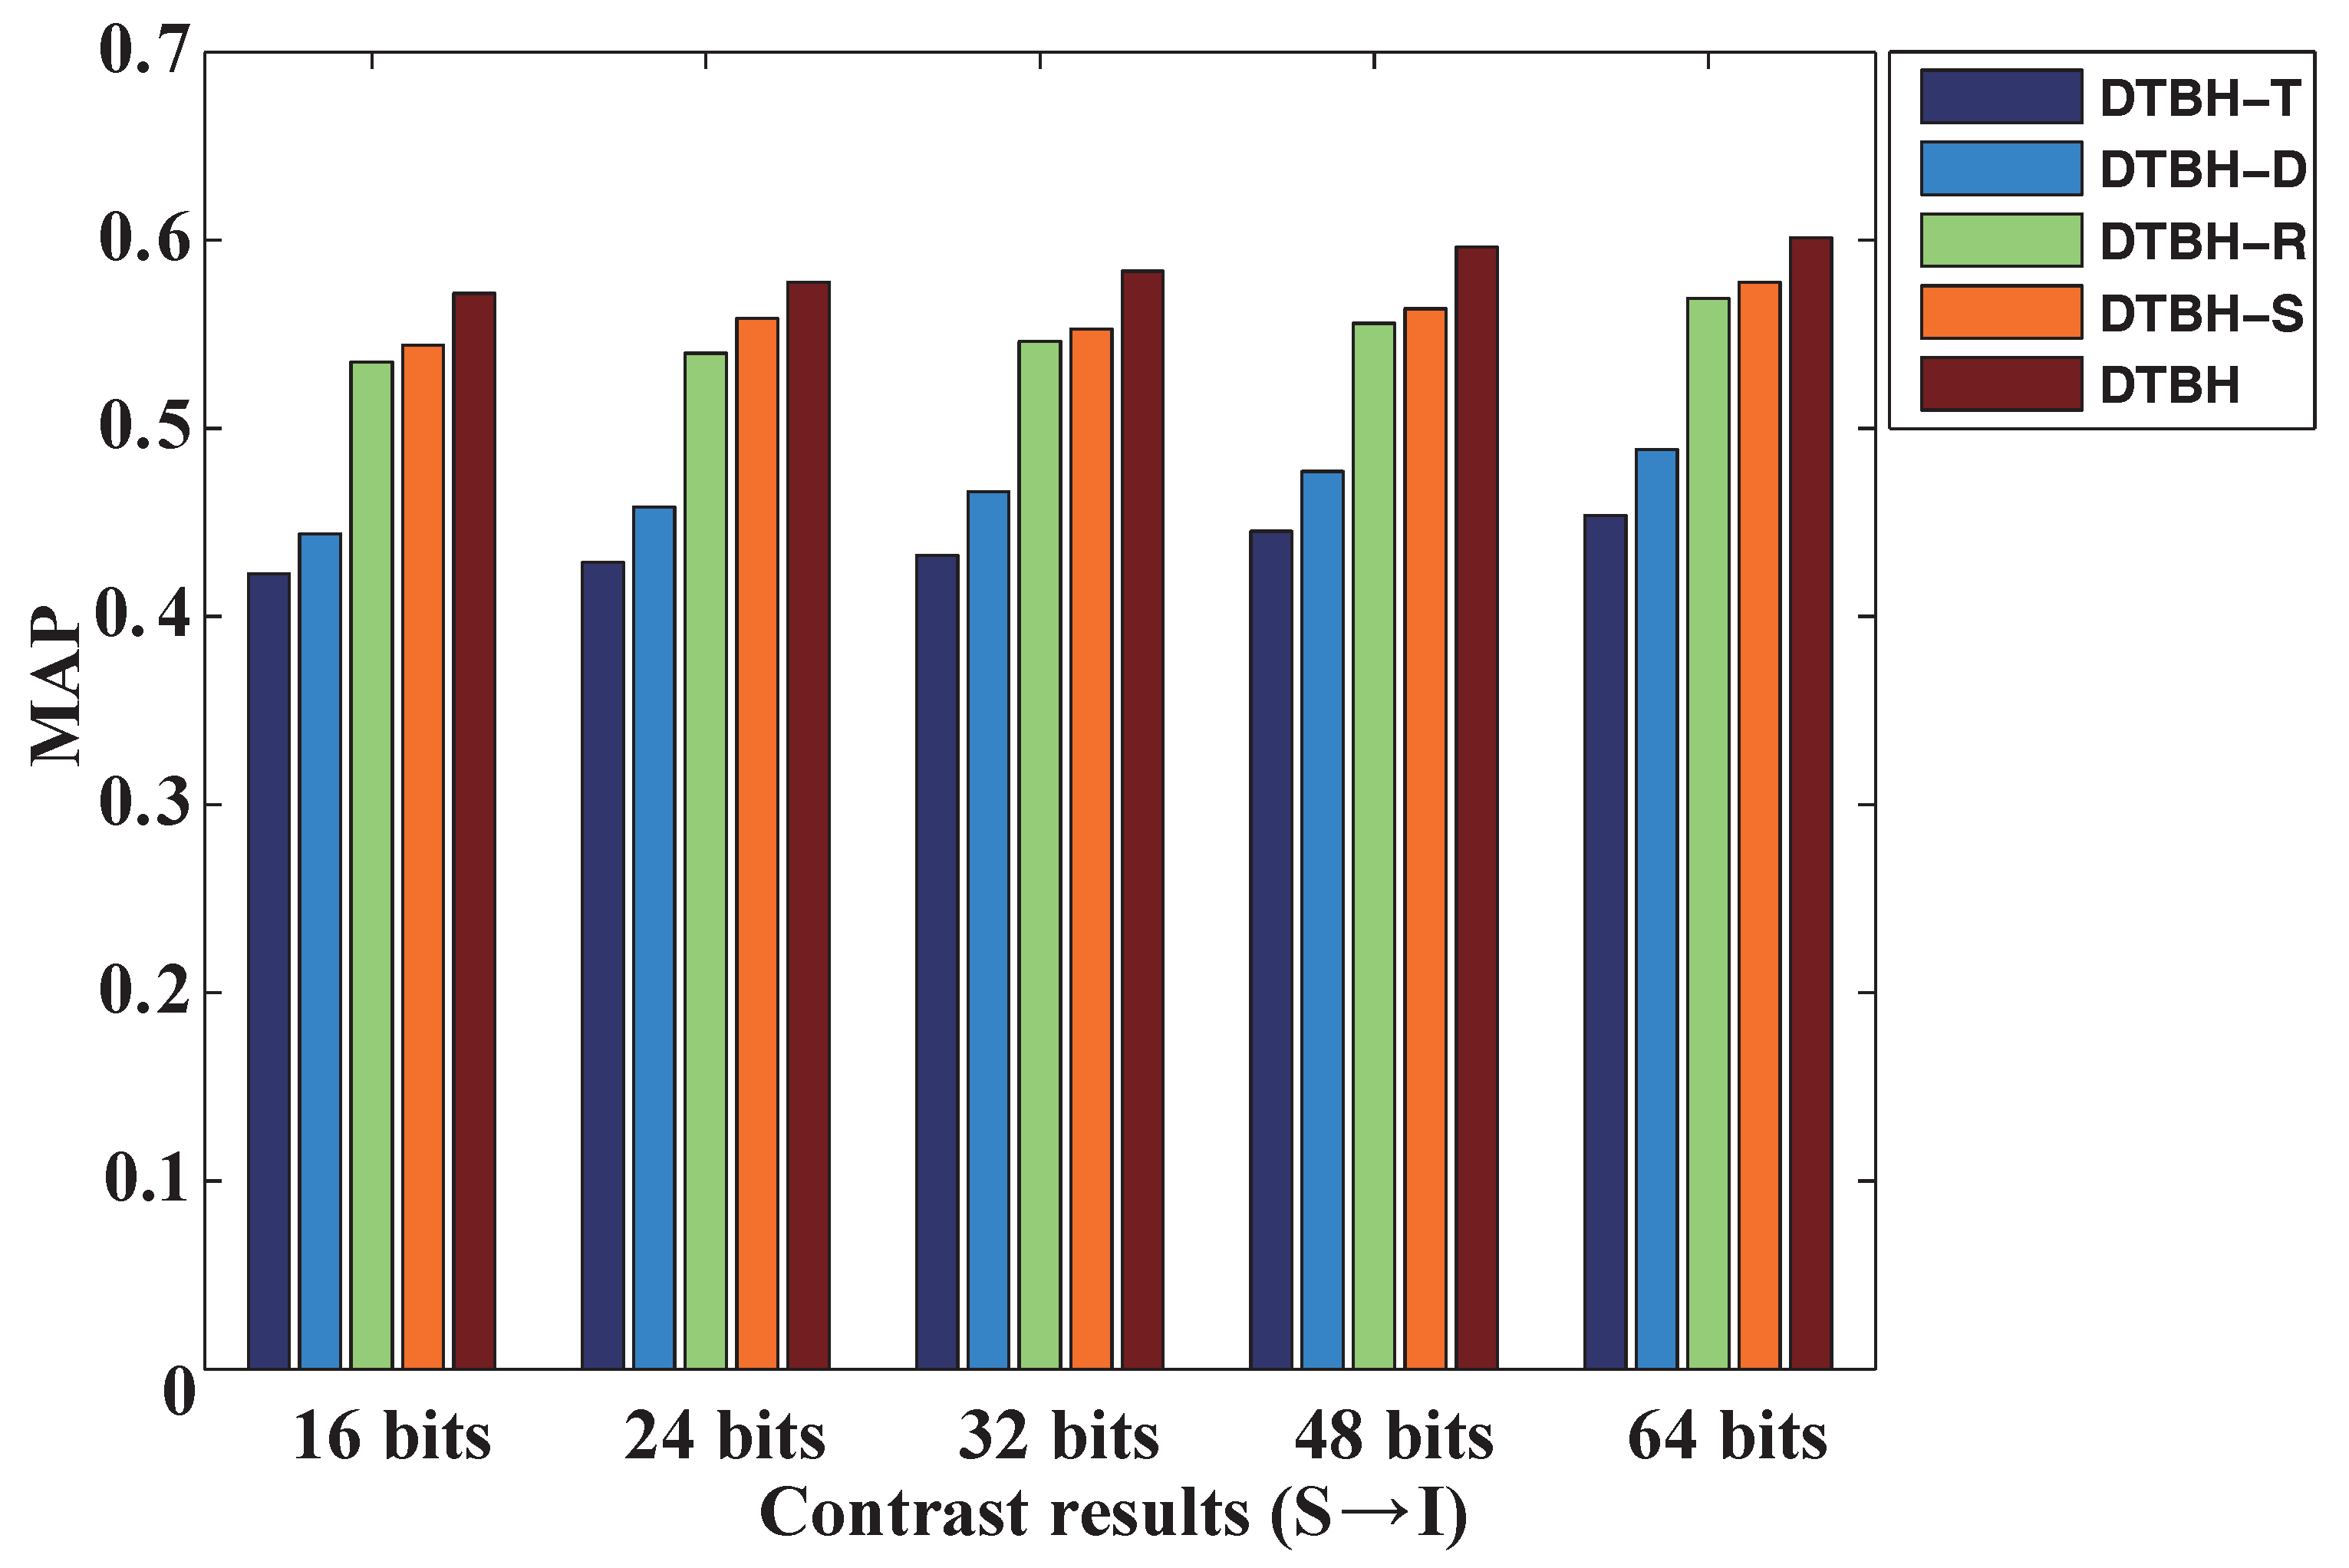
Table 2 shows contrasting results of DTBH-S, DTBH-R, DTBH-D, DTBH-T, and DTBH on the UCM dataset with different hash codes. Figure 4 shows the comparative results of DTBH-T, DTBH-D, DTBH-R, DTBH-S, and DTBH for different hash bits on the UCM dataset by using RS images to retrieve sounds. Meanwhile, Figure 5 shows the comparative results of DTBH-T, DTBH-D, DTBH-R, DTBH-S, and DTBH for different hash bits on the UCM dataset using the sounds generated from RS images. Here, “S→I” represents the case where the query datasets are RS sounds and the gallery datasets are RS images. “I→S” represents the case where the query datasets are RS images and the gallery datasets are RS sounds. It is clearly seen from Figure 4 and Figure 5, and Table 2 that the proposed DTBH method can achieve superior performance to DTBH-P, DTBH-D, DTBH-Q, and DTBH-I on the MAP with different bits hash codes. For S→I, the proposed DTBH method improved the MAP with 32 bits from DTBH-T (43.25%), DTBH-D (46.65%), DTBH-R (54.61%), and DTBH-S (55.28%) to 58.36%. For I→S, the proposed DTBH method improved the MAP with 32 bits from DTBH-T (48.09%), DTBH-D (52.38%), DTBH-R (60.93%), and DTBH-S (61.38%) to 63.45%. This is because the proposed DTBH method utilizes the deep feature similarity, triplet selection strategy, and triplet regularized term to achieve superior retrieval performance.
To assess the impacts of different convolution architectures for the proposed DTBH method, we evaluate several variants of SDIH. These variants contain DTBH+AlexNet, DTBH+GoogleNet, and DTBH+VGG16. The differences in these variants are the head of the image network. DTBH+VGG16 uses the convolution part of VGG-16 network as the head of the image network. DTBH+AlexNet utilizes the convolution part of AlexNet network as the head of the image network. DTBH+GoogleNet utilizes the convolution part of GoogleNet network as the head of the image network. Table 3 shows the contrasting results of DTBH+AlexNet, DTBH+GoogleNet, and DTBH+VGG16 on UCM dataset with mean average precision (mAP) in different hash bits. It can be observed from Table 3 that the cross-modal hashing algorithm using VGG-16 network can achieve better performance than the identical algorithm using the GoogleNet network and AlexNet network.
3.4. Results
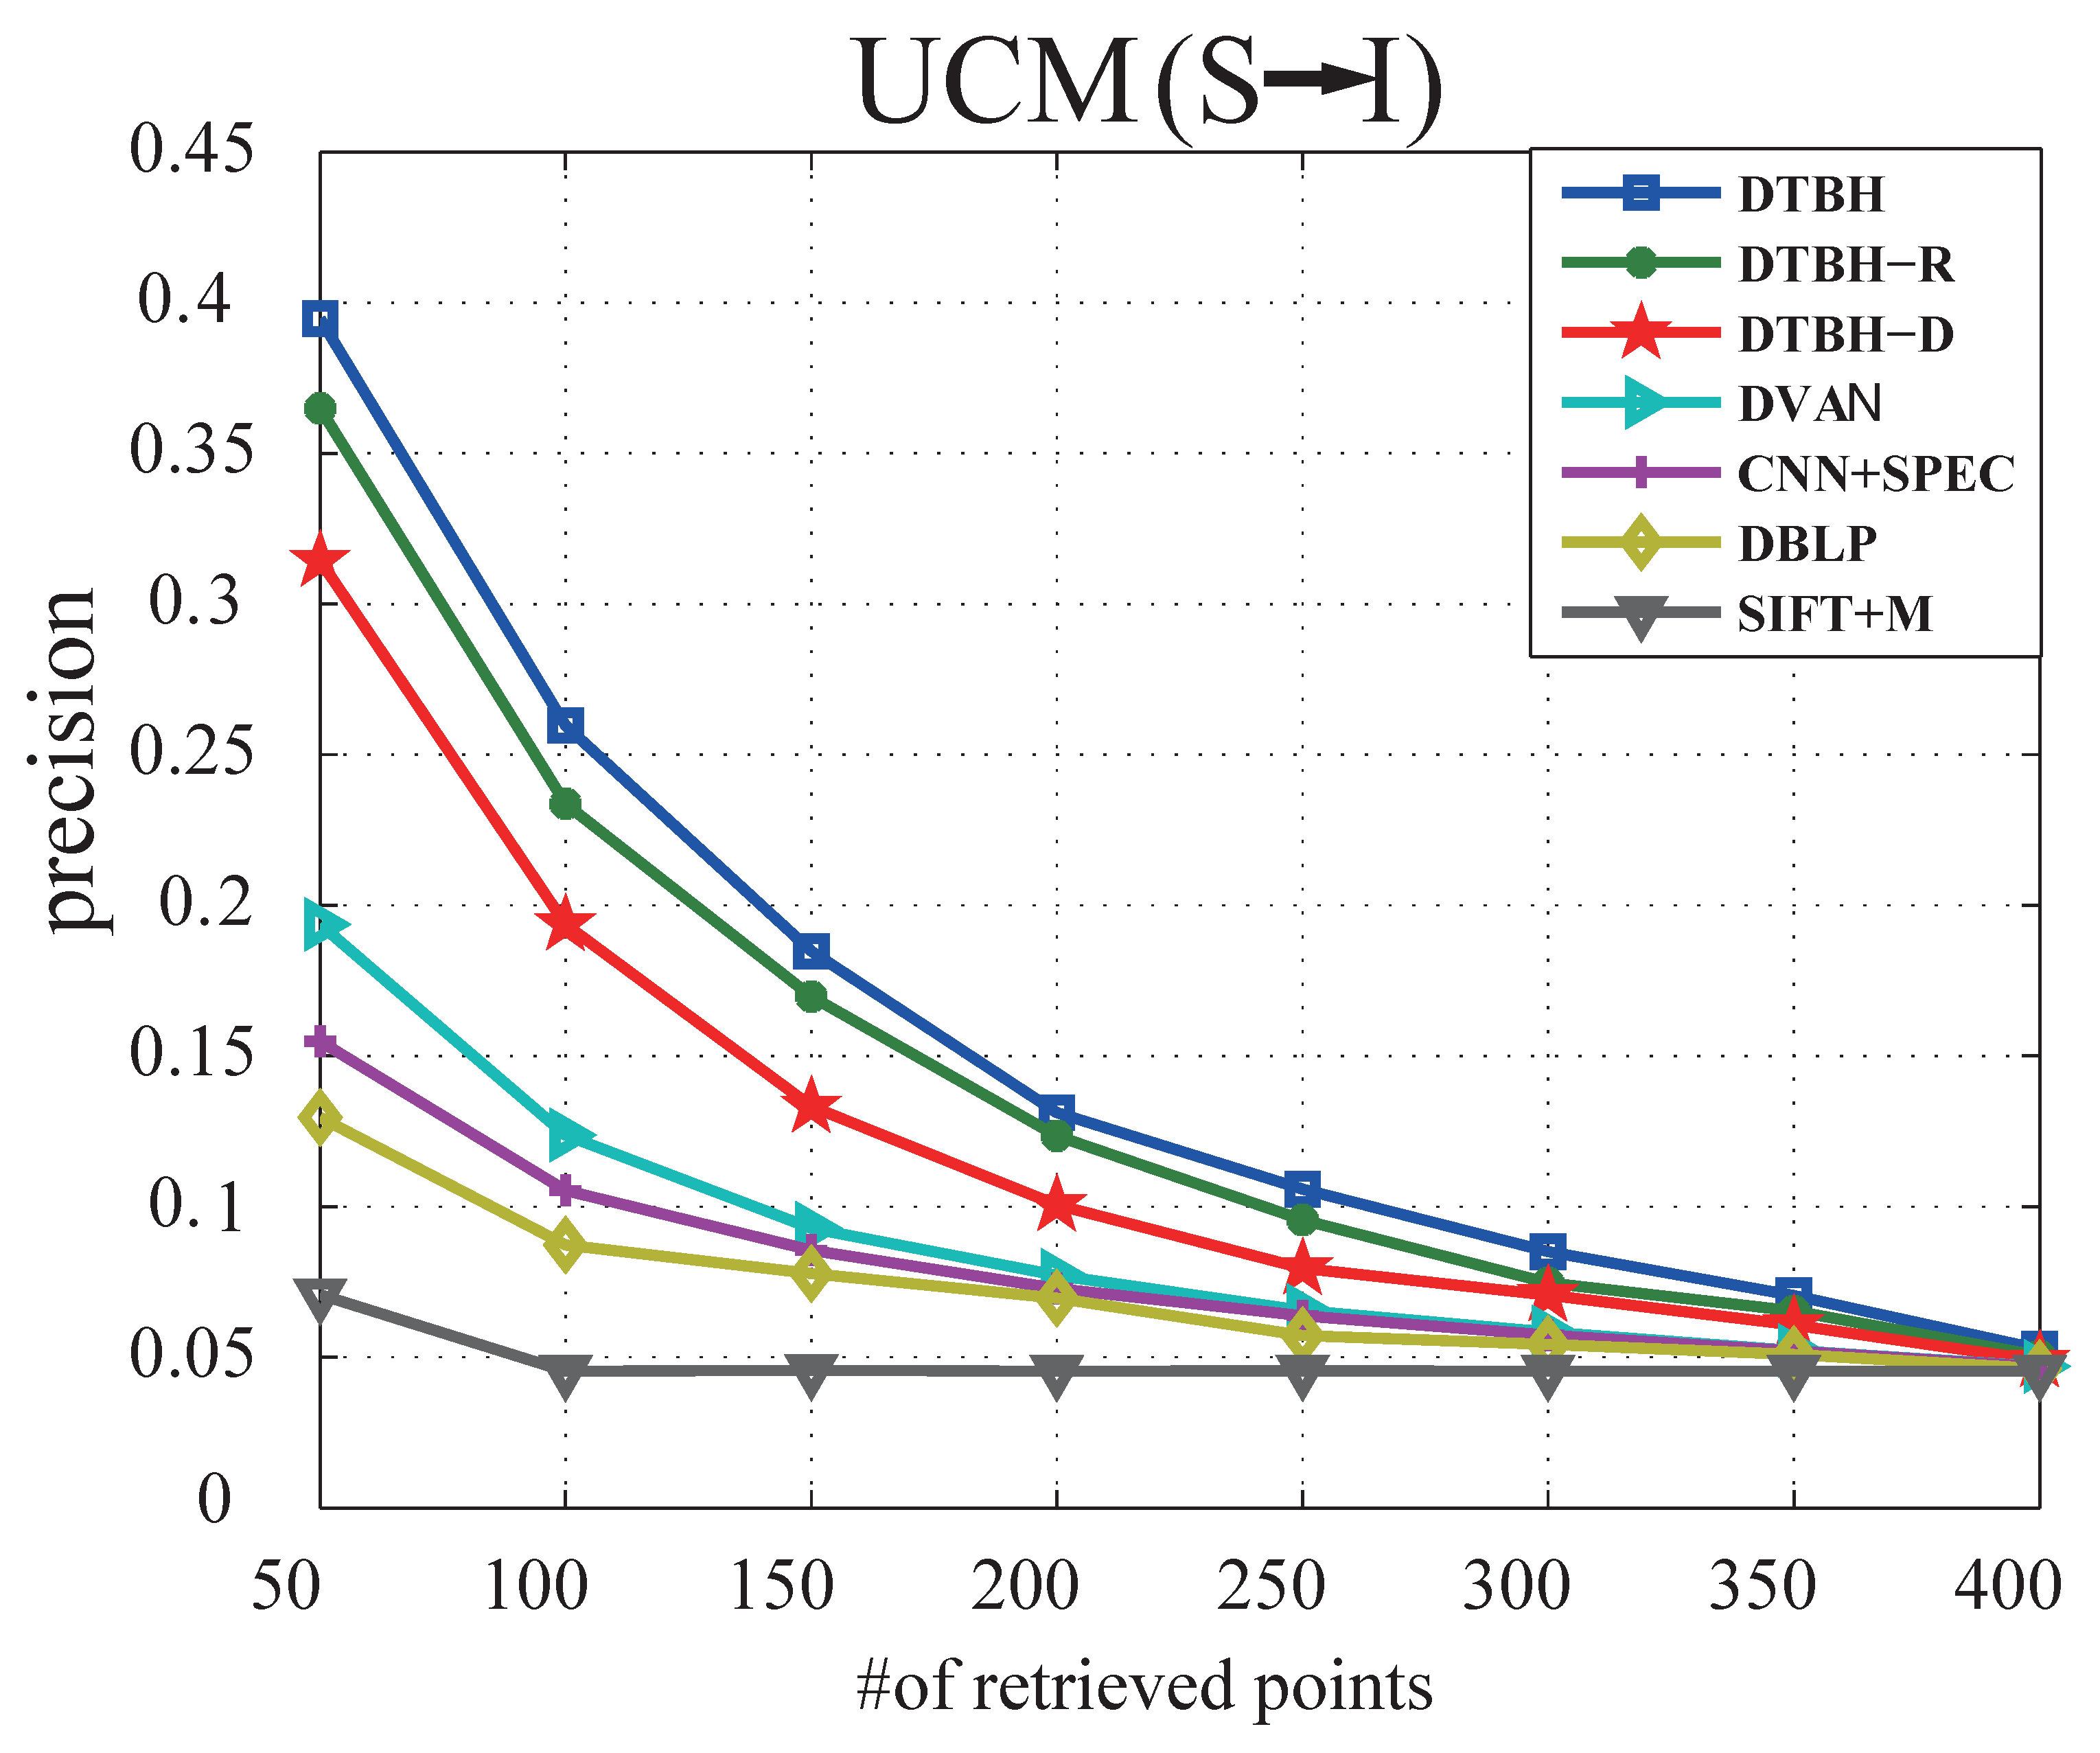
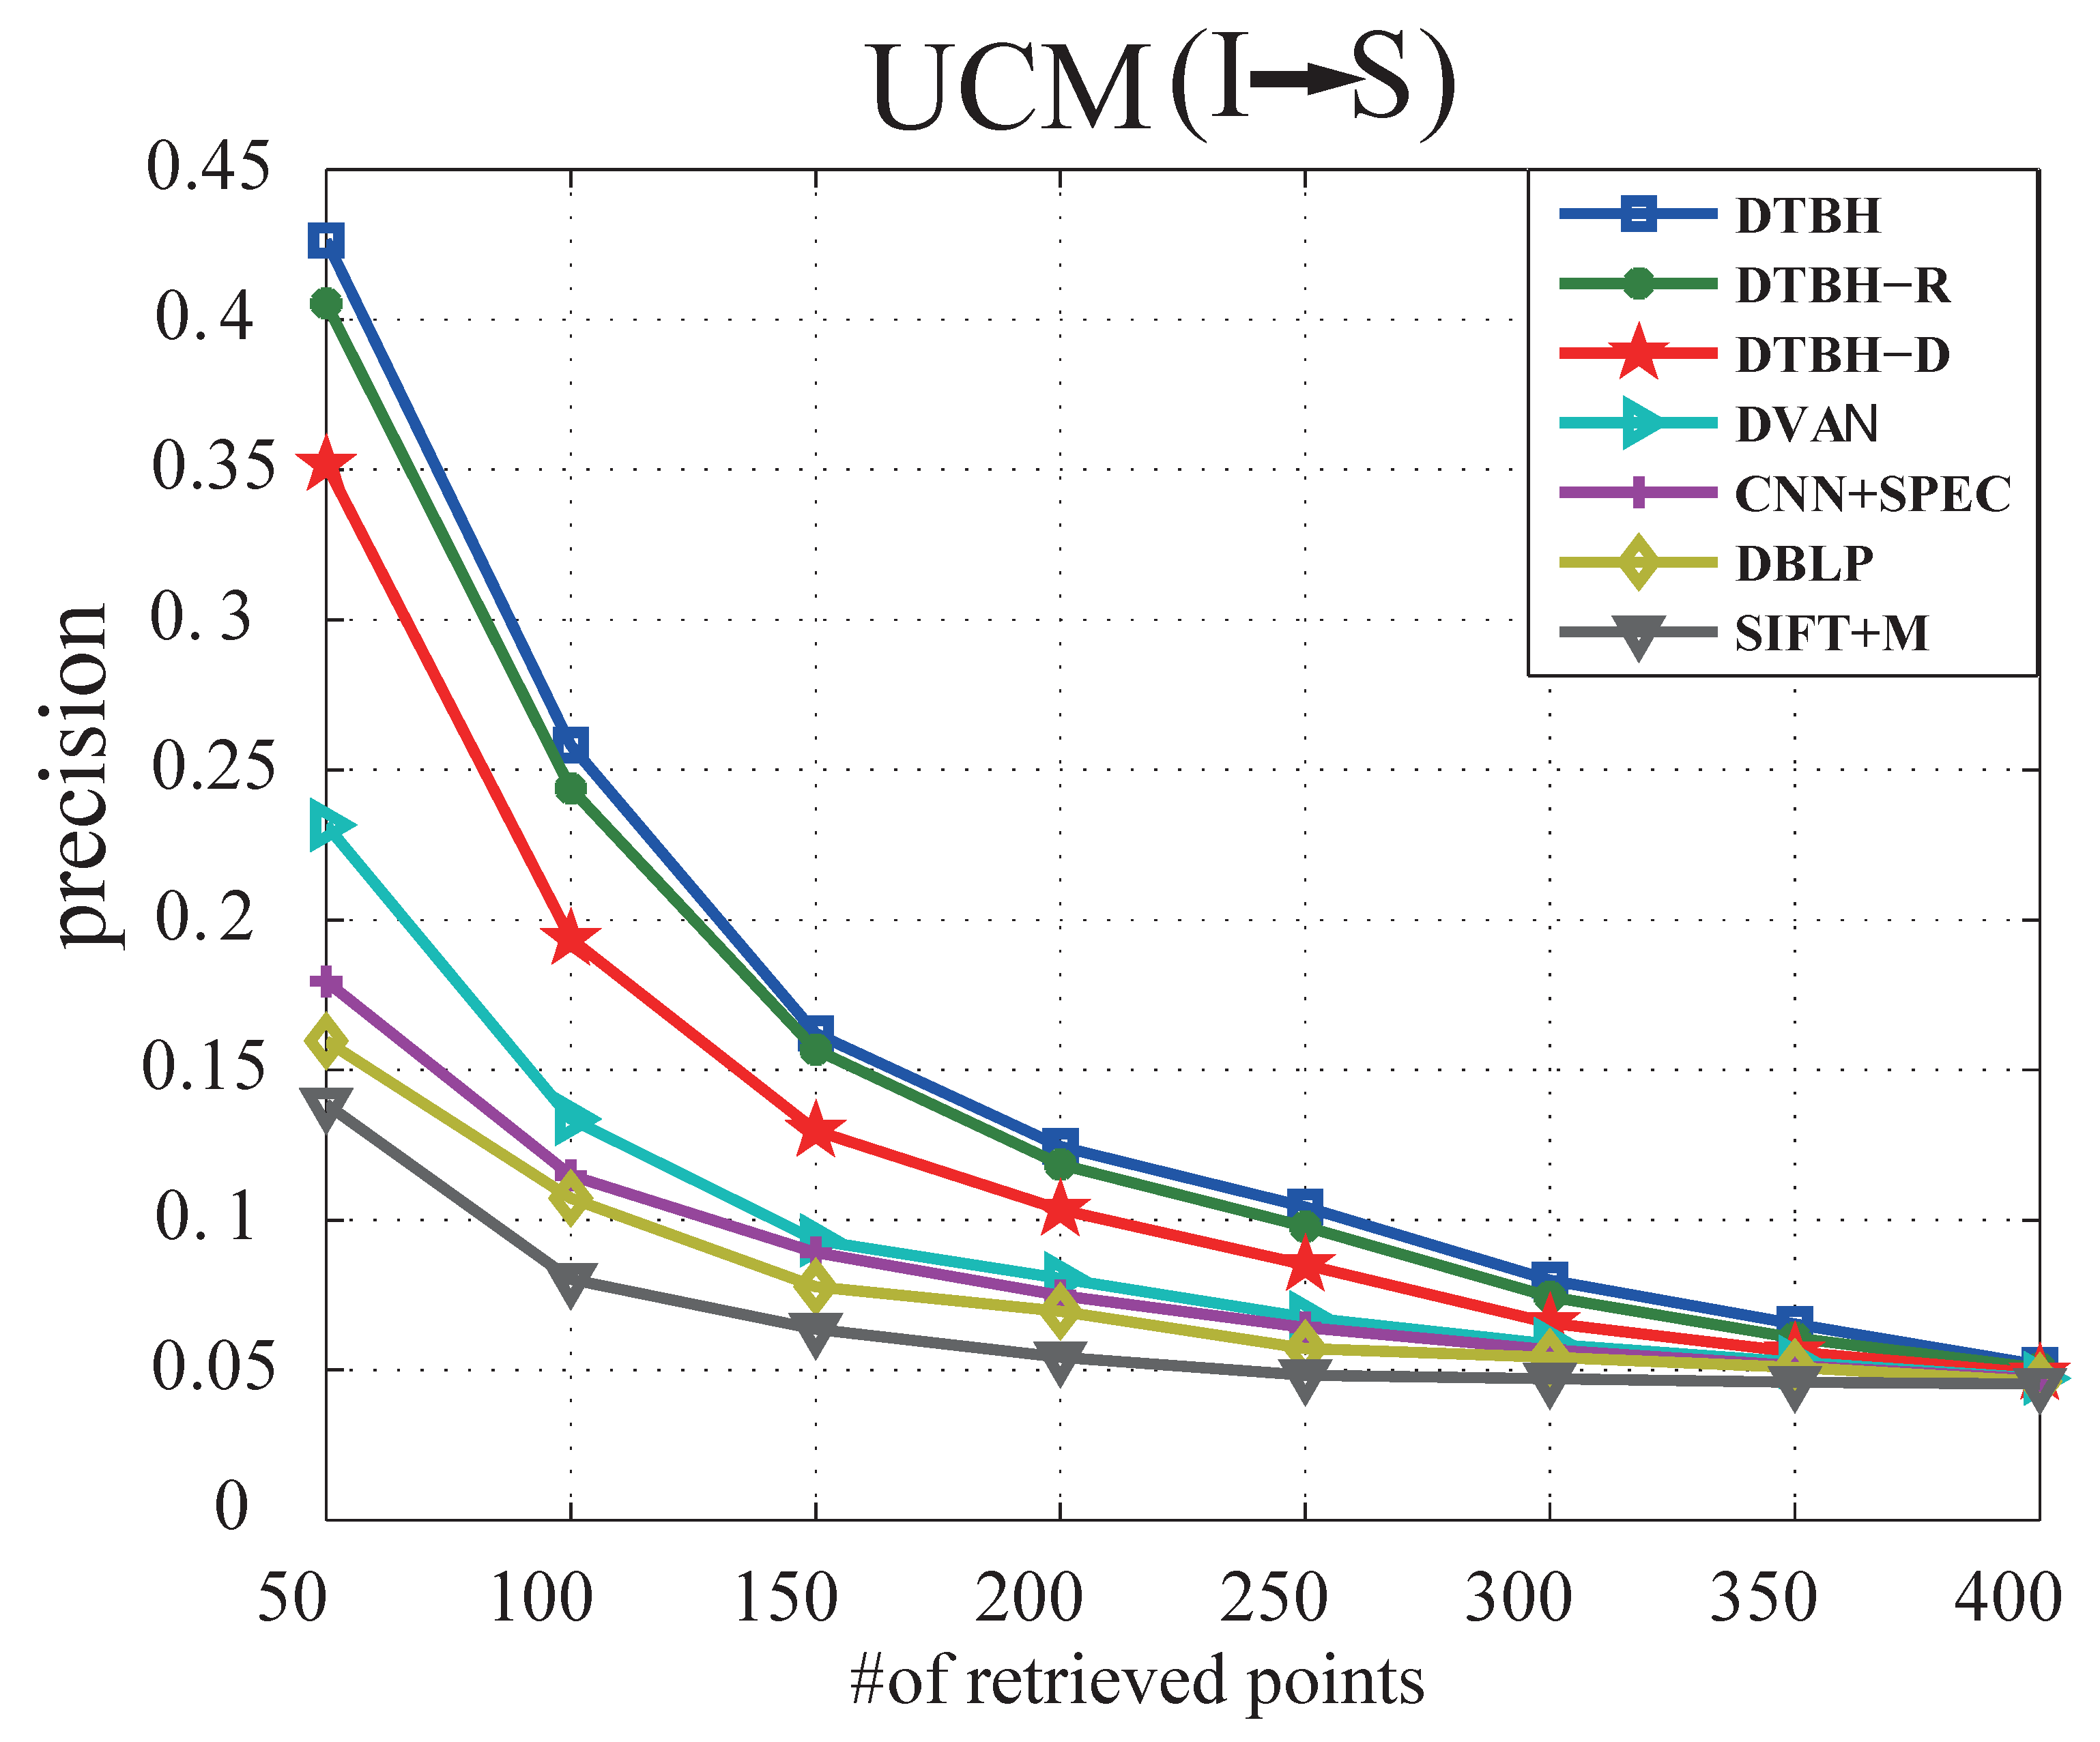
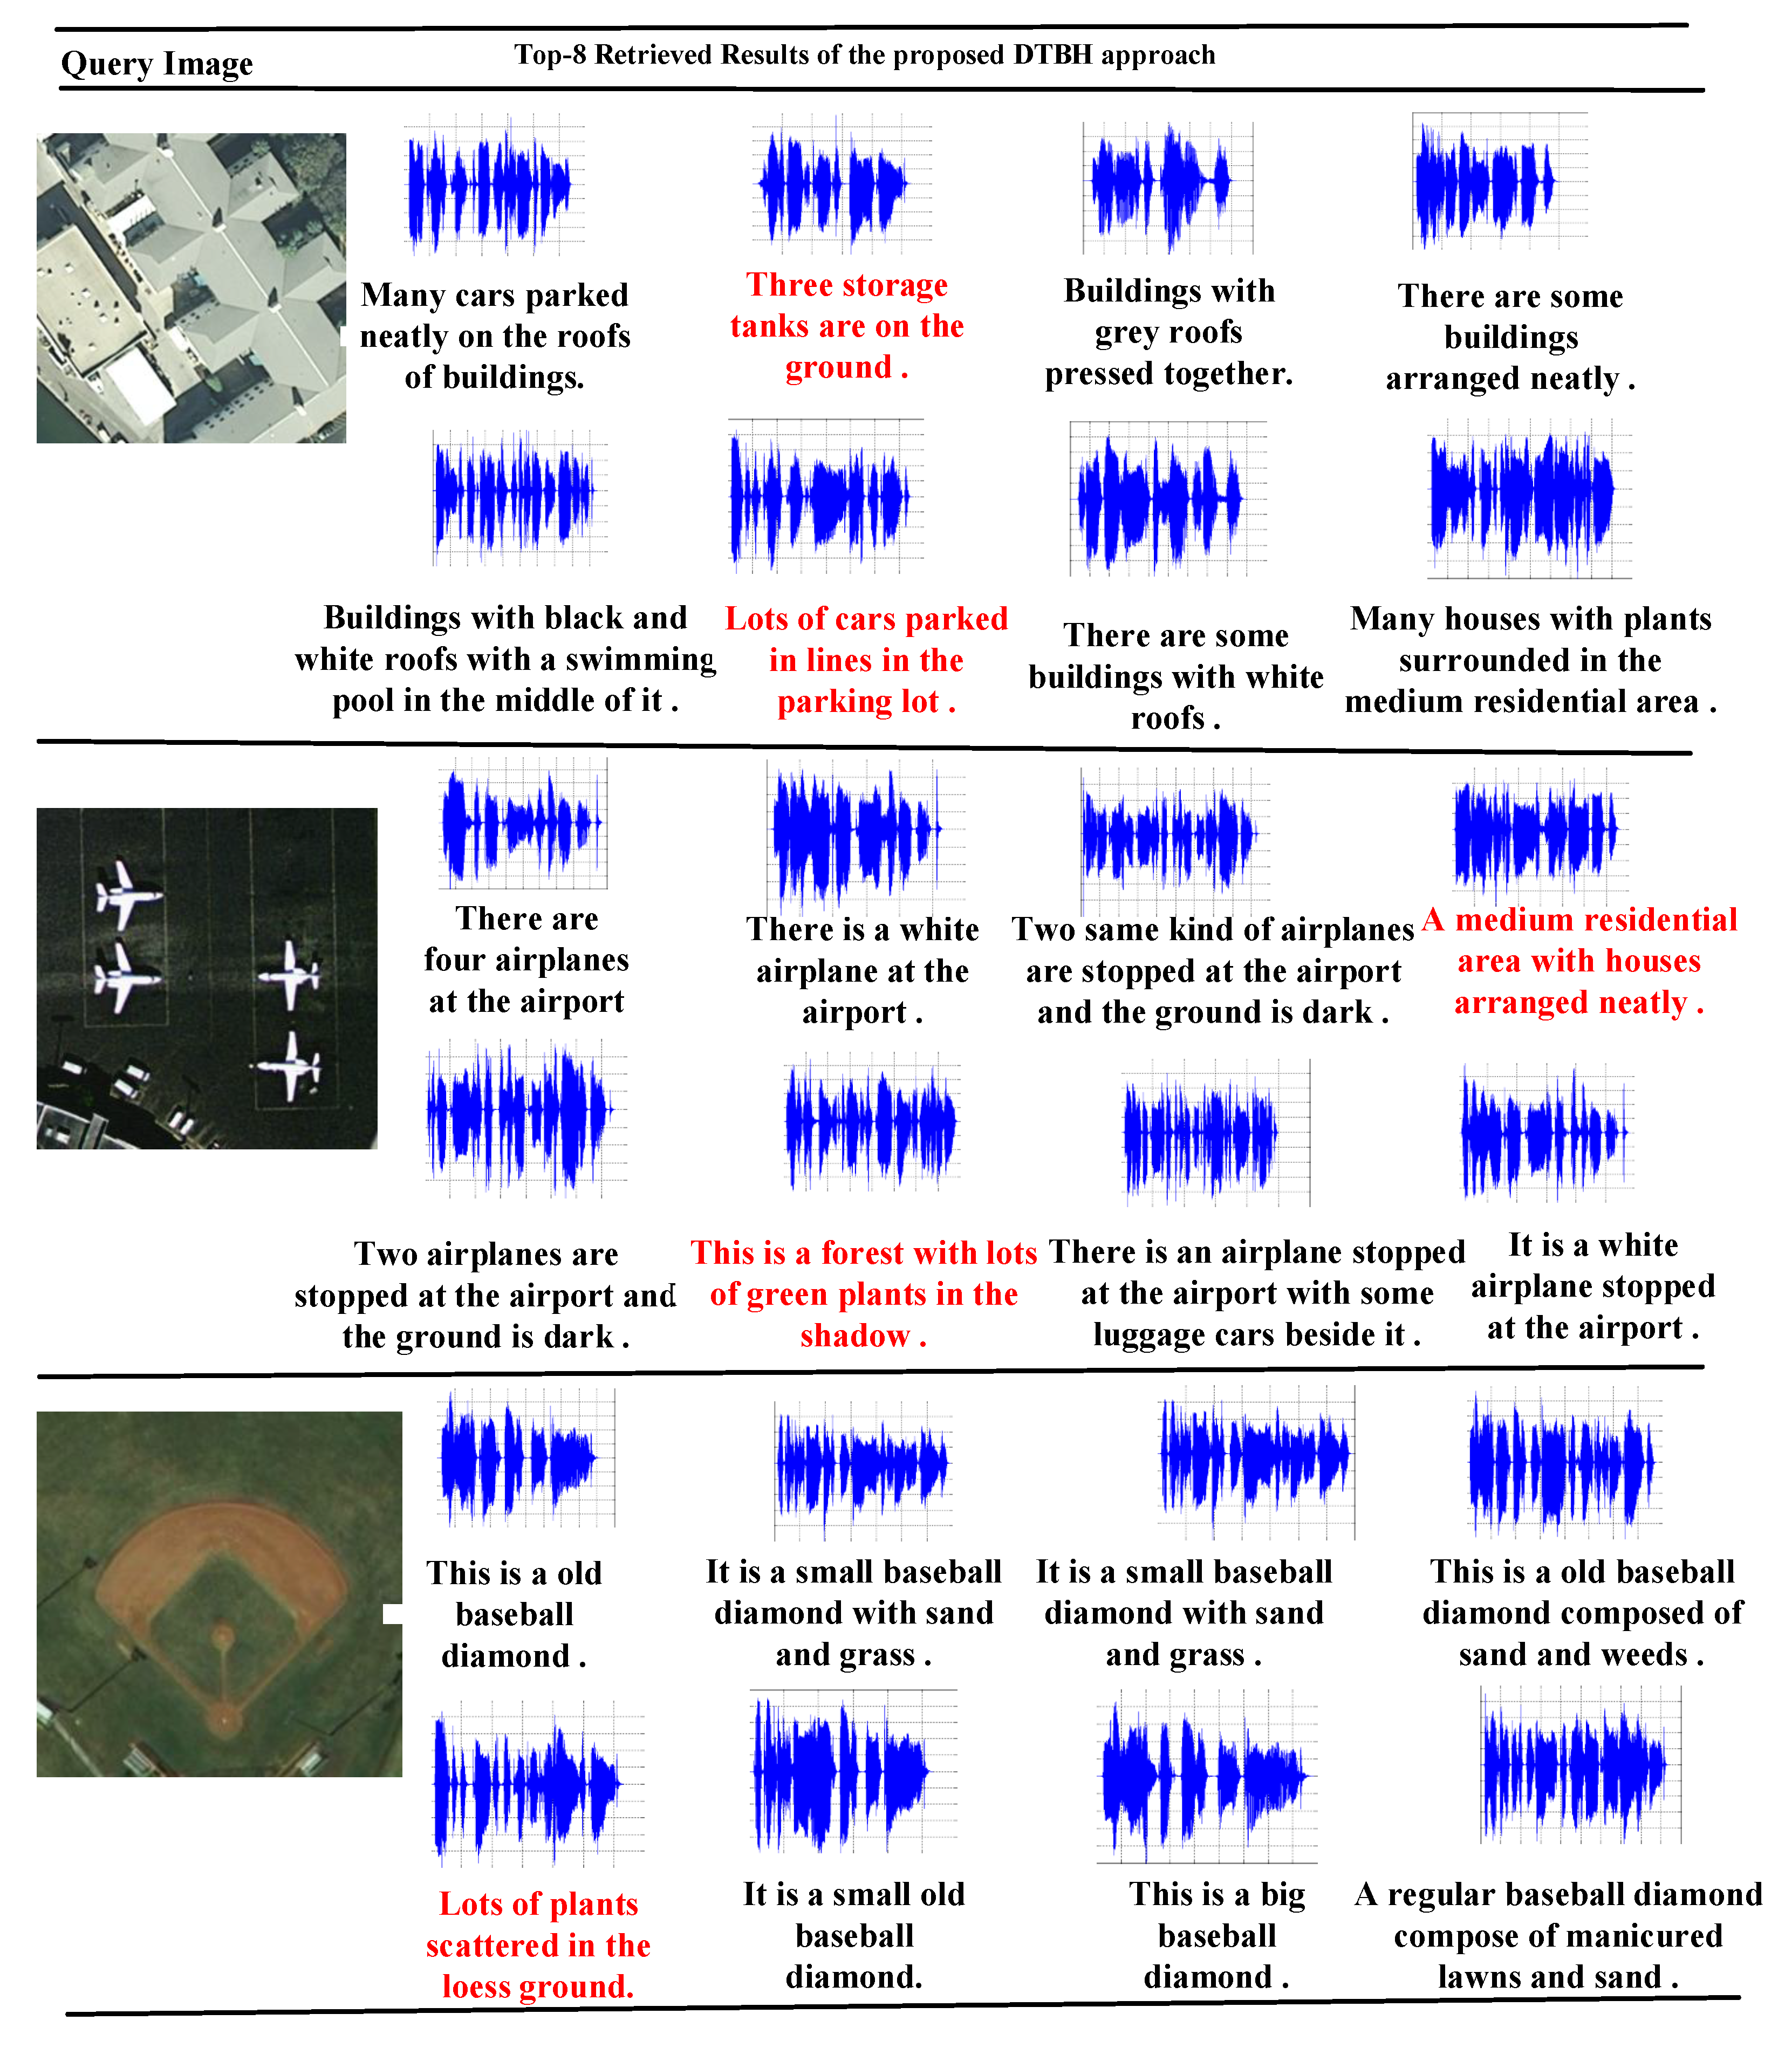
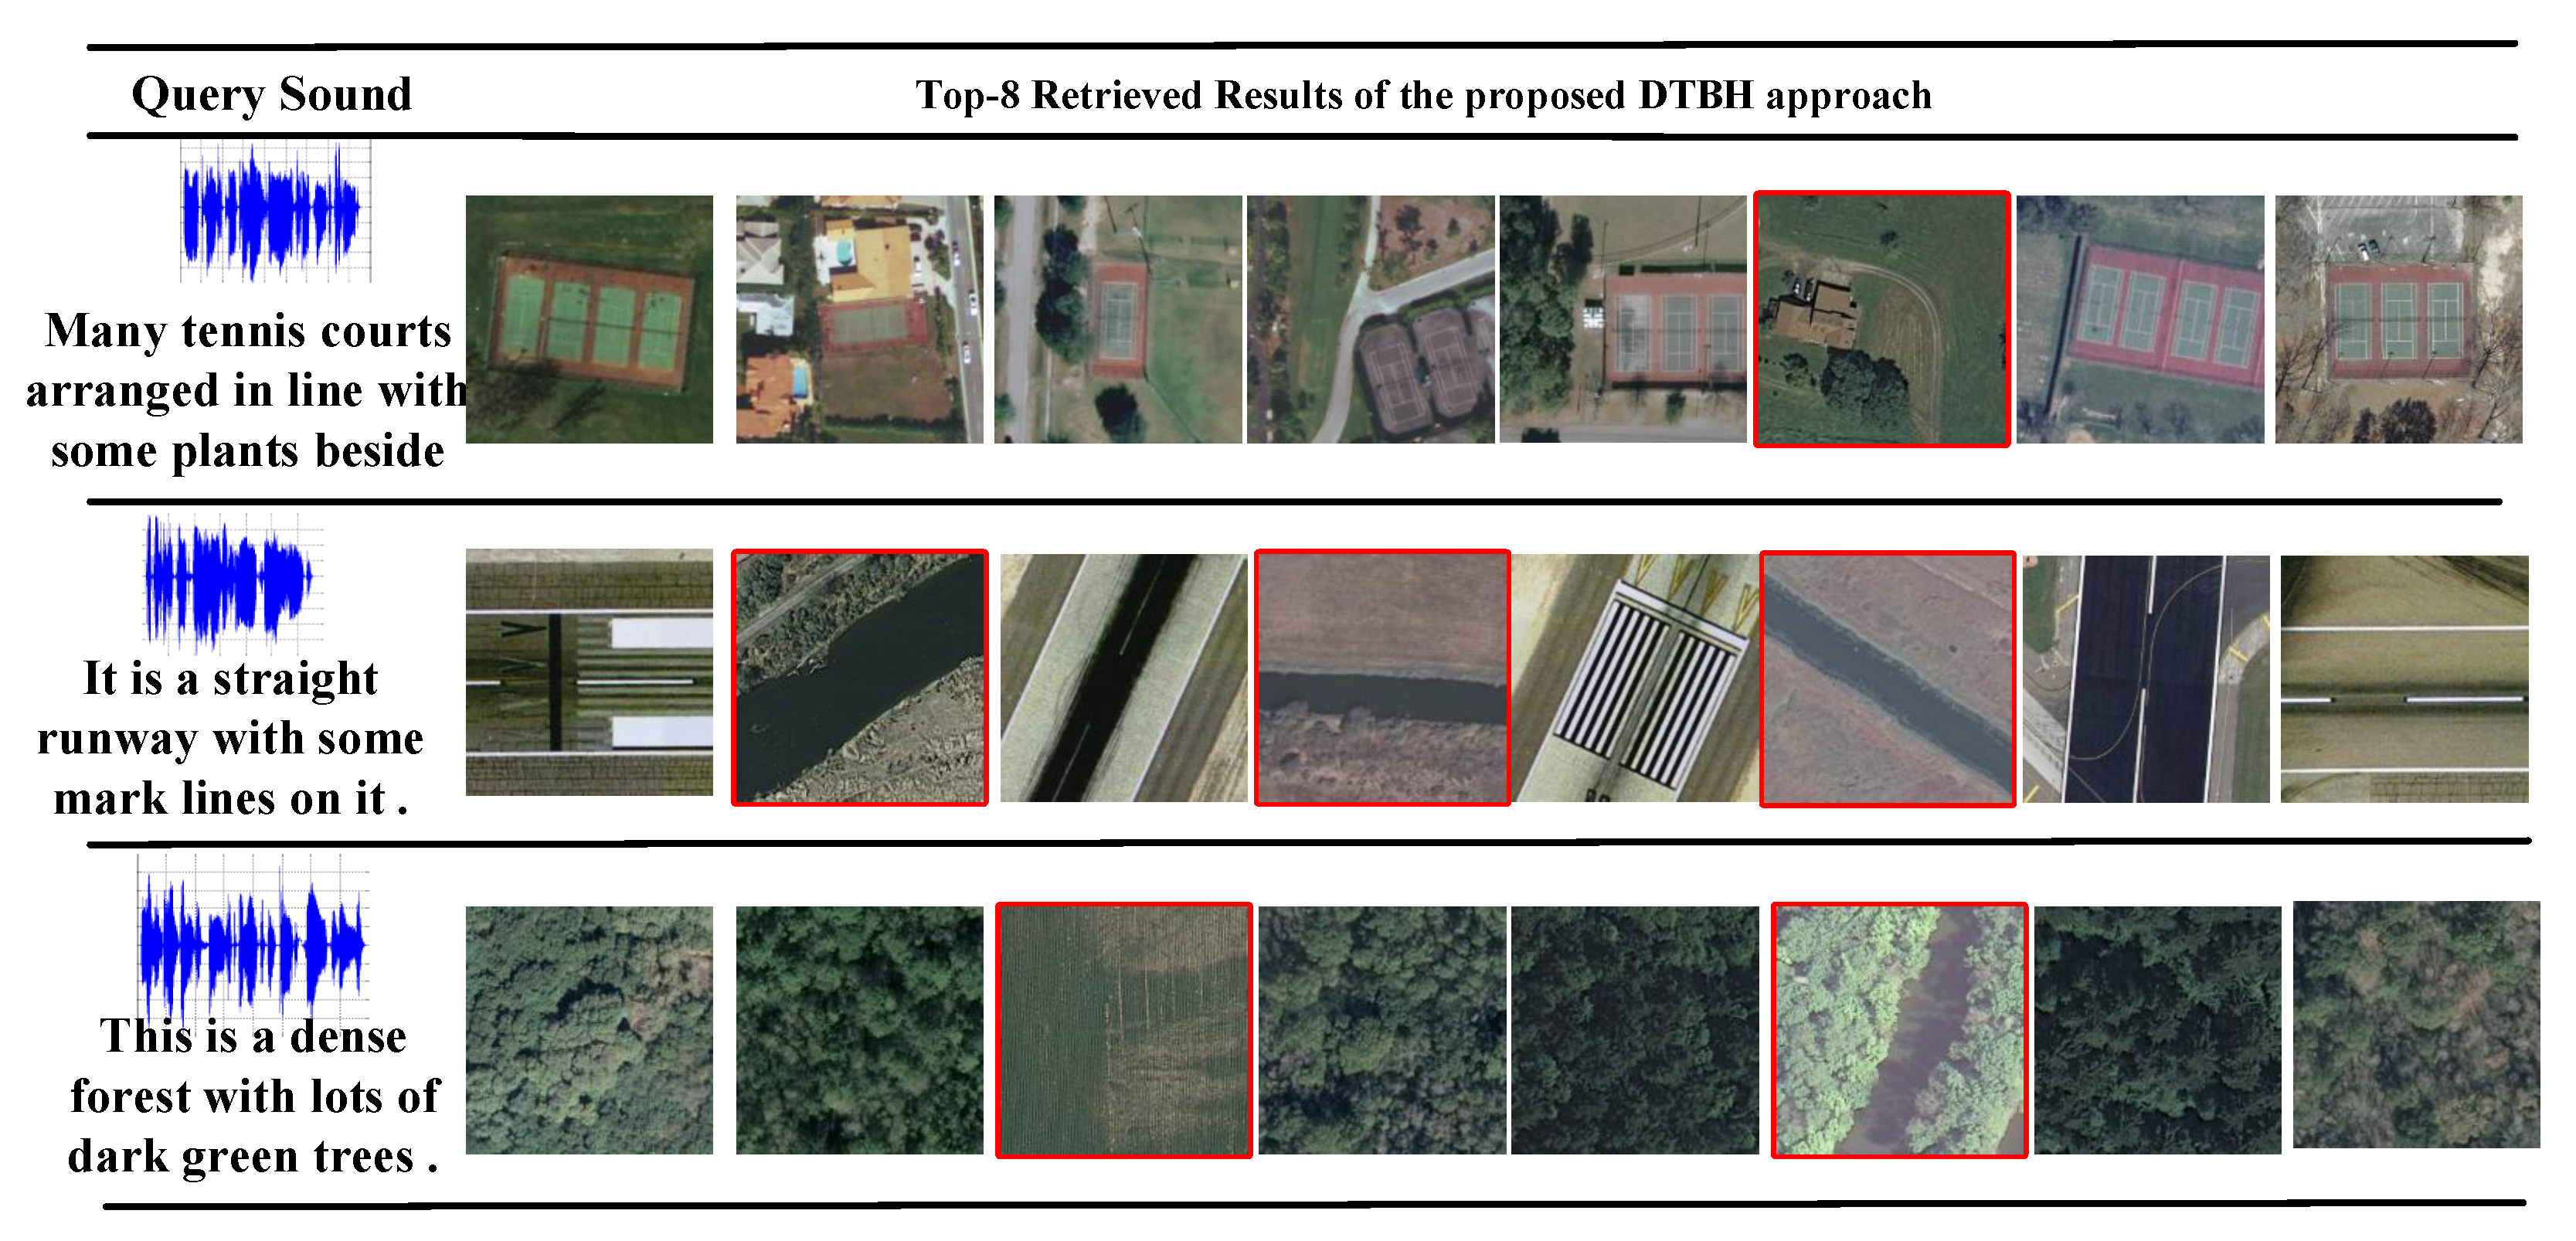
(1) Results on UCM:Table 4 shows the performance comparison between the proposed DTBH method and other compared methods on UCM dataset by using sound to retrieve RS image. Table 5 shows the performance comparison between the proposed DTBH method and other compared methods on UCM dataset by using RS images to retrieve sounds. Figure 6 shows precision curves with different samples retrieved by using sounds to retrieve RS images on UCM dataset. Figure 7 shows precision curves with different samples retrieved by using RS images to retrieve sounds on UCM dataset. We can obviously see that: (1) Although these methods have yielded good results, the proposed DTBH method can achieve the highest value in terms of mean average precision, the highest precision for the top sample retrieved, the highest precision for the top five samples retrieved, and the highest precision for the top 10 samples retrieved. Figure 8 shows the top eight retrieval results of the proposed DTBH approach on UCM dataset by utilizing RS images to retrieve voices. Figure 9 shows the top eight retrieval results of the proposed DTBH approach on UCM dataset by utilizing voices to retrieve RS images. (2) It can be clearly seen from Figure 6 and Figure 7 that the proposed DTBH method can outperform the other methods at all returned neighbors. (3) For I→S, the proposed DTBH method improved the MAP from SIFT+M (8.55%), DBLP (25.48%), CNN+SPEC (26.25%), DVAN (36.79%), DTBH-D (53.24%), and DTBH-R (61.84%) to 64.27%. Furthermore, for S→I, the proposed DTBH method improved the MAP from SIFT+M (6.66%), DBLP (19.33%), CNN+SPEC (21.79%), DVAN (32.28%), DTBH-D (48.88%), and DTBH-R (56.91%) to 60.13%. This is because the proposed DTBH method not only leverages triplet selection strategy to mine effective triplets, but also exploits deep feature similarity and a triplet regularized term to learn the similarity of hash codes.
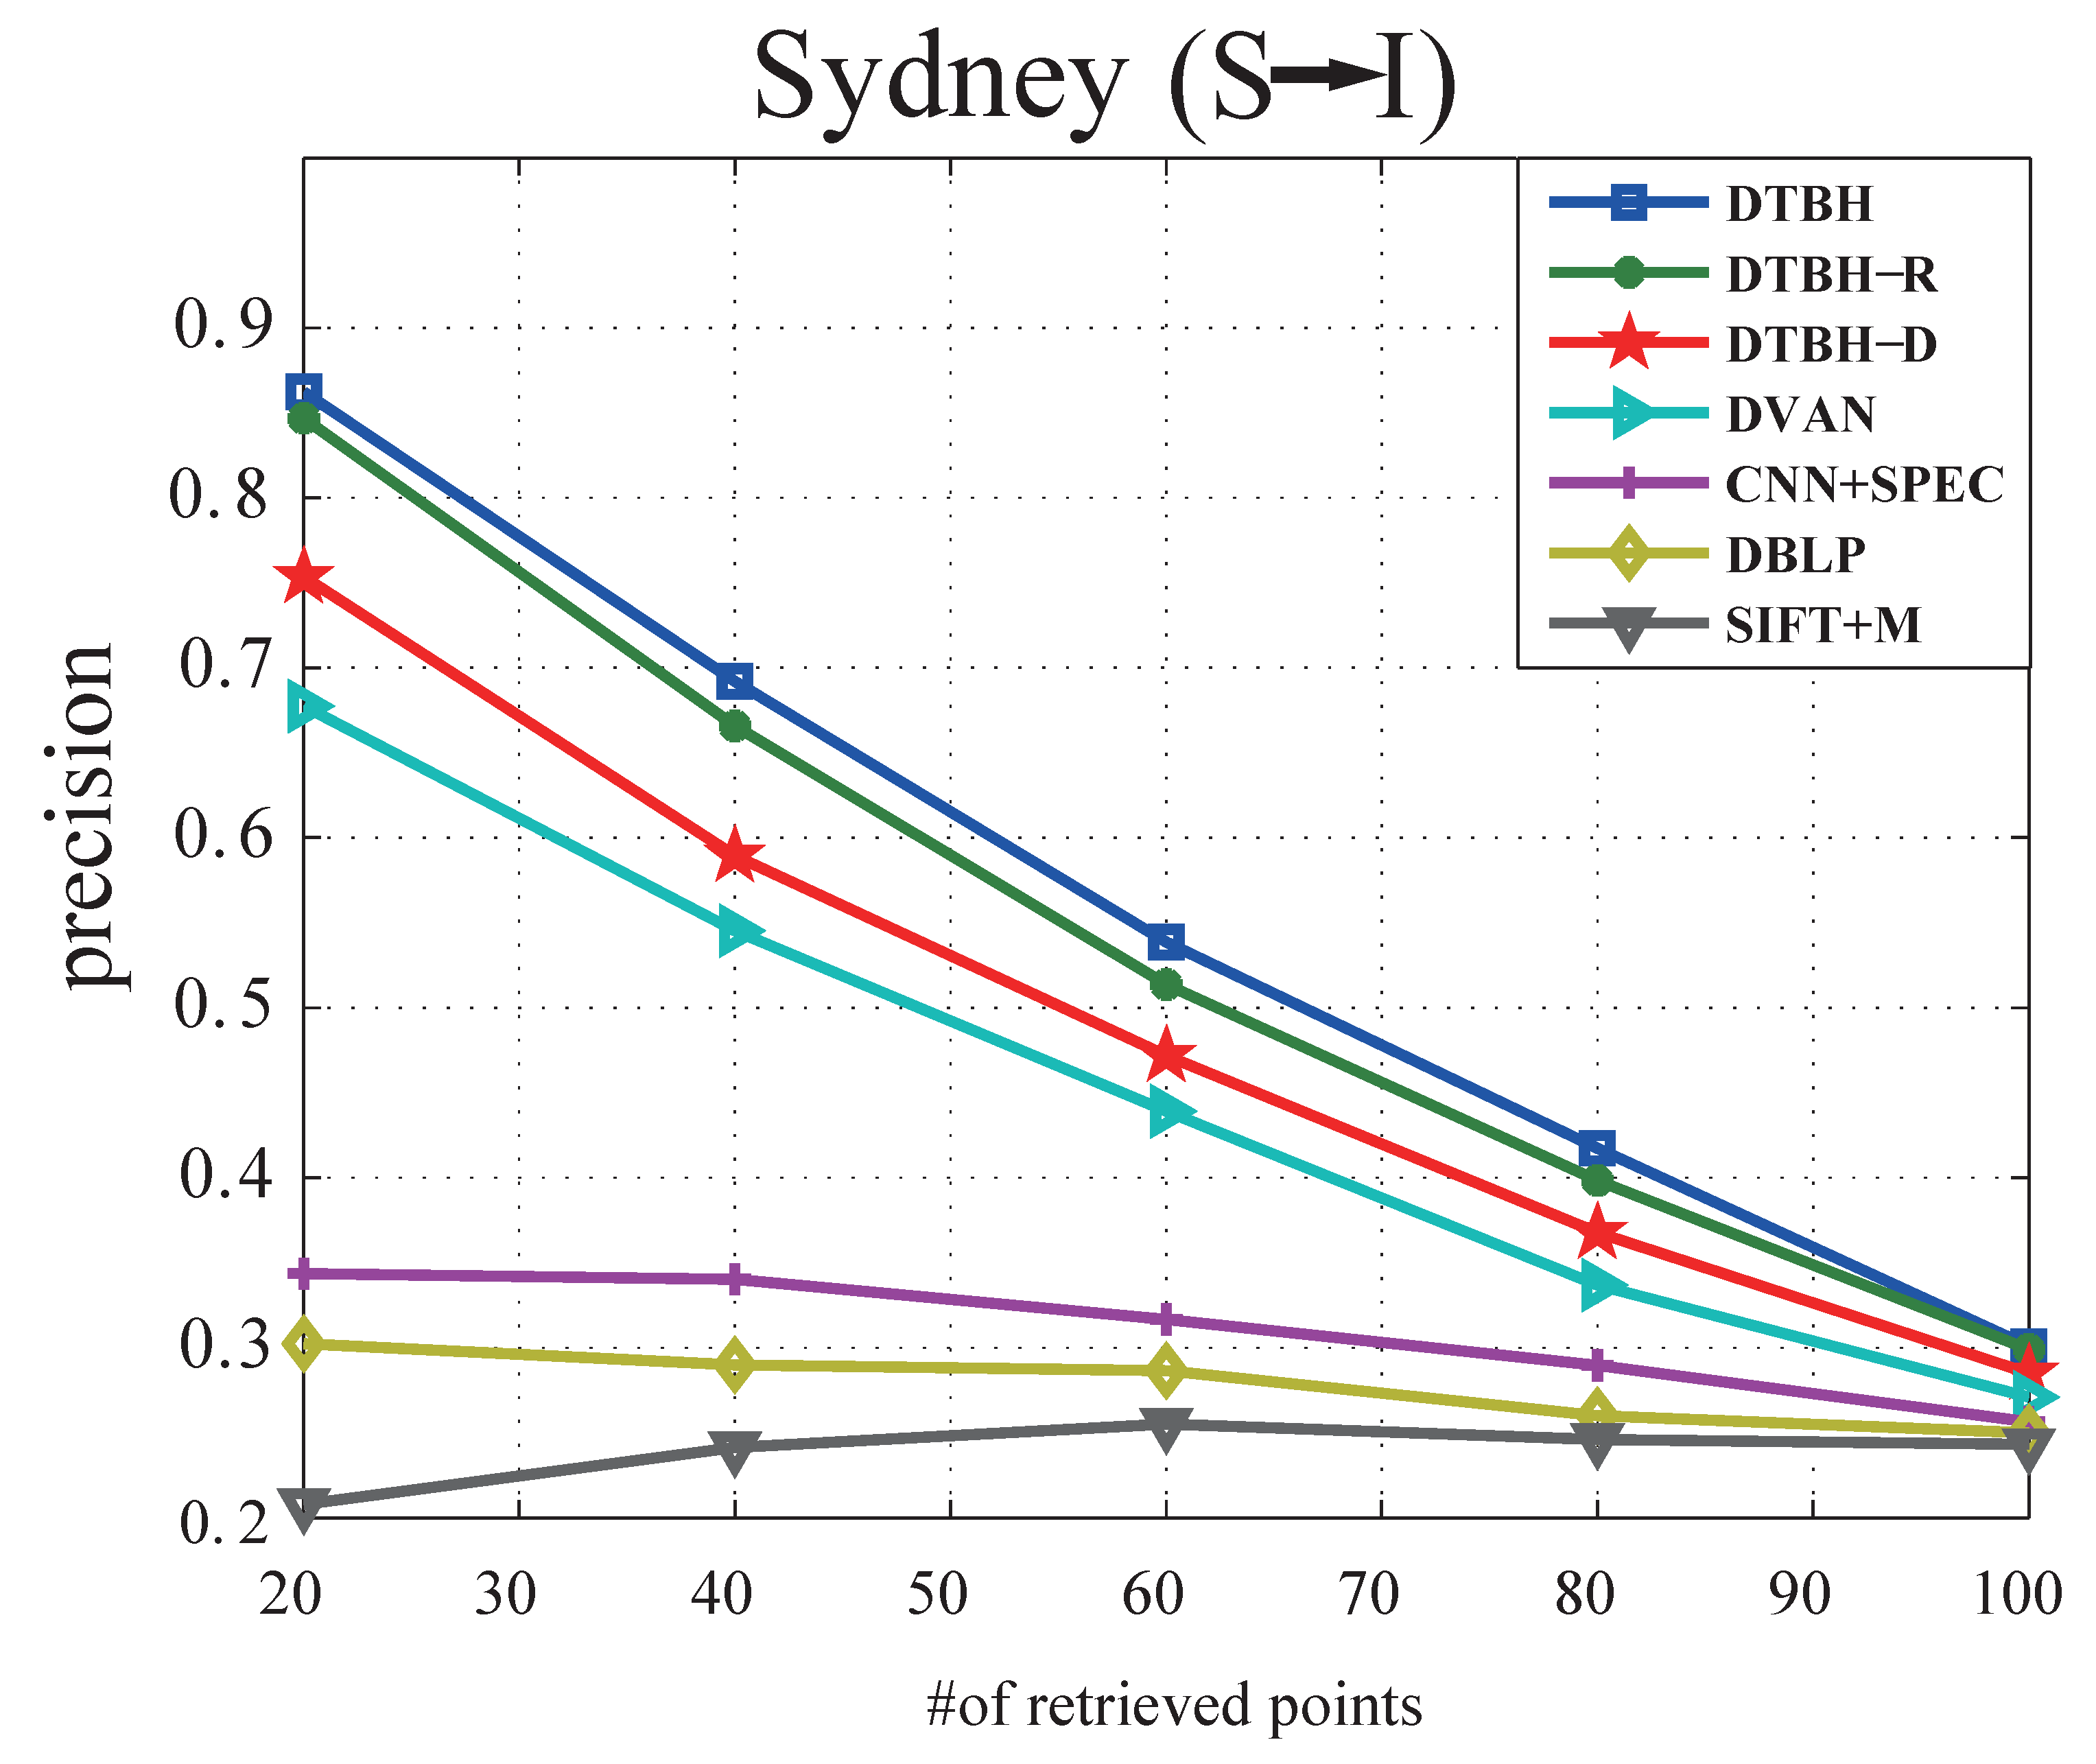
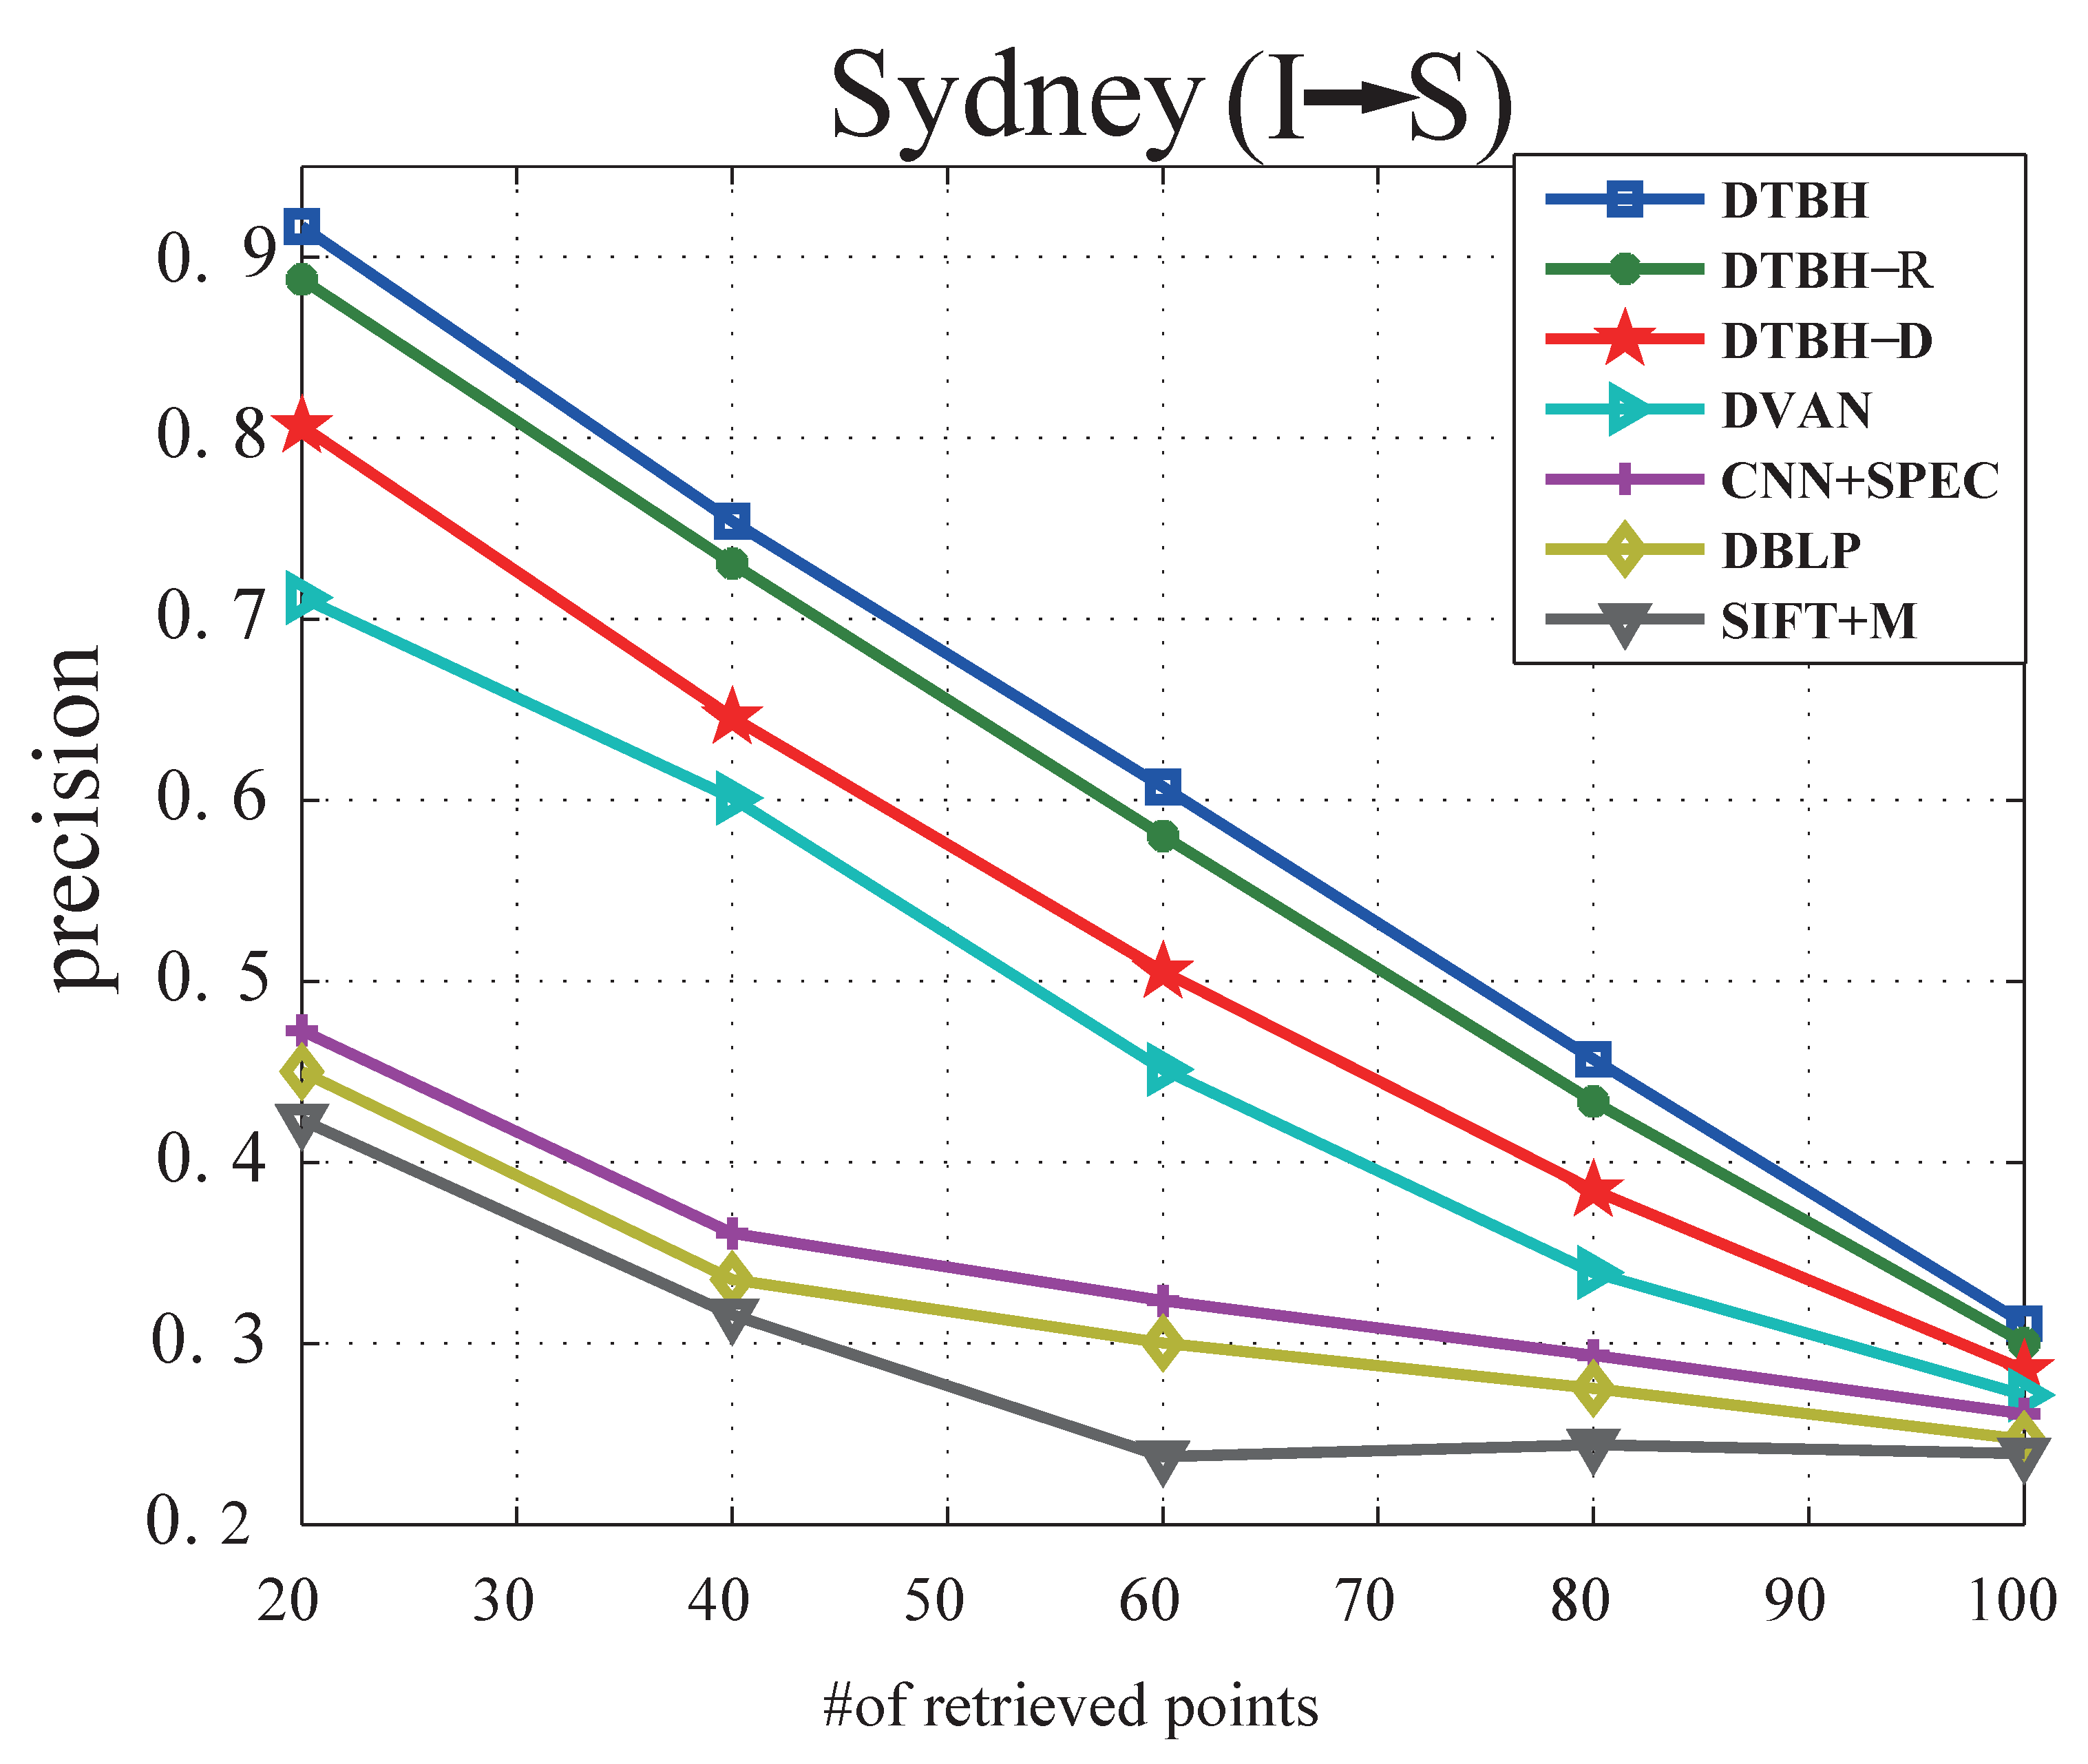
(2) Results on Sydney:Table 6 shows the performance comparison between the proposed DTBH method and other methods on the Sydney dataset by using sounds to retrieve RS images. Table 7 shows the performance comparison between the proposed DTBH method and other methods on Sydney dataset by using RS images to retrieve sounds. Precision curves with different samples retrieved by using sounds to retrieve RS images and precision curves with different samples retrieved by using RS images to retrieve sounds are shown in Figure 10 and Figure 11, respectively. Similar experimental results can be clearly seen on UCM dataset. For example, for I→S, the proposed DTBH method improved the MAP from SIFT+M (31.67%), DBLP (44.38%), CNN+SPEC (46.67%), DVAN (71.77%), DTBH-D(81.23%), and DTBH-R(89.64%) to 92.45%. Furthermore, for S→I, the proposed DTBH method improved the MAP from SIFT+M (26.5%), DBLP (34.87%), CNN+SPEC (35.72%), DVAN (63.88%), DTBH-D(76.53%), and DTBH-R(85.46%) to 87.49%. The proposed DTBH method achieves the highest precision in all the evaluation metrics, which demonstrates the effectiveness of cross-modal similarity learning by utilizing deep feature similarity, triplet selection strategy, and triplet regularized term simultaneously.
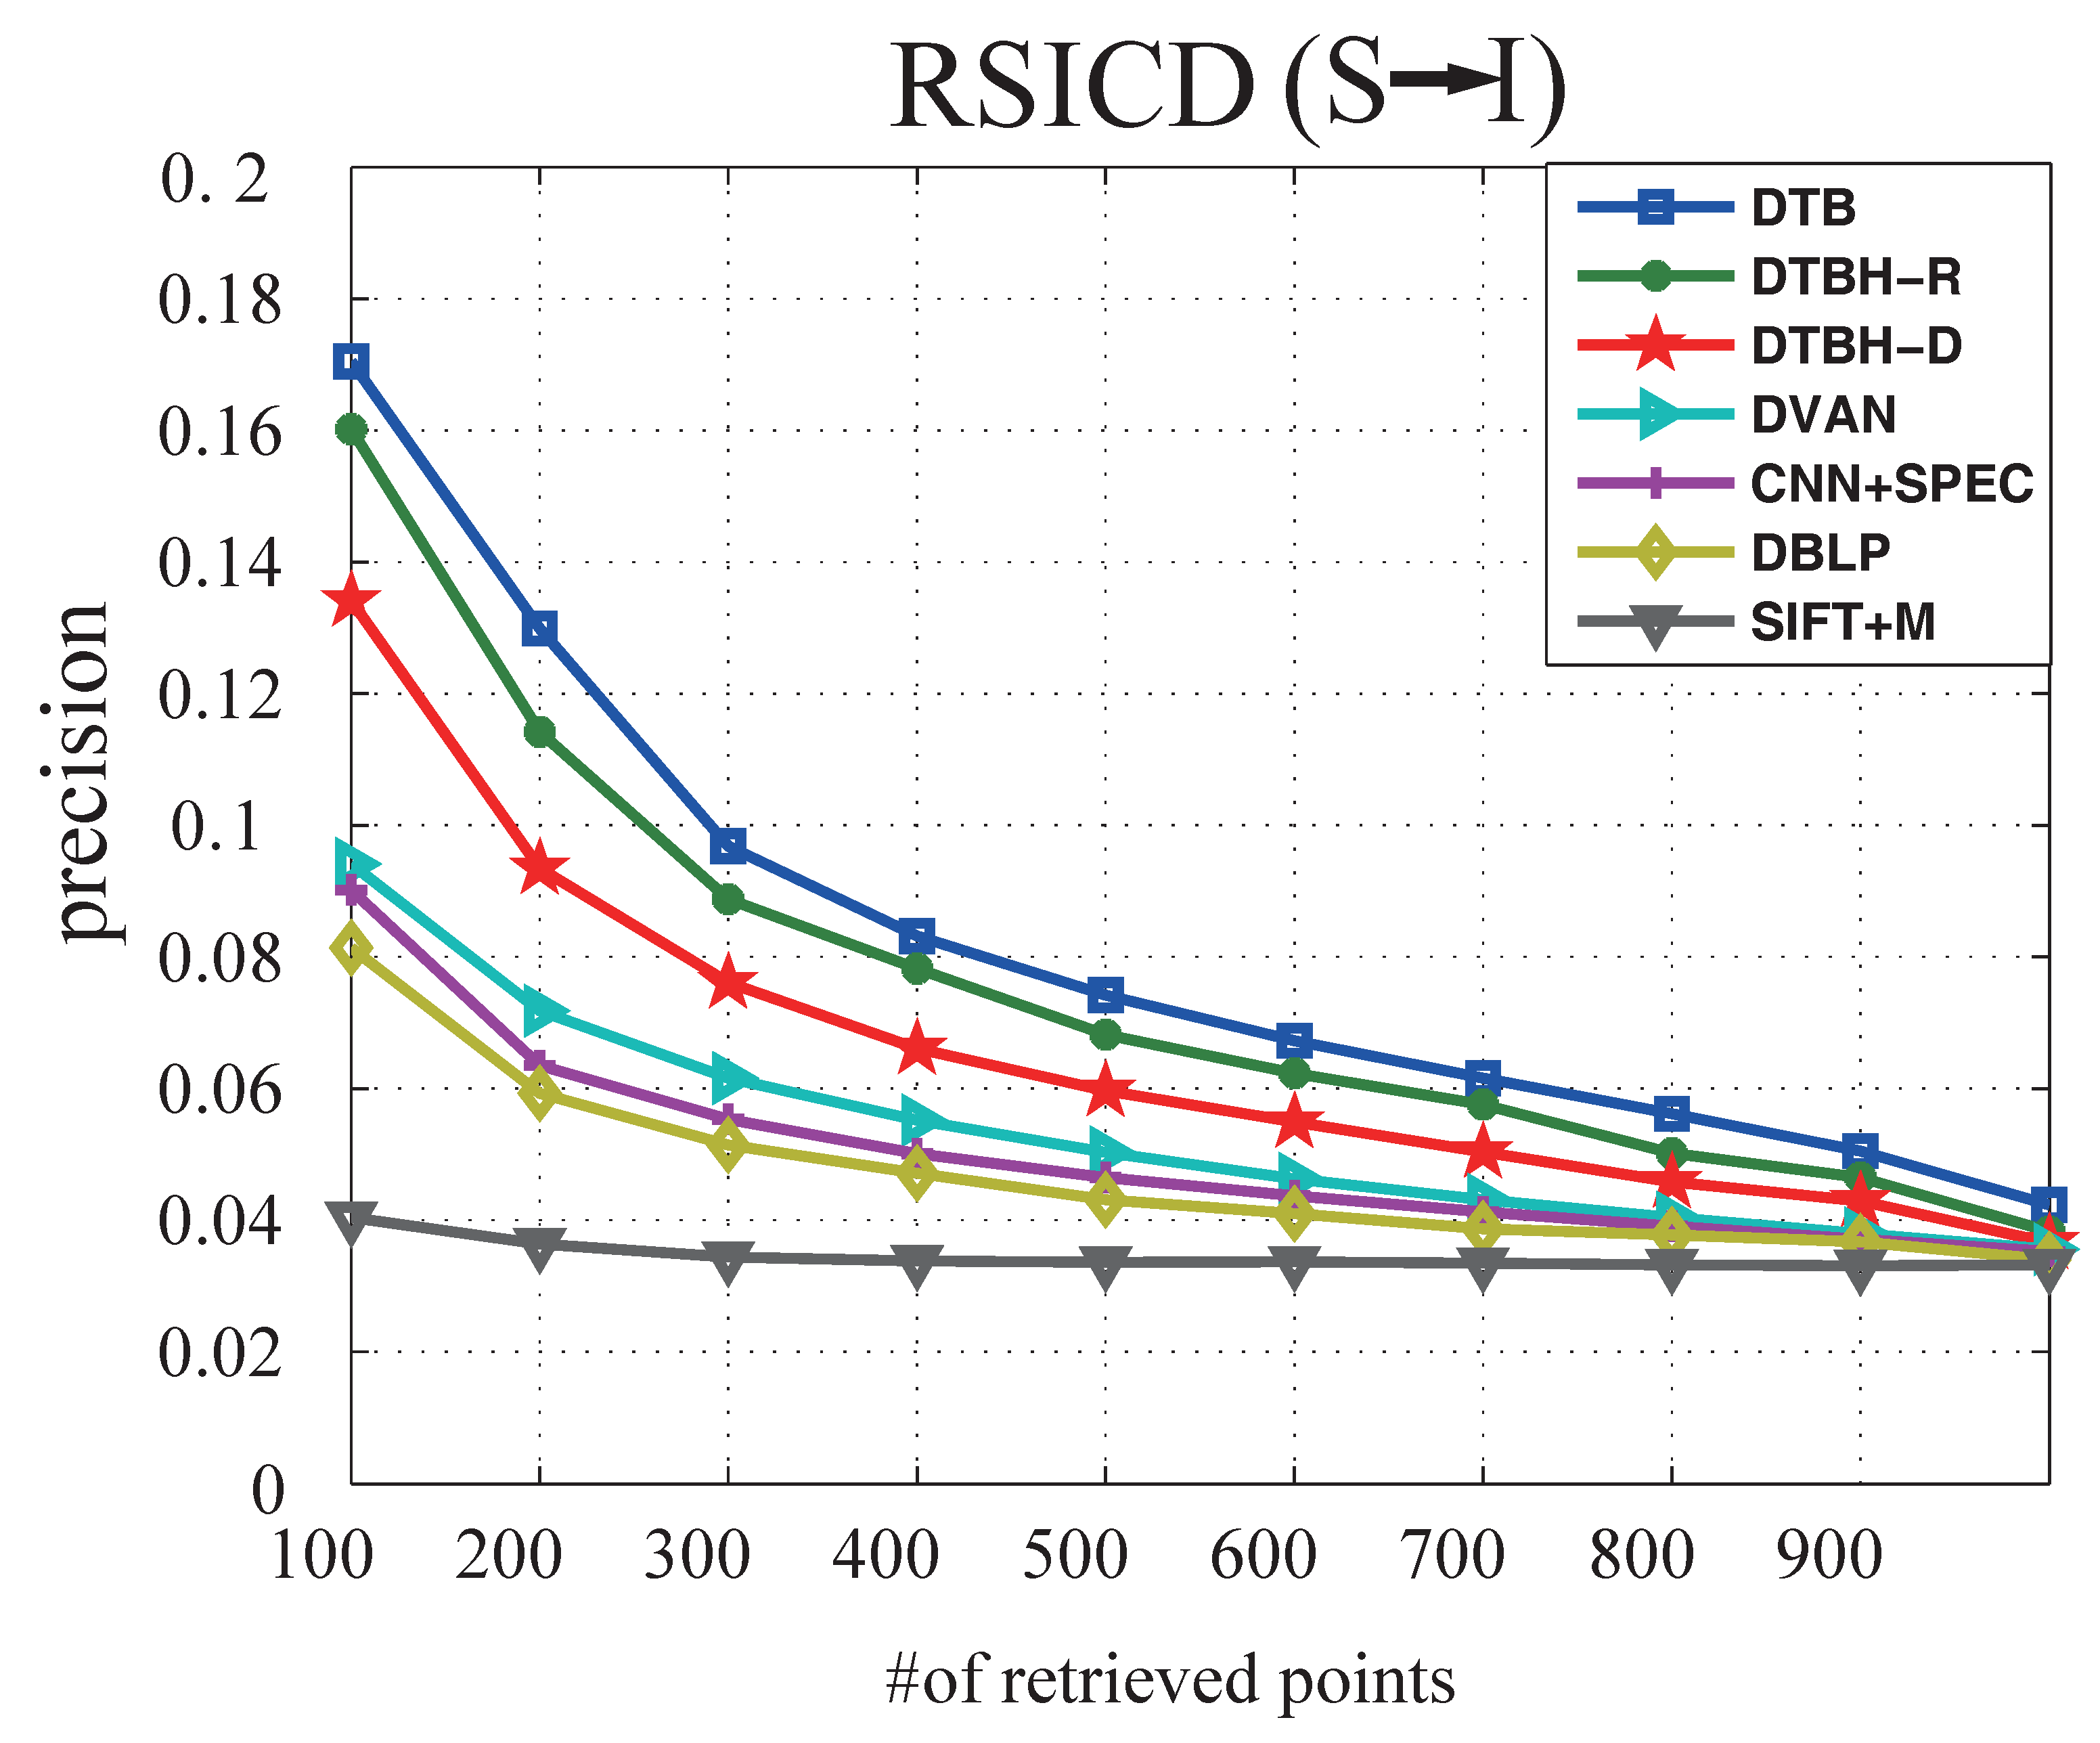
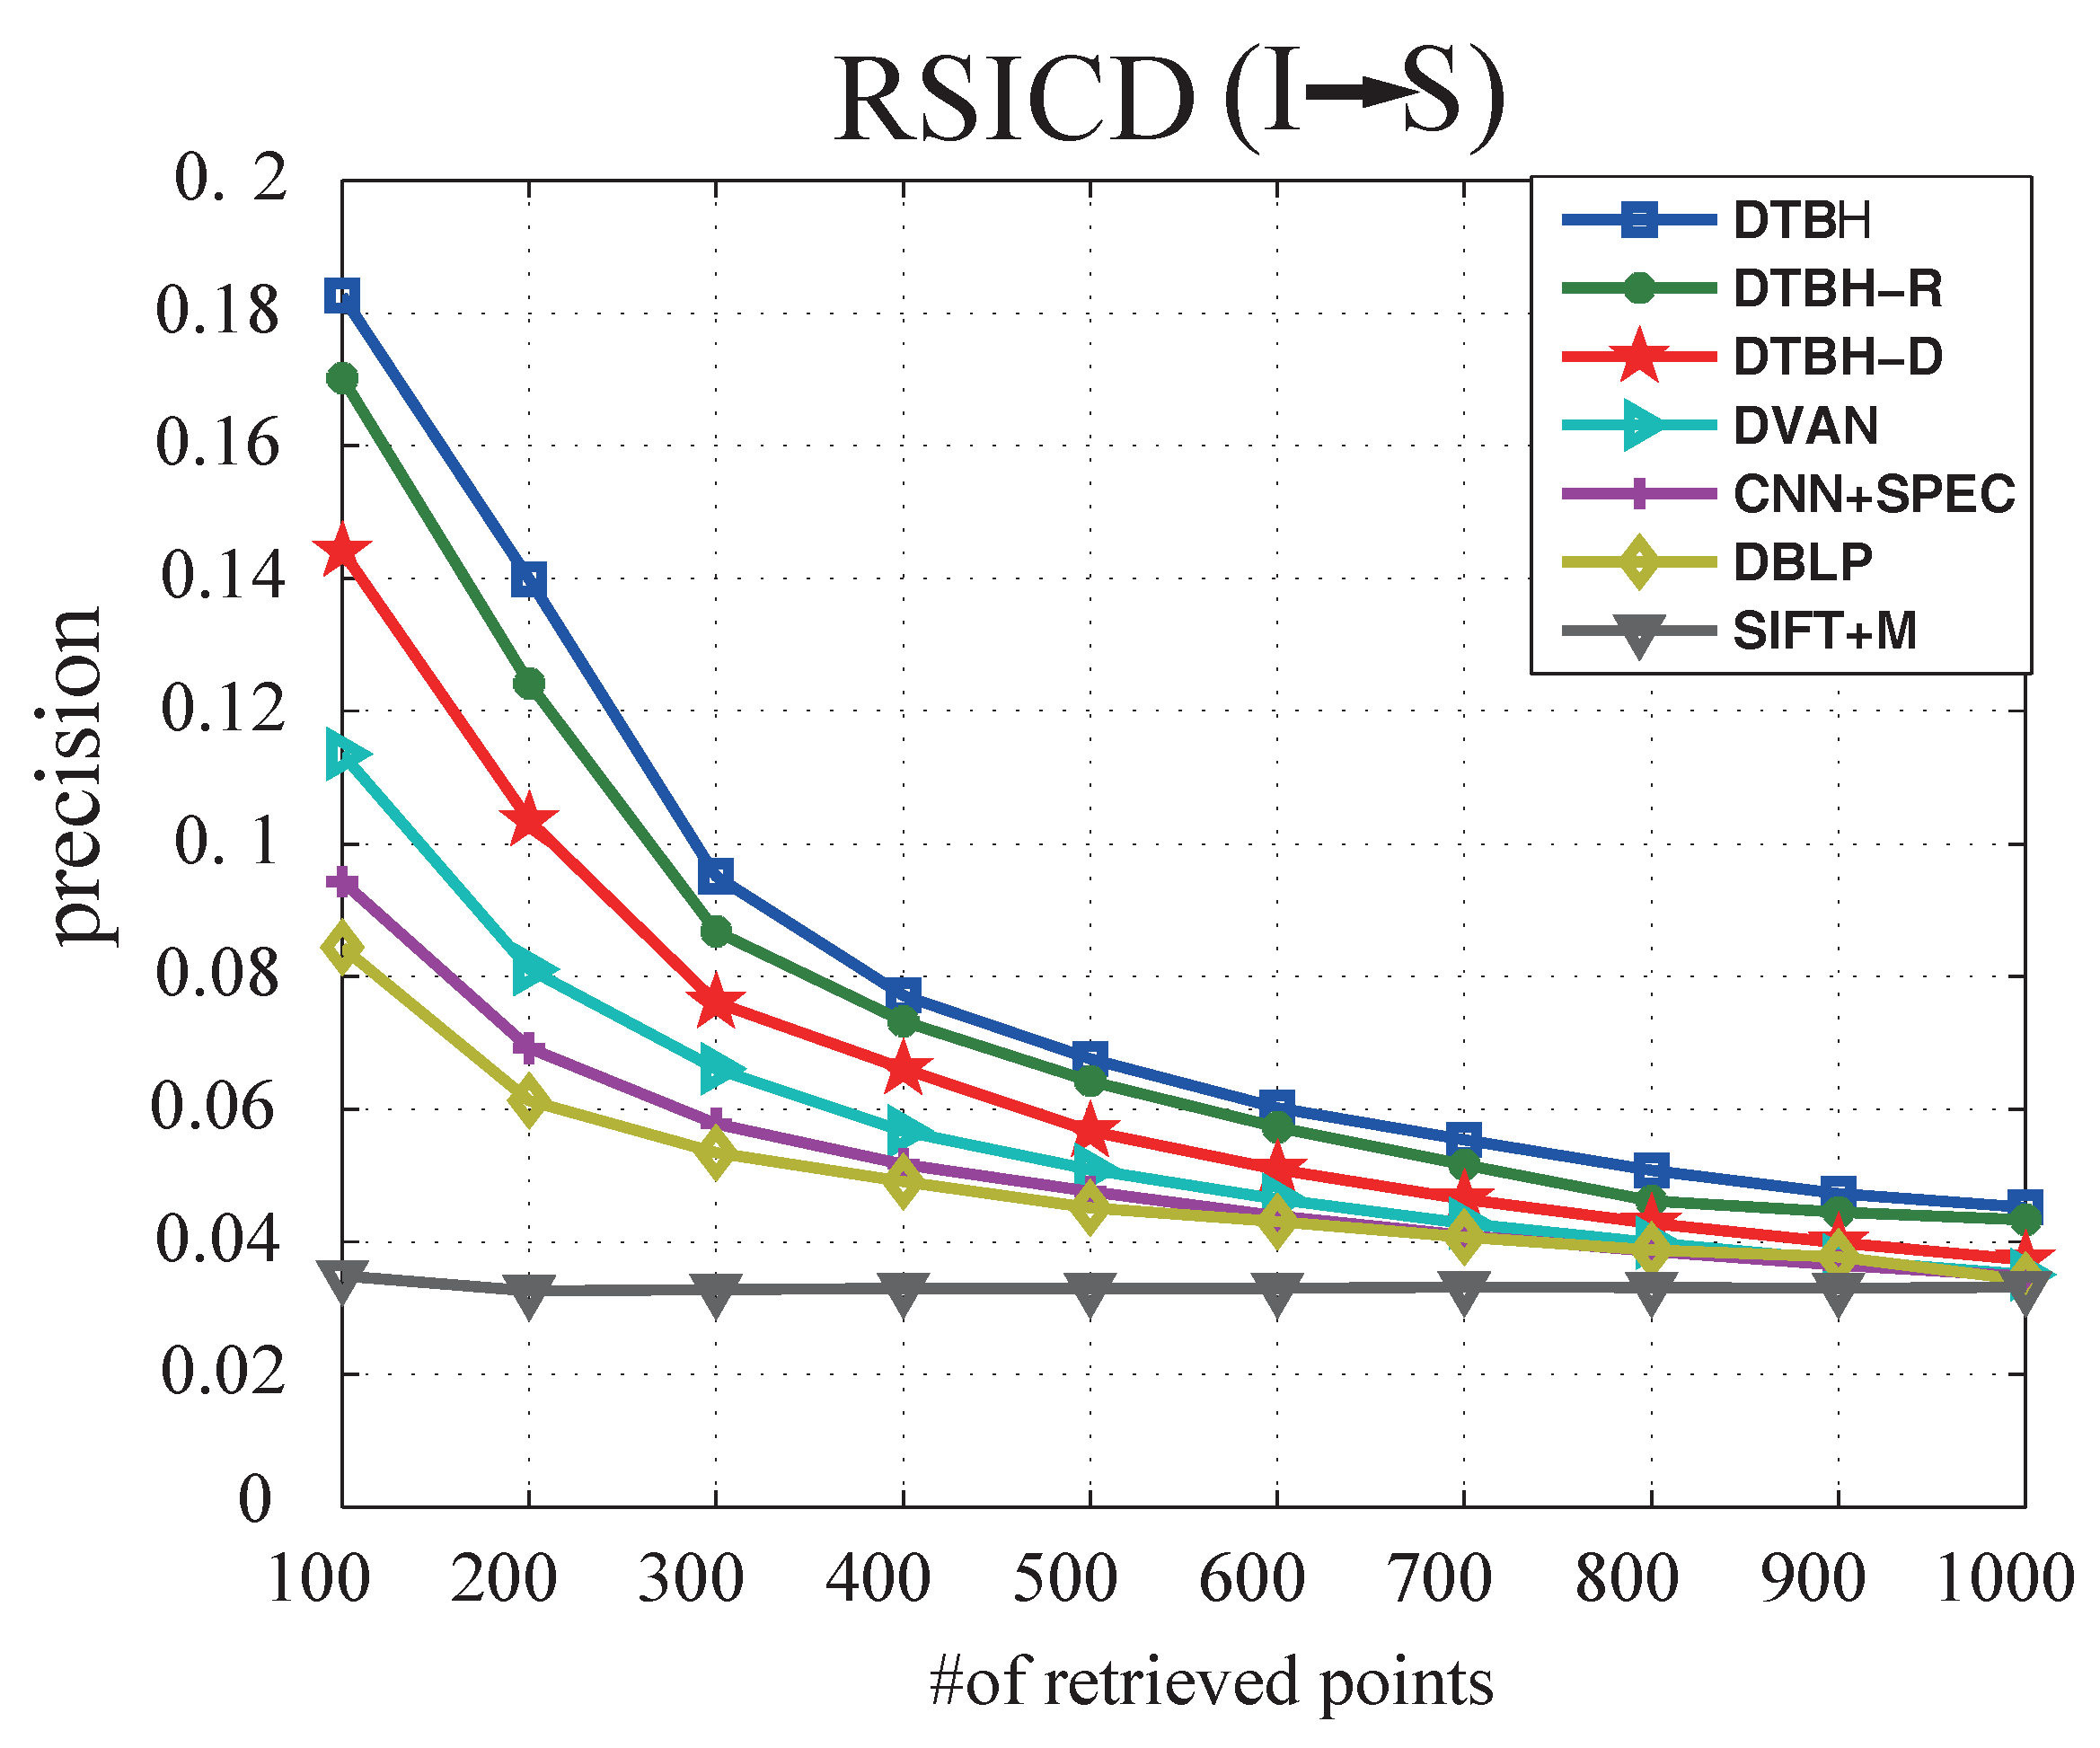
(3) Results on RSICD dataset: RSICD image-voice dataset consists of 10,921 RS image-sound pairs—making it more complex and challenging than the other two datasets. Table 8 shows the performance comparison between the proposed DTBH method and other methods on the RSICD dataset by using sounds to retrieve RS images. Table 9 shows the performance comparison between the proposed DTBH method and compared methods on the RSICD dataset by using RS image to retrieve sound. Figure 12 shows precision curves with different samples retrieved by using sounds to retrieve RS images. Figure 13 shows precision curves with different samples retrieved by using RS images to retrieve sounds from the RSICD dataset. The proposed DTBH method achieved highest Precision@1, Precision@5, Precision@10, and MAP results, which further demonstrates the effectiveness of the DTBH method.
3.5. Parameter Discussion
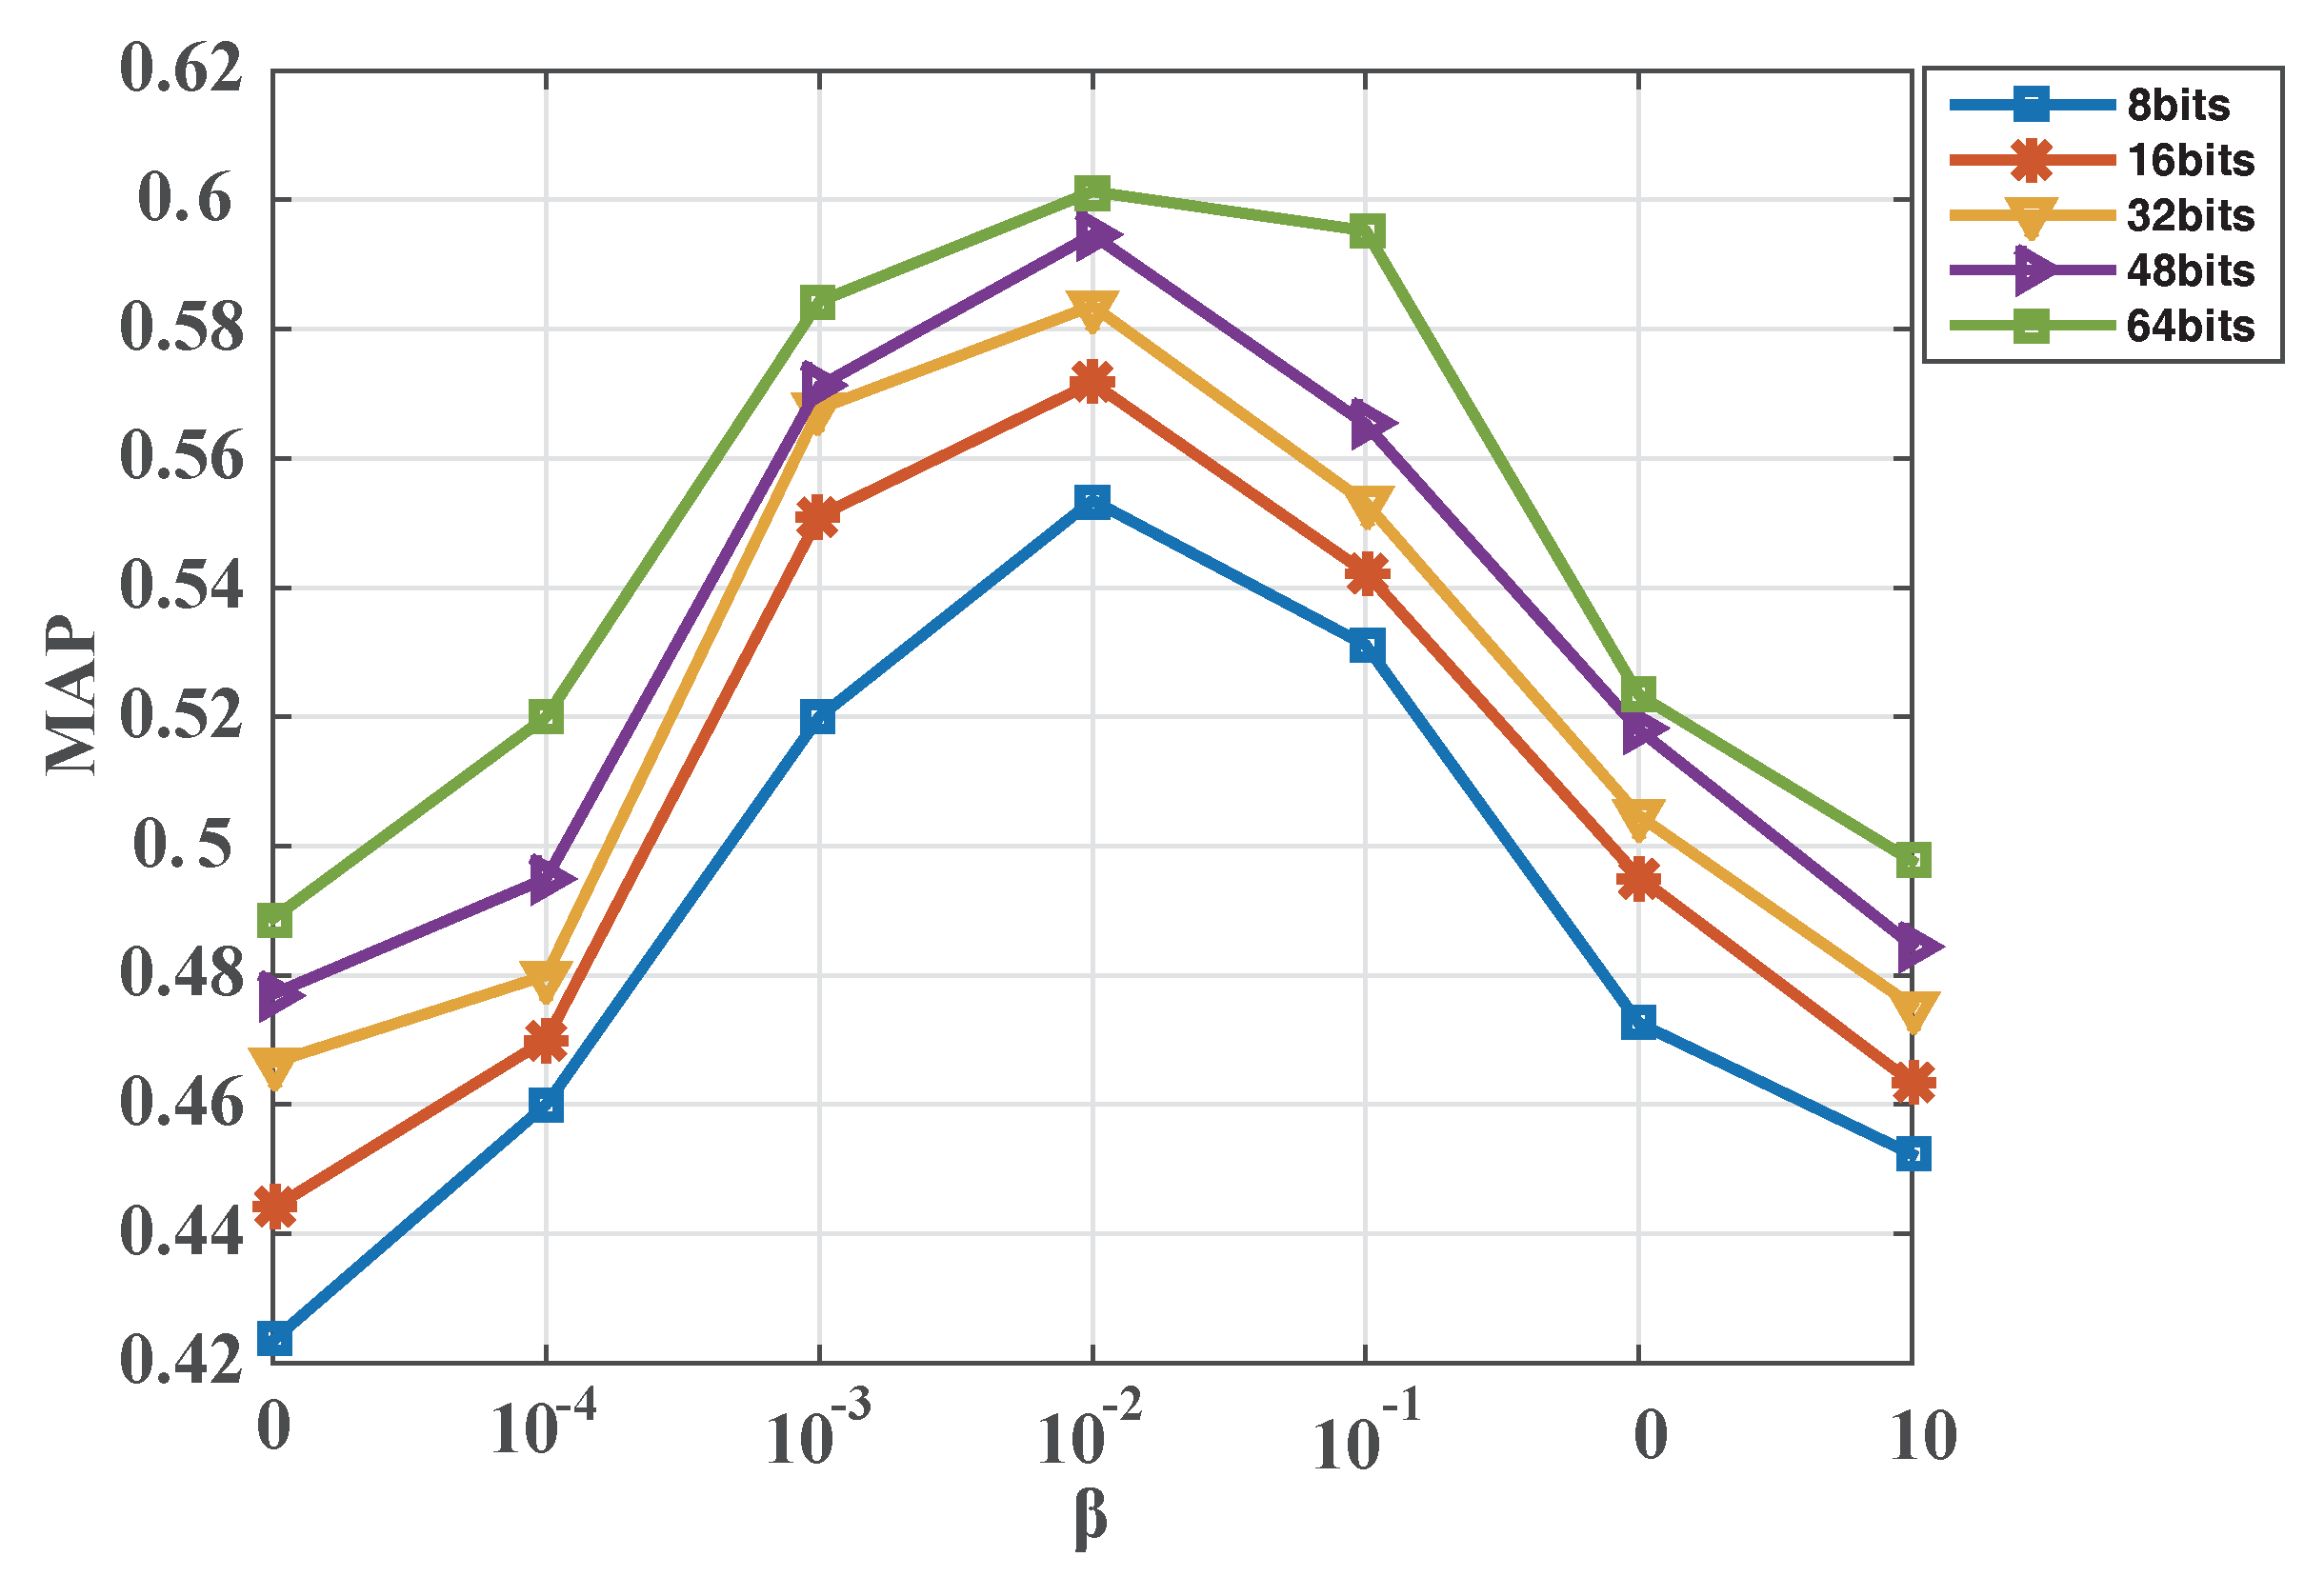
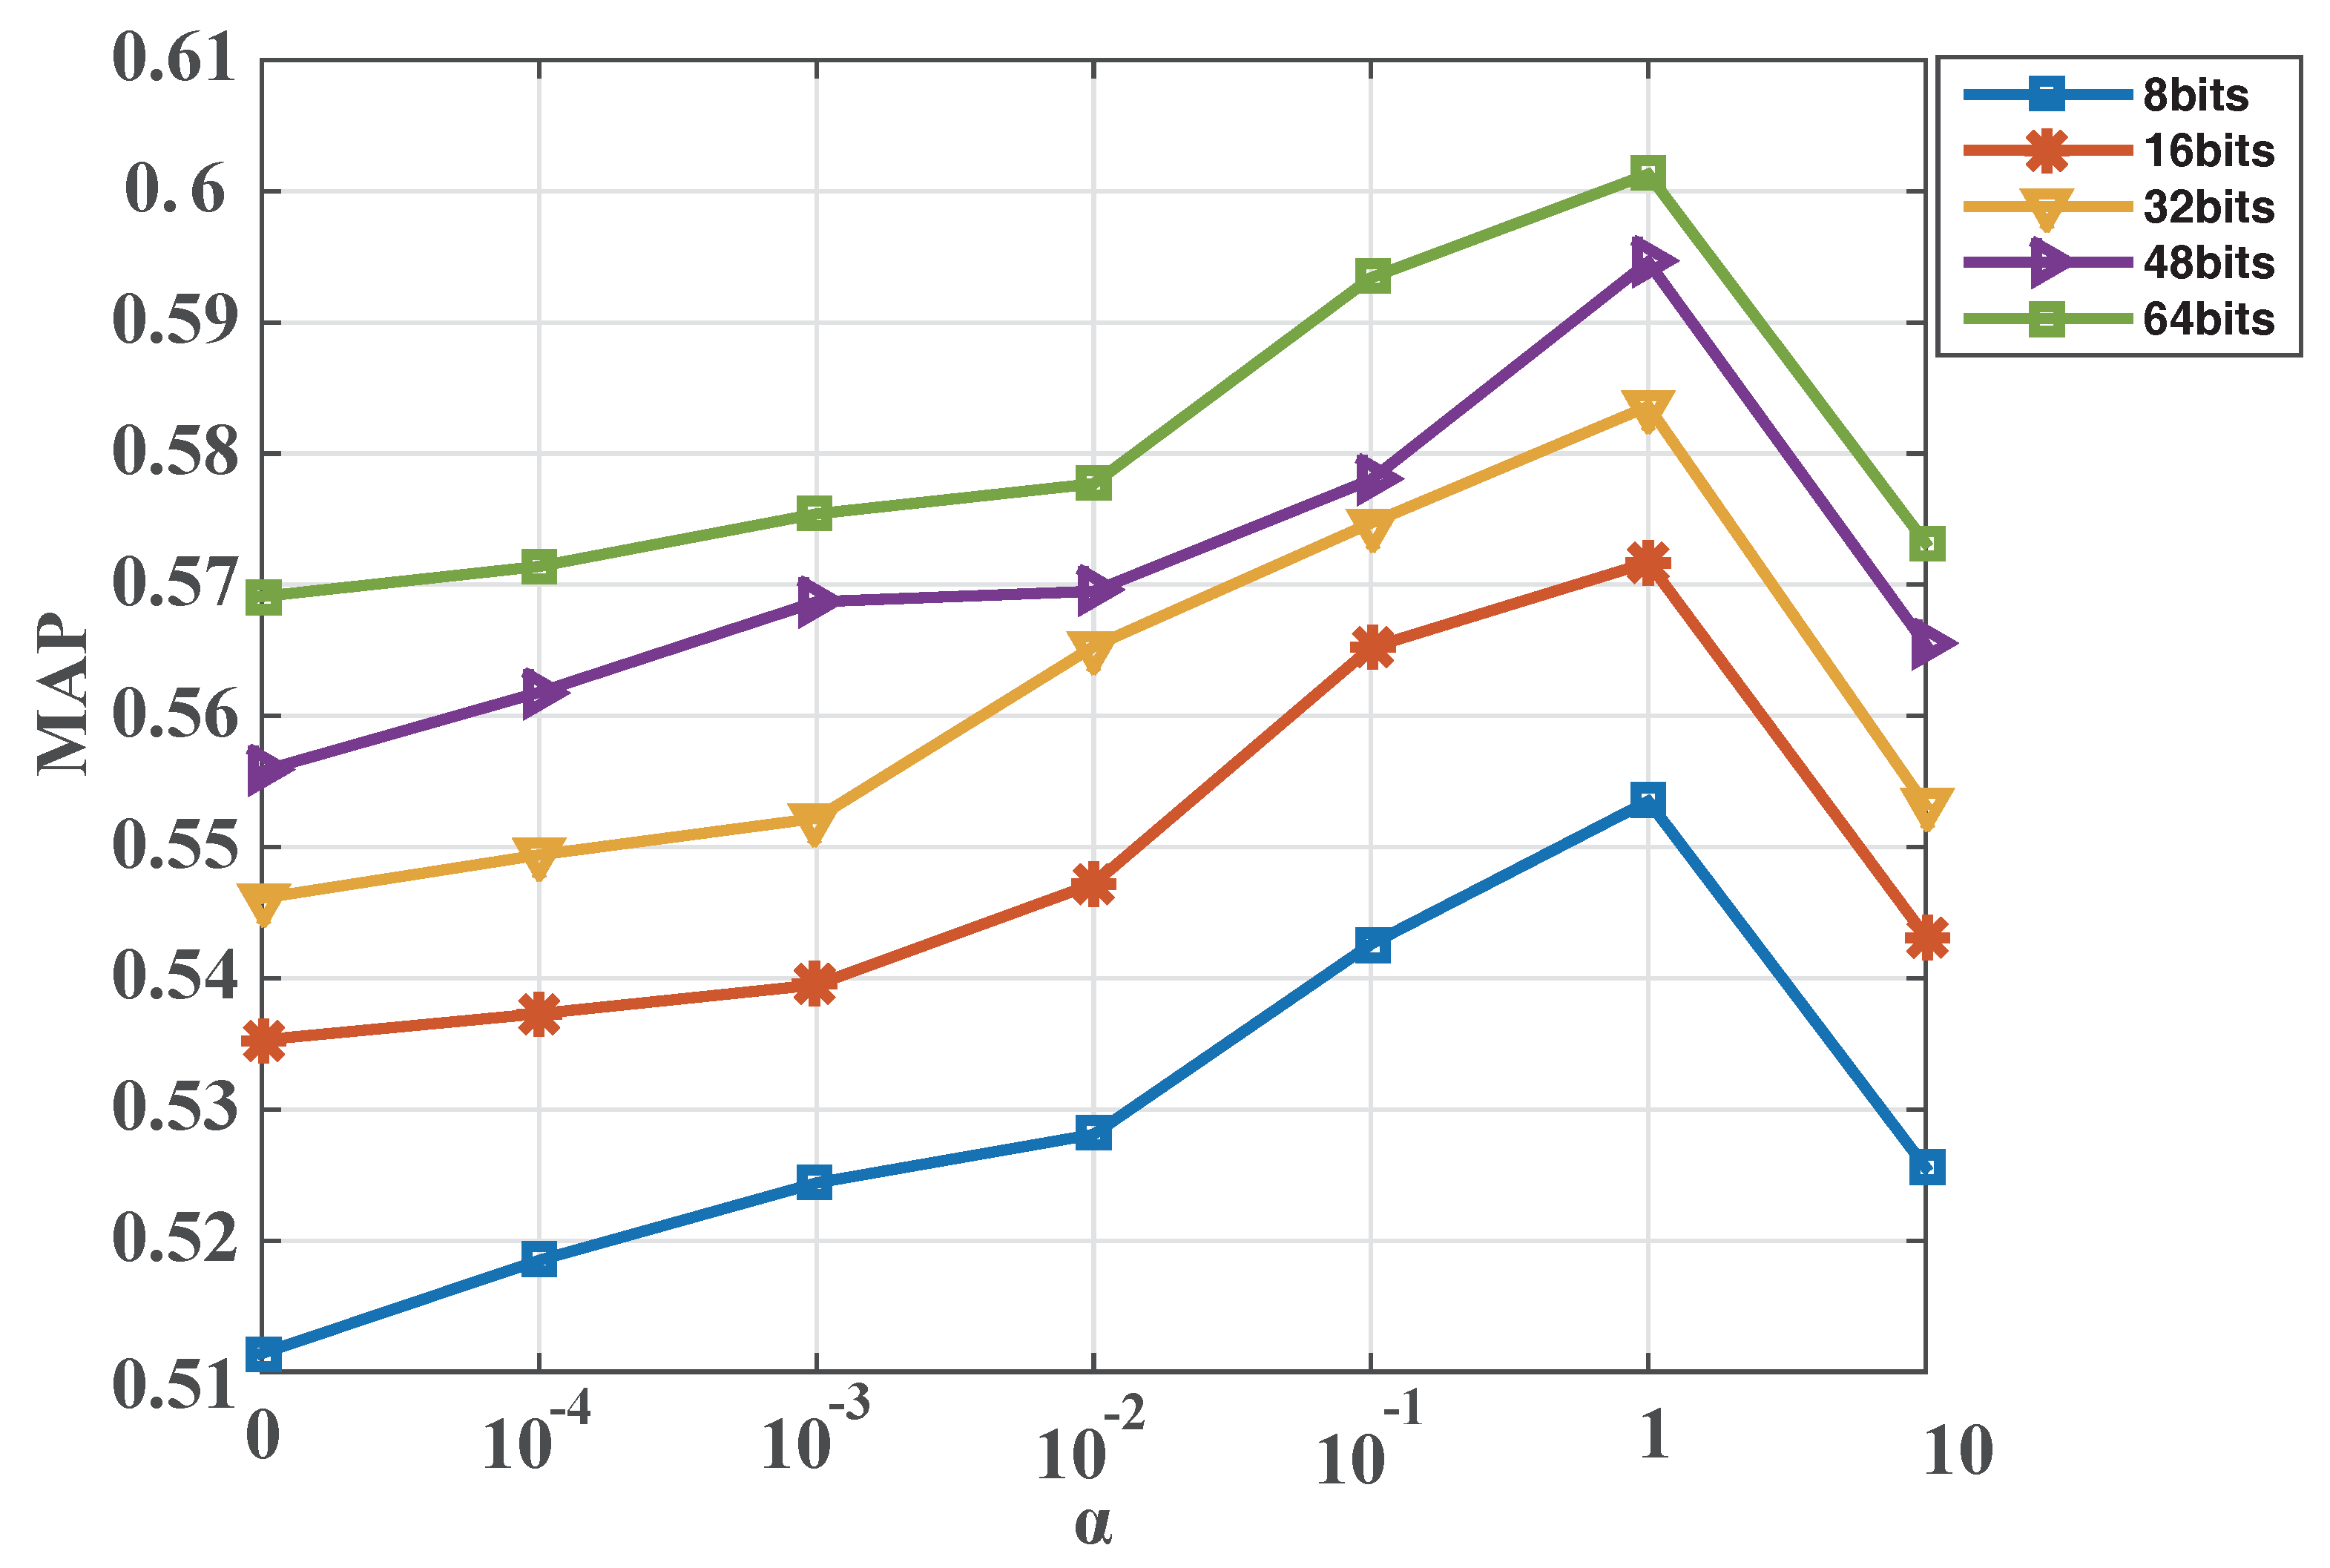
To implement parameter discussion for the proposed DTBH method, we performed experiments regarding the two parameters and of Equation (18) on the UCM dataset. First, we set the parameter to 1. The parameter changed form 0 to 10. Figure 14 shows MAP variations with the parameter for different hash bits on the UCM dataset by utilizing voices to retrieve RS images. It can be seen from Figure 14 that the proposed DTBH approach can achieve the best MAP when the parameter = 0.01. Second, the parameter is fixed to 0.01. The parameter changes form 0 to 10. Figure 15 shows MAP variations with the parameter for different hash bits on the UCM dataset by utilizing sound to retrieve RS images. It is observed from Figure 15 that the proposed DTBH approach can achieve the best MAP when the parameter = 1. Hence, the parameter and the parameter were set to 1 and 0.01, respectively.
4. Conclusions
In this paper, we proposed a novel deep triplet-based hashing (DTBH) approach, which leverages deep feature similarity and the triplet selection strategy to guide hash codes learning in RS cross-modal image-sound retrieval. Specially, compared with high-dimensional real-valued features, hash codes can reduce storage costs. Firstly, we proposed a new triplet selection strategy, which can select effective triplets to capture the intra-class and inter-class variations for hash codes learning. Secondly, we proposed a novel objective function, which consists of the triplet similarity loss function, the triplet regularized loss function, and the deep feature triplet loss function. The triplet similarity loss function makes sure that that the anchor images are more similar to the positive sounds than the negative sounds. The deep feature triplet loss function ensures that the anchor deep features are more similar to the positive deep features than to the negative deep features. The triplet regularized loss function can reduce the information loss between hash-like codes and hash codes. Finally, for sound query RS image task, the proposed approach can achieve a mean average precision up to 60.13% on the UCM dataset, 87.49% on the Sydney dataset, and 22.72% on the RSICD dataset. For RS image query sound task, the proposed approach can achieve a mean average precision up to 64.27% on the UCM dataset, 92.45% on the Sydney dataset, and 23.46% on the RSICD dataset. Moreover, extensive experimental results on UCM, Sydney, and RSICD datasets show that the DTBH method can achieve better performance than other state-of-the-art cross-modal image-sound retrieval methods. Future work can be divided into two main aspects. First, we plan to exploit DTBH in other applications, such as cross-modal biometric matching, to demonstrate its extensive effectiveness. Second, we will focus on how to combine the balanced property of hash codes to improve image–sound retrieval performance.
Author Contributions
Y.C. and X.L. made contributions to proposing the method, doing the experiments, and analyzing the results. Y.C. and X.L. were involved in the preparation and revision of the manuscript. All authors have read and agreed to the published version of the manuscript.
Funding
This work was supported in part by the China National Funds for Distinguished Young Scientists under Grant 61925112; in part by the National Natural Science Foundation of China under grant 61772510 and 61702498; in part by the Key Research Program of Frontier Sciences, Chinese Academy of Sciences (CAS) under grant QYZDY-SSW-JSC044; in part by the Young Top-notch Talent Program of Chinese Academy of Sciences under grant QYZDB-SSW-JSC015; in part by the National Key R&D Program of China under grant 2017YFB0502900; and in part by the CAS “Light of West China” Program under grant XAB2017B15.
Acknowledgments
The authors would like to show their gratitude to the editors and the anonymous reviewers for their comments and suggestions.
Conflicts of Interest
The authors declare no conflict of interest.
References
- Ma, Y.; Wu, H.; Wang, L.; Huang, B.; Ranjan, R.; Zomaya, A.Y.; Jie, W. Remote Sensing Big Data Computing: Challenges and Opportunities. Future Gener. Comput. Syst. 2015, 51, 47–60. [Google Scholar] [CrossRef]
- Mandal, D.; Chaudhury, K.N.; Biswas, S. Generalized semantic preserving hashing for n-label cross-modal retrieval. In Proceedings of the IEEE Conference on Computer Vision and Pattern Recognition, Honolulu, HI, USA, 21–26 July 2017; pp. 4076–4084. [Google Scholar]
- Scott, G.J.; Klaric, M.N.; Davis, C.H.; Shyu, C.R. Entropy-Balanced Bitmap Tree for Shape-Based Object Retrieval From Large-Scale Satellite Imagery Databases. IEEE Trans. Geosci. Remote Sens. 2011, 49, 1603–1616. [Google Scholar] [CrossRef]
- Demir, B.; Bruzzone, L. Hashing-Based Scalable Remote Sensing Image Search and Retrieval in Large Archives. IEEE Trans. Geosci. Remote Sens. 2016, 54, 892–904. [Google Scholar] [CrossRef]
- Peng, L.; Peng, R. Partial Randomness Hashing for Large-Scale Remote Sensing Image Retrieval. IEEE Geosci. Remote Sens. Lett. 2017, 14, 464–468. [Google Scholar]
- Li, Y.; Zhang, Y.; Xin, H.; Hu, Z.; Ma, J. Large-Scale Remote Sensing Image Retrieval by Deep Hashing Neural Networks. IEEE Trans. Geosci. Remote Sens. 2018, 54, 950–965. [Google Scholar] [CrossRef]
- Yang, Y.; Newsam, S. Geographic image retrieval using local invariant features. IEEE Trans. Geosci. Remote Sens. 2012, 51, 818–832. [Google Scholar] [CrossRef]
- Aptoula, E. Remote sensing image retrieval with global morphological texture descriptors. IEEE Trans. Geosci. Remote Sens. 2013, 52, 3023–3034. [Google Scholar] [CrossRef]
- Luo, B.; Aujol, J.F.; Gousseau, Y.; Ladjal, S. Indexing of satellite images with different resolutions by wavelet features. IEEE Trans. Image Process. 2008, 17, 1465–1472. [Google Scholar]
- Rosu, R.; Donias, M.; Bombrun, L.; Said, S.; Regniers, O.; Da Costa, J.P. Structure tensor Riemannian statistical models for CBIR and classification of remote sensing images. IEEE Trans. Geosci. Remote Sens. 2016, 55, 248–260. [Google Scholar] [CrossRef]
- Tobin, K.W.; Bhaduri, B.L.; Bright, E.A.; Cheriyadat, A.; Karnowski, T.P.; Palathingal, P.J.; Potok, T.E.; Price, J.R. Automated Feature Generation in Large-Scale Geospatial Libraries for Content-Based Indexing. Photogramm. Eng. Remote Sens. 2006, 72, 531–540. [Google Scholar] [CrossRef]
- Shyu, C.R.; Klaric, M.; Scott, G.J.; Barb, A.S.; Davis, C.H.; Palaniappan, K. GeoIRIS: Geospatial Information Retrieval and Indexing System-Content Mining, Semantics Modeling, and Complex Queries. IEEE Trans. Geosci. Remote Sens. 2013, 102, 2564–2567. [Google Scholar] [CrossRef] [Green Version]
- Ye, D.; Li, Y.; Tao, C.; Xie, X.; Wang, X. Multiple feature hashing learning for large-scale remote sensing image retrieval. ISPRS Int. J. Geo-Inf. 2017, 6, 364. [Google Scholar] [CrossRef] [Green Version]
- Guo, M.; Yuan, Y.; Lu, X. Deep Cross-Modal Retrieval for Remote Sensing Image and Audio. In Proceedings of the 2018 10th IAPR Workshop on Pattern Recognition in Remote Sensing (PRRS), Beijing, China, 19–20 August 2018; pp. 1–7. [Google Scholar]
- Jiang, Q.Y.; Li, W.J. Deep Cross-Modal Hashing. In Proceedings of the Computer Vision and Pattern Recognition, Honolulu, HI, USA, 21–26 July 2017; pp. 3270–3278. [Google Scholar]
- Li, K.; Qi, G.J.; Ye, J.; Hua, K.A. Linear subspace ranking hashing for cross-modal retrieval. IEEE Trans. Pattern Anal. Mach. Intell. 2016, 39, 1825–1838. [Google Scholar] [CrossRef] [PubMed]
- Tang, J.; Wang, K.; Shao, L. Supervised matrix factorization hashing for cross-modal retrieval. IEEE Trans. Image Process. 2016, 25, 3157–3166. [Google Scholar] [CrossRef] [PubMed] [Green Version]
- Li, D.; Dimitrova, N.; Li, M.; Sethi, I.K. Multimedia content processing through cross-modal association. In Proceedings of the Eleventh ACM International Conference on Multimedia, Berkeley, CA, USA, 2–8 November 2003; pp. 604–611. [Google Scholar]
- Zhang, H.; Zhuang, Y.; Wu, F. Cross-modal correlation learning for clustering on image-audio dataset. In Proceedings of the 15th ACM international conference on Multimedia, Augsburg, Germany, 24–29 September 2007; pp. 273–276. [Google Scholar]
- Song, Y.; Morency, L.P.; Davis, R. Multimodal human behavior analysis: Learning correlation and interaction across modalities. In Proceedings of the 14th ACM International Conference on Multimodal Interaction, New York, NY, USA, 22–26 October 2012; pp. 27–30. [Google Scholar]
- Torfi, A.; Iranmanesh, S.M.; Nasrabadi, N.; Dawson, J. 3D Convolutional Neural Networks for Cross Audio-Visual Matching Recognition. IEEE Access 2017, 5, 22081–22091. [Google Scholar] [CrossRef]
- Arandjelovi, R.; Zisserman, A. Look, Listen and Learn. In Proceedings of the IEEE Conference on Computer Vision and Pattern Recognition, Honolulu, HI, USA, 21–26 July 2017; pp. 609–617. [Google Scholar]
- Nagrani, A.; Albanie, S.; Zisserman, A. Seeing Voices and Hearing Faces: Cross-modal biometric matching. In Proceedings of the IEEE Conference on Computer Vision and Pattern Recognition, Salt Lake City, UT, USA, 18–22 June 2018. [Google Scholar]
- Li, Y.; Zhang, Y.; Huang, X.; Ma, J. Learning source-invariant deep hashing convolutional neural networks for cross-source remote sensing image retrieval. IEEE Trans. Geosci. Remote Sens. 2018, 56, 6521–6536. [Google Scholar] [CrossRef]
- Salem, T.; Zhai, M.; Workman, S.; Jacobs, N. A multimodal approach to mapping soundscapes. In Proceedings of the IEEE Conference on Computer Vision and Pattern Recognition, Salt Lake City, UT, USA, 18–22 June 2018; pp. 2524–2527. [Google Scholar]
- Gu, J.; Cai, J.; Joty, S.; Niu, L.; Wang, G. Look, Imagine and Match: Improving Textual-Visual Cross-Modal Retrieval with Generative Models. In Proceedings of the IEEE Conference on Computer Vision and Pattern Recognition, Salt Lake City, UT, USA, 18–22 June 2018; pp. 7181–7189. [Google Scholar]
- Lin, K.; Yang, H.F.; Hsiao, J.H.; Chen, C.S. Deep learning of binary hash codes for fast image retrieval. In Proceedings of the IEEE Conference on Computer Vision and Pattern Recognition, Boston, MA, USA, 7–12 June 2015; pp. 27–35. [Google Scholar]
- Xu, T.; Jiao, L.; Emery, W.J. SAR Image Content Retrieval Based on Fuzzy Similarity and Relevance Feedback. IEEE J. Sel. Top. Appl. Earth Obs. Remote Sens. 2017, 10, 1824–1842. [Google Scholar]
- Zhang, L.; Yin, X.; Wang, Z.; Hao, L.; Lin, M. Preliminary Analysis of the Potential and Limitations of MICAP for the Retrieval of Sea Surface Salinity. IEEE J. Sel. Top. Appl. Earth Obs. Remote Sens. 2018, 11, 2979–2990. [Google Scholar] [CrossRef]
- Yang, Z.; Li, Z.; Zhu, J.; Preusse, A.; Hu, J.; Feng, G.; Papst, M. High-Resolution Three-Dimensional Displacement Retrieval of Mining Areas From a Single SAR Amplitude Pair Using the SPIKE Algorithm. IEEE J. Sel. Top. Appl. Earth Obs. Remote Sens. 2018, 11, 3782–3793. [Google Scholar] [CrossRef]
- Lu, X.; Chen, Y.; Li, X. Siamese Dilated Inception Hashing With Intra-Group Correlation Enhancement for Image Retrieval. IEEE Trans. Neural Netw. Learn. Syst. 2019. [Google Scholar] [CrossRef]
- Chen, Y.; Lu, X.; Feng, Y. Deep Voice-Visual Cross-Modal Retrieval with Deep Feature Similarity Learning. In Proceedings of the Chinese Conference on Pattern Recognition and Computer Vision, Xi’an, China, 8–11 November 2019; pp. 454–465. [Google Scholar]
- Ruzaij, M.F.; Neubert, S.; Stoll, N.; Thurow, K. Hybrid voice controller for intelligent wheelchair and rehabilitation robot using voice recognition and embedded technologies. J. Adv. Comput. Intell. 2016, 20, 615–622. [Google Scholar] [CrossRef]
- Harwath, D.; Glass, J.R. Learning Word-Like Units from Joint Audio-Visual Analysis. In Proceedings of the Annual Meeting of the Association for Computational Linguistics, Vancouver, BC, Canada, 30 July–4 August 2017; pp. 506–517. [Google Scholar]
- Chapaneri, S.V. Spoken digits recognition using weighted MFCC and improved features for dynamic time warping. Int. J. Comput. Appl. 2012, 40, 6–12. [Google Scholar]
- Chahal, A.; Kaur, R.; Baghla, S.; Kaushal, G. Heart Rate Monitoring using Human Speech Features Extraction: A Review. Heart 2017, 4, 444–449. [Google Scholar]
- Selvakumari, N.S.; Radha, V. Recent Survey on Feature Extraction Methods for Voice Pathology and Voice Disorder. Int. J. Comput. Math. Sci. 2017, 6, 74–79. [Google Scholar]
- Kim, J.; Kumar, N.; Tsiartas, A.; Li, M.; Narayanan, S.S. Automatic intelligibility classification of sentence-level pathological speech. Comput. Speech Lang. 2015, 29, 132–144. [Google Scholar] [CrossRef] [PubMed] [Green Version]
- Harwath, D.F.; Torralba, A.; Glass, J.R. Unsupervised Learning of Spoken Language with Visual Context. In Proceedings of the Advances in Neural Information Processing Systems, Barcelona, Spain, 5–10 December 2016; pp. 1858–1866. [Google Scholar]
- Zhang, R.; Lin, L.; Zhang, R.; Zuo, W.; Zhang, L. Bit-Scalable Deep Hashing With Regularized Similarity Learning for Image Retrieval and Person Re-Identification. IEEE Trans. Image Process. 2015, 24, 4766–4779. [Google Scholar] [CrossRef]
- Liu, H.; Wang, R.; Shan, S.; Chen, X. Deep Supervised Hashing for Fast Image Retrieval. In Proceedings of the IEEE International Conference on Computer Vision and Pattern Recognition, Las Vegas, NV, USA, 26 June–1 July 2016; pp. 2064–2072. [Google Scholar]
- Gong, Y.; Lazebnik, S. Iterative quantization: A procrustean approach to learning binary codes. In Proceedings of the IEEE International Conference on Computer Vision and Pattern Recognition, Colorado Springs, CO, USA, 20–25 June 2011; pp. 817–824. [Google Scholar]
- Zhu, H.; Long, M.; Wang, J.; Cao, Y. Deep hashing network for efficient similarity retrieval. In Proceedings of the AAAI, Phoenix, AZ, USA, 12–17 February 2016; pp. 2415–2421. [Google Scholar]
- Lu, X.; Chen, Y.; Li, X. Hierarchical Recurrent Neural Hashing for Image Retrieval with Hierarchical Convolutional Features. IEEE Trans. Image Process. 2018, 27, 106–120. [Google Scholar] [CrossRef]
- Hyvärinen, A.; Hurri, J.; Hoyer, P.O. Natural Image Statistics: A Probabilistic Approach to Early Computational Vision; Springer Science&Business Media: Berlin/Heidelberg, Germany, 2009; Volume 39. [Google Scholar]
- Kingma, D.P.; Ba, J. Adam: A Method for Stochastic Optimization. In Proceedings of the International Conference for Learning Representations, San Diego, CA, USA, 7–9 May 2015; pp. 1–15. [Google Scholar]
- Qu, B.; Li, X.; Tao, D.; Lu, X. Deep semantic understanding of high resolution remote sensing image. In Proceedings of the International Conference on Computer, Information and Telecommunication Systems, Kunming, China, 6–8 August 2016; pp. 1–5. [Google Scholar]
- Lu, X.; Wang, B.; Zheng, X.; Li, X. Exploring Models and Data for Remote Sensing Image Caption Generation. IEEE Trans. Geosci. Remote Sens. 2017, 56, 2183–2195. [Google Scholar] [CrossRef] [Green Version]
- Li, Y.; Chen, Y.; Huang, J. An Approach to Improve Leaf Pigment Content Retrieval by Removing Specular Reflectance Through Polarization Measurements. IEEE Trans. Geosci. Remote Sens. 2018, 57, 2173–2186. [Google Scholar] [CrossRef]
- Kolassa, J.; Gentine, P.; Prigent, C.; Aires, F.; Alemohammad, S.H. Soil moisture retrieval from AMSR-E and ASCAT microwave observation synergy. Part 2: Product evaluation. Remote Sens. Environ. 2017, 195, 202–217. [Google Scholar] [CrossRef]
- Zhang, H.; Liu, X.; Yang, S.; Yu, L.I. Retrieval of remote sensing images based on semisupervised deep learning. J. Remote Sens. 2017, 21, 406–414. [Google Scholar]
- Imbriaco, R.; Sebastian, C.; Bondarev, E.; De With, P.H.N. Aggregated Deep Local Features for Remote Sensing Image Retrieval. Remote Sens. 2019, 11, 493. [Google Scholar] [CrossRef] [Green Version]
- Mouha, N.; Raunak, M.S.; Kuhn, D.R.; Kacker, R. Finding bugs in cryptographic hash function implementations. IEEE Trans. Reliab. 2018, 67, 870–884. [Google Scholar] [CrossRef] [PubMed]
- Guo, M.; Zhou, C.; Liu, J. Jointly Learning of Visual and Auditory: A New Approach for RS Image and Audio Cross-Modal Retrieval. IEEE J. Sel. Top. Appl. Earth Obs. Remote Sens. 2019. [Google Scholar] [CrossRef]
- Pan, P.; Xu, Z.; Yang, Y.; Wu, F.; Zhuang, Y. Hierarchical Recurrent Neural Encoder for Video Representation with Application to Captioning. In Proceedings of the International Conference on Computer Vision and Pattern Recognition, Las Vegas, NV, USA, 26 June–1 July 2016; pp. 1029–1038. [Google Scholar]
Figure 1.
The comparison of (a) exiting image-sound retrieval methods [14,25] and (b) the proposed DTBH approach.

Figure 2.
The proposed framework of deep triplet-based hashing (DTBH). The whole framework contains the remote sensing (RS) image branch, a positive RS sound branch, and a negative RS sound branch. The positive RS sound branch and the negative RS sound branch are shared weights. The overall objective function consists of the triplet similarity loss function, the triplet regularized loss function, and the deep feature triplet loss function.

Figure 3.
Some example images and sounds from three RS image-sound datasets. (a) Sydney dataset. (b) UCM dataset. (c) RSICD dataset.
Figure 3.
Some example images and sounds from three RS image-sound datasets. (a) Sydney dataset. (b) UCM dataset. (c) RSICD dataset.

Figure 4.
The comparative results of DTBH-T, DTBH-D, DTBH-R, DTBH-R, and DTBH for different hash bits on the UCM dataset by using RS images to retrieve sounds. The horizontal axis represents hash codes with different bits, and the vertical axis represents mean average precision.
Figure 4.
The comparative results of DTBH-T, DTBH-D, DTBH-R, DTBH-R, and DTBH for different hash bits on the UCM dataset by using RS images to retrieve sounds. The horizontal axis represents hash codes with different bits, and the vertical axis represents mean average precision.

Figure 5.
The comparative results of DTBH-T, DTBH-D, DTBH-R, DTBH-R, and DTBH for different hash bits on the UCM dataset by using sounds to retrieve RS images. The horizontal axis represents hash codes with different bits, and the vertical axis represents mean average precision.
Figure 5.
The comparative results of DTBH-T, DTBH-D, DTBH-R, DTBH-R, and DTBH for different hash bits on the UCM dataset by using sounds to retrieve RS images. The horizontal axis represents hash codes with different bits, and the vertical axis represents mean average precision.

Figure 6.
The precision curves with different samples retrieved by using sounds to retrieve RS images on UCM dataset.
Figure 6.
The precision curves with different samples retrieved by using sounds to retrieve RS images on UCM dataset.

Figure 7.
The precision curves with different samples retrieved by using RS images to retrieve sounds on UCM dataset.
Figure 7.
The precision curves with different samples retrieved by using RS images to retrieve sounds on UCM dataset.

Figure 8.
The top eight retrieval results of the proposed DTBH approach on the UCM dataset by utilizing RS images to retrieve voices. The wrong retrieval results are marked with red font.
Figure 8.
The top eight retrieval results of the proposed DTBH approach on the UCM dataset by utilizing RS images to retrieve voices. The wrong retrieval results are marked with red font.

Figure 9.
The top eight retrieval results of the proposed DTBH approach on the UCM dataset by utilizing voices to retrieve RS images. The wrong retrieval results are marked with red font.
Figure 9.
The top eight retrieval results of the proposed DTBH approach on the UCM dataset by utilizing voices to retrieve RS images. The wrong retrieval results are marked with red font.

Figure 10.
The precision curves with different samples retrieved by using sounds to retrieve RS images from the Sydney dataset.
Figure 10.
The precision curves with different samples retrieved by using sounds to retrieve RS images from the Sydney dataset.

Figure 11.
The precision curves with different samples retrieved by using RS images to retrieve sounds from the Sydney dataset.
Figure 11.
The precision curves with different samples retrieved by using RS images to retrieve sounds from the Sydney dataset.

Figure 12.
The precision curves with different samples retrieved by using sounds to retrieve RS images from the RSICD dataset.
Figure 12.
The precision curves with different samples retrieved by using sounds to retrieve RS images from the RSICD dataset.

Figure 13.
The precision curves with different samples retrieved by using RS images to retrieve sounds form the RSICD dataset.
Figure 13.
The precision curves with different samples retrieved by using RS images to retrieve sounds form the RSICD dataset.

Figure 14.
MAP varies with the parameter for different hash bits on the UCM dataset by utilizing sound to retrieve RS images. The horizontal axis represents the parameter , and the vertical axis represents mean average precision.
Figure 14.
MAP varies with the parameter for different hash bits on the UCM dataset by utilizing sound to retrieve RS images. The horizontal axis represents the parameter , and the vertical axis represents mean average precision.

Figure 15.
MAP varies with the parameter for different hash bits on the UCM dataset by utilizing sound to retrieve RS images. The horizontal axis represents the parameter , and the vertical axis represents mean average precision.
Figure 15.
MAP varies with the parameter for different hash bits on the UCM dataset by utilizing sound to retrieve RS images. The horizontal axis represents the parameter , and the vertical axis represents mean average precision.


Table 1.
Definition of some symbols.
| Symbol | Definition |
|---|---|
| the triplet units | |
| the set of the RS anchor images | |
| the set of the RS positive sounds | |
| the set of the RS negative sounds | |
| the m-th RS anchor image | |
| the m-th RS positive sound | |
| the m-th RS negative sound | |
| the Hamming distance |
Table 2.
Comparison of DTBH-S, DTBH-R, DTBH-D, DTBH-T, and DTBH on the UCM dataset with mean average precision (mAP) in different hash bits.
Table 2.
Comparison of DTBH-S, DTBH-R, DTBH-D, DTBH-T, and DTBH on the UCM dataset with mean average precision (mAP) in different hash bits.
| Method | 16 Bits | 32 Bits | 48 Bits | 64 Bits | |
|---|---|---|---|---|---|
| S→ I | DTBH-T | 42.29 | 43.25 | 44.52 | 45.36 |
| DTBH-D | 44.40 | 46.65 | 47.71 | 48.88 | |
| DTBH-R | 53.53 | 54.61 | 55.58 | 56.91 | |
| DTBH-S | 54.43 | 55.28 | 56.37 | 57.76 | |
| DTBH | 57.17 | 58.36 | 59.46 | 60.13 | |
| I→ S | DTBH-T | 47.28 | 48.09 | 48.98 | 49.86 |
| DTBH-D | 50.32 | 51.56 | 52.38 | 53.24 | |
| DTBH-R | 57.15 | 59.04 | 60.93 | 61.84 | |
| DTBH-S | 58.61 | 60.45 | 61.38 | 62.42 | |
| DTBH | 60.85 | 62.35 | 63.45 | 64.27 |
Table 3.
Comparison of DTBH+AlexNet, DTBH+GoogleNet, and DTBH+VGG16 on the UCM dataset with mean average precision (mAP) in different hash bits.
Table 3.
Comparison of DTBH+AlexNet, DTBH+GoogleNet, and DTBH+VGG16 on the UCM dataset with mean average precision (mAP) in different hash bits.
| Method | 16 Bits | 32 Bits | 48 Bits | 64 Bits | |
|---|---|---|---|---|---|
| S→ I | DTBH+AlexNet | 54.69 | 56.41 | 57.16 | 58.51 |
| DTBH+GoogleNet | 55.83 | 57.17 | 57.94 | 59.22 | |
| DTBH+VGG16 | 57.17 | 58.36 | 59.46 | 60.13 | |
| I→ S | DTBH+AlexNet | 57.87 | 59.25 | 60.47 | 62.15 |
| DTBH+GoogleNet | 59.44 | 60.83 | 62.27 | 63.36 | |
| DTBH+VGG16 | 60.85 | 62.35 | 63.45 | 64.27 |
Table 4.
The performance comparison between the proposed DTBH method and other methods on the UCM dataset by using sound to retrieve RS image.
Table 4.
The performance comparison between the proposed DTBH method and other methods on the UCM dataset by using sound to retrieve RS image.
| Task | Method | MAP | Precision@1 | Precision@5 | Precision@10 |
|---|---|---|---|---|---|
| S→ I | SIFT+M | 6.66 | 3.58 | 4.41 | 4.68 |
| DBLP [39] | 19.33 | 17.12 | 17.62 | 16.31 | |
| CNN+SPEC [22] | 21.79 | 19.42 | 19.86 | 19.23 | |
| DVAN [14] | 32.28 | 32.37 | 33.91 | 34.34 | |
| DTBH-D | 48.88 | 58.56 | 54.29 | 50.35 | |
| DTBH-R | 56.91 | 65.48 | 61.54 | 57.32 | |
| DTBH | 60.13 | 70.26 | 66.63 | 61.73 |
Table 5.
The performance comparison between the proposed DTBH method and other methods on the UCM dataset by using RS images to retrieve sounds.
Table 5.
The performance comparison between the proposed DTBH method and other methods on the UCM dataset by using RS images to retrieve sounds.
| Task | Method | MAP | Precision@1 | Precision@5 | Precision@10 |
|---|---|---|---|---|---|
| I→ S | SIFT+M | 8.55 | 4.56 | 4.65 | 4.56 |
| DBLP [39] | 25.48 | 24.18 | 23.87 | 23.24 | |
| CNN+SPEC [22] | 26.25 | 29.5 | 25.52 | 23.65 | |
| DVAN [14] | 36.79 | 32.37 | 33.29 | 33.74 | |
| DTBH-D | 53.24 | 63.44 | 59.63 | 55.54 | |
| DTBH-R | 61.84 | 70.82 | 66.93 | 62.49 | |
| DTBH | 64.27 | 73.10 | 69.69 | 65.63 |
Table 6.
The performance comparison between the proposed DTBH method and other methods on the Sydney dataset by using sounds to retrieve RS images.
Table 6.
The performance comparison between the proposed DTBH method and other methods on the Sydney dataset by using sounds to retrieve RS images.
| Task | Method | MAP | Precision@1 | Precision@5 | Precision@10 |
|---|---|---|---|---|---|
| S→ I | SIFT+M | 26.50 | 34.48 | 24.48 | 23.28 |
| DBLP [39] | 34.87 | 21.63 | 26.78 | 30.94 | |
| CNN+SPEC [22] | 35.72 | 17.24 | 27.76 | 31.21 | |
| DVAN [14] | 63.88 | 67.24 | 63.34 | 67.07 | |
| DTBH-D | 76.53 | 81.36 | 79.28 | 77.82 | |
| DTBH-R | 85.46 | 89.86 | 87.07 | 85.38 | |
| DTBH | 87.49 | 92.18 | 90.36 | 88.82 |
Table 7.
The performance comparison between the proposed DTBH method and other methods on the Sydney dataset by using RS images to retrieve sounds.
Table 7.
The performance comparison between the proposed DTBH method and other methods on the Sydney dataset by using RS images to retrieve sounds.
| Task | Method | MAP | Precision@1 | Precision@5 | Precision@10 |
|---|---|---|---|---|---|
| I→ S | SIFT+M | 31.67 | 11.21 | 35.00 | 37.59 |
| DBLP [39] | 44.38 | 56.51 | 52.65 | 49.68 | |
| CNN+SPEC [22] | 46.67 | 58.62 | 55.00 | 51.64 | |
| DVAN [14] | 71.77 | 75.86 | 73.62 | 72.93 | |
| DTBH-D | 81.23 | 88.51 | 86.79 | 84.47 | |
| DTBH-R | 89.64 | 95.60 | 93.48 | 92.54 | |
| DTBH | 92.45 | 97.41 | 95.63 | 93.78 |
Table 8.
The performance comparison between the proposed DTBH method and other methods on the RSICD dataset by using sounds to retrieve RS images.
Table 8.
The performance comparison between the proposed DTBH method and other methods on the RSICD dataset by using sounds to retrieve RS images.
| Task | Method | MAP | Precision@1 | Precision@5 | Precision@10 |
|---|---|---|---|---|---|
| S→ I | SIFT+M | 4.85 | 3.66 | 3.60 | 3.54 |
| DBLP [39] | 8.14 | 6.21 | 6.08 | 6.76 | |
| CNN+SPEC [22] | 9.96 | 7.13 | 7.00 | 7.44 | |
| DVAN [14] | 15.71 | 16.18 | 15.10 | 14.76 | |
| DTBH-D | 18.86 | 19.58 | 18.64 | 17.74 | |
| DTBH-R | 21.41 | 22.03 | 21.39 | 20.68 | |
| DTBH | 22.72 | 23.30 | 22.48 | 21.17 |
Table 9.
The performance comparison between the proposed DTBH method and other methods on the RSICD dataset by using RS images to retrieve sounds.
Table 9.
The performance comparison between the proposed DTBH method and other methods on the RSICD dataset by using RS images to retrieve sounds.
| Task | Method | MAP | Precision@1 | Precision@5 | Precision@10 |
|---|---|---|---|---|---|
| I→ S | SIFT+M | 5.04 | 6.22 | 5.34 | 4.50 |
| DBLP [39] | 12.70 | 15.32 | 15.21 | 14.22 | |
| CNN+SPEC [22] | 13.24 | 16.82 | 16.62 | 15.69 | |
| DVAN [14] | 16.29 | 22.49 | 22.56 | 21.7 | |
| DTBH-D | 19.39 | 24.82 | 24.29 | 23.65 | |
| DTBH-R | 22.52 | 26.81 | 26.28 | 25.49 | |
| DTBH | 23.46 | 27.58 | 26.84 | 26.37 |
© 2019 by the authors. Licensee MDPI, Basel, Switzerland. This article is an open access article distributed under the terms and conditions of the Creative Commons Attribution (CC BY) license (http://creativecommons.org/licenses/by/4.0/).
Share and Cite
MDPI and ACS Style
Chen, Y.; Lu, X. A Deep Hashing Technique for Remote Sensing Image-Sound Retrieval. Remote Sens. 2020, 12, 84. https://0-doi-org.brum.beds.ac.uk/10.3390/rs12010084
AMA Style
Chen Y, Lu X. A Deep Hashing Technique for Remote Sensing Image-Sound Retrieval. Remote Sensing. 2020; 12(1):84. https://0-doi-org.brum.beds.ac.uk/10.3390/rs12010084
Chicago/Turabian StyleChen, Yaxiong, and Xiaoqiang Lu. 2020. "A Deep Hashing Technique for Remote Sensing Image-Sound Retrieval" Remote Sensing 12, no. 1: 84. https://0-doi-org.brum.beds.ac.uk/10.3390/rs12010084
Note that from the first issue of 2016, this journal uses article numbers instead of page numbers. See further details here.