Letter

Combined Study of a Significant Mine Collapse Based on Seismological and Geodetic Data—29 January 2019, Rudna Mine, Poland

1
Institute of Geodesy and Geoinformatics, Wrocław University of Environmental Life and Sciences, 50-357 Wrocław, Poland
2
Institute of Geophysics, Polish Academy of Sciences, 01-452 Warszawa, Poland
*
Author to whom correspondence should be addressed.
Remote Sens. 2020, 12(10), 1570; https://0-doi-org.brum.beds.ac.uk/10.3390/rs12101570
Submission received: 27 March 2020 / Revised: 9 May 2020 / Accepted: 12 May 2020 / Published: 15 May 2020
(This article belongs to the Special Issue Remote Sensing in Applied Geophysics)

Abstract

:
On 29 January 2019, the collapse of a mine roof resulted in a significant surface deformation and generated a tremor with a magnitude of 4.6 in Rudna Mine, Poland. This study combines the seismological and geodetic monitoring of the event. Data from local and regional seismological networks were used to estimate the mechanism of the source and the ground motion caused by the earthquake. Global Navigation Satellite System data, collected at 10 Hz, and processed as a long-term time-series of daily coordinates solutions and short-term high frequency oscillations, are in good agreement with the seismological outputs, having detected several more tremors. The range and dynamics of the deformed surface area were monitored using satellite radar techniques for slow and fast motion detection. The radar data revealed that a 2-km2 area was affected in the six days after the collapse and that there was an increase in the post-event rate of subsidence.

Graphical Abstract

1. Introduction

Rock bursts and collapses are the most dangerous phenomena associated with seismicity in underground mines. The collapse of a mine roof can follow strong and shallow seismic events of magnitudes M > 3 [1,2,3,4]. They pose a serious threat to life for miners working in the vicinity of the collapsing rock. The strongest underground mining-induced seismic events are Volkershausen [5] and Newcastle [6], both M5.6 Although the magnitudes of such shallow seismic events are usually small in comparison with natural earthquakes, the ground shaking might be felt by local citizens and can damage surface infrastructure. Rock-burst issues have occurred in the Polish copper region known as the Legnica Głogów Copper District (LGCD). Thousands of events of M > 1.0 are recorded every year in the LGCD. Among these, several are followed by rock bursts or tunnel collapses. Both ground shaking (i.e., a seismic event) and local ground failure occur as consequences of mining. While the shaking effects are comparable to what can be felt during small to moderate natural earthquakes, the surface deformation is specific to mining areas. The subsidence is either a ground response to the closure of excavated mining panels, e.g., [7,8,9], or is related to strong tremors [10,11]. In this paper, we present a joint seismological and geodetic study that expands our knowledge concerning the connection between mine collapses and the ground response to seismic sources manifested by permanent ground deformations.
The analysis focused on the strongest seismic event recorded by LGCD in the last several years—namely, the 29 January 2019 M4.6 collapse in the Rudna Mine, Poland. The phenomenon was widely felt and was followed by massive collapse. While the seismological analyses were carried out using records from local and regional seismic networks, the geodetic data are comprised of Global Navigation Satellite System (GNSS) observations collected at station LES1 (Komorniki; part of the European Plate Observing System project [EPOS-PL] network) and the European Space Agency’s (ESA’s) Sentinel-1 radar observations. The LES1 station was aligned with a strong motion sensor (KOMR), part of the local seismic system, the Legnica–Głogow Underground Mining INduced Earthquake Observing System (LUMINEOS), located above the mine. Interferometric Synthetic Aperture Radar (InSAR) techniques were applied to analyse the co-seismic surface deformation.

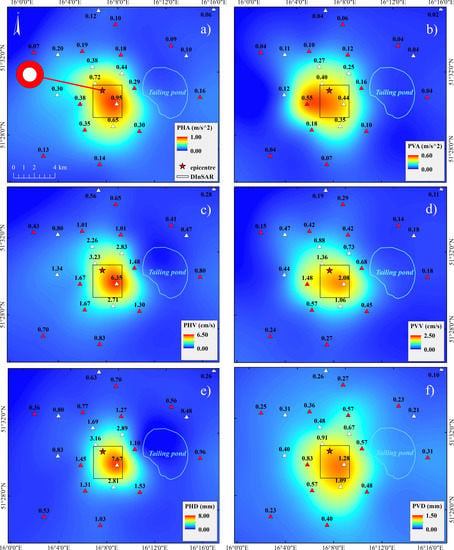
2. The Collapse and Seismological Analyses

On 29 January 2019, Rudna Mine in western Poland was struck by a seismic event followed by a rock burst. It was one of a few such events in the area in recent years [4,12,13]. Using seismic signals recorded by the LUMINEOS surface local seismic network (Figure 1a) and a local velocity model [14], the epicentre was located at 51.5110°N, 16.1197°E. For our analysis, we assumed that the event depth was located at the level of the excavation; that is, 1 km below the surface. LUMINEOS consisted of 10 strong motion sensors (AC-73) and 17 five-second VE-53/BB instruments (both types manufactured by GeoSIG, Schlieren, Switzerland).
The source mechanism of the event was estimated using seismic signals recorded by broad-band seismometers (STS2 or Güralp CMG3ESP; Figure 1b) at regional distances of 70 to 300 km. The signals and corresponding station responses were obtained from the ORFEUS-EIDA project page [15]. The inversion was performed using the real displacement, derived from the original signals, for 11 seismic stations located around the epicentre (Figure 1b). The mechanism (Figure 2a) was estimated in terms of the full moment tensor, which can be directly used to interpret the mechanisms of mining tremors [16]. The Pyrocko toolbox [17] and KIWI tool software [18] were used for the calculations. The software had already been tested as a tool for determining a stable point source model in mines [19], including mine collapses [4,11]. In this work, we followed the procedure previously used in [4]. The inversion was based on the full waveform displacement and spectra in the specific frequency range. The regional velocity model proposed by [20] was used. The lowest misfit was obtained for data filtered between 0.07 and 0.11 Hz. The final moment tensor solution was decomposed according to [21] into its isotropic and deviatoric parts, and ultimately into the double-couple and compensated linear vector dipole. The resulting moment tensor (m11: −4.03 × 10¹⁵ m22: −3.91 × 10¹⁵ m33: −11.9 × 10¹⁵ m12: −0.07 × 10¹⁵ m13: −0.11 × 10¹⁵ m23: −0.22 × 10¹⁵ Nm) was dominated by the implosive component (isotropic part: −55%). This kind of mechanism can be explained by a tabular cavity collapse [4,22], and it was strongly supported by the observations recorded on the strong motion sensors belonging to the LUMINEOS network(see Supporting Material: Table S1). Figure 2 shows the distribution of the peak ground acceleration around the epicentre. The clearly visible peak ground acceleration pattern corresponds very well with the collapse source model.

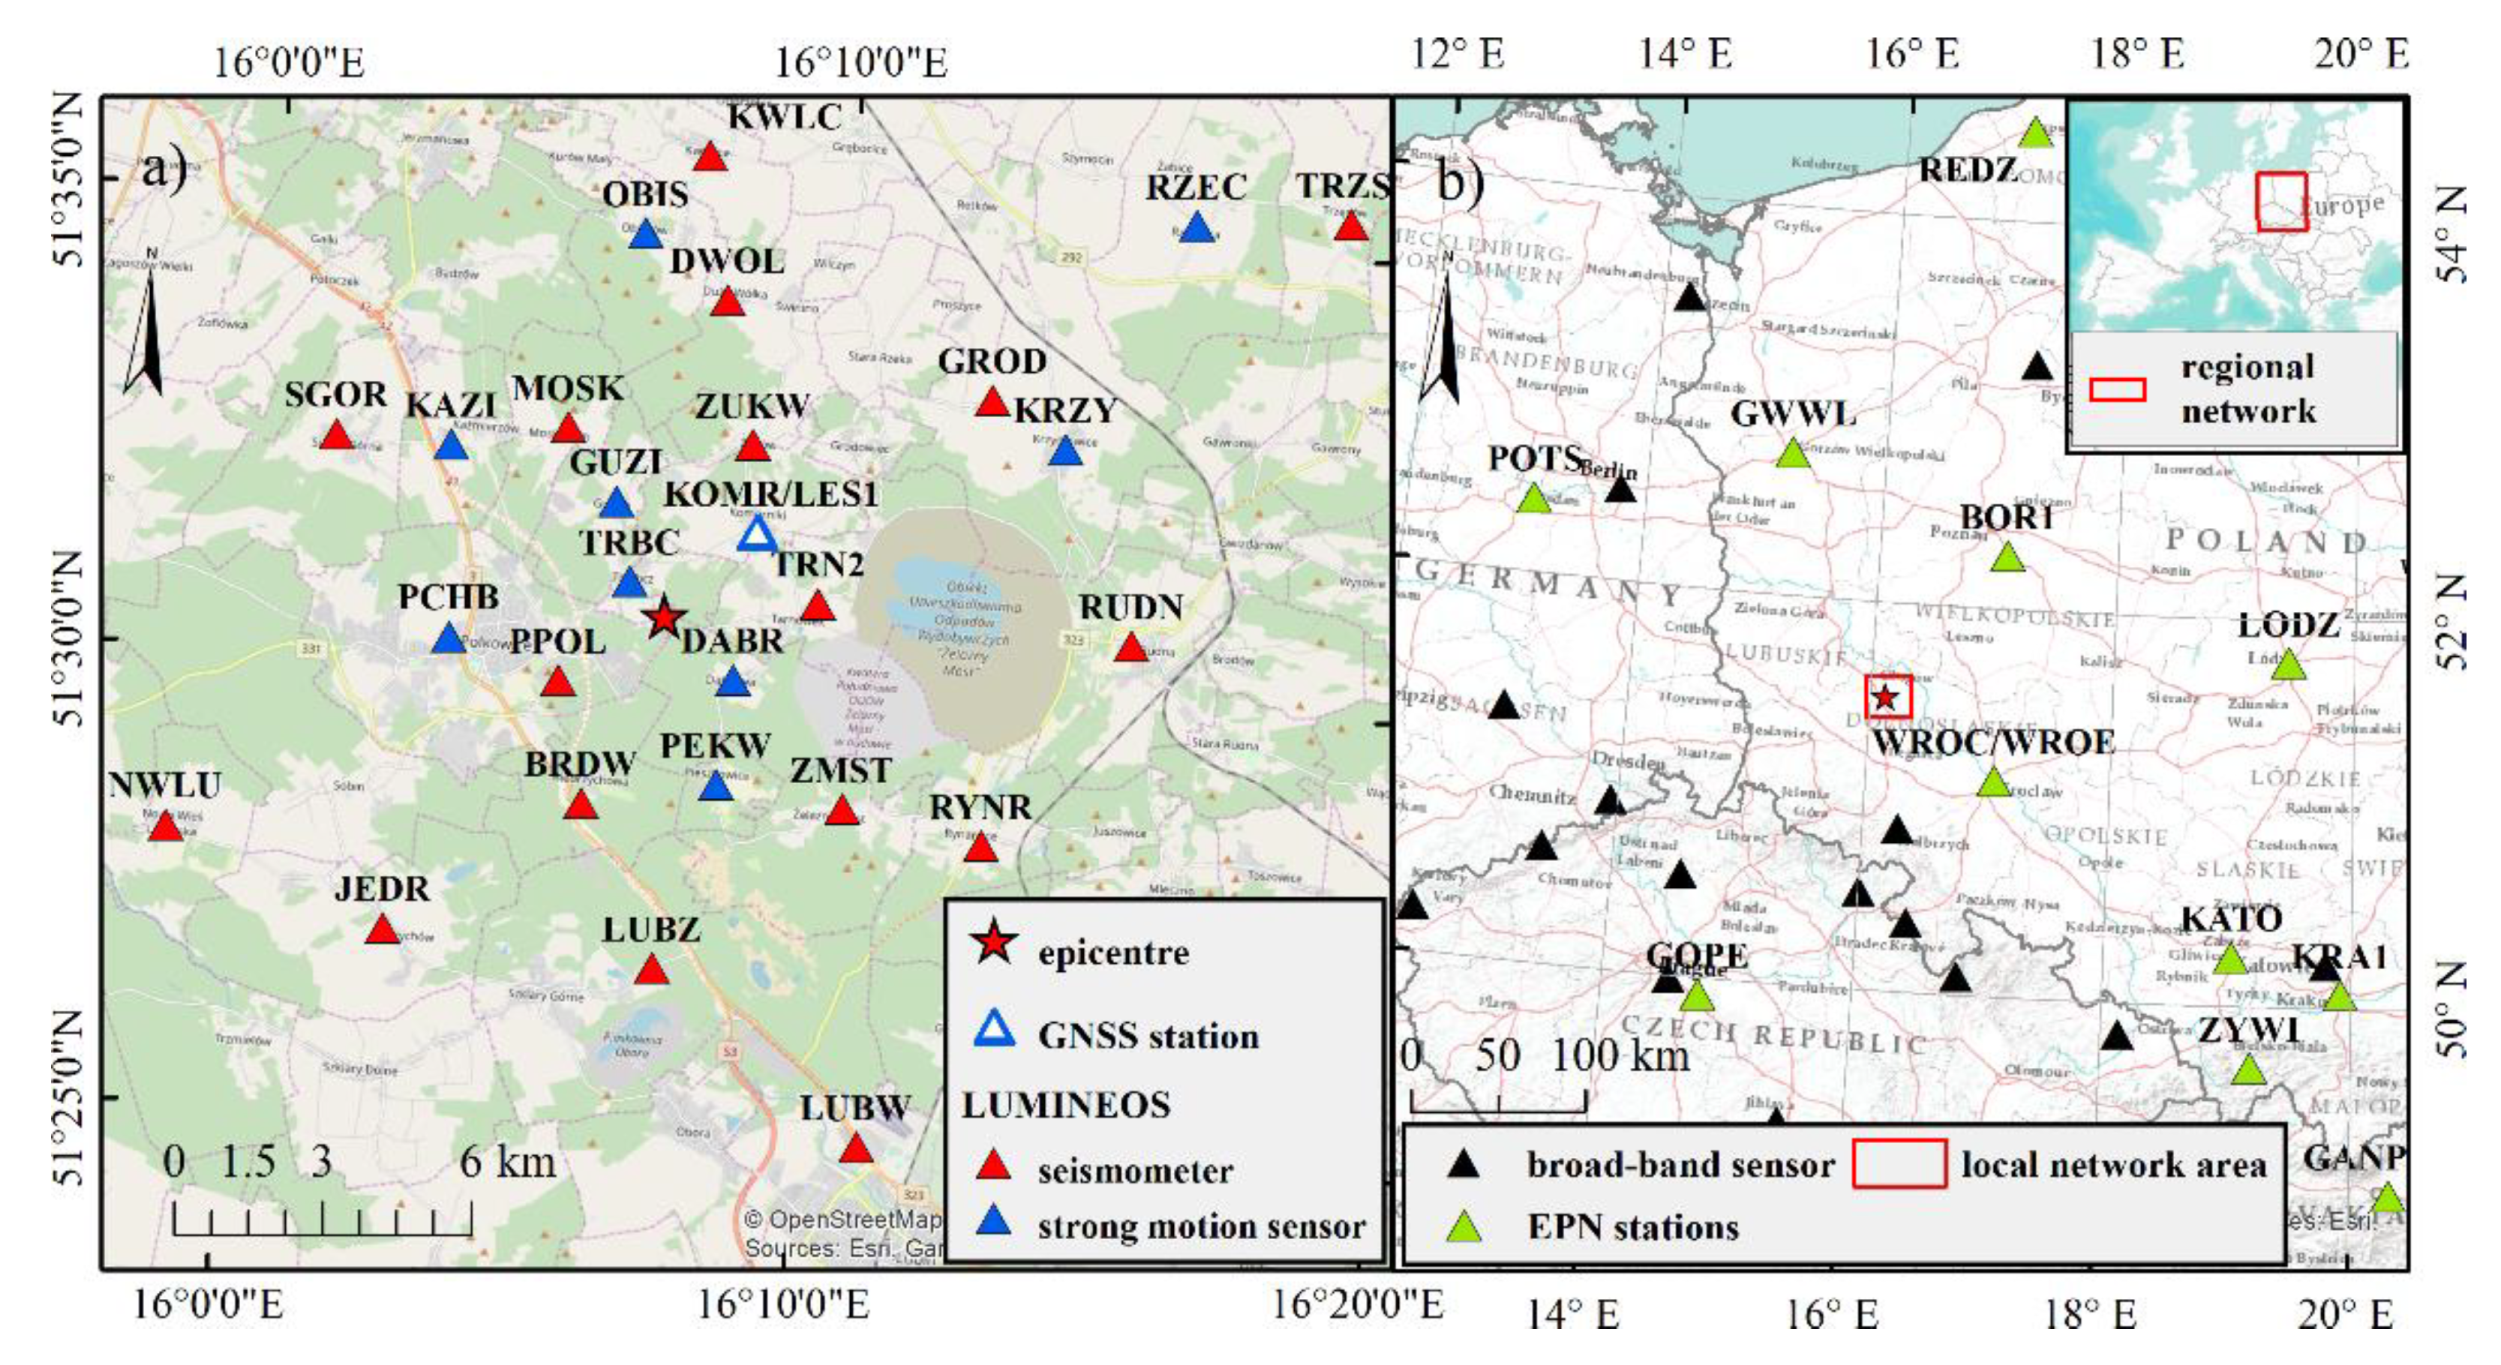
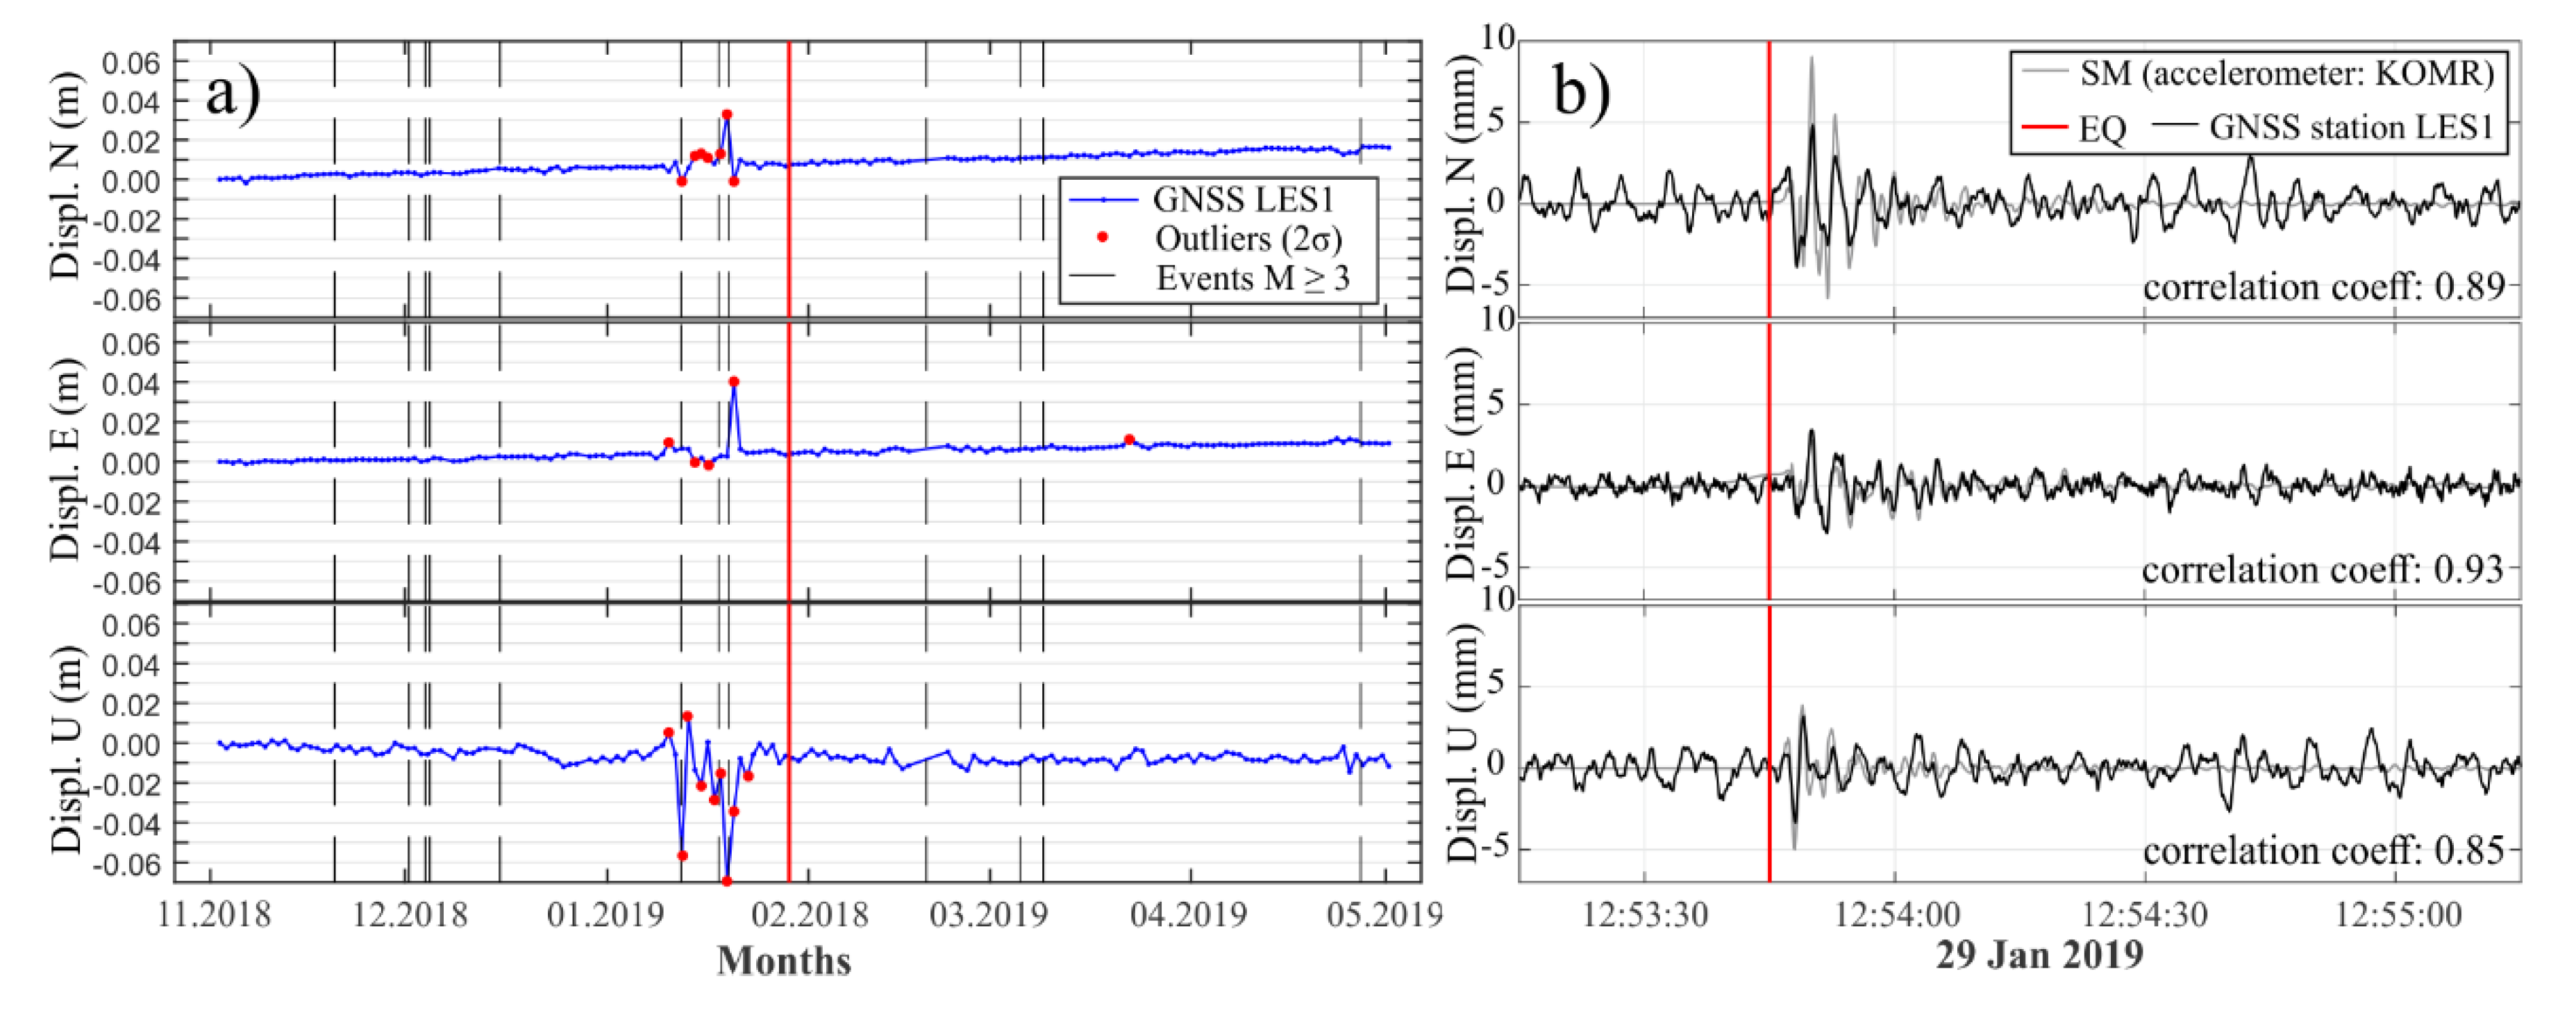
3. GNSS Short- and Long-Term Monitoring

The deformations of mining-induced areas might be monitored by GNSS sensors. In the literature, some research concerning the ground deformation monitoring can be found (e.g., [23,24,25]). However, for short-term oscillations, the papers usually are related to natural earthquake analysis (e.g., [26,27,28,29]). For the current study, the GNSS observations at station LES1, collected at 10 Hz from all visible GPS, GLONASS, Galileo and Bediou satellites, were processed in two different modes: (1) as a long-term network daily solution, producing high-quality, daily-coordinates time-series for a period of six months (three before and three after the event); and (2) short-term, high-frequency oscillations in the horizontal and vertical coordinates, observed during the event, to produce a high-frequency picture of the seismic wave passage.

3.1. Long-Term Monitoring

The daily solution was performed for station LES1 using Bernese GPS Software v.5.2 [30]. Selection of the processing parameters was based on the standard EUREF Permanent GNSS Network (EPN) processing strategy in [31], and they included the following: reference frame: ITRF 2014; orbits and clocks: CODE Final; ionosphere: CODE GLOBAL IONOSPHERE; troposphere: ZTD a priori and mapping function: Vienna Mapping Function 1; reference stations selected from EPN, independent vectors; coordinates and velocities for reference sites: EPN_A_IGS14.SNX; solution type: daily, minimum constrain on translation; estimated parameters: daily coordinates transformed into east, north, up (ENU), troposphere delays, and gradients; time span: 1 November 2018–30 April 2019; quality of estimation measured by mean Helmert transformation root-mean-square error on the daily boundaries: 2.6 mm.
The solution, based on double differences and an independent network of vectors, showed a high level of consistency between consecutive days, as confirmed by a low Helmert transformation RMS. The daily solutions were not combined into a full-period solution, so as to allow the detection of jumps related to post-seismic deformations; therefore, the impact of the plate velocities on the reference stations was removed using the EPN solution [31]. The constant velocities in each component were estimated. The analysis of six months of coordinate time-series (Figure 3a) showed that, for the north component (top panel), five significant (larger than 2σ) jump events were recorded. For the east component (middle panel), it was five events, and for the up component, it was nine events. For the investigated case (red line in Figure 3a), none of the estimated coordinates exceeded 2σ threshold. However, other events (marked as a grey dashed line in Figure 3a) coincide with significant outliers; further studies should investigate whether there is a connection between deformations and induced seismic events.

3.2. Short-Term Monitoring

The high-rate GNSS data was recorded by station LES1, which was collocated with the KOMR accelerometer, 2.5 km north-east of the epicentre. Two hours of 10-Hz GPS data were processed using GAMIT/GLOBK v.10.9 software [32] and the double-differencing method in kinematic mode. The WROE reference station was located 79 km south-east of the epicentre, outside the deformation zone. For processing, CODE final orbits and differential code biases were used. The phase and code observables were combined to remove ionospheric refraction by the Melbourne–Wübbena combination [33,34]. Additionally, the Universitat Politècnica de Catalunya’s rapid Global Ionosphere Maps (UQRG) was used, which significantly reduced the noise in the resultant position time-series. The UQRG model had a 5.0 × 2.5 spatial resolution and a 15-minute temporal resolution [35].
The geocentric coordinates (XYZ) obtained were transformed into local topocentric (ENU) coordinates and displacements. To compare the GNSS-displacement time-series with the positions calculated from the accelerometric data, both time-series were reduced to the period starting 30 s before the event and finishing 90 s after (Figure 3b). The low-frequency noise of the GPS position time-series was removed using the second-order Butterworth filter and the high-pass frequency set to 0.15 Hz, based on the Fourier spectra of the seismological position time-series [27]. This reduced the standard deviations of the GPS position time-series from several millimetres to less than 1 mm. Pearson’s correlation coefficient reached 0.93, 0.89 and 0.85 for the E, N and U displacement time-series, respectively. This indicates good agreement between both time series.

4. InSAR Data and Analyses

Two InSAR techniques were used to obtain the areal pattern of the surface deformation: (1) a small baseline subset (SBAS) [36] for slow-rate displacements; and (2) a conventional differential InSAR (DInSAR) [37] for fast-motion monitoring around the epicentre. The selected data had the following parameters: orbits: ascending (track 73) and descending (track 22); type of images: Sentinel-1A/B (C-band), IW mode, VV polarization, SLC format; resolution: ~2.3 m in range, ~13.9 m in azimuth; time span: 28 October 2018 to 20 April 2019; revisiting time: six days, with the exception of one ascending 12-day pair (23 January–4 February 2019). In both techniques, SBAS and DInSAR, the differential interferograms were filtered with a Goldstein filter and were unwrapped using the minimum cost flow (MCF) phase unwrapping procedure [38]. The received phase differences present the surface deformation in the line-of-sight (LOS) direction to the satellite in grid images with 20-m resolution. All the interferograms were vertically translated to a common reference point, namely station LES1 (Figure 1a), and were roughly converted to vertical displacements by the division to cosine of the incidence angle. The 1 arc-second (30 m) SRTM-DEM [39] was used to remove the topographic phase component.

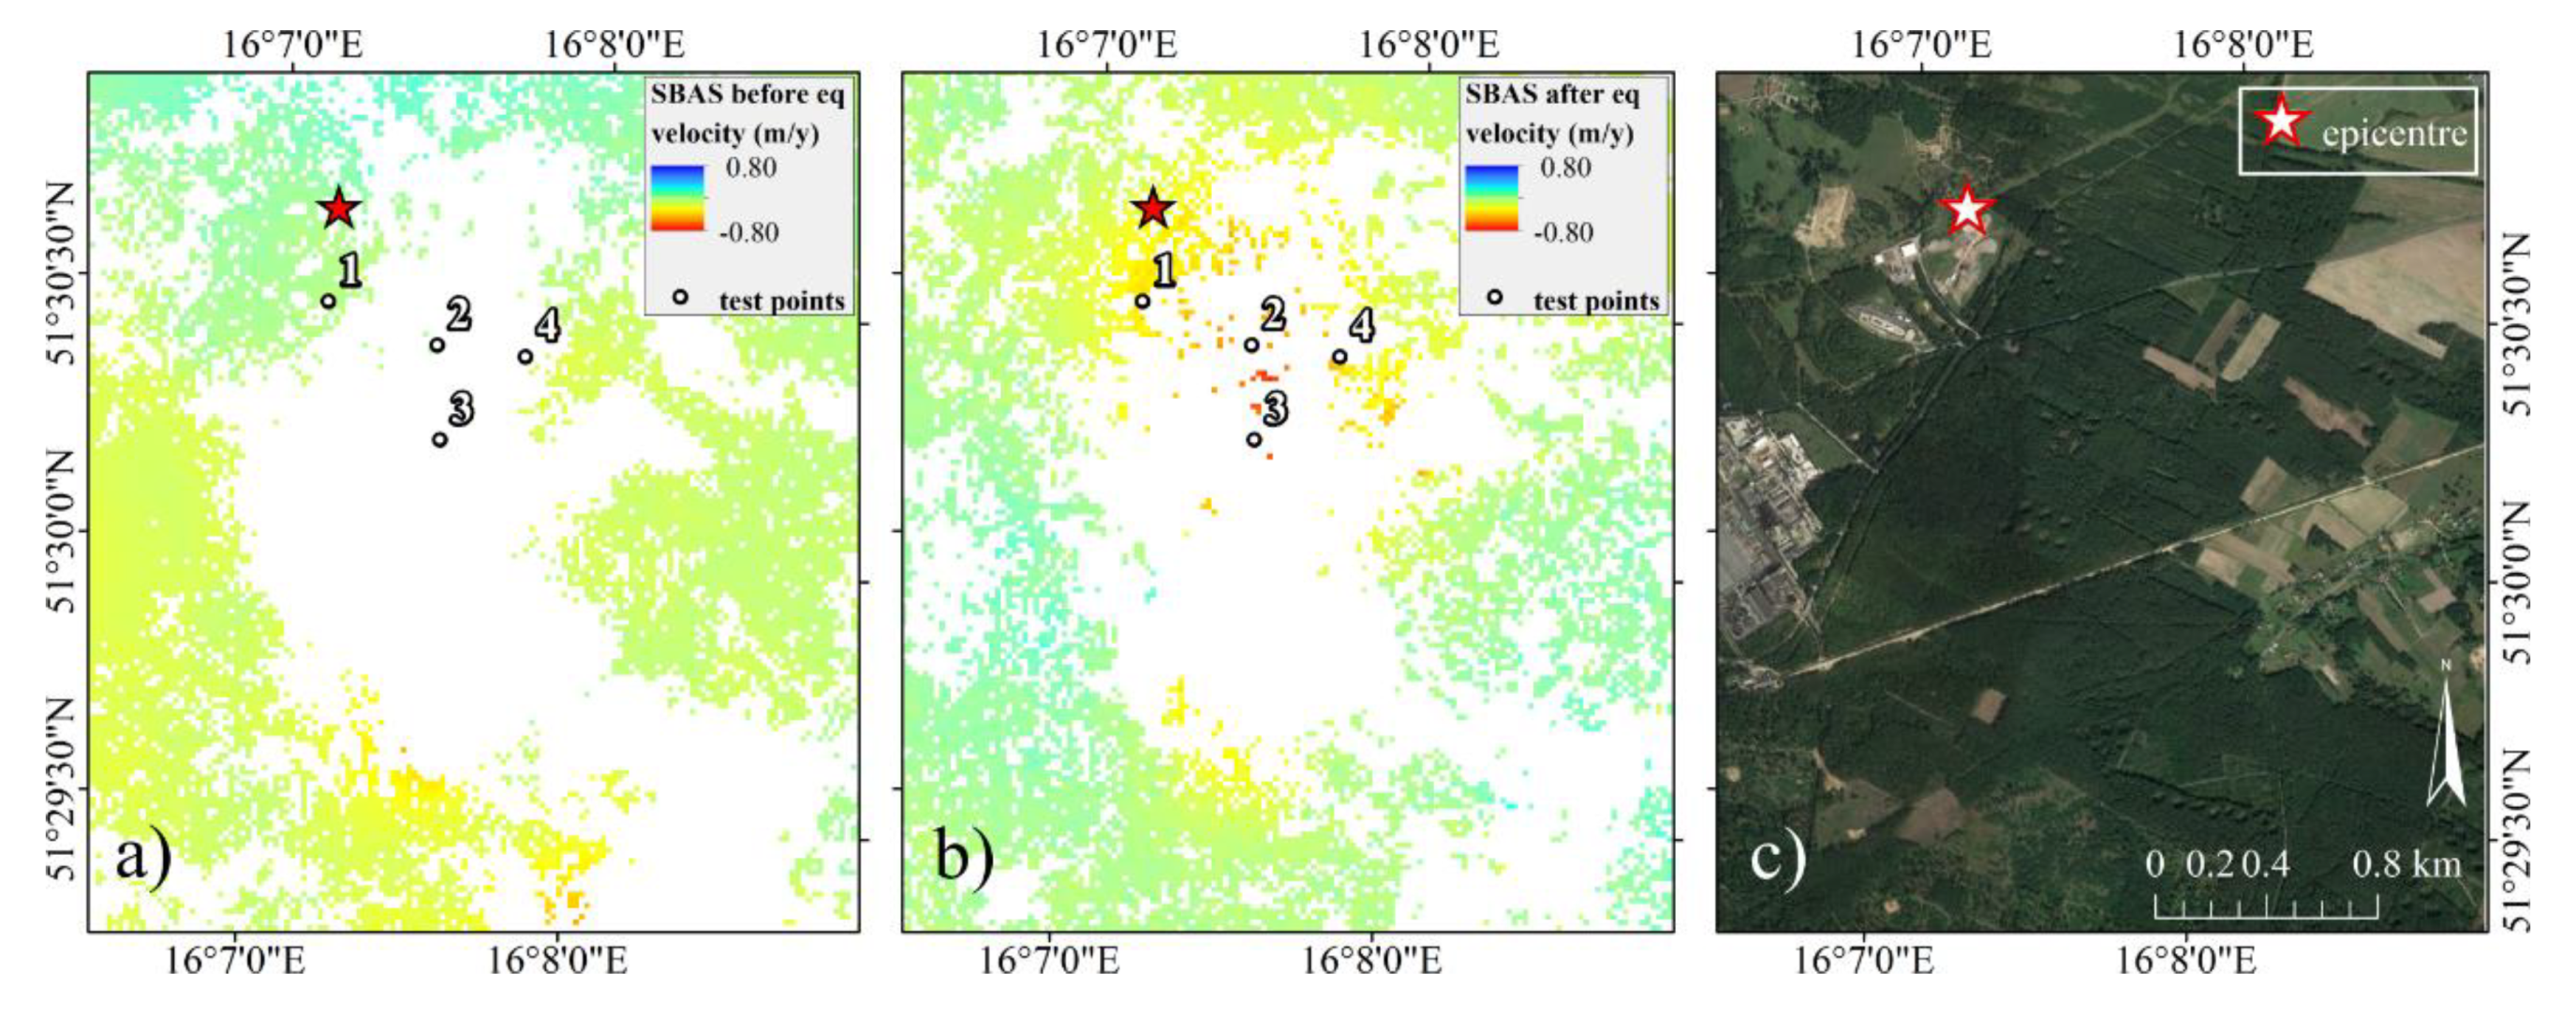
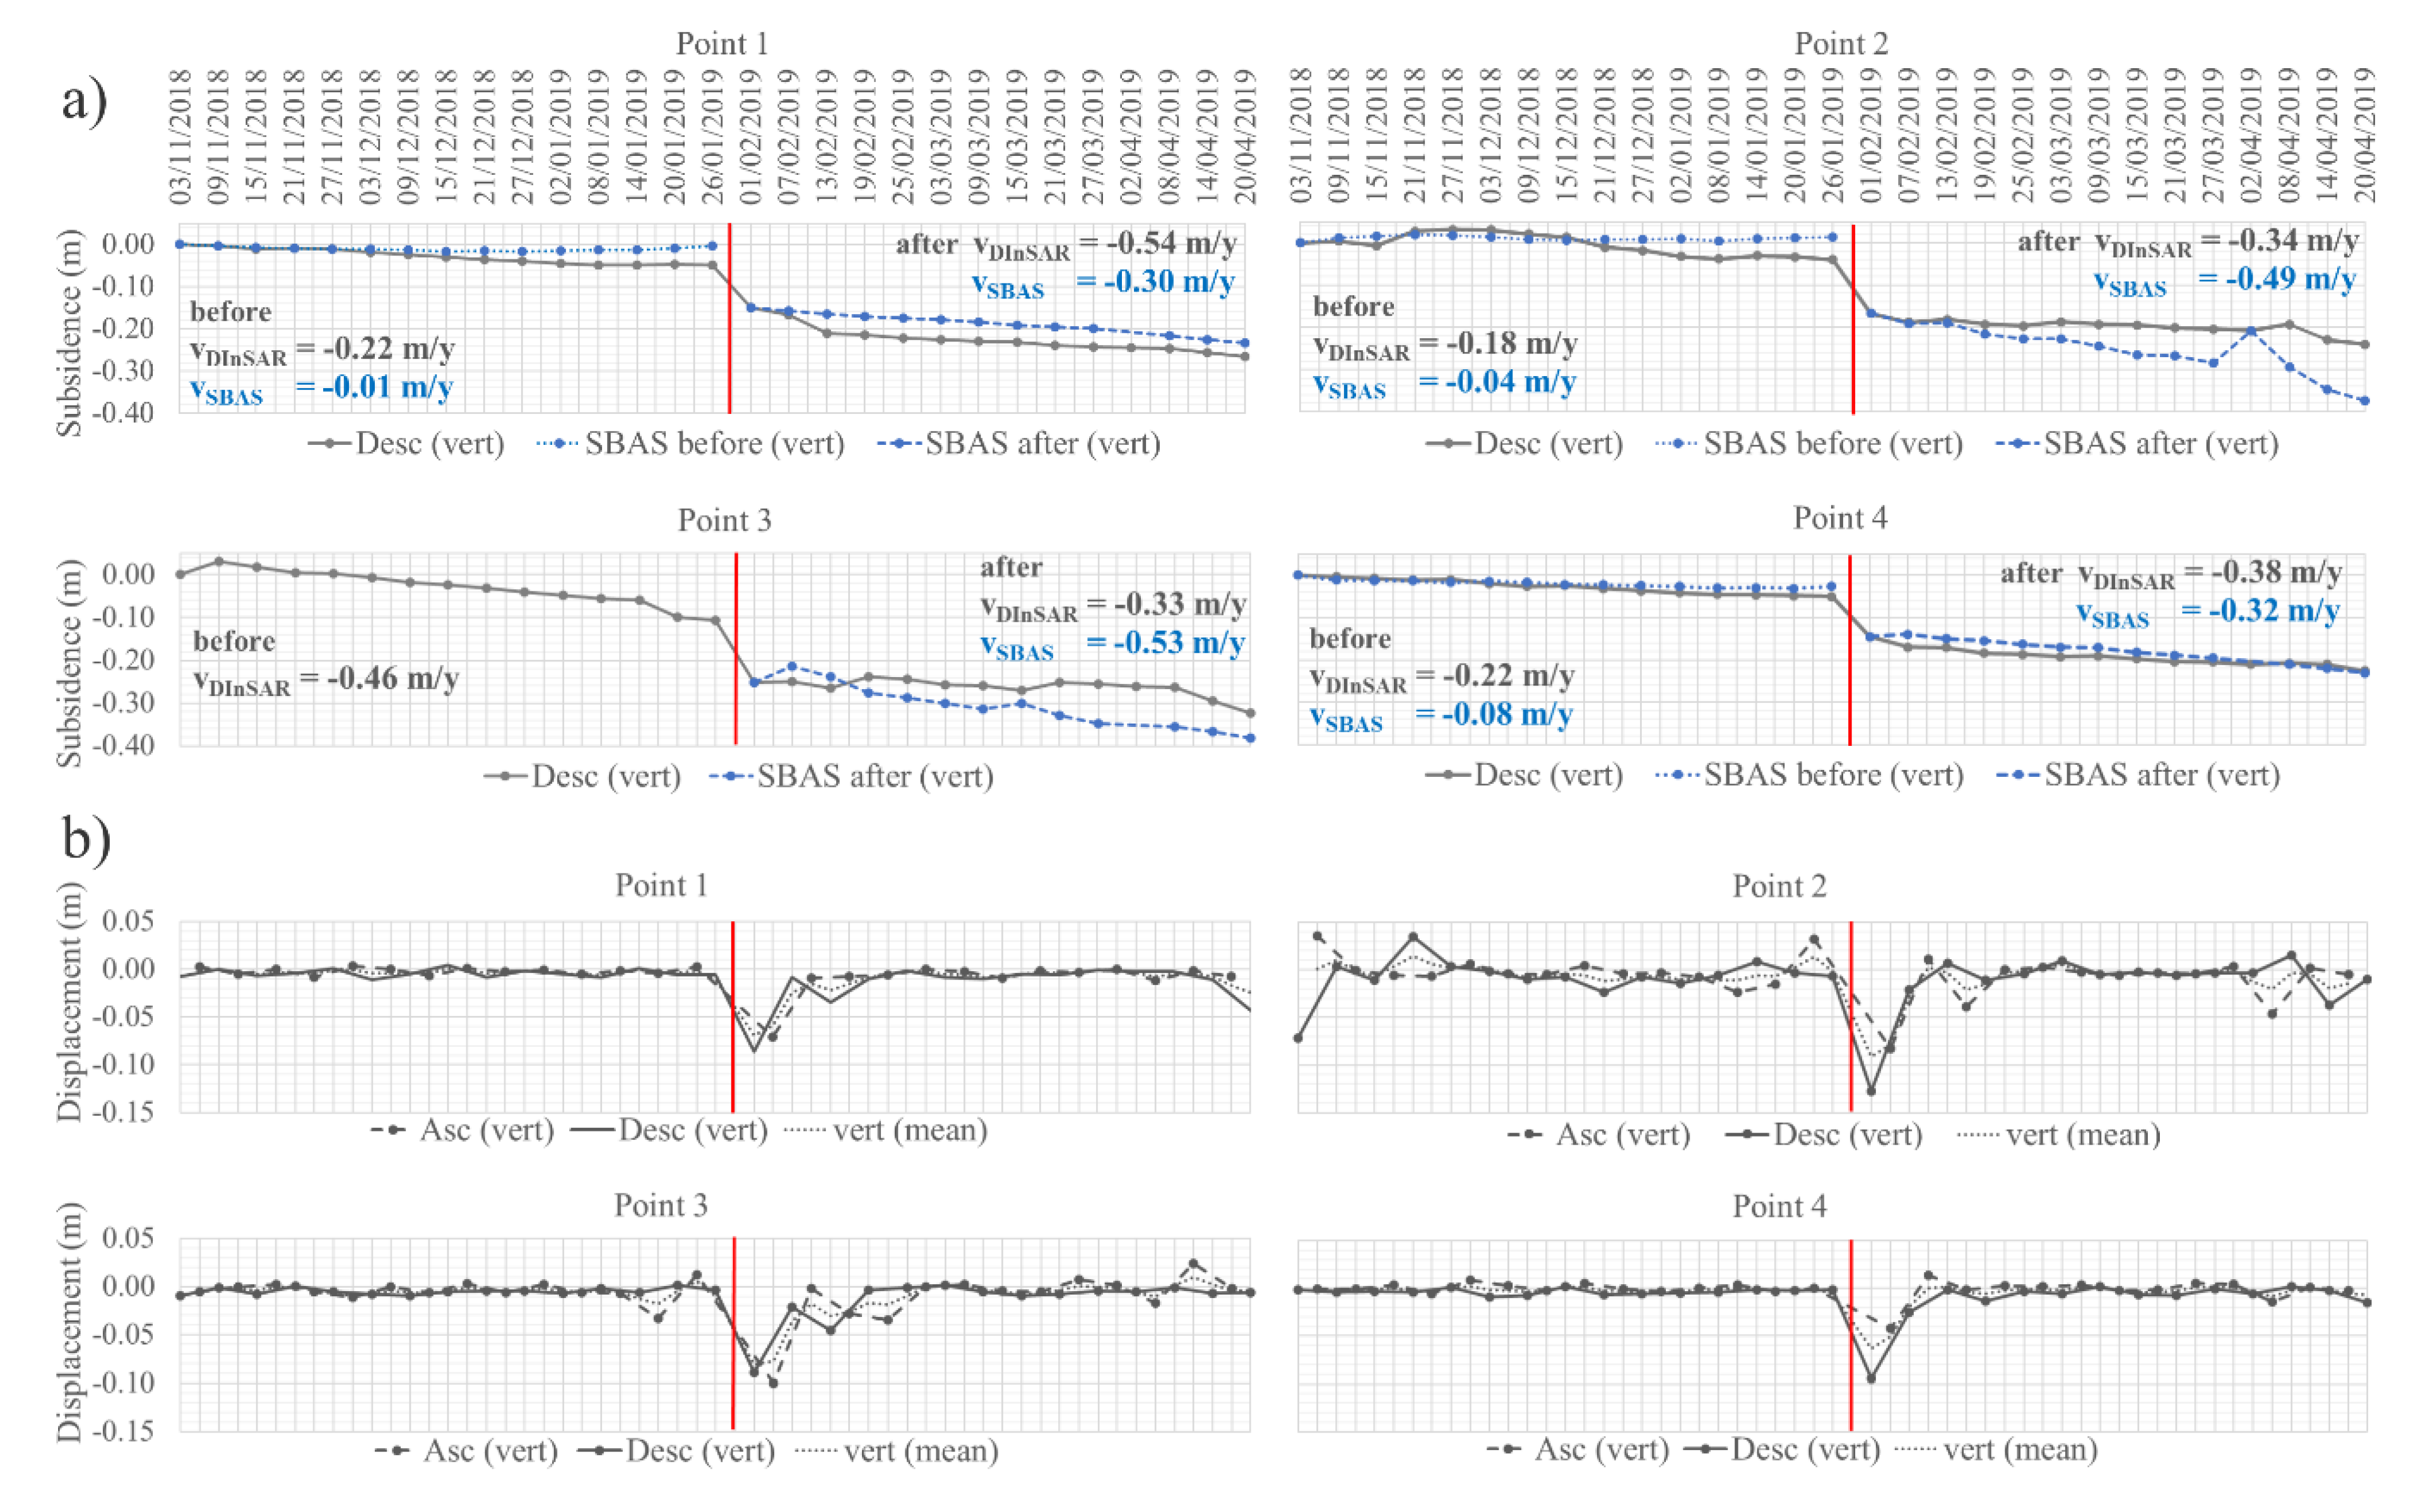
4.1. Slow-Rate Motion Monitoring with SBAS

This technique is typically applied for monitoring slow motions and strain accumulation. It faces some limitations regarding the capability to detect surface deformation rates above certain values depending on the wavelength of the radar signal [40]. Additionally, a bigger part of the studied area is covered by vegetation, thus it is very challenging to investigate it by using stacking-based methods (like SBAS), which depend on a long time coverage and are therefore sensitive to temporal decorrelation. Considering that SBAS has an advantage to estimate atmospheric components, and DInSAR is fully capable of detecting co-seismic displacement (see Section 4.2), these two techniques are complementary to each other and can also be evaluated with each other internally since their results are processed separately using two different softwares—SARscape [41] for SBAS and SNAP [42] for DInSAR. Thus, in SBAS processing, a stack of multi-looked interferograms was applied according to the typical SBAS method [43,44], which is optimised for resolution cells containing distributed scatterer (DS), which are more effective in vegetated areas. Additionally, to maximize the coherence and to avoid incorrectness in the series due to a short rapid movement of the collapse, we divided our dataset for the SBAS processing into two independent datasets from descending images, from three months before (15 images) and three months after the event (14 images). The maximum critical baseline percentage was set to 2%, and the maximum temporal baseline was set to 30 days. The low-quality interferograms were removed from further processing. Finally, 36 and 21 interferograms were used for interferometric component estimation for the first (Figure 4a) and second (Figure 4b) datasets, before and after the event, respectively.
It was not possible to capture the velocity in the centre of the subsidence bowl due to the forest land cover in that area (Figure 4c), which presented an obstacle for the C-band signal. Nevertheless, the results showed a slight acceleration of the movements around the main zone of deformation in the second period, and more prominent vertical displacement, in the range of 80 cm/year, in the most affected area after the earthquake.

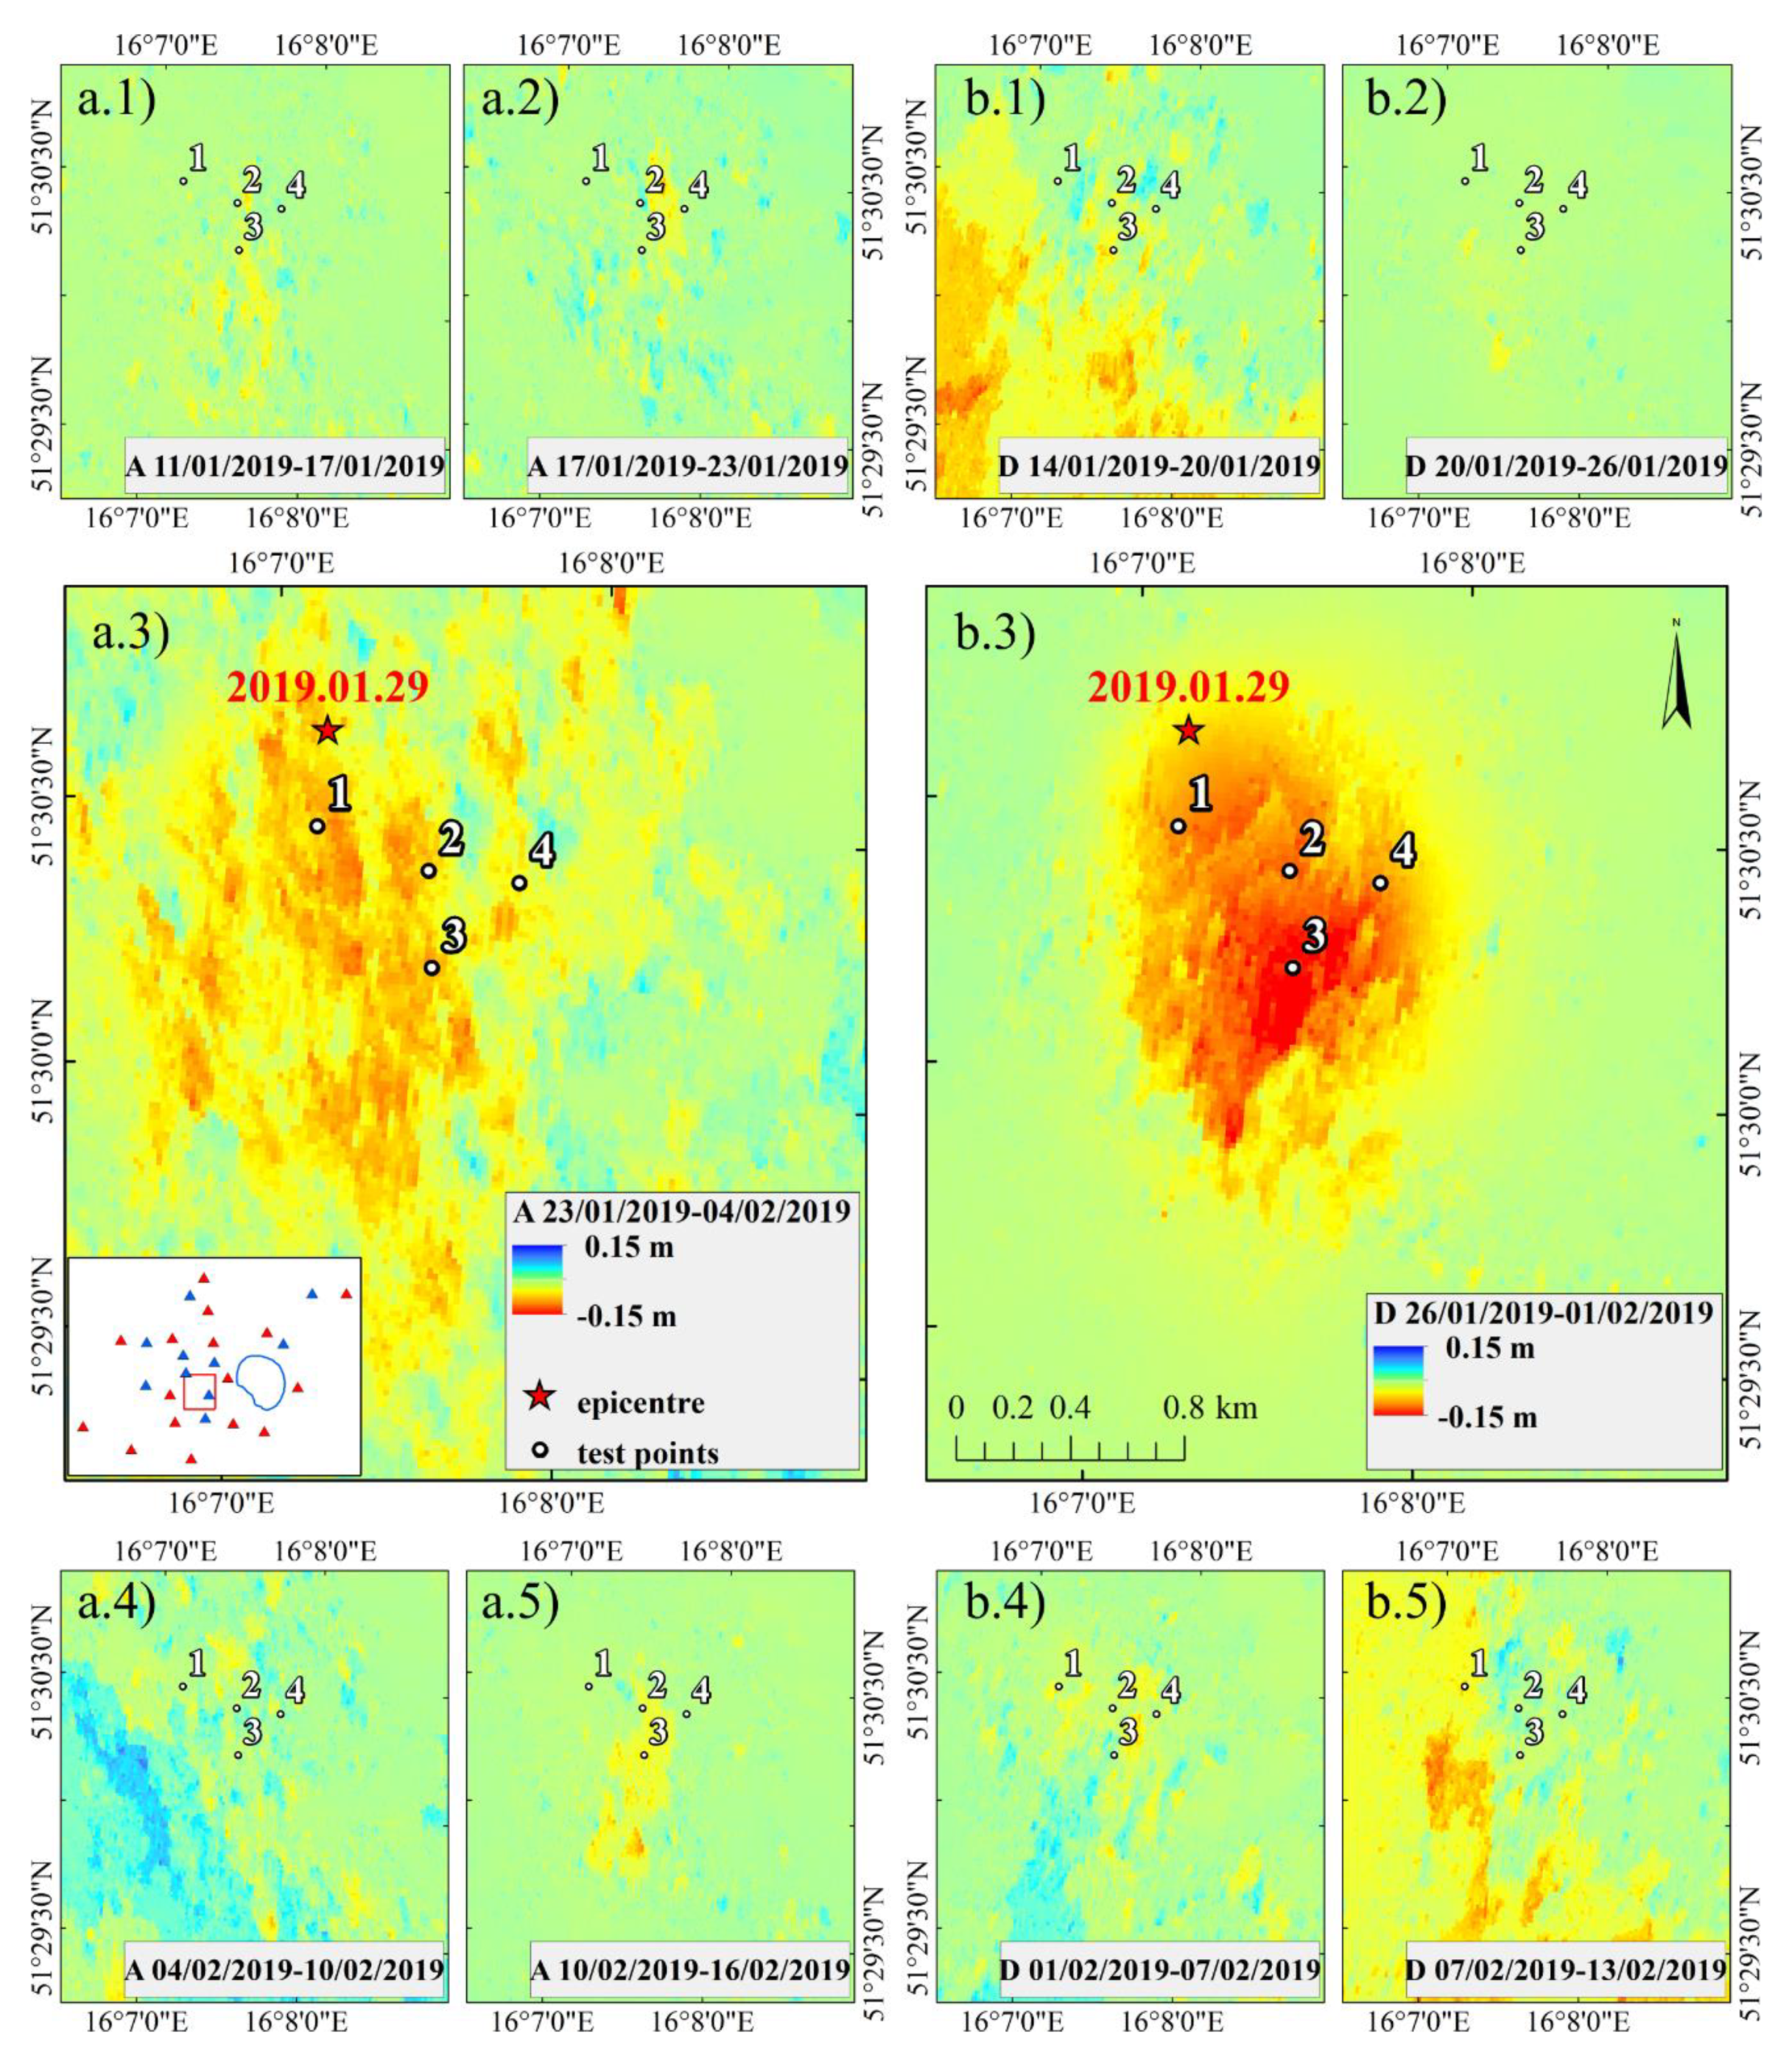
4.2. Earthquake Surface Deformation Detected by DInSAR

For the DInSAR, the Sentinel-1 data were processed following the standard consecutive approach using the smallest temporal six-day baselines, with the exception of the one 12-day ascending pair mentioned earlier. Differential interferograms of adjacent SAR acquisitions were calculated and accumulated to provide complete time-series interferometric results. This technique uses small temporal baselines which minimize temporal decorrelation [44,45]. Vertical displacements at each pixel acquired by DInSAR estimates are presented in Figure 5.

4.3. InSAR Time Series

Four test points (Figure 4 and Figure 5) were selected in order to compare the SBAS and DInSAR vertical subsidence velocities before and after the seismic event (Figure 6a). Three of the test points (1, 2 and 4) coincided with ground objects with solid construction, such as roads and buildings, lying within highly coherent (≥0.9) pixels. Point 3 was chosen in the area of maximal detected SBAS subsidence. It was captured only in the second SBAS set.
The displacement values from the ascending and descending DInSAR deformation maps were extracted and compared by time-series (Figure 6b). The mean values of the vertical displacement in the time-series graphs were calculated by linear interpolation.

5. Discussion and Conclusions

Mining-induced seismicity and the associated ground deformation, measured by advanced geodetic observations, have not been studied by many authors, except in the cases of controlled salt mine cavity collapse [46,47,48], examples in the Upper Silesia Coal Basin [7,8,11,49,50], and in the LGCD [51,52]. Previous works concerning ground deformation studies in mining areas, however, were focused on geodetic data only (i.e., remote sensing or GNSS) ([46,47,48,51,53] and references therein) or used just very basic seismological parameters, usually epicentre locations provided by various seismological centres [13,50]. Some specific models of ground deformations have also been considered previously [54]. Since a mining collapse is actually an isotropic seismic source, these models seem to be in very good agreement with the seismological model of mining collapse. On the other hand, the impact of mining tremor deals with a very minor number of existing subsidence basins in mining areas. Hence, it is difficult to judge, using the geodetic data only, whether the subsidence is directly connected with a tremor or not. In all these studies, it was postulated that the increased seismicity manifested itself on the ground as a higher subsidence rate, with the measurable effects of post-seismic vertical deformation reaching up to 10 cm [52]. We applied several different techniques in order to gain a better understanding of the characteristics of the strong anthropogenic tremors induced by mining activities. These results not only support similar previous studies, but also contribute new findings.
First of all, we determined that shallow-induced seismic events with magnitudes of M4 and above can manifest not only as a relatively strong ground motion but can also provoke significant surface deformation in a very short time. Both effects have been observed in mining areas [6,11], but rarely in such a detailed way as presented here. The combination of different long- and short-time monitoring techniques provided an opportunity to track the process of evolving surface deformation in a complex regime of mining subsidence and anthropogenic seismicity in detail. Thanks to the GNSS and InSAR analysis, the rate and delineation of the subsidence was determined quite well, and we confirmed the rapid subsidence of the ground in relation to the mine roof collapse events.
High-rate GNSS observations have been applied in earthquake analysis and structural health monitoring. Previous studies of seismogeodesy have been concerned with large natural earthquakes with magnitudes exceeding M4.5 and amplitudes reaching decimetres and even meters (e.g., [27,55,56,57]). The event from 29th January is the first example presented of HR-GNSS application in short-term deformations caused by induced earthquakes. Studies related to induced shocks have involved long-term displacements and standard sampling frequencies of up to 1 Hz only [58]. In this study, the greater potential of the HR-GNSS for small events with centimetre-scale amplitudes was confirmed by a comparison with the seismological data. The short-term GNSS observation revealed the possibility of a wider interpretation of the source mechanism in the future. Data from the collocated GNSS and seismic sensors showed very good agreement in the displacement time-series, which indicates that the GNSS stations can be used for additional, alternative data, recorded around an epicentre in an area with sparse seismic sensors. On the other hand, the long-term GNSS study revealed the possible detection of other high-energy seismic events in the area. However, this is highly dependent on the distance between the GNSS station and the seismic sources and requires extended investigation.
The spatial range of the surface deformation derived from the InSAR studies corresponded well with the estimated location and focal mechanism of the event. The DInSAR results showed an undoubted capability to detect and delineate the scale of the surface deformations caused by such an event, as proved by the comparison between the ascending and descending data, even though the ascending co-seismic interferogram (12-day) had a lower quality. The combination of the SBAS and DInSAR results demonstrated the intensive subsidence with varying velocity associated with mining activities. Continuous subsidence occurred in the area at different velocities, depending on the dynamics of the material being extracted and also the local seismicity.
In principle, the source parameters can be derived directly or indirectly from seismograms recorded around the hypocenter. The most important and interesting in the case studied in this work is the source mechanism, which in fact is quite different in comparison with natural earthquakes that occurred on faults. In such regions, the dominance of the double couple mechanisms is observed, and no isotropic sources are expected. Concerning the mechanism, since the subsidence was completed in a very short time after the quake happened, the satellite observations can be used as an indicator for the source type determination. In our case, the geodetic studies strongly supported the full moment tensor estimated with seismological analysis. We also gained better knowledge about the size of the rupture thanks to the additional study of the seismic and geodetic data. This is quite unique in the case of seismicity related to underground mining. Our results also help in better understanding the influence of the collapse like events on surface vibration measured in terms of PGA/PGV. By geodetic techniques, we investigated the surface for possible deformations before and after the event in order to verify the proper detection of the affected area. Last, but not least, it was previously shown that seismic sources with visible rock bursts (e.g., tunnel collapses) in this area are complex (see, e.g., [4,12]). This is not obvious seismological observation and is crucial to understand the phenomena in the future. Since the subsidence is directly connected with the collapse, using geodetic analysis we would be ready to say more about the source physics.
The outcomes from the current study confirm the potential of the applied techniques for investigating ground vibrations and the surface deformation related to them. The studied event highlighted the need for a more detailed study, focused on several areas, starting with the highly complex nature of the ground deformations in areas where mining activities occur. The combination of factors provoking such ground changes, such as the very fast motions caused by moderate tremors with different magnitudes, the fast and slow nonlinear subsidence of the surface triggered by material extraction, and also the change in subsidence rates between the pre- and post-earthquake periods, the local geological structures, underground water-level changes, etc., produce a complex dynamic regime at the mine surface and in the behaviour of the cavity. The combination of different techniques provides a better understanding of the mining and its induced seismicity influence on the surface.
To increase the impact of such joint investigations, several recommendations can be made. A high density of GNSS stations, in areas with significant seismic risk also provoked by human activities, is recommended. A high density will allow a more detailed, long-term study of the horizontal and vertical trends of the surface in the area. On the other hand, the results from short-term GNSS measurements could be used to densify and verify the seismic recordings. Combined observation of long time series of seismological and geodetic data (GNSS, InSAR) could reinforce the possibility of detection of pre-seismic markers, enabling it to become a method for developing an early warning system in mining areas.
Undoubtedly, the investigation of this event has provided a new way for analysing hazardous rock bursts in underground mines. The current study has proved the high potential for obtaining a broader understanding of anthropogenic hazards by combining different Earth monitoring techniques. Joint geodetic and seismological observations can complement each other and help to overcome the individual disadvantages of the separate methods. This approach can be recommended as a complex tool, which can be used to gain a better understanding of the seismicity associated with all kinds of anthropogenic activities. The method would be especially useful in areas with sparse seismic monitoring and/or regions with already known isotropic source mechanisms, such as mining or volcanic.

Supplementary Materials

The following are available online at https://0-www-mdpi-com.brum.beds.ac.uk/2072-4292/12/10/1570/s1, Table S1: Ground motion parameters estimated for LUMINEOS.

Author Contributions

Conceptualization, M.I., Ł.R., G.L. and D.O.; methodology, M.I., Ł.R., K.P.-F., G.L., I.K., D.T. and D.O.; validation, M.I., Ł.R., G.L. and D.O.; formal analysis, M.I., Ł.R., K.P.-F., G.L., I.K., D.T. and D.O.; investigation, M.I., Ł.R., K.P.-F., G.L., I.K., D.T. and D.O.; resources, D.O.; data curation, M.I., Ł.R., K.P.-F., G.L., I.K., D.T. and D.O.; writing—original draft preparation, M.I., Ł.R., K.P.-F., G.L., I.K., D.T. and D.O.; writing—review and editing, M.I., Ł.R., G.L. and D.O.; visualization, M.I., Ł.R., K.P.-F. and D.O.; supervision, Ł.R.; project administration, G.L. and D.O.; funding acquisition, G.L. and D.O. All authors have read and agreed to the published version of the manuscript.

Funding

This study was conducted under the umbrella of the EPOS-PL project, POIR.04.02.00-14-A003/16, funded by the Operational Program Smart Growth 2014–2020, Priority IV: Increasing research potential, Action 4.2: Development of modern research infrastructure in the science sector. It was co-financed by the European Regional Development Fund. GNSS station LES1 was established as part of the EPOS-PL scientific geodetic infrastructure. This work was also partially financed by the Polish Ministry of Science and Higher Education in Poland as a part of its statutory activity No 3841/E-41/S/2020.

Acknowledgments

The seismic data from the local network LUMINEUS are available on the IS-EPOS platform [59] http://tcs.ah-epos.eu/#episode:LGCD, last accessed November 2019. The seismic data from the regional stations are available on the ORFEUS-EIDA project page: http://www.orfeus-eu.org/data/eida/, last accessed November 2019. The Sentinel-1 data used in the study are freely available on the ESA’s Sentinel data hub: https://scihub.copernicus.eu/, last accessed November 2019. The estimated ground motion parameters for the stations from the LUMINEOS network are presented in the Supporting Information associated with this manuscript. The authors express acknowledgments to Witold Rohm and Jan Kapłon from the Institute of Geodesy and Geoinformatics at Wroclaw University of Environmental and Life Sciences, for the critical reading and advices for improvement of the manuscript.

Conflicts of Interest

The authors declare no conflict of interest.

References

  1. Dreger, D.S.; Ford, S.R.; Walter, W.R. Source analysis of the Crandall Canyon, Utah, mine collapse. Science 2008, 321, 217. [Google Scholar] [CrossRef] [PubMed] [Green Version]
  2. Ford, S.R.; Dreger, D.S.; Walter, W.R. Source characterization of the 6 August 2007 Crandall canyon mine seismic event in central Utah. Seismol. Res. Lett. 2008, 79, 637–644. [Google Scholar] [CrossRef] [Green Version]
  3. Ford, S.R.; Dreger, D.S.; Walter, W.R. Identifying isotropic events using a regional moment tensor inversion. J. Geophys. Res. Solid Earth 2009, 114. [Google Scholar] [CrossRef]
  4. Rudzinski, Ł.; Cesca, S.; Lizurek, G. Complex rupture process of the 19 March 2013, Rudna mine (Poland) induced seismic event and collapse in the light of local and regional moment tensor inversion. Seismol. Res. Lett. 2016, 87, 274–284. [Google Scholar] [CrossRef] [Green Version]
  5. Klose, C.D. Geomechanical modeling of the nucleation process of Australia’s 1989 M5.6 Newcastle earthquake. Earth Planet. Sci. Lett. 2007, 256, 547–553. [Google Scholar] [CrossRef]
  6. McGarr, A.; Simpson, D.; Seeber, L. Case histories of induced and triggered seismicity. In IInternational Geophysics Series, International Handbook of Earthquake and Engineering Seismology; Academic Press: Cambridge, MA, USA, 2002; Volume 81A, pp. 647–661. ISBN 0124406521. [Google Scholar]
  7. Mirek, K.; Mirek, J. Non-parametric approximation used to analysis of psinsarTM data of upper silesian coal basin, Poland. Acta Geodyn. Geomater. 2009, 6, 405–409. [Google Scholar]
  8. Mirek, K.; Mirek, J. Observation of underground exploitation influence on a surface in Budryk, Sośnica, and Makoszowy Coal Mine Area. Pol. J. Environ. Stud. 2016, 25, 57–61. [Google Scholar]
  9. Zheng, M.; Deng, K.; Fan, H.; Du, S. Monitoring and analysis of surface deformation in mining area based on InSAR and GRACE. Remote Sens. 2018, 10, 1392. [Google Scholar] [CrossRef] [Green Version]
  10. Malinowska, A.A.; Witkowski, W.T.; Guzy, A.; Hejmanowski, R. Mapping ground movements caused by mining-induced earthquakes applying satellite radar interferometry. Eng. Geol. 2018, 246, 402–411. [Google Scholar] [CrossRef]
  11. Rudziński, Ł.; Mirek, K.; Mirek, J. Rapid ground deformation corresponding to a mining-induced seismic event followed by a massive collapse. Nat. Hazards 2019, 96, 461–471. [Google Scholar] [CrossRef] [Green Version]
  12. Rudziński, Ł.; Cesca, S.; Talaga, A.; Koziarz, E. Complex mechanism of rockburst observed on Polish copper mines. In Proceedings of the 9th International Symposium on Rockbursts and Seismicity in Mines—RaSiM9, Santiago, Chile, 15–17 November 2017; Vallejos, J.A., Ed.; University of Chile: Santiago, Chile, 2017; pp. 87–92. [Google Scholar]
  13. Milczarek, W. Investigation of post inducted seismic deformation of the 2016 Mw4.2 Tarnowek Poland mining tremor based on DInSAR and SBAS methods. Acta Geodyn. Geomater. 2019, 16, 183–193. [Google Scholar] [CrossRef]
  14. Dec, J.; Pietsch, K.; Marzec, P. Application of seismic methods to identify potential gas concentration zones at the Zechstein Limestone Level in the “Rudna” mining area, SW Poland. Ann. Soc. Geol. Pol. 2011, 81, 63–78. [Google Scholar]
  15. Orfeus: European Integrated Data Archive. Available online: http://www.orfeus-eu.org/data/eida/ (accessed on 8 August 2019).
  16. Hasegawa, H.S.; Wetmiller, R.J.; Gendzwill, D.J. Induced seismicity in mines in Canada—An overview. Pure Appl. Geophys. 1989, 129, 423–453. [Google Scholar] [CrossRef]
  17. Heimann, S.; Kriegerowski, M.; Isken, M.; Cesca, S.; Daout, S.; Grigoli, F.; Juretzek, C.; Megies, T.; Nooshiri, N.; Steinberg, A.; et al. Pyrocko—An Open-Source Seismology Toolbox and Library. V. 0.3; GFZ: Potsdam, Germany, 2017. [Google Scholar]
  18. Heimann, S. A Robust Method to Estimate Kinematic Earthquake Source Parameters. Ph.D. Thesis, University of Hamburg, Hamburg, Germany, 2011. [Google Scholar]
  19. Sen, A.T.; Cesca, S.; Bischoff, M.; Meier, T.; Dahm, T. Automated full moment tensor inversion of coal mining-induced seismicity. Geophys. J. Int. 2013, 195, 1267–1281. [Google Scholar] [CrossRef] [Green Version]
  20. Grad, M.; Jensen, S.L.; Keller, G.R.; Guterch, A.; Thybo, H.; Janik, T.; Tiira, T.; Yliniemi, J.; Luosto, U.; Motuza, G.; et al. Crustal structure of the Trans-European suture zone region along POLONAISE’97 seismic profile P4. J. Geophys. Res. 2003, 108, 2541. [Google Scholar] [CrossRef]
  21. Jost, M.L.; Herrmann, R.B. A Student’s Guide to and Review of Moment Tensors. Seismol. Res. Lett. 1989, 60, 37–57. [Google Scholar] [CrossRef]
  22. Talebi, S.; Coté, M. Implosional Focal Mechanisms in a Hard-Rock Mine. In Proceedings of the Controlling Seismic Risk, 6th International Symposium on Rockburst and Seismicity in Mines, Perth, Australia, 9–11 March 2005; Potvin, Y., Hudyma, M., Eds.; Australian Centre for Geomechanics: Perth, Australia, 2005; pp. 113–121. [Google Scholar]
  23. Hu, H.; Gao, J.; Yao, Y. Land deformation monitoring in mining area with PPP-AR. Int. J. Min. Sci. Technol. 2014, 24, 207–212. [Google Scholar] [CrossRef]
  24. Bian, H.F.; Zhang, S.B.; Zhang, Q.Z.; Zheng, N.S. Monitoring large-area mining subsidence by GNSS based on IGS stations. Trans. Nonferrous Met. Soc. China 2014, 24, 514–519. [Google Scholar] [CrossRef]
  25. Üstün, A.; Tuşat, E.; Yalvaç, S.; Özkan, İ.; Eren, Y.; Özdemir, A.; Bildirici, Ö.; Üstüntaş, T.; Kırtıloğlu, O.S.; Mesutoğlu, M.; et al. Land subsidence in Konya Closed Basin and its spatio-temporal detection by GPS and DInSAR. Environ. Earth Sci. 2015, 73, 6691–6703. [Google Scholar] [CrossRef]
  26. Li, X.; Zheng, K.; Li, X.; Liu, G.; Ge, M.; Wickert, J.; Schuh, H. Real-time capturing of seismic waveforms using high-rate BDS, GPS and GLONASS observations: The 2017 Mw 6.5 Jiuzhaigou earthquake in China. GPS Solut. 2019, 23, 1–12. [Google Scholar] [CrossRef]
  27. Kudlacik, I.; Kaplon, J.; Bosy, J.; Lizurek, G. Seismic phenomena in the light of high-rate GPS precise point positioning results. Acta Geodyn. Geomater. 2019, 193, 99–112. [Google Scholar] [CrossRef] [Green Version]
  28. Michel, C.; Kelevitz, K.; Houlié, N.; Edwards, B.; Psimoulis, P.; Su, Z.; Clinton, J.; Giardini, D. The potential of high-rate GPS for strong ground motion assessment. Bull. Seismol. Soc. Am. 2017, 107, 1849–1859. [Google Scholar] [CrossRef] [Green Version]
  29. Bock, Y.; Prawirodirdjo, L.; Melbourne, T.I. Detection of arbitrarily large dynamic ground motions with a dense high-rate GPS network. Geophys. Res. Lett. 2004, 31. [Google Scholar] [CrossRef] [Green Version]
  30. Dach, R.; Lutz, S.; Walser, P.; Fridez, P. (Eds.) Bernese GNSS Software Version 5.2. User Manual; Astronomical Institute, University of Bern, Bern Open Publishing: Bern, Switzerland, 2015; ISBN 978-3-906813-05-9. [Google Scholar]
  31. Bruyninx, C.; Legrand, J.; Fabian, A.; Pottiaux, E. GNSS metadata and data validation in the EUREF Permanent Network. GPS Solut. 2019, 23, 106. [Google Scholar] [CrossRef]
  32. Herring, T.A.; King, R.W.; Floyd, M.A.; McClusky, S.C. Introduction to GAMIT/GLOBK; Release 10.8; Massachusetts Institute of Technology: Cambridge, MA, USA, 2018. [Google Scholar]
  33. Melbourne, W. The Case for Ranging in GPS Based Geodetic System. In Proceedings of the 1st International Symposium on Precise Positioning with the Global Positioning System, Rockville, MD, USA, 15–19 April 1985; Goad, C., Ed.; U.S. Department of Commerce: Rockville, MD, USA, 1985. [Google Scholar]
  34. Wübbena, G. Software Developments for Geodetic Positioning with GPS Using TI 4100 Code and Carrier Measurements. In Proceedings of the 1st International Symposium on Precise Positioning with the Global Positioning System, Rockville, MD, USA, 15–19 April 1985; Goad, C., Ed.; U.S. Department of Commerce: Rockville, MD, USA, 1985; pp. 403–412. [Google Scholar]
  35. Orús, R.; Hernández-Pajares, M.; Juan, J.M.; Sanz, J. Improvement of global ionospheric VTEC maps by using kriging interpolation technique. J. Atmos. Solar Terr. Phys. 2005, 67, 1598–1609. [Google Scholar] [CrossRef]
  36. Berardino, P.; Fornaro, G.; Lanari, R.; Sansosti, E. A new algorithm for surface deformation monitoring based on small baseline differential SAR interferograms. IEEE Trans. Geosci. Remote Sens. 2002, 40, 2375–2383. [Google Scholar] [CrossRef] [Green Version]
  37. Massonnet, D.; Rossi, M.; Carmona, C.; Adragna, F.; Peltzer, G.; Feigl, K.; Rabaute, T. The displacement field of the Landers earthquake mapped by radar interferometry. Nature 1993, 364, 138–142. [Google Scholar] [CrossRef]
  38. Chen, C.W.; Zebker, H.A. Network approaches to two-dimensional phase unwrapping: Intractability and two new algorithms. J. Opt. Soc. Am. A 2000, 17, 401–414. [Google Scholar] [CrossRef]
  39. Rodriguez, E.; Morris, C.S.; Belz, J.E.; Chapin, E.C.; Martin, J.M.; Daffer, W.; Hensley, S. An Assessment of the SRTM Topographic Products, Technical Report JPL D-31639; Jet Propulsion Laboratory: Pasadena, CA, USA, 2005. [Google Scholar]
  40. Crosetto, M.; Monserrat, O.; Cuevas-González, M.; Devanthéry, N.; Crippa, B. Persistent Scatterer Interferometry: A review. ISPRS J. Photogramm. Remote Sens. 2016, 115, 78–89. [Google Scholar] [CrossRef] [Green Version]
  41. L3Harris Geospatial ENVI® SARscape®. Available online: https://www.harrisgeospatial.com/Software-Technology/ENVI-SARscape (accessed on 8 May 2020).
  42. ESA SNAP Sentinel-1 Toolbox. Available online: https://step.esa.int/main/toolboxes/sentinel-1-toolbox/ (accessed on 8 May 2020).
  43. Hooper, A.; Bekaert, D.; Spaans, K.; Arikan, M. Recent advances in SAR interferometry time series analysis for measuring crustal deformation. Tectonophysics 2012, 514–517, 1–13. [Google Scholar] [CrossRef]
  44. Pawluszek-Filipiak, K.; Borkowski, A. Integration of DInSAR and SBAS techniques to determine mining-related deformations using Sentinel-1 data: The case study of Rydultowy mine in Poland. Remote Sens. 2020, 12, 242. [Google Scholar] [CrossRef] [Green Version]
  45. Ilieva, M.; Polanin, P.; Borkowski, A.; Gruchlik, P.; Smolak, K.; Kowalski, A.; Rohm, W. Mining Deformation Life Cycle in the Light of InSAR and Deformation Models. Remote Sens. 2019, 11, 745. [Google Scholar] [CrossRef] [Green Version]
  46. Klein, E.; Contrucci, I.; Daupley, X.; Hernandez, O.; Nadim, C.; Cauvin, L.; Pirson, M.; Klein, E.; Contrucci, I.; Daupley, X.; et al. Evolution monitoring of a solution-mining cavern in salt: Identifying and analysing early-warning signals prior to collapse. In Proceedings of the SMRI Fall Technical Conference, Austin, TX, USA, 12–14 October 2008; pp. 1–12. [Google Scholar]
  47. Klein, E.; Contrucci, I.; Cao, N.T.; Bigarre, P. Mining induced seismicity—Monitoring of a large scale salt cavern collapse. In Proceedings of the 73rd European Association of Geoscientists and Engineers Conference and Exhibition 2011: Unconventional Resources and the Role of Technology. Incorporating SPE EUROPEC 2011, Vienna, Austria, 23–26 May 2011; pp. 615–619. [Google Scholar]
  48. Contrucci, I.; Klein, E.; Cao, N.-T.; Daupley, X.; Bigarré, P. Multi-parameter monitoring of a solution mining cavern collapse: First insight of precursors. Comptes Rendus Geosci. 2011, 343, 1–10. [Google Scholar] [CrossRef] [Green Version]
  49. Ćwiękała, M. Korelacja wyników monitoringu geodezyjnego z sejsmicznością indukowaną w czasie eksploatacji ściany VIb-E1 w pokładzie 703/1 w KWK ROW Ruch Rydułtowy Correlation of geodetic monitoring results with seismicity induced by exploitation of longwall VIb-E1 in. Przegląd Górniczy 2019, 75, 4–15. [Google Scholar]
  50. Krawczyk, A.; Grzybek, R. An evaluation of processing InSAR Sentinel-1A/B data for correlation of mining subsidence with mining induced tremors in the Upper Silesian Coal Basin (Poland). E3S Web Conf. 2018, 26. [Google Scholar] [CrossRef] [Green Version]
  51. Szczerbowski, Z.; Jura, J. Mining induced seismic events and surface deformations monitored by GPS permanent stations. Acta Geodyn. Geomater. 2015, 12, 237–248. [Google Scholar] [CrossRef] [Green Version]
  52. Szczerbowski, Z. High-energy seismic events in Legnica–Głogów Copper District in light of ASG-EUPOS data. Rep. Geod. Geoinform. 2019, 107, 25–40. [Google Scholar] [CrossRef] [Green Version]
  53. Wang, L.; Deng, K.; Zheng, M. Research on ground deformation monitoring method in mining areas using the probability integral model fusion D-InSAR, sub-band InSAR and offset-tracking. Int. J. Appl. Earth Obs. Geoinf. 2020, 85, 101981. [Google Scholar] [CrossRef]
  54. Milczarek, W. Application of a Small Baseline Subset Time Series Method with Atmospheric Correction in Monitoring Results of Mining Activity on Ground Surface and in Detecting Induced Seismic Events. Remote Sens. 2019, 11, 1008. [Google Scholar] [CrossRef] [Green Version]
  55. Psimoulis, P.; Houlié, N.; Meindl, M.; Rothacher, M. Consistency of PPP GPS and strong-motion records: Case study of Mw9.0 Tohoku-Oki 2011 earthquake. Smart Struct. Syst. 2015, 16, 347–366. [Google Scholar] [CrossRef] [Green Version]
  56. Nie, Z.; Zhang, R.; Liu, G.; Jia, Z.; Wang, D.; Zhou, Y.; Lin, M. GNSS seismometer: Seismic phase recognition of real-time high-rate GNSS deformation waves. J. Appl. Geophys. 2016, 135, 328–337. [Google Scholar] [CrossRef]
  57. Fratarcangeli, F.; Savastano, G.; D’Achille, M.C.; Mazzoni, A.; Crespi, M.; Riguzzi, F.; Devoti, R.; Pietrantonio, G. VADASE reliability and accuracy of real-time displacement estimation: Application to the Central Italy 2016 earthquakes. Remote Sens. 2018, 10, 1201. [Google Scholar] [CrossRef] [Green Version]
  58. Xu, C.; Gong, Z.; Niu, J. Recent developments in seismological geodesy. Geod. Geodyn. 2016, 7, 157–164. [Google Scholar] [CrossRef]
  59. Orlecka-Sikora, B.; Lasocki, S.; Kocot, J.; Szepieniec, T.; Robert Grasso, J.; Garcia-aristizabal, A.; Schaming, M.; Urban, P.; Jones, G.; Stimpson, I.; et al. An open data infrastructure for the study of anthropogenic hazards linked to georesource exploitation. Sci. Data 2020, 7, 1–16. [Google Scholar] [CrossRef] [PubMed] [Green Version]
Figure 1. The seismic networks employed: (a) Local LUMINEOS network—strong motion sensors (blue triangles), seismometers (red triangles) and location of the KOMR GNSS station, LES1, aligned with a strong motion sensor. The epicentre is marked by a red star. (b) Regional network of broad-band sensors (black triangles) used to estimate the source mechanism, the closest EPN GNSS stations and the WROE reference station (green triangles). Location of these networks within Europe (inset).
Remotesensing 12 01570 g001
Figure 2. Peak ground acceleration: (a) horizontal (PHA) and (b) vertical (PVA); peak ground velocity: (c) horizontal (PHV) and (d) vertical (PVV); and peak ground displacement: (e) horizontal (PHD) and (f) vertical (PVD) estimated from the local LUMINEOS network record, represented as triangles. Red—seismometers. White—strong motion sensors. The location of the estimated epicentre is indicated by a star, and the beach ball represents the focal mechanism in (a). The black rectangle shows the range of the DInSAR plots illustrated in Section 4.2.
Remotesensing 12 01570 g002
Figure 3. GNSS estimates in north, east, and up (top to bottom) components: (a) long-term daily coordinates estimates; (b) DD-GNSS and accelerometer displacement comparison. The red vertical line shows the moment of the roof collapse. The vertical dashed lines in (a) show that other earthquakes with a magnitude more than 3 happened in the radius of 5 km around the LES1 station.
Remotesensing 12 01570 g003
Figure 4. SBAS velocity pattern (a) before the event and (b) after the event; (c) land cover in the area of the subsidence (source: Google Earth).
Remotesensing 12 01570 g004
Figure 5. Vertical deformation patterns derived from the ascending (a) and descending (b) DInSAR interferograms: (1) and (2) pre-seismic; (3) co-seismic—(a.3) 12-day and (b.3) six-day; and (4) and (5) post-seismic. The images used for each interferogram are shown in the format DD/MM/YYYY. The red star represents the epicentre. The numbered dots are the points chosen for time-series comparison (Figure 6). The inset in (a.3) shows the footprint (red rectangle) of the DInSAR results over the local LUMINEOS network. The blue polygon represents the Żelazny Most tailings pond.
Remotesensing 12 01570 g005
Figure 6. Time-series for selected points (Figure 4 and Figure 5), showing: (a) the vertical subsidence for the period three months before and three months after the earthquake (red line), extracted from the descending SBAS (dashed blue lines) and DInSAR (solid black line); (b) the vertical displacement for the same period, extracted from ascending (dashed line) and descending (solid line) DInSAR data. The dotted line represents the mean value of the vertical displacements.
Remotesensing 12 01570 g006

