Performance Modeling Framework for IoT-over-Satellite Using Shared Radio Spectrum
by
 , , , and
Chiu Chun Chan
1,* ,
,
Akram Al-Hourani
1,
Jinho Choi
2,
Karina Mabell Gomez
1 and
Sithamparanathan Kandeepan
1 1
School of Engineering, RMIT University, Melbourne, VIC 3000, Australia
2
School of Information Technology, Deakin University, Geelong, VIC 3220, Australia
*
Author to whom correspondence should be addressed.
Remote Sens. 2020, 12(10), 1666; https://0-doi-org.brum.beds.ac.uk/10.3390/rs12101666
Submission received: 14 April 2020
/
Revised: 11 May 2020
/
Accepted: 19 May 2020
/
Published: 22 May 2020
(This article belongs to the Special Issue Satellite Communication)
Abstract
:Delivering Internet-of-Things (IoT) connectivity over satellite is a promising solution for applications in remote and sparsely populated areas. These applications range from smart agriculture, logistics, asset tracking to emergency services. Using a shared radio spectrum with terrestrial services will facilitate a cost-effective and rapid deployment of IoT-over-Satellite since it reduces the administrative and financial hurdles of leasing a dedicated segment of the spectrum. Although IoT-over-Satellite communication provides larger service coverage, the vast number of IoT devices also increase the interference in the satellite uplink channel, and it becomes a significant challenge for the reliable performance of the IoT-over-satellite. In this paper, we propose a framework for modeling the performance of IoT-over-Satellite access systems when sharing the radio spectrum with terrestrial networks. We take into consideration several important aspects, namely; satellite orbit, terrestrial IoT devices uplink interference, atmosphere and gas absorption, and the probability of line-of-sight. The performance of the overall system is presented in terms of the uplink signal-to-interference-plus-noise ratio (SINR), and thus the time-availability of the satellite link during a typical pass. We focus on low earth orbit satellites due to their potential use in IoT applications, where we evaluate the framework using actual parameters of satellites located in 300–800 km orbits. Furthermore, the paper presents a numercial model to obtain the most suitable antenna beamwidth that maximizes the link-availability of the satellite link by the simultaneous reduction in the terrestrial interference and the boosting of the underlying IoT signal of interest.

1. Introduction
Recently, there has been significant research interest in access networks of the Internet-of-Things (IoT), since a vast number of IoT devices have been deployed around the world. IoT access network allows smart devices to communicate with the Internet and thus to connect with the IoT cloud services, where many of these devices are envisioned as battery-powered with low data rate wireless connectivity. Such networks are referred to as Low-Power Wide Area Networks (LPWAN), where it is crucial to have wireless connectivity that elongates the battery life and has a low fabrication cost. Applications of LPWAN are numerous; ranging from smart grids, environmental monitoring sensors, smart agriculture, asset tracking, to emergency management [1]. Many of these applications are located in rural and remote locations, where it is challenging to deploy terrestrial wireless networks because of either technical difficulties or the lack of a profitable business case. To cater for these scenarios, IoT-over-Satellite access is proposed as a viable solution for a cost-effective and easy-to-deploy network in remote locations [1,2,3] having several commercial solutions that are currently undergoing large-scale deployment [3,4]. With the ongoing trend to unify communication protocols and systems, hybrid terrestrial-satellite systems are increasingly proposed. This trend can be clearly observed in the 3rd Generation Partnership Project (3GPP) efforts to expand 5G into satellite communication services [5,6].
In this paper, we explore the possibility of using the shared Industrial Scientific Medical (ISM)-band for IoT access by sharing this band with existing terrestrial wireless services. Shared radio bands can significantly reduce spectrum acquisition hurdles along with the associated spectrum leasing costs because of the license-free nature of this band. However, such a sharing scheme might come at the cost of the reduced performance due to the mass-interference generated by millions of incumbent terrestrial sources. Therefore, to develop a model of predicting the performance of IoT-over-Satellite communication systems using a shared spectrum is of utmost importance for the IoT-over-satellite industry. With a reliable and robust analytical model, researchers and designers can evaluate the performance of the system in terms of coverage availability and signal quality. Although different researchers propose a simulation framework or simulation system model of satellite communications, such a performance model, or framework is still lacking from today’s literature as most of the current satellite systems are using licensed frequency bands. To bridge this gap, we develop in this paper a performance evaluation framework for the IoT-over-Satellite access in terms of the uplink signal-to-interference-and-noise-ratio (SINR). We derive the SINR at the satellite by considering several factors affecting the performance. These factors include satellite orbit, terrestrial IoT interference, atmosphere and gas absorption, probability of line of sight, and antenna beamwidth. We obtain the satellite location across time by using a common orbital predictor. Then, we estimate the uplink signal and the terrestrial interference using our proposed framework. In order to evaluate this framework under realistic environments, we adopt several parameters in the commonly used LoRaWAN standard [7] over a Low Earth Orbit (LEO) satellite. Then we evaluate the performance of the link in terms of SINR. The main contributions of this paper are summarized as follows:
- Providing an evaluation framework of predicting the uplink SINR in IoT-over-satellite communication.
- Providing a model for obtaining the aggregated uplink interference of terrestrial shared ISM band users as seen from the satellite’s perspective.
- Providing a model for predicting satellite link-availability based on a given antenna beamwidth.
- Finding the optimal beamwidth of satellite antenna beamwidth to maximize link-availability.
The main focus of the paper is to provide a simulation framework to estimate the impact of terrestrial uplink interference to the LEO satellite in the shared spectrum, and it does not necessarily address only ISM or any specific radio frequency band. Although the 1.6 GHz and 2.5 GHz is a suggestion by the 3GPP [8,9], there is no restriction on what frequency bands to be used in IoT-over-satellite communication, and it is interesting to explore the use of a license-free spectrum, such as the ISM band for shared terrestrial-satellite access use since the ISM band devices are commonly used by the public.
2. Background and Literature Review
LEO satellites are referred to satellites that have a circular orbit from 500 km to 2000 km above the Earth. In contrast, Medium Earth Orbit (MEO) satellites are located in the region above the LEO and below the geosynchronous orbit (GEO), having an altitude of 2000 km to 35,786 km, and Highly elliptical orbit (HEO) satellites have an elliptic orbit with high eccentricity around the Earth. The radius of the footprint of a communications satellite in LEO varies from 3000 to 4000 km. Therefore, the maximum visible time of an LEO satellite is up to 25 min to a user during a single pass. In this case, LEO satellites must hand over much more frequently than other types of orbit or communication must be locked to a specified time window for a single satellite. On the other hand, MEO satellites have wider service coverage and longer visible time window to the user when compared with LEO satellites, while HEO satellites are specific to serve high latitude regions [10]. In order to simplify the structure of the IoT satellite system and reduce its cost, LEO satellites using a shared band is considered to be the most suitable solution for IoT satellite communication, and it is suggested by many researchers [1,2,11]. This is because the slant range in LEO is shorter when compared with other orbits. Thus, the path-loss in LEO satellite communication is minimized, leading to a host of useful traits such as; lower transmission power, longer battery life, simpler satellite architecture, lower launch costs, and simpler antenna designs on both the satellite and the IoT device, and it highly reduces the complexity of the ground IoT devices and satellites allowing the construction of Nano-satellite, low power consumption and direct communication from IoTs to satellite system. In such cases, it would be feasible for the IoT device to have a small aperture antenna or a wire antenna without the need for the costly and sometimes infeasible, parabolic antenna setup. Despite all the pros of using LEO satellites for low-power IoT communication, several challenges are currently hindering the full deployment of shared-spectrum LEO satellites, including; (i) the high interference level from terrestrial devices when sharing the spectrum, (ii) a reduced satellite availability time due to the inherited reduction in the low orbit nature, (iii) Doppler shifts due to the relatively large relative velocity of LEO satellites.
2.1. Lower-Power IoT Technologies
In order to elongate the lifetime of IoT devices and thus to reduce the maintenance and replacement cost of an IoT network, low power consumption is a crucial requirement for most of the envisioned IoT applications. Many terrestrial LPWAN technologies were developed in specific response to applications that do not require large bandwidth and are primarily located in hard-to-reach areas. Some practical IoT-over-Satellite products had been used, as shown in References [1,2,4]. The impact of the future SpaceX IoT potential is also studied in Reference [12]. The leading IoT technologies, at the time of writing this paper, are compared in Table 1.
As can be seen from the table, current terrestrial IoT access systems can differ quite significantly in terms of their modulation schemes, radio bandwidth, carrier frequencies, and protocols. These differences lead to a significant variation in terms of interference, data throughput, battery lifespan, and the maximum number of devices per gateway.
The extension of terrestrial LPWAN technologies for satellite access is taking a new momentum, for example, the studies in References [1,2,13,14] address this possibility, with special focus on Narrowband IoT (NB-IoT) and Long Range Wireless Access Network (LoRaWAN) as these technologies have been widely used and these devices are publicly available. Some of these studies have found the suitability of such technologies for IoT-over-Satellite without taking terrestrial interference into account. On the other hand, there are a plethora of field trials for these technologies under realistic interference scenarios for terrestrial applications [15,16]. The performance in terms of block error rate (BLER) and the relation between BLER and the number of users is shown in Reference [15], where NB-IoT outperforms other technologies due to the controlled spectrum access, having a 95 percentile uplink failure probability of less than 4% when there are less than 10 devices. However, the drawback of NB-IoT is that it has a long time on-air (when compared with other IoT technologies), causing a reduction in the longevity of the field IoT devices. A comparison of some IoT-over-Satellite systems is listed in Table 2.
2.2. IoT Spectrum Sharing
Conventional Very Small Aperture Terminal (VSAT) access had been using higher frequency bands such as Ku and Ka-band for many decades to meet the growing capacity requirements and to reduce congestion in the spectrum. Those bands require directional parabolic or patch antennas and careful alignment. Due to the high-directivity, frequency-reuse is quite common in these bands, allowing efficient utilization of the spectrum. On the contrary, Land Mobile Services (LMS) usually utilize the L-Band spectrum with less-directional antennas on the terrestrial terminal [4], allowing mobility without the need for a mechanically steerable antenna. However, for global LMS to function, it requires an exclusive license to use across different terrains and countries, which is quite costly and administratively challenging. As an extension for LMS, IoT-over-LEO Satellite is suggested by international organization 3GPP (3GPP: Third generation Partnership Project coordinating major cellular technologies are standardized) to enable easy deployment and compact devices [4]. Sharing terrestrial bands with satellite IoT access becomes an attractive option because of the reduced spectrum fees and faster access to the market. This has captured the attention of 3GPP that is currently working to extend the cellular network to hybrid terrestrial-satellite services. In the 3GPP technical report [8,9], various types of IoT-over-Satellite enabling 5G network architectures and the solution of terrestrial-to-satellite network integration in 5G had been suggested. Furthermore, a 3GPP task force has been working on satellite-to-NB-IoT integration [17]. While 3GPP systems operate in the licensed spectrum, it is interesting to explore the use of a license-free spectrum, such as the ISM band for shared terrestrial-satellite access use. ISM-band has harmonized standards in many countries around the world, which allow license-free devices to operate within specific parameters; such as the maximum equivalent isotropic radiated power (EIRP), power spectral density, and maximum time-on-air. Therefore, the impact of terrestrial interference on the IoT satellite becomes a major concern in the IoT-over-Satellite system. In Reference [18], the satellite uplink transmission with terrestrial interference is analyzed, assuming an LTE terrestrial network extended by satellite communication using Quadrature Phase Shift Keying (QPSK) or 16—Quadrature amplitude modulation (QAM) modulation with all terrestrial users transmitting at −2 dBm EIRP, and they simulated the uplink SINR level of an LEO satellite showing that communication service can be provided when the number of terrestrial users is less than one million. IoT-over-Satellite communication using the shared ISM band is anticipated to face a massive terrestrial interference in the uplink due to its wide adoption. For example, our previous study in Reference [19] shows that ISM-band 915–928 MHz in Melbourne, Australia is highly congested with spectrum occupancy of around 16%. This figure is quite high for random access systems such as ALOHA, where the normalized spectrum utilization in urban environments is around 40% when considering ALOHA-like access. Since satellites would have a higher probability of Line-of-Sight (LoS) and a wider footprint, the terrestrial interference in the ISM band is expected to be much higher than the terrestrial interference [10].
3. IoT-over-Satellite Performance Modeling
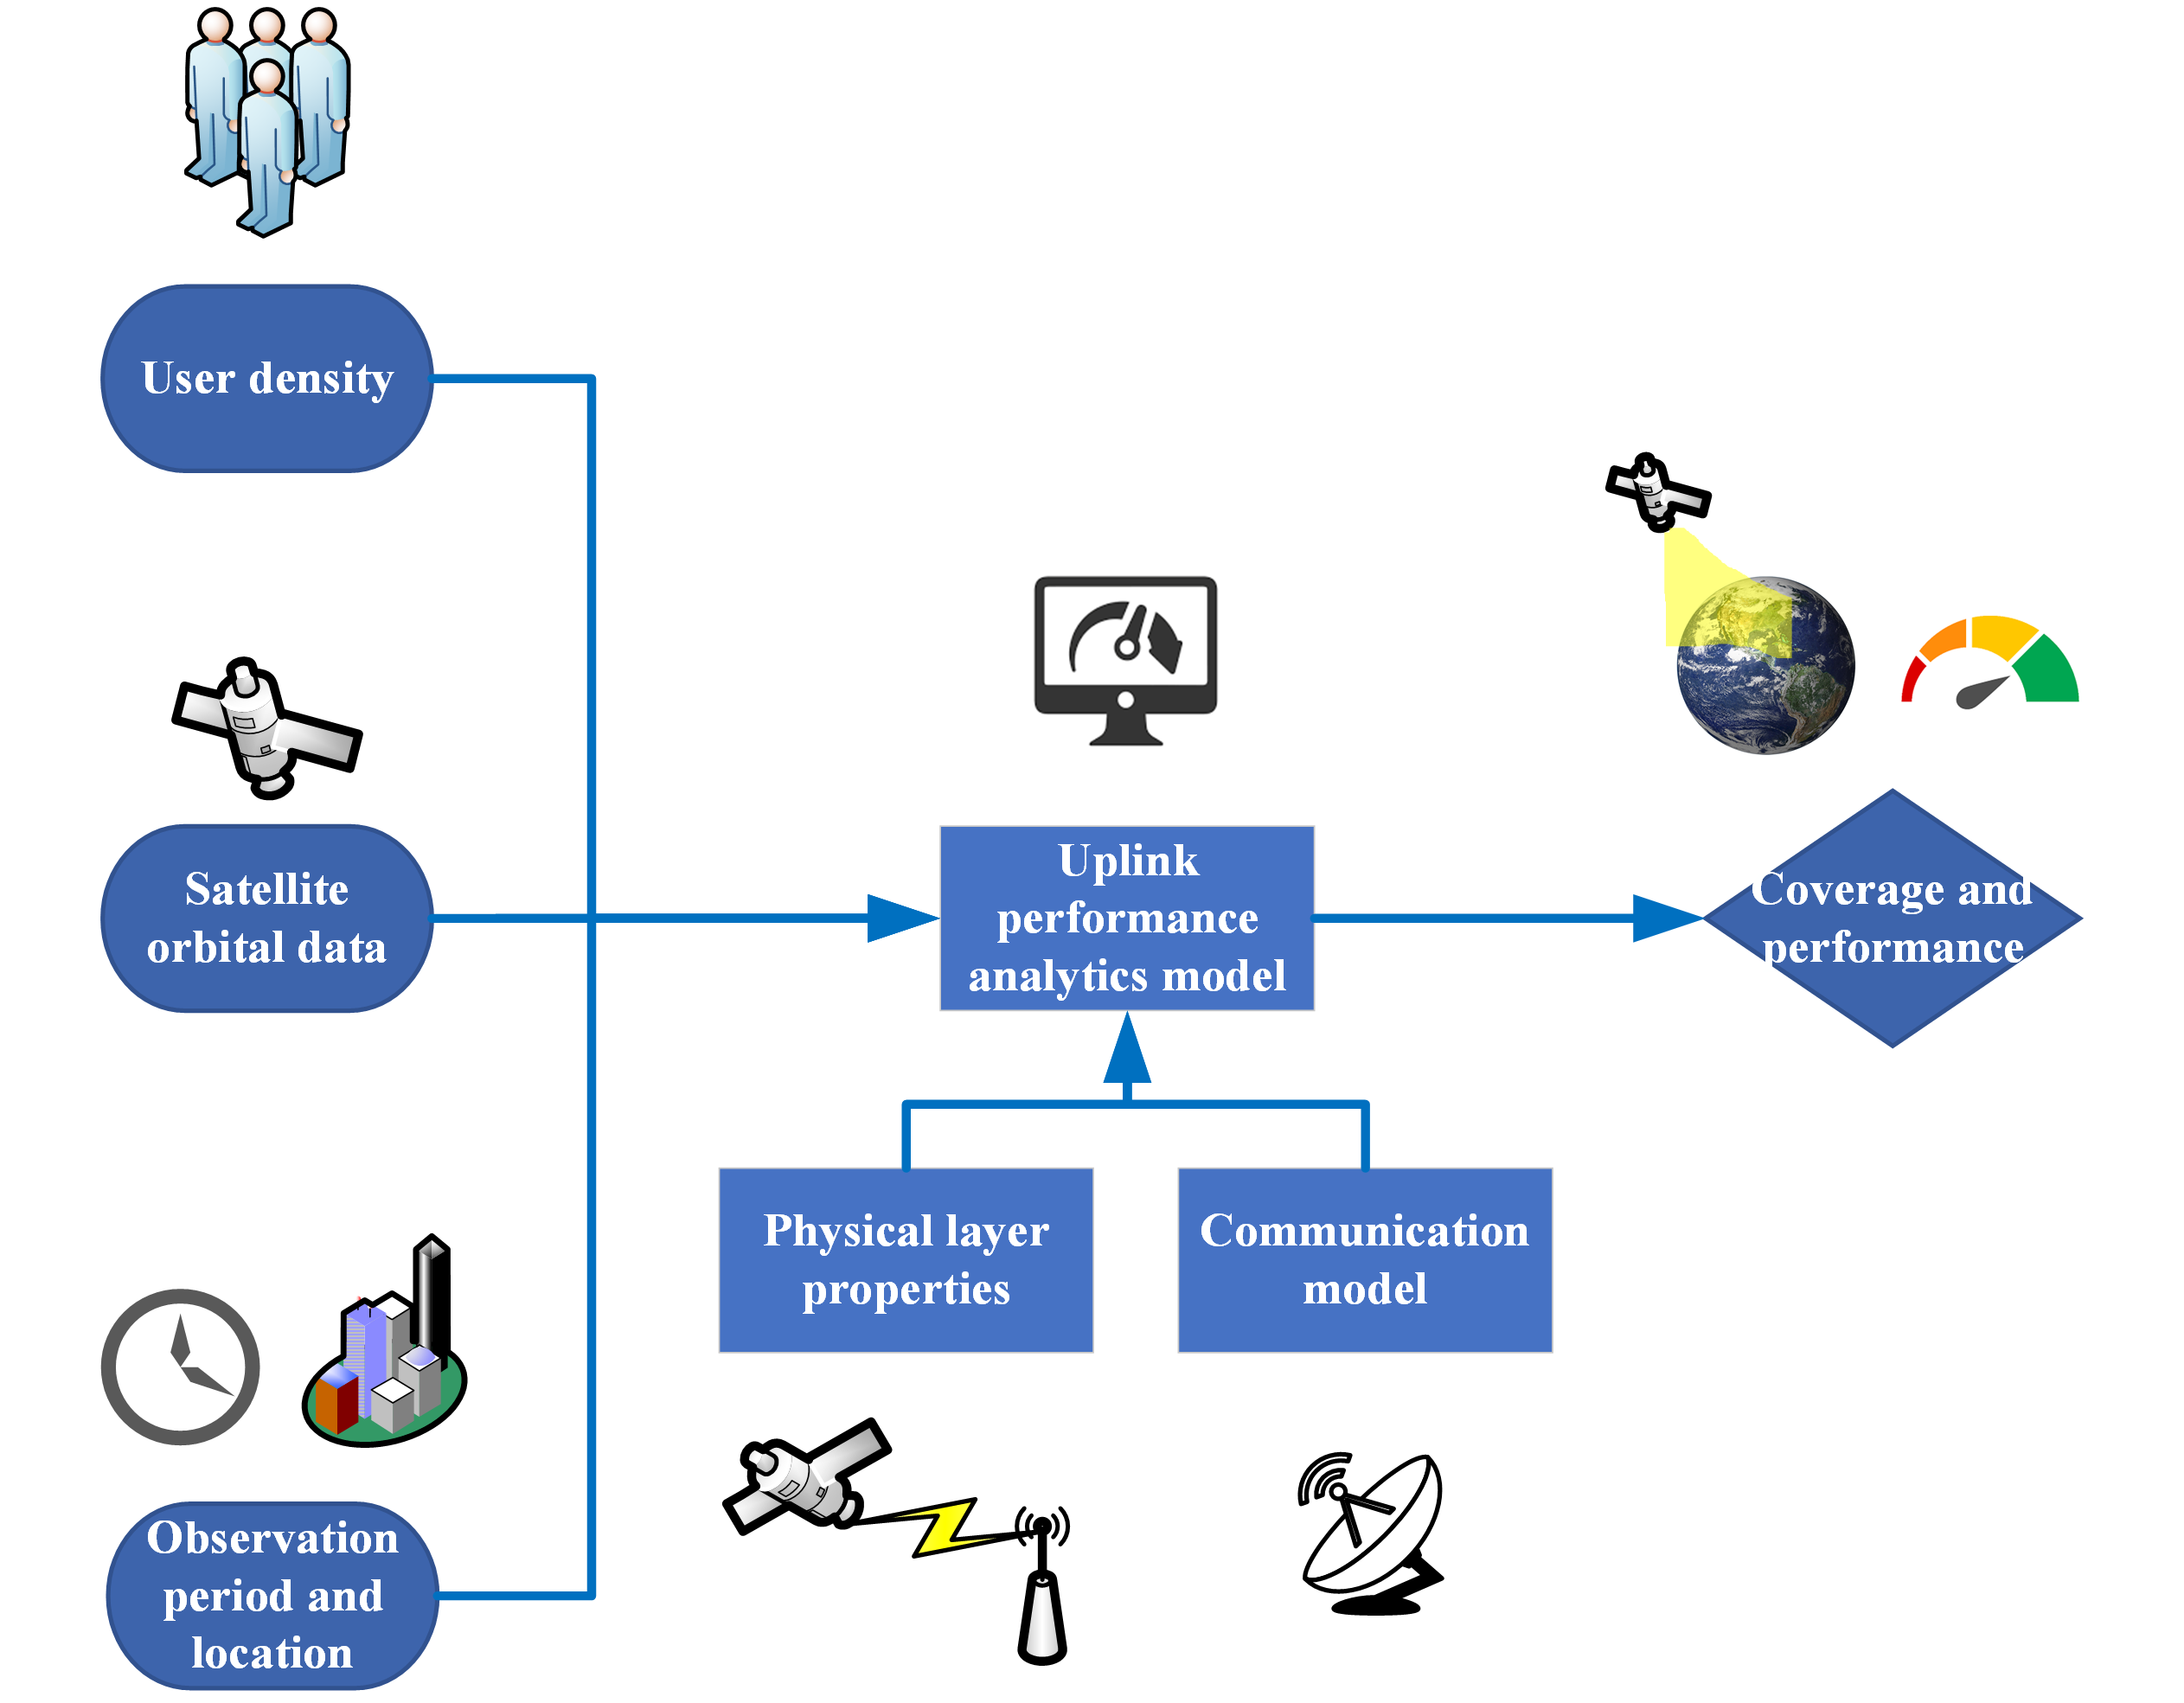
In this section, we describe the proposed modeling approach that will be utilized to evaluate the IoT-over-Satellite performance. We start by using the Simplified General Perturbations (SGP4) orbital predictor [10] to obtain the radio channel performance of both the desired IoT signal and the underlying interference. Without loss of generality, we take Australia as a typical simulation example where measurement points, that is, simulated IoT devices and interferes, are uniformly distributed on a grid. The received power by the satellite for all measurement points is calculated by applying a detailed channel model that takes into consideration several parameters; air absorption [20], free path loss, excessive path loss caused by urban structures [21], and the probability of line-of-sight [22].
The average interference power of the observation points is calculated as the sum of all interference terms generated from the co-channel transmitters existing in the selected ISM band (915–928 MHz). Accordingly, we can obtain the uplink SINR for all measurement points within a given simulation time period. We evaluate the performances of practical IoT technology (namely LoRaWAN) by applying a mapping method that predicts the packet error rate based on the SINR value. This prediction is based on empirical measurements from the literature [23], in which the packet error rate can be estimated by the fitting table in the following subsection.
An overview of the proposed workflow of the performance evaluation model is shown in Figure 1 as a block diagram, while all evaluation parameters are listed in Table 3. In the following subsection, we further elaborate on the performance modeling approach.
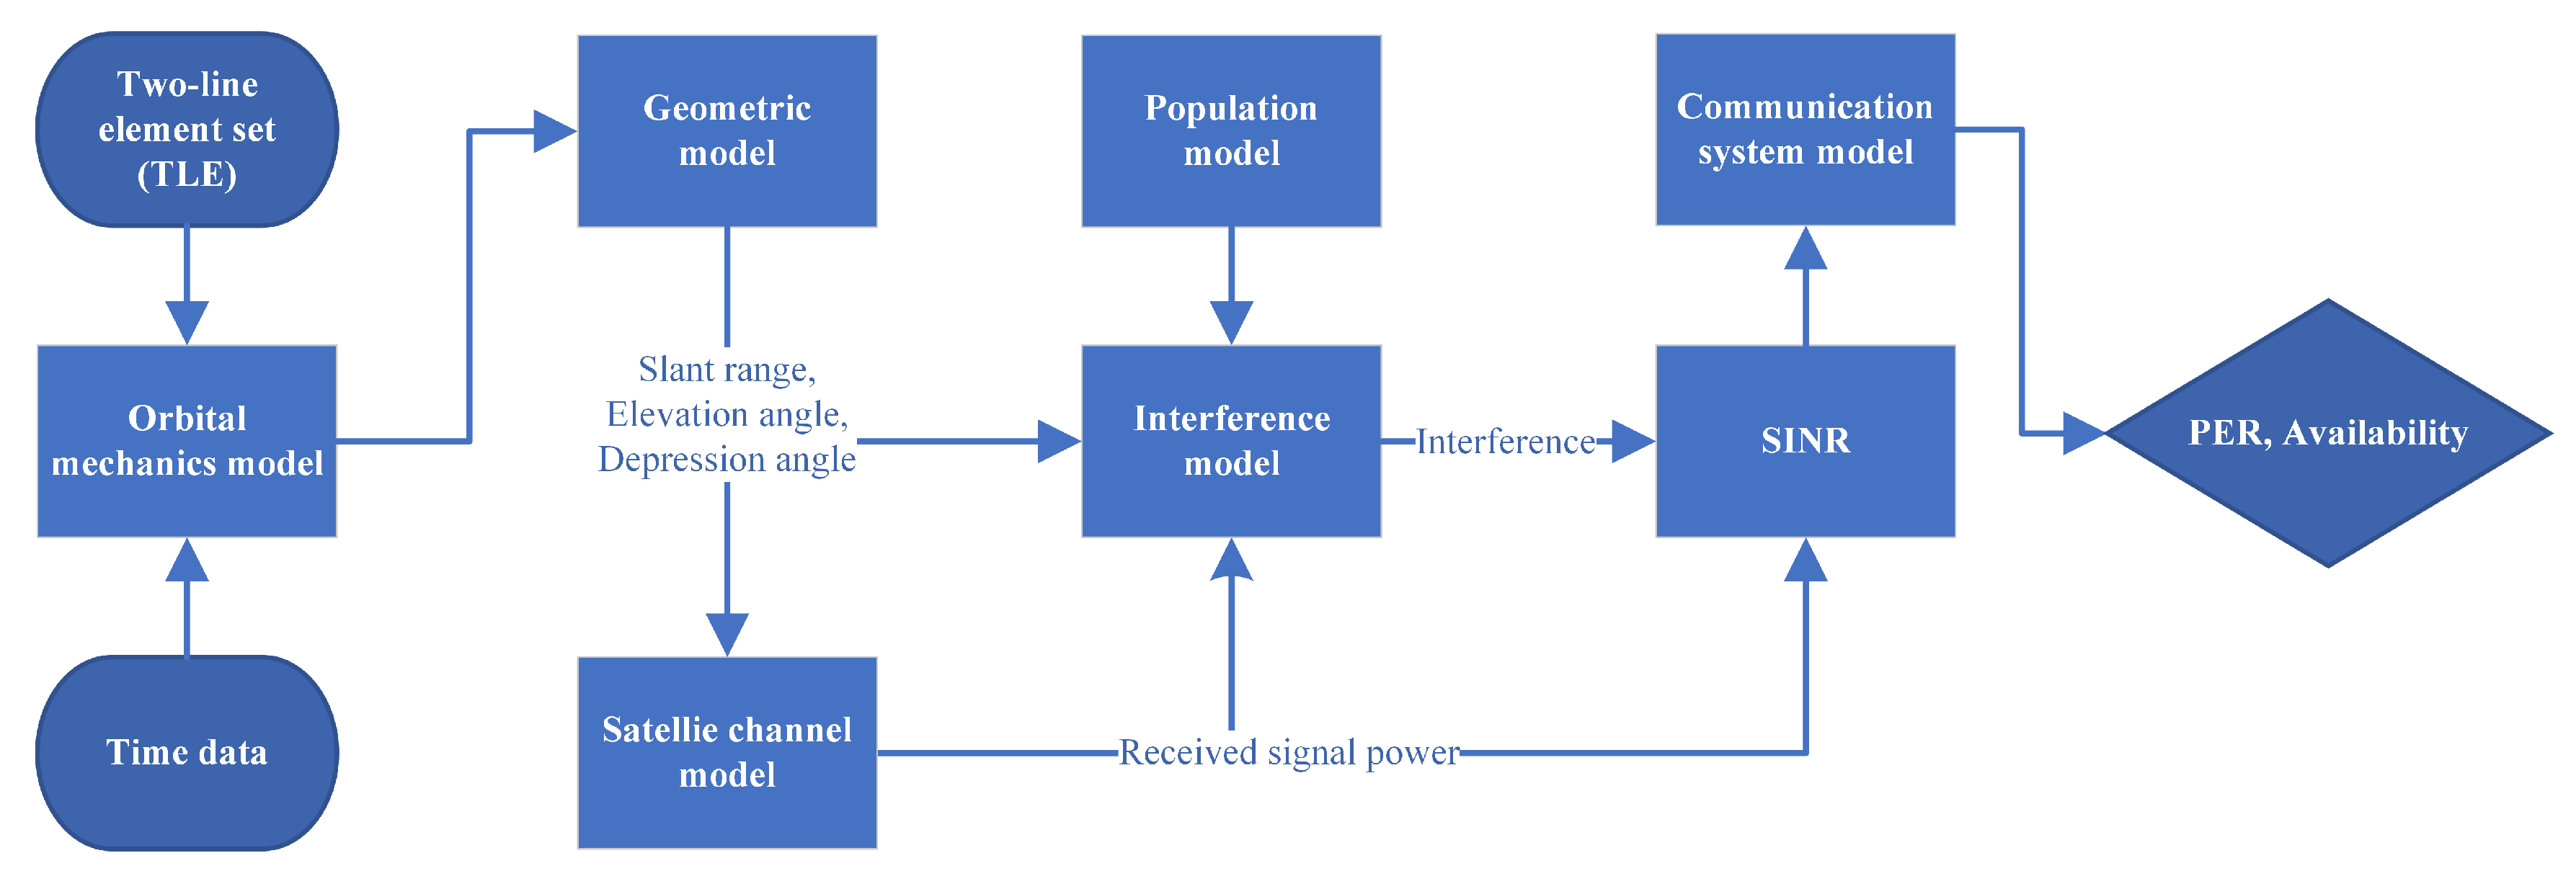
3.1. Orbital Mechanics and Geometric Model
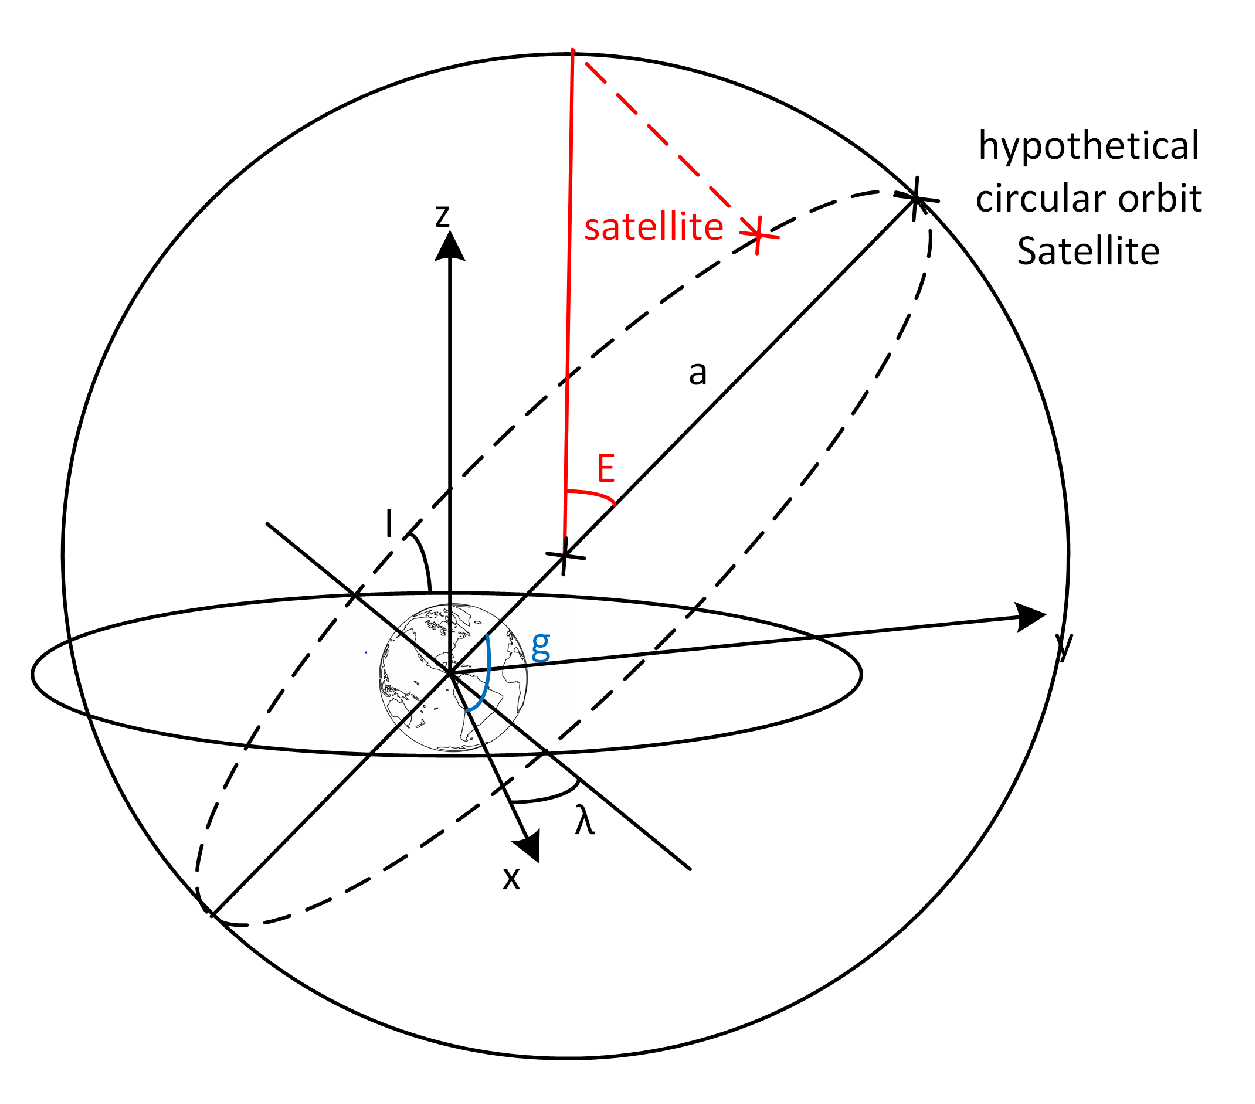
In this evaluation framework, we use the SGP4 algorithm to calculate orbital velocity and location vectors of the LEO satellite. The orbital data is then fed into the geometric model to estimate the slant distance (d), the elevation angle of the measurement point (), and the depression angle of the satellite (). The SGP4 model is an old algorithm developed in the 1970s, obtained by simplifying the Air Force General Perturbation theory (AFGP4) and using the Brouwer’s gravitational model [28,29]. The SGP4 model takes satellite orbital elements from a set of parameters called the Two Line Element (TLE). A TLE entry of a particular satellite consists of a list of orbital elements including [10]; satellite code, classification, international desiccator, epoch year, day, hour, the mean velocity of the satellite, mean acceleration of the satellite, inclination, right ascension of the ascending node, argument of perigee, mean anomaly, mean motion, and revolution number at epoch. Since the SGP4 model has an error around 1–3 km at epoch per day, TLE sets are regularly updated by the NASA and NORAD to mitigate possible errors. The Cartesian coordinates (The utilized frame of reference is called the True Equator Mean Equinox Earth-Centered Inertial (TEME ECI). The origin of this frame is at the Earth’s center of mas, and it does not rotate with the Earth movement, the x-y plane is the true Equator, and the mean Equinox is the z-axis) of the satellite point at a time interval can be calculated from the output of the SGP4 as follows [28],
where
Here a is the semi-major axis of the satellite orbit, e is its eccentricity, g is the argument of the periapsis, is the longitude of ascending node, I is the inclination, and E is the eccentric anomaly. An illustration of the satellite orbital parameter is depicted in Figure 2.
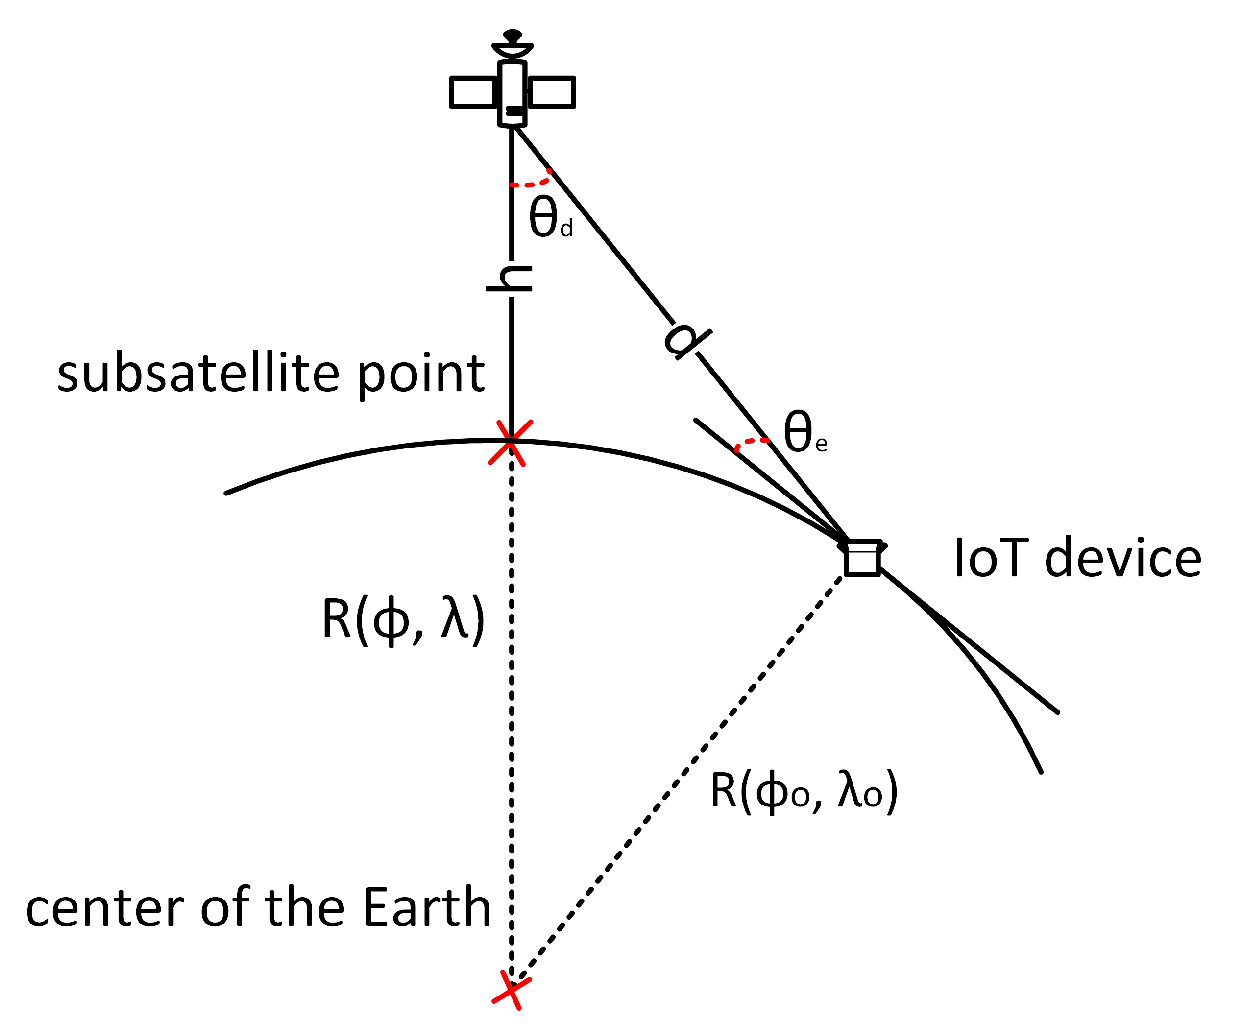
We convert the True Equator Mean Equinox (TEME) Cartesian coordinates of the satellite into latitude and longitude, referring to the World Geodetic System 1984 (WGS84) frame. Then, we can obtain the slant range distance (d), elevation angle (), and azimuth angle from the measurement points. Also, the depression angle () of the antenna which can be calculated by the cosine law [10],
where R(, ) is the true radius of the Earth at the subsatellite point, and () is the latitude and longitude of the subsatellite point, R(, ) is the true radius of the Earth at the observation point, where (, ) is the latitude and longitude of the observation point, and h is the altitude of the satellite, as depicted in Figure 3. According to these parameters, we calculate the satellite channel the path loss, air absorption, and excessive path loss between the satellite and the observation point as further detailed in the below subsection.
3.2. Satellite Channel Model
As the wireless electromagnetic signal propagates from the IoT device toward the satellite, it suffers from the natural wave-front expansion. This expansion is captured in the free-space path loss and computed as
in which d is the slant range in meters and f is the carrier frequency in Hertz.
The second important factor in the wireless satellite channel is the attenuation caused by the atmosphere air absorption as elaborated in the following subsection.
3.2.1. Air Absorption
Electromagnetic transmission through the atmosphere experiences attenuation caused by the resonance of gas molecules and water vapor between the Earth’s surface and the satellite. The approximate region of the atmosphere effect is around 100 km above the Earth’s surface. The atmosphere components considered by this study are oxygen and water vapor. We implement the framework recommended by the International Telecommunication Union (ITU) in Reference [20], where depends on the pressure of air molecule and water vapor together, and it is based on a series of functions and the air pressure parameters measured by ITU. By giving the temperature, dry air pressure, and air humidity to the ITU model, it can return the approximate air absorption attenuation in dB. We implement the ITU air absorption model as a Matlab function with the following structure,
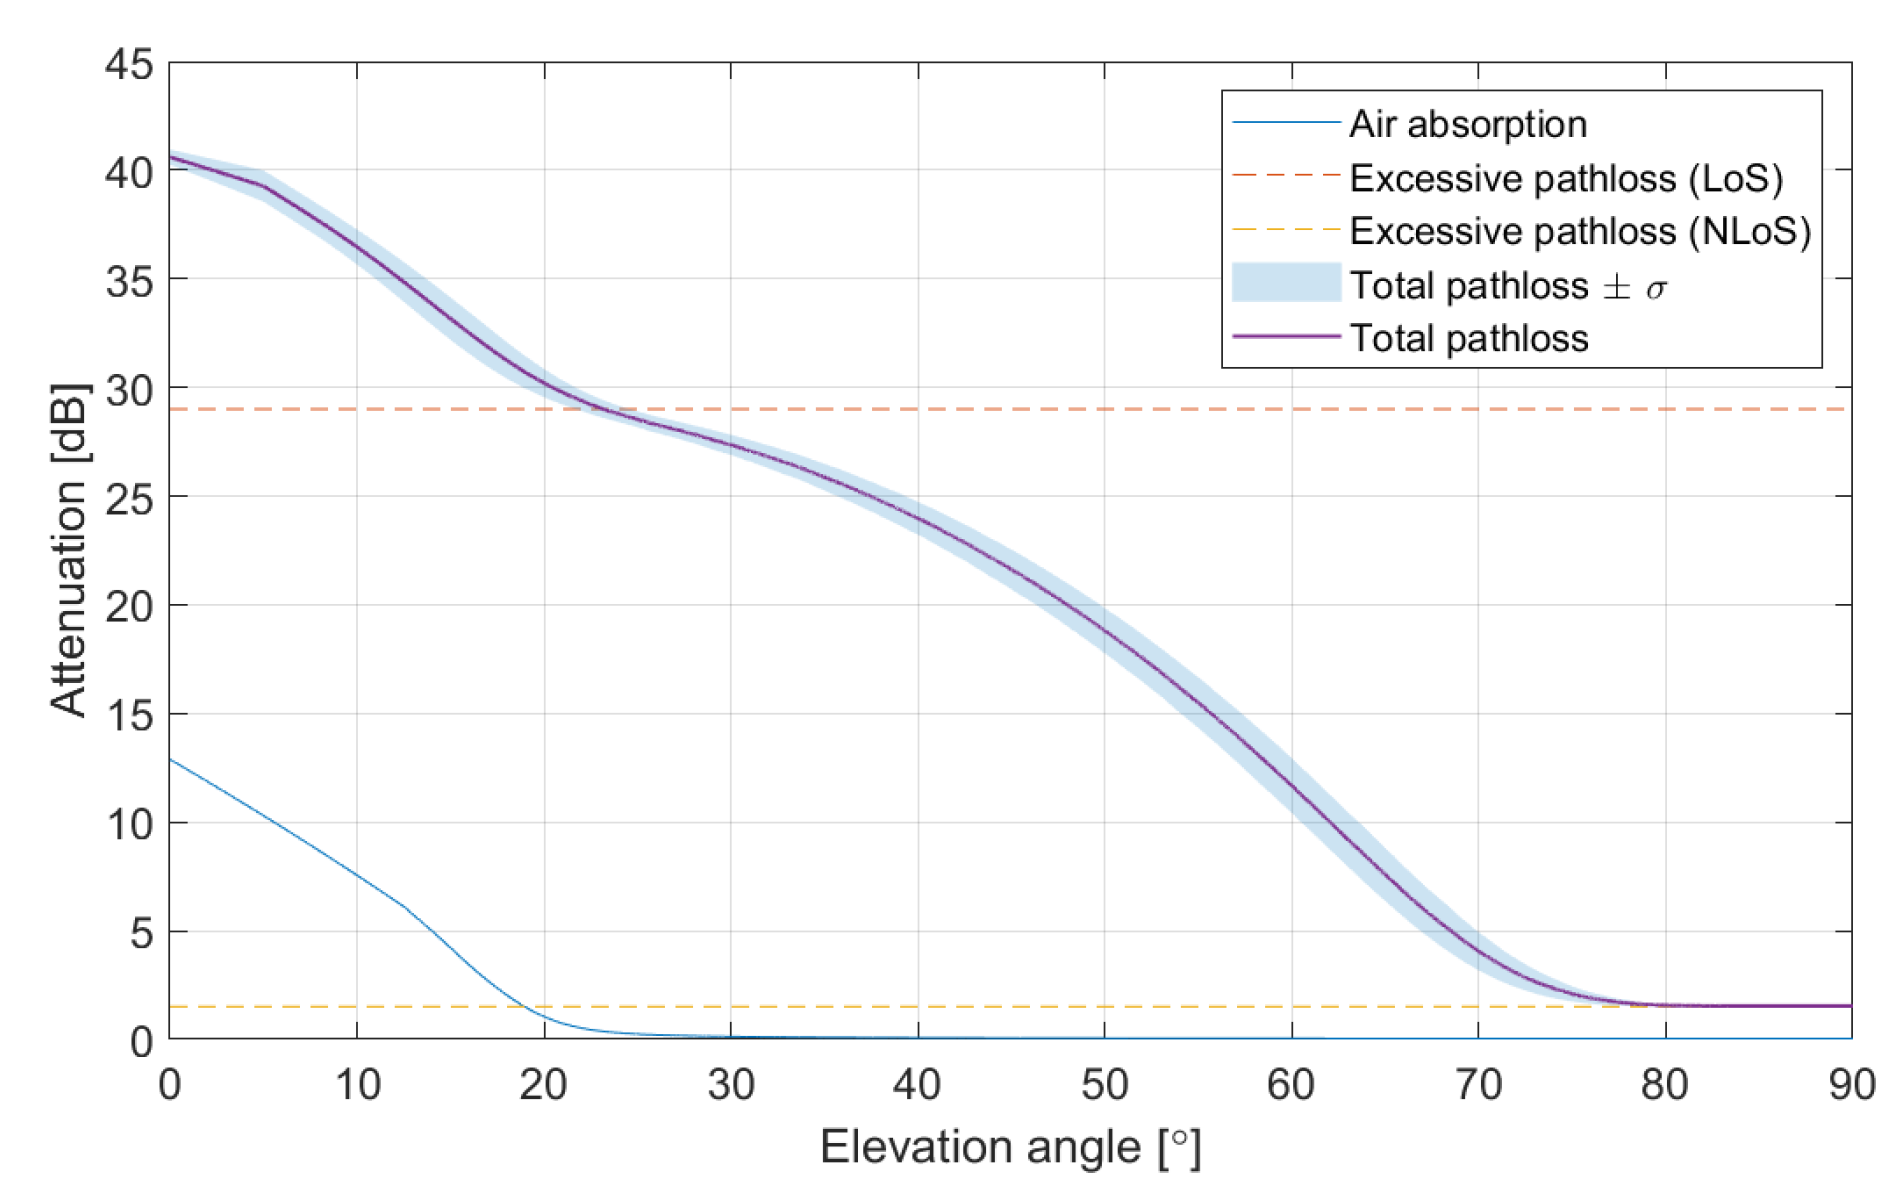
where , , are representing respectively the height, latitude, and longitude of the measurement point on the ground. An illustration of the air-absorption effect is shown in Figure 4.
3.2.2. Excessive Path Loss Model
In order to generalize the satellite channel model, we include the effect of human-made structures on the propagation. This effect manifests itself as an excessive loss on top of the incurred wave-front expansion and air-absorption. We adopt our previous model of excessive path loss in Reference [21] (called the Air-to-Ground model AtG) by assuming the satellite akin to a low altitude platform in sharing the diffraction and reflection introduced by the human-made urban layer. In the AtG model, a Gaussian random variable captures the excessive path loss, where the mean and standard deviation of this random variable depend on whether the device has a Line of Sight (LoS) condition with the satellite or not as follows:
where N is the normal distribution of a mean and a standard deviation of and . In order to simplify the calculation, we assume that the excessive path loss of the IoT device is calculated as follows:
And we use the ITU-R [22] to calculate the probability of LoS and Non Line of Sight (NLoS) in different city types by the following equation,
where m and n are the S-curve parameters derived from the original ITU-R model, and is the elevation angle of ground transmitters. The numerical approximation of the probability of LoS and NLoS are also derived in the 3GPP technical report of non-terrestrial network [30]. Then, we adopted the excess path loss model in high-rise building city, high dense urban, urban, and sub-urban.
Signals transmitted through the satellite channel are attenuated by the distance, diffraction, and scattering, the path loss in the communication link can be obtained by,
where is the loss due to air absorption and is the excessive path loss [10]. The received signal power can be calculated by
where is the transmitter power, is the gain of the satellite antenna, and is the path loss in the communication link. If we assume a directional antenna is deployed on the satellite to avoid unwanted terrestrial interference, the gain can be calculated by the following equation,
where is the beamwidth angle of the antenna.
3.3. Terrestrial Interference Model
By getting the number of IoT device population and the uplink received powers of each measurement point, the average terrestrial interference of a measurement point (n) can be calculated by,
where is the received power of the satellite, and representing the Probability of Non Line of Sight (NLoS), and Line of Sight (LoS) of the measurement point calculated by (8) and the excessive loss () in LoS and NLoS situation using Reference [21]. The total terrestrial interference is equal to the sum of the average terrestrial interference terms within the satellite horizon as following,
where k is equal to the number of measurement points in the satellite coverage area, and the average number of active IoT devices will be discussed in the following subsection.
3.3.1. Use Case Scenarios and Interference Population Thinning
To simulate a real-world situation, we assume IoT devices are about i times to the human population, and we presume according to Reference [31]. Also, in order to create an accurate interference model for IoT-over-Satellite communication, we deploy the Remoteness Index of Australia (ARIA) to classify all interference sources into the following classes [32]:
- Class 1 (sea): Interference sources on the sea level and are at least 100 km away from the urban and suburban areas. Class 1 is having the lowest interference since the smallest amount of IoT devices are located in Class 1. Since the focus of the paper is on estimating the terrestrial interference from the land, we assume there are no IoT devices on the sea level.
- Class 2 (remote): Interference sources that score more than 10 in the ARIA (ARIA G5) representing a remote area, which is at least 141 km away from the nearest remote center, 264 km away from the nearest rural center, and 614 km away from the nearest suburban center. Class 2 is likely to have lower interference than Class 3.
- Class 3 (rural): Interference sources that score between 5–10 in the ARIA (ARIA G4) representing a rural area, which is around 217 km away from the nearest suburban center, 134 km away from the nearest rural center. Class 3 is expected to have the highest interference among these classes.
We also apply the thinning to estimate the average active IoT devices and the number of active interference sources can be calculated as
in which the active IoT devices are equal to the total IoT devices(N) times the regulated duty cycle () divides by the number of channel (). We assume 1% of duty cycle, N is equal to 3 times of the human population as the worst-case scenario based on the radio regulation [26,27], so that we can find the lowest bound on SINR in the evaluation framework.
3.3.2. SINR Model and Communication System Model
The PER is commonly used to evaluate the link quality and link availability in the communication system, and it is a function of the ratio of energy per bit to the spectral noise density with given noise power, interference, path loss and a modulation scheme of the link as shown in the following:
where is a function based on the modulation and coding scheme (MCS). Here, is calculated by the times the channel bandwidth divided by the bitrate of the channel (). The linear expression of the is calculated by the received signal power divided by the interference in Equation (13) plus the system noise power . Thus, the uplink performance can be estimated by the PER of the IoT-over-Satellite communication system by given the .
3.4. Communication System Model
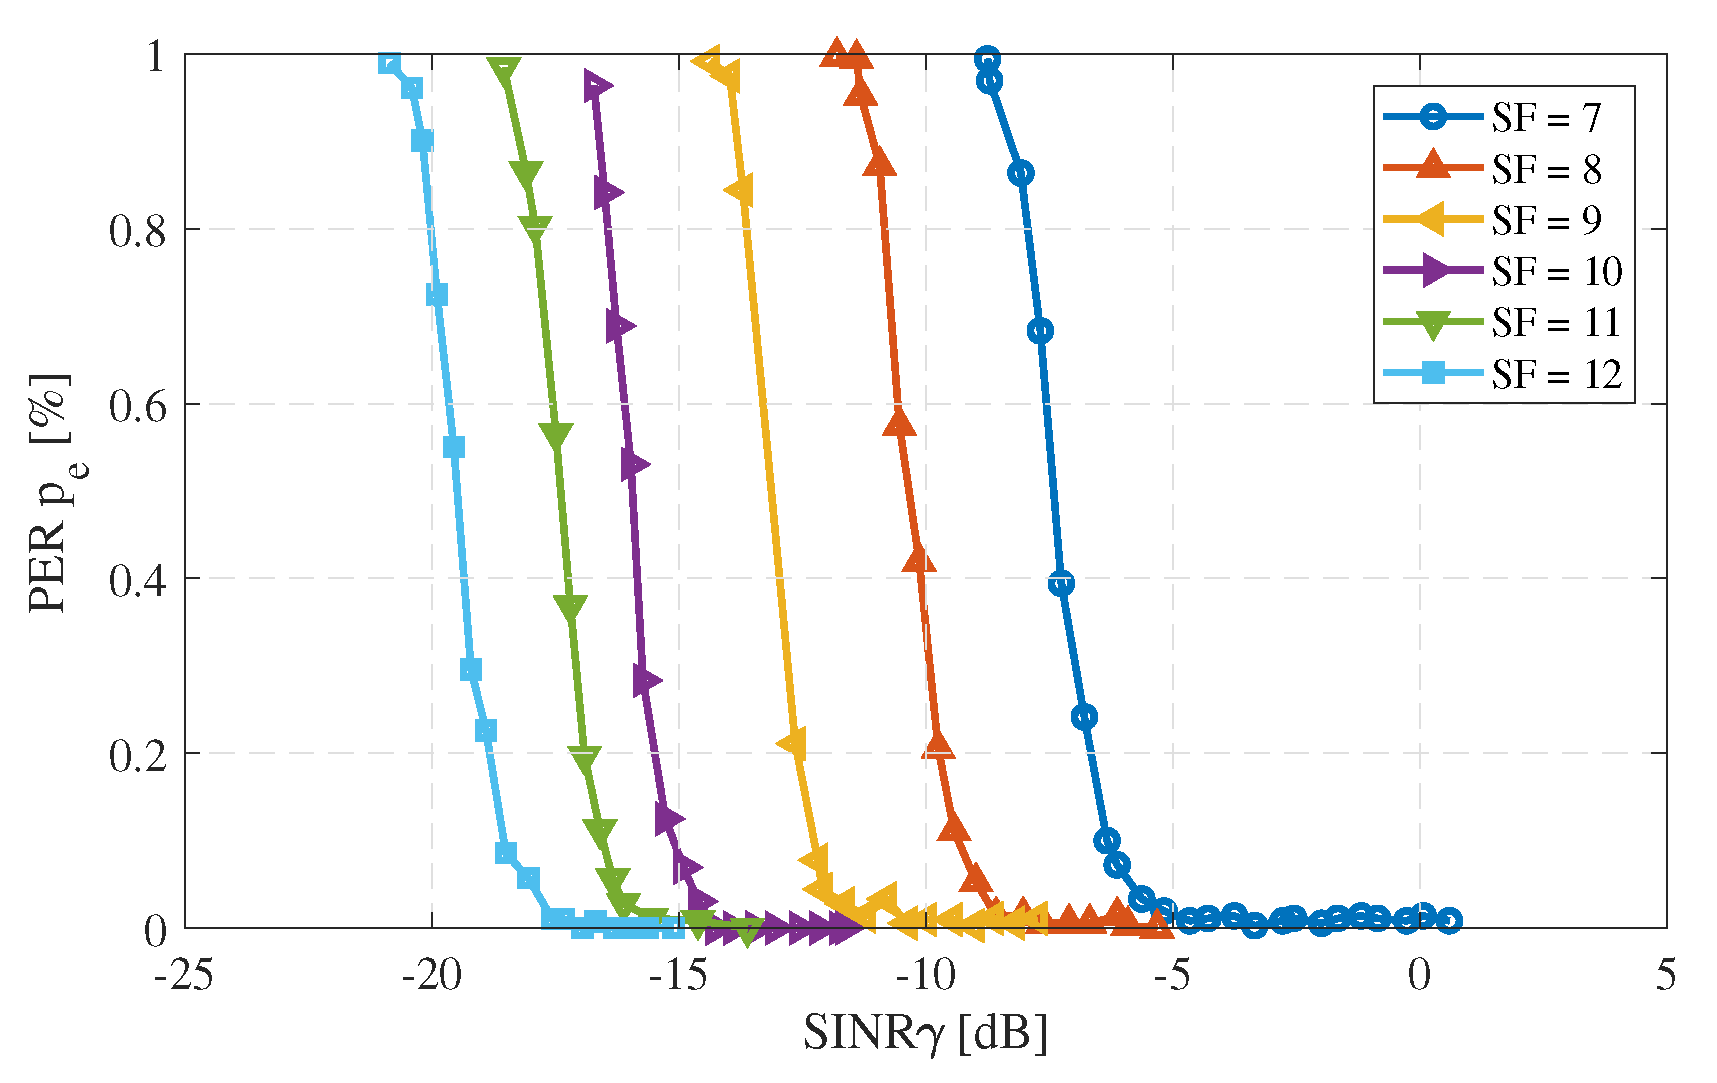
For evaluating the performances of practical IoT technology, we apply the free licensed LoRa chirp spread spectrum (LoRa CSS) modulation. In order to maximize the number of active users, we assume the lowest channel bandwidth of LoRa, which is 125 kHz, is used in the modulation so that we have 64 channels in the ISM band following the LoRa parameters [7]. This function is based on empirical measurements from the literature [23], in which the fitting table can estimate the packet error rate in the following Figure 5. The limit to establish communication is shown in Table 4.
4. SINR Model Approximation and Optimal Parameter of IoT-over-Satellite
As mentioned in the previous section, a comprehensive uplink SINR model can help to estimate the quality and performance of the IoT-over-Satellite channel and thus to provide the PER and availability of the satellite channel link. Therefore, we derived the SINR model based on the simulation and channel models explained in Section 3. The linear mathematical expression is shown in the following:
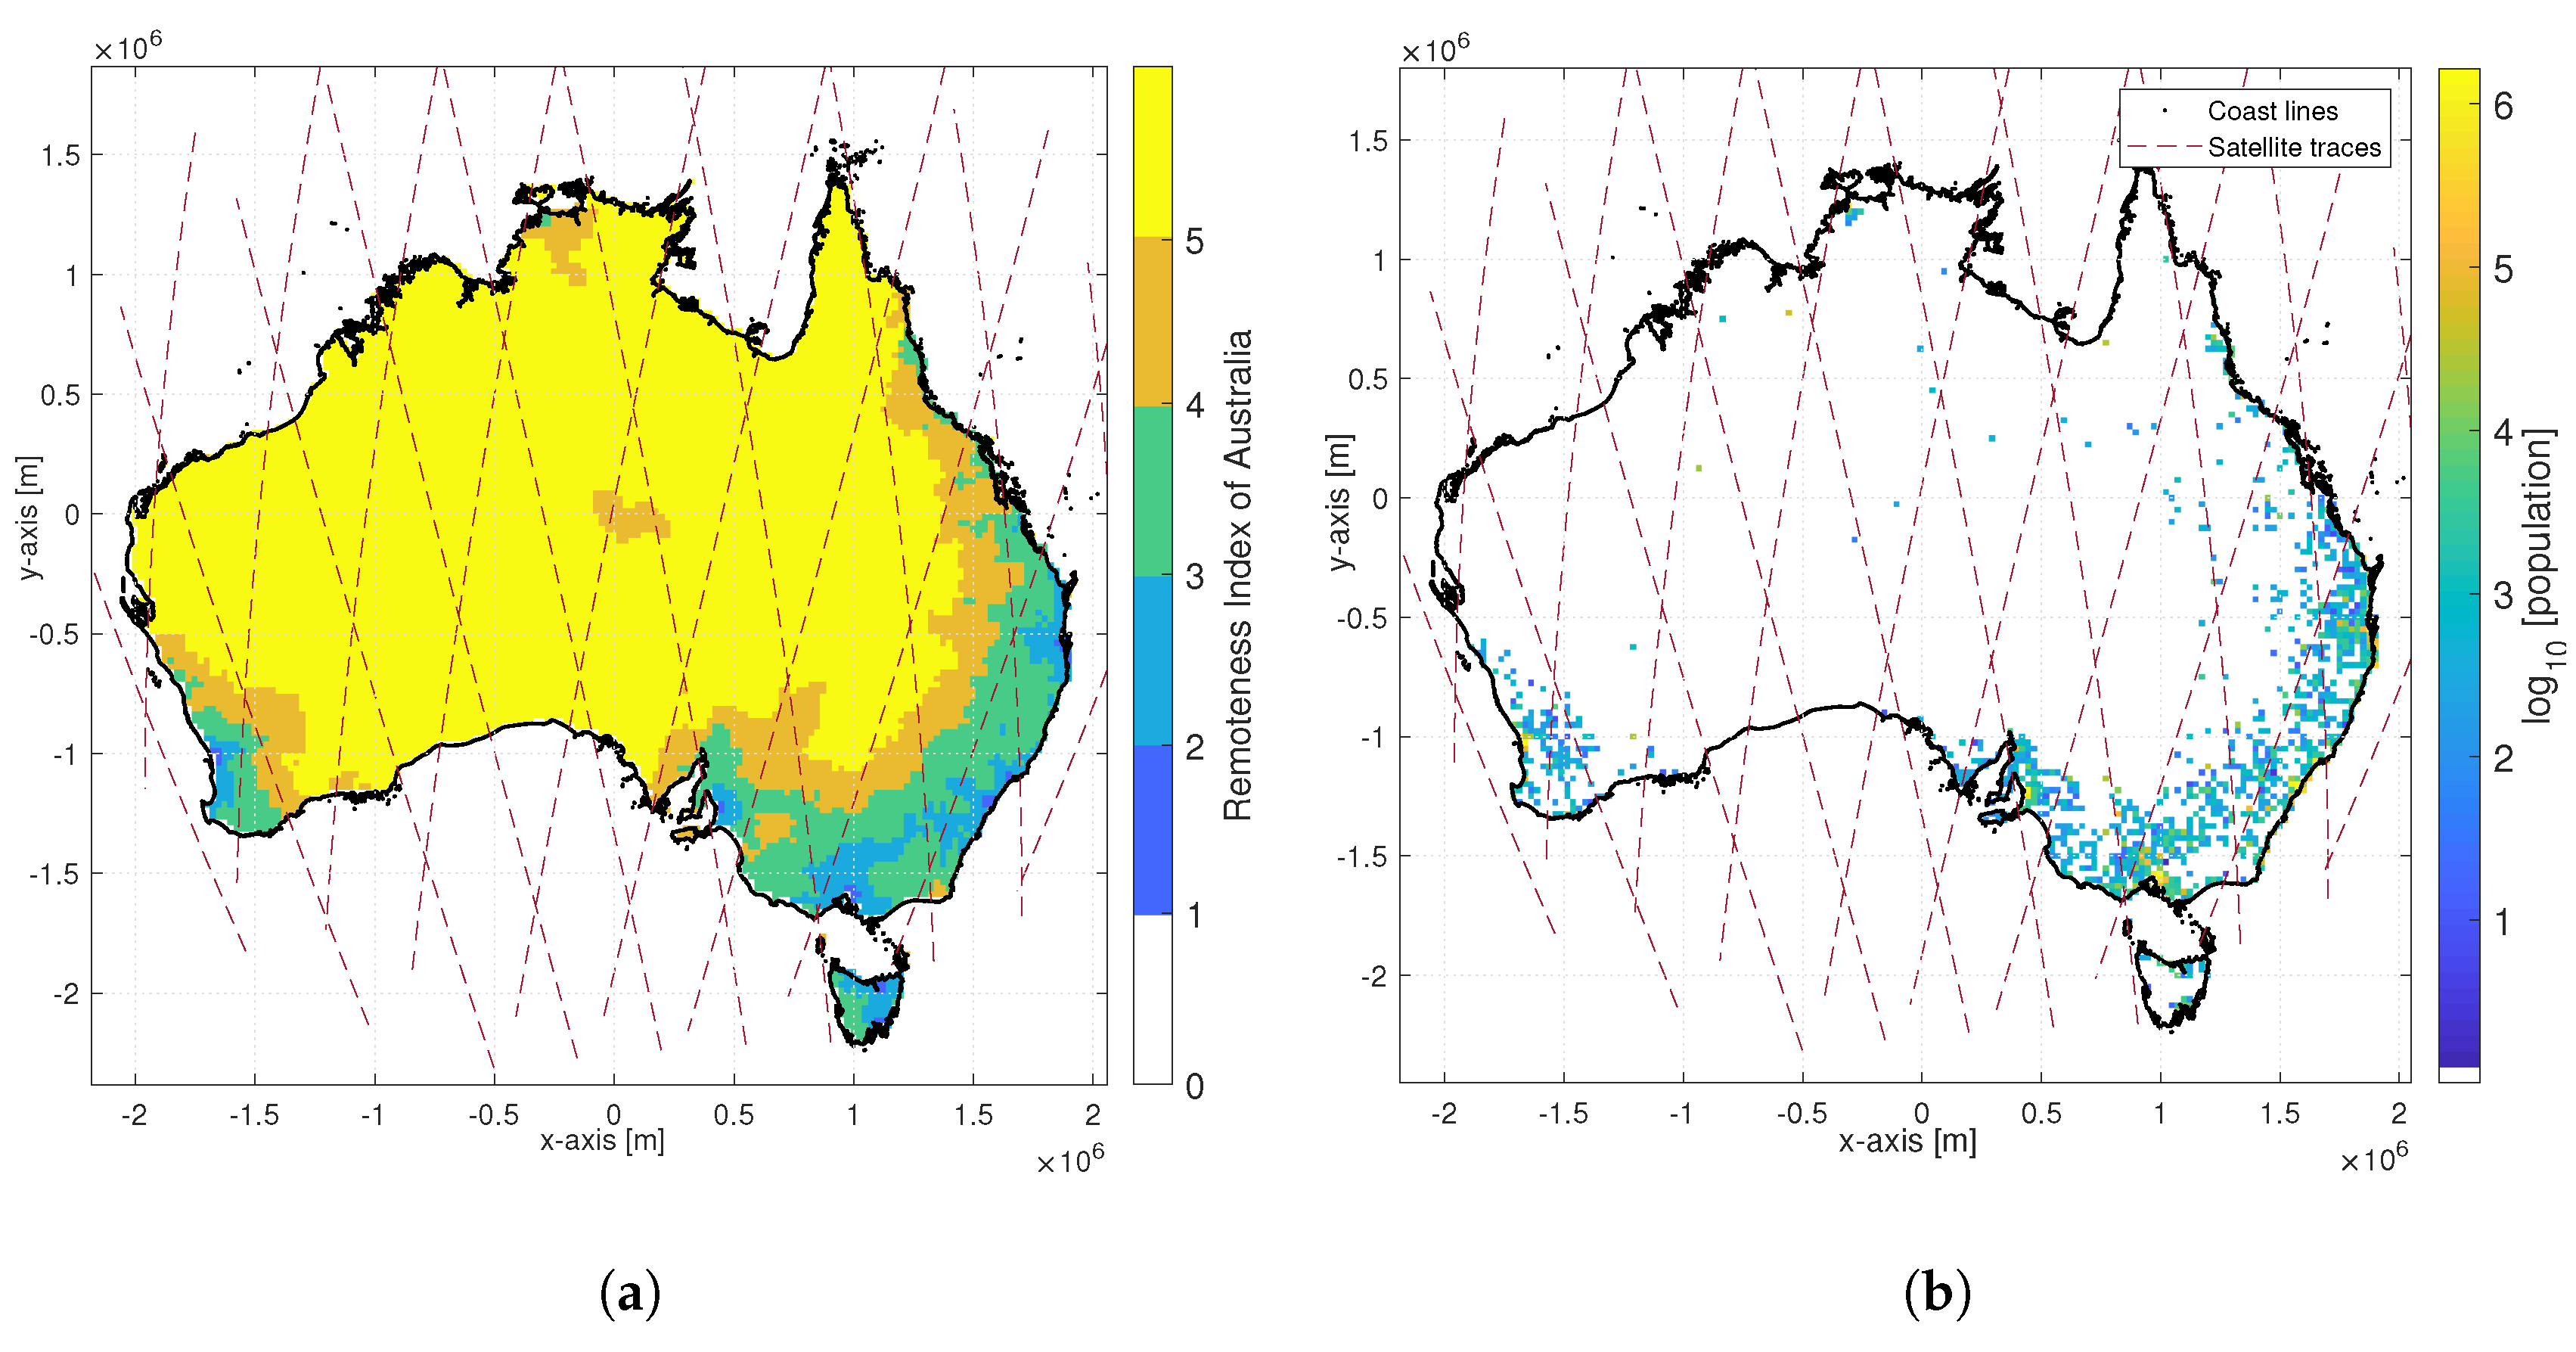
where at a measurement point highly depends on the average IoT devices population in the area, and due to the reason that IoTs population of remote and rural areas tend to be constant as shown in Figure 6, we assume that the average interference per user () in the remote or rural area can be simplified into a constant , and is a function based on the coordinates of the satellite cube-sat as shown in (3). The coordinates are varying over the period of time.
4.1. Uplink SINR in Australia
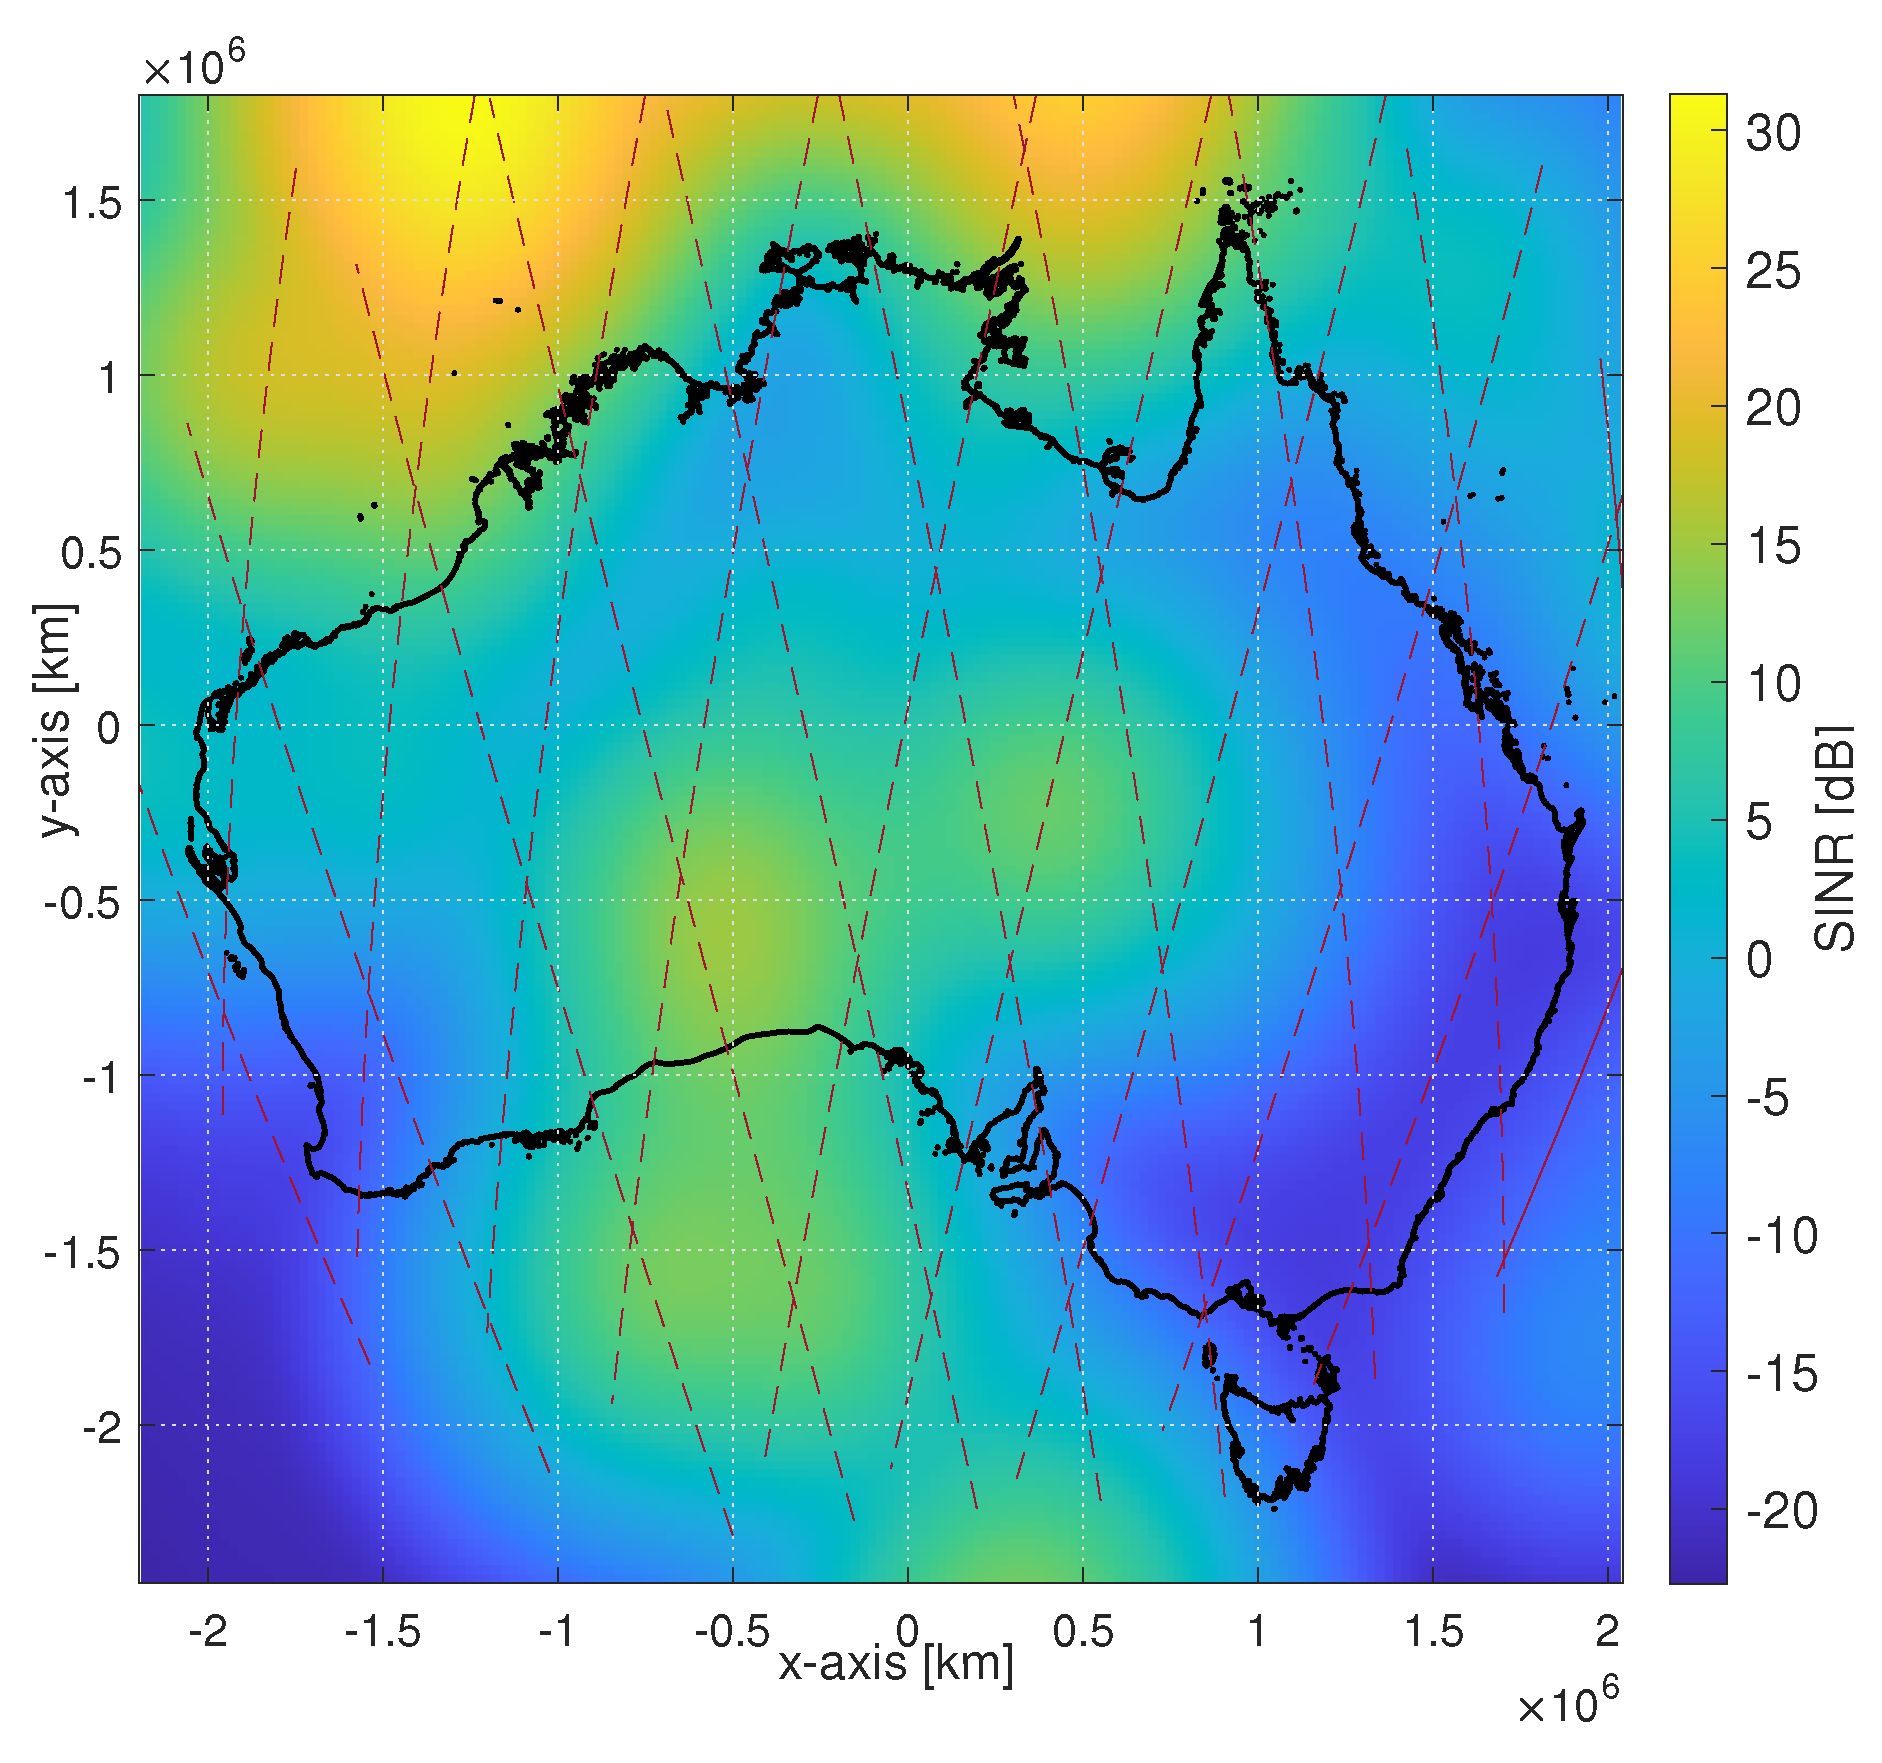
Using (16), we calculate the average SINR level of each measurement points over a week, and the result is shown in Figure 7. It indicates that the SINR in the remote and rural areas (Classes 2 and 3) is at least 10 dB, and the level in an urban or suburban area is less than 5 dB since the number of interference sources is much higher in the area. If we assume several IoT modulation schemes such as BPSK, QPSK, 16QAM, and LoRa CSS are used in the IoT-over-Satelite communication, the SINR level needs to be more than 10 dB to achieve a Bit Error Rate (BER) with less than using (15). Thus, an IoT-over-Satellite system using an LEO satellite with shared bands may not be an option in an urban or suburban area without an advanced modulation scheme or access techniques to reduce the terrestrial interference.
4.2. IoT-over-Satellite Duty Cycle and Optimal Beamwidth Modeling
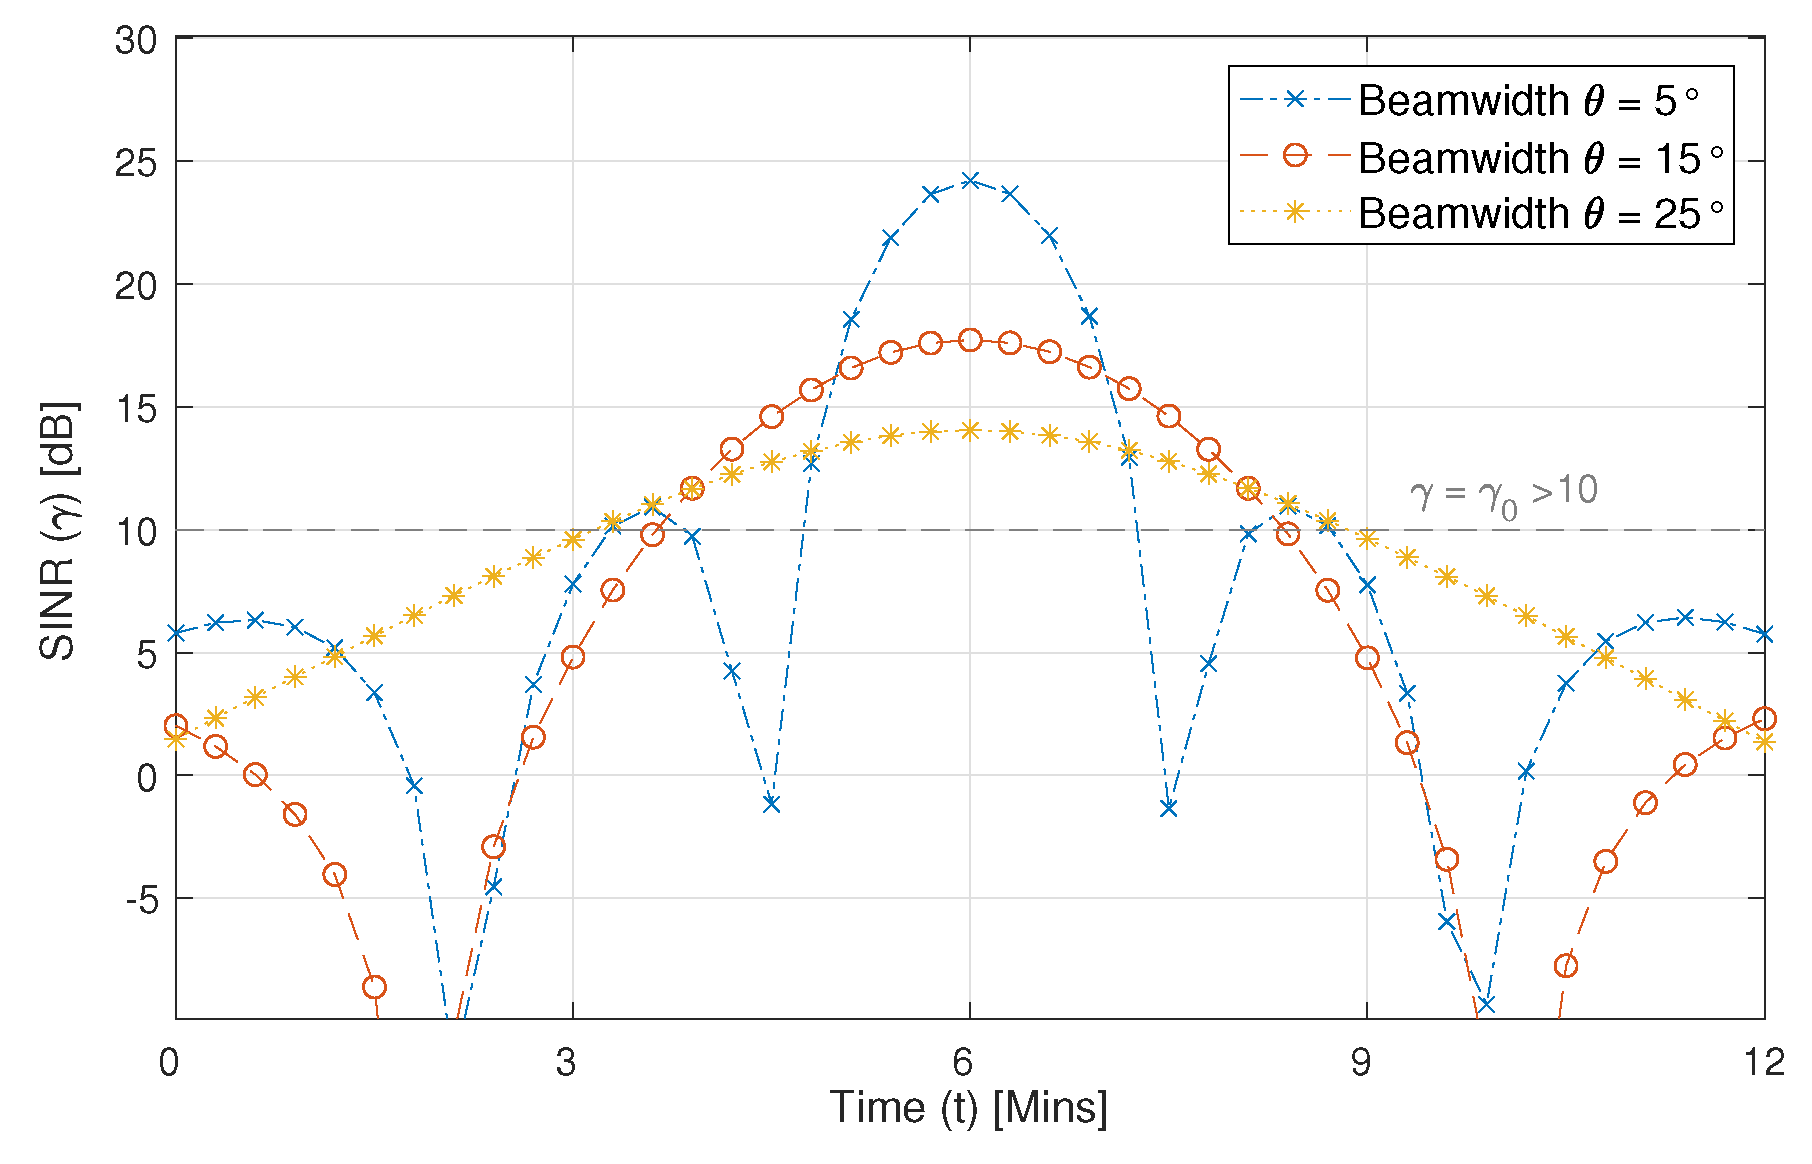
To establish a proper uplink channel, the minimum SINR level is at least −18 dB to provide a PER at according to Table 4, so we define the available system time interval as the interval that SINR is larger than the threshold () in decibel. The link-availability is equal to the available period divided by the accessible period. The accessible period is the time interval that the satellite has the LoS to the IoT devices, and it is equal to the time interval that elevation angle is higher than the horizon angle of the satellite (). Figure 8 shows the SINR level of a measurement point in a single satellite pass. The period when SINR is above the threshold (grey-line) is the available period, and we assume the accessible interval to be the whole period. The effect of satellite antenna beamwidth has been taken into consideration. The mathematical expression for the link availability is shown in the following:
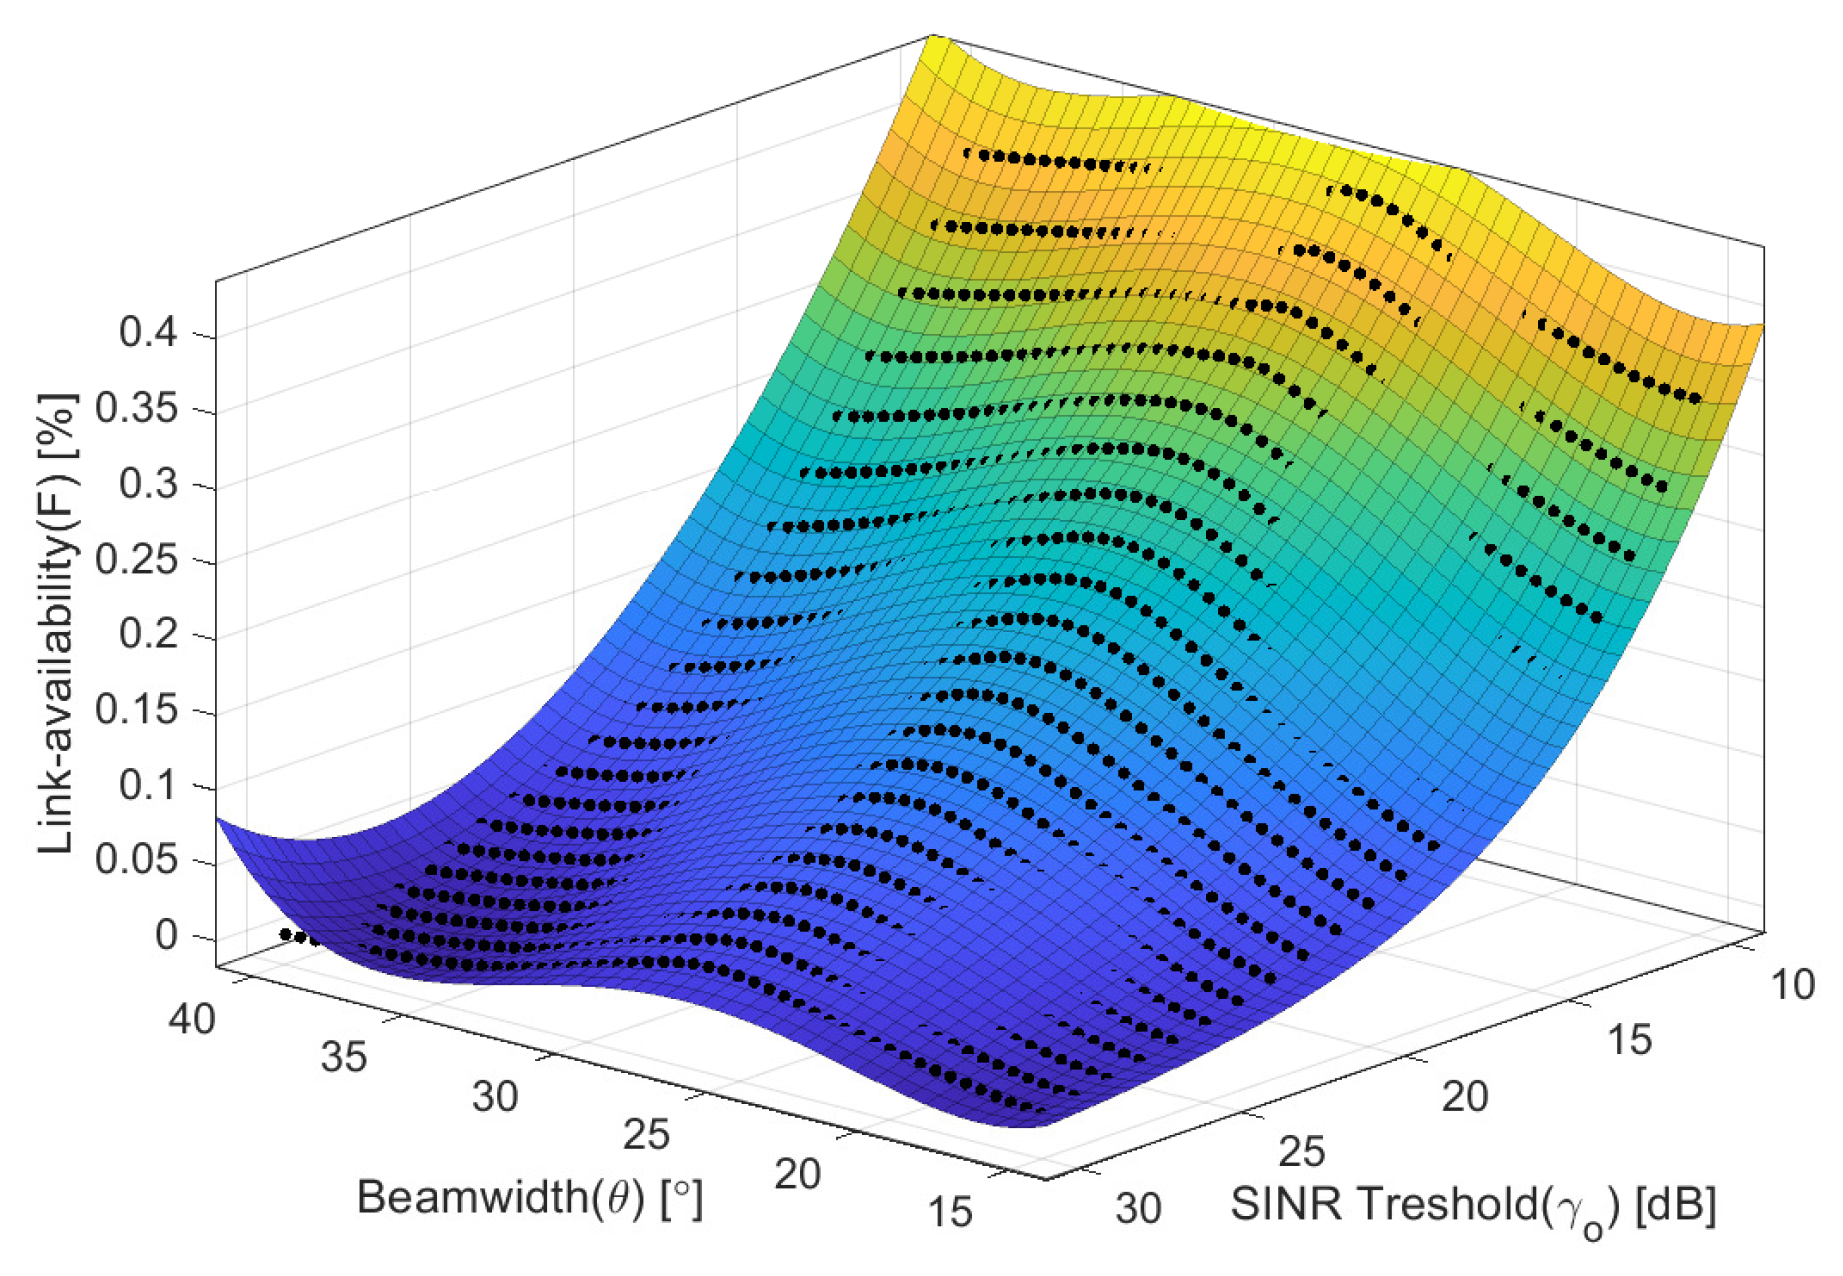
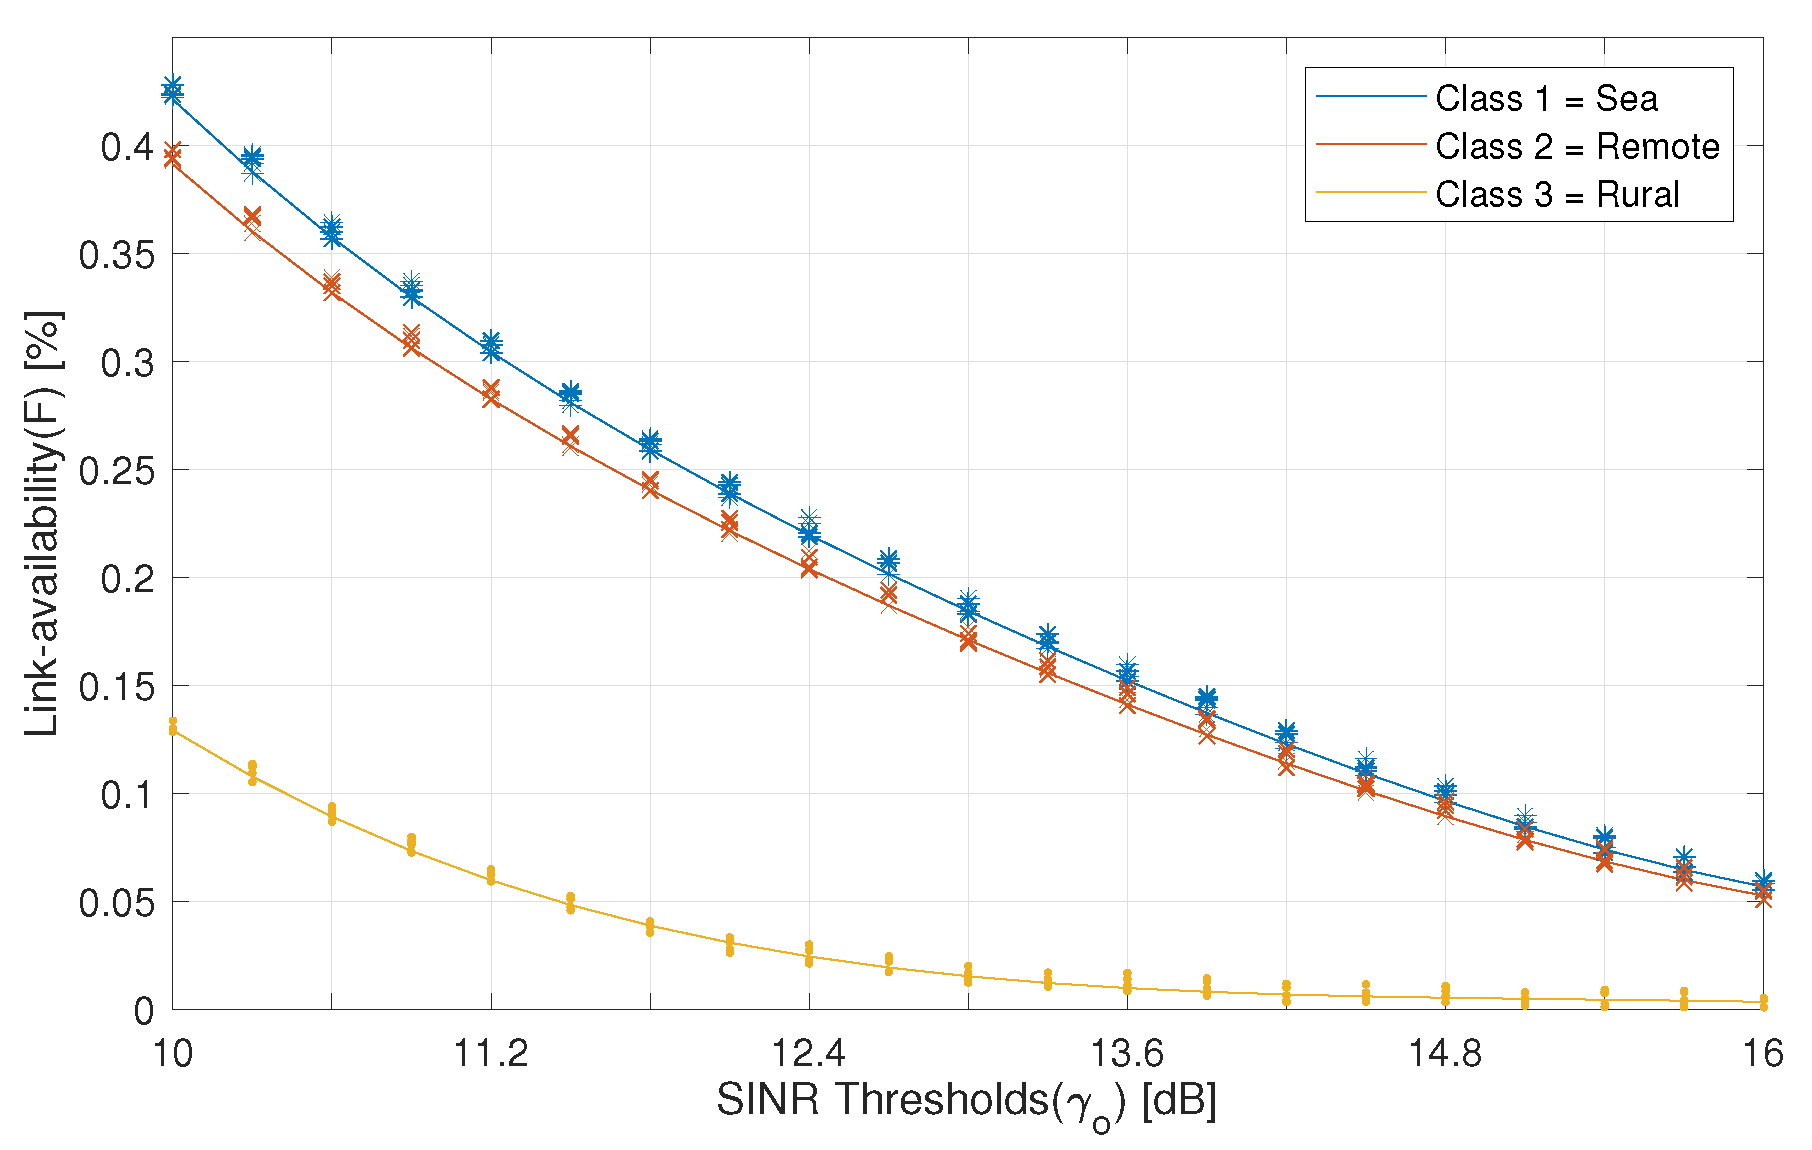
The link-availability is calculated, and the relationship between the duty cycle, SINR threshold, and antenna beamwidth is shown in Figure 9 and Figure 10. The approximation is made by using two variables fitting where beamwidth (), SINR threshold () are the variables. The polynomial approximation can be written as the following:
where is the polynomial coefficients and is given in Table 5, Table 6 and Table 7 for classes 1, 2 and 3, respectively.
5. Optimal Operating Parameters
In order to maximize the availability of the IoT-over-Satellite channel, we utilize the framework derived in Section 4 and find the optimal operating parameters of LEO satellite serving IoT devices. In particular, we focus on the antenna beamwidth and the optimal spreading factor (SF) of LoRa modulation when used for then uplink channel to increase link-availability.
5.1. Optimal Beamwidth of LEO Satellite Antenna
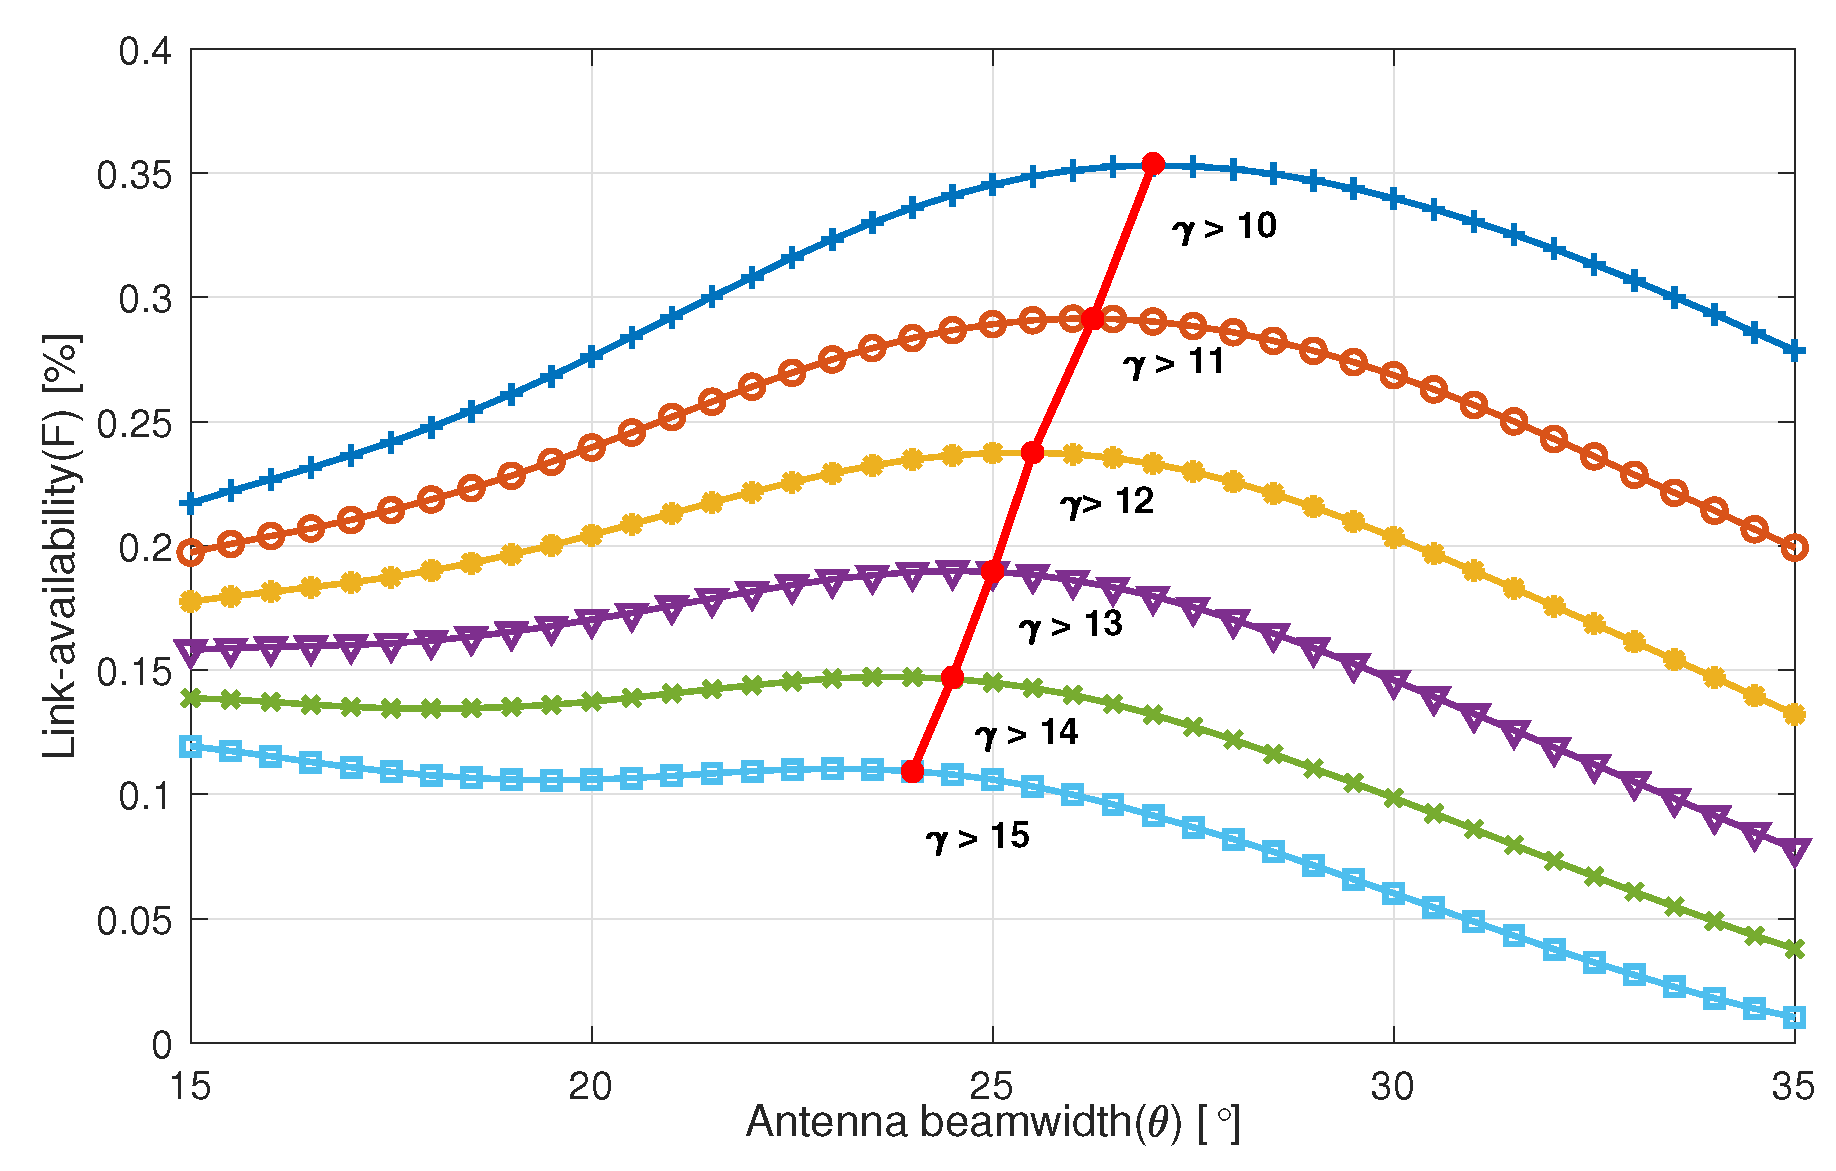
In order to maximize the link-availability, we need to elongate the duration at which the SINR is above the minimum threshold. Having a narrower beamwidth results in a higher gain, thus higher a SINR; however, the duration of such an increase in SINR will be reduced. These two competition factors can result in a maximum link-availability at a particular beamwidth. The dynamic of these two factors is illustrated in Figure 8. As it can be noted from Figure 9 and Figure 11, the optimum beamwidth is specific to a certain SINR threshold. And the optimal antenna beamwidth of a satellite occurs when maximum average link-availability is achieved. Hence, the optimal satellite beamwidth can be derived from the differentiating of (17) because it is a concave function, as follows,
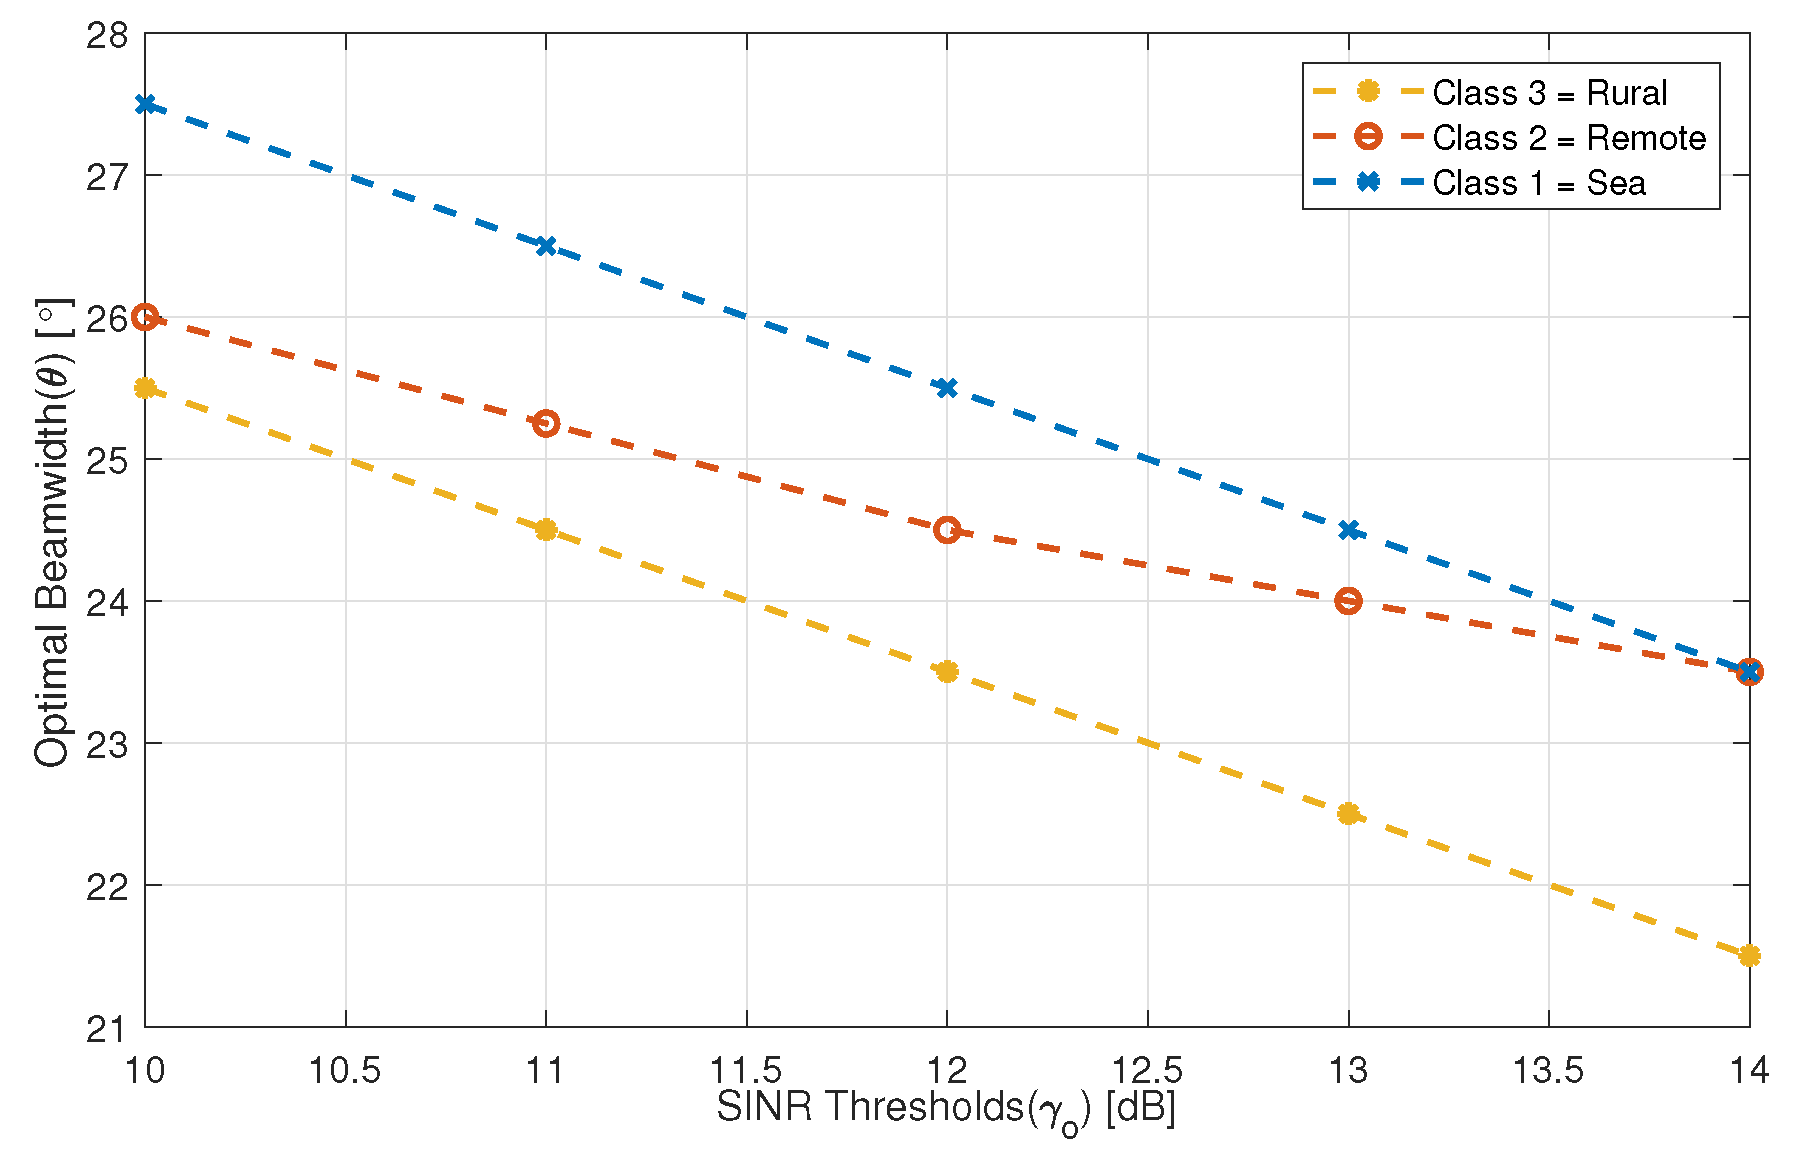
We depict in Figure 10 the optimum beamwidth as a function of the SINR threshold in the three different classes. The result of the duty cycle percentage when adopting the is shown in Figure 12, and the solution of (19) is shown in Figure 10. We substitute the optimal beamwidth into (18), and the result of maximum link-availability is shown in Figure 12. The sea area has the highest link-availability, and rural area has the lowest among these groups, as shown in Figure 12. It shows that the communication started to be available when the beamwidth of the antenna is smaller than 35, and having the optimal beamwidth at around 22–27. If we decrease the beamwidth of the antenna, it shows better link-availability because narrow-band antenna decreases the area of the visible horizon. So it decreases the number of terrestrial interference sources.
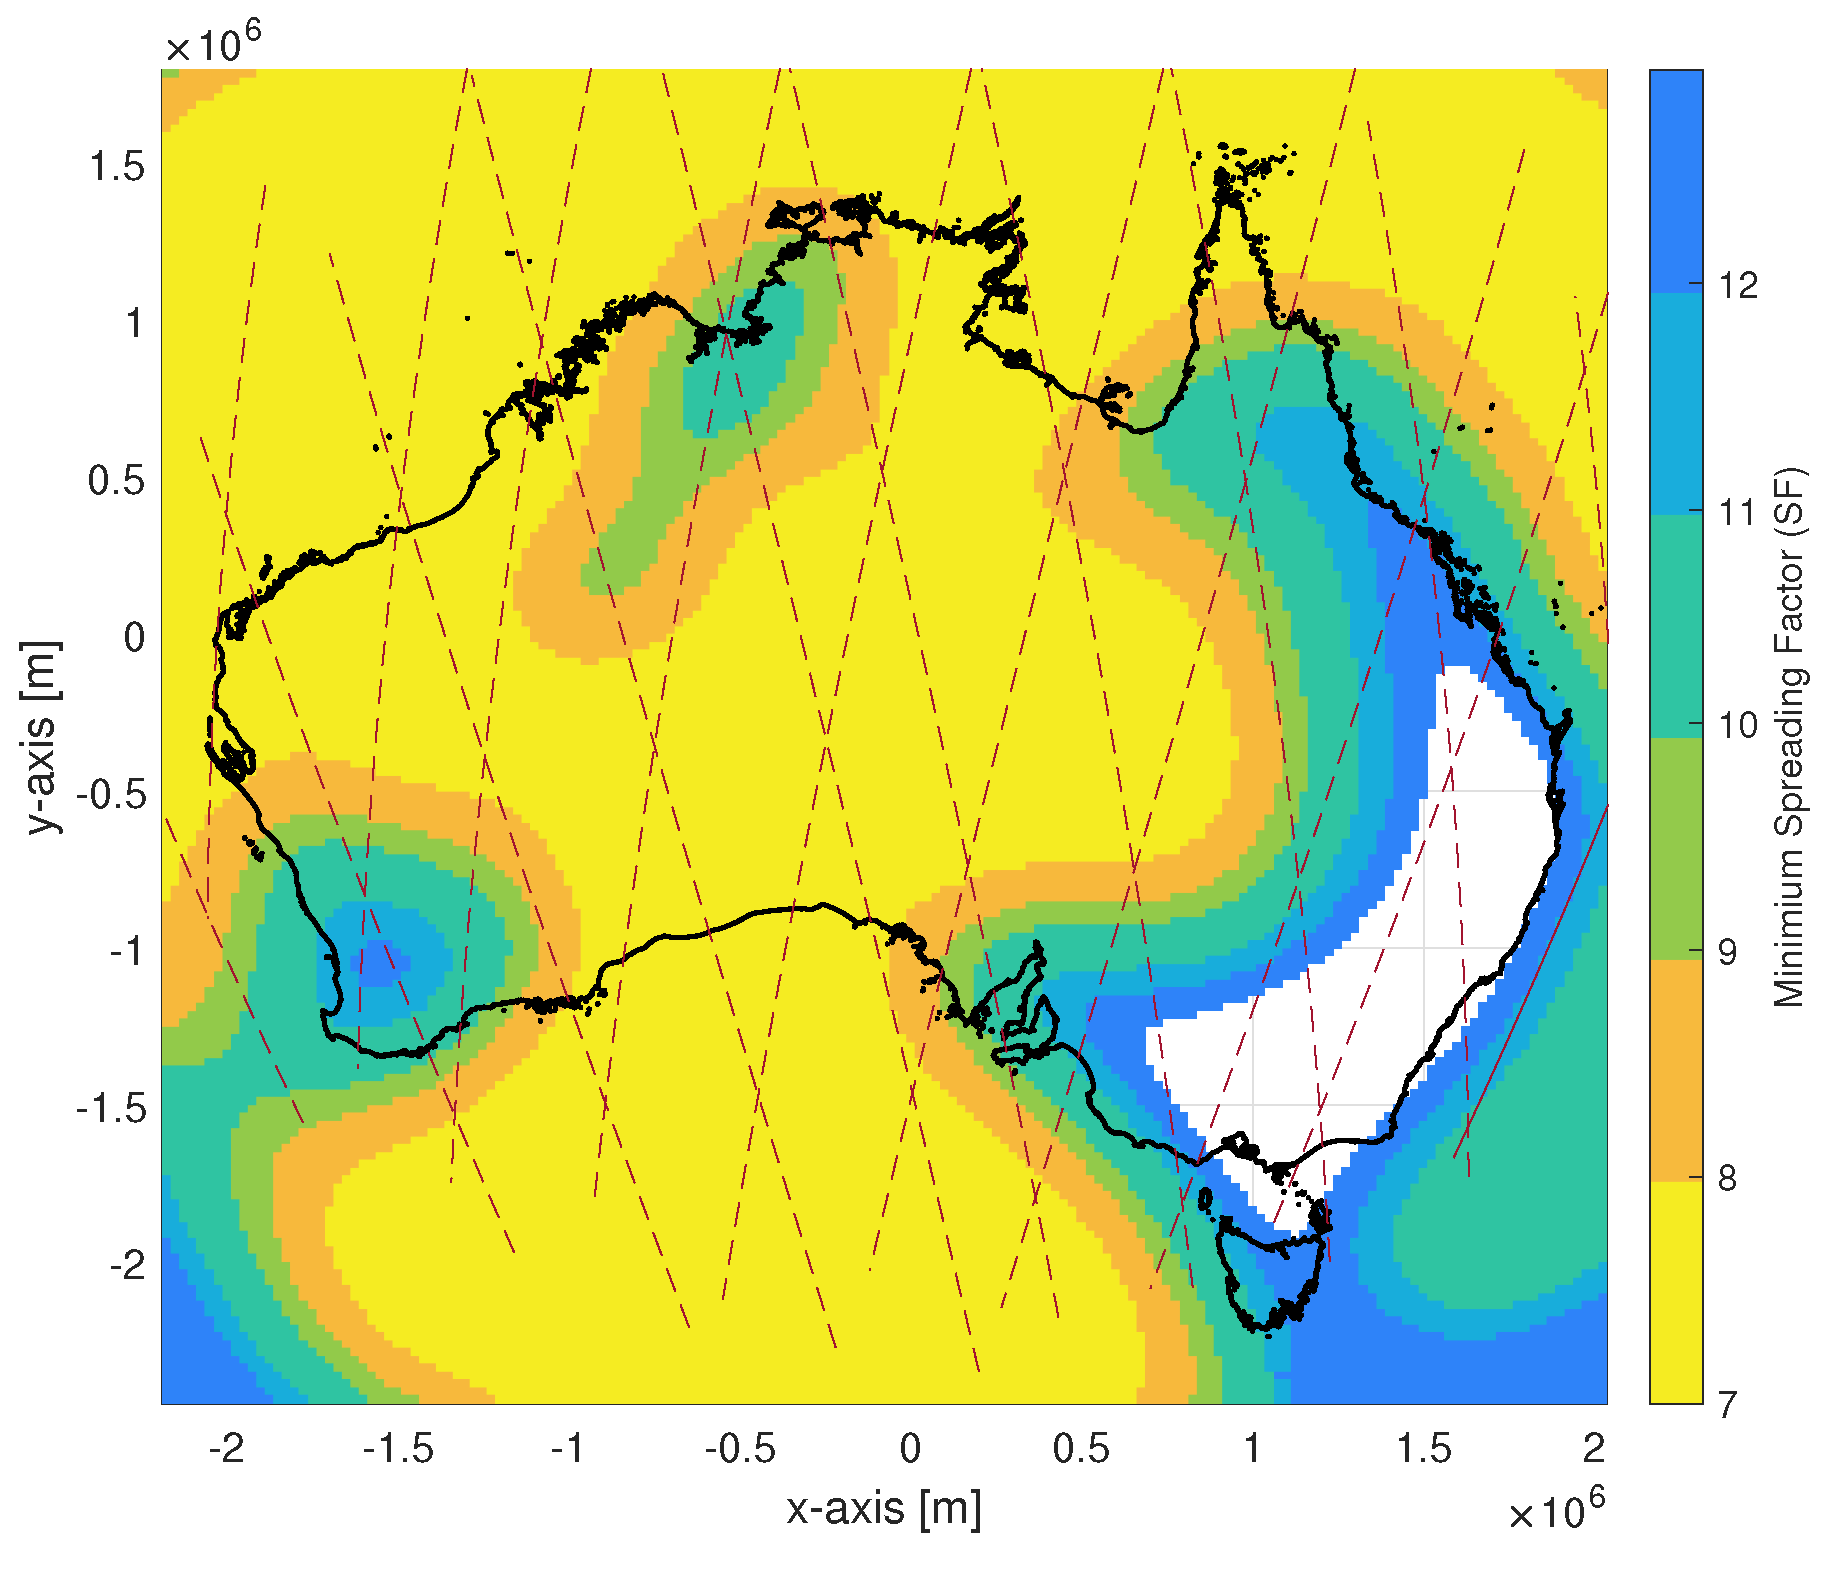
5.2. Finding the Minimum SF in Different Region
LoRa modulation employs the Chirp Spread Spectrum (CSS) modulation, which transmits the data by spreading information into the wide-band linear chirp pulses. By applying different SF into the modulation, it adopts different transmission ranges, payload sizes, and data rates to enable the LoRa CSS modulation [7]. As a result, changing SF is a trade-off between ranges, payload sizes, and data rates. Hence, in order to understand the trade-off between those factors and to increase the spectral efficiency of LoRaWAN in IoT-over-Satellite communication, we find the minimum SF in the simulated area by applying the PER mapping parameters in Table 4 into Figure 7 so that we can find out the minimum SF ensuring the PER is less than allowing IoT-over-Satellite communication. The result is shown in Figure 13.
6. Conclusions
In this paper, we proposed a framework to capture the performance of IoT-over-Satellite systems using shared spectrum resources with terrestrial IoT. We took the study case of Australia and adopt various system parameters such as satellite orbits, user density, and air absorption using practical path loss models. The performance was measured in terms of the signal-to-interference-and-noise-ratio of the uplink channel. We further developed an optimization technique to obtain the optimal satellite antenna beamwidth that maximizes the SINR. Based on the result, we derived a link-availability model that shows the relationship between the transmission duty cycle and antenna beamwidth from one side and SINR threshold on the other side. The satellite link-availability shows a promising role of using a shared spectrum in IoT-over-Satellite applications opening the door for a faster-to-market implementation of IoT-over-Satellite. Future works will include investigating the impact of different access schemes on IoT-over-Satellite communication and to minimize the terrestrial interference in an IoT-over-Satellite system.
Author Contributions
C.C.C. and A.A.-H. conceived, planned and developed the simulation framework and analytic model. C.C.C. performed the numerical simulation, analytic calculation and derived the uplink-availability equation. A.A.-H. supervised the project. C.C.C. took the lead in writing the manuscript. All authors provided critical feedback and helped shape the research, analysis and manuscript. All authors discussed the results and commented on the manuscript. All authors have read and agreed to the published version of the manuscript.
Funding
This research received no external funding.
Acknowledgments
The authors would like to thank Mohammed Elsagher for his contribution to the implementation of the ITU-R P.676-12 air-absorption model.
Conflicts of Interest
The authors declare no conflicts of interest.
References
- Qu, Z.; Zhang, G.; Cao, H.; Xie, J. LEO satellite constellation for Internet of Things. IEEE Access 2017, 5, 18391–18401. [Google Scholar] [CrossRef]
- Sanctis, M.D.; Cianca, E.; Araniti, G.; Bisio, I.; Prasad, R. Satellite Communications Supporting Internet of Remote Things. IEEE Internet Things J. 2016, 3, 113–123. [Google Scholar] [CrossRef]
- Kawamoto, Y.; Nishiyama, H.; Kato, N.; Yoshimura, N.; Yamamoto, S. Internet of things (IoT): Present state and future prospects. IEICE Trans. Inf. Syst. 2014, 97, 2568–2575. [Google Scholar] [CrossRef] [Green Version]
- Hornillo-Mellado, S.; Martín-Clemente, R.; Baena-Lecuyer, V. Prediction of Satellite Shadowing in Smart Cities with Application to IoT. Sensors 2020, 20, 475. [Google Scholar] [CrossRef] [PubMed] [Green Version]
- Jia, M.; Gu, X.; Guo, Q.; Xiang, W.; Zhang, N. Broadband hybrid satellite-terrestrial communication systems based on cognitive radio toward 5G. IEEE Wirel. Commun. 2016, 23, 96–106. [Google Scholar] [CrossRef]
- Kodheli, O.; Guidotti, A.; Vanelli-Coralli, A. Integration of Satellites in 5G through LEO Constellations. In Proceedings of the GLOBECOM 2017—2017 IEEE Global Communications Conference, Singapore, 4–8 December 2017; pp. 1–6. [Google Scholar]
- Alliance, L. LoRaWAN® Regional Parameters; LoRa Alliance: Fremont, CA, USA, 2019; Available online: https://lora-alliance.org/sites/default/files/2020-01/rp_2-1.0.0_final_release.pdf (accessed on 21 May 2020).
- 3rd Generation Partnership Project (3GPP). Solutions for NR to Support Non-Terrestrial Networks (NTN). 2019. Available online: http://www.3gpp.org/ftp/TSG_RAN/TSG_RAN/TSGR_86/Docs/RP-193062.zip (accessed on 5 April 2020).
- 3rd Generation Partnership Project (3GPP). Study on Architecture Aspects for Using Satellite Access in 5G. 2019. Available online: http://www.3gpp.org/ftp/tsg_sa/TSG_SA/TSGS_86/Docs/SP-191095.zip (accessed on 5 April 2020).
- Roddy, D. Satellite Communications, (Professional Engineering); McGraw-Hill Professional: New York, NY, USA, 2006. [Google Scholar]
- Fairhurst, G.; Caviglione, L.; Collini-Nocker, B. FIRST: Future Internet—A role for satellite technology. In Proceedings of the 2008 IEEE International Workshop on Satellite and Space Communications, Toulouse, France, 1–3 October 2008; pp. 160–164. [Google Scholar]
- Foreman, V.L.; Siddiqi, A.; De Weck, O. Large satellite constellation orbital debris impacts: Case studies of oneweb and spacex proposals. In Proceedings of the AIAA SPACE and Astronautics Forum and Exposition, Orlando, FL, USA, 12–14 September 2017; p. 5200. [Google Scholar]
- Celandroni, N.; Ferro, E.; Gotta, A.; Oligeri, G.; Roseti, C.; Luglio, M.; Bisio, I.; Cello, M.; Davoli, F.; Panagopoulos, A.D.; et al. A survey of architectures and scenarios in satellite-based wireless sensor networks: System design aspects. Int. J. Satell. Commun. Netw. 2013, 31, 1–38. [Google Scholar] [CrossRef]
- Stankovic, J.A. Research Directions for the Internet of Things. IEEE Internet Things J. 2014, 1, 3–9. [Google Scholar] [CrossRef]
- Vejlgaard, B.; Lauridsen, M.; Nguyen, H.; Kovacs, I.Z.; Mogensen, P.; Sorensen, M. Coverage and Capacity Analysis of Sigfox, LoRa, GPRS, and NB-IoT. In Proceedings of the 2017 IEEE 85th Vehicular Technology Conference (VTC Spring), Sydney, Australia, 4–7 June 2017; pp. 1–5. [Google Scholar]
- Marchese, M.; Moheddine, A.; Patrone, F. IoT and UAV Integration in 5G Hybrid Terrestrial-Satellite Networks. Sensors 2019, 19, 3704. [Google Scholar] [CrossRef] [PubMed] [Green Version]
- 3rd Generation Partnership Project (3GPP). Study on Narrow-Band Internet of Things (NB-IoT)/Enhanced Machine Type Communication (eMTC) Support for Non-Terrestrial Networks (NTN). 2019. Available online: https://portal.3gpp.org/desktopmodules/Specifications/SpecificationDetails.aspx?specificationId=3747 (accessed on 5 April 2020).
- Janhunen, J.; Ketonen, J.; Hulkkonen, A.; Ylitalo, J.; Roivainen, A.; Juntti, M. Satellite Uplink Transmission with Terrestrial Network Interference. In Proceedings of the 2015 IEEE Global Communications Conference (GLOBECOM), San Diego, CA, USA, 6–10 December 2015; pp. 1–6. [Google Scholar]
- Homssi, B.A.; Al-Hourani, A.; Evans, R.J.; Chavez, K.G.; Kandeepan, S.; Rowe, W.S.T.; Loney, M. Free Spectrum for IoT: How Much Can It Take? In Proceedings of the 2018 IEEE International Conference on Communications Workshops (ICC Workshops), Kansas City, MO, USA, 20–24 May 2018; pp. 1–6. [Google Scholar]
- ITU-R, Rec. P. 676-12: Attenuation by Atmospheric Gases in the Frequency Range 1–350 GHz; Propagat. Radiowave Propagation; Electronic Publication: Geneva, Switzerland, 2019; Available online: https://www.itu.int/rec/R-REC-P.676-12-201908-I/en (accessed on 21 May 2020).
- Al-Hourani, A.; Kandeepan, S.; Jamalipour, A. Modeling air-to-ground path loss for low altitude platforms in urban environments. In Proceedings of the 2014 IEEE Global Communications Conference (GLOBECOM), Austin, TX, USA, 8–12 December 2014; pp. 2898–2904. [Google Scholar]
- ITU-R, Rec. P. 1410-5: Propagation Data and Prediction Methods Required for the Design of Terrestrial Broadband Radio Access Systems Operating in a Frequency Range from 3 to 60 GHz; Propagat. Radiowave Propagation; Electronic Publication: Geneva, Switzerland, 2013; Available online: https://www.itu.int/rec/R-REC-P.1410/en (accessed on 21 May 2020).
- Ayele, E.D.; Hakkenberg, C.; Meijers, J.P.; Zhang, K.; Meratnia, N.; Havinga, P.J. Performance analysis of LoRa radio for an indoor IoT applications. In Proceedings of the 2017 International Conference on Internet of Things for the Global Community (IoTGC), Funchal, Portugal, 10–13 July 2017; pp. 1–8. [Google Scholar]
- Schodorf, J.B. Land-Mobile Satellite Communications. In Wiley Encyclopedia of Telecommunications; John Wiley & Sons, Inc.: Hoboken, NJ, USA, 2003; Available online: https://0-onlinelibrary-wiley-com.brum.beds.ac.uk/doi/abs/10.1002/0471219282.eot298 (accessed on 21 May 2020).
- Cakaj, S. Rain attenuation impact on performance of satellite ground stations for low earth orbiting (LEO) satellites in Europe. Int. J. Commun. Netw. Syst. Sci. 2009, 2, 480. [Google Scholar] [CrossRef] [Green Version]
- Australian Communications and Media Authority (ACMA). Short-Range Spread-Spectrum Devices Fact Sheet ACMA. 2019. Available online: https://www.acma.gov.au/Industry/Spectrum/Radiocomms-licensing/Class-licences/shortrange-spreadspectrum-devices-fact-sheet (accessed on 15 December 2019).
- The Internet of Things Alliance Australia (IoTA). Spectrum Available for IoT. 2016. Available online: https://http://www.iot.org.au/wp/wp-content/uploads/2016/12/IoTSpectrumFactSheet.pdf (accessed on 15 December 2019).
- Brouwer, D. Solution of the problem of artificial satellite theory without drag. Astron. J. 1959, 64, 378–430. [Google Scholar] [CrossRef]
- Lane, M.H.; Hoots, F.R. General Perturbations Theories Derived from the 1965 Lane Drag Theory; Project Space Track: New York, NY, USA, 1979; pp. 1–60. Available online: https://apps.dtic.mil/dtic/tr/fulltext/u2/a081264.pdf (accessed on 21 May 2020).
- 3rd Generation Partnership Project (3GPP). Study on New Radio (NR) to Support Non-Terrestrial Networks. 2019. Available online: http://www.3gpp.org/ftp//Specs/archive/38_series/38.811/38811-f20.zip (accessed on 25 April 2020).
- Ericsson. Ericsson Mobility Report. 2019. Available online: https://www.ericsson.com/4acd7e/assets/local/mobility-report/documents/2019/emr-november-2019.pdf (accessed on 15 December 2019).
- Glover, J.D.; Tennant, S.K. Remote Areas Statistical Geography in Australia: Notes on the Accessibility/Remoteness Index for Australia (ARIA+ Version). 2003. Available online: https://www.adelaide.edu.au/hugo-centre/services/aria (accessed on 15 December 2019).
Figure 1.
A block diagram for the proposed performance evaluation model of IoT-over-Satellite access system.
Figure 1.
A block diagram for the proposed performance evaluation model of IoT-over-Satellite access system.

Figure 2.
Illustration of the key satellite orbital parameter used in the SGP4 model where E is the eccentric anomaly of the satellite at time t.
Figure 2.
Illustration of the key satellite orbital parameter used in the SGP4 model where E is the eccentric anomaly of the satellite at time t.

Figure 3.
Explanation of the satellite down-tilt angle shown in (3). Since the satellite object is moving, the becomes a time varying function.
Figure 3.
Explanation of the satellite down-tilt angle shown in (3). Since the satellite object is moving, the becomes a time varying function.

Figure 4.
Different types of attenuation and the mean of total attenuation (purple line) with changing elevation angle . As the PLoS depends on the elevation angle, as shown in (8). IoT devices will suffer mostly NLoS condition when 10.
Figure 4.
Different types of attenuation and the mean of total attenuation (purple line) with changing elevation angle . As the PLoS depends on the elevation angle, as shown in (8). IoT devices will suffer mostly NLoS condition when 10.

Figure 5.
The packet error rate (PER) versus signal-to-interference-plus-noise ratio (SINR) with different Spreading Factor (SF) in LoRa modulation.
Figure 5.
The packet error rate (PER) versus signal-to-interference-plus-noise ratio (SINR) with different Spreading Factor (SF) in LoRa modulation.

Figure 6.
(a) Remoteness index and (b) IoT population based on human population. The higher value represents a higher level of remoteness. The red dash line is the satellite track over a week [32]. (a) Remoteness index based on Reference [32]. (b) Number of IoT devices in Australia.

Figure 7.
Average Uplink SINR of Australia over a week.

Figure 8.
Uplink-SINR during the accessible period with different antenna beamwidths of the satellite. The grey line represents the SINR threshold, and the period when SINR is above the threshold represents the available period for communication.
Figure 8.
Uplink-SINR during the accessible period with different antenna beamwidths of the satellite. The grey line represents the SINR threshold, and the period when SINR is above the threshold represents the available period for communication.

Figure 9.
An example of the availability percentage varies with the antenna beamwidth and the SINR threshold in Class 1. The dots indicate the simulation data and the heat map is the surface fitting using (18).
Figure 9.
An example of the availability percentage varies with the antenna beamwidth and the SINR threshold in Class 1. The dots indicate the simulation data and the heat map is the surface fitting using (18).

Figure 10.
The optimal satellite beamwidth with different SINR thresholds. It shows that the optimal antenna beamwidth for the satellite is from 22 to 28 based on the simulation.
Figure 10.
The optimal satellite beamwidth with different SINR thresholds. It shows that the optimal antenna beamwidth for the satellite is from 22 to 28 based on the simulation.

Figure 11.
An example of SINR vs antenna beamwidth with different SINR threshold. The red line represents the optimal antenna beamwidths () when maximum link-availability achieved.
Figure 11.
An example of SINR vs antenna beamwidth with different SINR threshold. The red line represents the optimal antenna beamwidths () when maximum link-availability achieved.

Figure 12.
The link-availability at different SINR threshold when the optimal beamwidth is adopted. The markers represent the result of the simulation, while the plots are the approximation of link-availability using (18).
Figure 12.
The link-availability at different SINR threshold when the optimal beamwidth is adopted. The markers represent the result of the simulation, while the plots are the approximation of link-availability using (18).

Figure 13.
The minimum Spreading Factor that suitable for the simulated area based on the result of average SINR over a week.
Figure 13.
The minimum Spreading Factor that suitable for the simulated area based on the result of average SINR over a week.


Table 1.
Internet of Things (IoT) technologies comparison.
| NB-IoT | SigFox | LoRaWAN | Wi-Fi 802.11ah | |
|---|---|---|---|---|
| Carrier Frequency | LTE bands | 915 MHz | 915 MHz | 2.4 or 5 GHz |
| Channel bandwidth | 200 kHz | 100 Hz | ≥125 kHz | 1/2/4/8/16 MHz |
| Modulation Scheme | QPSK | BPSK | CSS | N-QAM/NPSK |
| Transmit power | 23 dBm | 20 dBm | 30 dBm | 30 dBm |
| Access Scheme | SR + ALOHA | ALOHA | ALOHA | CSMA/CA |
Table 2.
Comparison of different practical Internet of Things (IoT)-over-Satellite systems.
| Company | Satellite Constellation | Frequency Band | Coverage | Transmit Power [dBm] | Targeting User |
|---|---|---|---|---|---|
| Iridium | constellation | 1616–1626.5 MHz | worldwide | less than 32 | commercial |
| Globalstar | constellation | UHF, SHF | worldwide | 18, 25 | commercial |
| Orbcomm | constellation | L-Band | worldwide | less than 37 | commercial |
| Myriota | 15 satellites | VHF, UHF, ISM | worldwide | 27, 27, 14 | commercial |
| Fossasat | single satellite | ISM 436.7 MHz | an hour per day | 16 | educational |
Table 3.
Evaluation parameter.
| Parameters | Symbol | Value |
|---|---|---|
| Number of satellite | - | 1 |
| Orbit | - | LEO |
| Satellite altitude | d | 300–850 km |
| Frequency band | f | 915–928 MHz [7] |
| Antenna beamwidth | 10–90 | |
| Channel bandwidth | B | 125 KHz [7] |
| Available number of channels | - | 64 [7] |
| Uplink noise temperature | - | 320 K [24,25] |
| Transmission duty cycle | - | 1% [26,27] |
| Depression angle | - | |
| Elevation angle | - | |
| Transmit power | 100 mW [26,27] | |
| Uplink Transmitter gain | 0 dBi | |
| Number of simulates | N | 7,380,000 |
| Latitude range | −43.0031 to −12.4611 | |
| Longitude range | 113.6594 to 153.6119 | |
| SINR Treshold Range | 10–20 dB |
Table 4.
The lowest SINR values limit in LoRa chirp spread spectrum (CSS) modulation with six spreading factors and 125KHz bandwidth.
Table 4.
The lowest SINR values limit in LoRa chirp spread spectrum (CSS) modulation with six spreading factors and 125KHz bandwidth.
| Spreading Factor | 7 | 8 | 9 | 10 | 11 | 12 |
|---|---|---|---|---|---|---|
| SINR (dB) | −5 | −8 | −10 | −14 | −16 | −18 |
Table 5.
Surface Polynomial Coefficients for Class 1.
| i | 0 | 1 | 2 | 3 | 4 | |
|---|---|---|---|---|---|---|
| j | ||||||
| 0 | 3.296 | −0.3102 | 0.01652 | −0.0003975 | 3.57 × 10 | |
| 1 | −0.2542 | 0.01051 | −0.0001986 | 9.556 × 10 | - | |
| 2 | 0.01015 | −0.0003013 | 3.305 × 10 | - | - | |
| 3 | −0.0001688 | 2.166 × 10 | - | - | - | |
| 4 | 1.115 × 10 | - | - | - | - |
Table 6.
Surface Polynomial Coefficients for Class 2.
| i | 0 | 1 | 2 | 3 | 4 | |
|---|---|---|---|---|---|---|
| j | ||||||
| 0 | 5.193 | −0.7377 | 0.04943 | −0.001439 | 1.566 × 10 | |
| 1 | −0.2536 | 0.01297 | −0.0003978 | 2.702 × 10 | - | |
| 2 | 0.009473 | −0.0003127 | 6.509 × 10 | - | - | |
| 3 | −0.0001397 | 9.906 × 10 | - | - | - | |
| 4 | 9.301 × 10 | - | - | - | - |
Table 7.
Surface Polynomial Coefficients for Class 3.
| i | 0 | 1 | 2 | 3 | 4 | |
|---|---|---|---|---|---|---|
| j | ||||||
| 0 | 1.006 | −0.1815 | 0.01493 | −0.0004503 | 4.597 × 10 | |
| 1 | 0.002753 | −0.003322 | −2.033 × 10 | 1.53 × 10 | - | |
| 2 | 0.0004753 | 0.0001392 | −1.35 × 10 | - | - | |
| 3 | −3.165 × 10 | −1.09 × 10 | - | - | - | |
| 4 | 3.75 × 10 | - | - | - | - |
© 2020 by the authors. Licensee MDPI, Basel, Switzerland. This article is an open access article distributed under the terms and conditions of the Creative Commons Attribution (CC BY) license (http://creativecommons.org/licenses/by/4.0/).
Share and Cite
MDPI and ACS Style
Chan, C.C.; Al-Hourani, A.; Choi, J.; Gomez, K.M.; Kandeepan, S. Performance Modeling Framework for IoT-over-Satellite Using Shared Radio Spectrum. Remote Sens. 2020, 12, 1666. https://0-doi-org.brum.beds.ac.uk/10.3390/rs12101666
AMA Style
Chan CC, Al-Hourani A, Choi J, Gomez KM, Kandeepan S. Performance Modeling Framework for IoT-over-Satellite Using Shared Radio Spectrum. Remote Sensing. 2020; 12(10):1666. https://0-doi-org.brum.beds.ac.uk/10.3390/rs12101666
Chicago/Turabian StyleChan, Chiu Chun, Akram Al-Hourani, Jinho Choi, Karina Mabell Gomez, and Sithamparanathan Kandeepan. 2020. "Performance Modeling Framework for IoT-over-Satellite Using Shared Radio Spectrum" Remote Sensing 12, no. 10: 1666. https://0-doi-org.brum.beds.ac.uk/10.3390/rs12101666
Note that from the first issue of 2016, this journal uses article numbers instead of page numbers. See further details here.