Article

Comparison of Above-Water Seabird and TriOS Radiometers along an Atlantic Meridional Transect

1
Department of Remote Sensing, Tartu University, Tartu Observatory, Observatooriumi 1, 61602 Tartu, Estonia
2
Plymouth Marine Laboratory, Prospect Place, The Hoe, Plymouth PL1 3DH, UK
3
European Space Agency, 2201 AZ Noordwijk, The Netherlands
*
Author to whom correspondence should be addressed.
Remote Sens. 2020, 12(10), 1669; https://0-doi-org.brum.beds.ac.uk/10.3390/rs12101669
Submission received: 14 April 2020 / Revised: 15 May 2020 / Accepted: 18 May 2020 / Published: 22 May 2020
(This article belongs to the Special Issue Fiducial Reference Measurements for Satellite Ocean Colour)

Abstract

:
The Fiducial Reference Measurements for Satellite Ocean Color (FRM4SOC) project has carried out a range of activities to evaluate and improve the state-of-the-art in ocean color radiometry. This paper described the results from a ship-based intercomparison conducted on the Atlantic Meridional Transect 27 from 23rd September to 5th November 2017. Two different radiometric systems, TriOS-Radiation Measurement Sensor with Enhanced Spectral resolution (RAMSES) and Seabird-Hyperspectral Surface Acquisition System (HyperSAS), were compared and operated side-by-side over a wide range of Atlantic provinces and environmental conditions. Both systems were calibrated for traceability to SI (Système international) units at the same optical laboratory under uniform conditions before and after the field campaign. The in situ results and their accompanying uncertainties were evaluated using the same data handling protocols. The field data revealed variability in the responsivity between TRiOS and Seabird sensors, which is dependent on the ambient environmental and illumination conditions. The straylight effects for individual sensors were mostly within ±3%. A near infra-red (NIR) similarity correction changed the water-leaving reflectance (ρw) and water-leaving radiance (Lw) spectra significantly, bringing also a convergence in outliers. For improving the estimates of in situ uncertainty, it is recommended that additional characterization of radiometers and environmental ancillary measurements are undertaken. In general, the comparison of radiometric systems showed agreement within the evaluated uncertainty limits. Consistency of in situ results with the available Sentinel-3A Ocean and Land Color Instrument (OLCI) data in the range from (400…560) nm was also satisfactory (−8% < Mean Percentage Difference (MPD) < 15%) and showed good agreement in terms of the shape of the spectra and absolute values.

Graphical Abstract

1. Introduction

The European Commission provides daily global ocean color data via the Ocean and Land Color Instrument (OLCI) on board Sentinel-3 (S-3) satellite in the context of the Copernicus program. The first Sentinel-3 satellite was launched in 2016. The Sentinel-3 mission will continue for at least two decades through the sequential launch of a cluster of satellites. These will provide data to Europe’s Copernicus environmental program to support monitoring, services, decision and policymaking, and climate change studies.
Based on the requirements of the Global Climate Observing System (GCOS), there is less than 5% uncertainty level expectation for water-leaving radiance (Lw) data contributing to climate studies. To reduce the uncertainties in the satellite products, System Vicarious Calibration (SVC) approach has been undertaken using field data to calibrate the combined system of satellite instrument and the processing algorithm [1,2]. SVC has been operationally used for previous, e.g., MEdium Resolution Imaging Spectrometer (MERIS) on board Environmental Satellite (ENVISAT) and on ongoing missions to meet ocean color mission requirements in open waters. For Sentinel-3 data, the SVC gains have now been applied to OLCI data on Sentinel-3A but not to Sentinel-3B yet. For S-3 OLCI radiometric products, Sentinel-3 mission requirements [3] foresee 5% uncertainty for bands (490, 510, 560) nm and 5–10% uncertainty for bands (400, 412, 442) nm depending on water types. To qualify as Fiducial Reference Measurements (FRM), quantification of the uncertainties in the Earth observation data is required. This can only be done by quantifying the uncertainties in the field data used to validate and through rigorous intercomparison exercises to assess differences in radiometer systems used for such validation.
The Fiducial Reference Measurements for Satellite Ocean Color (FRM4SOC) project aimed to evaluate and improve state of the art in ocean color radiometry through review of commonly used radiometers [4], SI (Système international) traceable calibrations [5], protocols for the downwelling irradiance [6] and water-leaving radiance [7], uncertainty evaluation at different stages of the traceability chain [5,8], and through series of radiometric comparisons [9,10,11,12]. These included:
  • a comparison of radiance and irradiance sources used for calibration of radiometers National Physics Laboratory-UK(NPL, UK) [9];
  • an indoor comparison of uniformly calibrated radiometers measuring stable radiance and irradiance sources where the illumination conditions and measurement geometry were strictly controlled and close to ideal [10];
  • an outdoor comparison over a Case 2 water body with the radiometers installed on the fixed platform (Lake Kääriku, Estonia). The illumination conditions during this experiment were variable due to the weather, while the measurement geometry resembled as closely as possible to the realistic field conditions [11];
  • a further outdoor comparison with the same instruments a year later on a fixed platform (the Aqua Alta Oceanographic Tower—AAOT) under near-ideal environmental conditions [12];
  • a shipborne campaign on the Atlantic Meridional Transect 27 (AMT27), (the current study).
The indoor exercise consisted of calibration of the instruments at the same laboratory and demonstrated satisfactory consistency between sensors with a standard deviation within ±1% [10]. The field comparisons had substantially larger variability between the same sensors, implying to the respective increase of the uncertainty of the field results. At Lake Kääriku, Estonia, there was large variability between recently calibrated sensors due to high spectral and spatial variability in the targets and environmental conditions. At the AAOT in the Adriatic Sea off Venice, there was a <5% difference in normalized water-leaving radiance of both TriOS- Radiation Measurement Sensor with Enhanced Spectral resolution (RAMSES) and Seabird- Hyperspectral Surface Acquisition System (HyperSAS) sensors compared to Aerosol Robotic Network for Ocean Color (AERONET-OC) SeaWiFS Photometer Revision for Incident Surface Measurements (SeaPRiSM) [12]. The reasons for the increase from 1 to 5% are likely to be due to different measurement targets during field measurements and calibration, both spectrally and spatially; less stable ambient temperatures during the field campaigns, which can vary, compared to the calibration temperature, by more than ±15 °C.
In this study, we analyzed the difference between a TriOS-RAMSES and Seabird-HyperSAS systems that were used in the indoor laboratory intercomparison and the two field intercomparisons [10,11,12] on the 27th Atlantic Meridional Transect (AMT27) cruise, which crossed a range of ocean provinces and different environmental conditions. The in situ data was also compared to S-3A OLCI radiometric products.
The objectives of this work were: (1) to analyze above-water in situ radiometric data measured using two different systems, both of which used three radiometers each, under variable environmental conditions, in the context of the previous intercomparisons [10,11,12]; (2) to specify the uncertainties for both systems, and to evaluate the consistency of measured in situ data; (3) to evaluate the consistency of satellite data with the in situ results, accounting for estimated in situ uncertainties.

2. Materials and Methods
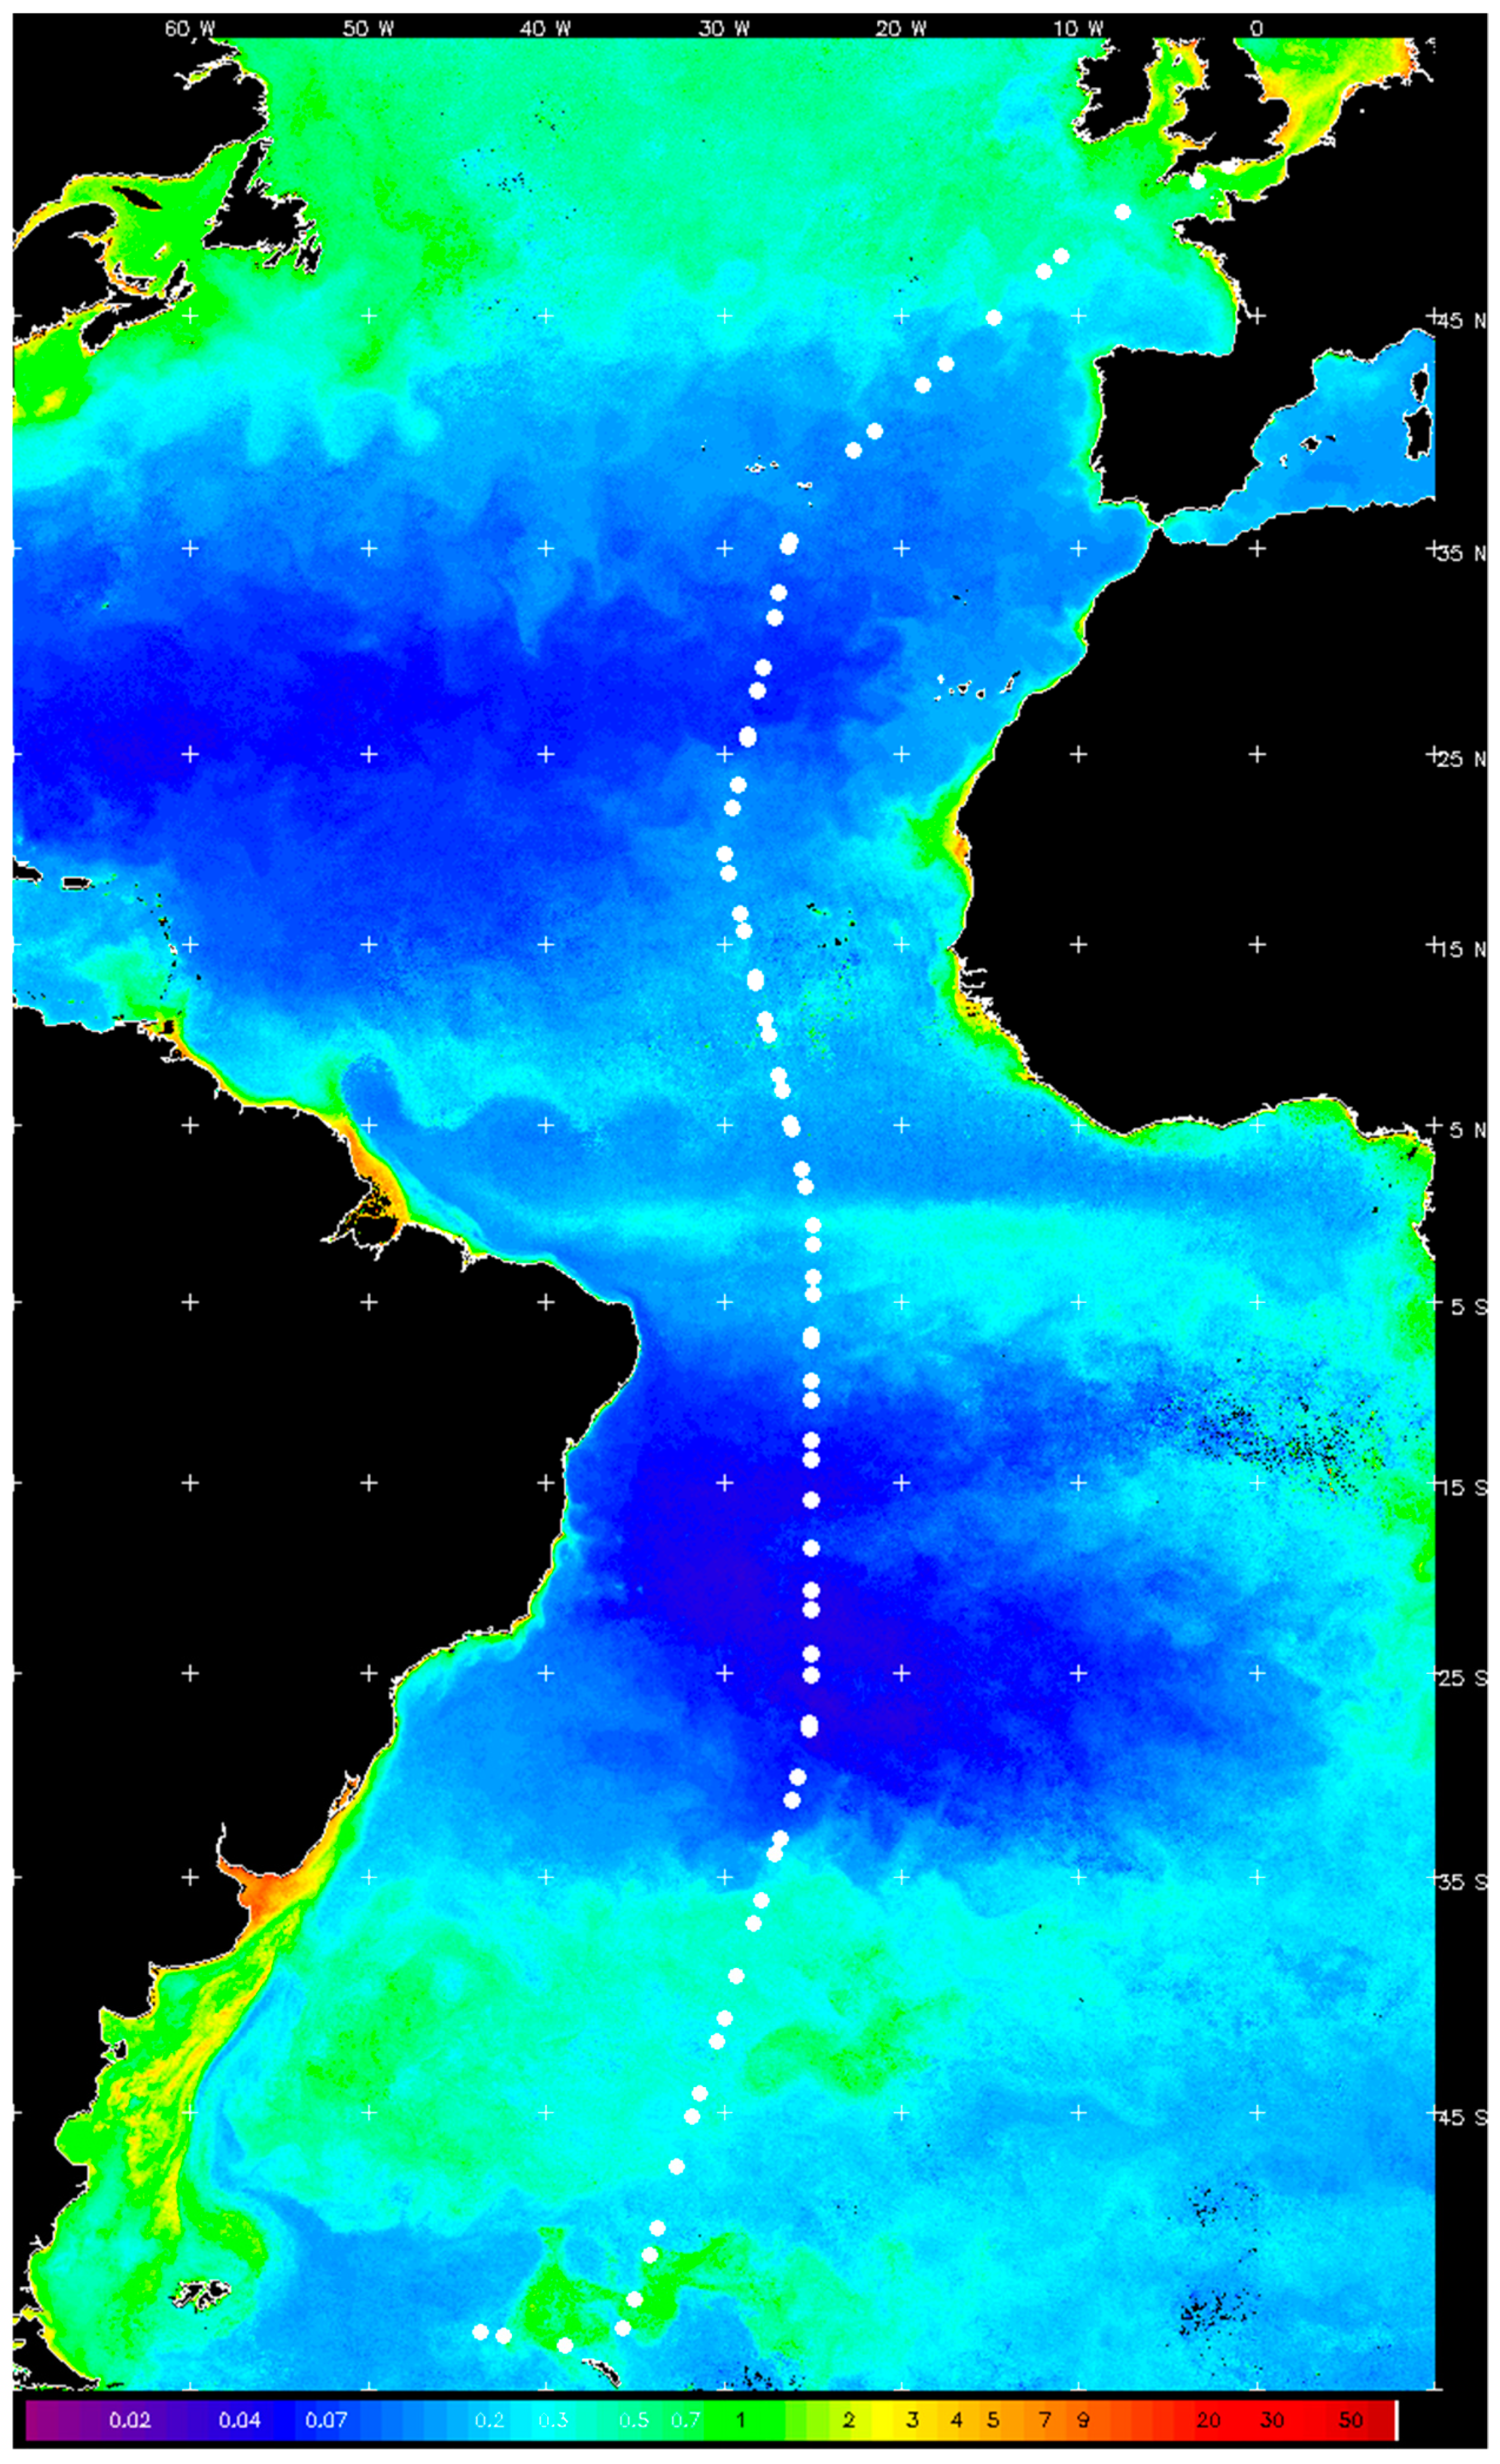
2.1. Study Site

The AMT27 field campaign took place from 23rd September to 5th November 2017 from Southampton, UK to South Georgia and the Falkland Islands on the UK-Natrual Environment Research Council (NERC) ship Royal Research Ship (RRS) Discovery. The AMT is a multidisciplinary research program, which undertakes biological, chemical, and physical oceanographic research during an annual voyage between the UK and destinations in the South Atlantic. The program has been running for 20 years and was established in 1995, in collaboration with National Aeronautics and Space Administration (NASA), as an independent platform to validate Sea-Viewing Wide Field-of-View Sensor (SeaWiFS) ocean color data. The transect covered several ocean provinces where key physical and biogeochemical variables, such as chlorophyll, primary production, nutrients, temperature, salinity, and oxygen, were measured. The stations sampled were principally in Case 1 waters [13,14]; in the North and South Atlantic Gyres, but also the productive waters of the Celtic Sea, Patagonian Shelf, and Equatorial upwelling zone were visited, which, therefore, offered a wide range of variability in which to conduct field intercomparisons. The measurement stations are listed in Table 1; Sentinel-3A OLCI quality controlled match-ups were available for station id-s 22, 32, 46, 48, 56.

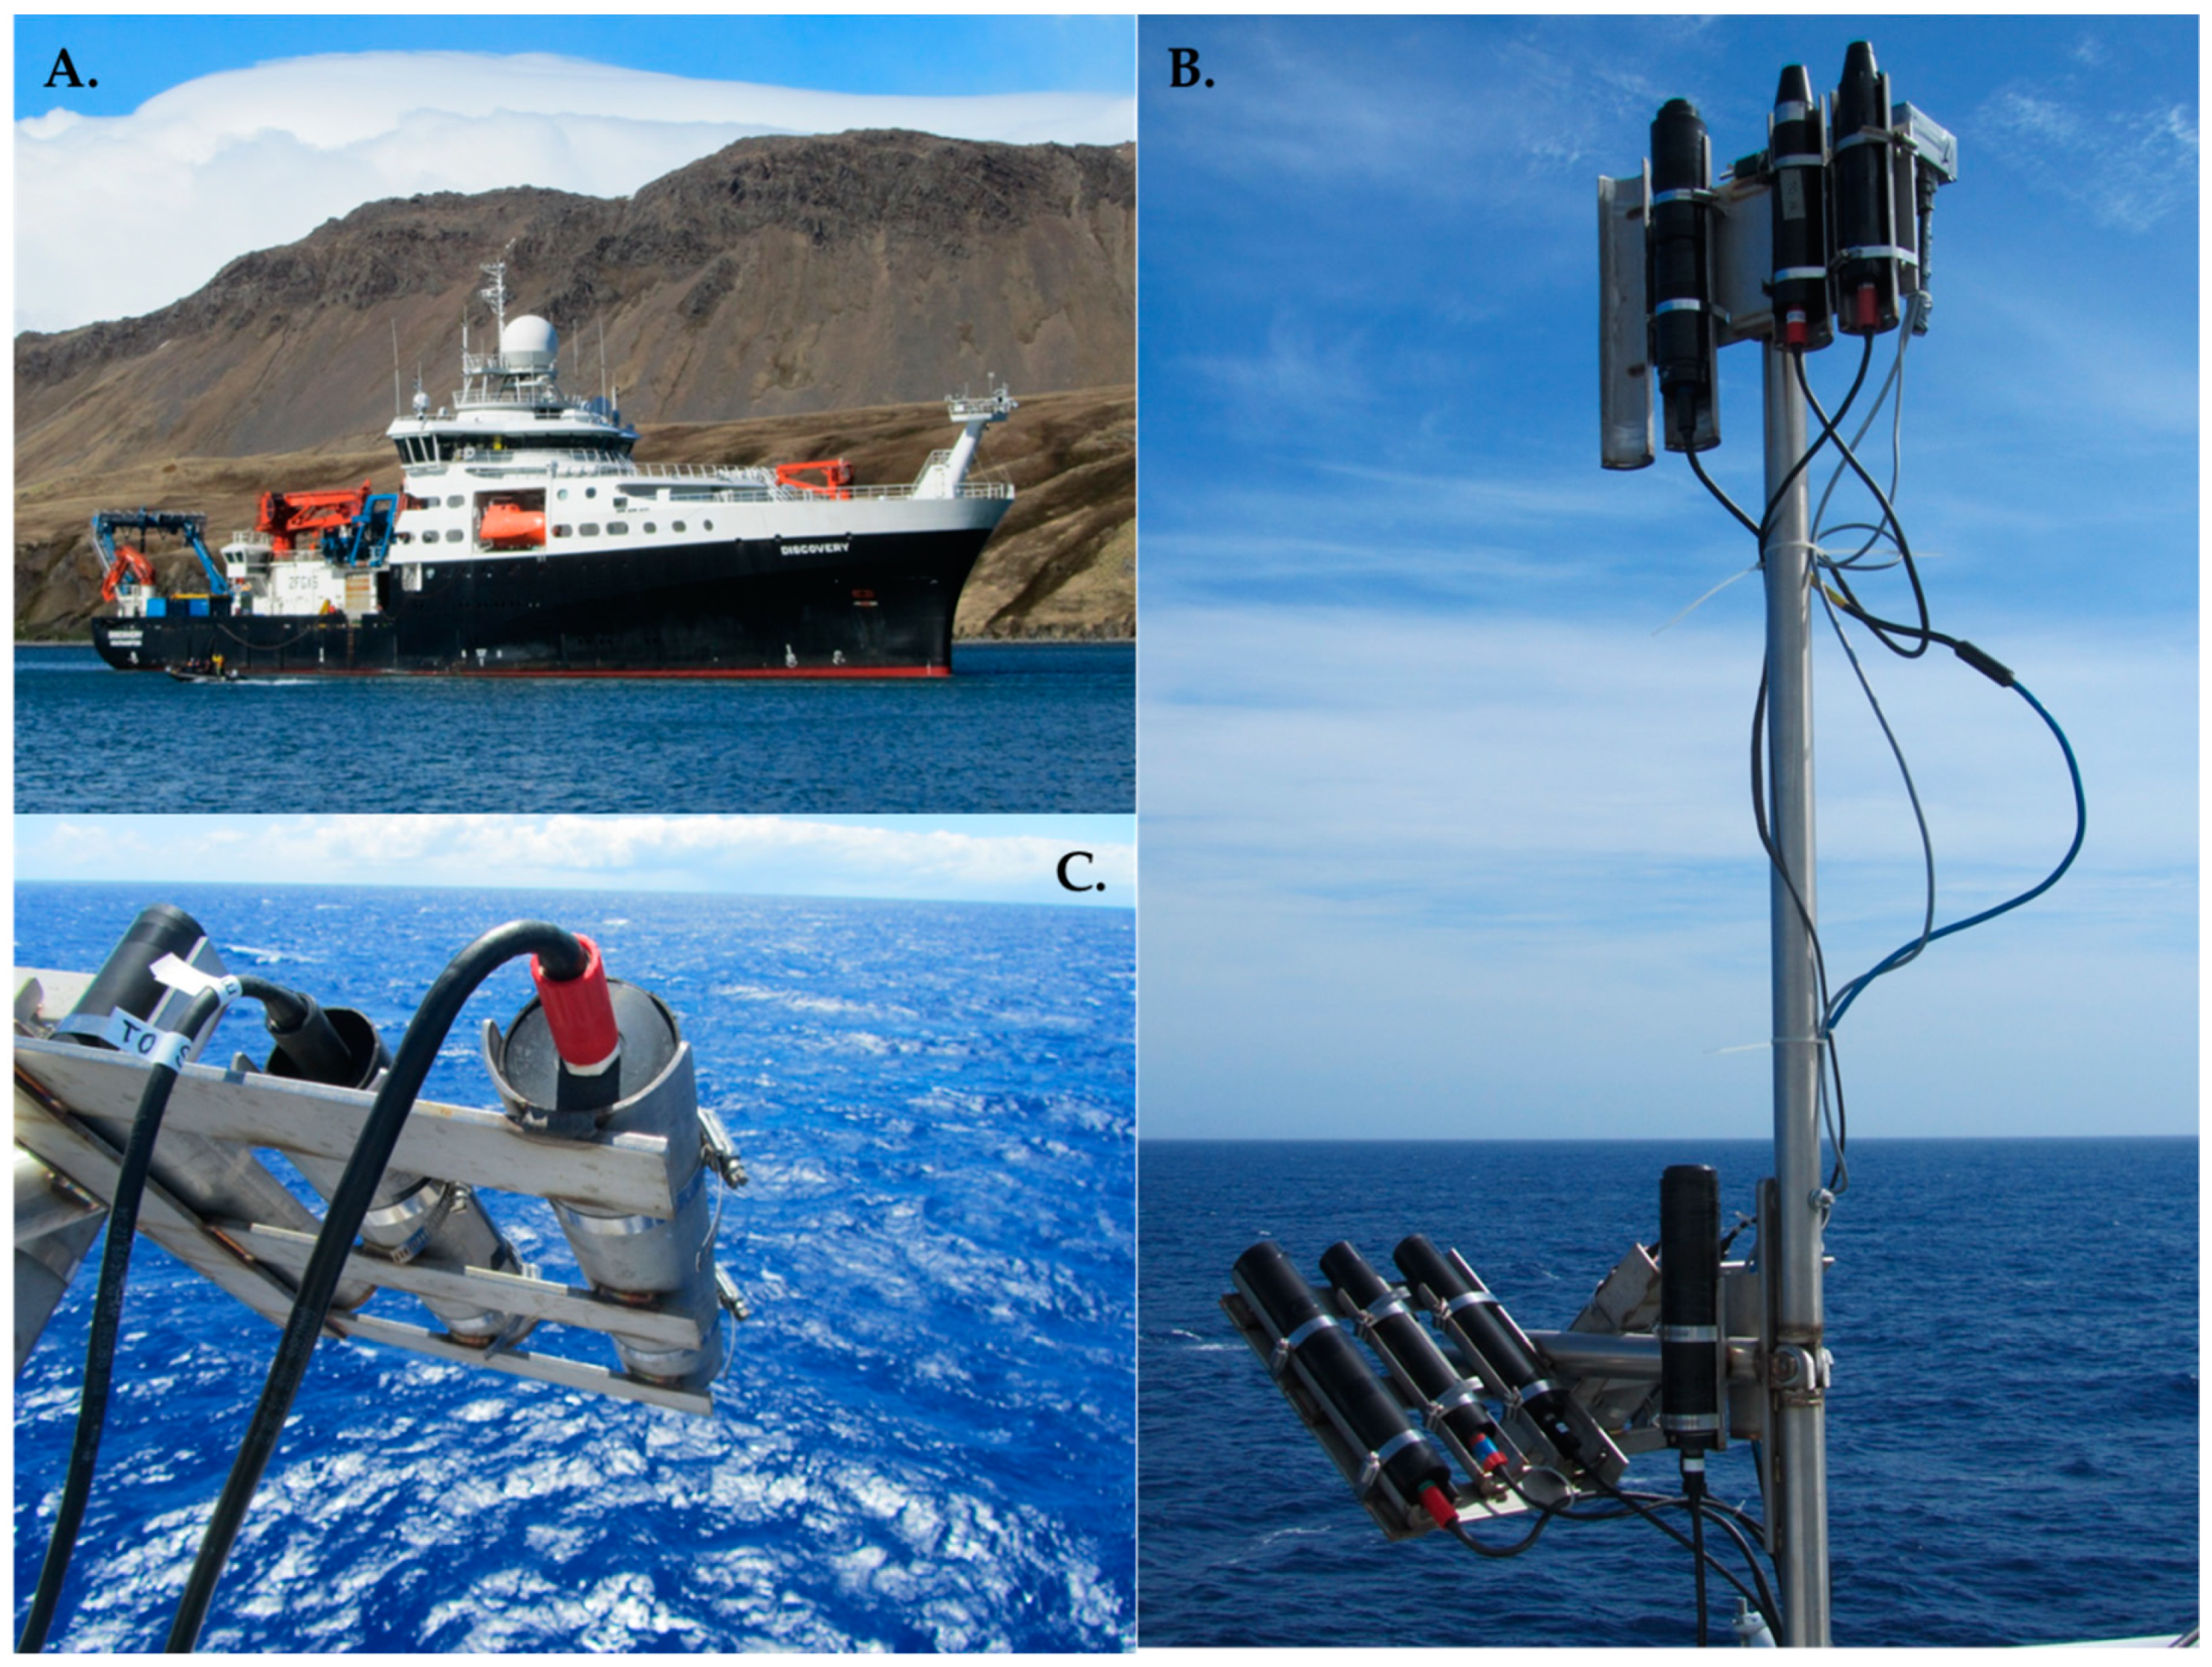
2.2. In Situ Above-Water Radiometric Data

Stations were sampled daily at 12:00 local time to ensure coincident in situ measurements within 1 h of the S-3 overpass. Radiometric measurements were performed with two sets of above water hyperspectral radiometers, both consisting of three separate sensors to measure radiance from the water surface Lu(λ), radiance from the sky Ld(λ), and downwelling solar irradiance Ed(λ). Plymouth Marine Laboratory (PML) used three Seabird (formerly Satlantic) HyperOCR sensors, while the University of Tartu (TO) used three TriOS RAMSES sensors. All radiance and irradiance sensors of both radiometric systems were SI-traceably calibrated at the Tartu Observatory following procedures entirely described in [10]. To comply with FRM, the sensors were calibrated frequently; in this case, three times: in April 2017 before the second SI-traceable Laboratory inter-comparison experiment (LCE-2) campaign, just after the AMT-27 campaign in January 2018, and in June 2018 before AAOT. All of these sensors were involved also in the LCE-2 intercomparisons, and during indoor measurements [10] demonstrated differences of less than ±1% both for radiance and irradiance results. However, during the outdoor exercise under cloudy conditions, the PML irradiance sensors did show up to 6% higher values in Ed at 400 nm, and radiance sensors did show up to about 10% higher values in red and IR parts of spectrum than the respective TO sensors [11]. Technical parameters [15,16] of the applied radiometers are given in Table 2.
The sensors are based on the Carl Zeiss Monolithic Miniature Spectrometer (MMS), incorporating a 256-channel silicon photodiode array. The SI-traceable radiometric calibration covered the wavelength range of (350…900) nm. During the field measurements, the integration time was automatically adjusted to correspond to the measured light intensity. The data acquisition system consisted of power supplies, RS232 multiplexers, and logging computers. The instruments were mounted on a common steel frame, which was constructed to perform measurements under identical zenith and viewing angles (Figure 1). The radiance sensors (Ld(λ)) and (Lu(λ)) were positioned at the very front of the ship (Figure 1A), with an un-obscured view of the ocean and sky (Figure 1C), side by side at the same height at 40° and 120° angles from zenith (Figure 1B), respectively. The colinearity of the radiance sensors in the frame was set by visual observation from the side of the frame and was estimated to be within ±1°. The downwelling irradiance sensors were positioned on the same steel frame, higher from other sensors to avoid any ship shadows. A fixed mounting frame of the irradiance sensors ensured equal height and leveling of the cosine collectors.

2.3. In Situ Data Processing

For both systems, the radiometric raw data were logged through a laptop, which was set up in the meteorological laboratory, some 50 m away from the setup of the radiometers on the meteorological platform at the bow of the ship (Figure 1). The HyperOCR instruments produced proprietary binary data files as standard output from the manufacturer’s software. The TriOS RAMSES spectrometers were operated by software developed in TO; spectra were stored in the American Standard Code for Information Interchange (ASCII) datafiles. The three HyperOCR spectrometers were individually measured in burst mode (i.e., continuously), while the three RAMSES devices performed synchronized measurement every 10 s. Altogether, five million spectra were collected by PML and 200,000 by TO. Additionally, ancillary meteorological and positional data were provided by the AMT crew in the form of Network Common Data Form (NetCDF) files. Particularly, position latitude and longitude, ship speed and direction, and wind speed and air temperature were used in this study.
A number of computer programs were created for this particular dataset to process the data. The algorithms were programmed directly without using external libraries. Third-party software was used to visualize the results and extract data from NetCDF files. Due to a large amount of spectra, a database was created first for all instruments, containing the filenames and positions within the data files, which was ordered by timestamps. Then, the database was used to dynamically extract the individual spectra from the raw data files without creating unnecessary copies of big data for the HyperOCR spectra, and the closest shutter measurement was subtracted from each field spectrum. In the case of TRiOS-RAMSES instruments, the average signal over the opaque pixels was used as a dark reference. In the case of HyperOCR, the L u spectrum was derived first and then the closest (within ±3 s) L d and E d spectrum in order to form the consistent data triplet. The spectra were derived according to the cast start and stop timestamps, calibration and all necessary corrections/filtering applied, after which the output quantities were calculated, and the corresponding uncertainties were evaluated. The results were stored as ASCII data files, which are convenient to use for post-processing or spreadsheet programs. The hyperspectral data was convoluted into 19 OLCI channels, from 400 nm to 885 nm, based on channel definitions from [17].
The corrections and filtering criteria were sequentially applied via command line parameters during the data processing. The steps included in the processing were: straylight correction, NIR similarity correction, clear sky, and overcast screening. The straylight removal algorithm was based on [18]. The Line Spread Functions (LSF) have been previously measured at TO. The straylight algorithm was applied separately to the raw calibration signals and to all the raw field spectra, individually for the six participating radiometers. NIR similarity correction was based on Formulas (3) and (4). The clear/overcast condition was based solely on the E d threshold level and was only used to assess the cosine error of the Ed sensors (Section 3.2).
The uncertainty of the results was evaluated according to the Guide to the Expression of Uncertainty in Measurement (GUM) [19]. For each input quantity, a relative standard uncertainty was estimated. The relative combined standard uncertainty of output quantity was calculated by combining relative standard uncertainties of all input estimates by using formula (12) of the Joint Committee for Guides in Metrology (JCGM) [19]. Radiometric calibration of the irradiance and radiance sensors and respective uncertainty budgets are described in [5]. The properties of the measured and derived quantities (water-leaving reflectance ρ w , downwelling sky irradiance Ed, water-leaving radiance Lw) and evaluation of related uncertainties can be found in [11,20]. Measurement models for the evaluation of the uncertainty of ρ w and Lw are defined by the Formulas (1), (2), and (5). Type B uncertainty of results measured by the Ed sensor included the calibration uncertainty and the aging, contribution due to the non-cosine response and temperature effects. The calibration uncertainty included the following components: alignment, repeatability, temporal stability of the calibration source, repeatability of the calibration and dark signals, thermal effects in the laboratory, polarization sensitivity. The absolute calibration of the source was excluded from the uncertainty budget of ρ w because all the radiometers were calibrated against the same lamp. Type A uncertainty for ρ w , Ed, and Lw was calculated as the standard deviation of the station average, taking into account the effective degree of freedom based on the lag1 autocorrelation of the time series [21]. The autocorrelation coefficient varied from 0 to 1, depending on the station. In the figures, the expanded uncertainties (k = 2) are shown. En numbers [22] were used to assess the agreement between the results from two radiometric systems.
The water-leaving reflectance spectra were calculated from the synchronized triplets measured with HyperSAS and TriOS-RAMSES hyperspectral radiometers following MERIS-Regional Validation of MERIS Chlorophyll Products in North Sea coastal waters (REVAMP) and the National Aeronautics and Space Administration (NASA) protocols [23,24]. The water-leaving reflectance ρ w N was calculated as
ρ w N = π R r s ( λ ) = π L u ( λ ) ρ ( W ) L d ( λ ) E d ( λ )
where R r s ( λ ) is the remote sensing reflectance, L u ( λ ) is the upwelling radiance from the sea, L d ( λ ) is the downwelling radiance from the sky, E d ( λ ) is the downwelling irradiance, and ρ ( W ) is the sea surface reflectance as a function of wind speed ( W , m·s−1), calculated as
ρ ( W ) = 0.0256 + 0.00039 W + 0.000034 W 2
The NIR similarity correction of the water-leaving reflectance spectra was based on [25,26]. First, the additive correction term for every individual spectrum was found as
ε = α 1 , 2 ·   ρ w ( λ 2 ) ρ w ( λ 1 ) α 1 , 2 1
The constant parameter α 1 , 2 of the NIR similarity correction [25] is determined in [26] and depends on the choice of wavelengths λ1 and λ2; α 1 , 2 = 2.35 for the λ1 = 720 nm and λ2 = 780 nm. The NIR similarity-corrected water-leaving reflectance, ρ w ( λ ) , was then calculated as:
ρ w ( λ ) = ρ w ( λ ) ε
The NIR-corrected water leaving radiance was calculated from corrected R r s ( λ ) as
L w = R r s ( λ ) E d ( λ )
For the output quantities ( ρ w , E d , and L w ), the median over the station results was calculated, and only the spectra within ±10% in respect of the median were included in final averaging.
The evaluation of the agreement between the results from two radiometric systems, E n numbers were calculated following [22] as
E n = x 1 x 2 U 1 2 + U 2 2
where x 1 and x 2 are the independent results subject to comparison; U 1 and U 2 are the expanded uncertainties of these results with k = 2, respectively. The agreement between the compared values was considered satisfactory if | E n | 1 and non-satisfactory if | E n | > 1 .

2.4. Sentinel-3A OLCI Data

Sentinel-3A OLCI full resolution level-2 data was downloaded from EUMETSAT (https://eoportal.eumetsat.int/) from the same day with in situ measurements. OLCI values from the 3 × 3 pixel Region of Interest (ROI) centered at the coordinates of the in situ stations were extracted for further analyses.
The recommended set of flags (CLOUD, CLOUD_AMBIGUOUS, CLOUD_MARGIN, INVALID, COSMETIC, SATURATED, SUSPECT, HISOLZEN, HIGHGLINT, SNOW_ICE, WHITECAPS, ANNOT_ABSO_D, ANNOT_MIXR1, ANNOT_TAU06, RWNEG_O2, RWNEG_O3, RWNEG_O4, RWNEG_O5, RWNEG_O6, RWNEG_O7, RWNEG_O8) was applied on the data to eliminate possible invalid values. Additionally, quality control was performed by checking the OLCI zenith angle < 60° and Sun zenith < 70°. Then, the mean (µ) and standard deviation (σ) were calculated within the ROI.
Further, pixel outliers were removed if ρ w ( λ ) < (µ − 1.5σ) or ρ w ( λ ) > (µ + 1.5σ). After removing the outliers, the Coefficient of Variation (CV=σ/ µ) was calculated for the full ROI, and match-ups with CV > 0.2 at 560 nm were discarded. After these filtering steps, five qualified match-ups were left corresponding to the in situ stations with station id’s 22, 32, 46, 48, and 56, respectively, from Table 1.
For the match-ups, the Mean Absolute Percentage Difference (MAPD) to investigate dispersion and MPD to investigate bias were calculated between OLCI and in situ data:
M A P D λ = i = 1 n 100 | ρ w ( λ ) i n s i t u , i ρ w ( λ ) o l c i , i ρ w ( λ ) i n s i t u , i |
M P D λ = i = 1 n 100 ( ρ w ( λ ) i n s i t u , i ρ w ( λ ) o l c i , i ρ w ( λ ) i n s i t u , i )
where ρ w ( λ ) i n s i t u , i and ρ w ( λ ) o l c i , i are, respectively, in situ and OLCI-derived values for the band λ and match-up i.
The filtering of satellite and in situ data was done following the EUMETSAT “Recommendations for Sentinel-3 OLCI ocean color product validations in comparison with in situ measurements—Match-up Protocols” [27].

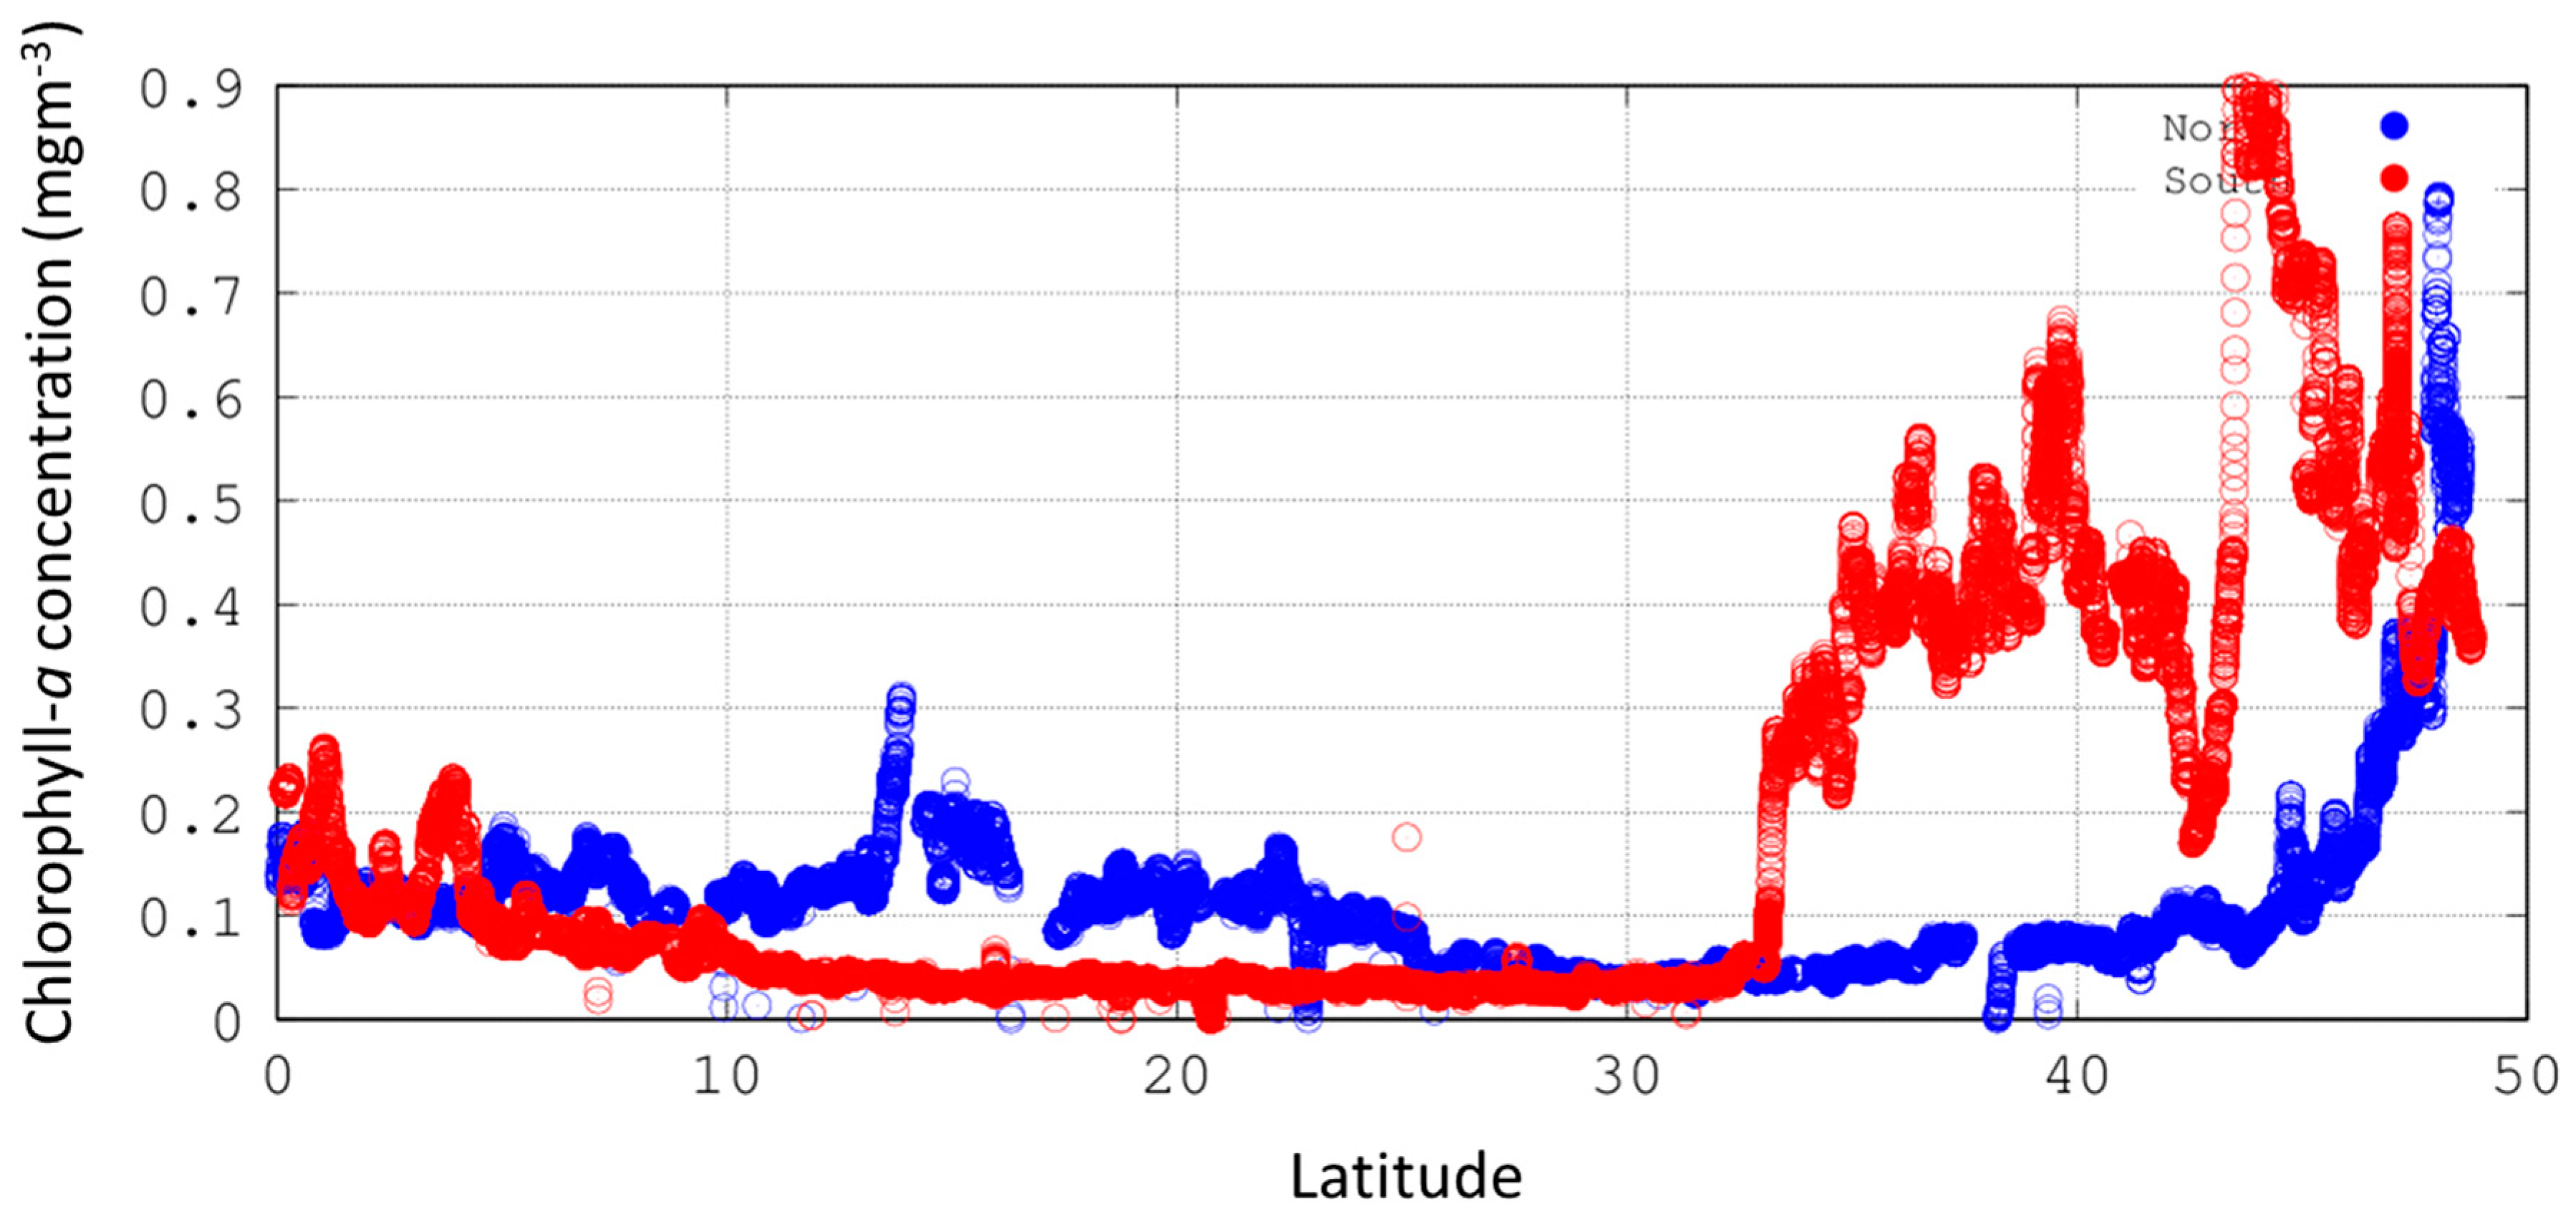
2.5. Measurement of Chlorophyll-a

Surface water samples were collected using 20 L Niskin bottles and between 1 and 6 L of seawater were filtered onto 0.7 µm GF/F filters. Discrete water samples were collected along the transects from an underway flow-through optical system and from Niskin bottle rosettes deployed with a Seabird Conductivity-Temperature-Depth sampling device. The water samples were filtered onto Whatman GF/F filters (nominal pore size of 0.7 μm), transferred to Cryovials and stored immediately in liquid nitrogen. High Performance Liquid Chromatography (HPLC) was then used to determine Total Chl a following the methods given in [28]. A WET Labs hyperspectral absorption-attenuation instrument (AC-S) was coupled to the ship’s clean flow-through system, which continually pumps seawater from a nominal depth of 5 to 7 m beneath the ship’s hull. The underway spectrophotometric method of determining Chl a is given in detail in [29]. Chl a concentrations were estimated from the absorption-attenuation instruments, using the absorption coefficient of particulate matter (ap(λ)) data at 650, 676 and 715 nm [29].

3. Results

Radiometric measurements were conducted at 32 stations (Figure 2), covering the Solar Zenith Angle (SZA) range of (6…60)° and ambient temperature range of (1…30) °C. Chlorophyll-a (Chl a) concentrations varied from (0.05…1.0) mg·m−3. They were highest on the UK shelf at 48°N where they reached 0.8 mg·m−3 and also in the South Atlantic from 33°S to 49°S where they were between 0.7 mg·m−3 and >0.9 mg·m−3 (Figure 3). For the results given in Figure 4 data from all stations were included without screening. In the following text and figures, The Seabird HyperOCR from Plymouth Marine Laboratory and TriOS RAMSES data from Tartu Observatory are denoted as “PML” and “TO”, respectively.
The uncorrected E d and ρ w spectra for all 32 stations are shown in Figure 4 together with the expanded uncertainties. The scatter in E d at noon was caused by the high Solar Zenith Angle and by the sky conditions, which varied from overcast to clear. The water type was Case 1 during the whole campaign with slightly modified short-wavelength reflectance near the coastline in the beginning and end of the voyage, as characterized by the reflectance spectra (Figure 4, right).
The initial ρ w spectra (Figure 4) showed two potential outliers from stations 67 and 50, respectively, the lowest and highest ρ w spectra in Figure 4. While ρ w from station 67 could be explained by poor measurement conditions (Table 1), the measurement conditions were optimal in station 50. Besides, as both radiometric systems resulted in the closely similar shape and absolute values of ρ w at these stations, these spectra were included in further analyses in order to show the resulting processing steps.
The uncertainty lower limits (3% for E d and 5% for ρ w , k = 2) were determined by type B instrumental components and could be reached in the near-ideal measurement conditions.

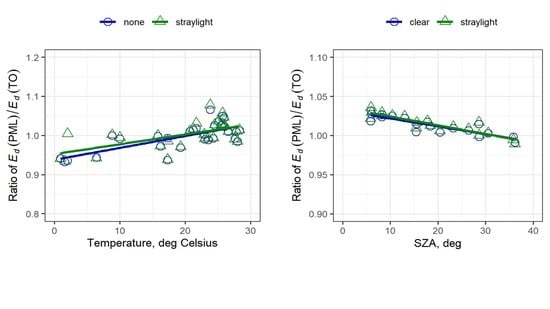
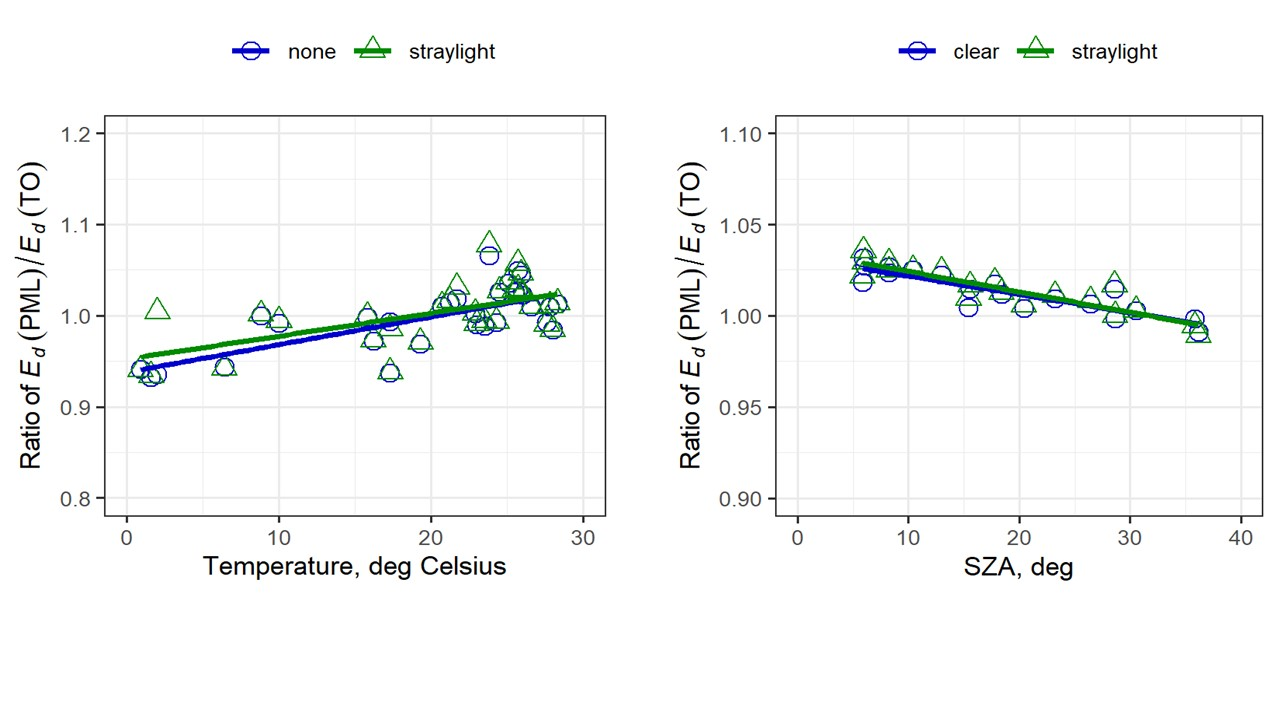
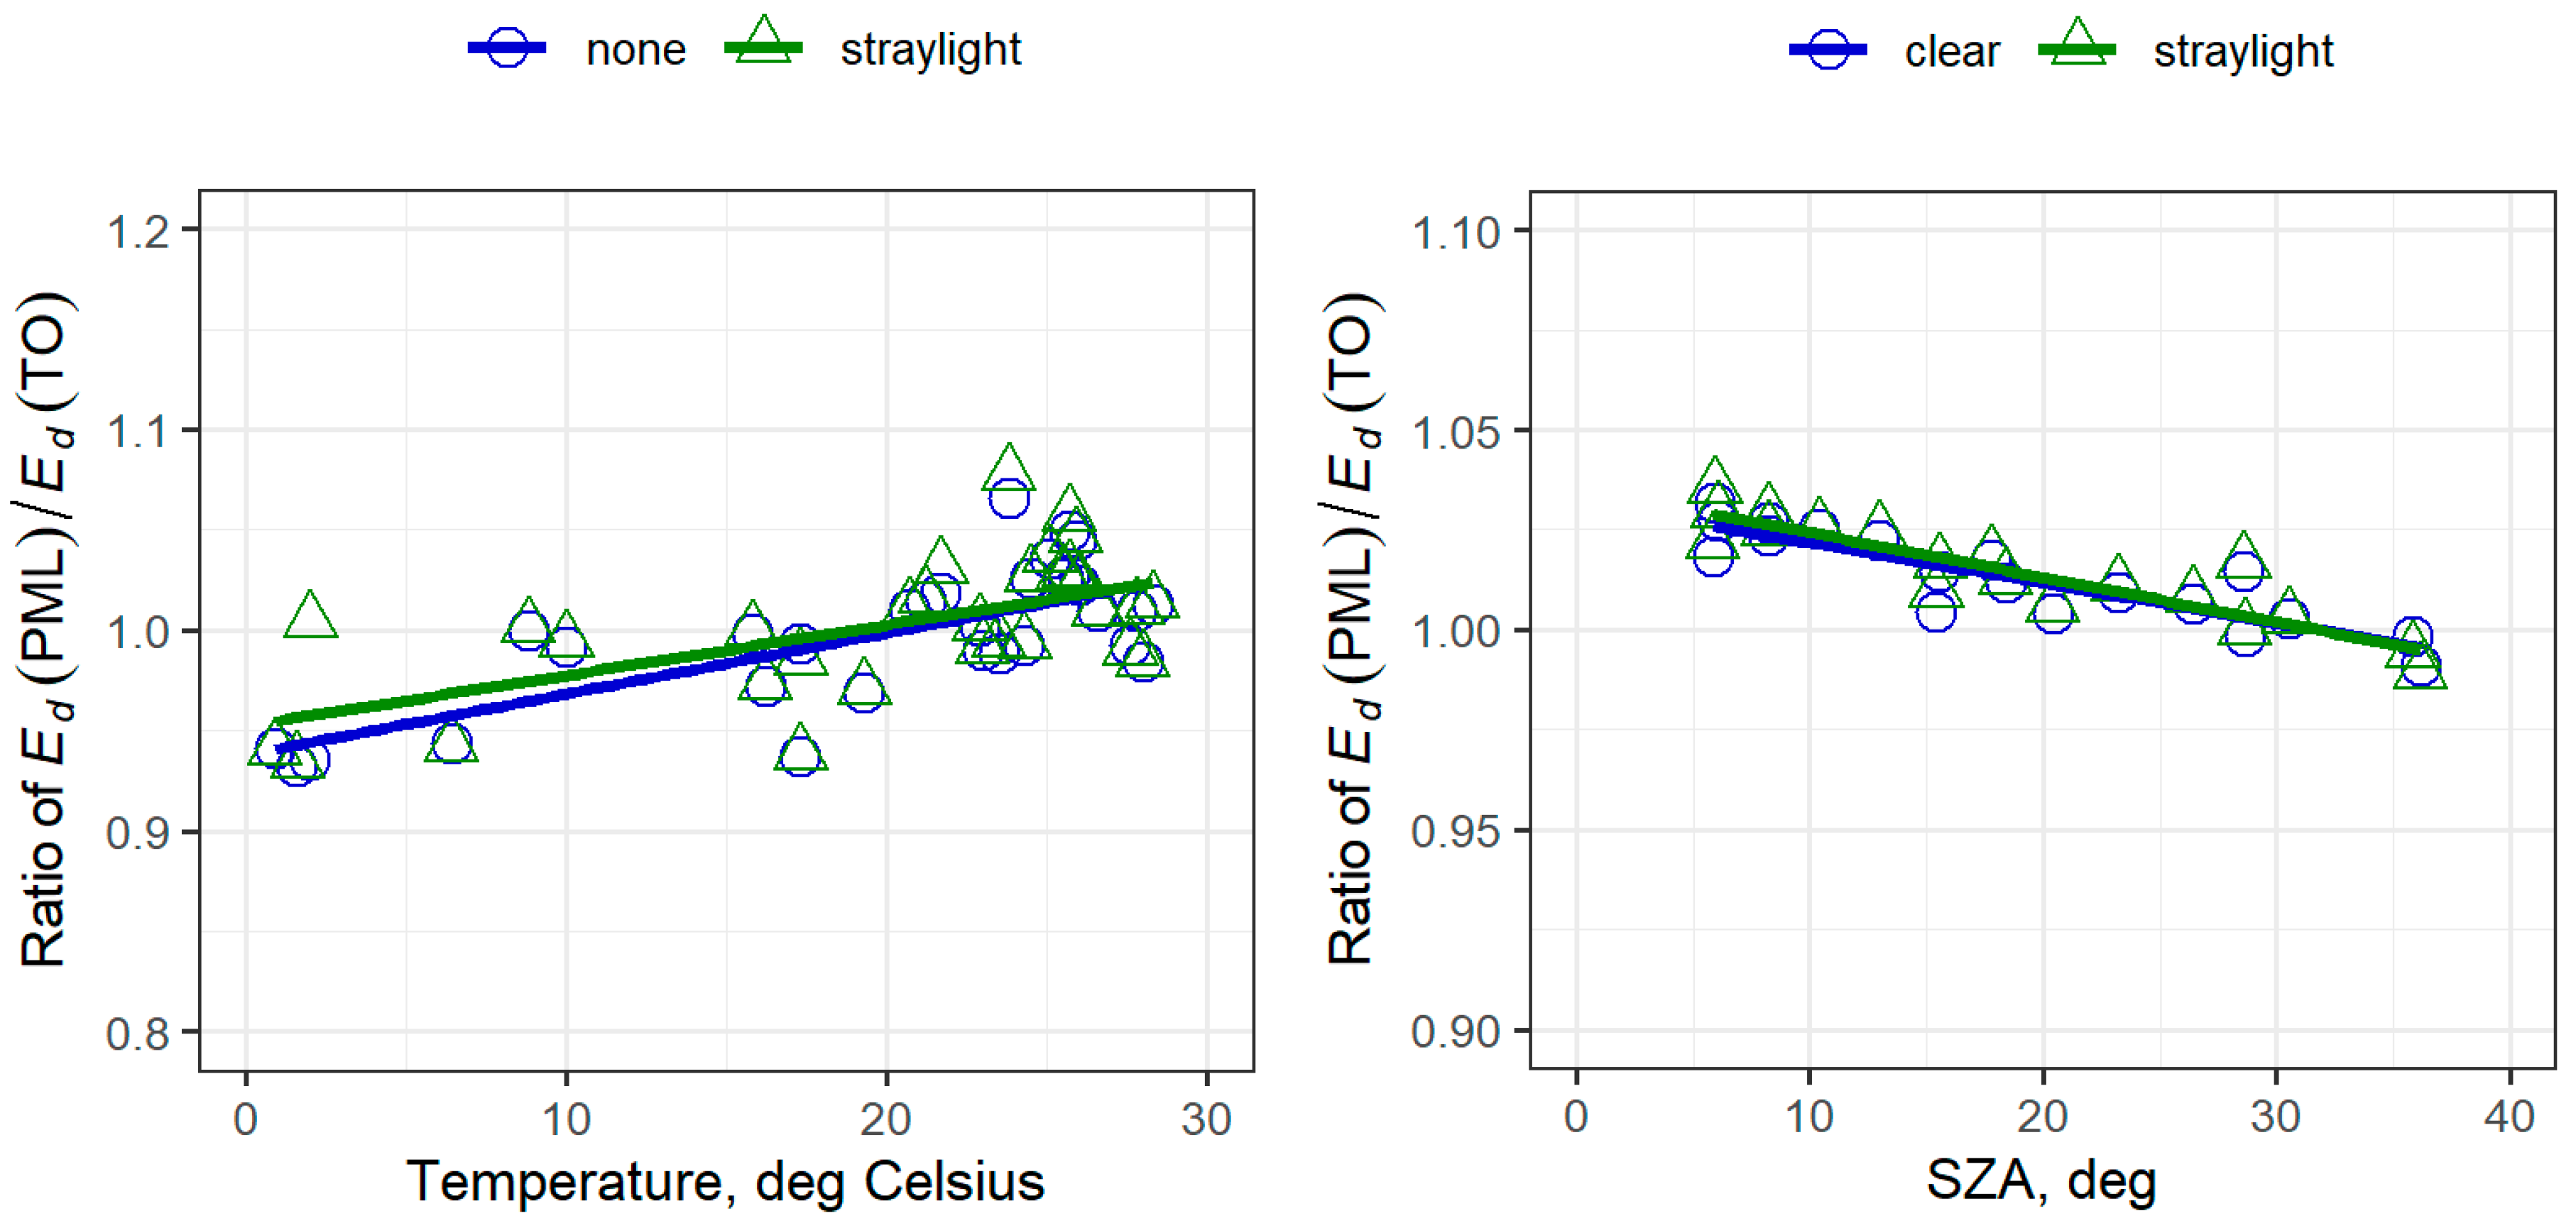
3.1. Environmental Effects

The difference in results of downwelling irradiance between PML and TO, as a function of ambient temperature and as a function of Solar Zenith Angle, is shown in Figure 5. The ratios of E d (PML)/ E d (TO) were averaged over all OLCI band values and included all measurement stations.

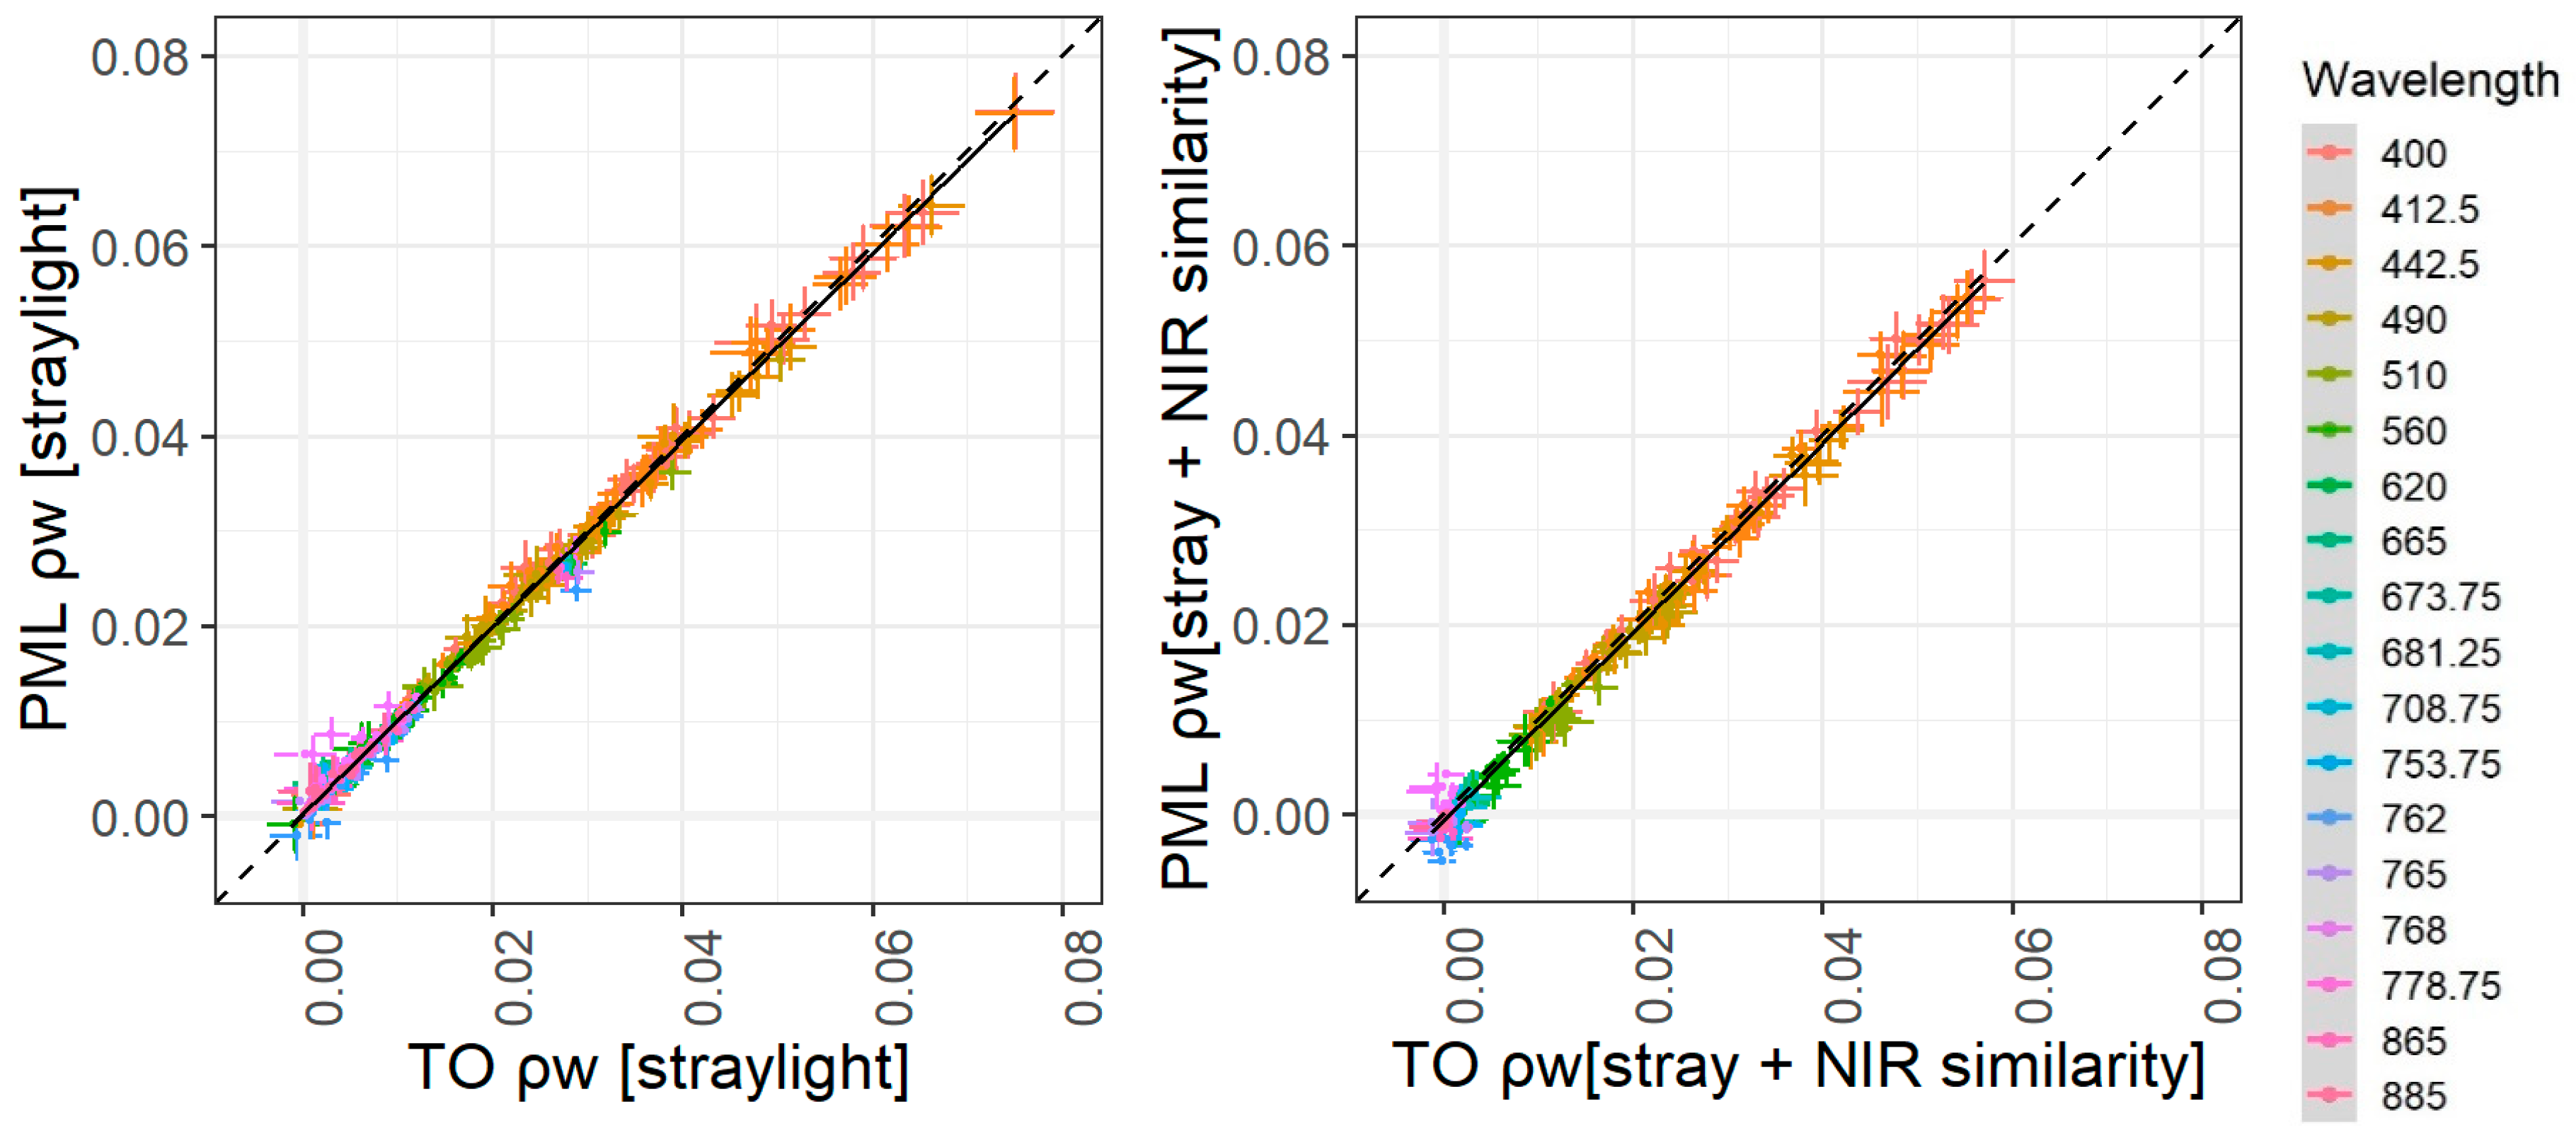
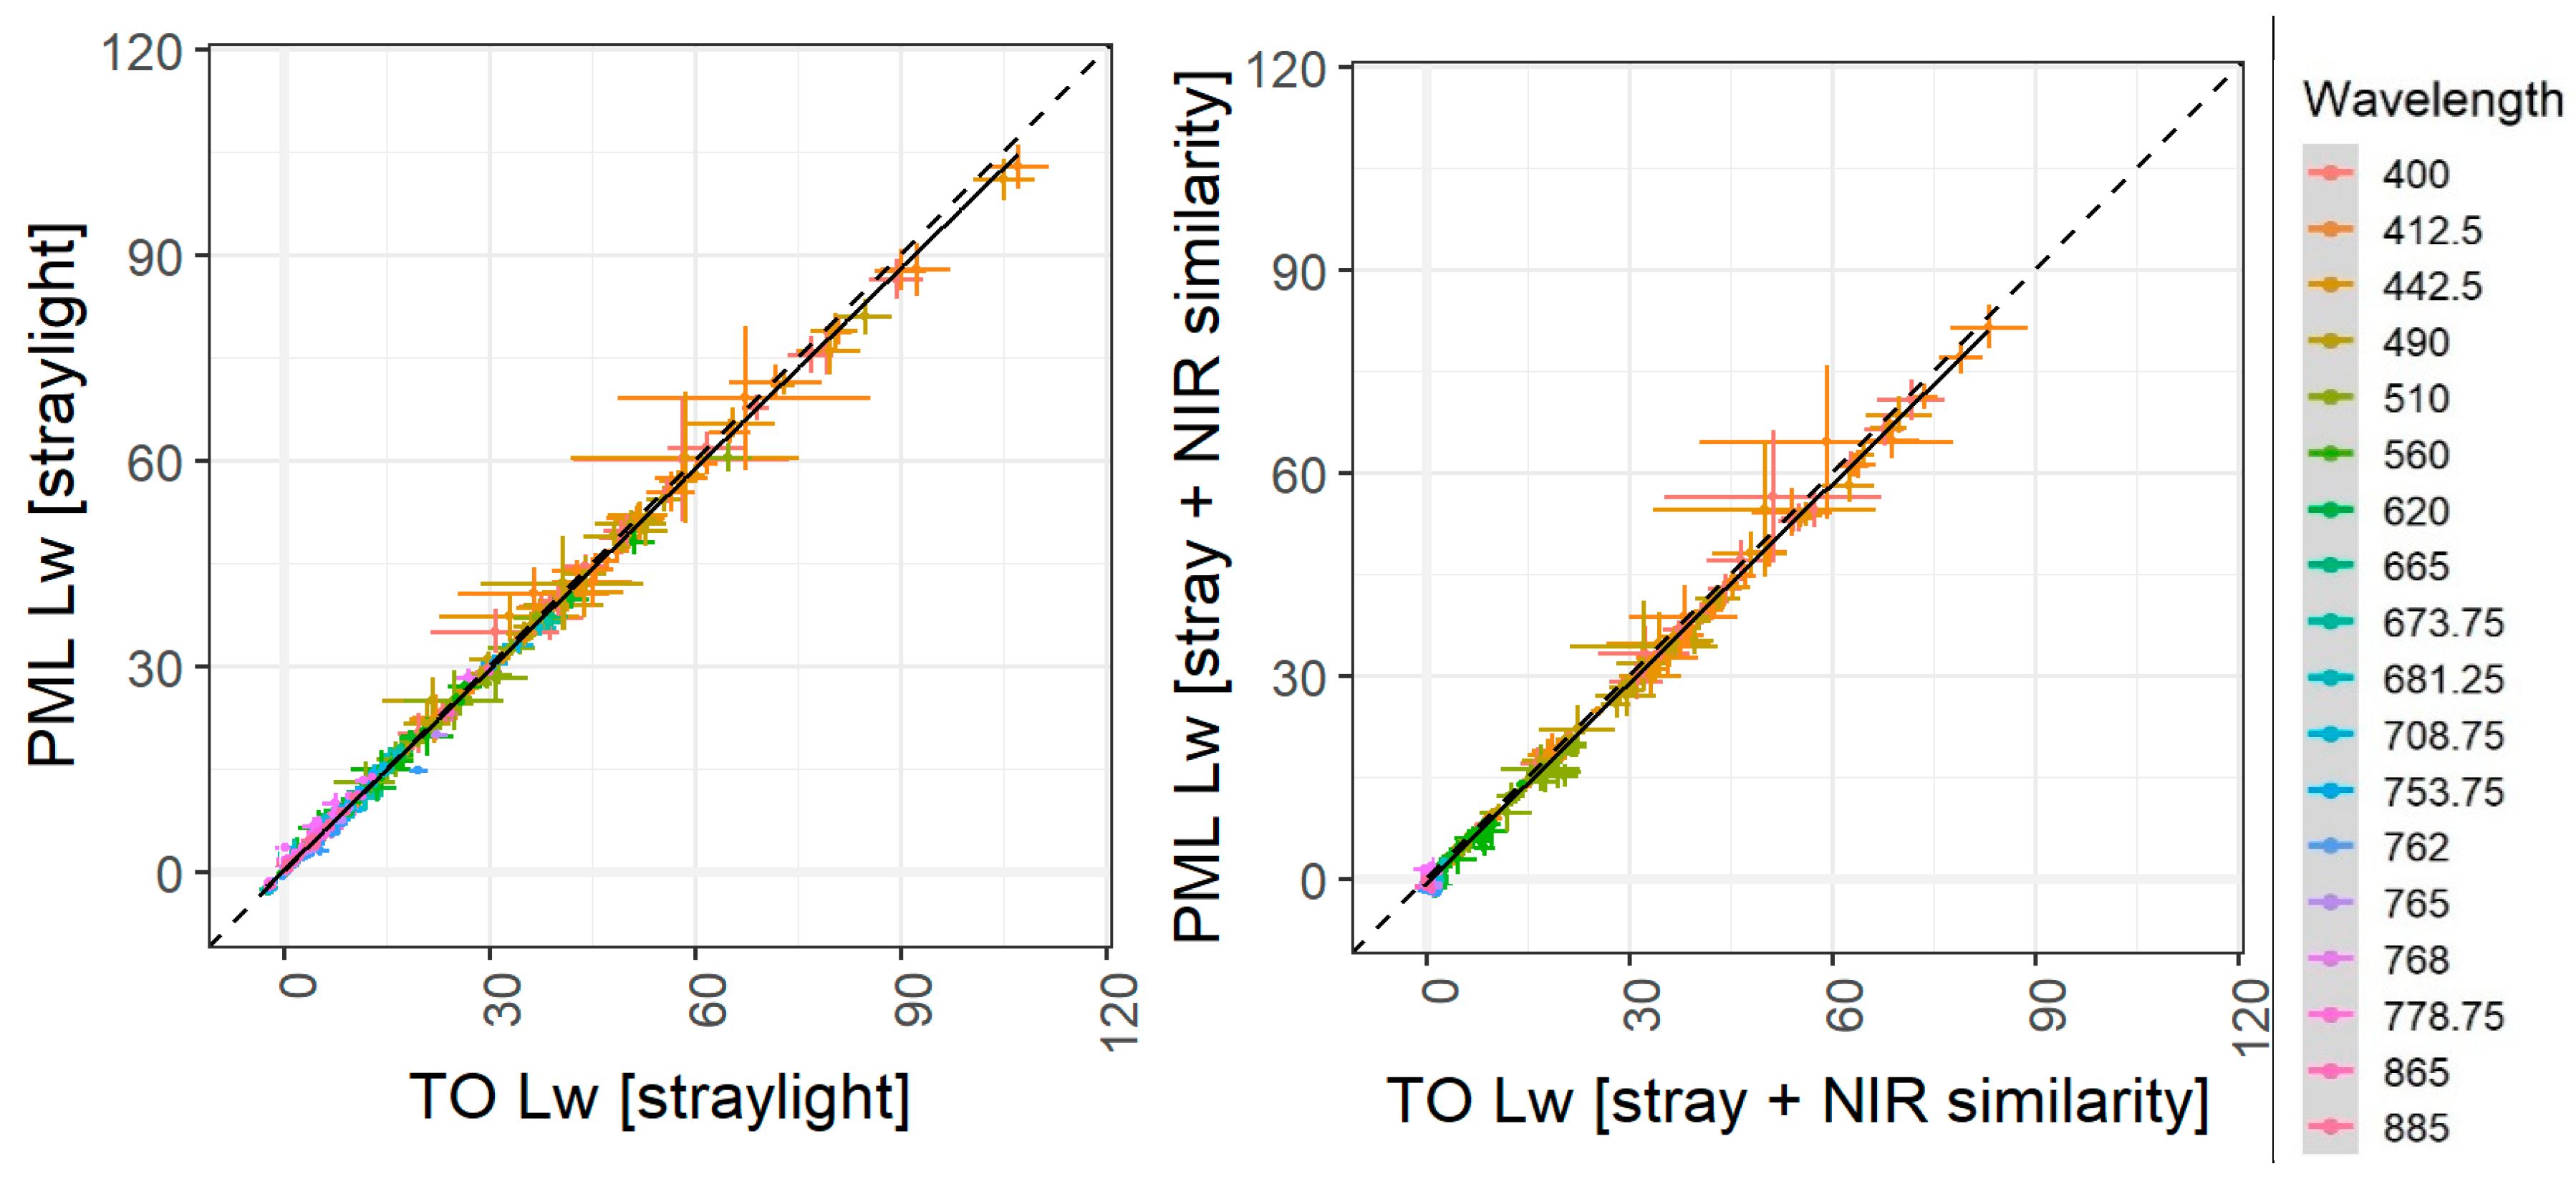
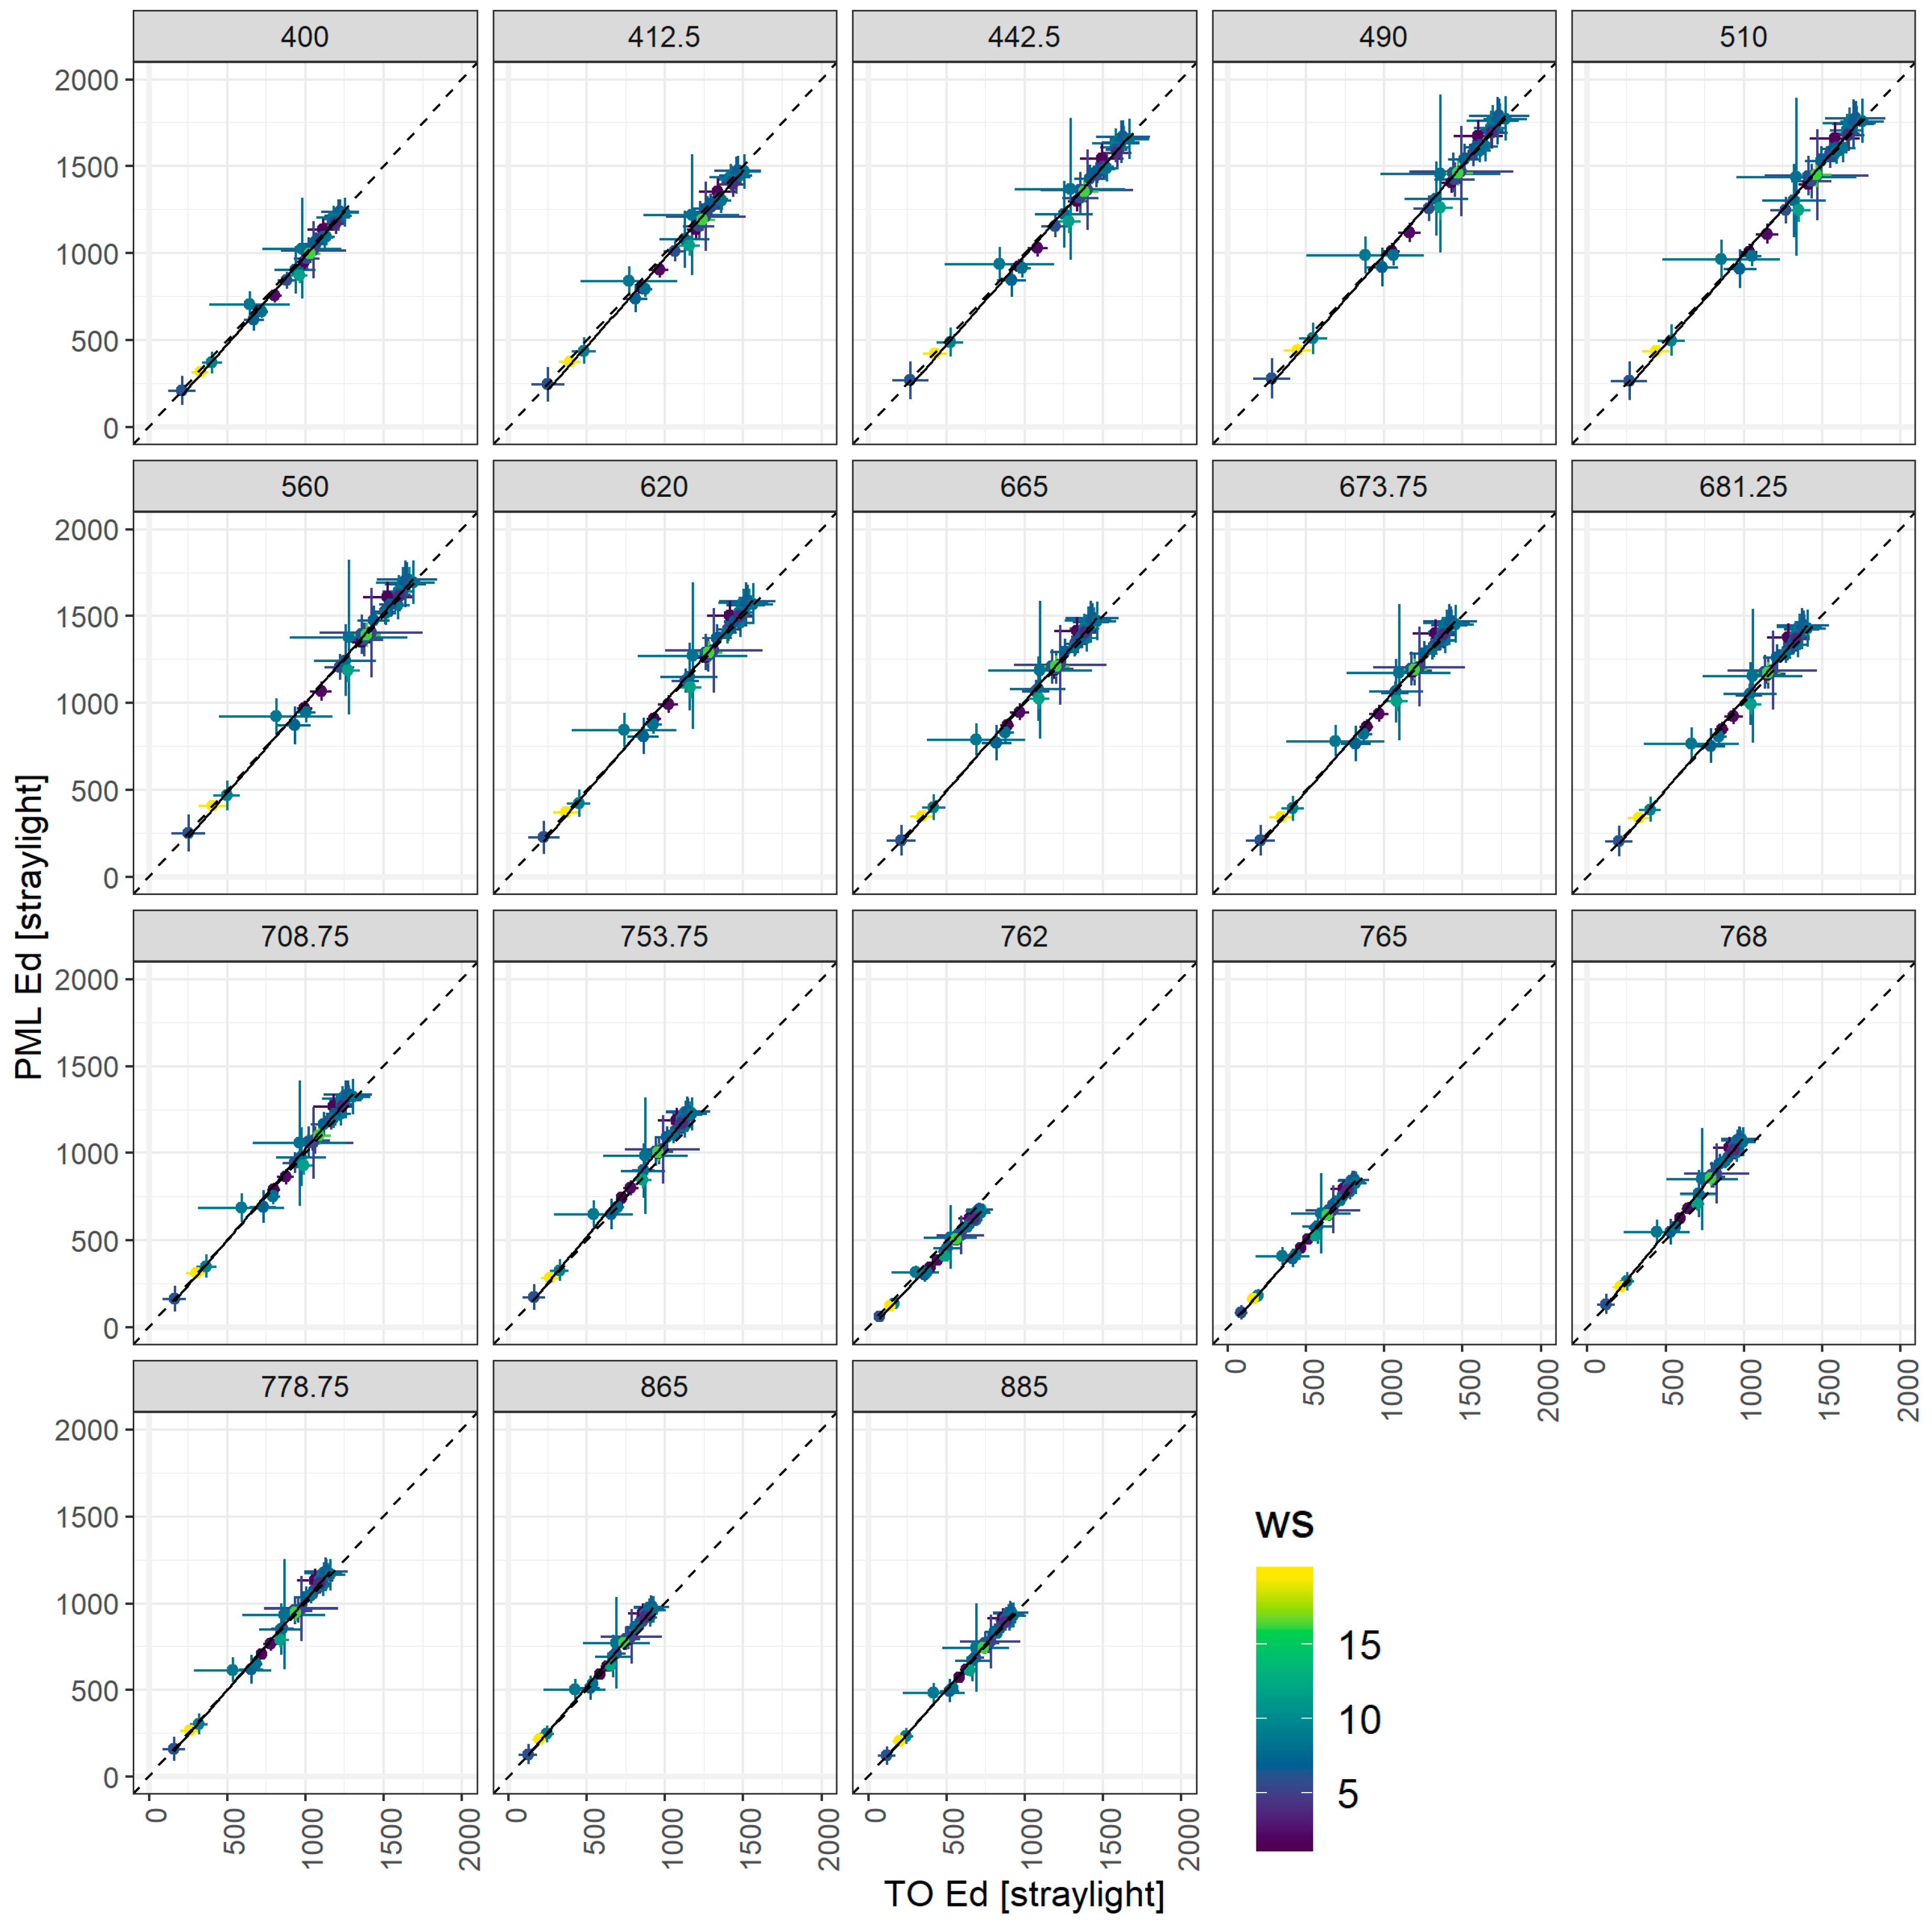
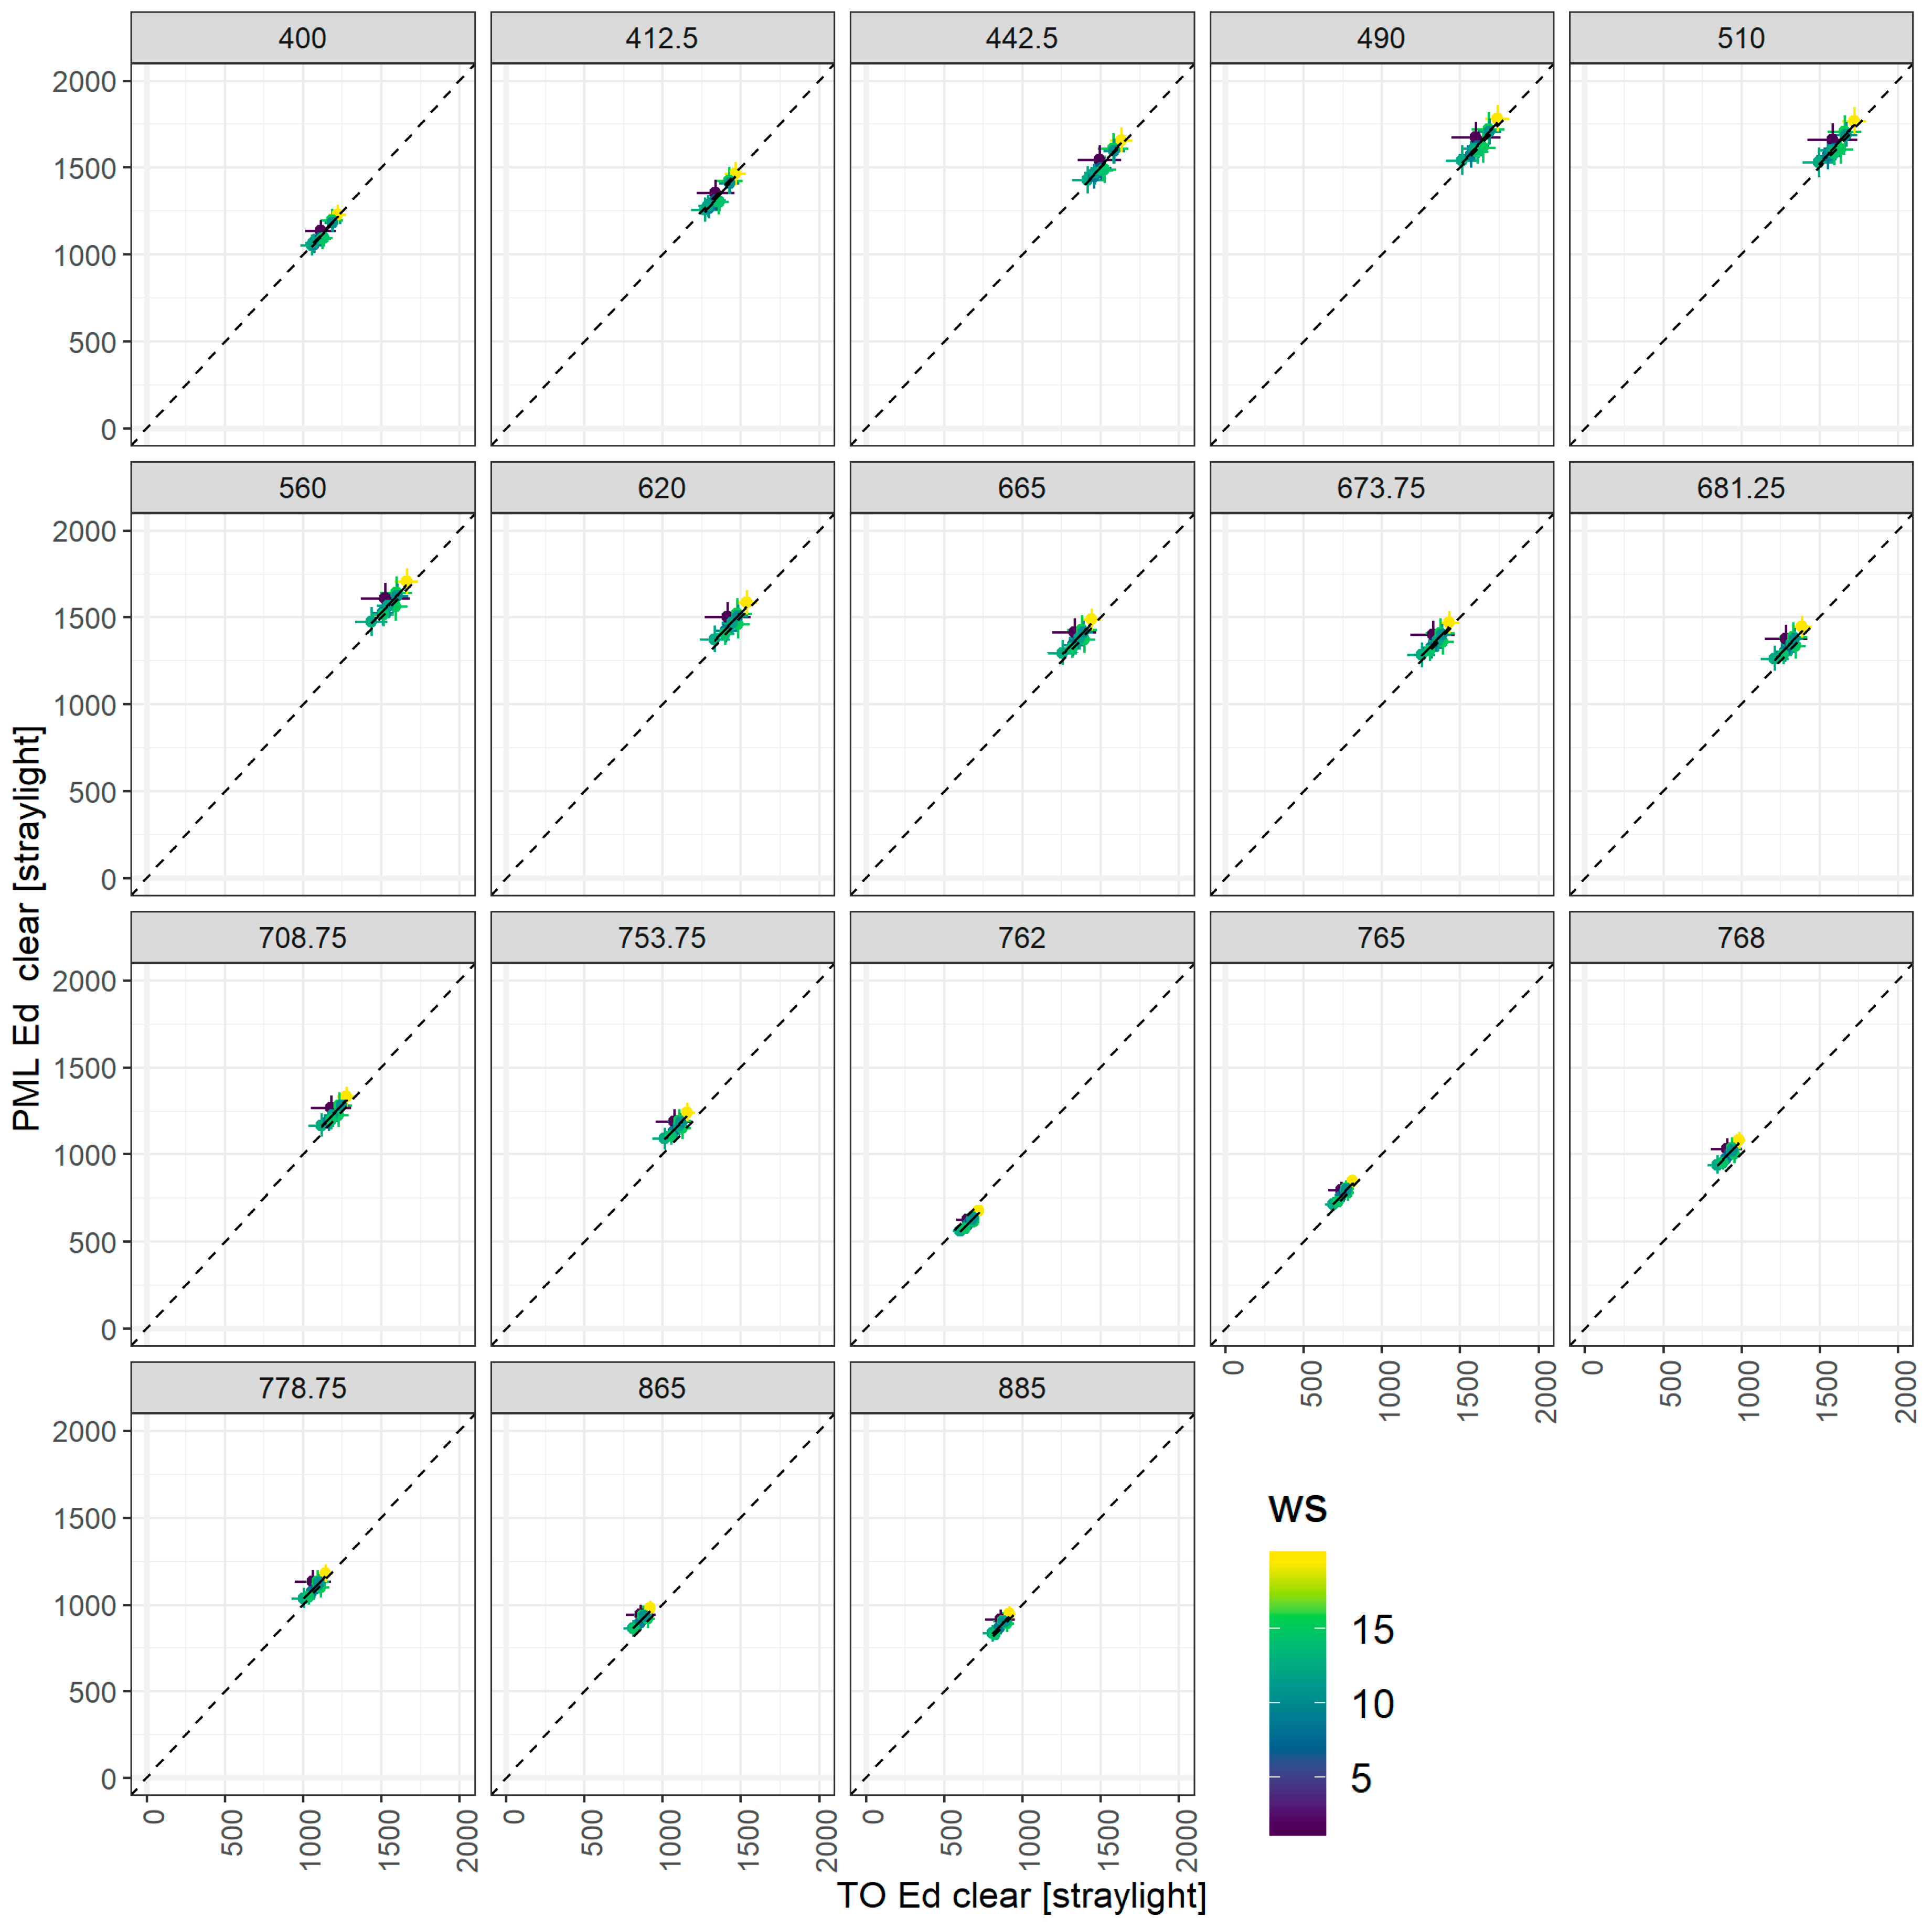
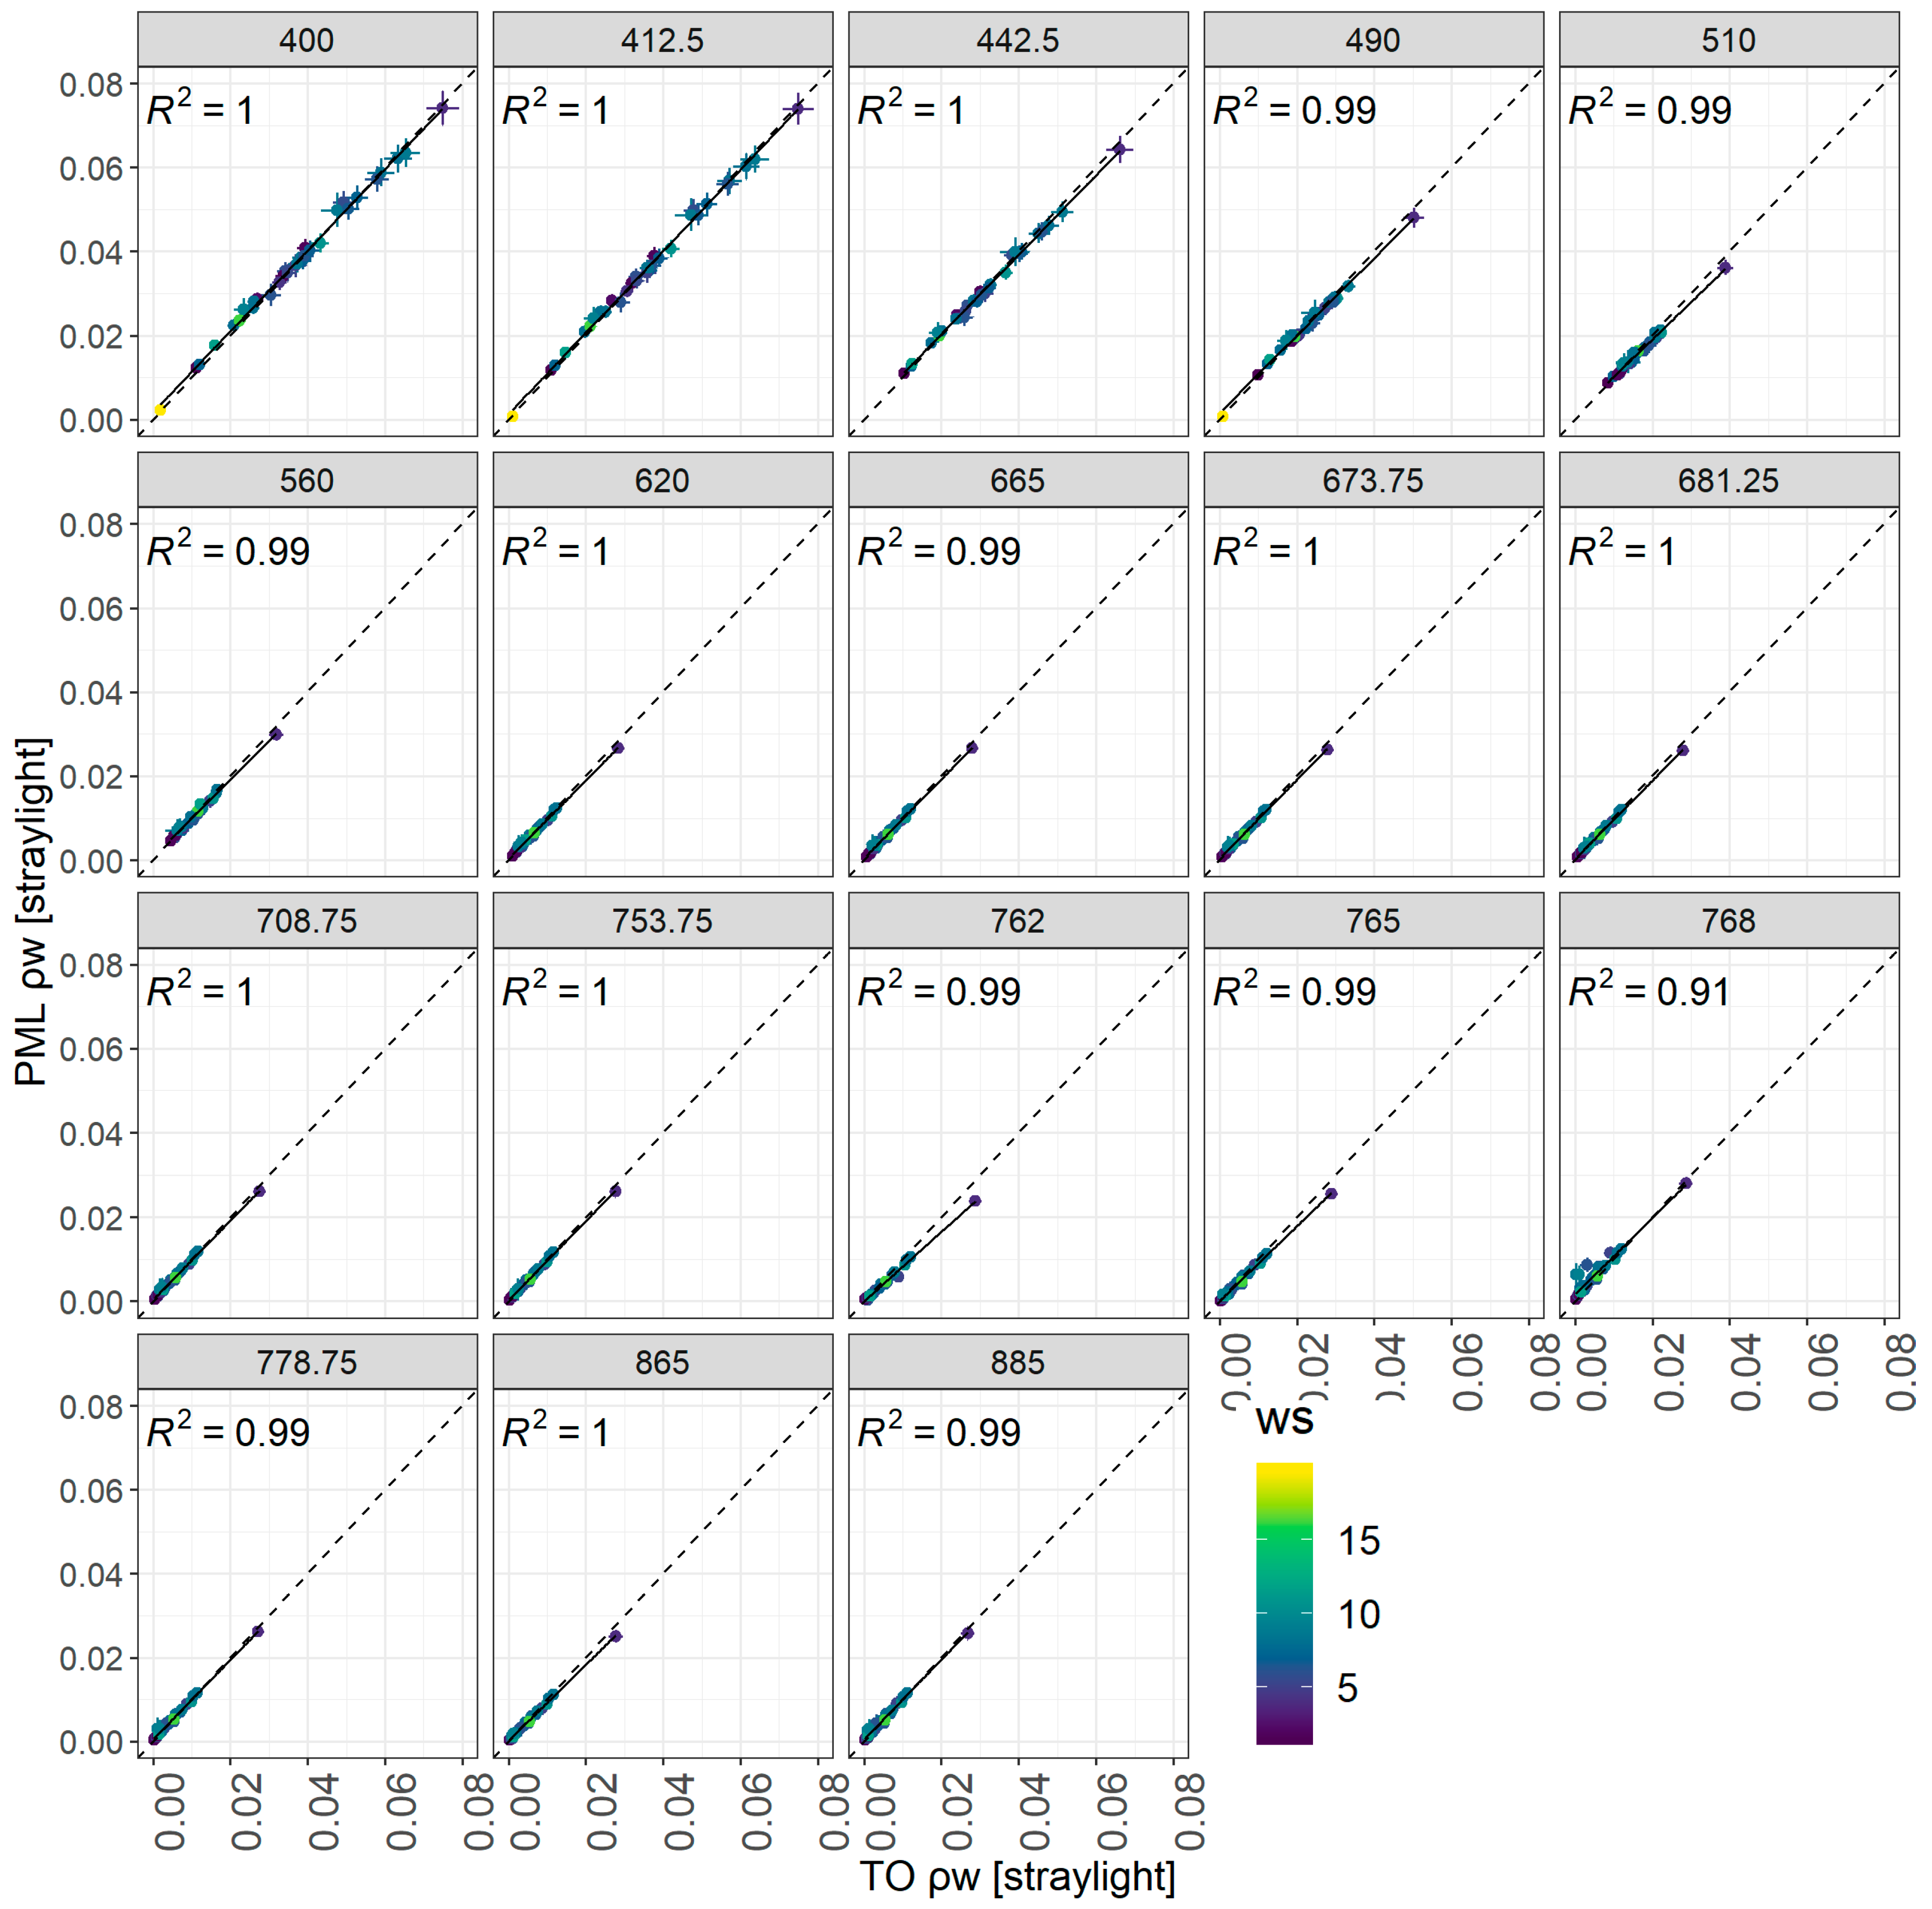
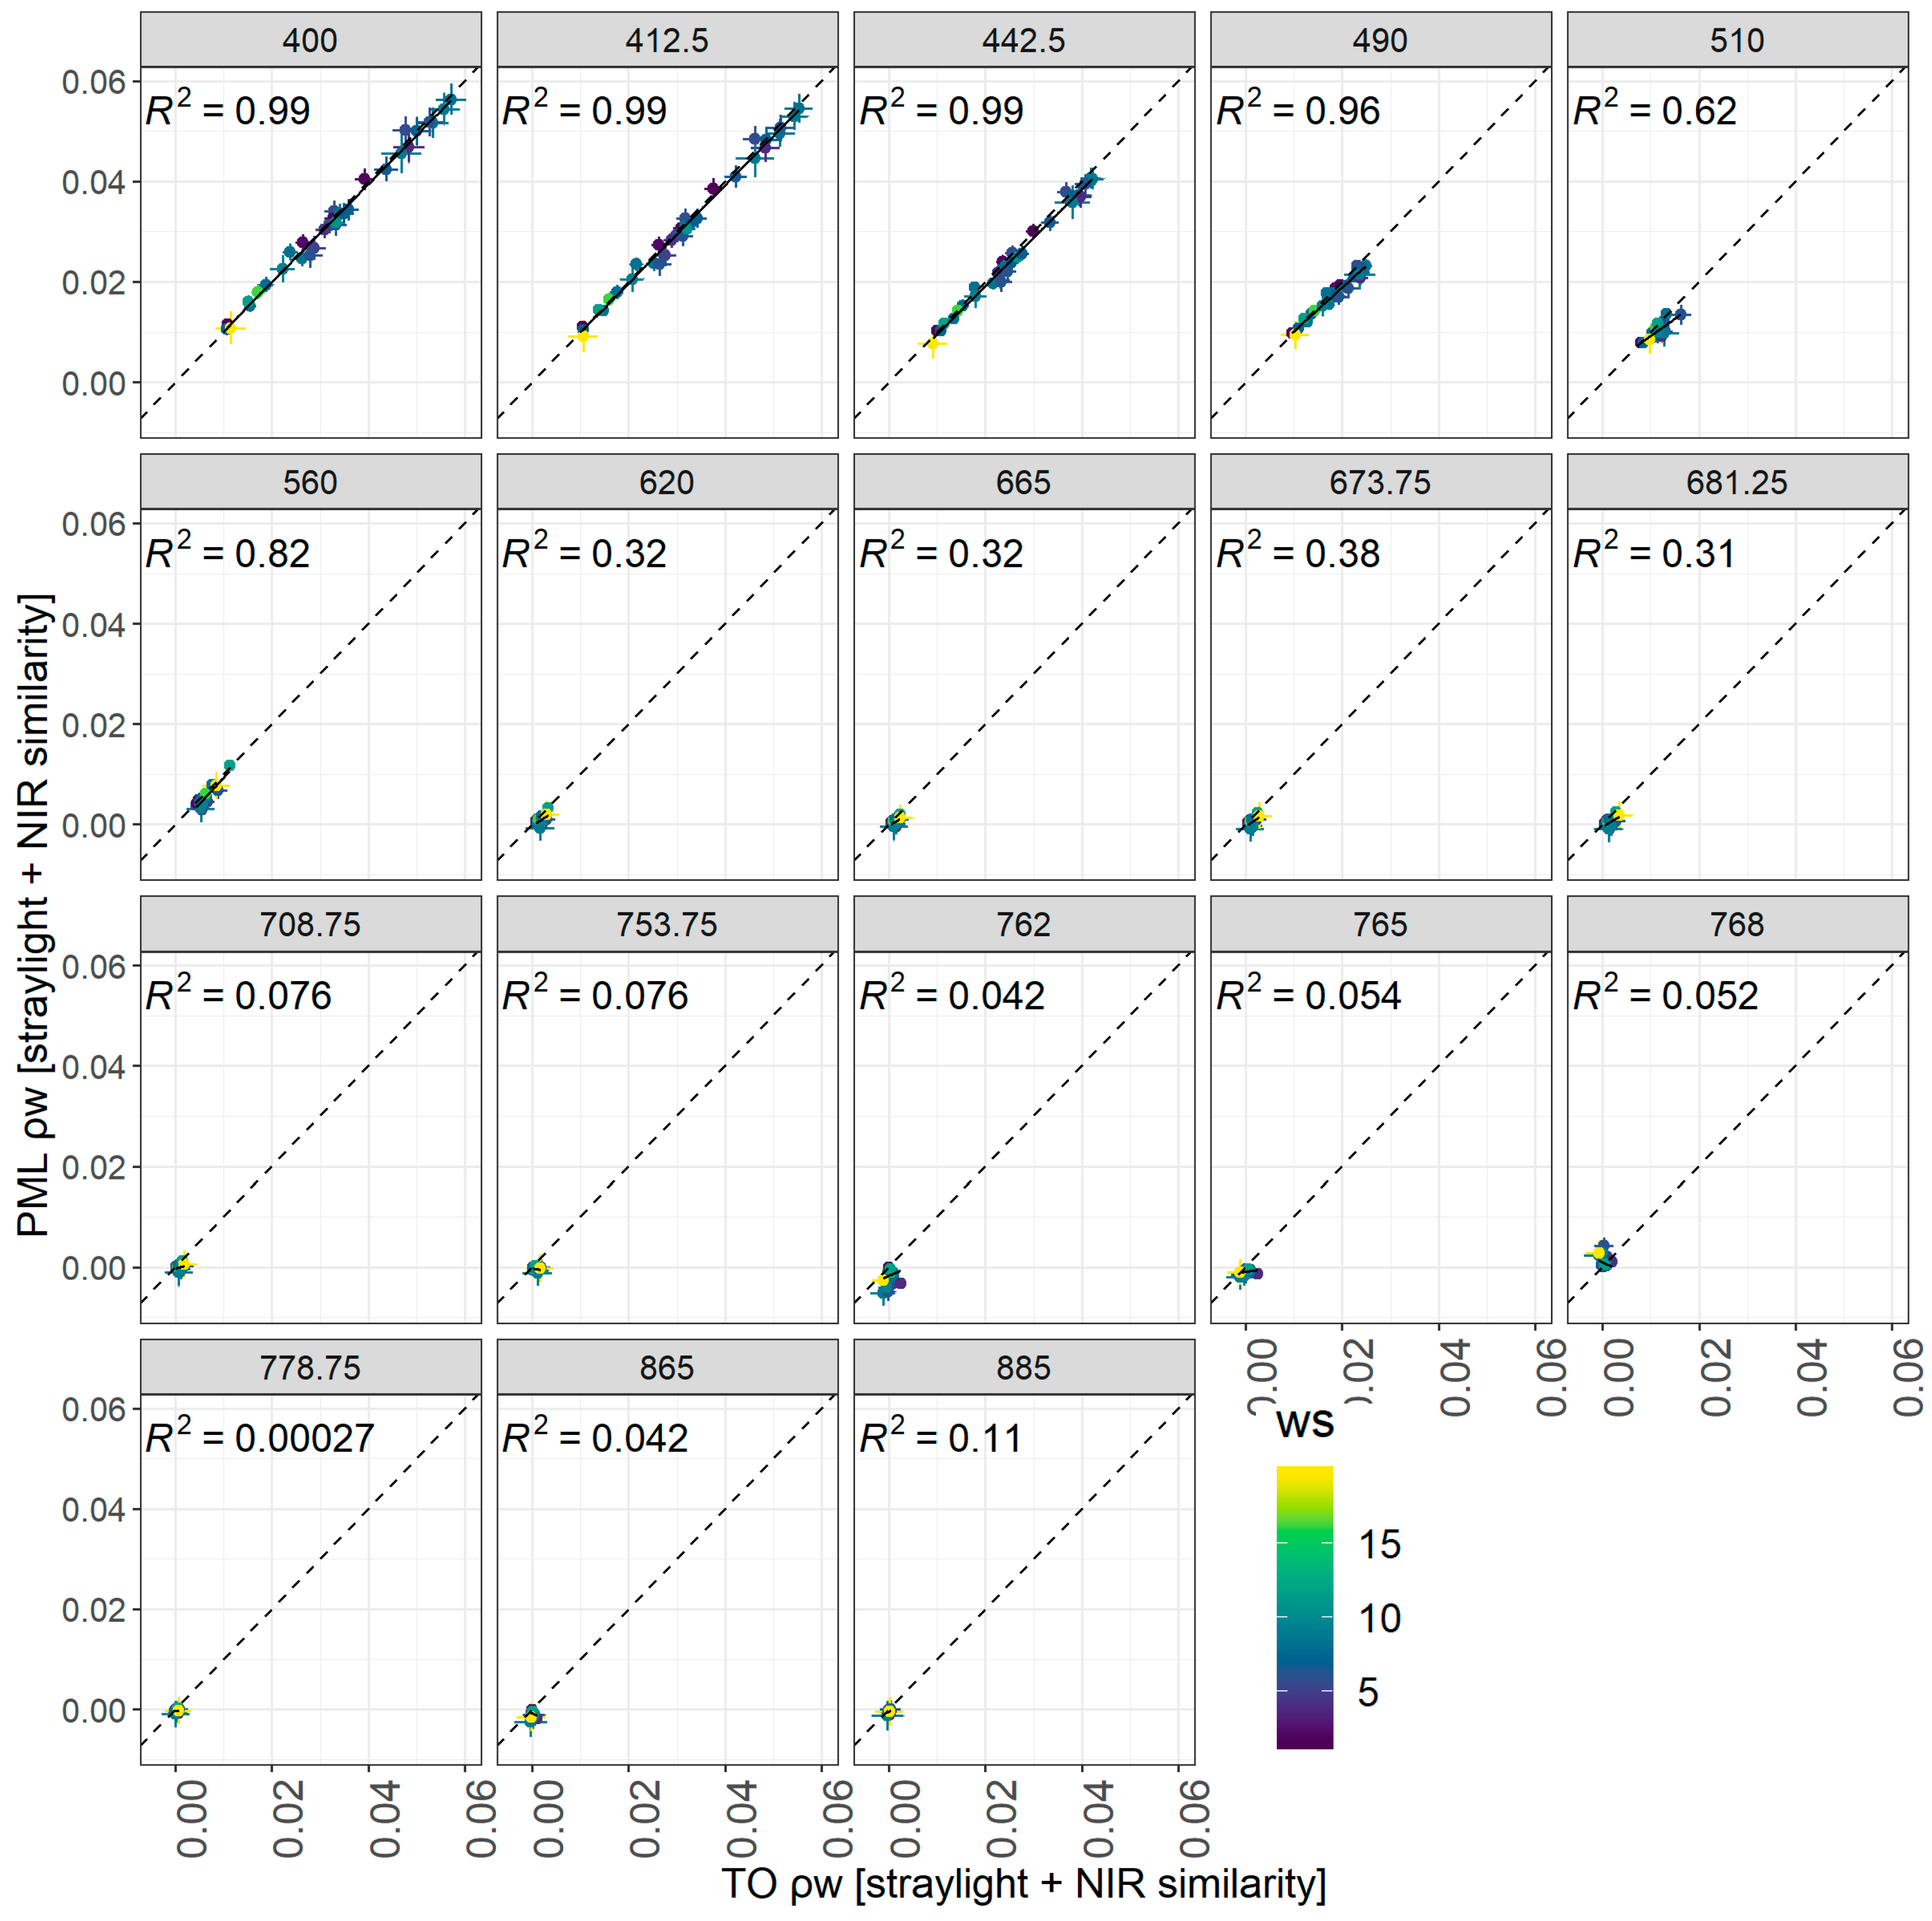
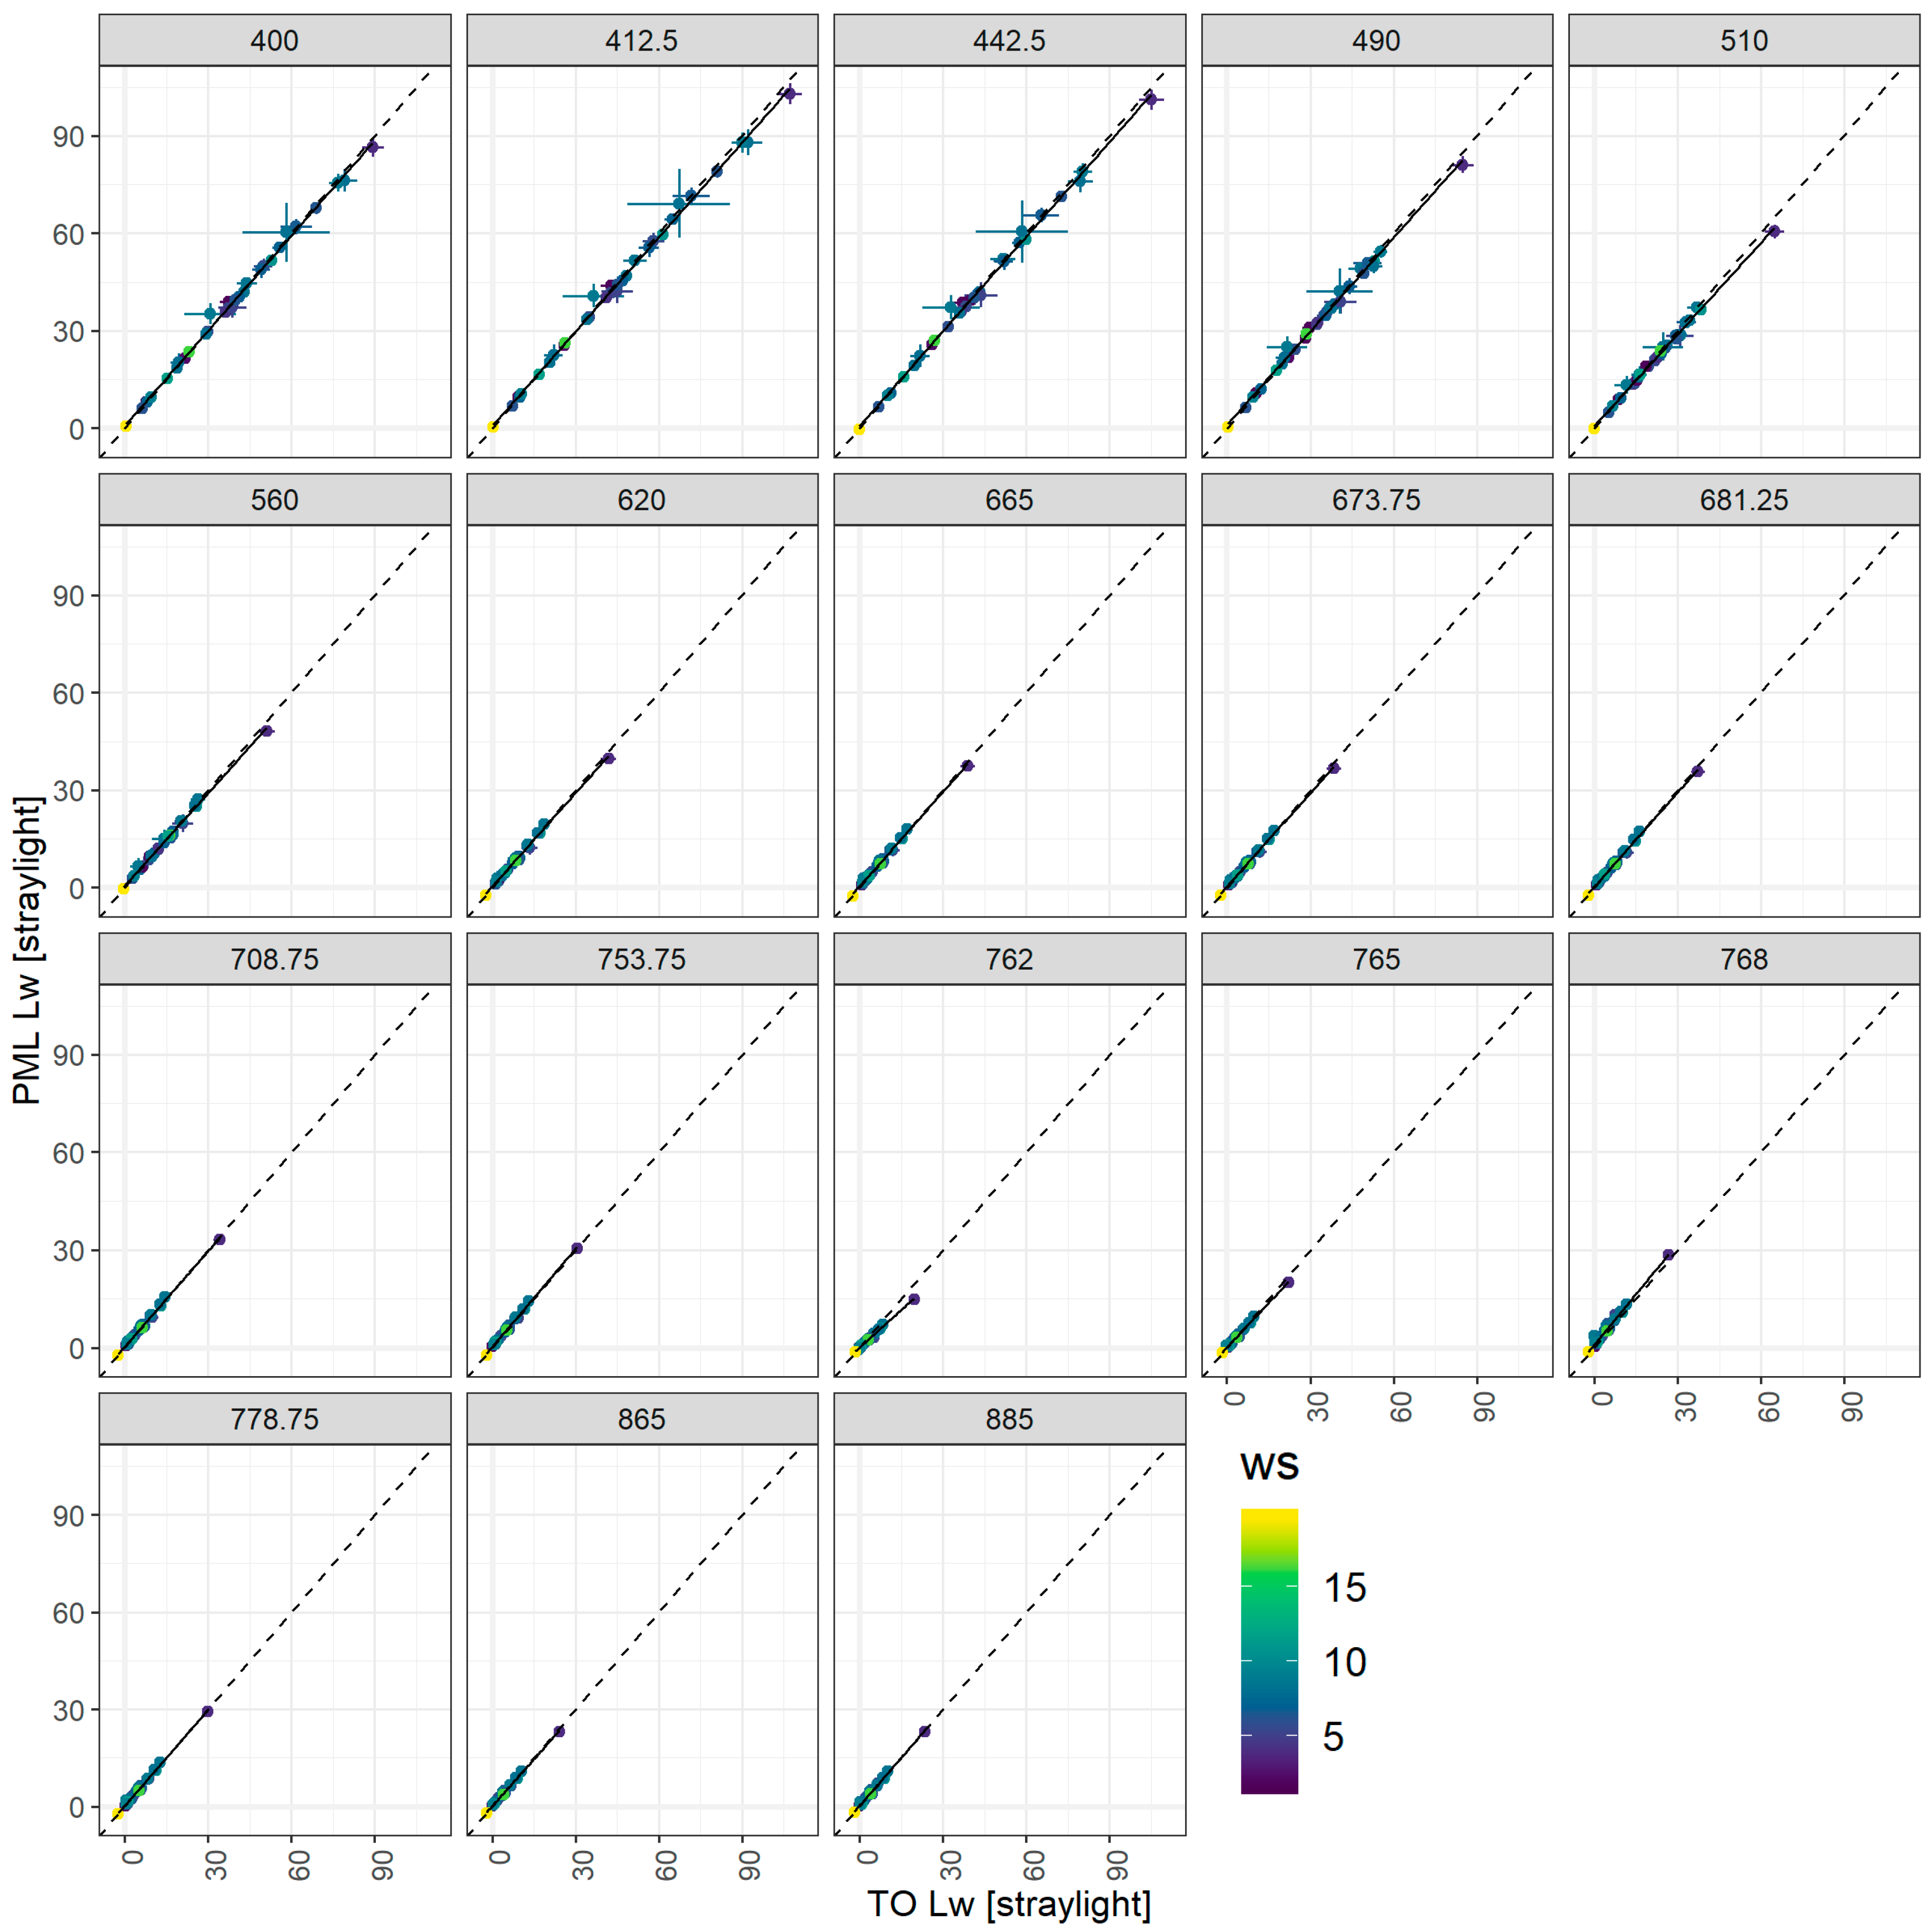
3.2. Comparison Between the In Situ Radiometric Systems

A comparison between the PML and TO radiometric systems is shown in Figure 6. Results are given as ratios (PML/TO) for ρ w ( λ ) , L w ( λ ) , and E d ( λ ) , with and without the NIR similarity correction (not applicable in the case of E d ). The outliers for ρ w ( λ ) , L w ( λ ) ratios, without any correction (left panel on Figure 6) and with straylight correction (middle panel in Figure 6), originated from station 67. After NIR similarity correction, the consistency between TO and PML radiometric data was poorer, although there were no distinct outliers (Figure 6).
The straylight correction was applied to all data. An example of the straylight and NIR similarity correction effects on ρ w is shown in Figure 7.
The NIR correction could substantially decrease the ρ w values (Figure 7), but also retained the spectral shape (Figure A1).
In order to compare E d measured by the RAMSES and HyperOCR instruments, only clear sky conditions were used (Figure 8, Figure A2). First, individual spectra were screened for the irradiance threshold of 1200 mW/m2 at 560 nm. The resulting dataset was further reduced by rejecting all stations with an expanded uncertainty of E d more than 5%. As a result, 10 stations were included in the comparison of E d (Figure 8) from the whole dataset (Figure A3). The average E d ratio between PML and TO over all 32 stations, together with the expanded uncertainty, is shown in Figure 9. The median of En numbers of individual station ratios is shown in Figure 10 as well.
The agreement between different radiometric systems is shown in Figure 10. The yellow line is the mean ratio (PML/TO) for ρ w ( λ ) together with uncertainty bars, and the purple line is the respective median of En number.
Comparison of ρ w ( λ ) values measured by PML and TO, after correcting for straylight only or after applying both straylight and NIR similarity correction, is shown in Figure 11. For straylight correction only (Figure A4), the agreement between PML and TO was good overall wavelengths, whereas for straylight and NIR similarity correction (Figure A5), the agreement became weaker from 510 nm wavelength.
Agreement between L w values as measured by PML and TO, after correcting for straylight only or after applying straylight and NIR similarity corrections, is shown in Figure 12 and Figure A6.

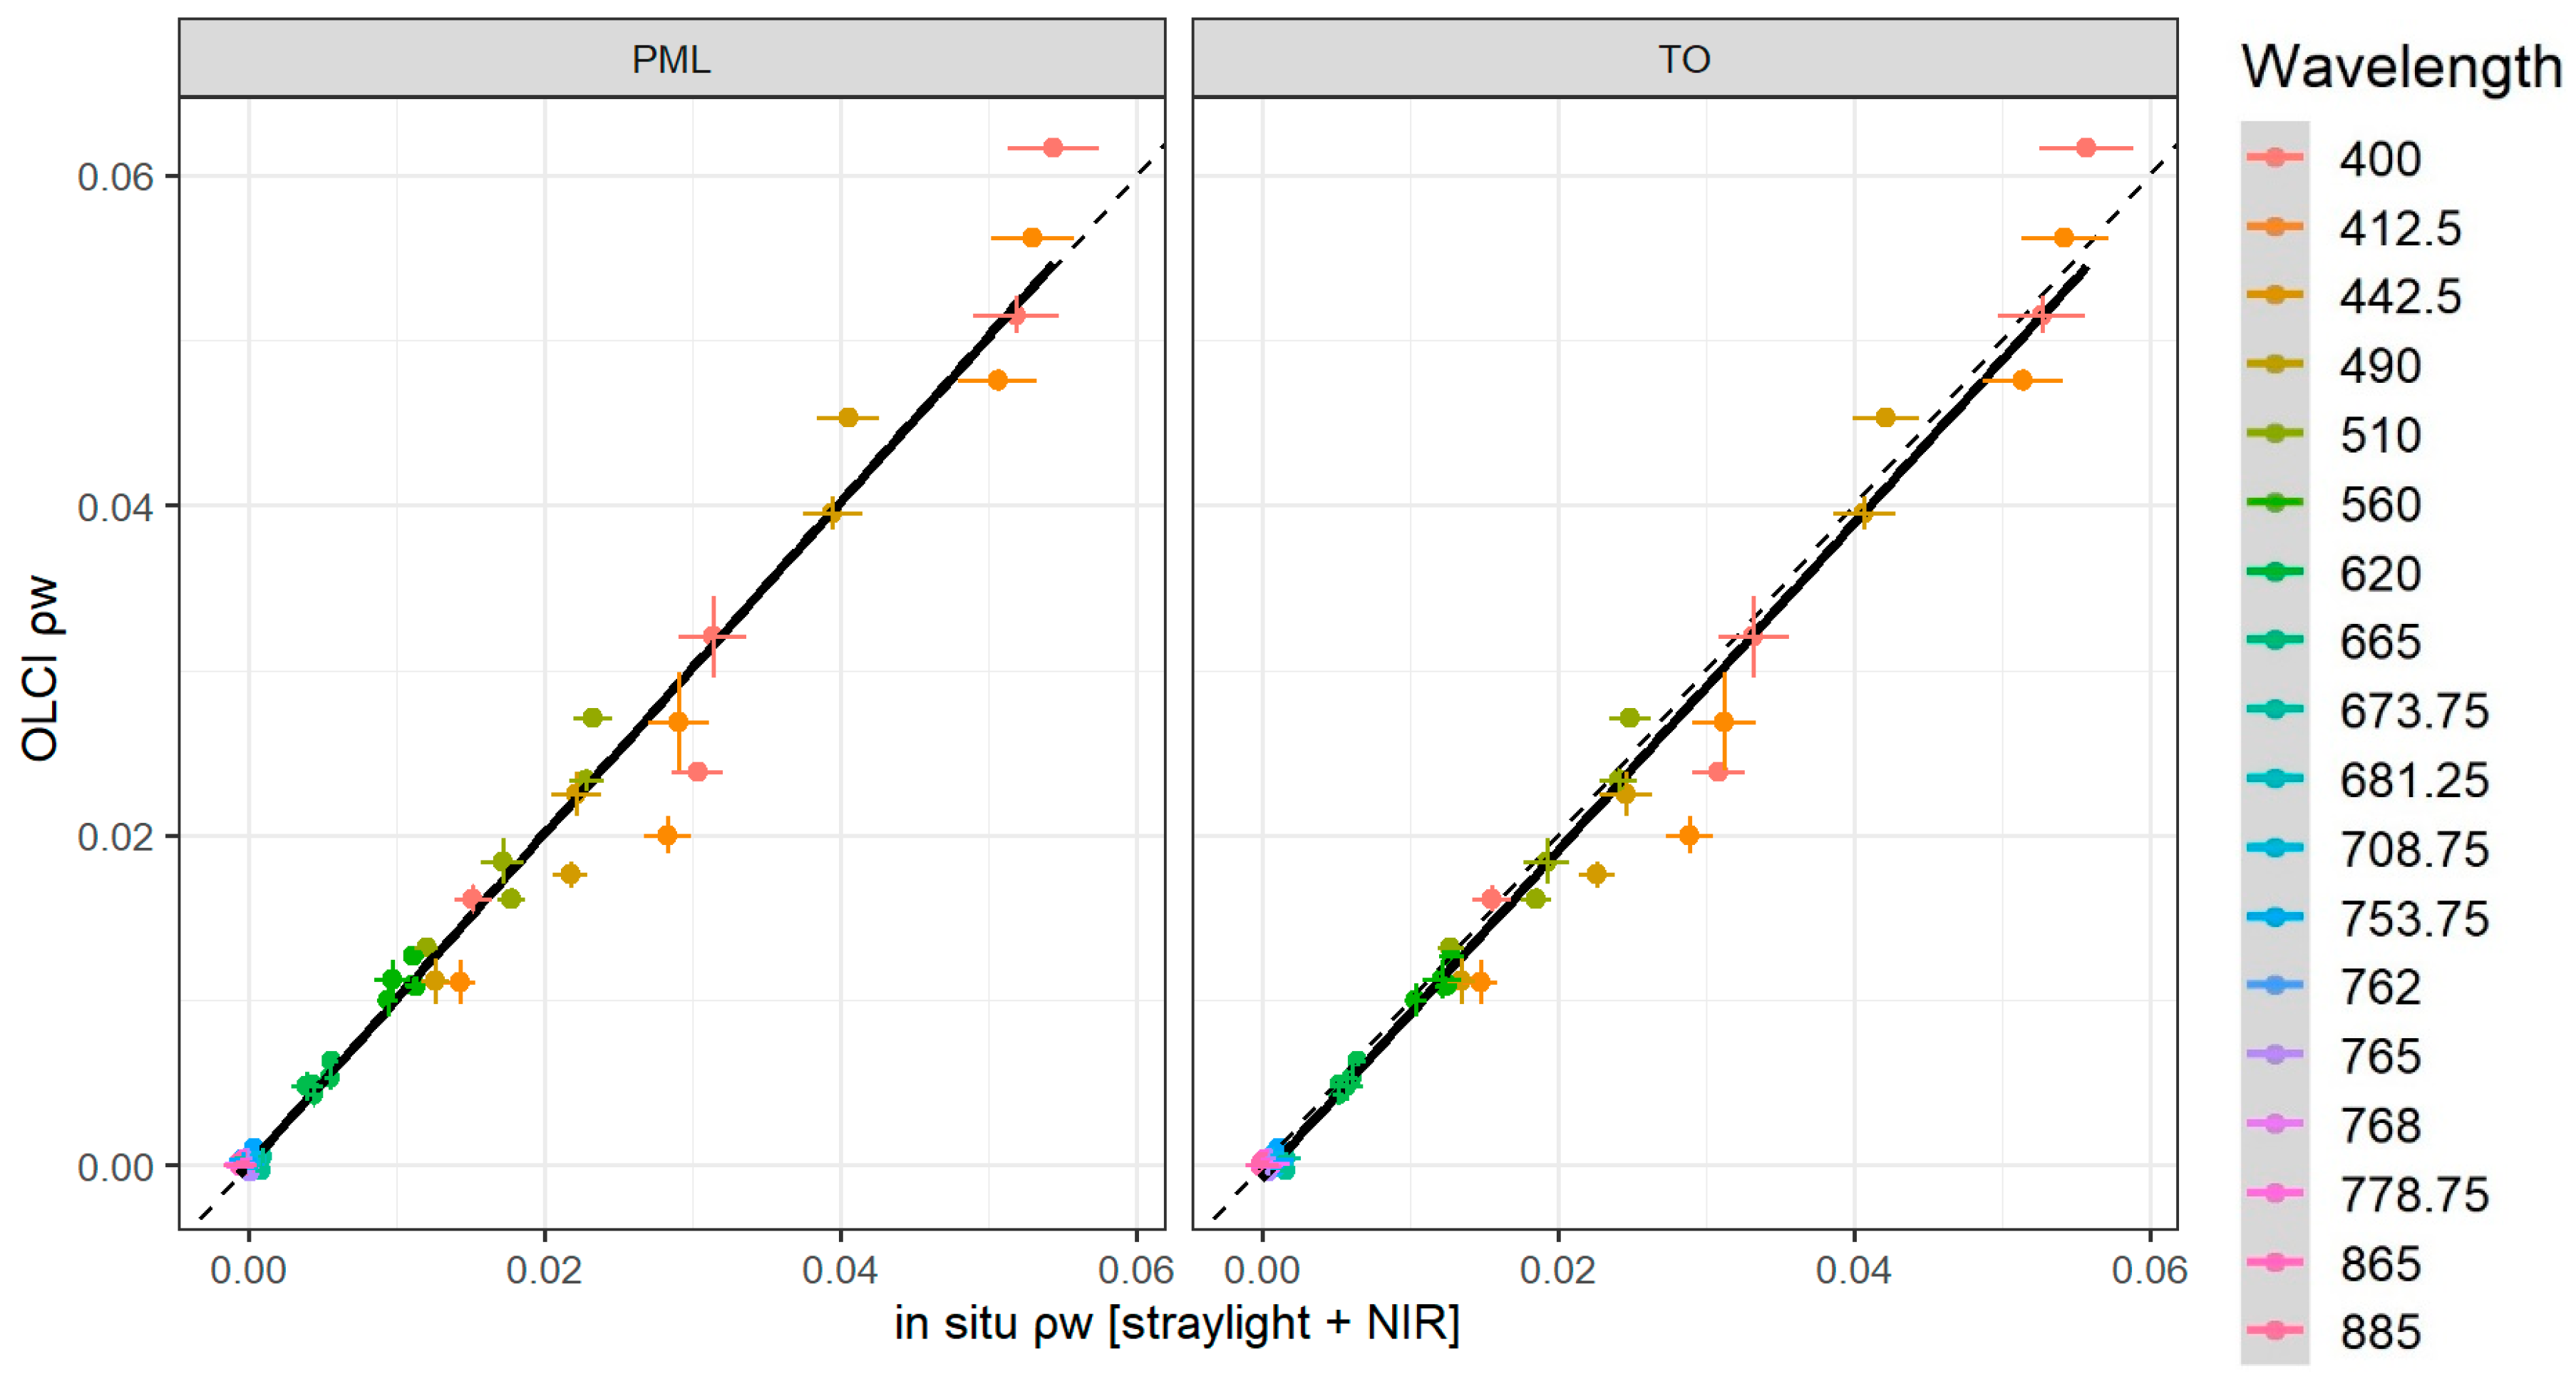
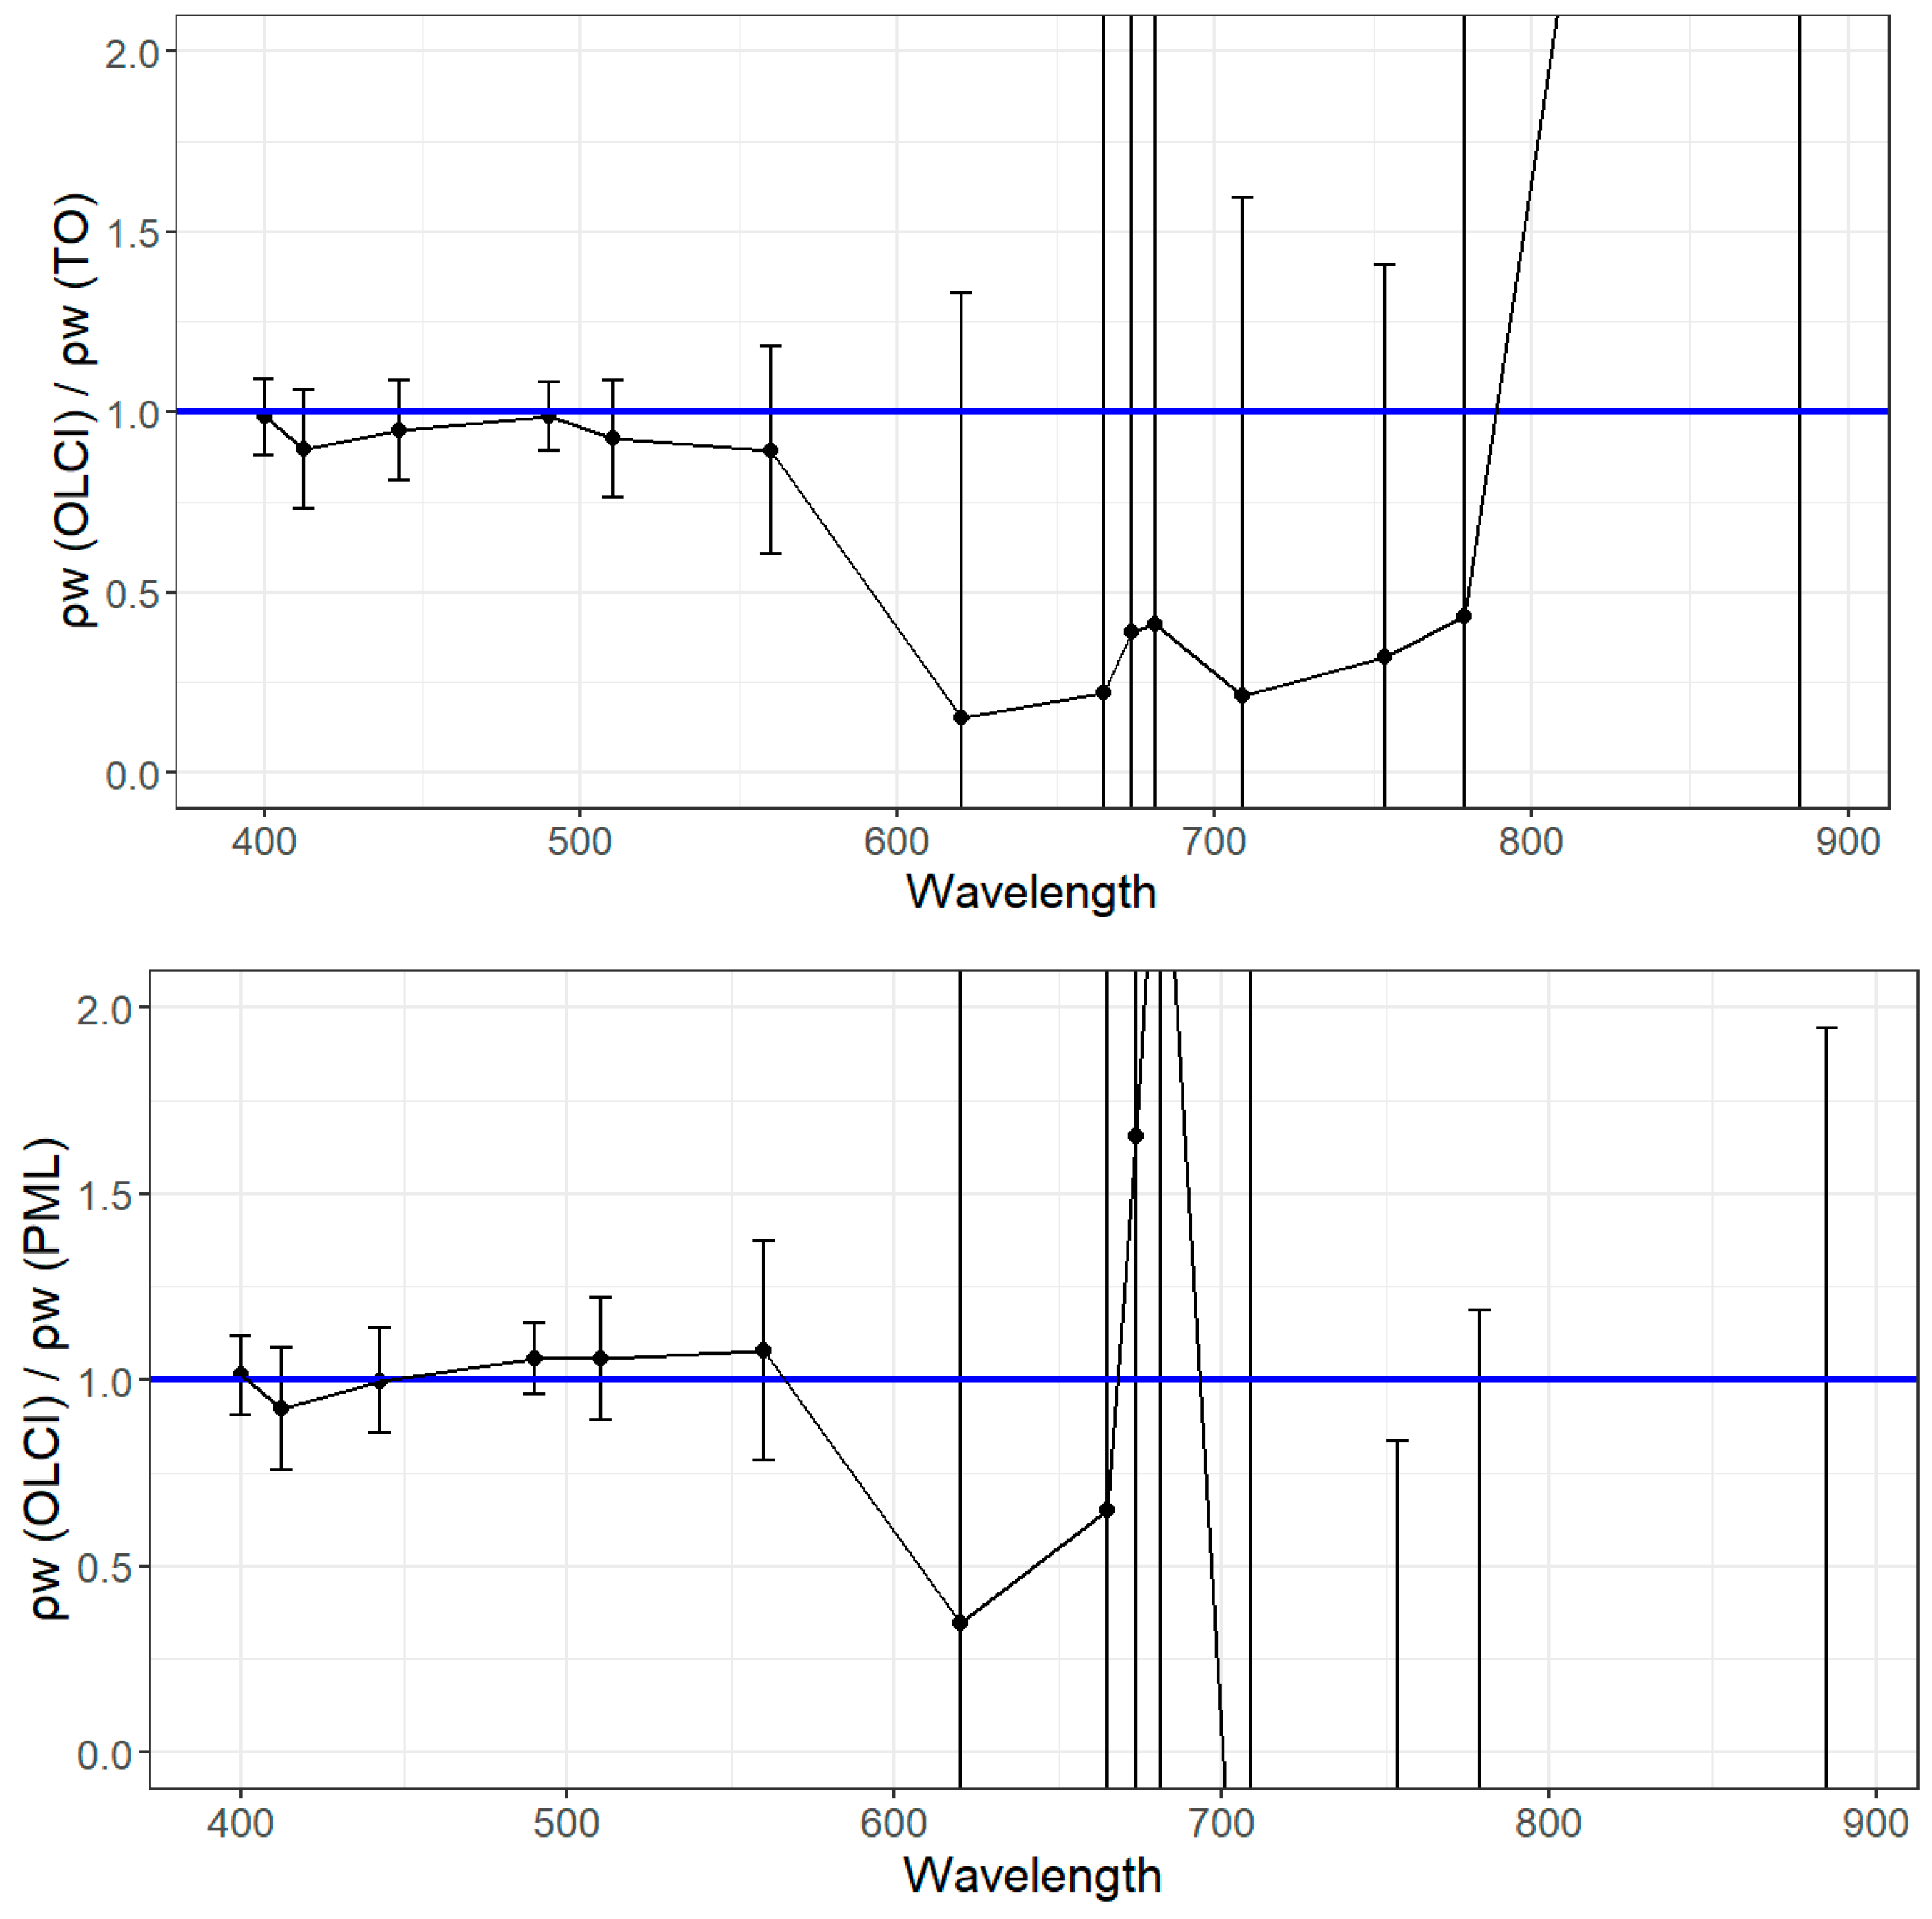
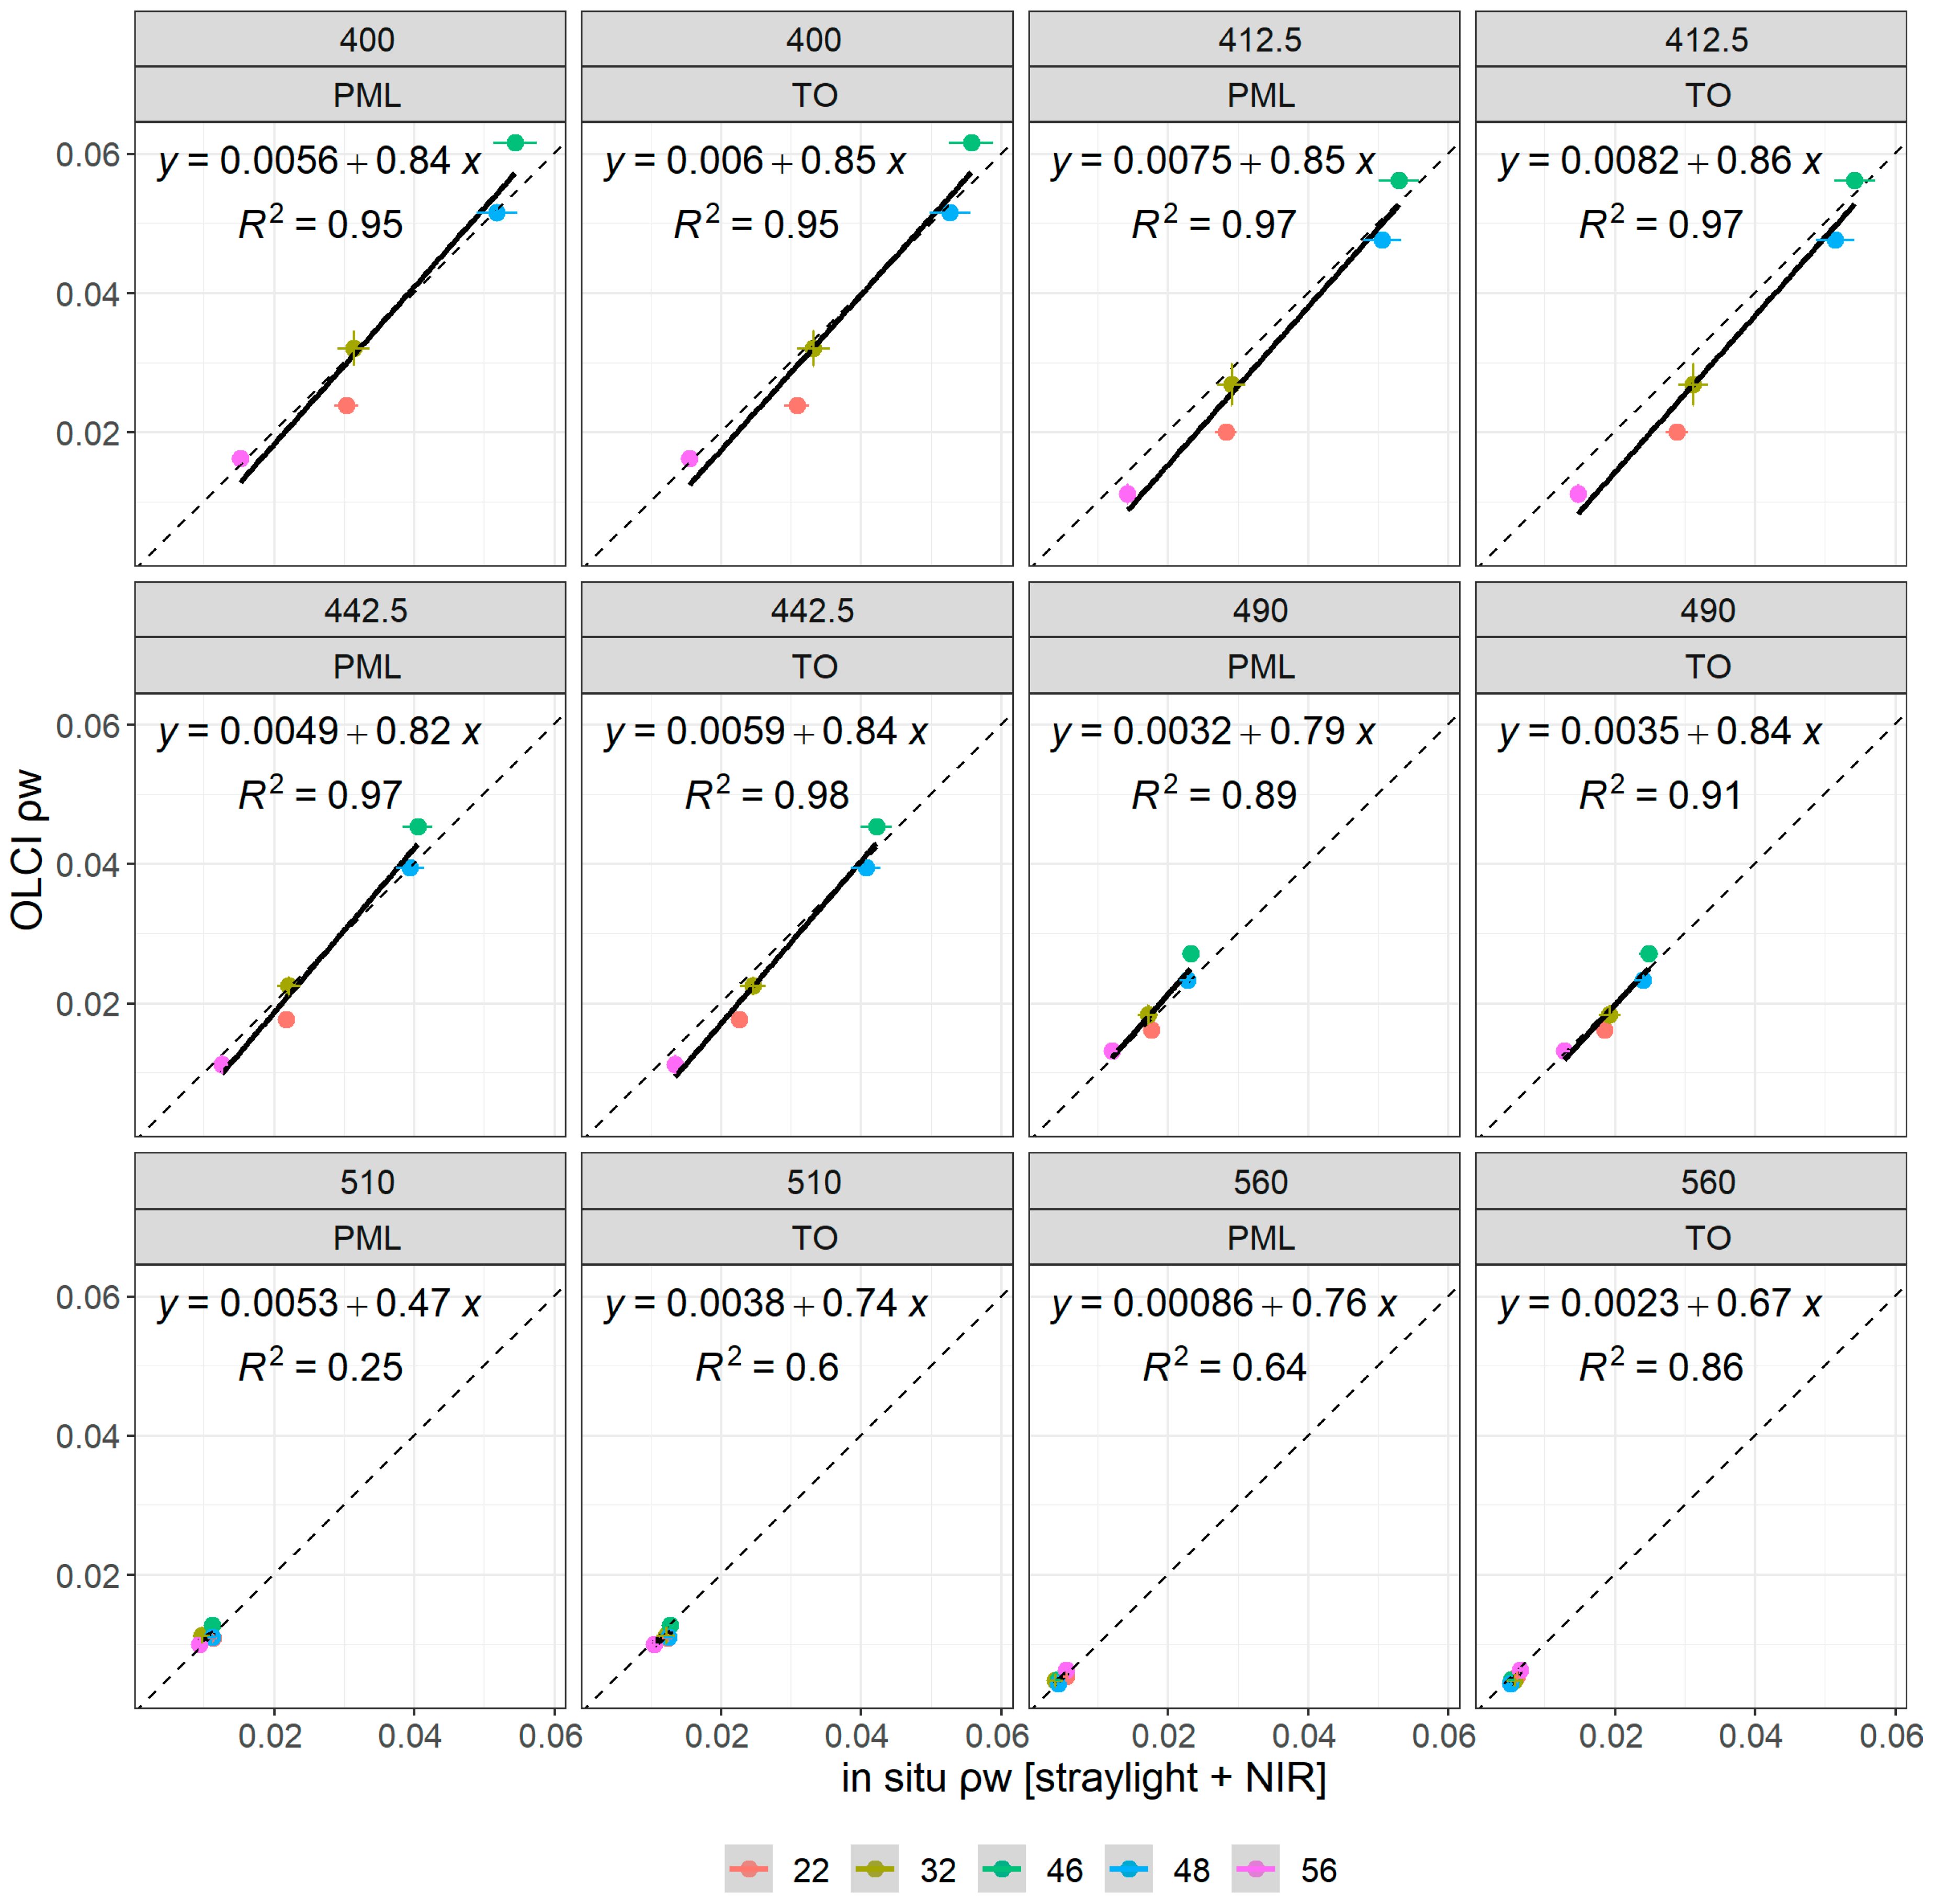
3.3. Consistency between In Situ and OLCI Radiometric Data

After applying the filtering criteria on OLCI’s data as described in Section 2.3, five match-ups were obtained. Comparison of in situ and OLCI-derived reflectances for all five match-ups is shown in Figure 13 in the case of different corrections of the in situ results. The corresponding scatterplots are shown in Figure 14 over all wavelengths and in Figure A7 for the wavelengths up to 560 nm separately. The statistics describing the agreement between in situ and satellite measurements are concluded in Table 3. The OLCI to in situ ratios of ρ w together with uncertainty limits are shown in Figure 15.

4. Discussion

4.1. Data Filtering Procedure

The aim of the paper was to compare the performance of the two different radiometric systems over different environmental conditions and water types. The variable environmental conditions (e.g., −53.65 < latitude (°) < 48.93; −38.05 < longitude (°) < −7.62; 5.84 < sun zenith angle (°) < 60.54; 1.48 < wind speed (m·s−1) < 19.71; 0.9 < temperature (°C) < 28.3) allowed the comparison of radiometric data slightly outside of the strict rules applied to produce validation datasets for satellites. This is important in order to show the reliability of the in situ measurements. It is likely that the recommended optimal conditions in satellite validation protocols are associated with the measurement limits of the radiometers. These do not always correspond to the expectations of the users nor the realistic measurement conditions. Therefore, to study the behavior of existing radiometers close to (or even beyond) the specification limits is important, in order to plan the next-generation systems.
Outliers in the datasets are typically caused by: (1) instrumental errors; (2) unsuitable measurement conditions or natural variations outside the acceptable limits; (3) methodical errors in sampling and statistical treatment of results [11]. In our dataset, two potential outlier stations were present (Figure 4, Figure 6, Figure 7). Because two different measurement systems resulted in nearly identical results over these stations, the instrumental and sampling errors could be excluded. Measurement conditions fell into the recommended limits in terms of SZA. Measurement procedures, including most aspects of sampling, were the same for both systems in all stations. Therefore, there was no clear reason for removing these stations from the dataset, and, instead, the behavior of data was analyzed during the processing. Nevertheless, in order to avoid biased conclusions, we acknowledge the need to study the potential outliers and remove them if justified. The uncertainty also needs to be considered as a criteria for removal of the outliers and further research and analysis is required on this. Moreover, during the previous phases of the FRM4SOC project, the investigation of the outliers (not caused by the instrumental errors) helped to reveal errors in the recommended measurement and processing procedure and in the instrument characterization [9,11]. This would not be possible when the outliers have been removed from the datasets without identifying the causes for them. As a result, no data were screened out from the AMT27 dataset, except in the case of clear-sky Ed comparison (Figure 8). However, the in situ ρ w data of the five match-ups used for S-3 OLCI validation agreed well with the main group of stations and had mean uncertainty (6…7)% for (400…510) nm, which increased towards longer wavelengths (Table 3).

4.2. Comparison of Radiometric Measurement Systems on a Moving Vessel

The intercomparison of simultaneous radiometric measurements on the AMT27 field campaign allowed us to assess the consistency of data and investigate the uncertainties on a moving vessel. An intercomparison exercise of optical systems at the stable, AAOT during near-ideal conditions showed spectrally averaged values of relative differences comprised between −1% and +6% and spectrally averaged values of absolute differences around 6% for the above-water systems and 9% for buoy-based systems [30]. As expected for a moving vessel, we found the differences to be slightly higher, depending both on the corrections and also on varying environmental conditions. Comparison of the in-water and above-water results of radiometric measurements [31] gave the best agreement at the 490 nm band, especially in Case 1 waters during cloud-free conditions, highlighting again that the agreement was better under ideal measurement conditions with minimal impact from the environmental parameters. Due to the responsivity of the radiometers and the influence of the environmental conditions on the radiance signal, the reflectance at wavelengths > 650 nm was weak and noisy, which is characteristic of these Case 1 oligotrophic waters [32]. The results above 650 nm were included to show the effects of straylight and NIR similarity corrections on the in situ radiometric data, especially in the context of comparisons with S-3A OLCI data. The signal at 760 nm was further affected by oxygen absorption, which was clearly sharper than the spectral resolution of the TRiOS and Seabird radiometers. The behavior of the corrected signal around this narrow spectral band showed an improvement using straylight correction and also revealed a possible shift in the wavelength scales of the radiometers (the wavelength scales of radiometers were not individually tested during this study). A large increase in the uncertainties above 650 nm was expected and did not limit the use of these radiometers for Case 2 waters, where reflectance in the red and NIR was substantially higher [11]. Nevertheless, even with the weak signal in Case 1 waters, the comparison showed agreement within the evaluated uncertainty limits.
Simulations from [26] showed that the NIR similarity spectrum correction applied in this study, was valid for waters and was ρ w (780) > 0.0001. All ρ w (780) values, including the type-A uncertainty, were above the threshold except one data point measured at very high wind speed (19.71 m·s−1, station id 67 from Table 1). The mean values, both for TO and PML systems were ρ w (780) > 0.004 before the NIR correction. Without the NIR similarity correction, the values for the ρw were too high due to sunglint. Therefore, the NIR correction was included in the standard data processing scheme, and its effect were evaluated. The results showed that for clear waters, with a very low radiometric signal and high noise in the NIR, the NIR similarity correction removed this and gave reasonable results. Although various corrections exist for Case 1 waters (e.g., [33,34]), due to the low signal/high noise in the NIR, it is difficult to choose a specific correction as the noise is higher than the signal strength, and these parameters are evaluated separately in the processing steps. This would require a reference value to eliminate the effect of wind and then to estimate the most accurate correction factor for each above-water measurement made. Historically, the scientific community has been encouraged to develop improved and universal correction methods for waters with very low signal in the NIR. To do this properly, however, it requires the development of a new instrument with improved signal-to-noise performance in the NIR spectral range and independent reference methods that are not dependent on the wind that causes air-water surface effects and artifacts.

4.3. Environmental Effects

The field data revealed variability in the responsivity between TRiOS and Seabird sensors calibrated at the same laboratory, which depended on the ambient and illumination conditions. The variability in responsivity of both sensors was likely to be much larger compared to the change of the signal ratio but was masked by the similar behavior of sensors. The differences in Figure 2 varied from approximately −5% to +5% over the temperature range from 1 °C to 30 °C, which was a substantially smaller change than expected temperature effect determined for other TriOS sensors [35]. A slight dependence on the straylight correction was also evident. The irradiance sensors showed the best agreement at 21 °C, which corresponded to the calibration temperature. Thus, the characterization of thermal effects in the full temperature range of field measurements would improve the traceability of results to SI considerably. In this study, due to the lack of characterization data, the temperature correction was not applied.
Differences in downwelling irradiance between PML and TO as a function of SZA showed that the variation was in agreement with known or expected errors of the cosine collectors of the sensors, which were within ±3% [11]. The ratio of L w -s showed no correlation with SZA or temperature, while the ratio of ρ w ( λ ) showed the opposite pattern compared to the ratio for E d -s, as expected. By comparison with the temperature and angle effects, straylight effects were negligible and given in Figure 5 for reference only.

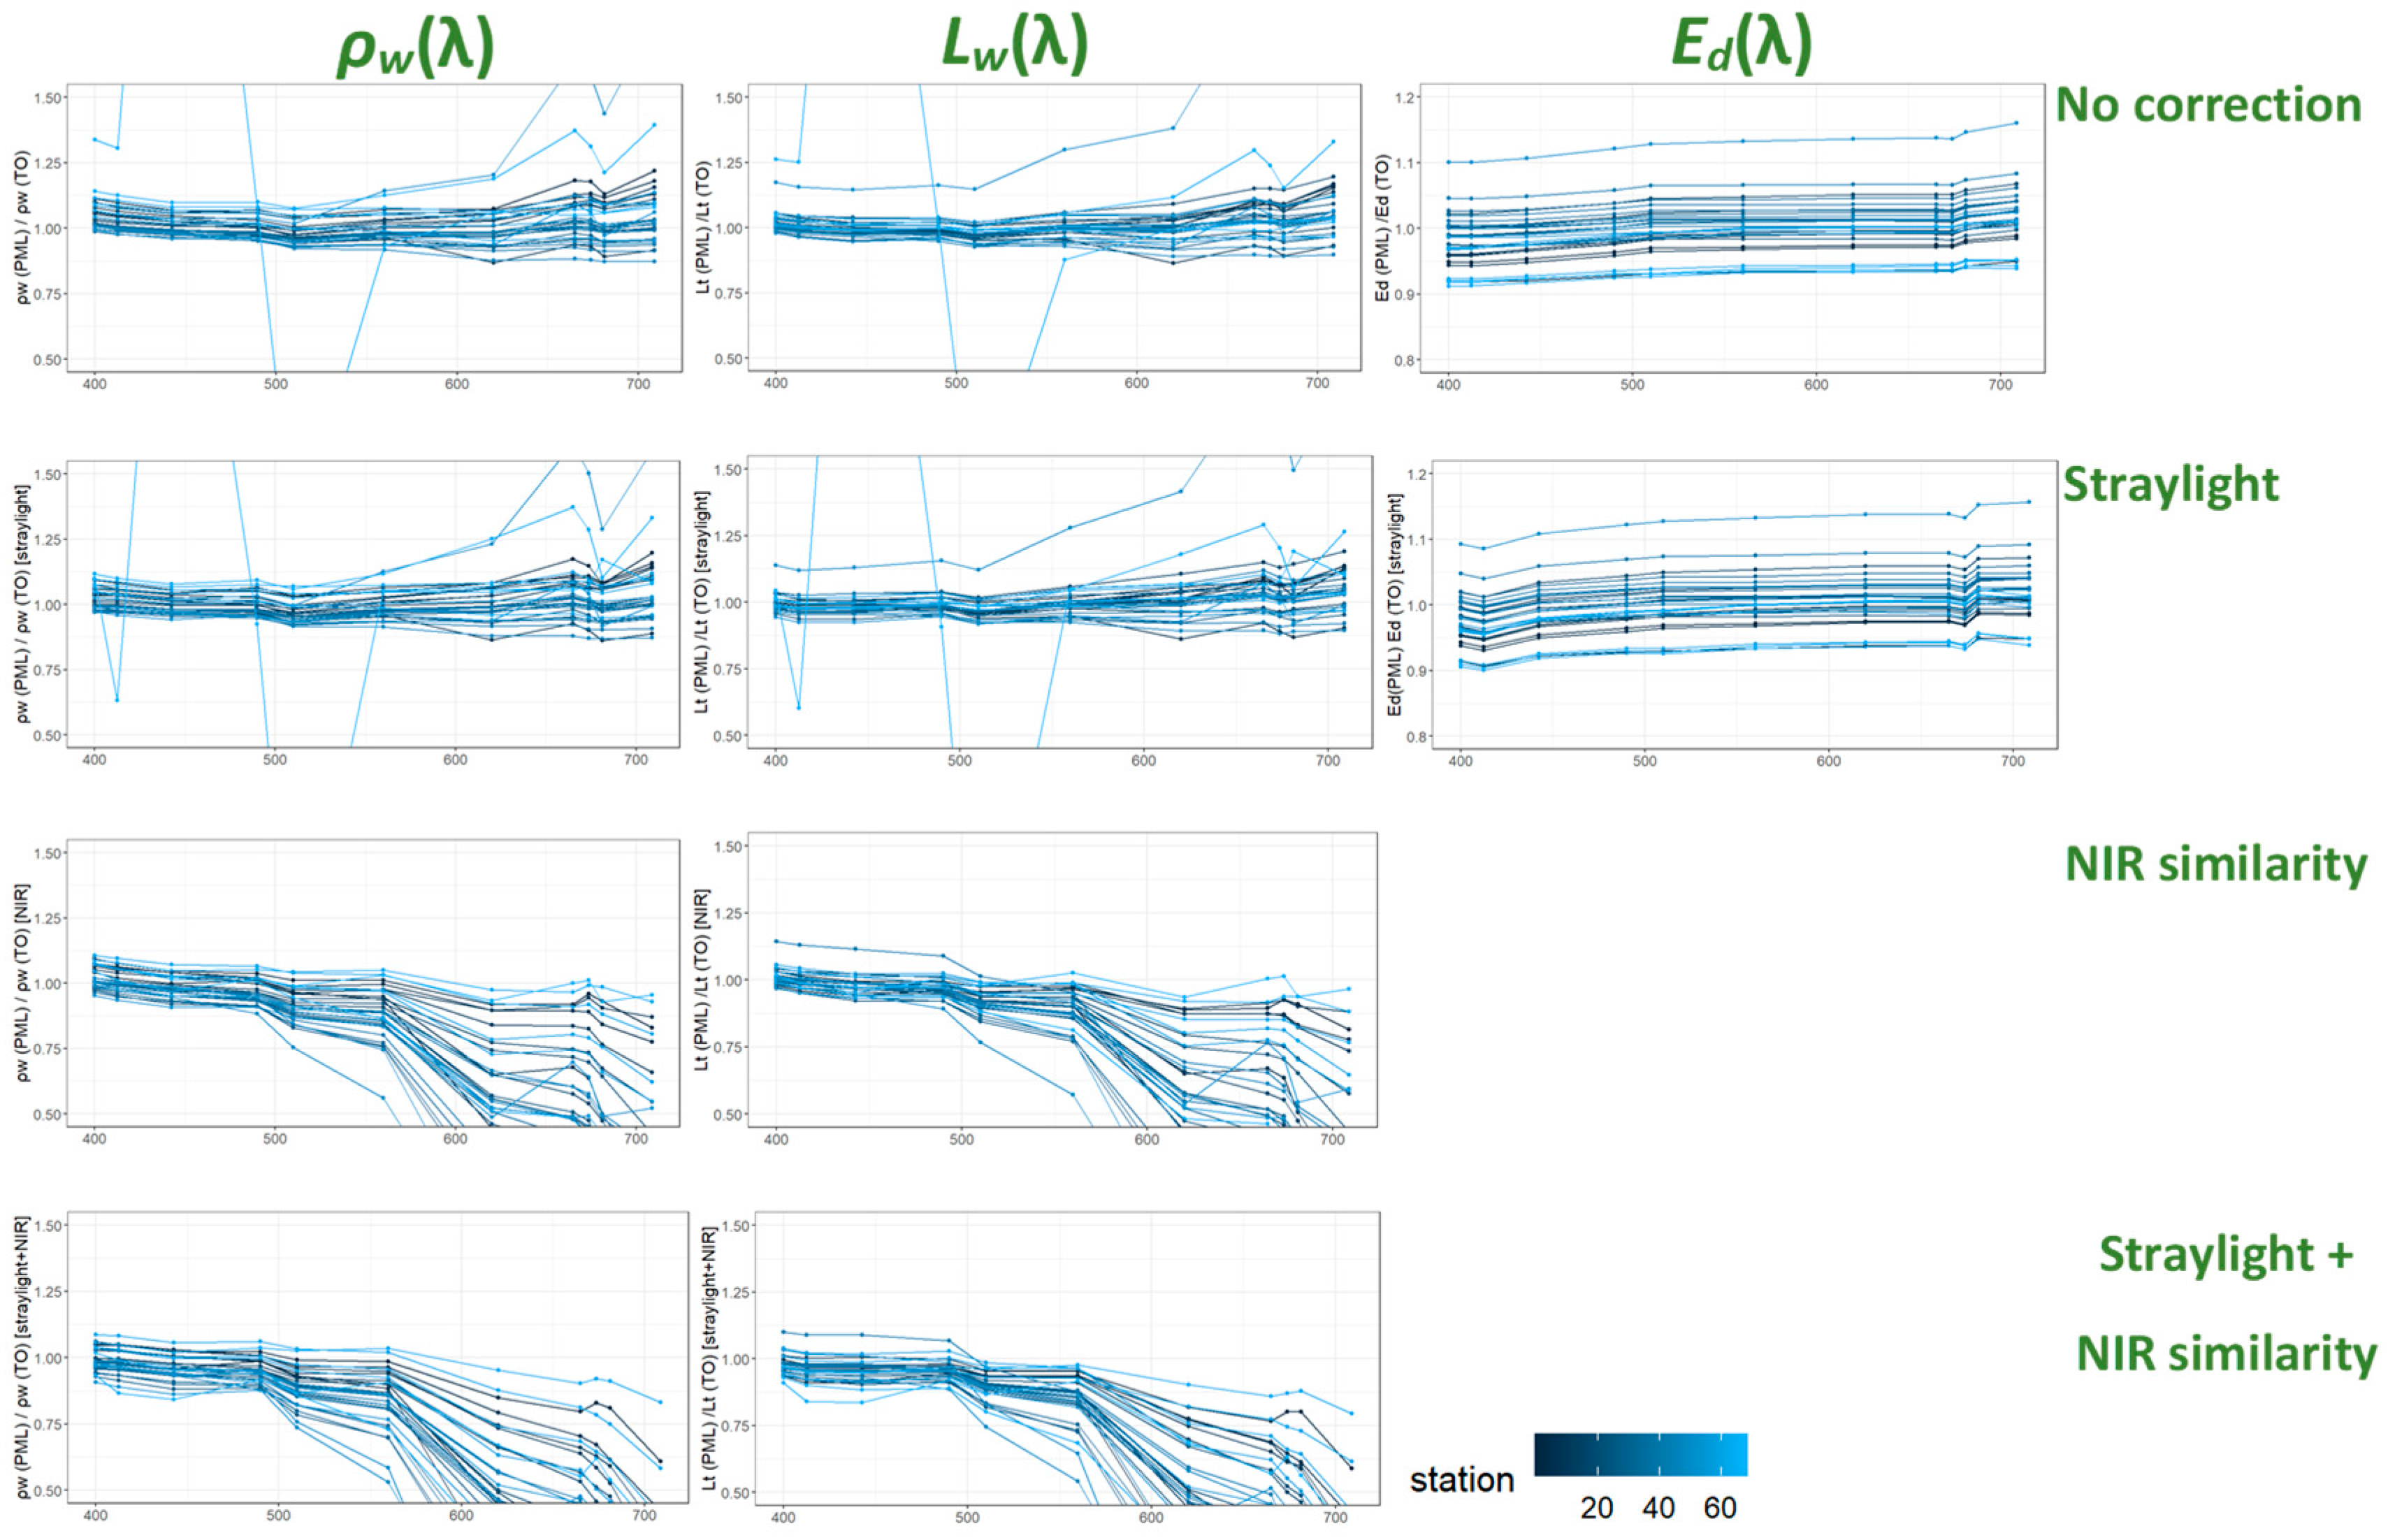
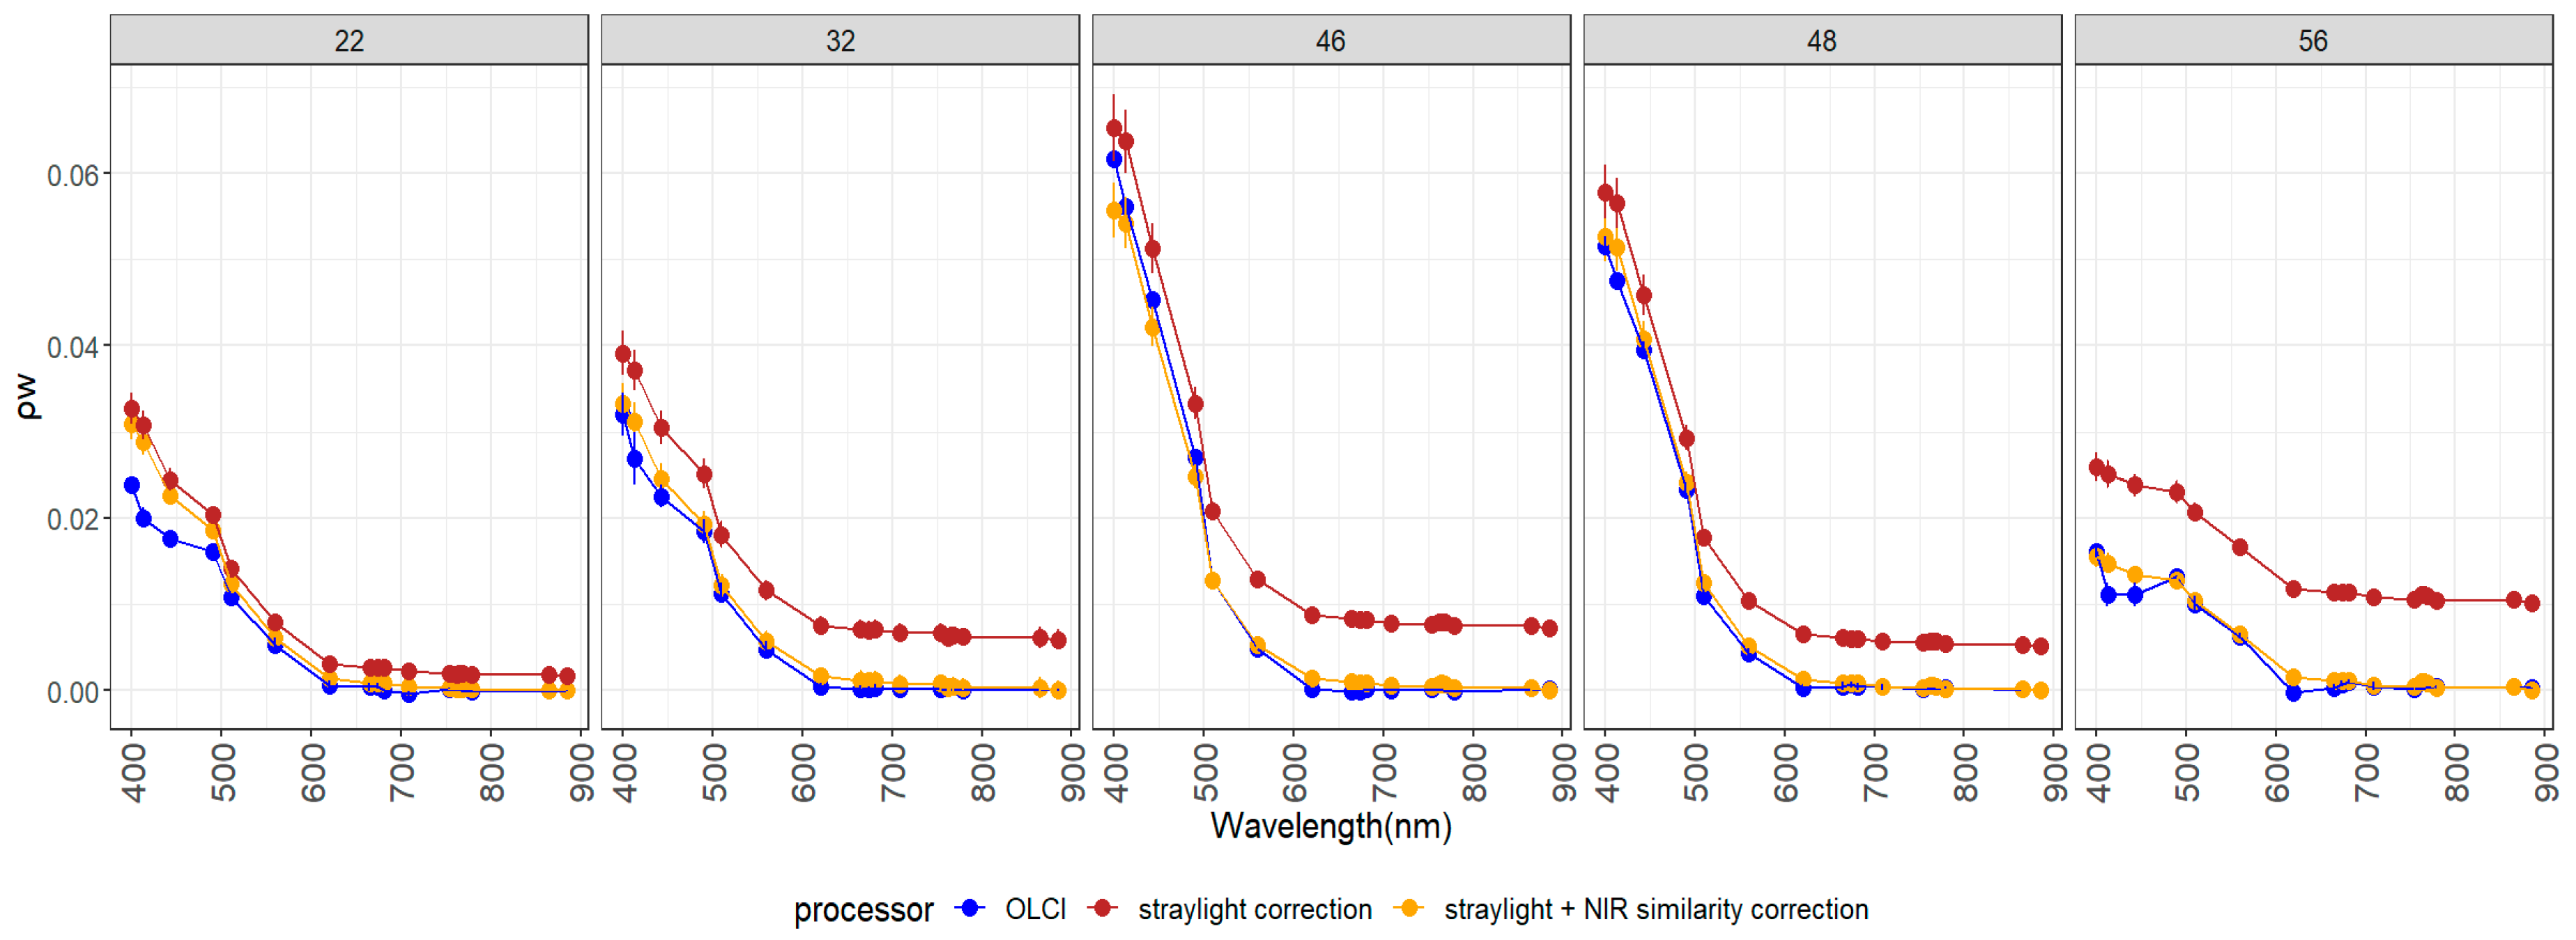
4.4. Comparison of Water-Leaving Reflectance and Radiance Spectra

Agreement between ρ w values measured by TO and PML over all stations and after correcting for straylight and NIR showed good agreement without any bias over all wavelengths. In general, the TO measured values were slightly higher than PML data. The best agreement was for bands (400…442.5) nm (R2 = 0.99, Figure A5), it was slightly lower for bands (490…560) nm (R2 decrease 0.96 to 0.82, respectively, Figure A5), and rapidly decreased towards longer wavelengths, where the signal was small and negligible. The agreement between TO and PML for L w after applying two corrections was good at all wavelengths (Figure A6), although TO measured values were slightly higher than PML (Figure 12).
The NIR similarity correction increased both the bias and the scatter between the ρ w and L w ratios, but this could be expected as the L w signal levels in the Case 1 waters above 550 nm as a result of this correction normally would be extremely low (Figure 11, ρ w and L w after straylight and NIR similarity correction).
The straylight effects for individual sensors, as well as for the derived quantities, were mostly within ±3%, which was consistent with previous results [10,11,36]. The effect of straylight correction on the ρ w is shown in the upper panel of Figure 7. The straylight correction was applied to all of the data, regardless of the other corrections. The NIR similarity correction [25,26], on the other hand, changed the ρ w and L w spectra significantly and converged the outliers closer to 1 (Figure 6, Figure 7, lower panel). The NIR similarity correction removed the shift in ρ w (and L w ) spectra, which was probably caused by high tilt, waves, and skyglint. While the agreement between the two in situ radiometric systems could be satisfactory or even better without the NIR similarity correction (Figure 6, Figure 7), distortion of the spectra was evident (Figure 13), and the comparison with satellite data showed significant bias without the NIR correction (Figure 13).

4.5. Comparison of In Situ and OLCI Radiometric Data

Agreement between OLCI and in situ ρ w values, after both straylight and NIR similarity corrections were applied, was very good in terms of the shape of the spectra and absolute values (Figure 13). Although a similar shape in the ρ w spectrum was obtained using straylight correction only, it was significantly larger than the OLCI-derived ρ w spectrum, especially at longer wavelengths (Figure 13).
Based on the five match-ups available, there was good agreement between OLCI and in situ derived ρ w values for bands (400…510) nm and respective uncertainties less than 7%. For bands 620 nm onwards, the signal was very weak, and the relative uncertainties of the in situ data increased (>30%); the signal to noise ratio of the OLCI’s five cameras was lower than for blue bands [37], which made the validation of satellite radiometric products over Case 1 waters in this range challenging.
The comparison between OLCI and in situ ρ w for both PML and TO from 400 nm to 560 nm showed comparable results (Figure 14, Table 3), though at 412.5 nm, the dispersion was up to 16%, and bias was 15%. This was mainly caused by OLCI ρ w at stations 22 (Figure A7) and 56 (Figure 13), which had a steep decrease from 400 nm to 412.5 nm, and was not seen in the field measurements. The reason could be due to poor characterization of the aerosol load and type in the S-3A OLCI atmospheric correction [38,39]. Five match-ups, however are too few to make robust conclusions on the accuracy of S-3A OLCI. In this study, they were used as a preliminary analysis of the potential difference between using two different above-water systems for the validation of S-3A OLCI. For a comprehensive accuracy assessment, more match-up data are required.
The estimation of the uncertainty of the ratio of OLCI and in situ ρ w was up to 40% (Figure 15). The combined uncertainty for the ratio of ρ w (OLCI) and ρ w (in situ) (Figure 15) was within (10…16)% for the (400…510) nm, 39% for 560 nm, and above 100% for longer wavelengths, where the signal was very small (Figure 15). The contribution from in situ uncertainty was (6…7)% for bands (400…510) nm, about 11% for 560 nm, and 30% for longer wavelengths. The difference in the mean uncertainty between the TO and PML ρ w was within 1% for bands up to 510 nm and increasing towards longer wavelengths.
S-3 mission requirements [3] specify a 5% uncertainty for bands (490, 510, 560) nm in Case 1 waters and (5…10)% uncertainty for bands (400, 412, 442) nm depending on the water type. As per pixel uncertainty estimates on OLCI Level 2 data that do not include the uncertainty estimate from Level-1B products [40], it was currently not possible to validate the OLCI products against in situ data using uncertainty estimates for OLCI. The uncertainties for the match-ups were ~6% for the bands (400…510) nm, and based on the limited number of match-ups available, there was a difference of up to 16% between in situ and OLCI data.

5. Conclusions

The results of the AMT27 field intercomparison are a major international step in assessing differences in commonly used above-water radiometers under different environmental conditions on a moving ship. The AMT campaign was also a significant step, in the framework of both the FRM4SOC project and the international community, in enhancing the confidence in different sources of radiometric data used for satellite ocean color validation.
In general, the agreement between the two in situ systems during the field campaign was satisfactory, with up to a 5% difference over visible wavelengths before corrections applied to ρ w . Over the wavelength range from (400…510) nm, the relative mean uncertainty of in situ data was close to the S-3 mission requirements of 5%, but with an increase in wavelength beyond 500 nm, the relative uncertainty also increased mainly due to unstable targets, highly variable environmental conditions, and the low signal at red bands in oligotrophic waters.
The consistency between the satellite and in situ data for both sets of radiometers was similar. From 412 nm to 560 nm, the Seabird system showed −8% < MPD < 12% difference and TriOS 2% < MPD < 15% difference compared to OLCI data. The consistency between the in situ and OLCI radiometric data was good, and the respective uncertainties were less than 7%.
SI traceable calibration of radiometers before or after field campaigns is very important to ensure traceability. Calibration alone is not sufficient however, and to trace where the variability between radiometric systems comes from, it is necessary to characterize a number of other parameters, including temperature dependence, nonlinearity and spectral straylight. In parallel to correction for instrument bias, and to improve measurement uncertainties, a detailed characterization of environmental conditions during deployment is required. The effect of different processing corrections applied to different radiometric sensors, including NIR similarity correction, correction for straylight, non-linearity, also needs further testing using a simultaneous independent reference instrument that is less affected by these systematic effects.

Author Contributions

Conceptualization, K.A., V.V., G.H.T., G.D., R.V., C.D. and T.C.; methodology, K.A., V.V., G.H.T. and G.D.; software, I.A.; formal analysis, K.A., I.A., V.V., G.H.T., G.D. and F.N.; investigation, K.A., V.V., I.A., G.H.T., and G.D.; resources, G.H.T. and R.V.; data curation, K.A, G.D. and F.N.; writing—original draft preparation, K.A.; writing—review and editing, G.H.T., G.D., V.V., I.A. and R.V.; visualization, K.A., G.H.T. and F.N.; project administration, R.V.; funding acquisition, G.H.T., R.V., C.D. and T.C. All authors have read and agreed to the published version of the manuscript.

Funding

This work was funded by European Space Agency project Fiducial Reference Measurements for Satellite Ocean Color (FRM4SOC), contract No. 4000117454/16/I-Sbo. G.H.T., G.D. and F.N. were also funded by AMT4SentinelFRM from the European Space Agency (contract No. ESRIN/RFQ/3-14457/16/I-BG) and UK Natural Environment Research Council (NERC) National Capability funding to Plymouth Marine Laboratory for the Atlantic Meridional Transect. The Atlantic Meridional Transect is funded by the UK Natural Environment Research Council through its National Capability Long-term Single Center Science Program, Climate Linked Atlantic Sector Science (grant number NE/R015953/1).

Acknowledgments

The authors would like to thank the captain and crew of RRS Discovery for AMT27. We thank Silvia Pardo of the Natural Environment Research Council Earth Observation Data Acquisition and Analysis Service (NEODAAS) for satellite imagery during the campaign and for producing Figure 2. This study contributes to the international IMBeR project, and 344 is the contribution number of the AMT program.

Conflicts of Interest

The authors declare no conflict of interest.

Appendix A

Figure A1. ρ w ( λ ) spectra at each measurement station corrected for straylight (green circles) and after the straylight and NIR similarity correction (brown triangles). More data from each station can be found in Table 1.
Remotesensing 12 01669 g0a1
Figure A2. Comparison between TO and PML E d ( λ ) after straylight correction at OLCI’s bands.
Remotesensing 12 01669 g0a2
Figure A3. Comparison between TO and PML E d ( λ ) after straylight correction and NIR similarity correction at OLCI’s bands.
Remotesensing 12 01669 g0a3
Figure A4. Comparison between TO and PML ρ w ( λ ) after straylight correction at OLCI’s bands.
Remotesensing 12 01669 g0a4
Figure A5. Comparison between TO and PML ρ w ( λ ) after straylight correction and NIR similarity correction at OLCI’s bands.
Remotesensing 12 01669 g0a5
Figure A6. Comparison between TO and PML L w ( λ ) after straylight correction at OLCI’s bands.
Remotesensing 12 01669 g0a6
Figure A7. Scatterplots for the validation of OLCI radiometric data for bands 400 to 560 nm using PML’s and TO’s in situ data for five data match-ups.
Remotesensing 12 01669 g0a7

References

  1. Bailey, S.W.; Hooker, S.B.; Antoine, D.; Franz, B.A.; Werdell, P.J. Sources and assumptions for the vicarious calibration of ocean color satellite observations. Appl. Opt. 2008, 47, 2035–2045. [Google Scholar] [CrossRef]
  2. Zibordi, G.; Mélin, F.; Voss, K.J.; Johnson, B.C.; Franz, B.A.; Kwiatkowska, E.; Huot, J.P.; Wang, M.; Antoine, D. System vicarious calibration for ocean color climate change applications: Requirements for in situ data. Remote Sens. Environ. 2015, 159, 361–369. [Google Scholar] [CrossRef]
  3. ESA. Sentinel-3 Mission Requirements Document (MRD), EOPSMO/1151/MD-md; ESA: Paris, France, 2007. [Google Scholar]
  4. Ruddick, K. Technical Report TR-2 „A Review of Commonly used Fiducial Reference Measurement (FRM) Ocean Colour Radiometers (OCR) used for Satellite OCR Validation” 2018. Available online: https://frm4soc.org/wp-content/uploads/filebase/FRM4SOC-TR2_TO_signedESA.pdf (accessed on 21 May 2020).
  5. Kuusk, J.; Ansko, I.; Vabson, V.; Ligi, M.; Vendt, R. Protocols and Procedures to Verify the Performance of Fiducial Reference Measurement (FRM) Field Ocean Colour Radiometers (OCR) Used for Satellite Validation; Technical Report TR-5; Tartu Observatory: Tõravere, Estonia, 2017. [Google Scholar]
  6. Ruddick, K.G.; Voss, K.; Boss, E.; Castagna, A.; Frouin, R.; Gilerson, A.; Hieronymi, M.; Johnson, B.C.; Kuusk, J.; Lee, Z.; et al. A Review of Protocols for Fiducial Reference Measurements of Downwelling Irradiance for the Validation of Satellite Remote Sensing Data over Water. Remote Sens. 2019, 11, 1742. [Google Scholar] [CrossRef] [Green Version]
  7. Ruddick, K.G.; Voss, K.; Boss, E.; Castagna, A.; Frouin, R.; Gilerson, A.; Hieronymi, M.; Johnson, B.C.; Kuusk, J.; Lee, Z.; et al. A Review of Protocols for Fiducial Reference Measurements of Water-Leaving Radiance for Validation of Satellite Remote-Sensing Data over Water. Remote Sens. 2019, 11, 2198. [Google Scholar] [CrossRef] [Green Version]
  8. Białek, A.; Douglas, S.; Kuusk, J.; Ansko, I.; Vabson, V.; Vendt, R. Example of Monte Carlo Method Uncertainty Evaluation for Above-Water Ocean Colour Radiometry. Remote Sens. 2020, 12, 780. [Google Scholar] [CrossRef] [Green Version]
  9. Białek, A.; Goodman, T.; Woolliams, E.; Brachmann, J.F.S.; Schwarzmaier, T.; Kuusk, J.; Ansko, I.; Vabson, V.; Lau, I.C.; MacLellan, C.; et al. Results from Verification of Reference Irradiance and Radiance Sources Laboratory Calibration Experiment Campaign. Remote Sens. 2020, in press. [Google Scholar]
  10. Vabson, V.; Kuusk, J.; Ansko, I.; Vendt, R.; Alikas, K.; Ruddick, K.; Ansper, A.; Bresciani, M.; Burmester, H.; Costa, M.; et al. Laboratory Intercomparison of Radiometers Used for Satellite Validation in the 400–900 nm Range. Remote Sens. 2019, 11, 1101. [Google Scholar] [CrossRef] [Green Version]
  11. Vabson, V.; Kuusk, J.; Ansko, I.; Vendt, R.; Alikas, K.; Ruddick, K.; Ansper, A.; Bresciani, M.; Burmester, H.; Costa, M.; et al. Field Intercomparison of Radiometers Used for Satellite Validation in the 400–900 nm Range. Remote Sens. 2019, 11, 1129. [Google Scholar] [CrossRef] [Green Version]
  12. Tilstone, G.; Dall’Olmo, G.; Hieronymi, M.; Ruddick, K.; Beck, M.; Ligi, M.; Costa, M.; D’Alimonte, D.; Vellucci, V.; Vansteenwegen, D.; et al. Field intercomparison of radiometer measurements for ocean colour validation. Remote Sens. 2020, 12, 1587. [Google Scholar] [CrossRef]
  13. Morel, A.; Prieur, L. Analysis of variations in ocean color1. Limnol. Oceanogr. 1977, 22, 709–722. [Google Scholar] [CrossRef]
  14. Organelli, E.; Dall’Olmo, G.; Brewin, R.J.W.; Tarran, G.A.; Boss, E.; Bricaud, A. The open-ocean missing backscattering is in the structural complexity of particles. Nat. Commun. 2018, 9, 1–11. [Google Scholar] [CrossRef]
  15. Sea-Bird Scientific. Specifications for HyperOCR Radiometer. Available online: https://www.seabird.com/hyperspectral-radiometers/hyperocr-radiometer/family?productCategoryId=54627869935 (accessed on 31 January 2019).
  16. TriOS. RAMSES Technische Spezifikationen. TriOS Mess- und Datentechnik. Available online: https://www.trios.de/ramses.html (accessed on 31 January 2019).
  17. Spectral Response Function Data. Available online: https://sentinel.esa.int/web/sentinel/technical-guides/sentinel-3-olci/olci-instrument/spectral-response-function-data (accessed on 3 September 2018).
  18. Slaper, H.; Reinen, H.A.J.M.; Blumthaler, M.; Huber, M.; Kuik, F. Comparing ground-level spectrally resolved solar UV measurements using various instruments: A technique resolving effects of wavelength shift and slit width. Geophys. Res. Lett. 1995, 22, 2721–2724. [Google Scholar] [CrossRef]
  19. JCGM 100, Evaluation of Measurement Data—Guide to the Expression of Uncertainty in Measurement (GUM), 1st ed.; JCGM, September 2008; Available online: http://www.bipm.org/utils/common/documents/jcgm/JCGM_100_2008_E.pdf. (accessed on 20 March 2020).
  20. Alikas, K.; Ansko, I.; Vabson, V.; Ansper, A.; Kangro, K.; Uudeberg, K.; Ligi, M. Consistency of Radiometric Satellite Data over Lakes and Coastal Waters with Local Field Measurements. Remote Sens. 2020, 12, 616. [Google Scholar] [CrossRef] [Green Version]
  21. Santer, B.D.; Wigley, T.M.L.; Boyle, J.S.; Gaffen, D.J.; Hnilo, J.J.; Nychka, D.; Parker, D.E.; Taylor, K.E. Statistical significance of trends and trend differences in layer-average atmospheric temperature time series. J. Geophys. Res. Atmos. 2000, 105, 7337–7356. [Google Scholar] [CrossRef]
  22. ISO/IEC 17043:2010. Conformity Assessment—General Requirements for Proficiency Testing; ISO: Geneva, Switzerland, 2010. [Google Scholar]
  23. Tilstone, G.H.; Moore, G.F.; Sørensen, K.; Doerfeer, R.; Røttgers, R.; Ruddick, K.D.; Pasterkamp, R.; Jørgensen, P.V. Regional Validation of MERIS Chlorophyll Products in North Sea Coastal Waters: REVAMP Protocols; Presented at the ENVISAT Validation Workshop; ESA: Frascatti, Italy, 2004. [Google Scholar]
  24. Mueller, J.L.; Davis, C.; Arnone, R.; Frouin, R.; Carder, K.; Lee, Z.P.; Steward, R.G.; Hooker, S.; Mobley, C.D.; McLean, S. Above-Water Radiance and Remote Sensing Reflectance Measurement and Analysis Protocols. In Ocean Optics Protocols for Satellite Ocean Color Sensor Validation, Revision 2; NASA/TM-2000-209966; Goddard Space Flight Space Center: Greenbelt, MD, USA, 2000. [Google Scholar]
  25. Ruddick, K.; de Cauwer, V.; van Mol, B. Use of the near infrared similarity reflectance spectrum for the quality control of remote sensing data. Remote Sens. Coast. Ocean. Environ. 2005, 5885, 588501. [Google Scholar] [CrossRef]
  26. Ruddick, K.G.; de Cauwer, V.; Park, Y.-J.; Moore, G. Seaborne measurements of near infrared water-leaving reflectance: The similarity spectrum for turbid waters. Limnol. Oceanogr. 2006, 51, 1167–1179. [Google Scholar] [CrossRef] [Green Version]
  27. EUMETSAT. Recommendations for Sentinel-3 OLCI Ocean Colour Product Validations in Comparison with in situ Measurements—Matchup Protocols; User Guide EUM/SEN3/DOC/19/1092968; EUMETSAT: Darmstadt, Germany, 2019. [Google Scholar]
  28. Barlow, R.G.; Cummings, D.; Gibb, S.W. Improved resolution of mono- and divinyl chlorophylls a and b and zeaxanthin and lutein in phytoplankton extracts using reverse phase C-8 HPLC. Mar. Ecol. Prog. Ser. 1997, 161, 303–307. [Google Scholar] [CrossRef]
  29. Dall’Olmo, G.; Westberry, T.K.; Behrenfeld, M.J.; Boss, E.; Slade, W.H. Significant contribution of large particles to optical backscattering in the open ocean. Biogeosciences 2009, 6, 947–967. [Google Scholar] [CrossRef] [Green Version]
  30. Zibordi, G.; Ruddick, K.; Ansko, I.; Moore, G.; Kratzer, S.; Icely, J.; Reinart, A. In situ determination of the remote sensing reflectance: An inter-comparison. Ocean Sci. 2012, 8, 567–586. [Google Scholar] [CrossRef] [Green Version]
  31. Kowalczuk, P.; Durako, M.J.; Cooper, W.J.; Wells, D.; Souza, J.J. Comparison of radiometric quantities measured in water, above water and derived from seaWiFS imagery in the South Atlantic Bight, North Carolina, USA. Cont. Shelf Res. 2006, 26, 2433–2453. [Google Scholar] [CrossRef]
  32. Brewin, R.J.W.; Dall’Olmo, G.; Pardo, S.; van Dongen-Vogels, V.; Boss, E.S. Underway spectrophotometry along the Atlantic Meridional Transect reveals high performance in satellite chlorophyll retrievals. Remote Sens. Environ. 2016, 183, 82–97. [Google Scholar] [CrossRef] [Green Version]
  33. Lee, Z.; Ahn, Y.-H.; Mobley, C.; Arnone, R. Removal of surface-reflected light for the measurement of remote-sensing reflectance from an above-surface platform. Opt. Express 2010, 18, 26313–26324. [Google Scholar] [CrossRef] [PubMed]
  34. Hooker, S.B.; Lazin, G.; Zibordi, G.; McLean, S. An Evaluation of Above- and In-Water Methods for Determining Water-Leaving Radiances. J. Atmos. Ocean. Technol. 2002, 19, 486–515. [Google Scholar] [CrossRef]
  35. Zibordi, G.; Talone, M.; Jankowski, L. Response to Temperature of a Class of In Situ Hyperspectral Radiometers. J. Atmos. Ocean. Technol. 2017, 34, 1795–1805. [Google Scholar] [CrossRef]
  36. Talone, M.; Zibordi, G.; Ansko, I.; Banks, A.C.; Kuusk, J. Stray light effects in above-water remote-sensing reflectance from hyperspectral radiometers. Appl. Opt. 2016, 55, 3966–3977. [Google Scholar] [CrossRef] [PubMed]
  37. EUMETSAT. Sentinel-3 OLCI Marine User Handbook, v1H e-Signed; EUMETSAT: Darmstadt, Germany, 2018. [Google Scholar]
  38. Li, J.; Jamet, C.; Zhu, J.; Han, B.; Li, T.; Yang, A.; Guo, K.; Jia, D. Error Budget in the Validation of Radiometric Products Derived from OLCI around the China Sea from Open Ocean to Coastal Waters Compared with MODIS and VIIRS. Remote Sens. 2019, 11, 2400. [Google Scholar] [CrossRef] [Green Version]
  39. Zibordi, G.; Mélin, F.; Berthon, J.-F. A Regional Assessment of OLCI Data Products. IEEE Geosci. Remote Sens. Lett. 2018, 15, 1490–1494. [Google Scholar] [CrossRef]
  40. EUMETSAT Mission Management. Sentinel-3 Product Notice—OLCI Level-2 Ocean Colour, v1; EUMETSAT: Darmstadt, Germany, 2019. [Google Scholar]
Figure 1. Radiometer set up on RRS Discovery; (A) showing the location of the meteorological mast on the bow of the ship where the radiometers were located; (B) Purpose-built frame for locating the sensors, side by side; (C) View of upwelling radiance sensors.
Remotesensing 12 01669 g001
Figure 2. AMT27 campaign sampling stations superimposed on a NASA Visible Infrared Imager Radiometer Suite (VIIRS) Chl a composite satellite image from 19th September to 09th November 2017. The Chl a concentration scale is given below the image.
Remotesensing 12 01669 g002
Figure 3. Chl a concentration derived from WetLABs absorption-attenuation measurements (ac-S) along AMT27. Blue points are for Northern latitudes; Red points are for Southern latitudes.
Remotesensing 12 01669 g003
Figure 4. Upper panel: E d (left) and ρ w (right) spectra, re-calculated for OLCI (Ocean and Land Color Instrument) channels. Lower panel: expanded uncertainties of downwelling solar irradiance ( E d ) and water-leaving reflectance ( ρ w ). The color denotes the station ID, as listed in Table 1.
Remotesensing 12 01669 g004
Figure 5. The difference in downwelling irradiance between PML (Plymouth Marine Laboratory) and TO (Tartu Observatory) as a function of ambient temperature (left panel) and function of Solar Zenith Angle (right panel). Blue color circles represent data without any correction and with green triangles after straylight correction.
Remotesensing 12 01669 g005
Figure 6. The ratio between PML and TO water-leaving reflectance ( ρ w )   (left), water-leaving radiance (Lw) (middle), and downwelling solar irradiance ( E d )   (right) in terms of different corrections (rows from top to bottom): no correction; staylight; near infra-red (NIR) similarity; straylight and NIR similarity.
Remotesensing 12 01669 g006
Figure 7. The ratio of uncorrected to straylight corrected ρ w (above) and straylight corrected to straylight and NIR similarity corrected ρ w (below) over all stations. Brown line is set to 1 to show the direction of the correction.
Remotesensing 12 01669 g007
Figure 8. Comparison between TO and PML E d (mW·m−2·µm−1) and respective uncertainties over all OLCI’s band. The comparison in each band separately can be found in Figure A2 for clear conditions and in Figure A3 for all conditions.
Remotesensing 12 01669 g008
Figure 9. Mean ratio of E d between TO and PML (triangles) and agreement between the results from two radiometric systems, expressed as median En number of the ratio (circles) over all stations.
Remotesensing 12 01669 g009
Figure 10. Comparison PML/TO averaged results for ρ w , before (left) and after (right) NIR similarity corrections. Mean ratio with uncertainty bars—yellow line (triangles); Median of respective En values—purple line (circles).
Remotesensing 12 01669 g010
Figure 11. Comparison between TO and PML ρw after straylight (left) and straylight + NIR similarity correction over all OLCI’s band. The comparison at each band can be found in Figure A4 for straylight correction and in Figure A5 for straylight + NIR similarity correction.
Remotesensing 12 01669 g011
Figure 12. Comparison between TO and PML L w after straylight (left) and straylight + NIR similarity correction over all OLCI’s band. The comparison in each band separately can be found in Figure A6 for straylight correction.
Remotesensing 12 01669 g012
Figure 13. Comparison of OLCI ρ w against TO in situ measured ρ w after straylight correction and after straylight + NIR similarity correction in five match-up stations. The error bars denote respective uncertainties for in situ data and standard deviation inside the Region of Interest (ROI) for OLCI. The general information for each station can be found in Table 1.
Remotesensing 12 01669 g013
Figure 14. Correlation between OLCI-derived and in situ-measured ρ w processed with straylight and NIR similarity correction over five match-ups over all wavelengths. The error bars denote respective uncertainties for in situ data and standard deviation inside the ROI for OLCI.
Remotesensing 12 01669 g014
Figure 15. The ratio between mean OLCI ρ w against in situ ρ w (TO above and PML below) with straylight and NIR similarity corrections over four match-up stations (22, 32, 48, 56). The error bars denote the uncertainty for the ratio calculated from in situ and OLCI’s data.
Remotesensing 12 01669 g015
Table 1. Overview of measurement conditions during the midday station during AMT27.
NoStation IdDateLatitude
(Degree)
Longitude
(Degree)
Sun Zenith Angle
(Degree)
Wind Speed
(W, m·s−1)
Temperature
(t, °C)
1124.09.201748.9−7.652.371.4816.2
2325.09.201746.7−12.051.527.2317.3
3627.09.201742.2−18.846.312.2419.3
4828.09.201739.4−22.745.315.9423.0
51030.09.201735.1−26.338.871.6924.3
61201.10.201731.8−27.235.845.6923.5
71603.10.201725.7−28.730.527.1524.5
81804.10.201722.3−29.528.581.6925.7
92005.10.201718.8−29.726.45.4726.6
102206.10.201715.5−28.823.214.3127.8
112407.10.201712.8−28.220.48.4328.0
122608.10.20179.9−27.418.386.8928.3
132809.10.20176.9−26.715.415.1327.6
143211.10.20171.5−25.410.426.3426.0
153412.10.2017−1.8−25.08.238.4425.9
163613.10.2017−4.6−25.06.0710.7425.7
173814.10.2017−7.1−25.05.846.825.5
184015.10.2017−10.5−25.15.936.6325.1
194216.10.2017−13.7−25.17.858.1223.8
204317.10.2017−16.0−25.18.228.0722.9
214619.10.2017−21.8−25.1138.7621.7
224820.10.2017−25.1−25.015.566.2621.2
235021.10.2017−27.9−25.217.783.8820.7
245222.10.2017−31.3−26.221.228.7419.4
255423.10.2017−33.9−27.126.056.1717.3
265624.10.2017−37.0−28.328.628.1215.8
275926.10.2017−42.1−30.434.227.9210.0
286127.10.2017−45.2−31.736.1516.258.8
296228.10.2017−47.1−32.654.538.036.4
306429.10.2017−50.4−34.240.2311.631.6
316630.10.2017−52.9−35.743.259.250.9
326701.11.2017−53.7−38.160.5419.712.0
* AMT27—Atlantic Meridional Transect 27.
Table 2. Technical parameters of the radiometers.
ParameterRAMSESHyperOCR
Field of View (L/E)7°/cos6°/cos
Adaptive integration timeYesyes
Min. integration time, ms44
Max. integration time, ms40964096
Min. sampling interval, s10.5
Recording dark signalOpaque pixelsInternal shutter
Number of channels256256
Wavelength range, nm320…1050320…1050
Wavelength step, nm3.33.3
Spectral resolution, nm1010
Table 3. The Mean Absolute Percentage Difference (MAPD) and Mean Percentage Difference (MPD) as calculated between Ocean Land Colour Instrument (OLCI) and in situ ρ w data measured by TO or PML over five match-up stations. Straylight and NIR similarity correction was applied to in situ data. The mean in situ uncertainty for both radiometers is shown in the right column.
MAPD (%)MPD (%)Mean Uncertainty of In Situ ρw (%)
BandTOPMLTOPMLTOPML
400993066
412.51614151266
442.51299366
490792−566
510787−677
560111011−81012
6208417884−5330>50
665771177710940>50
673.7561102613142>50
681.256212362−941>50
708.7584141184−903>50>50
753.756015660156>50>50
778.7511014362143>50>50
885145116−72116>50>50

