Article

Remote Detection of Moisture and Bio-Deterioration of Building Walls by Time-Of-Flight and Phase-Shift Terrestrial Laser Scanners

by
Czesław Suchocki
1,*,
Marzena Damięcka-Suchocka
1,
Jacek Katzer
2,
Joanna Janicka
2,
Jacek Rapiński
2 and
Paulina Stałowska
1
1
Faculty of Civil Engineering, Environmental and Geodetic Sciences, Koszalin University of Technology, Śniadeckich 2, 75-453 Koszalin, Poland
2
Faculty of Geoengineering, University of Warmia and Mazury in Olsztyn, Oczapowskiego 2, 10-719 Olsztyn, Poland
*
Author to whom correspondence should be addressed.
Remote Sens. 2020, 12(11), 1708; https://0-doi-org.brum.beds.ac.uk/10.3390/rs12111708
Submission received: 7 May 2020 / Revised: 24 May 2020 / Accepted: 25 May 2020 / Published: 27 May 2020
(This article belongs to the Special Issue Point Cloud Processing and Analysis in Remote Sensing)

Abstract

:
Detection of bio-deterioration and moisture is one of the most important tasks for comprehensive diagnostic measurements of buildings and structures. Any undesirable change in the material properties caused by the action of biological agents contributes to gradual aesthetic and physical damage to buildings. Very often, such surface changes can lead to structural defects or poor maintenance. In this paper, radiometric analysis of point clouds is proposed for moisture and biofilm detection in building walls. Recent studies show that remote terrestrial laser scanning (TLS) technology is very useful for registering and evaluating the technical state of the deterioration of building walls caused by moisture and microorganisms. Two different types of TLS, time-of-flight and phase-shift scanners, were used in the study. The potential of TLS radiometric data for detecting moisture and biofilm on wall surfaces was tested on two buildings. The main aim of the research is to compare two types of scanners in the context of their use in the detection of moisture and microorganisms.

Graphical Abstract

1. Introduction

Recently, terrestrial laser scanning (TLS) technology has become one of the most popular methods for object acquisition in civil engineering [1,2,3,4]. TLS provides rapid capture of point clouds in high resolution for 3D object modelling (e.g., buildings [5,6], structures [7,8], geotechnical objects [9,10]). It can also be used for the technical assessment of the surface condition of building walls [11,12,13]. Thus, TLS has proved to be an efficient and useful device for diagnostic measurements of buildings and structures. Apart from capturing geometric information (xyz) with millimeter accuracy, TLS collects texture information provided by a digital camera (red, green, blue (RGB)) and radiometric information provided by the TLS sensor. The radiometric information of a laser beam can be successfully applied in the detection of surface changes, such as moisture and bio-deterioration [14,15] or cracks and cavities [16,17]. Digital photographs taken by TLS provide additional help in assessing the degradation of a building wall.
Long-lasting moisture (usually due to a lack of proper maintenance) greatly affects the structural safety of buildings, especially old and historic ones [18]. Additionally, very often the moistened surface of a building wall is the primary factor triggering the growth of microorganisms that form biofilms, covering the wall [19,20]. The most common microorganisms appearing on the surfaces of building walls are bacteria, cyanobacteria, algae, fungi, mold, lichens and mosses [21]. Such colonization of microorganisms usually causes aesthetic and physical damage to buildings and structures [22]. It has been estimated that about 25% of building deterioration is a result of microorganism activity [23]. Therefore, remote detection of factors that cause degradation of wall surfaces is extremely important for complex building diagnostics. Detection, registration and monitoring of surface changes, such as moisture movement [24] and biofilm growth, are important and urgent research problems. In this research, the authors propose the use of commercially available geodetic TLS to detect changes in the physiochemical properties of a scanned surface. The acquired radiometric information of point clouds was analyzed. Registering wall moisture and wall colonization by microorganisms via TLS has several advantages. TLS is a remote, active, nondestructive technique that is not sensitive to ambient lighting used for diagnostic measurements of buildings. It should be noted that traditional photographic techniques require good lighting. The traditional photographic techniques only provide a digital image; TLS provides three-dimensional point clouds characterized by very high resolution. Therefore, very good validation is enabled and measurements of the circumference of moisture area, length and width of a biofilm are possible. TLS is capable of conducting measurements from a distance of up to several hundred meters; traditional optic cameras are not able to take a clear picture from such a long distance. Using a thermal camera to determine the bio-deterioration of buildings is also possible [25]. In contrast to scanners, this is a passive measurement method, highly dependent on environmental conditions [26]. So far, authors have conducted multiple research programs dedicated to the use of the radiometric information of point clouds for the assessment of saturation and moisture movement in building materials and walls [27,28]. In these studies, the authors used time-of-flight (TOF) scanners produced by different manufacturers. It should be noted that manufacturers of TLS mainly use two principles for distance measurement. In addition to TOF, phase-shift (PS) distance measurement is also very popular. The use of different types of rangefinders might be affected by the absorption and dispersion of the laser beam on the target. Thus, the final value of the intensity can be registered in slightly different ranges by the PS and TOF scanners. The greater sensitivity of a TLS sensor provides more information about changes in the physiochemical properties of the scanned surface, such as saturation, discoloration and roughness. Basically, a more sensitive TLS sensor makes it easier to detect building defects, using the intensity of point cloud analysis, especially through the algorithm for automatic data classification, compared to a less sensitive TLS sensor.
The main aim of this paper was to compare TOF and PS scanners in the context of the collected intensity data for moisture and bio-deterioration detection in a building wall. The investigation pointed out the advantages and disadvantages of both measuring technologies in this field. Leica ScanStation C10 (TOF) and Z + F 5010X6 IMAGER (PS) scanners were used in the investigation. The potential of radiometric information of point clouds for moisture and biofilm detection in building walls was tested on two types of buildings.

2. Theoretical Background of Laser Measurements

A terrestrial laser scanner is based on the active emission of a laser beam, which spreads through the air to reach a target that scatters it. Part of the scattered energy returns to the TLS detector. The TLS conducts simultaneous measurements of distance, vertical angle and horizontal angle, which are carried out in a fully automated manner. Based on this information, the instrument’s software calculates point coordinates (x,y,z). Additionally, the TLS registers the radiometry information of the laser beam reflected by the target (so-called intensity). The relationship between the emitted and received TLS signal power is described by the following laser equation [29]:
P R = π P T ρ 4 R 2 η A t m η S y s c o s ( Θ )
where PR is the received signal power, PE is the transmitted signal power, α is the angle of incidence, ρ is the reflectance of a material, ηAtm and ηSys are the atmospheric and system transmission factors, and R is the range.
The parameters that affect the power of the registered laser beam can be split into three groups. The first group includes the parameters that are constant during the measurement (PE, ηSys), or their inconsiderable changes do not influence the power of the registered laser beam (ηAtm) [30]. The second group includes the parameters (α, R) that can be corrected through the adequate standardization of datasets [31]. The third group consists of a material’s reflectance ( ρ ) of the scanned surface. It should be noted that the reflectance of a material strongly depends on its physicochemical properties, such as color, roughness and saturation [32,33,34,35]. A change in these factors causes an increase or decrease in the recorded intensity value. Thus, an appropriate analysis of the intensity value of the point clouds enables the detection of a change in the moisture of a building wall, growth of microorganisms, or other changes in the surface.
It should be noted that one of the technical factors that may affect the sensitivity of the registration of the laser beam radiometry is the applied TLS distance measurement principle. The most common distance measurement principles between the TLS and the target are time-of-flight (TOF) and phase-shift (PS). In order to estimate distances, TOF rangefinders measure the time between the emission and receipt of a short, powerful laser pulse [36,37]. PS laser distance measurement is based on the phase difference between sent and received waveforms [38,39]. TLSs based on time-of-flight are widely used for long-range measurements. These scanners are characterized by a range of up to several kilometers. TLSs using phase-shift are characterized by a much shorter measurement range. Currently, PS-based measurements can reach a range above 300 meters. On the other hand, PS scanners acquire data with much higher speed and accuracy than TOF scanners.

3. Object Descriptions and Sampling by TLSs

For effective comparison of the discussed TLSs, two buildings with biological corrosion were scanned during the research program. The first object of the research was a small outbuilding made of cellular concrete and plastered with cement plaster. The lower part of the building façade was covered by biofilm (see Figure 1a). The second object of the study was a brickwork building. One wall of this building was covered by biofilm in the form of a long damp patch (see Figure 1b). The formation of a biofilm was caused by long-term water leakage from a damaged gutter. The scanning process of the buildings was conducted using both described scanners. The measurements were conducted from distances of 6 m and 17 m. During the measurements, the locations of both TLSs, in relation to the tested wall, were similar. The measurements were taken by using special flat professional targets located next to the buildings. Thanks to this, during the post-processing of the point clouds acquired by the two scanners, these could be transformed to one coordinate system, based on adjustment points (targets). Additionally, during the measurements, parts of the walls were intentionally flooded by tap water in order to simulate moisture in both buildings. These tested areas were named area 1 and area 3 for the first and second building, respectively. This procedure enabled us to see a change in the recorded intensity values of the laser beam caused by a change in the saturation of the building wall.

4. Results and Data Post-Processing

Dedicated software suites (Cyclone v.9.0, Z+F LaserControl v9.1 and CloudCompare v. 2.10.2) were used for the post-processing of the acquired datasets. Firstly, datasets were standardized to eliminate the effect of the incidence angle and distance changes on the value of intensity. Two approaches for the correction of laser scanning intensity data can be found in the literature: data-driven and model-driven correction [40,41]. In this investigation, model-driven correction was used. Finally, the intensity values were corrected using the following formula [42,43]:
I n o r m = I r a w ( R R r e f ) 2 ( 1 c o s ( α ) )
where I r a w is the raw intensity value, I n o r m is the normalized intensity value, R is the range between the sensor position and target, R r e f is the user-specified reference distance, and α is the incidence angle.
The point clouds collected by two scanners were registered in one local coordinate system. The spatial registration errors were always less than one millimeter. Such pre-prepared datasets were exported to *.ptx files and further analyzed in the context of saturation change analysis and biological corrosion change analysis of the walls.

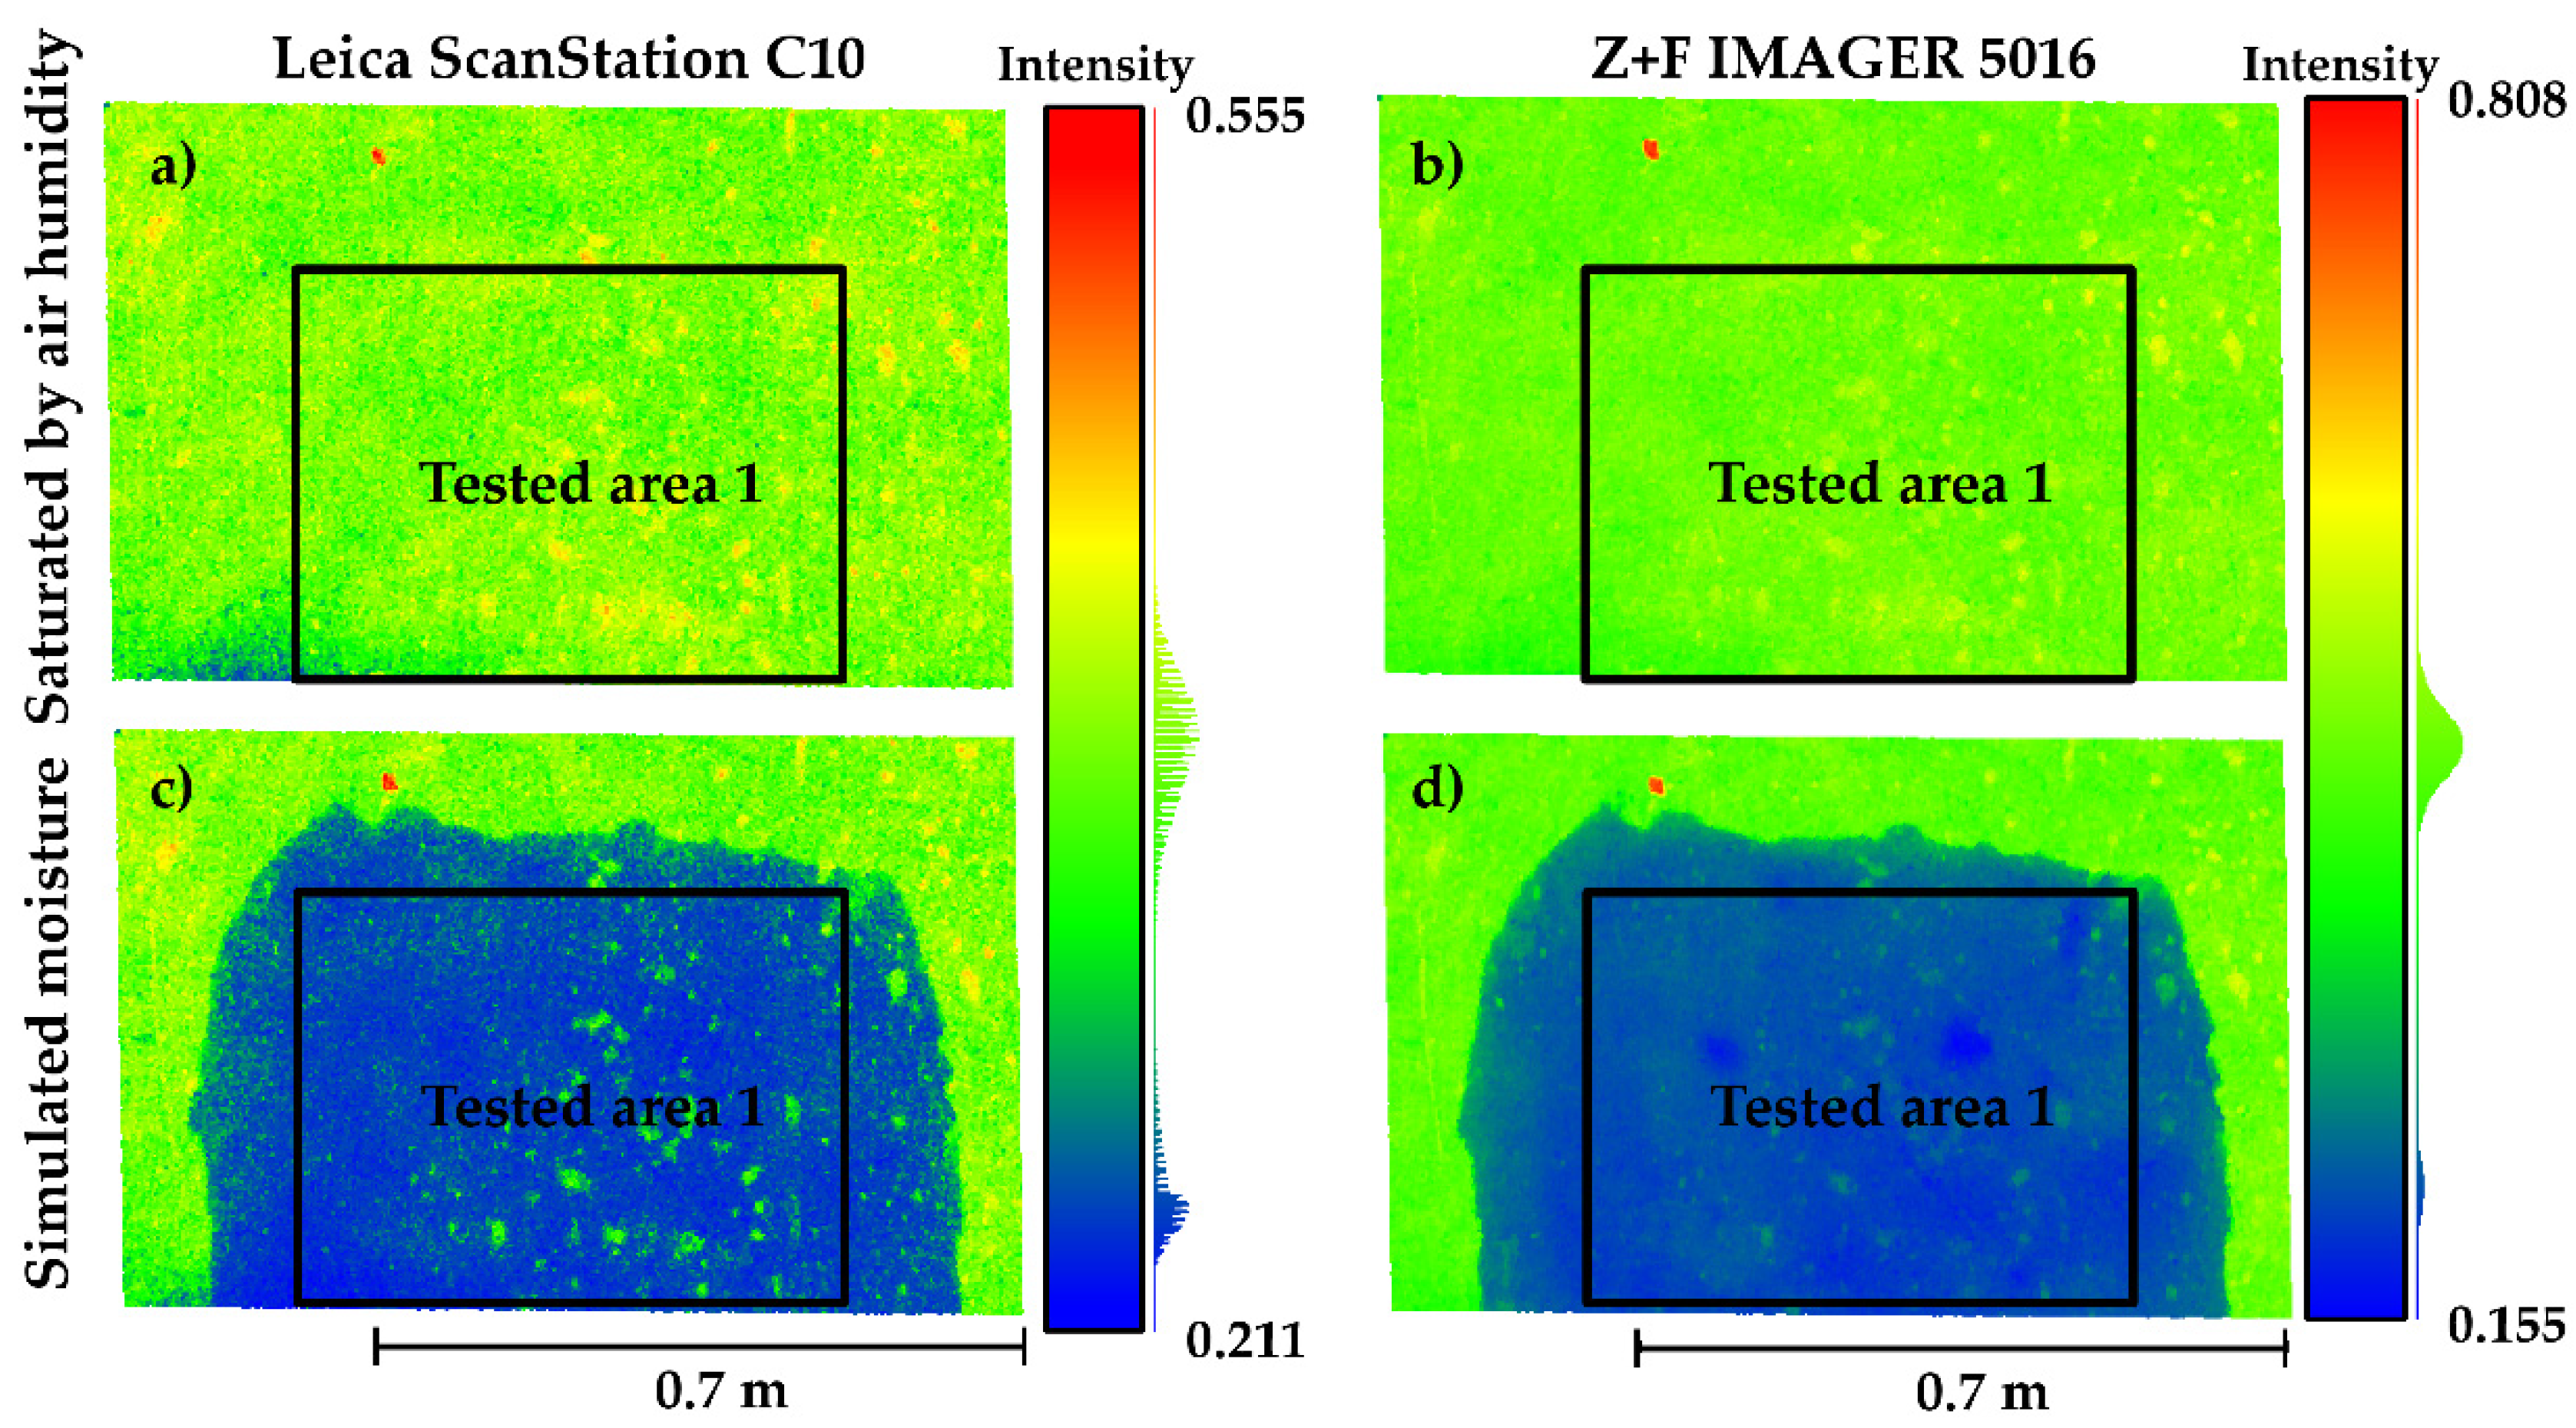
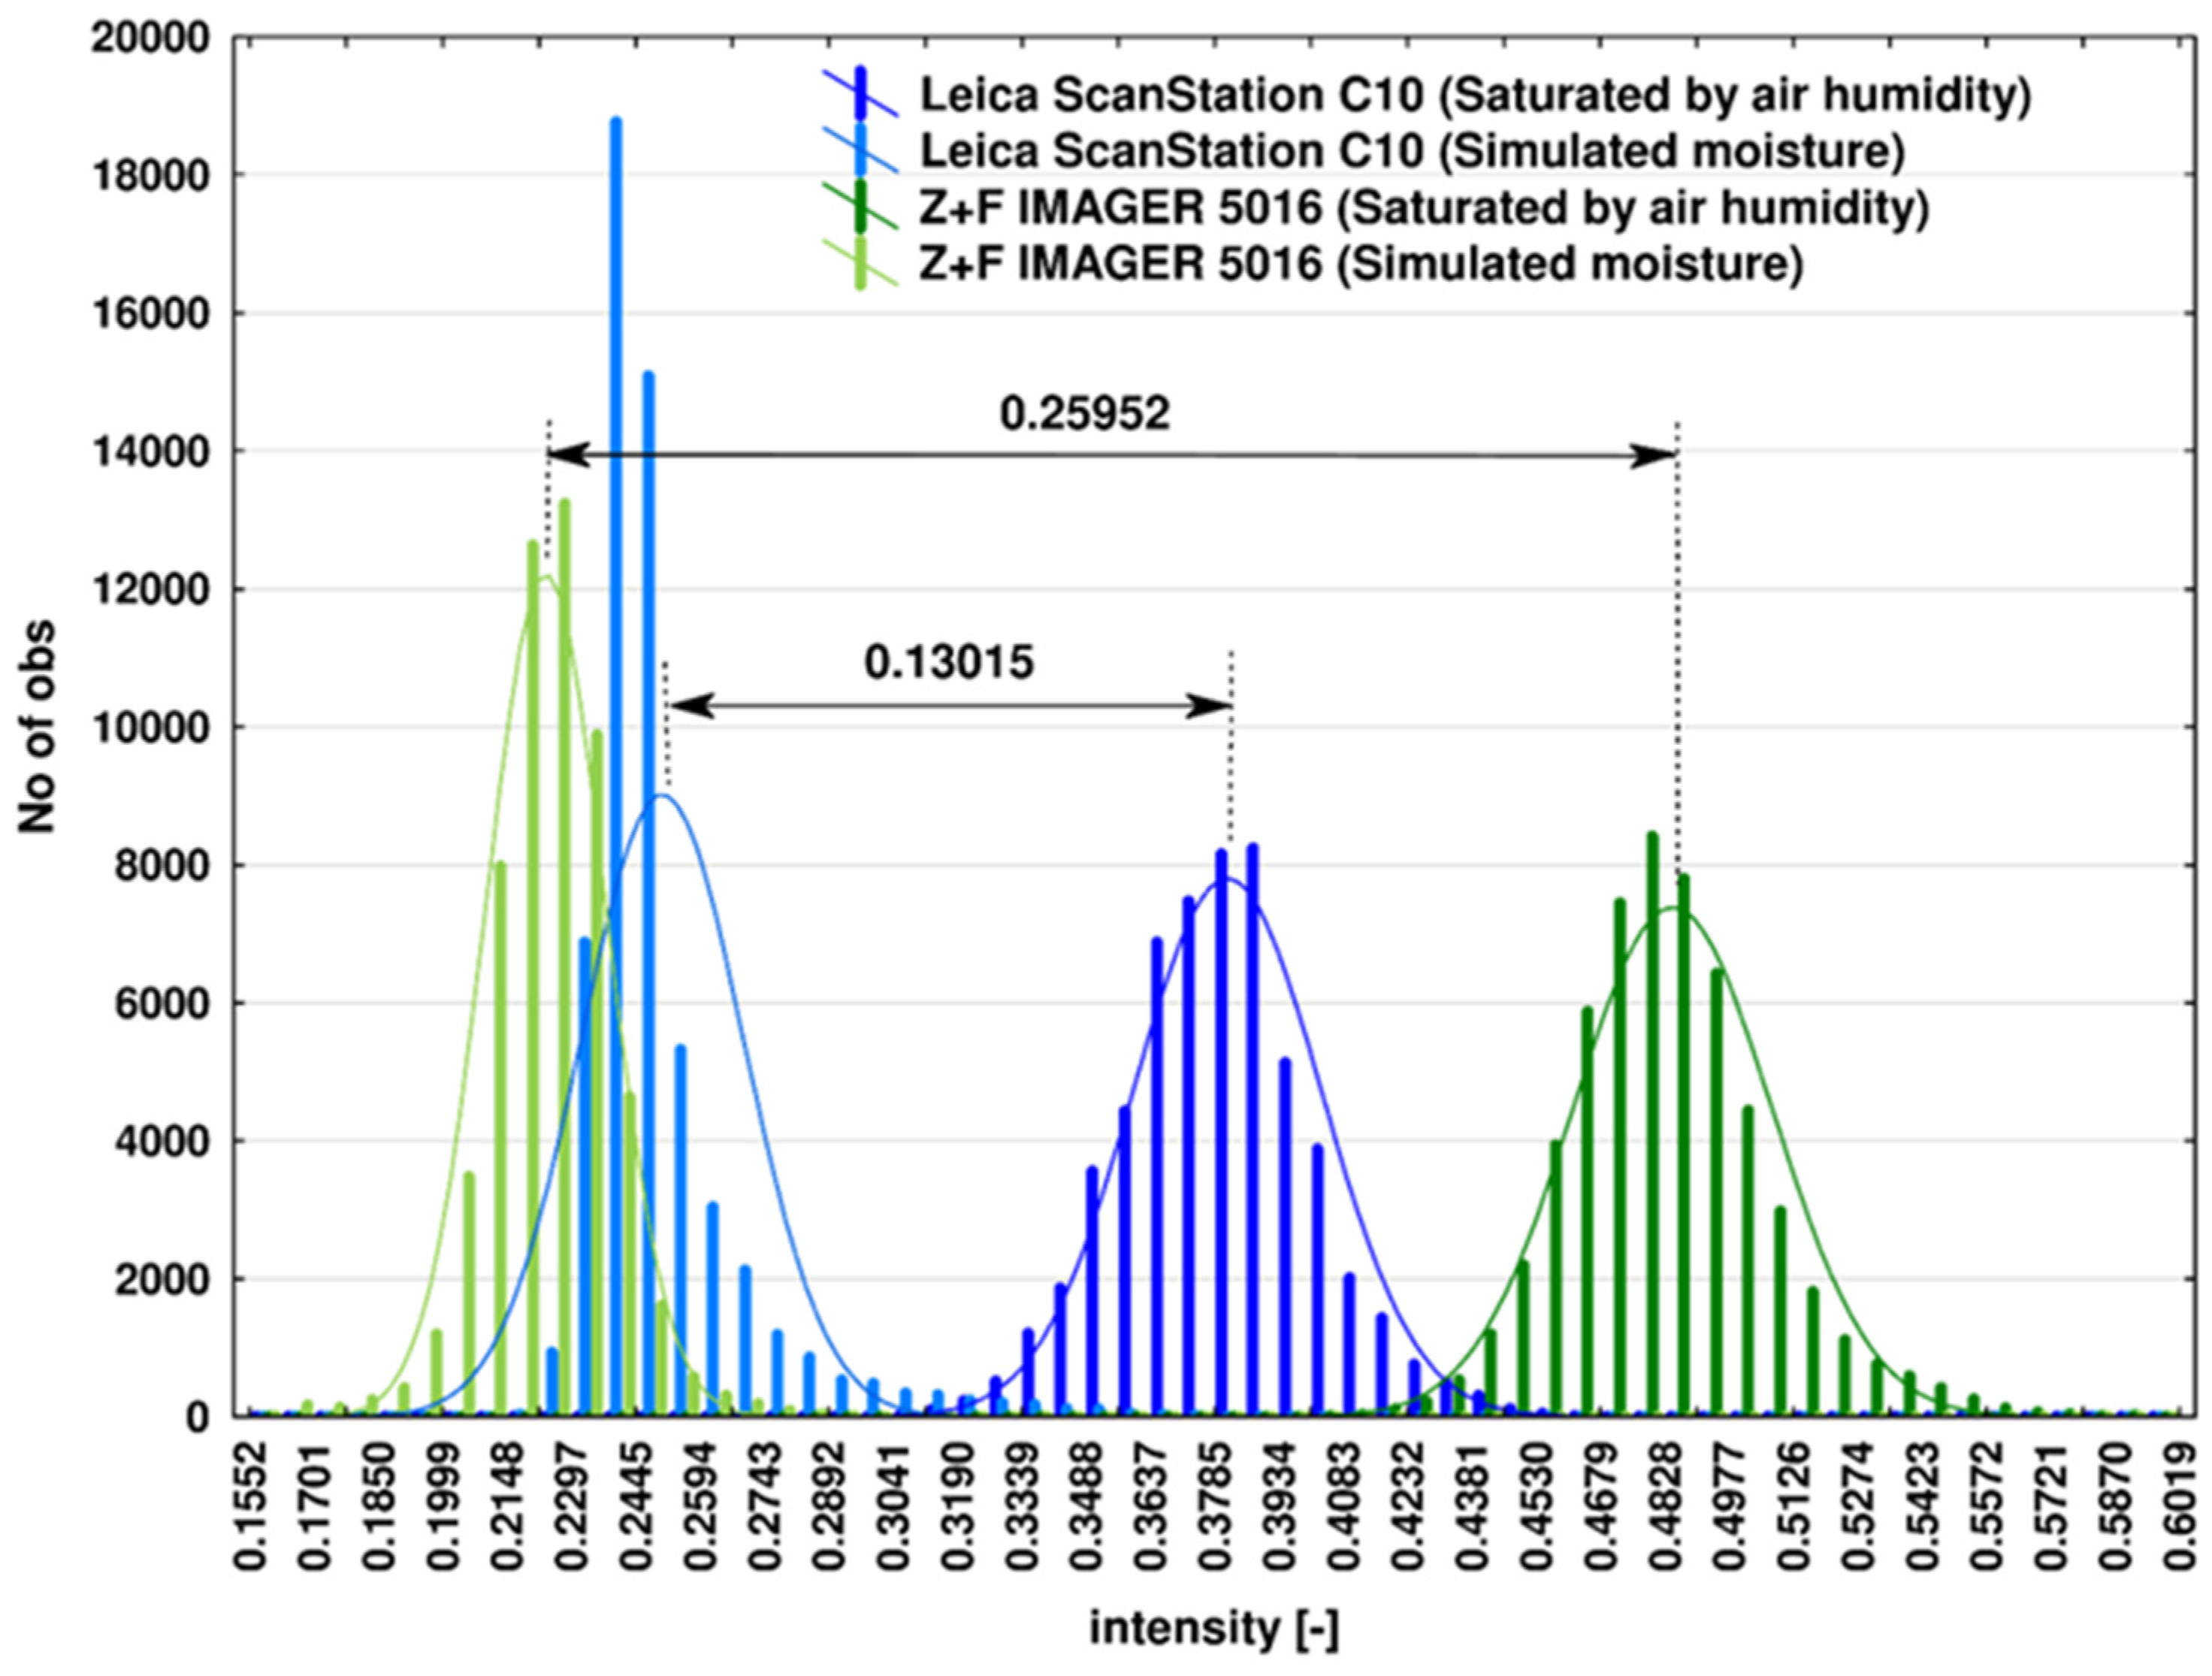
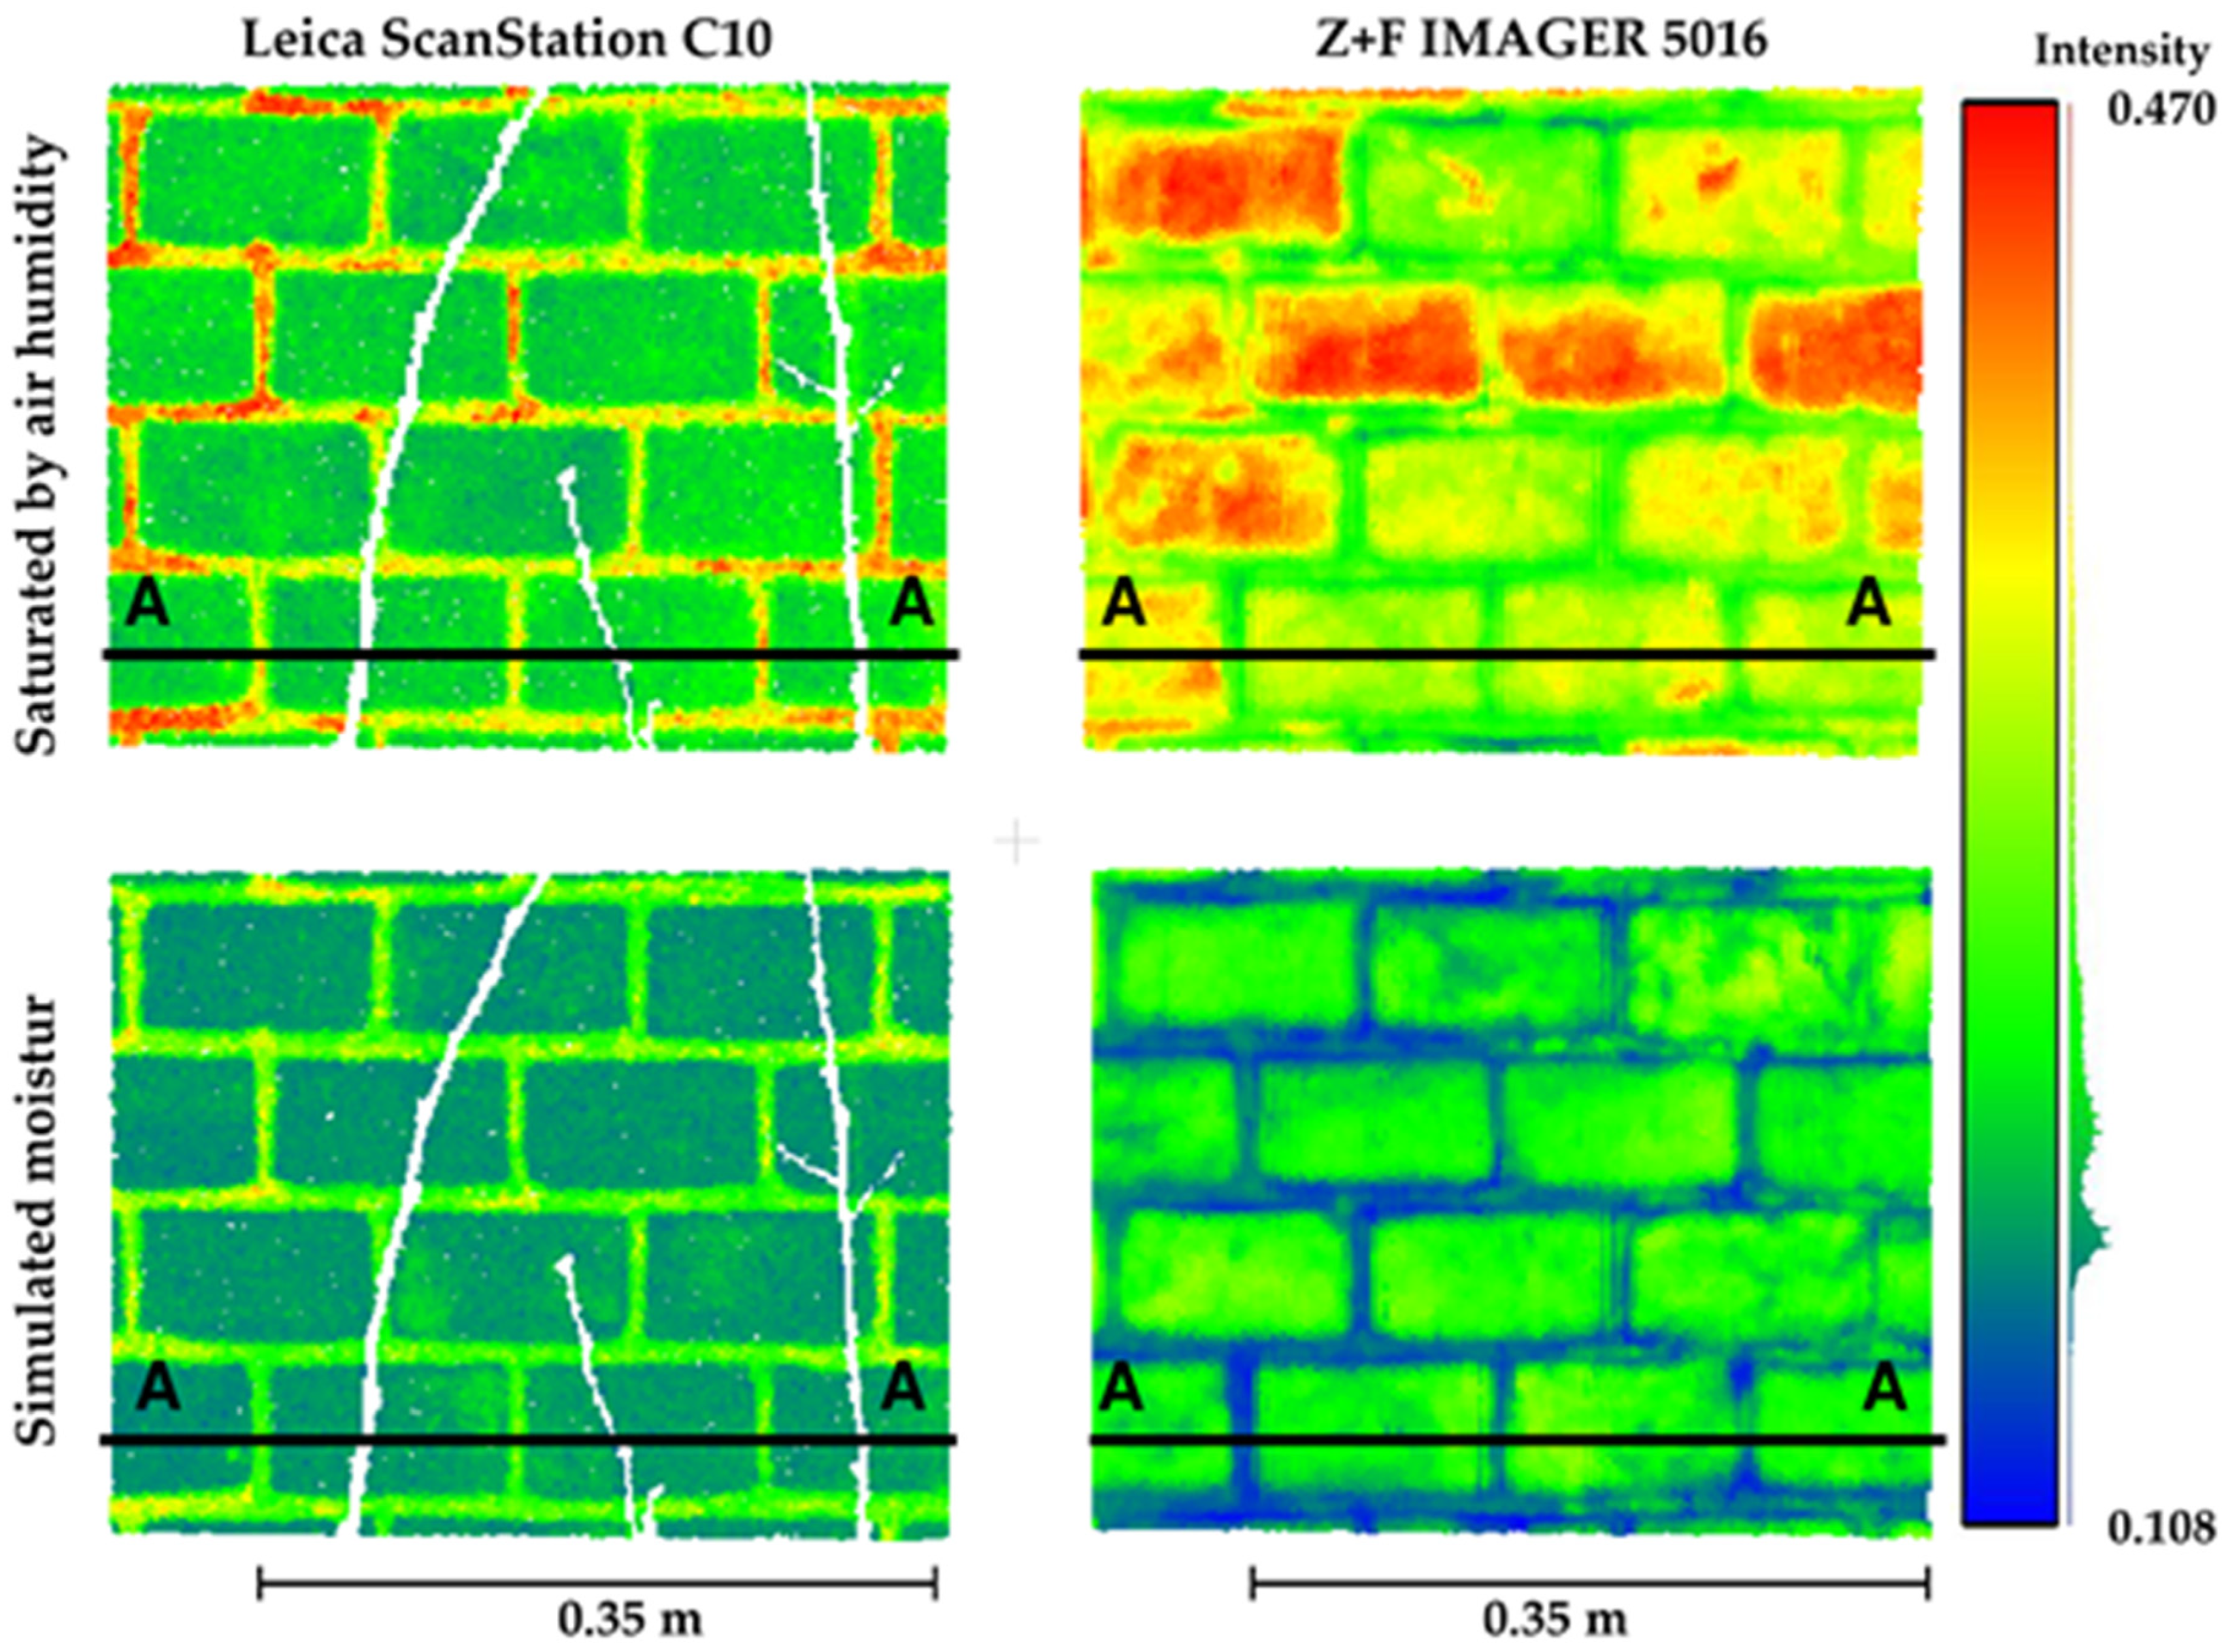
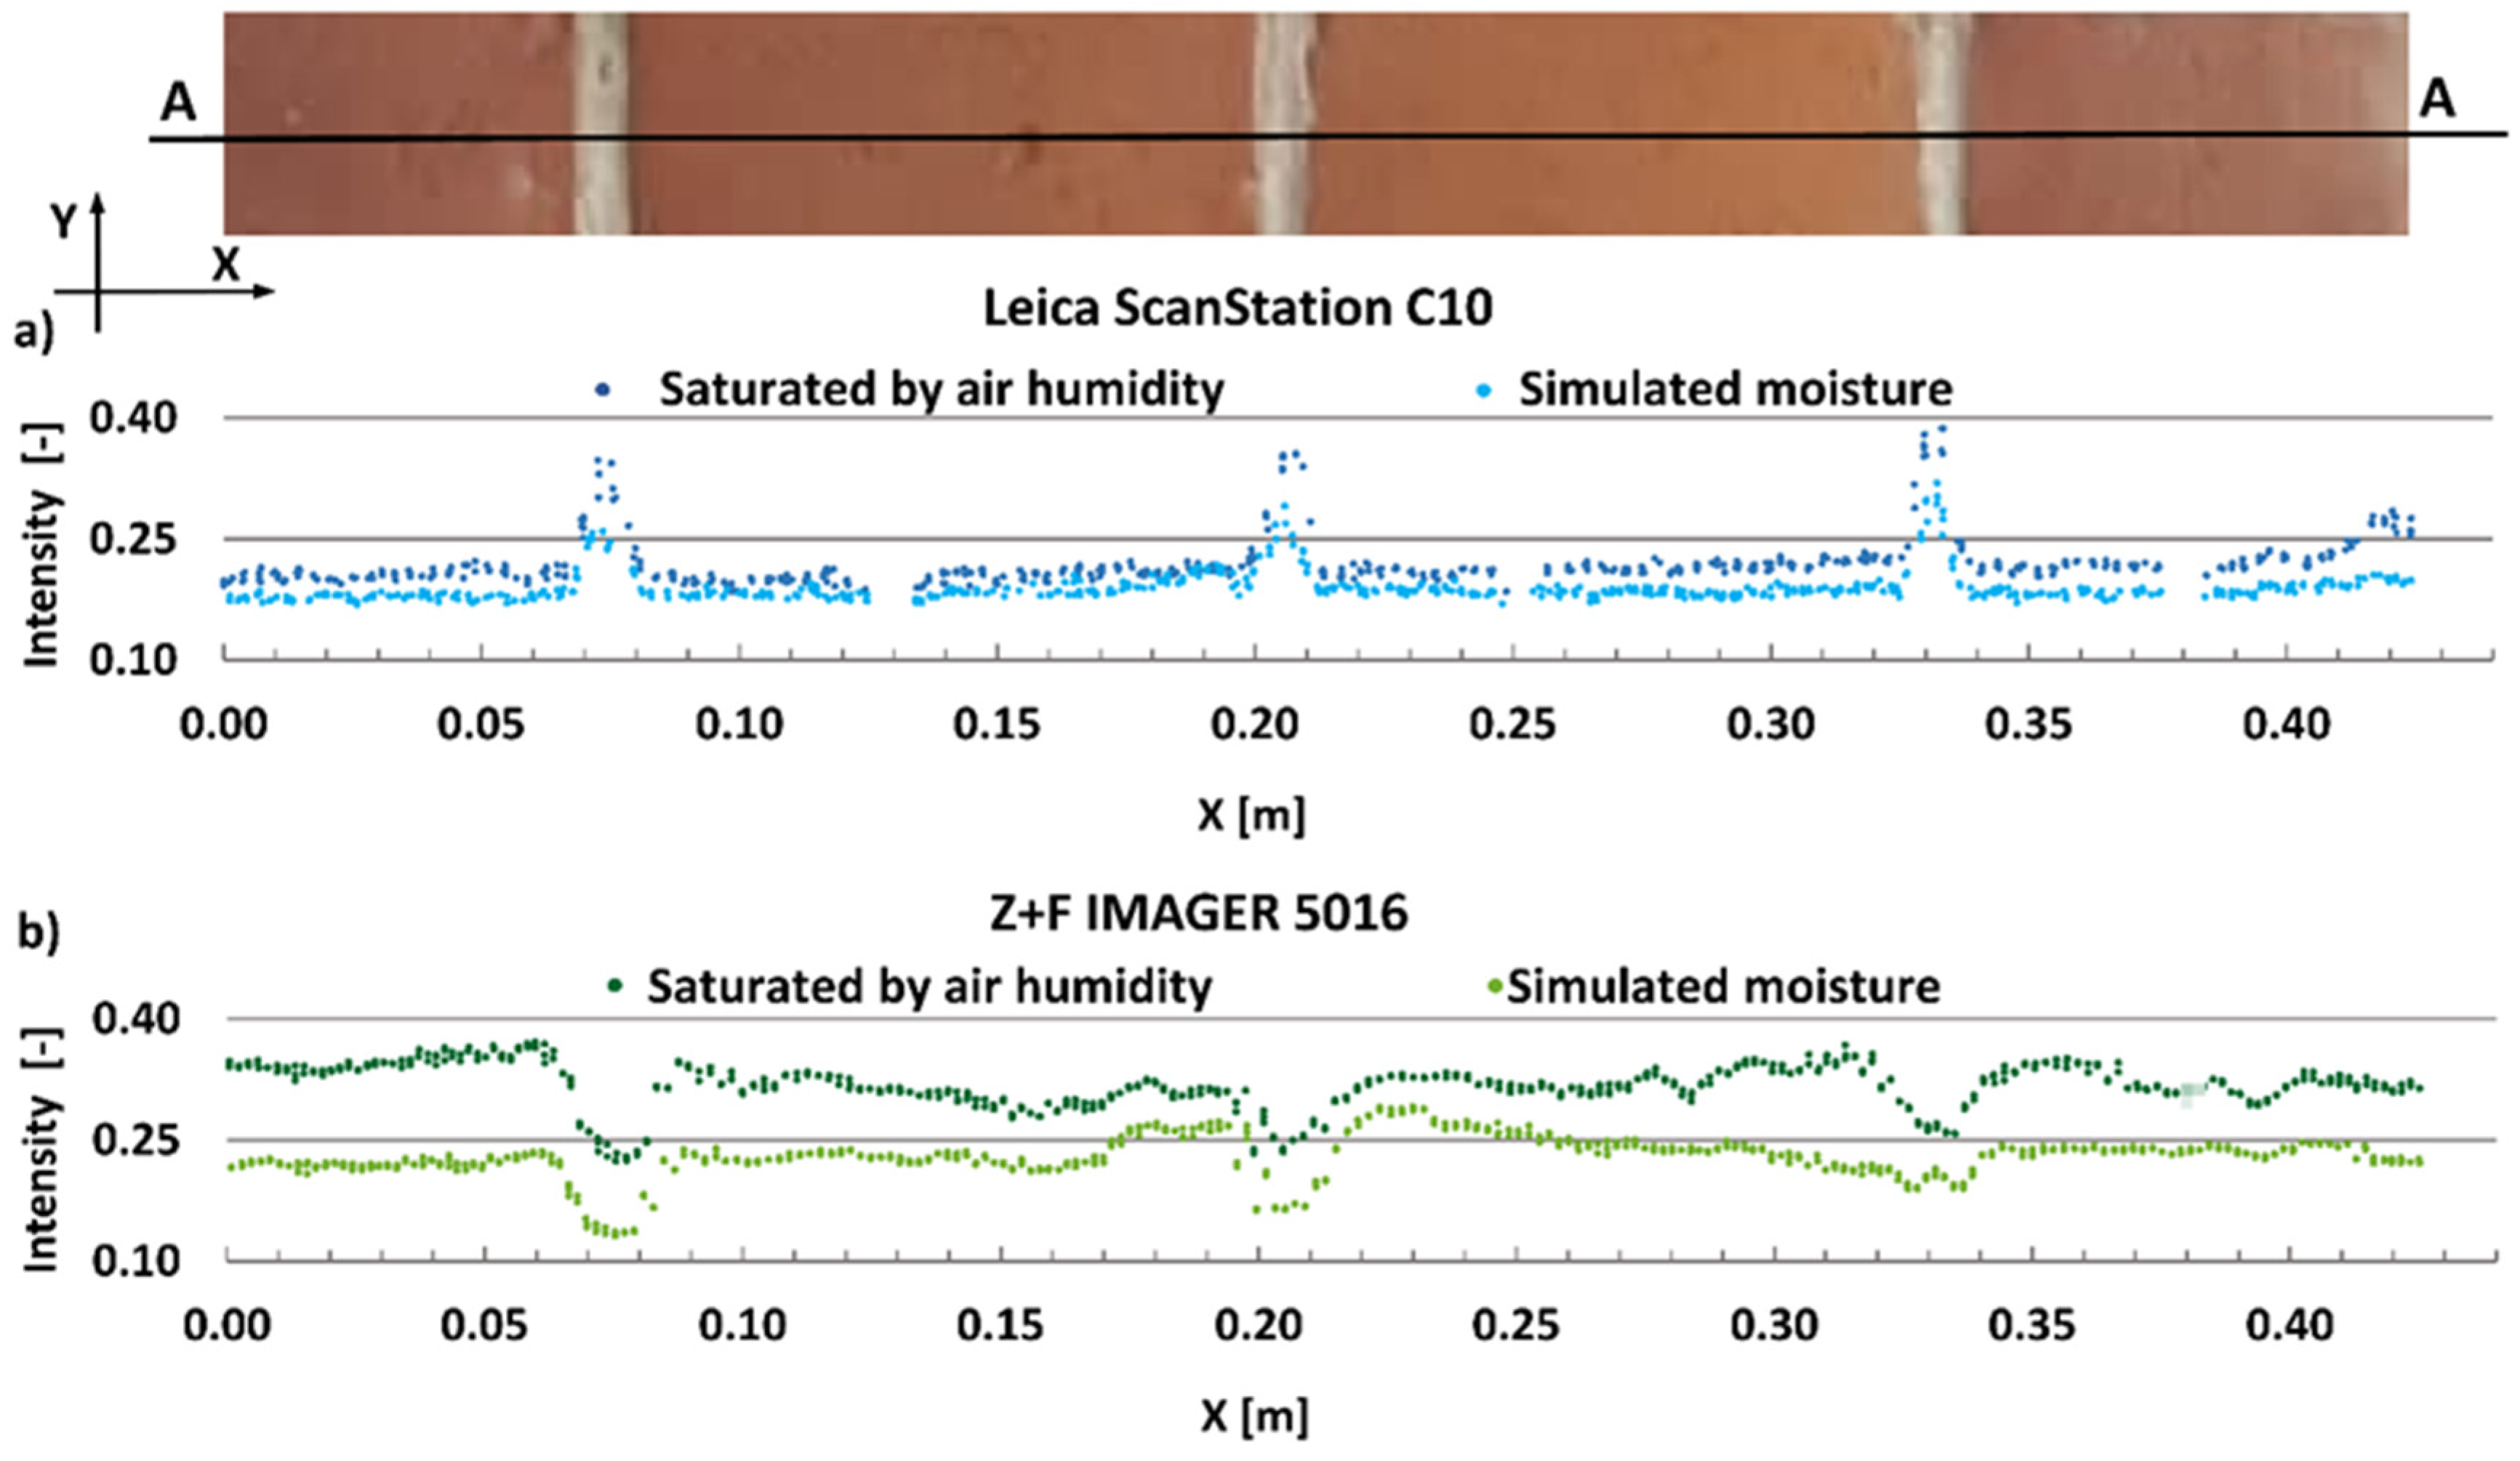
4.1. Analysis of Wall Saturation and Its Changes

Datasets captured by the two types of TLSs (TOF and PS) were compared. Point clouds for area 1 and area 3 in two states of saturation were analyzed and compared. Tested area 1 was a homogeneous area made of cement plaster. Tested area 3 was a section of a red brick wall. The intensity value of a scanned surface is directly associated with the reflectance of a material (see Equation (1)). Increased saturation of a building wall brings a higher absorption of the laser beam, which consequently decreases the intensity value. This phenomenon can be clearly seen in Figure 2, which shows tested area 1 with two states of saturation. The border between the area saturated by air humidity and the area intentionally saturated by tap water is very sharp (see Figure 2d). In the visual assessment, for the dataset acquired by the Z+F IMAGER 5016 scanner, this effect is slightly clearer than for the dataset acquired by the Leica ScanStation C10 scanner. For a more detailed analysis, the full set of available datasets for area 1, used to create the histograms, is presented in Figure 3.
The results of area 1 are characterized by two separate peaks, which represent different saturation states for the two scanners. The difference between the average intensity for the area saturated by air humidity and the area intentionally saturated by tap water is equal to 0.13015 and 0.25952 for the Leica ScanStation C10 and Z+F IMAGER 5016 scanners, respectively. In this case, the sensitivity of the Z+F IMAGER 5016 is almost double that of the Leica ScanStation C10. A greater range of intensity values for the tested area facilitates the detection of surface changes by the TLS.
The next example concerns changes in the intensity value of point clouds for red brick wall surfaces caused by different moisture levels. The results of the measurements of area 3 are shown in Figure 4. The analysis was performed with the help of a cross-section due to a heterogeneous surface (Figure 5).
The profile presented in Figure 5 is an example of the variations in the intensity values, depending on the two states of saturation of the red brick wall. One can see that the difference between the intensity value for saturation by air humidity and intentional saturation by tap water of the Z+F IMAGER 5016 scanner is significantly greater than that of the Leica ScanStation C10 scanner. The different intensity values obtained by the TOF and PS scanners may be affected by the wavelength of the laser beam, the power of the TLS emitter and the sensitivity of the TLS detector. Thus, similar to the previous example, changing the moisture of the building wall had a greater effect on the radiometric information of the point cloud obtained by the Z+F IMAGER 5016 than the Leica ScanStation C10. The radiometric value of the laser beam was much higher on mortar joints than on the red brick for the point clouds obtained with the Leica ScanStation C10; it is the opposite for the Z+F IMAGER 5016.

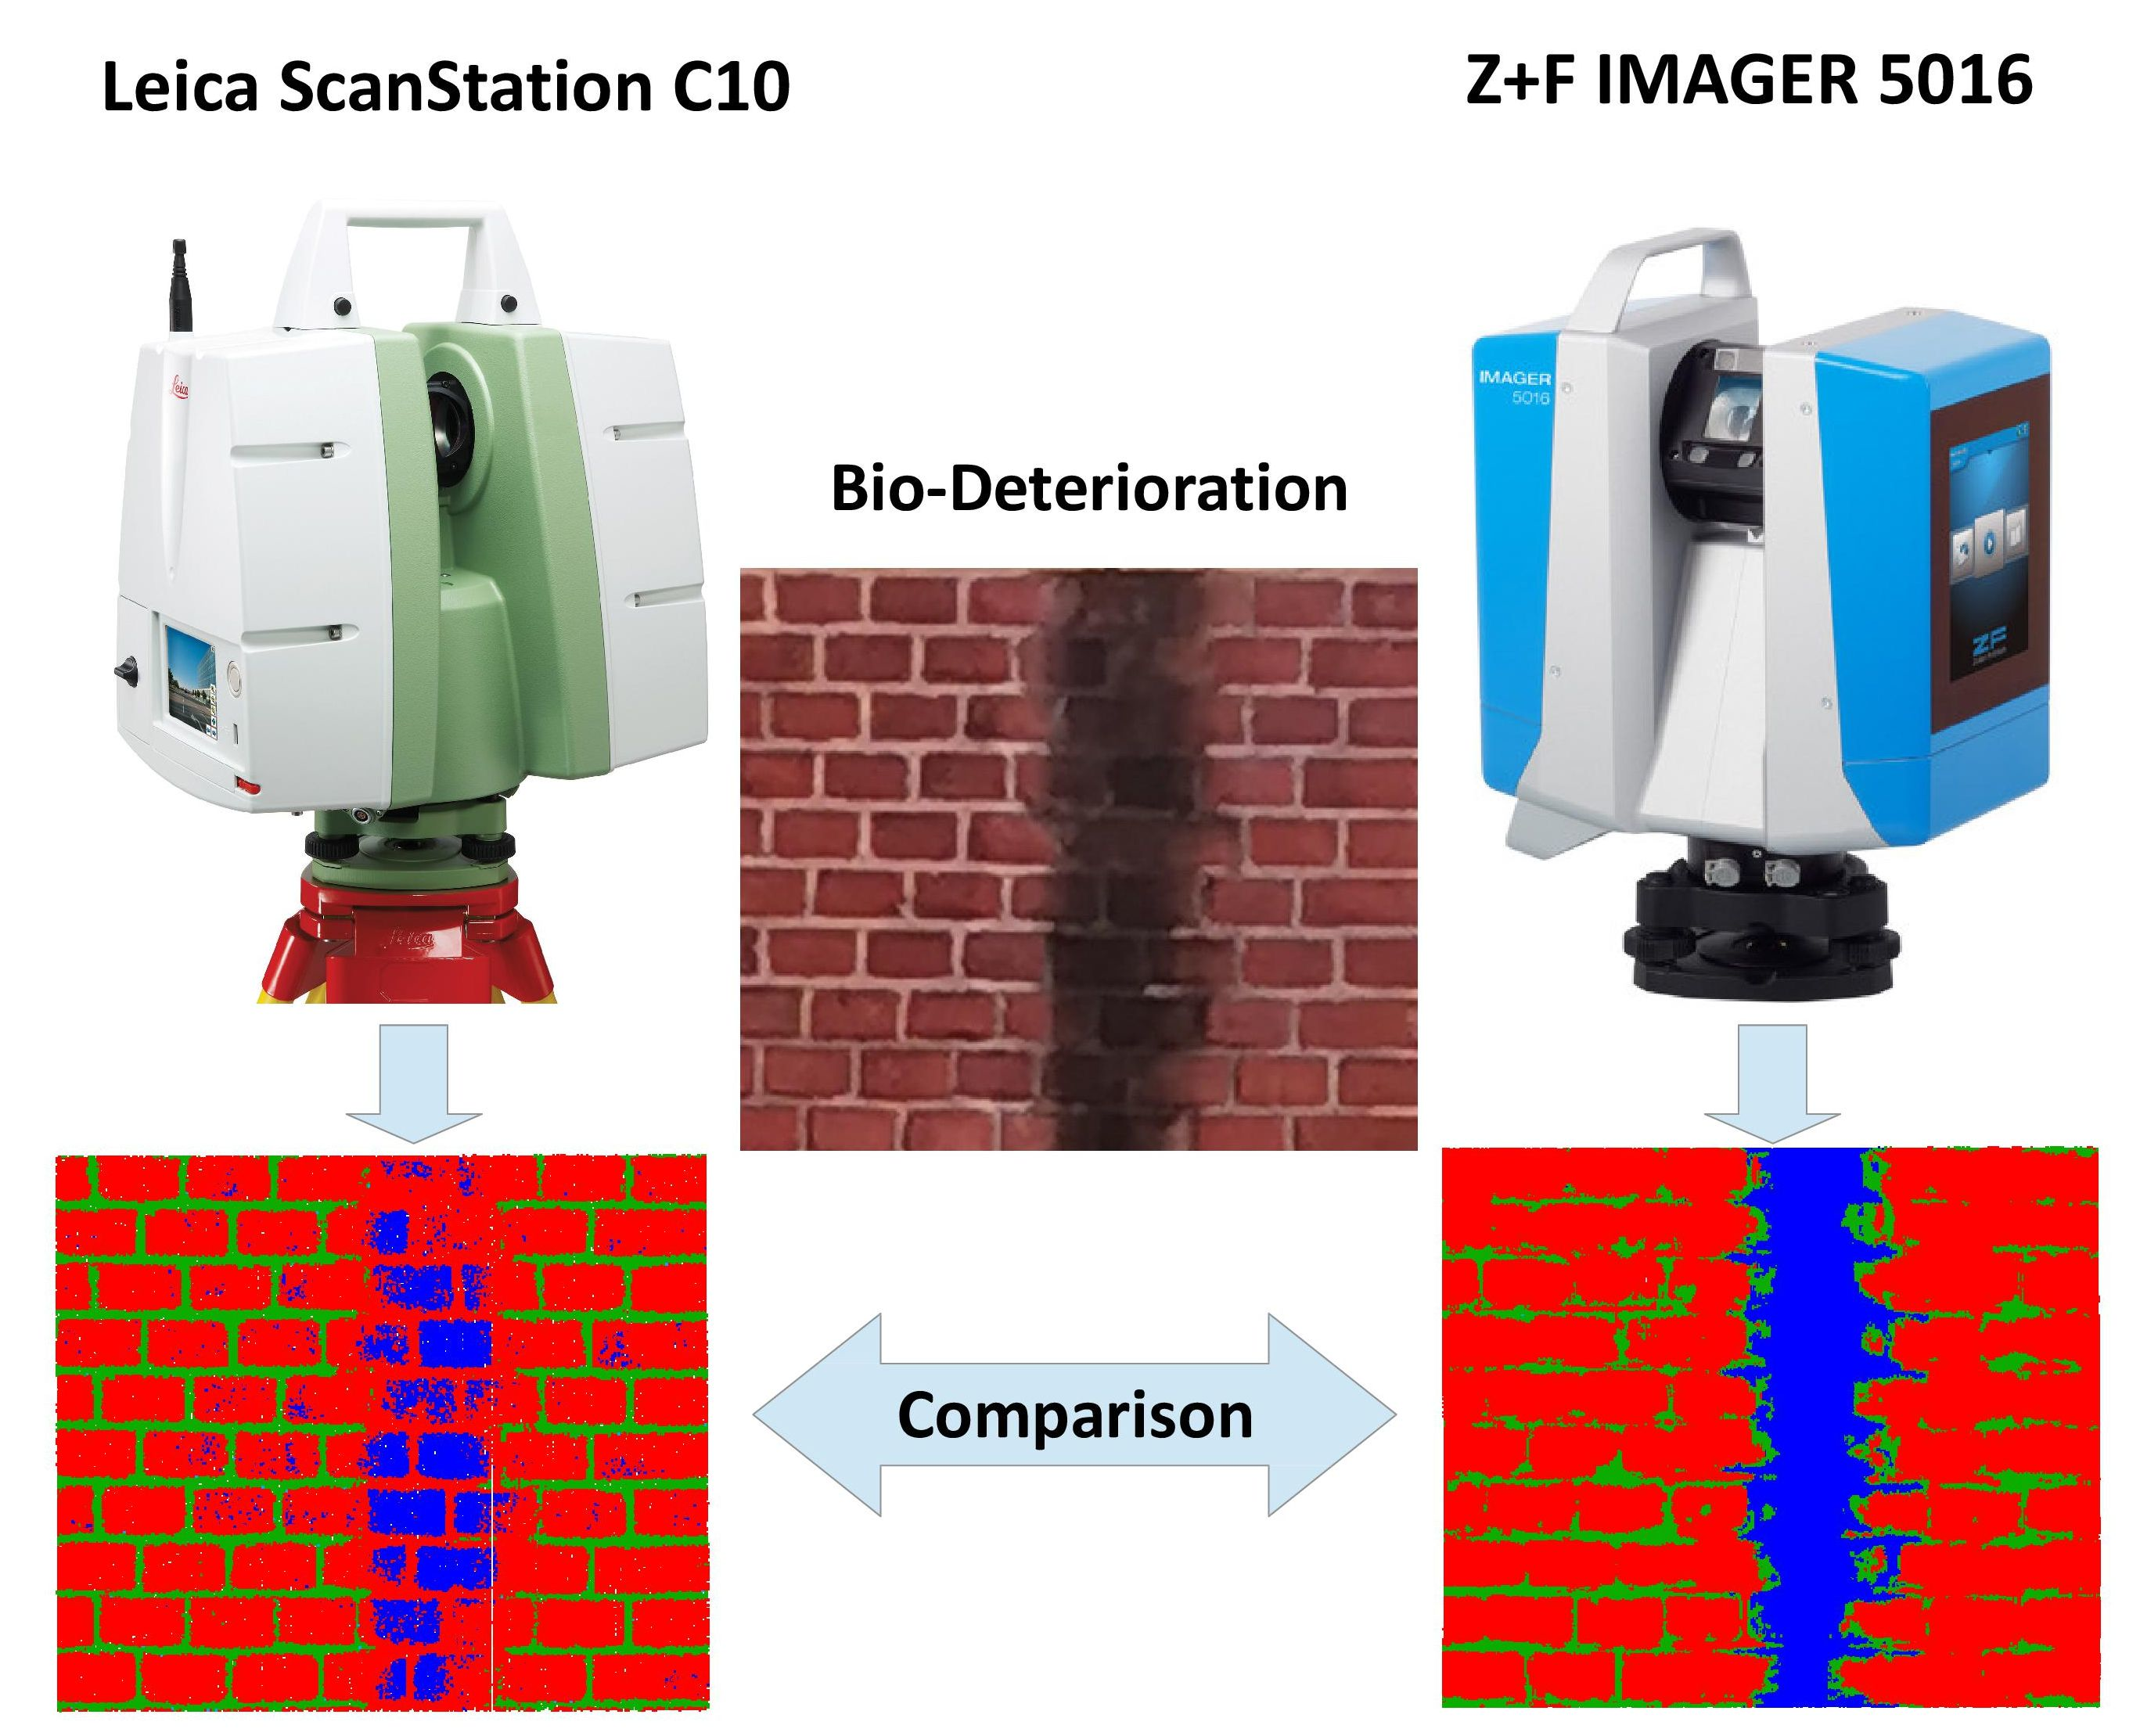
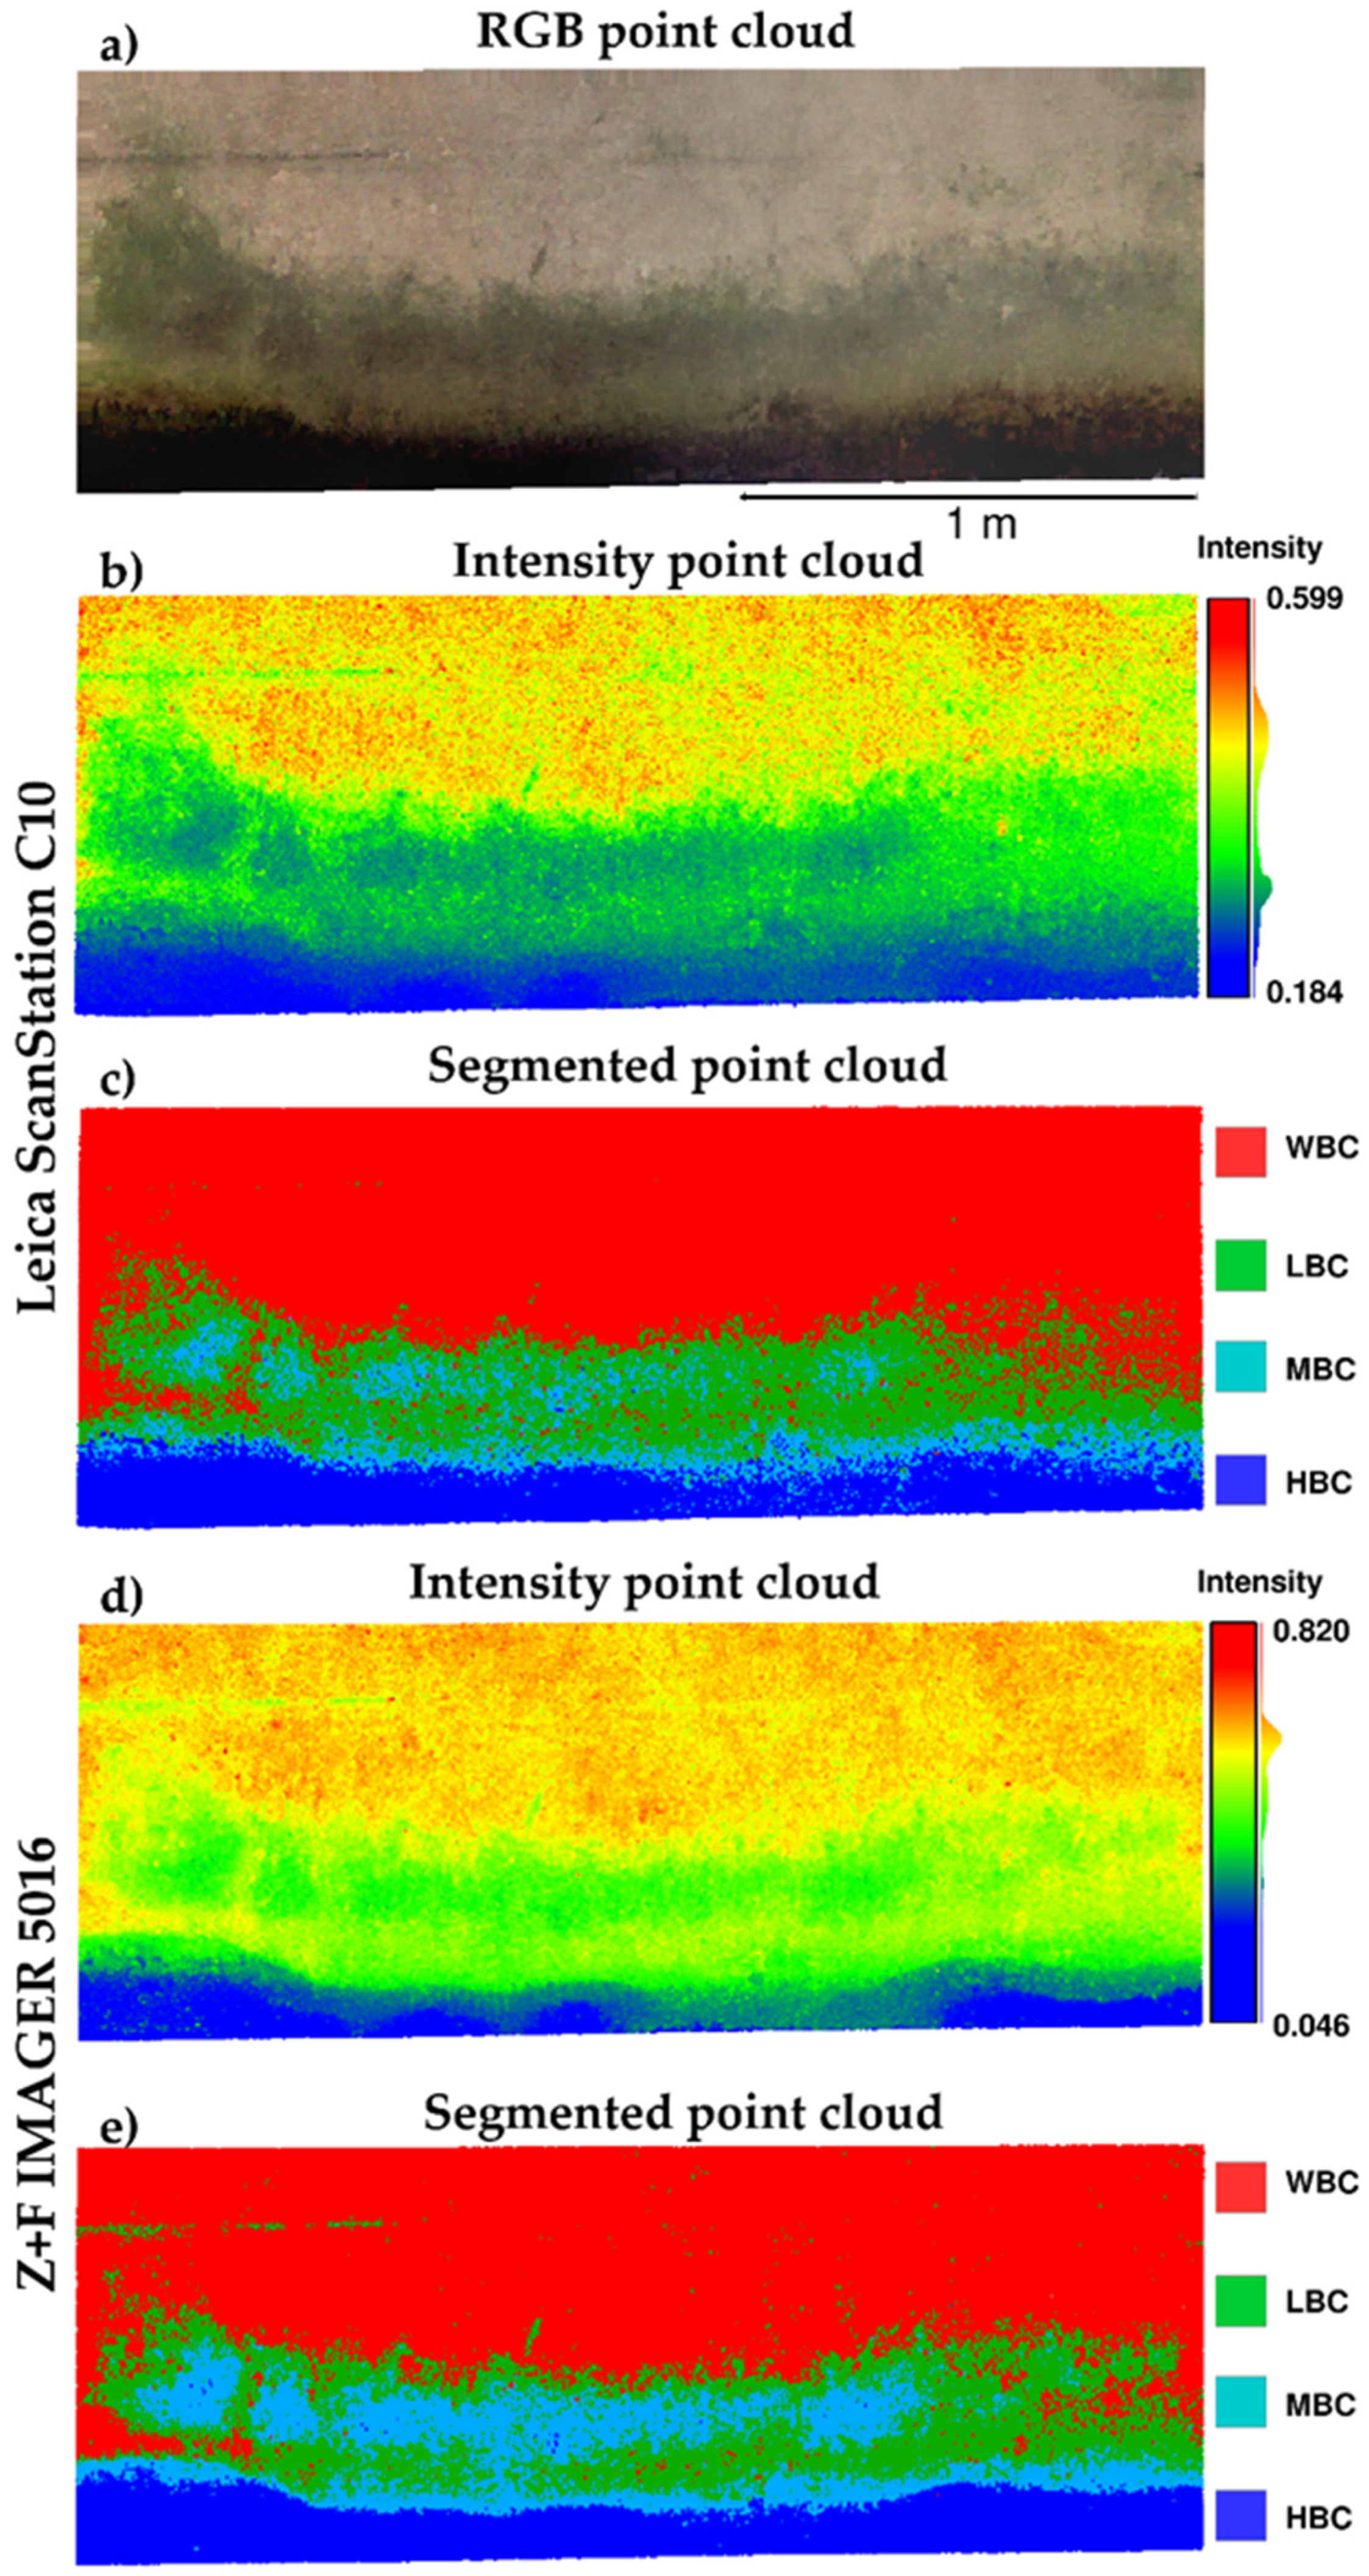
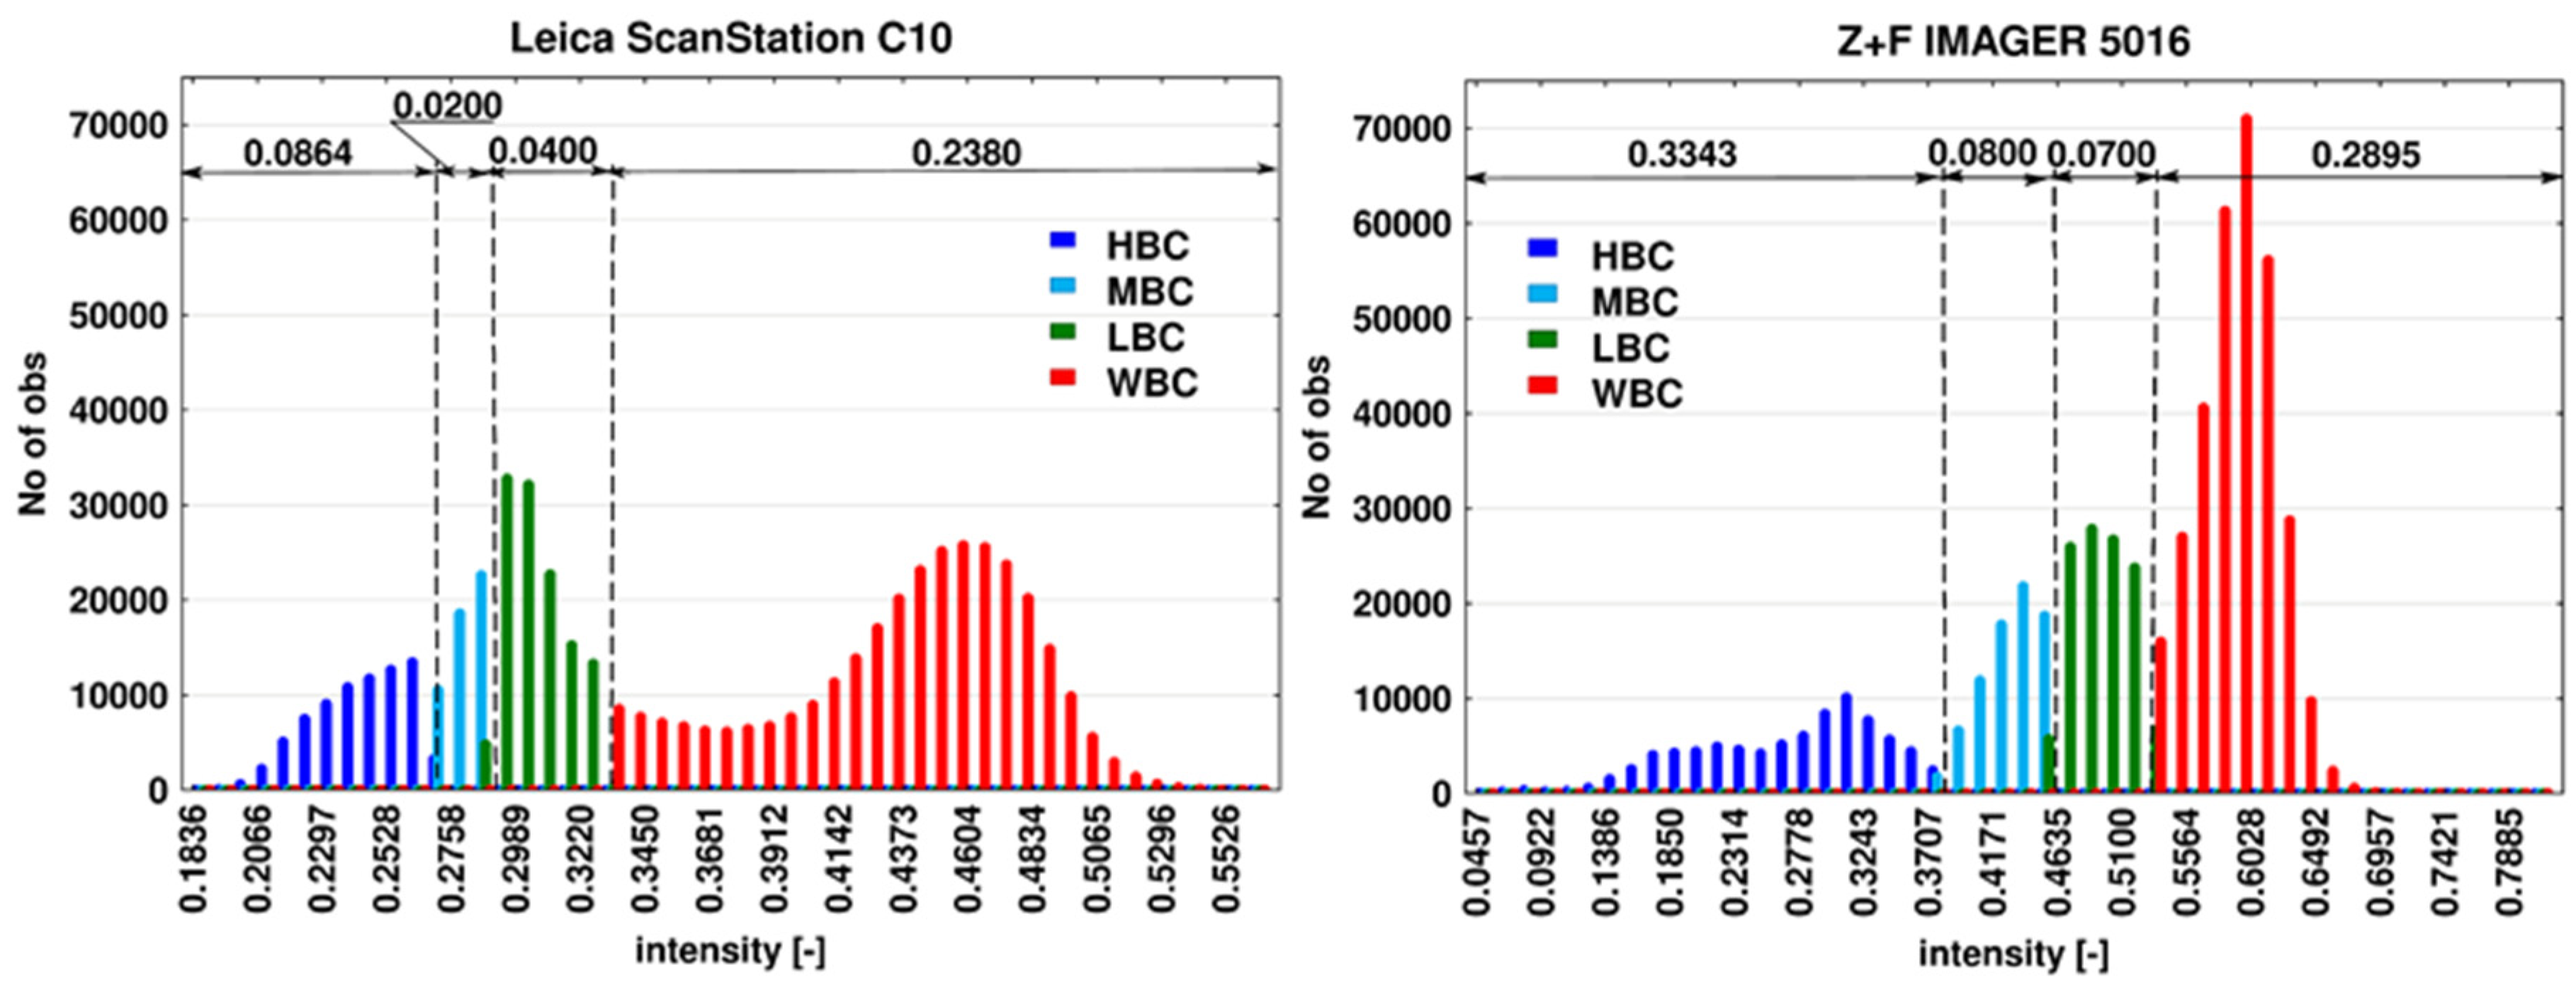
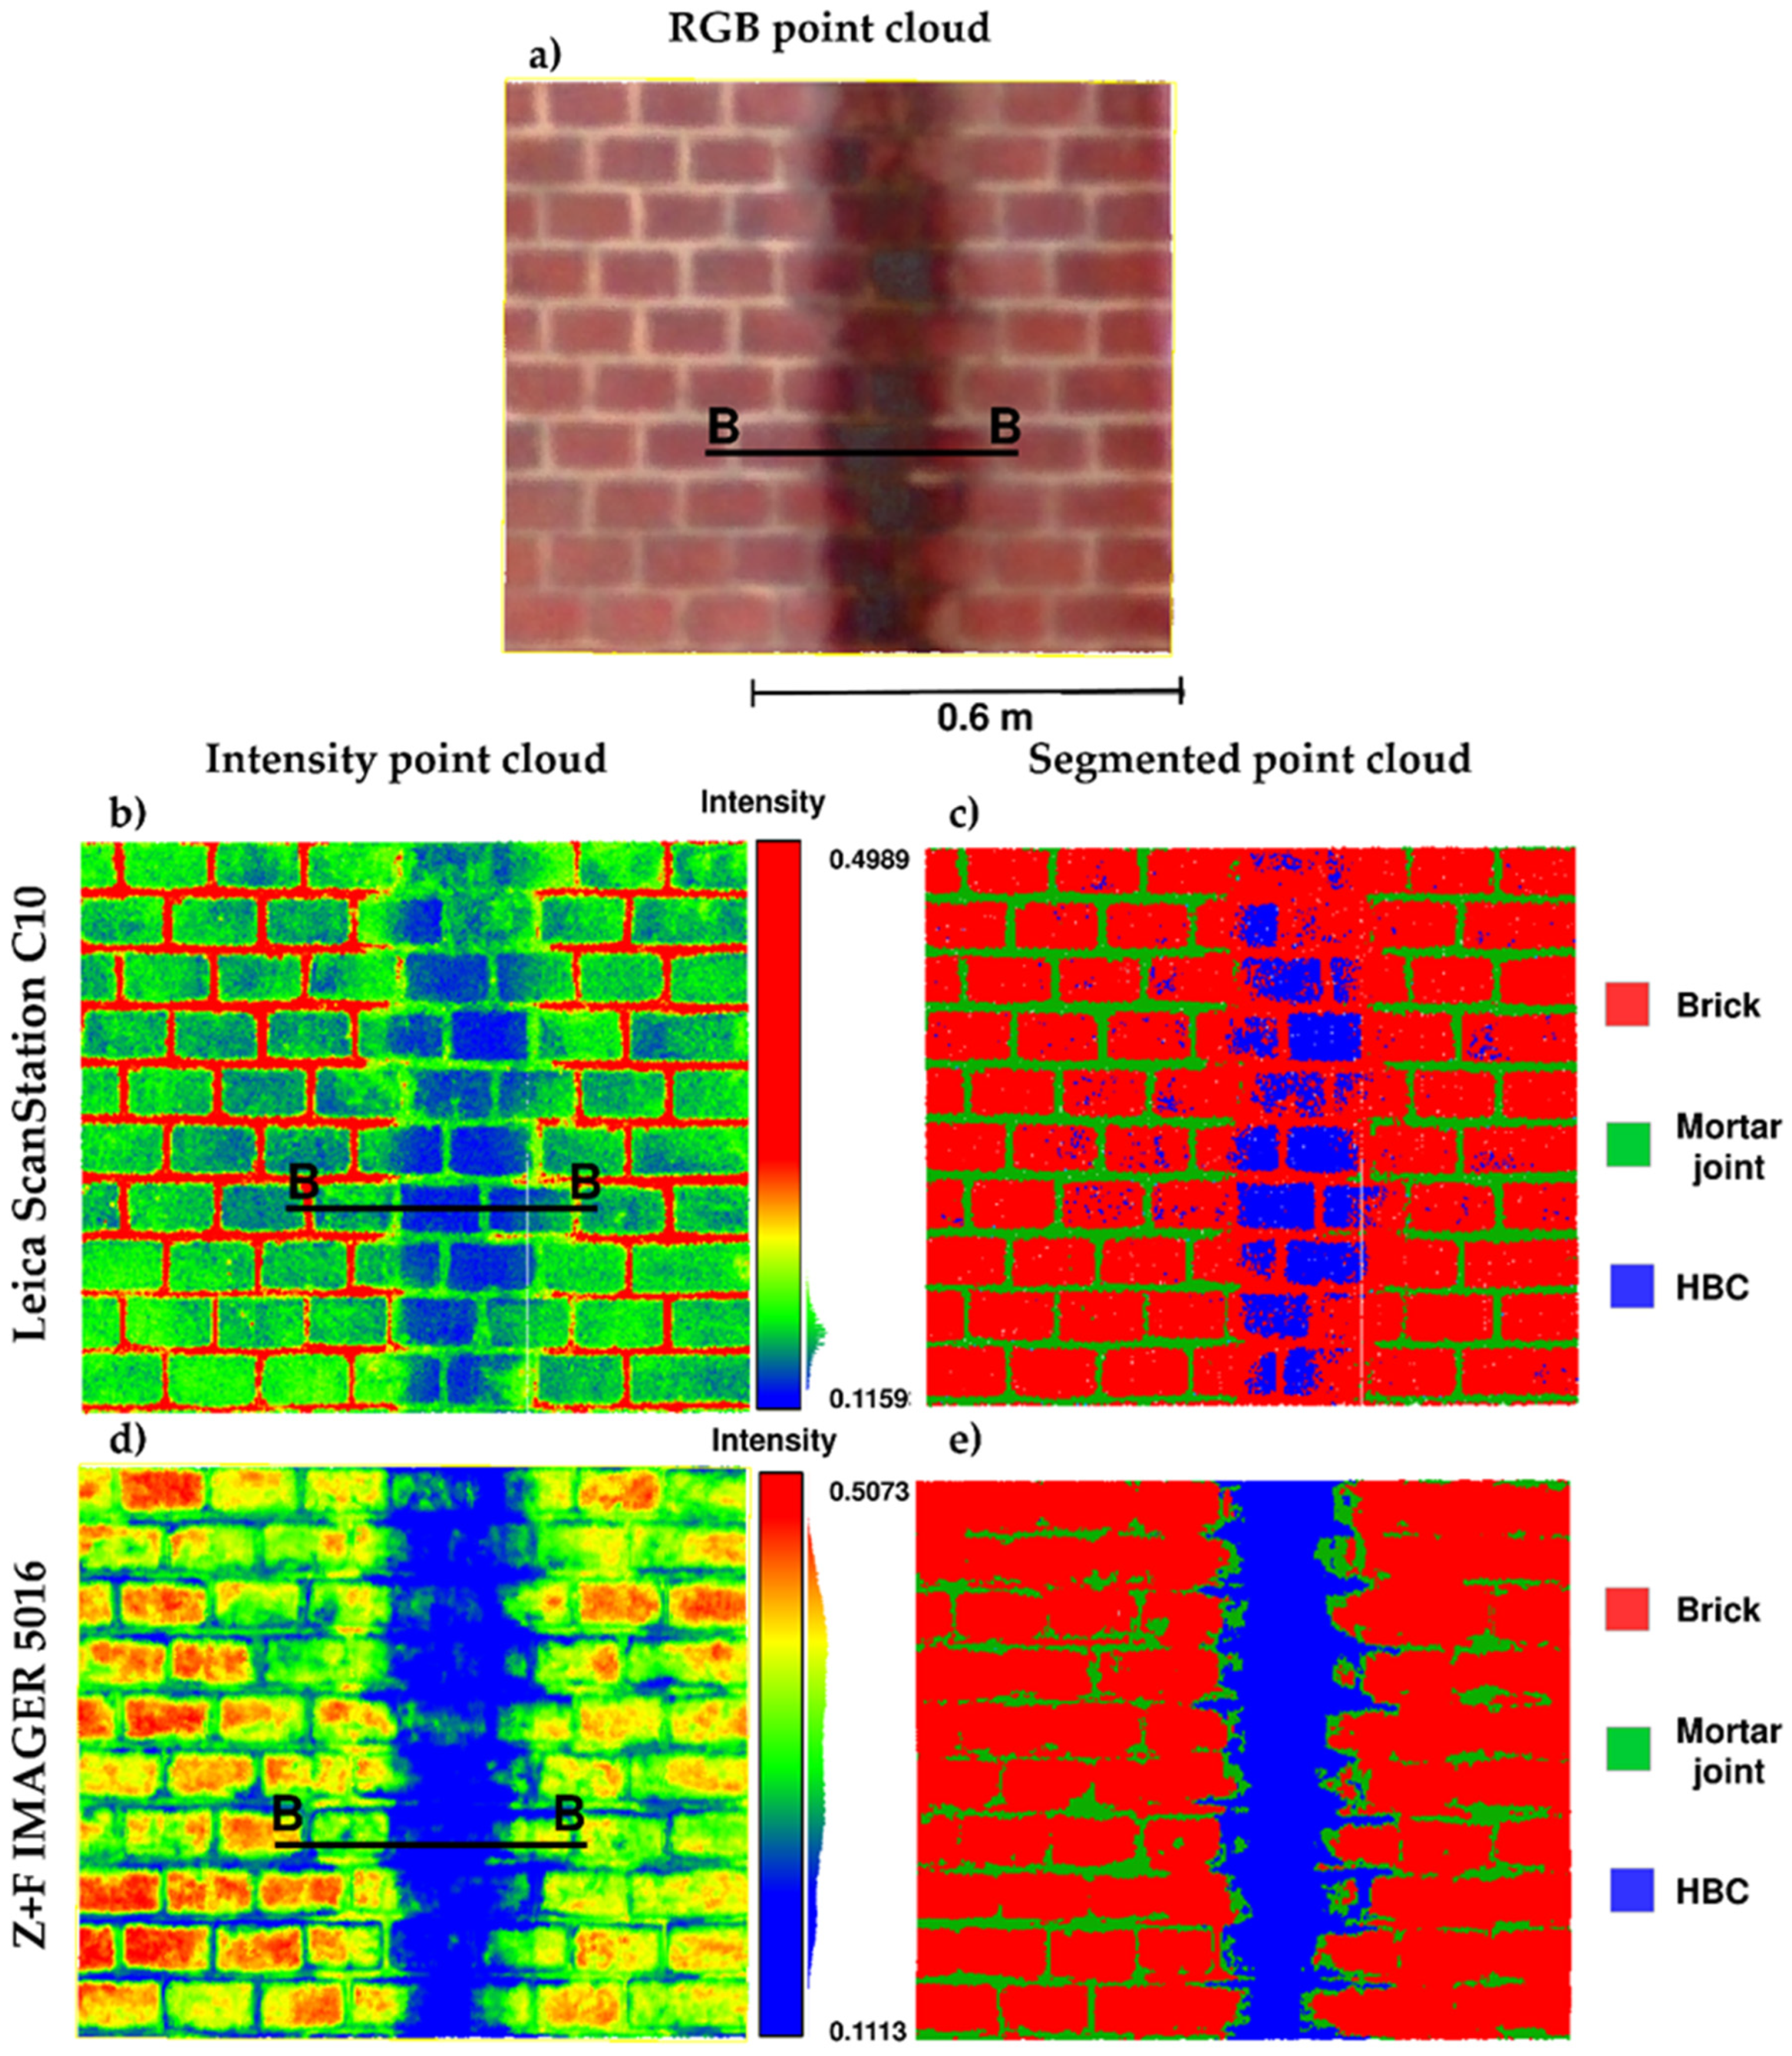
4.2. Analysis of Wall Biological Corrosion and Its Change

Biofilm covering the surface of a building wall is a common symptom of technical deterioration usually caused by a lack of proper maintenance or the deterioration of insulating materials. Thus, the detection of biological corrosion of a wall is a very important issue in the complex diagnostic measurement of buildings and structures. In this section, datasets captured by the TOF and PS scanners, focusing on detection of wall biological corrosion, were compared. The intensity values of point clouds for area 2 and area 4, captured via two scanners, were analyzed. Microorganism colonization of the wall surface caused a change in the reflection properties of this surface. Such a change affects the absorption and dispersion of the laser beam, which finally affects the power of the reflected and registered laser beam by the TLS sensor. This phenomenon can be clearly seen in area 2 and area 4. Based on the analysis of the point clouds by intensity value, manual classification was performed. In the area where a biofilm occurs, the intensity changes. Therefore, we attempted to digitally identify areas with biological degradation.
The first example was a wall covered with cement plaster (area 2). Biological corrosion was visible on the bottom part of the wall. By analyzing the RGB point cloud (Figure 6a), one can notice a different degree of the biological corrosion process. It was decided to segment the point clouds into four groups: areas with high biological corrosion (HBC), medium biological corrosion (MBC), low biological corrosion (LBC) and without biological corrosion (WBC).
The full sets of available data were treated statistically and divided into four groups. As a result of this process, histograms were created (Figure 7). The mapping results for the segmentations are presented in Figure 6c,e.
Comparing the segmentation results by intensity value for both TLSs, one can see that the area with HBC has the lowest intensity value. The WBC area is characterized by the highest intensity value. Thus, the results prove that the increased surface degradation caused by microorganisms simultaneously causes greater absorption of the laser beam. It should be noted that the sensitivity to changes in the wall surface is different for the Leica ScanStation and Z+F Imager 5016 scanners; for instance, the range intensity value for the HBC area is 0.0864 and 0.3343 for the two scanners, respectively (a four-fold difference). A similar situation occurs for the MBC area. A slightly smaller difference between the two scanners (0.0400 and 0.0700) can be seen for the LBC area. The range of intensity values for the WBC area does not differ significantly (0.2380 and 0.2895). In this case, the Z+F Imager 5016 is more likely to detect different degrees of biological corrosion in the building wall than the Leica ScanStation.
The next example concerns the red brick wall with high biological corrosion caused by a damaged gutter. By analyzing the point cloud, we decided to segment the point clouds into three groups: brick area, mortar joint area and area with high biological corrosion (HBC). The results of this segmentation are presented in Figure 8. The classified intensity value distribution is presented in Figure 9.
By comparing the results of the point cloud segmentation between the two scanners (Figure 8c,e), one can see that the Z+F IMAER 5016 scanner more clearly highlighted the HBC in comparison to the Leica ScanStation C10 scanner. On the other hand, the mortar joint area was much better highlighted, based on the dataset captured, by the Leica ScanStation C10 than the Z+F IMAER 5016. Red brick and mortar joints have different physicochemical properties, especially regarding roughness and color. These factors strongly affected the registered intensity value by the scanners. The TLS laser spot size may also affect the intensity registration of a distinct border between two surfaces, especially narrow stripes such as mortar joints. For better insight into the datasets, an additional profile was prepared (Figure 10).
By analyzing the histogram, one can see that the HBC area is characterized by the lowest intensity value for both scanners. The recorded range of intensity values for the HBC area is 0.0254 and 0.1187 for the Leica ScanStation and Z+F Imager 5016, respectively (a four-fold difference). The achieved results are similar to the previous example. The Z+F Imager 5016 is more sensitive in the detection of biological corrosion in a building wall than the Leica ScanStation. The values of the recorded intensity for the red brick and mortar joint have the reverse order for the two scanners. Thus, the sensitivity of the laser beam to changes in the scanned surface is slightly different for both scanners.
The profile presented in Figure 10 shows the distribution of the intensity values of the point cloud for part of a red brick wall with biofilm. It is clearly visible that, in the area where biofilm occurs, the intensity value decreases significantly for the data obtained with the Z+F IMAGER 5016 scanner. With the Leica ScanStation C10 scanner, the decrease in intensity is barely noticeable. The change in intensity value of the mortar joint is more noticeable for the data obtained with the Leica ScanStation C10 than the Z+F IMAGER 5016; the direction of change in value for the mortar joint is the opposite.

5. Discussion

TLS, apart from geometrical information, can provide information about the physicochemical properties of scanned surfaces (and their changes) based on an analysis of laser beam radiometry. Therefore, TLS is a good solution for the comprehensive diagnosis of architectural structures. In this study, we proposed the harnessing of TLS for the remote sensing and detection of saturation of building walls and microorganism colonization of a wall. Such changes usually cause serious maintenance problems and structural health issues in a building or structure.
The conducted research proves that changes in the physicochemical properties of a building wall (e.g., moisture and colonization of microorganisms) strongly affect the variation in the intensity values of point clouds captured by TLS. The saturation of building walls and biological corrosion can be successfully detected by TLS. As a result of testing two types of scanners (PS and TOF), it turned out that the phase-shift scanner was characterized by much higher sensitivity in recording changes in wall moisture and biofilm detection than the time-of-flight scanner. On the other hand, the Leica ScanStation C10 scanner registered the borders between bricks and mortar joints in the brick wall in a much clearer manner than the Z+F IMAGER scanner. It should be noted that more detailed radiometric data can influence the efficient segmentation and classification of point clouds. Keeping in mind that PS scanners can capture data faster and usually with higher accuracy than TOF scanners, it can be assumed that the PS scanner is better suited for the complex diagnosis of buildings and structures. Its limitation is its range of measurement, which is currently around 300 m. Nevertheless, this range is quite sufficient for various diagnostics of buildings and structures.
The remote detection of changes on the surface of a building wall by TLS is a great improvement in diagnostic and inventory measurements for building information modelling (BIM). Full information about the technical condition of a building is extremely important for BIM. Point cloud radiometric analysis helps to improve the performance of detecting moisture movement and the growth of microorganisms on a building wall. Detecting such changes is of fundamental importance for monitoring the technical state of historical buildings. The proposed radiometric point cloud analysis can be used by building managers, monument conservators, security professionals, and specialists dealing with repair service valuation.
A detailed automatic or semi-automatic methodology for the post-processing of point clouds to detect the bio-deterioration of buildings should be developed and tested in the future.

6. Conclusions

The conducted research program allows us to draw the following conclusions:
The phase-shift scanner is characterized by much higher sensitivity in recording changes in wall moisture and biofilm detection than the time-of-flight scanner.
The PS scanner is better suited for complex diagnostics of buildings and structures.
The TOF scanner is able to register the borders between bricks and mortar joints in a brick wall in a much clearer manner than the PS scanner.
The TLS method can easily determine the moisture and biodegradation area.
So far, it is not possible to test for moisture levels using the TLS technique. Therefore, future research in this direction is needed.
A methodology for the post-processing of point clouds, to detect the bio-deterioration of buildings, should be developed and tested.

Author Contributions

Conceptualization, C.S.; methodology, C.S.; software, C.S.; validation, C.S., and M.D.-S.; formal analysis, C.S., M.D.-S. and J.K.; investigation, C.S., M.D.-S. and J.K.; resources, C.S., J.R.; data curation, C.S., J.J.; writing—original draft preparation, C.S., M.D.-S.; writing—review and editing, J.K., J.R., J.J., and P.S.; visualization, C.S., M.D.-S. and P.S.; supervision, C.S.; project administration, C.S.; funding acquisition, C.S. and J.R. All authors have read and agreed to the published version of the manuscript.

Funding

Part of this research was funded by the National Science Center and Ministry of Science and Higher Education Poland, a project for the purchase of Terrestrial Laser Scanning (No: IA/SP/0017/2019).

Conflicts of Interest

The authors declare no conflict of interest.

References

  1. Gonzalez-Jorge, H.; Solla, M.; Armesto, J.; Arias, P. Novel method to determine laser scanner accuracy for applications in civil engineering. Opt. Appl. 2012, XLII, 43–53. [Google Scholar] [CrossRef]
  2. Lenda, G.; Uznański, A.; Strach, M.; Lewińska, P. Laser Scanning in Engineering Surveying: Methods of Measurement and Modeling of Structures. Rep. Geod. Geoinformatics 2016, 100, 109–130. [Google Scholar] [CrossRef] [Green Version]
  3. Del-Campo-Sanchez, A.; Moreno, M.; Ballesteros, R.; Hernandez-Lopez, D. Geometric characterization of vines from 3D point clouds obtained with laser scanner systems. Remote Sens. 2019, 11, 2365. [Google Scholar] [CrossRef] [Green Version]
  4. Suchocki, C.; Damięcka, M.; Jagoda, M. Determination of the building wall deviations from the vertical plane. In Proceedings of the 7th International Conference on Environmental Engineering, ICEE 2008, Vilnius, Lithuania, 23 May 2008; pp. 1488–1492. [Google Scholar]
  5. Corso, J.; Roca, J.; Buill, F. Geometric analysis on stone façades with terrestrial laser scanner technology. Geosci. 2017, 7, 103. [Google Scholar] [CrossRef] [Green Version]
  6. Xiong, X.; Adan, A.; Akinci, B.; Huber, D. Automatic creation of semantically rich 3D building models from laser scanner data. Autom. Constr. 2013, 31, 325–337. [Google Scholar] [CrossRef] [Green Version]
  7. Mistretta, F.; Sanna, G.; Stochino, F.; Vacca, G. Structure from motion point clouds for structural monitoring. Remote Sens. 2019, 11, 1940. [Google Scholar] [CrossRef] [Green Version]
  8. Kermarrec, G.; Kargoll, B.; Alkhatib, H. Deformation analysis using B-spline surface with correlated terrestrial laser scanner observations-a bridge under load. Remote Sens. 2020, 12, 829. [Google Scholar] [CrossRef] [Green Version]
  9. Ossowski, R.; Przyborski, M.; Tysiac, P. Stability Assessment of Coastal Cliffs Incorporating Laser Scanning Technology and a Numerical Analysis. Remote Sens. 2019, 11, 1951. [Google Scholar] [CrossRef] [Green Version]
  10. Suchocki, C. Application of terrestrial laser scanner in cliff shores monitoring. Rocz. Ochr. Sr. 2009, 11, 715–725. [Google Scholar]
  11. Rabah, M.; Elhattab, A.; Fayad, A. Automatic concrete cracks detection and mapping of terrestrial laser scan data. Nriag J. Astron. Geophys. 2013, 2, 250–255. [Google Scholar] [CrossRef] [Green Version]
  12. Armesto-González, J.; Riveiro-Rodríguez, B.; González-Aguilera, D.; Rivas-Brea, M.T. Terrestrial laser scanning intensity data applied to damage detection for historical buildings. J. Archaeol. Sci. 2010, 37, 3037–3047. [Google Scholar] [CrossRef]
  13. Suchocki, C.; Błaszczak-Bąk, W. Down-Sampling of Point Clouds for the Technical Diagnostics of Buildings and Structures. Geosciences 2019, 9, 70. [Google Scholar] [CrossRef] [Green Version]
  14. Tan, K.; Cheng, X.; Ju, Q.; Wu, S. Correction of Mobile TLS Intensity Data for Water Leakage Spots Detection in Metro Tunnels. IEEE Geosci. Remote Sens. Lett. 2016, 13, 1711–1715. [Google Scholar] [CrossRef]
  15. Pavi, S.; Gorkos, P.; Bordin, F.; Veronez, M.; Kulakowski, M. Laser scanner in identification of pathological manifestations in concrete. In Multi-Span Large Bridges, Proceedings of the International Conference on Multi-Span Large Bridges, Porto, Portugal, 1–3 July 2015; Taylor & Francis Gropup: Porto, Portugal, 2015; pp. 879–886. [Google Scholar]
  16. Nowak, R.; Orłowicz, R.; Rutkowski, R. Use of TLS (LiDAR) for building diagnostics with the example of a historic building in Karlino. Buildings 2020, 10, 24. [Google Scholar] [CrossRef] [Green Version]
  17. Suchocki, C. Comparison of Time-of-Flight and Phase-Shift TLS Intensity Data for the Diagnostics Measurements of Buildings. Mater. (Basel) 2020, 13, 353. [Google Scholar] [CrossRef] [PubMed] [Green Version]
  18. Nowak, R.; Orłowicz, R. Testing of Chosen Masonry Arched Lintels. Int. J. Arch. Herit. 2020. [Google Scholar] [CrossRef]
  19. Viitanen, H.; Vinha, J.; Salminen, K.; Ojanen, T.; Peuhkuri, R.; Paajanen, L.; Lähdesmäki, K. Moisture and bio-deterioration risk of building materials and structures. J. Build. Phys. 2010, 33, 579–594. [Google Scholar] [CrossRef]
  20. Gaylarde, C.C.; Morton, L.H.G. Deteriogenic biofilms on buildings and their control: A review. Biofouling 1999, 14, 59–74. [Google Scholar] [CrossRef]
  21. Herrera, L.K.; Borgne, S.L.; Videla, H.A. Modern Methods for Materials Characterization and Surface Analysis to Study the Effects of Biodeterioration and Weathering on Buildings of Cultural Heritage. Int. J. Arch. Herit. 2009, 3, 74–91. [Google Scholar] [CrossRef]
  22. Cwalina, B. Biodeterioration of concrete, brick and other mineral-based building materials. In Understanding Biocorrosion: Fundamentals and Applications; Silesian University of Technology: Gliwice, Poland, 2014; pp. 281–312, chapter of book; ISBN 9781782421252. [Google Scholar] [CrossRef]
  23. Wilimzig, M. Bio-deterioration of building materials. In Proceedings of the 8th International Congress on Deterioration and Conservation of Stone, Berlin, Germany, 30 September–4 October 1996; pp. 579–584, ISBN 3000007792. [Google Scholar]
  24. Gunn, D.A.; Chambers, J.E.; Uhlemann, S.; Wilkinson, P.B.; Meldrum, P.I.; Dijkstra, T.A.; Haslam, E.; Kirkham, M.; Wragg, J.; Holyoake, S.; et al. Moisture monitoring in clay embankments using electrical resistivity tomography. Constr. Build. Mater. 2015, 92, 82–94. [Google Scholar] [CrossRef] [Green Version]
  25. Piontek, M.; Jasiewicz, M.; Łuszczyńska, K. Thermal modernization and biodeterioration of prefabricated elements of buildings - A case study. In Management of Indoor Air Quality; chapter of book; Taylor & Fracis Group: Oxfordshire, UK, 2011; ISBN 9780415672665. [Google Scholar] [CrossRef]
  26. Gupta, R.P. Remote Sensing Geology; Springer: Berlin/Heidelberg, Germany, 1991; ISBN 978-3-662-12916-6. [Google Scholar]
  27. Suchocki, C.; Katzer, J.; Panuś, A. Remote Sensing to Estimate Saturation Differences of Chosen Building Materials Using Terrestrial Laser Scanner. Rep. Geod. Geoinformatics 2017, 103, 94–105. [Google Scholar] [CrossRef] [Green Version]
  28. Suchocki, C.; Katzer, J. Terrestrial laser scanning harnessed for moisture detection in building materials—Problems and limitations. Autom. Constr. 2018, 94, 127–134. [Google Scholar] [CrossRef]
  29. Blaskow, R.; Schneider, D. Analysis and correction of the dependency between laser scanner intensity values and range. In International Archives of the Photogrammetry, Remote Sensing and Spatial Information Sciences—ISPRS Archives; ISPRS Archives: Riva del Garda, Italy, 2014; Volume 40, pp. 107–112. [Google Scholar]
  30. Xu, T.; Xu, L.; Yang, B.; Li, X.; Yao, J. Terrestrial laser scanning intensity correction by piecewise fitting and overlap-driven adjustment. Remote Sens. 2017, 9, 90. [Google Scholar] [CrossRef] [Green Version]
  31. Kaasalainen, S.; Jaakkola, A.; Kaasalainen, M.; Krooks, A.; Kukko, A. Analysis of incidence angle and distance effects on terrestrial laser scanner intensity: Search for correction methods. Remote Sens. 2011, 3, 2207–2221. [Google Scholar] [CrossRef] [Green Version]
  32. Suchocki, C.; Katzer, J.; Rapiński, J. Terrestrial Laser Scanner as a Tool for Assessment of Saturation and Moisture Movement in Building Materials. Period. Polytech. Civ. Eng. 2018, 62, 1406. [Google Scholar] [CrossRef] [Green Version]
  33. Balaguer-Puig, M.; Molada-Tebar, A.; Marqués-Mateu, A.; Lerma, J.L. Characterisation of intensity values on terrestrial laser scanning for recording enhancement. Isprs—Int. Arch. Photogramm. Remote Sens. Spat. Inf. Sci. 2017, XLII-2/W5, 49–55. [Google Scholar] [CrossRef] [Green Version]
  34. Reshetyuk, Y. Investigation of the Influence of Surface Reflectance on the Measurementswith the Terrestrial Laser Scanner Leica HDS 3000. Z. Für Vermess 2006, 2, 96–103. [Google Scholar]
  35. Pesci, A.; Teza, G. Effects of surface irregularities on intensity data from laser scanning: An experimental approach. Ann. Geophys. 2008, 51, 839–848. [Google Scholar] [CrossRef]
  36. San José Alonso, J.I.; Martínez Rubio, J.; Fernández Martín, J.J.; García Fernández, J. Comparing Time-of-Flight and Phase-Shift. The Survey of the Royal Pantheon in the Basilica of San Isidoro (León). Isprs—Int. Arch. Photogramm. Remote Sens. Spat. Inf. Sci. 2012, XXXVIII-5/. [Google Scholar] [CrossRef] [Green Version]
  37. Tan, K.; Zhang, W.; Shen, F.; Cheng, X. Investigation of TLS intensity data and distance measurement errors from target specular reflections. Remote Sens. 2018, 10, 1077. [Google Scholar] [CrossRef] [Green Version]
  38. Heesun, Y.; Hajun, S.; Kyihwan, P. A phase-shift laser scanner based on a time-counting method for high linearity performance. Rev. Sci. Instrum. 2011, 8, 075108. [Google Scholar] [CrossRef]
  39. Bechadergue, B.; Chassagne, L.; Guan, H. Visible light phase-shift rangefinder for platooning applications. In Proceedings of the 2016 IEEE 19th International Conference on Intelligent Transportation Systems (ITSC), Rio de Janeiro, Brazil, 1–4 November 2016; IEEE: Rio de Janeiro, Brazil, 2016; pp. 1–7. [Google Scholar]
  40. Höfle, B.; Pfeifer, N. Correction of laser scanning intensity data: Data and model-driven approaches. Isprs J. Photogramm. Remote Sens. 2007, 62, 415–433. [Google Scholar] [CrossRef]
  41. Tan, K.; Cheng, X. Correction of incidence angle and distance effects on TLS intensity data based on reference targets. Remote Sens. 2016, 8, 251. [Google Scholar] [CrossRef] [Green Version]
  42. Vain, A.; Kaasalainen, S.; Pyysalo, U.; Krooks, A.; Litkey, P. Use of Naturally Available Reference Targets to Calibrate Airborne Laser Scanning Intensity Data. Sensors 2009, 9, 2780–2796. [Google Scholar] [CrossRef] [PubMed]
  43. Vain, A.; Xiaowei, Y.; Kaasalainen, S.; Hyyppä, J. Correcting Airborne Laser Scanning Intensity Data for Automatic Gain Control Effect. Geosci. Remote Sens. Lett. IEEE 2010, 7, 511–514. [Google Scholar] [CrossRef]
Figure 1. Tested external walls of the buildings: (a) object 1, (b) object 2.
Remotesensing 12 01708 g001
Figure 2. Value of intensity, recorded by terrestrial laser scanners (TLSs), for the external wall in different states of saturation (a) Saturated by air humidity sample measured via Leica ScanStation C10 scanner, (b) Saturated by air humidity sample measured via Z+F IMAGER 5016 scanner, (c) Simulated moisture sample measured via Leica ScanStation C10 scanner, (d) Simulated moisture sample measured via Z+F IMAGER 5016 scanner.
Remotesensing 12 01708 g002
Figure 3. Registered intensity of the cement plaster in two states of saturation, area 1.
Remotesensing 12 01708 g003
Figure 4. Intensity, recorded by TLSs, for the external brick wall saturated by air humidity and fully saturated, area 3.
Remotesensing 12 01708 g004
Figure 5. Intensity data profile of a brick wall with two states of saturation: data captured by (a) the Leica ScanStation C10 scanner; (b) the Z+F IMAGER 5016 scanner.
Remotesensing 12 01708 g005
Figure 6. Point clouds of the mortar wall with biological corrosion, area 2, (a) RGB point cloud, (b) point cloud captured by Leica ScanStation scanner, (c) segmented point cloud captured by Leica ScanStation scanner, (d) point cloud captured by Z+F Imager 5016 scanner, (e) segmented point cloud captured captured by Z+F Imager 5016 scanner
Remotesensing 12 01708 g006
Figure 7. Distribution of the intensity value, area 2.
Remotesensing 12 01708 g007
Figure 8. Intensity value, recorded by TLSs, for the external brick wall with biofilm, area 4, (a) RGB point cloud, (b) point cloud captured by Leica ScanStation scanner, (c) segmented point cloud captured by Leica ScanStation scanner, (d) point cloud captured by Z+F Imager 5016 scanner, (e) segmented point cloud captured by Z+F Imager 5016 scanner
Remotesensing 12 01708 g008
Figure 9. Distribution of intensity value, area 4.
Remotesensing 12 01708 g009
Figure 10. Intensity data profile of the brick wall with biofilm captured by Leica ScanStation C10 and Z+F IMAGER 5016 scanners.
Remotesensing 12 01708 g010

