Letter

First Experiences with the Landsat-8 Aquatic Reflectance Product: Evaluation of the Regional and Ocean Color Algorithms in a Coastal Environment

by
Majid Nazeer
1,
Muhammad Bilal
2,
Janet Elizabeth Nichol
3,
Weicheng Wu
1,*,
Mohammad M. M. Alsahli
4,
Muhammad Imran Shahzad
5 and
Bijoy Krishna Gayen
6
1
Key Laboratory of Digital Land and Resources, East China University of Technology, Nanchang 330013, China
2
School of Marine Sciences, Nanjing University of Information Science and Technology, Nanjing 210044, China
3
Department of Geography, School of Global Studies, University of Sussex, Brighton BN19RH, UK
4
Department of Geography, College of Social Sciences, Kuwait University, P.O. Box 5969, Safat 13060, Kuwait
5
Earth & Atmospheric Remote Sensing Lab (EARL), Department of Meteorology, COMSATS University Islamabad, Islamabad 45550, Pakistan
6
Department of Remote Sensing and GIS, Vidyasagar University, Midnapore, West Bengal 721102, India
*
Author to whom correspondence should be addressed.
Remote Sens. 2020, 12(12), 1938; https://0-doi-org.brum.beds.ac.uk/10.3390/rs12121938
Submission received: 29 May 2020 / Accepted: 13 June 2020 / Published: 15 June 2020

Abstract

:
Since the launch of the Landsat-8 (L8) Operational Land Imager (OLI) on 11 February 2013, there has been a continuous effort to produce reliable ocean color products by taking the advantages of its medium spatial resolution (30 m) and higher Signal to Noise Ratio (SNR). A Provisional Aquatic Reflectance product for the L8 OLI (L8PAR) has been recently released to the public to explore its potential for ocean color applications. This study used a six-year data record of L8 for development of a regionally tuned algorithm (RTA20) for estimating Chlorophyll-a (Chl-a) concentrations around the complex coastal environment of Hong Kong, and is the first to report the usability of the L8PAR product for coastal areas. Furthermore, this study validated three previously developed algorithms, namely RTA16, RTA17 and RTA19, and two ocean color algorithms (OC2 and OC3) modified for L8 OLI by NASA’s Ocean Color group. Results indicate that the newly released L8PAR product has a high potential for estimating the coastal water Chl-a concentrations with higher detail and higher accuracy than previously. The RTA20 algorithm developed in this study outperformed the previous algorithms (RTA16, RTA17, RTA19, OC2 and OC3), e.g., with lower values for Root Mean Square Error (RMSE; 0.92 mg/m3), bias (−0.26 mg/m3) and mean ratio (1.29). Although inferior to the RTA20, the OC2 algorithm also performed well in terms of Pearson’s correlation coefficient (r; 0.84), slope (6.87) and intercept (−8.44) while for RTA20 the values for r, slope and intercept were 0.96, 0.77 and 0.27, respectively. This preliminary evaluation reveals that the OC2 algorithm can be used as an operational algorithm for L8 Chl-a product generation for global coastal areas while RTA20 can be used as a regional algorithm for the routine monitoring of Chl-a concentrations around the coastal areas of Hong Kong or for coastal areas with similar water quality elsewhere in the world.

Graphical Abstract

1. Introduction

Ocean color remote sensing is defined as the measurement of the spectral distribution of reflected visible solar radiation upwelling from beneath the ocean surface. It has now become fundamental in the monitoring of marine and coastal ecosystems. The launch of the first ocean color sensor, the Coastal Zone Color Scanner (CZCS) in 1978 has greatly improved understanding of the ocean surface and given birth to ocean color remote sensing. Follow-on missions in this field include the Sea-viewing Wide Field of View Sensor (SeaWiFS), the Medium Resolution Imaging Spectrometer (MERIS), the Moderate Resolution Imaging Spectroradiometer (MODIS) and the Visible Infrared Imaging Radiometer Suite (VIIRS). These satellites have high temporal resolution and Signal to Noise Ratio (SNR), allowing mapping of the constituents of ocean waters such as Chlorophyll-a (Chl-a) concentrations, a proxy for phytoplankton biomass, which accounts for about half of the net primary productivity on Earth. Several algorithms (known as ocean color algorithms) have been developed for the estimation of Chl-a concentrations for these satellite sensors [1]. The coarse spatial resolution of these satellite sensors has, however, limited their applications in coastal and inland waters.
To resolve this limitation, several efforts have been made to evaluate the efficiency of Landsat-8 (L8) Operational Land Imager (OLI) data whose spatial resolution is 30 m, in retrieving a reliable water leaving (i.e., remote sensing) reflectance (Rrs). Franz et al. (2015) [2] used the standard atmospheric correction algorithm in SeaDAS (Sea-viewing Wide Field-of-View Sensor Data Analysis System), a free software package distributed by NASA (National Aeronautics and Space Administration), to derive Rrs from L8 OLI. They stated that L8 OLI’s Near Infrared (NIR) and Shortwave Infrared (SWIR) bands can be effectively used to remove scattering contributing present in the Rrs signal over water bodies. Pahlevan et al. (2017) [3] evaluated the performance of the Franz et al. (2015) [2] approach and concluded that atmospherically corrected L8 OLI images have reliable and consistent Rrs retrievals over water bodies. These two studies [2,3] revealed that the improved spectral resolution and SNR allowed a reliable retrieval of Rrs over coastal water bodies. Based on these efforts, the L8 Provisional Aquatic Reflectance (L8PAR) product was released to the public on 1 April 2020, facilitating further application of L8 mission in monitoring coastal and estuarine ecosystems.
These ecosystems are very responsive to physical and anthropogenic factors and hence require a spatial synoptic monitoring for maintenance and management. A key factor when maintaining and protecting coastal ecosystems is monitoring of Water Quality Parameters (WQPs). In-situ measurements of coastal water quality are time-consuming, labor intensive, costly and spatially incomplete [4]. Thus, integrating in-situ observations with L8PAR images would enhance the efficiency of coastal water quality monitoring. The L8PAR images can complement in-situ sampling by providing a synoptic view of some WQPs at larger scale and on regular basis. The spatial resolution of L8PAR images allows water quality monitoring in lagoons and small bays where anthropogenic activities are extensively concentrated. One of the most important WQP used to assess the health of a marine ecosystem is the Chl-a concentration, which can be linked to fundamental biotic and abiotic activities in coastal ecosystems [5].
Chl-a concentrations are monitored by many environmental agencies worldwide on a regular basis. The Hong Kong Environmental Protection Department (EPD) has run a coastal water quality monitoring program since 1986, and collects data for 24 different WQPs, including Chl-a concentrations each month. These data are ideal for development and validation of remote sensing based WQPs estimation algorithms. Therefore, this study aims to share the first experience with the L8PAR product by (i) exploring its potential for the estimation of coastal WQPs, (ii) development of a regionally tuned algorithm for routine monitoring of Chl-a concentrations, and (iii) evaluation of the Ocean Color algorithm and other previously developed algorithms.

2. Study Area and Data Used

2.1. Study Area

Hong Kong is a special administrative region of China, and has a complex coastal environment due to terrestrial discharges from the Pearl River Delta to its west, urban pollutants in the center and the clearer waters of the South China Sea to the east [6]. Hong Kong’s coastal water quality has been monitored monthly since 1986 by the Hong Kong EPD using a scientific vessel. Hong Kong’s waters are divided into ten Water Control Zones (WCZs) consisting of 95 monitoring stations (Figure S1). The previously reported Chl-a and suspended solid concentrations range from 0.2 to 25 mg/m3 and 0.5 to 56.0 mg/m3 [7,8,9], respectively, which show that Hong Kong waters are mesotrophic to eutrophic in nature.

2.2. Satellite Data

This study used the satellite data from L8 OLI which has nine spectral bands covering the visible, NIR and SWIR regions of the electromagnetic spectrum. In comparison to the previous Landsat missions, the L8 OLI sensor has several advantages, i.e., significantly improved radiometry due to the improved signal-to-noise ratios (SNR), onboard radiometric calibration, and improvement from 8- to 12-bit measurements [10]. The improved SNR and increased quantization of OLI significantly reduces the image noise and spectral heterogeneity, giving more precise water quality retrievals than with Landsat-7 (L7) Enhanced Thematic Mapper Plus (ETM+) [11]. The SNR of L8 OLI for B1 (0.43–0.45 µm), B2 (0.45–0.51 µm), B3 (0.53–0.59 µm), B4 (0.64–0.67 µm), B5 (0.85–0.88 µm), B6 (1.57–1.65 µm) and B7 (2.11–2.29 µm) is 344, 478, 279, 144, 67, 30 and 14, respectively while for L7 ETM+ sensor the SNR is 53, 37, 17, 11, 3 and <1 for B1 (0.45–0.52 µm), B2 (0.52–0.60 µm), B3 (0.63–0.69 µm), B4 (0.77–0.90 µm), B5 (1.55–1.75 µm) and B7 (2.09–2.35 µm), respectively [2]. Further, the newly introduced bands in L8 OLI, i.e., B1 and B9 are useful for coastal/aerosol studies and cirrus cloud detection, respectively. The narrow bandwidths and 12-bit quantization of B1 and B9 enable estimation of water constituents comparable to performance from current ocean color satellites [12], and better cloud masking [13].
In consideration of these improvements in the OLI sensor, L8PAR was released (on 1 April 2020). It is expected to enhance the applicability of the Landsat mission to ocean color remote sensing. The L8PAR product is derived from L8 Top of Atmosphere (TOA) reflectance and auxiliary atmospheric data based on the SeaDAS atmospheric correction algorithm for bands B1, B2, B3 and B4. The spectral Rrs of the visible bands is normalized by the Bidirectional Reflectance Distribution Function (BRDF) of a perfectly reflecting Lambertian surface (multiplied by π) to produce dimensionless aquatic reflectance [2,3]. In this study, the L8PAR data from April 2013 to December 2018 was obtained from the USGS (United States Geological Survey) EROS (Earth Resources Observation and Science) Center Science Processing Architecture (ESPA) on-demand interface (https://espa.cr.usgs.gov/).

2.3. In-Situ Chlorophyll-a (Chl-a) Concentration Data

For each monitoring station (Figure S1), water quality samples were collected at three, i.e., surface (1 to 5 m deep), middle layer and near the sea bed. Water samples were stored in a 500-mL Nalgene bottle and refrigerated for transport, then analyzed by the government laboratory for extraction of Chl-a using an in-house GL-OR-34 method based on the American Public Health Association (APHA) 20th edition 10200H 2 spectro-photometric method [14]. The in-situ “Surface” Chl-a data from April 2013 to December 2018 were obtained from the Hong Kong EPD.

3. Methodology

3.1. Match-up Procedure

From April 2013 to December 2018 there were 19 scenes (Table S1) which were coincident with the EPD WQPs data. For each scene, the L8PAR values were extracted for a 3 × 3 pixel window centered on the location of each monitoring station. The processing flags (l2_flags) delivered with the L8PAR product provide very useful per-pixel information about the success or failure of the atmospheric correction [15]. Based on the l2_flags, a pixel was rendered invalid for the matching analysis when it had encountered one of the following criteria: atmospheric correction failure, land, sun glint, high satellite zenith angle (>60°), cloud, cloud shadow or high solar zenith angle (>70°). These criteria resulted in 80 matched pairs of EPD and L8PAR data in all four bands (Table S1) for a Chl-a concentration ranging from 0.3 to 17.0 mg/m3. These matched-up observations (n = 80) were divided into two sets and among them 2/3 of the data set (n = 52) was used for the development of the model while 1/3 of the data (n = 28) was retained for validation. The mean Chl-a concentration for the model development dataset was 2.33 mg/m3 with a Standard Deviation (StDev) of 2.94 mg/m3, while the mean for the validation dataset was 2.28 mg/m3 with a StDev of 2.58 mg/m3.

3.2. Development of a Regional Chl-a Estimation Algorithm

Following the quality assurance of all the matched pairs, the L8PAR data for each band were converted to Rrs by dividing it by π. Initial data analysis suggested a low correlation between in-situ Chl-a and the Rrs of the four single bands of L8. Therefore, different band combinations and transformations were tested to examine if the correlation could be improved. Using the Rrs of four bands, 32 different band combinations were composed and a correlation matrix was developed (Table S2) to select the most suitable variable(s) for the development of a regionally tuned algorithm. As the Chl-a data follows the log-normal distribution [16], the in situ Chl-a observations were log-transformed for the determination of correlation with different bands, as well as their combinations and transformations.

3.3. Evaluation of Ocean Color (OCx) and Other Regional Chl-a Algorithms

Five algorithms, including two OCx algorithms (OC2 and OC3) and three regionally developed Chl-a estimation algorithms, were selected to assess the L8-derived Chl-a estimates in Hong Kong. The OCx algorithms were originally developed for sensors aboard SeaWIFS and MODIS, but, with the passage of time, new ocean color sensors have become available, and these algorithms are being modified accordingly. Similarly, these algorithms have been modified to support the L8 OLI data format and sensor spectral characteristics, and the coefficients have been provided for the L8 OLI sensor by the NASA ocean color group. Both of these OCx algorithms use a fourth-order polynomial relationship between the ratio of Rrs in blue–green bands and Chl-a concentrations [17]. The OC2 (Equation (1)) uses the Rrs ratio of B2 (blue) and B3 (green) while OC3 (Equation (2)) uses Rrs ratio of B1 (coastal blue) and B3 (green) for the estimation of Chl-a concentrations [2]. The three regionally developed Chl-a algorithms named as RTA16 (Equation (3)) [7], RTA17 (Equation (4)) [18] and RTA19 (Equation (5)) [8] have previously been developed over Hong Kong using the coincident in situ Chl-a concentrations and Landsat (Thematic Mapper (TM)/Enhanced Thematic Mapper Plus (ETM+) and Chinese HJ-1 AB CCD sensors datasets.
C h l a = 10 ( 0.1977 1.8117   X + 1.9743   X 2 2.5635   X 3 0.7218   X 4 )
C h l a = 10 ( 0.2412 2.0546   Y + 1.1776   Y 2 0.5538   Y 3 0.4570   Y 4 )
C h l a = 2.61 + 0.57 ( B 4 ( B 2 ) 2 )
C h l a = 1.87 + 0.46 ( B 4 ( B 2 ) 2 )
C h l a = 2.23 + 0.78   B 4 + 14.75 ( B 4 ( B 2 ) 2 )
where, X = l o g 10 ( R r s ( B 2 ) R r s ( B 3 ) ) and Y = l o g 10 ( R r s ( B 1 ) R r s ( B 3 ) ) in Equation (1) and Equation (2), respectively.

3.4. Validation Metrics

The performance of the regionally tuned Chl-a algorithm, OCx algorithms and other regionally developed algorithms was tested based on Pearson’s correlation coefficient (r), slope, intercept, Root Mean Square Error (RMSE, Equation (6)), bias (Equation (7)) and mean ratio (Equation (8)). Among these metrics, r, slope and intercept were estimated based on the linear regression fitted onto log-transformed Chl-a data.
R M S E = i = 1 N ( y i x i ) 2 N
B i a s = 1 N i = 1 N y i x i
M e a n   R a t i o = 1 N i = 1 N y i x i
where x i and y i represent the in situ and L8-derived Chl-a concentrations, respectively for the i-th matched pair, and N is the total number of matched pairs.

4. Results and Discussion

4.1. Potential of L8PAR for Chl-a Estimation

The remote-sensing-based empirical algorithms developed for the estimation of a certain WQP are usually data dependent, hence their accuracy may vary from one coastal environment to another. The OCx algorithms are based on the NASA bio-Optical Marine Algorithm Dataset (NOMAD) [1], which is a global dataset used for development and validation of ocean color algorithms for different sensors. However, the majority of the NOMAD represents observations from the open oceans, whereas the representation of coastal areas is only for the eastern coast of North America, South Korea and the western coast of South Africa. Due to limited/no data from the remaining coastal areas of the world, the ocean color algorithms should be used with caution for the retrieval of WQPs for coastal areas in general. Hong Kong has a complex coastal environment; therefore, a regionally tuned algorithm (RTA20, Equation (9)) was developed using the coincident in-situ Chl-a concentrations and L8PAR-derived Rrs. Among the other bands, their combinations and transformations, the band ratio of B2 (blue) and B3 (green) in a second-order polynomial, were able to best represent the regional variations in Chl-a concentration (Table 1).
C h l a = 10 ( 0.19 + 1.24   X + 5.00   X 2 )
The RTA20 algorithm outperformed the ocean color algorithms (OC2 and OC3) and other previously developed regional algorithms (RTA16, RTA17 and RTA19). The OC2 algorithm showed a relatively good performance in terms of r, slope and intercept, whereas RTA16 and RTA17 showed lower performance. The other two algorithms (OC3 and RTA19) exhibited a poor performance in terms of the intercept value, RMSE, mean ratio and bias. These differences in performance among the algorithms can be attributed to the bands used to develop these algorithms and the SNR factor. The OC2 algorithm was developed using similar bands to those used for the RTA20 algorithm, which have a higher sensitivity to Chl-a variations than those used to develop the OC3 and previously developed regional algorithms [19]. In addition, the previously developed regional algorithms were designed based on TM and ETM+ sensors whose SNR is lower than L8 OLI sensor. The SNR factor might also contribute to the general overestimation of Chl-a concentrations by these previously developed regional algorithms, whereas the overestimation by the CO2 and CO3 algorithms might be attributed to the contribution of other water constituents (e.g., total suspended sediments and colored dissolved organic matter) in the Rrs signal. The OC2 and OC3 algorithms were developed using in-situ data that mostly represent open ocean, where the contribution of such water constituents (e.g., total suspended sediments and colored dissolved organic matter) is negligible [20].

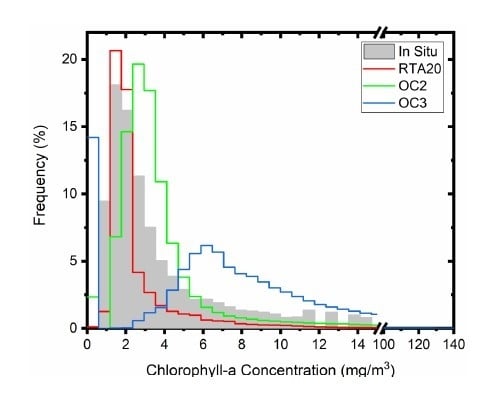
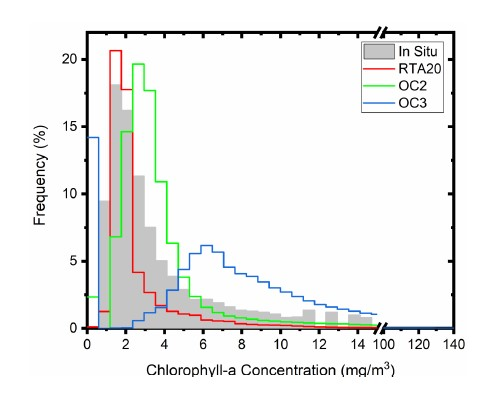
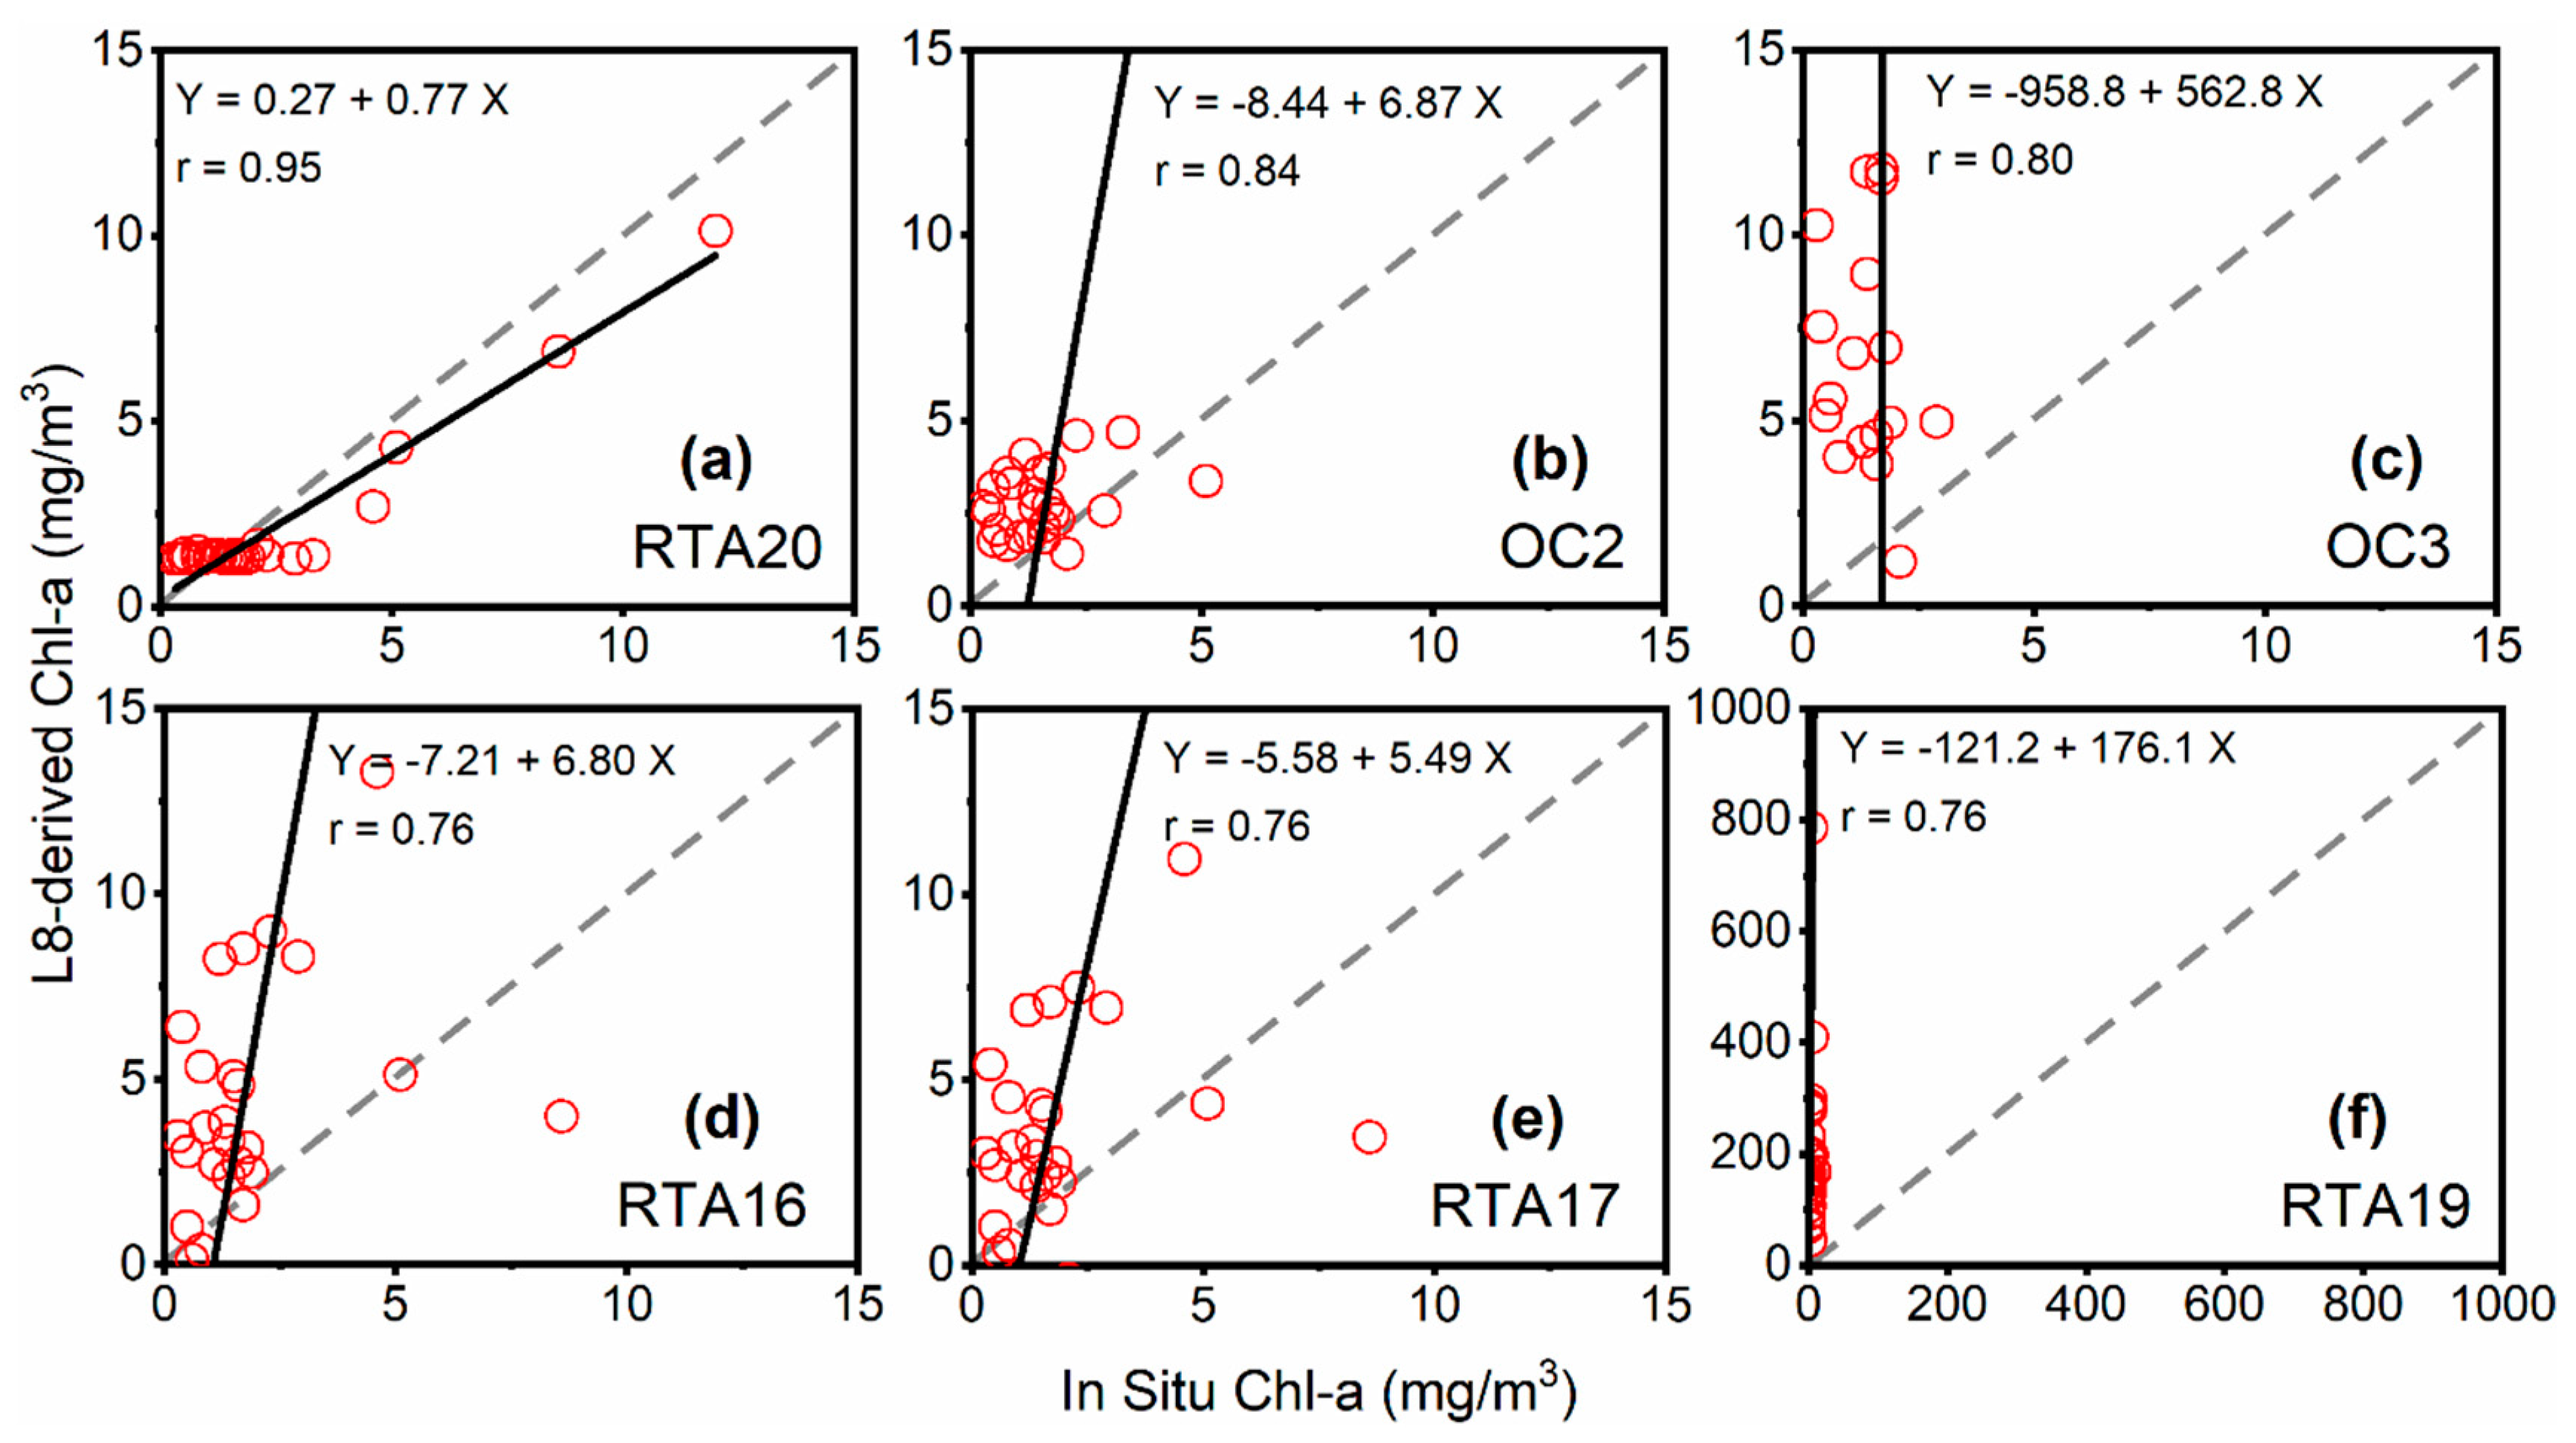
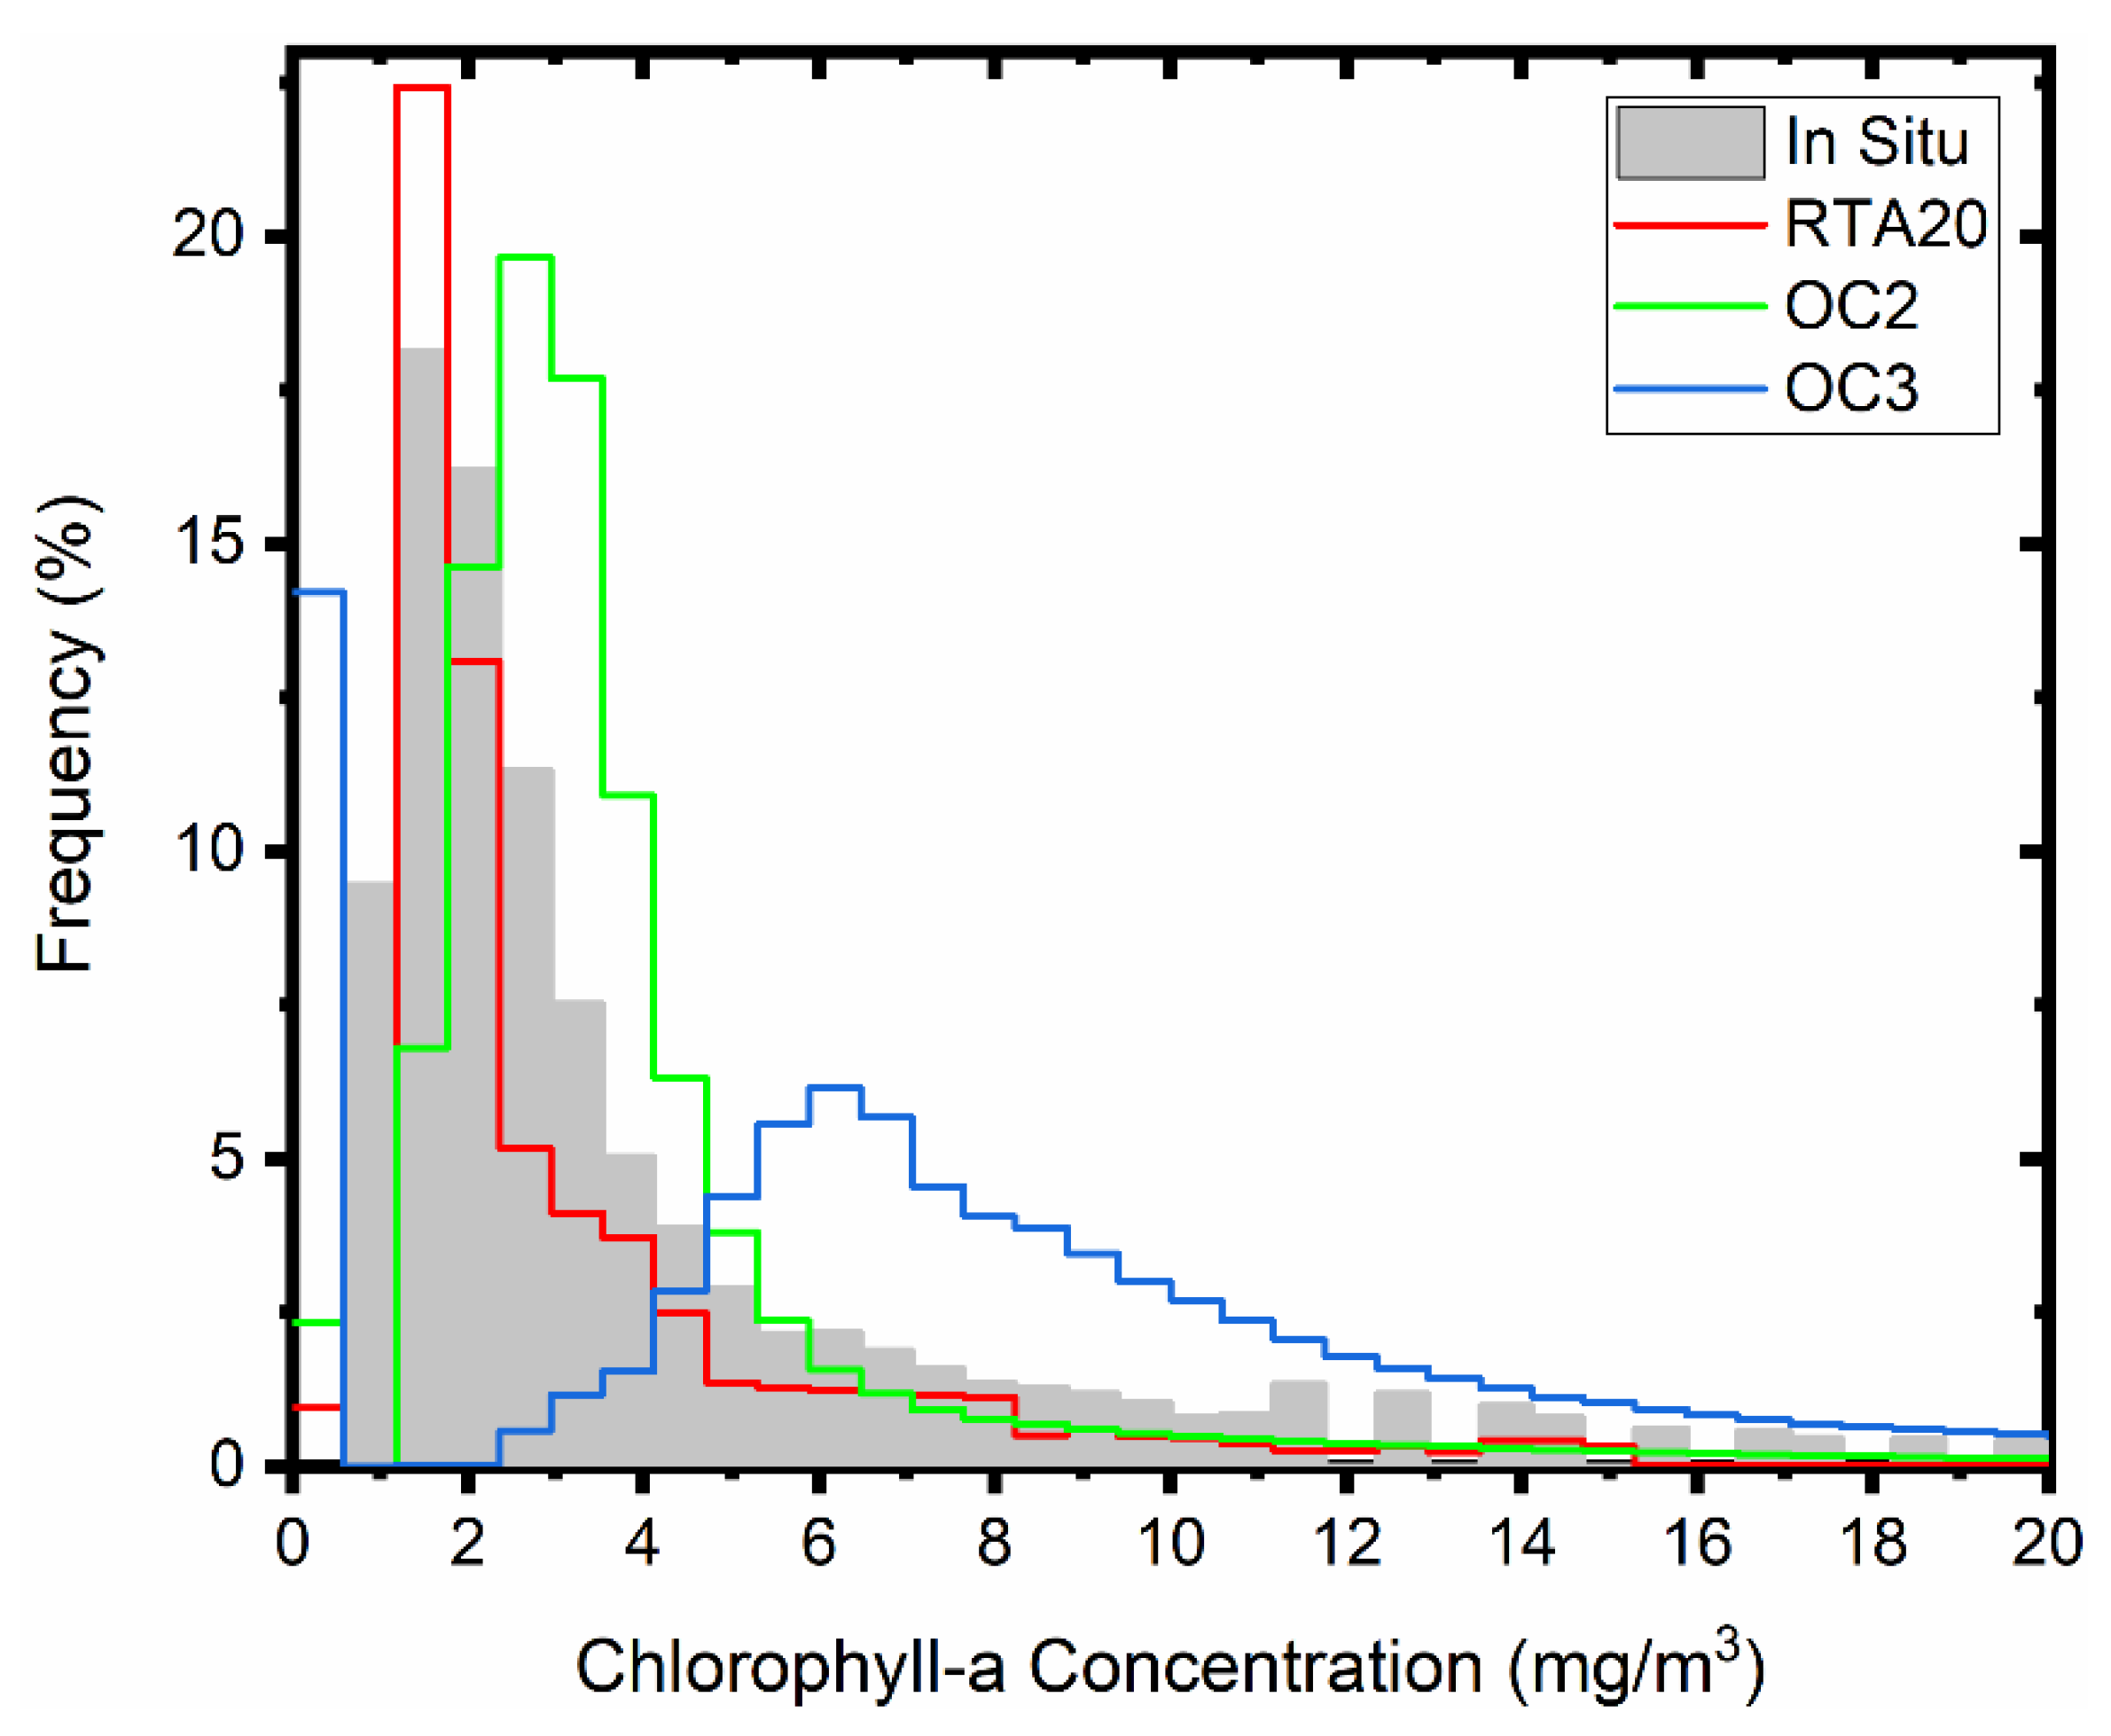
4.2. Evaluation of Different Chl-a Estimation Algorithms

To validate the performance of all participating algorithms, validation was conducted using 1/3 of the retained data (Section 3.1) (Figure 1). As observed in Figure 1, RTA20 and OC2 outperformed other algorithms by showing a higher correlation (with the in-situ Chl-a) and better slope and intercept values. The remaining algorithms (OC3, RTA16, RTA17 and RTA19) mostly overestimated the Chl-a concentrations, with RTA19 being highly biased and overestimated. The better performance of RTA20 can be attributed to the higher accuracy of L8PAR-derived Rrs as compared to the RTA16, RTA17 and RTA19, which used the 6S (Second Simulation of a Satellite Signal in the Solar Spectrum), a land-based atmospheric correction method, to derive water surface reflectance, and which includes sky glint contributions [21]. Although lower performance for estimating Chl-a concentration was observed for the OC2 and OC3 algorithms (Figure 1b,c), they still performed better than RTA16, RTA17 and RTA19. This may be because the 6S (or any other land-based atmospheric correction methods) estimates aerosol type and load over land and then spatially interpolates it over near-shore coastal areas for the estimation of surface reflectance. Therefore, an over-water atmospheric correction method should be used for the estimation of WQPs (i.e., Chl-a) [11]. These preliminary validation results also recommend use of the OC2 algorithm as an operational algorithm for L8 Chl-a product generation for global coastal waters, while RTA20 can be used as a regional algorithm for the routine monitoring of Chl-a concentrations around the coastal areas of Hong Kong and other similar coastal areas in the world.
The performance of the three better-performing algorithms (RTA20, OC2 and OC3) was also tested by plotting the quality-assured retrievals of Chl-a concentrations through each algorithm, and comparing it with historical in-situ Chl-a (Figure 2). For this purpose, Chl-a was estimated with the RTA20, OC2 and OC3 algorithms for all available quality-assured scenes of L8 OLI, and then an average (from April 2013 to December 2018) Chl-a concentration was estimated. These algorithm-based retrievals were then compared with the historical (30 years) in-situ Chl-a concentration data from January 1989 to December 2018 (Figure 2). It was observed that the RTA20 and OC2 Chl-a retrievals were within the range of values expected from the historical in-situ observations, with RTA20 showing a similar trend to the in-situ data, with a peak between 1 to 3 mg/m3 (x-axis). This peak was observed between concentrations of 2 to 4 mg/m3 Chl-a for the OC2 algorithm, and represents a moderate overestimation. The highest peak around 15% (y-axis) against the Chl-a range of 0.0 to 0.5 mg/m3 represents an overestimation in Chl-a concentration, and the second highest peak, at 7%, reveals that the OC3 algorithm has estimated the majority of Chl-a data in the 5 to 8 mg/m3 range throughout the study period. These two peaks in OC3 retrievals do not correspond to the in-situ Chl-a data, hence making it a less reliable algorithm for the coastal waters Chl-a estimation.

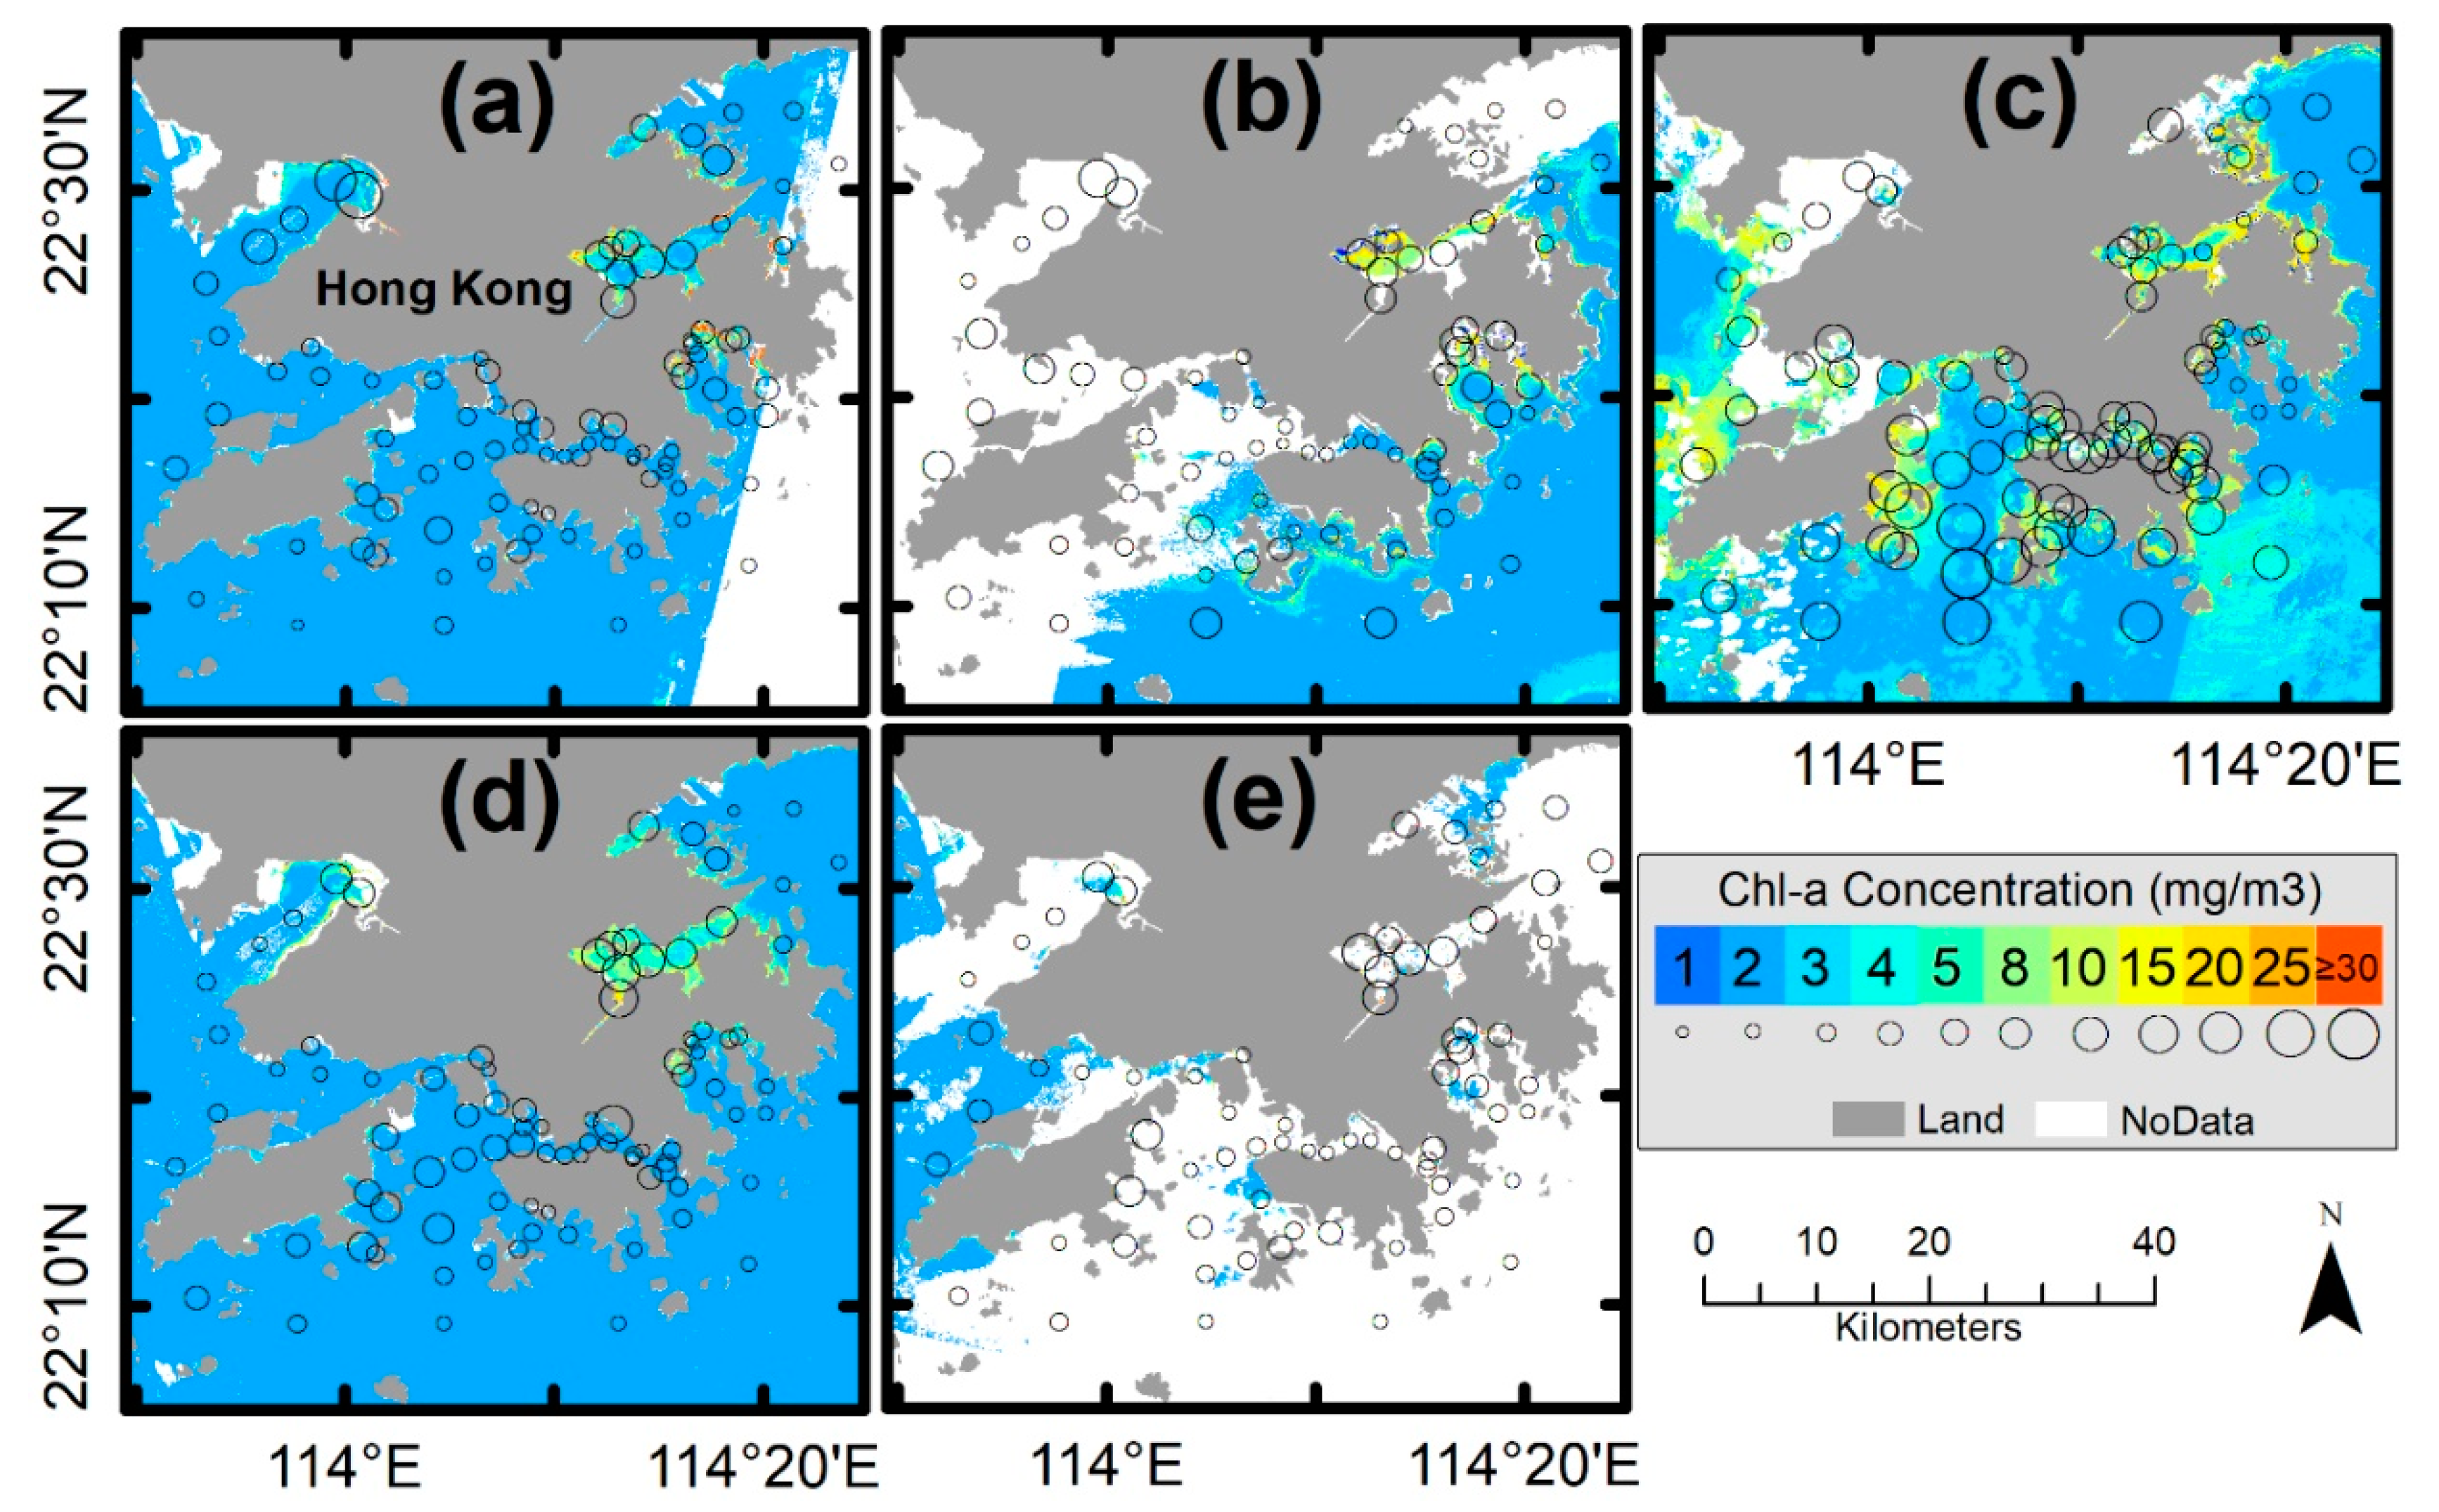
4.3. Synoptic Mapping of Chl-a Concentration

Based on the satisfactory performance of RTA20, this algorithm was used for synoptic mapping of Chl-a concentrations in the coastal waters around Hong Kong. For this purpose, L8 scenes from April 2013 to December 2018 were averaged for each month, i.e., representing six years (2013–2018) of monthly average Chl-a concentrations. Again, only quality-assured pixels/scenes were used for the generation of synoptic maps. The pixels/scenes/months which encountered atmospheric correction failure, sun glint, high satellite zenith angle, cloud, cloud shadow or high solar zenith angle, were discarded. This gave only the months of January, February, July, November and December (Figure 3) for producing the synoptic maps of Chl-a concentrations. These maps were overlaid with the in-situ observed Chl-a concentration (Figure 3; hollow graduated circles) for the same month (averaged from 2013 to 2018 for each respective month). Higher Chl-a concentrations were observed throughout the study period in the north-eastern part of Hong Kong. Overall, the RTA20-derived Chl-a was found in good agreement with the in-situ Chl-a observations, except for the month of July, where an underestimation was observed in the central waters of Hong Kong.

5. Conclusions and Recommendations

Recently, the open-source availability of the Landsat-8 (L8) Provisional Aquatic Reflectance (L8PAR) product has provided a new application possibility for L8 imagery. Similar to the previous Landsat missions, the L8 Operational Land Imager (OLI) was also designed for land-based applications as a continuation, but the addition of a new coastal/aerosol band and the higher Signal to Noise Ratio (SNR) have enhanced its usability for ocean color remote sensing. This study was designed to test the potential of L8PAR by developing a regionally tuned Chlorophyll-a (Chl-a) algorithm over Hong Kong, by evaluating previously developed regional algorithms and ocean color algorithms. The preliminary results indicate that L8PAR has potential for the estimation of coastal water Chl-a, as the Regionally Tuned Algorithm developed in this study (RTA20) was significantly better than the previous algorithms (RTA16, RTA17 and RTA19) and the ocean color algorithms OC2 and OC3. The better performance of RTA20 is due to the employment of L8PAR, which was derived through an over-water atmospheric correction approach, while the previous algorithms were based on the usage of over-land atmospheric correction methods, and were used with Landsat Thematic Mapper (TM) and Enhanced Thematic Mapper Plus (ETM+) sensors. Although inferior to the RTA20, the OC2 algorithm also shows acceptable performance. One reason for the inferior performance of OC2 and OC3 algorithms may be the lower representation of the coastal areas in the NOMAD (NASA bio-Optical Marine Algorithm Dataset). In NOMAD, validation data are only available for the eastern coastal area of North America, South Korea and the western coast of South Africa. Therefore, the ocean color algorithms should be used with caution for the retrieval of WQPs for other coastal areas. These preliminary validation results recommend the operational usage of the OC2 algorithm for L8 Chl-a product generation for coastal areas globally, while RTA20 can be used as a regional algorithm for the routine monitoring of Chl-a concentrations around the coastal areas of Hong Kong and other similar coastal areas elsewhere.
The L8PAR data are only available for bands 1 to 4, and not for NIR (B5) and SWIR (B6 and B7) bands, as these infra-red bands are used when performing the atmospheric correction. This is a limitation of the L8PAR product and may restrict its applicability. To sort out this issue, we recommend the use of other over-water atmospheric correction methods such as ACOLITE, iCOR or other available approaches to derive the Rrs for the Visible, NIR and SWIR bands of L8 OLI. Hence, a more robust approach could be developed for the estimation of the different WQPs. As the standard surface reflectance products provided by the USGS are based on the land-based atmospheric correction method (6S), care should be taken when using these products.
Launched on June 2015 and March 2017, the Multi-spectral Instrument (MSI) aboard Sentinel-2 A and B satellites have similar wavebands as L8 OLI. Therefore, if a similar product to L8PAR can be operationally generated from these satellite data, it will greatly benefit coastal water managers, enabling more frequent measurements of water quality parameters.

Supplementary Materials

The following are available online at https://0-www-mdpi-com.brum.beds.ac.uk/2072-4292/12/12/1938/s1, Figure S1. Hong Kong Environmental Protection Department water control zones and monitoring stations. Table S1: Summary of quality assured match-up pairs of EPD and L8PAR data; Table S2. Pearson’s correlation coefficient (r) and statistical significance (p-value) for L8 derived Rrs of band their combinations with in-situ Chl-a concentration. Where AV represents the average.

Author Contributions

Conceptualization, M.N.; methodology, M.N. and M.B.; software, M.N, M.B. and B.K.G.; validation, M.N., formal analysis, M.N.; investigation, M.N.; resources, M.N. and W.W.; data curation, M.N.; writing—original draft preparation, M.N.; writing—review and editing, M.N., M.B., J.E.N., W.W., M.M.M.A., M.I.S. and B.K.G.; visualization, M.N.; funding acquisition, M.N. and W.W. All authors have read and agreed to the published version of the manuscript.

Funding

This research was supported by the East China University of Technology, Nanchang China through the Research Startup Funding to Majid Nazeer through grant number DHBK2019003 (110/1410000537) and to Weicheng Wu (Grant No. DHTP2018001), who was also supported by the Jiangxi Talent Program.

Acknowledgments

The authors would like to thank, the USGS for the distribution of Landsat-8 OLI data products, the Hong Kong Environmental Protection Department for providing the coastal water quality data, the RStudio team for the development and support of the R software, and the three anonymous reviewers and the editors for their constructive feedback on this manuscript.

Conflicts of Interest

The authors declare no conflict of interest. The funders had no role in the design of the study; in the collection, analyses, or interpretation of data; in the writing of the manuscript, or in the decision to publish the results.

References

  1. Werdell, P.J.; Bailey, S.W. An improved in-situ bio-optical data set for ocean color algorithm development and satellite data product validation. Remote Sens. Environ. 2005, 98, 122–140. [Google Scholar] [CrossRef]
  2. Franz, B.A.; Bailey, S.W.; Kuring, N.; Werdell, P.J. Ocean color measurements with the Operational Land Imager on Landsat-8: Implementation and evaluation in SeaDAS. J. Appl. Remote Sens. 2015, 9, 096070. [Google Scholar] [CrossRef]
  3. Pahlevan, N.; Schott, J.R.; Franz, B.A.; Zibordi, G.; Markham, B.; Bailey, S.; Schaaf, C.B.; Ondrusek, M.; Greb, S.; Strait, C.M. Landsat 8 remote sensing reflectance (Rrs) products: Evaluations, intercomparisons, and enhancements. Remote Sens. Environ. 2017, 190, 289–301. [Google Scholar] [CrossRef]
  4. Shahzad, M.I.; Meraj, M.; Nazeer, M.; Zia, I.; Inam, A.; Mehmood, K.; Zafar, H. Empirical estimation of suspended solids concentration in the Indus Delta Region using Landsat-7 ETM+ imagery. J. Environ. Manag. 2018, 209, 254–261. [Google Scholar] [CrossRef]
  5. Nazeer, M.; Wong, M.S.; Nichol, J.E. A new approach for the estimation of phytoplankton cell counts associated with algal blooms. Sci. Total Environ. 2017, 590–591, 125–138. [Google Scholar] [CrossRef] [PubMed]
  6. Nazeer, M.; Nichol, J.E. Improved water quality retrieval by identifying optically unique water classes. J. Hydrol. 2016, 541, 1119–1132. [Google Scholar] [CrossRef]
  7. Nazeer, M.; Nichol, J.E. Development and application of a remote sensing-based Chlorophyll-a concentration prediction model for complex coastal waters of Hong Kong. J. Hydrol. 2016, 532, 80–89. [Google Scholar] [CrossRef]
  8. Hafeez, S.; Wong, M.; Ho, H.; Nazeer, M.; Nichol, J.; Abbas, S.; Tang, D.; Lee, K.; Pun, L. Comparison of Machine Learning Algorithms for Retrieval of Water Quality Indicators in Case-II Waters: A Case Study of Hong Kong. Remote Sens. 2019, 11, 617. [Google Scholar] [CrossRef] [Green Version]
  9. Nazeer, M.; Nichol, J.E. Combining Landsat TM/ETM+ and HJ-1 A/B CCD Sensors for Monitoring Coastal Water Quality in Hong Kong. IEEE Geosci. Remote Sens. Lett. 2015, 12, 1898–1902. [Google Scholar] [CrossRef]
  10. Loveland, T.R.; Irons, J.R. Landsat 8: The plans, the reality, and the legacy. Remote Sens. Environ. 2016, 185, 1–6. [Google Scholar] [CrossRef] [Green Version]
  11. Lymburner, L.; Botha, E.; Hestir, E.; Anstee, J.; Sagar, S.; Dekker, A.; Malthus, T. Landsat 8: Providing continuity and increased precision for measuring multi-decadal time series of total suspended matter. Remote Sens. Environ. 2016, 185, 108–118. [Google Scholar] [CrossRef]
  12. Concha, J.A.; Schott, J.R. Retrieval of color producing agents in Case 2 waters using Landsat 8. Remote Sens. Environ. 2016, 185, 95–107. [Google Scholar] [CrossRef] [Green Version]
  13. Senay, G.B.; Friedrichs, M.; Singh, R.K.; Velpuri, N.M. Evaluating Landsat 8 evapotranspiration for water use mapping in the Colorado River Basin. Remote Sens. Environ. 2016, 185, 171–185. [Google Scholar] [CrossRef] [Green Version]
  14. Hong Kong Environmental Protection Department. Marine water quality in Hong Kong in 2018; 2020. Available online: http://wqrc.epd.gov.hk/pdf/water-quality/annual-report/MarineReport2015eng.pdf (accessed on 23 April 2020).
  15. U.S Geological Survey. Landsat Provisional Aquatic Reflectance Product Guide (version 1.0); 2020. Available online: https://www.usgs.gov/media/files/landsat-provisional-aquatic-reflectance-product-guide (accessed on 1 April 2020).
  16. Park, K.-A.; Chae, H.-J.; Park, J.-E. Characteristics of satellite chlorophyll- a concentration speckles and a removal method in a composite process in the East/Japan Sea. Int. J. Remote Sens. 2013, 34, 4610–4635. [Google Scholar] [CrossRef]
  17. National Aeronautics and Space Administration. Chlorophyll a (chlor_a); 2020. Available online: https://oceancolor.gsfc.nasa.gov/atbd/chlor_a/#sec_2 (accessed on 12 April 2020).
  18. Nazeer, M.; Bilal, M.; Alsahli, M.; Shahzad, M.; Waqas, A. Evaluation of Empirical and Machine Learning Algorithms for Estimation of Coastal Water Quality Parameters. ISPRS Int. J. Geo-Inf. 2017, 6, 360. [Google Scholar] [CrossRef] [Green Version]
  19. Zhang, Y.; Ma, R.; Duan, H.; Loiselle, S.; Zhang, M.; Xu, J. A novel MODIS algorithm to estimate chlorophyll a concentration in eutrophic turbid lakes. Ecol. Indic. 2016, 69, 138–151. [Google Scholar] [CrossRef]
  20. Hu, C.; Carder, K.L.; Muller-Karger, F.E. Atmospheric correction of SeaWiFS imagery over turbid coastal waters: A practical method. Remote Sens. Environ. 2000, 74, 195–206. [Google Scholar] [CrossRef]
  21. Vermote, E.; Saleous, N. El Atmospheric correction of visible to middle-infrared EOS-MODIS data over land surfaces: Background, operational algorithm and validation. J. Geophys. Res. 1997, 102, 131–141. [Google Scholar] [CrossRef] [Green Version]
Figure 1. Scatter plots between in-situ Chl-a and L8-derived Chl-a concentrations (N = 28) for six algorithms: (a) RTA20, (b) OC2, (c) OC3, (d) RTA16, (e) RTA17 and (f) RTA19. The solid and dashed lines mark the regression line and 1:1 line, respectively.
Remotesensing 12 01938 g001
Figure 2. Comparison between the in-situ measured (grey colored) and the L8-derived Chlorophyll-a concentrations using RTA20 (red), OC2 (green) and OC3 (blue) algorithms.
Remotesensing 12 01938 g002
Figure 3. Spatial distribution of in-situ (circled) Chl-a (mg/m3) and L8-derived Chl-a concentrations from the RTA20 algorithm averaged for each month from April 2013 to December 2018: (a) January, (b) February, (c) July, (d) November and (e) December. There were no valid pixels for L8PAR-derived Rrs for the remaining months due to the exclusion of pixels based on l2_flags, i.e., atmospheric correction failure, sun glint, high satellite zenith angle (>60°), cloud, cloud shadow or high solar zenith angle (>70°). The color-coded background map represents the L8-derived Chl-a concentrations and the graduated black circles denote the in-situ measured Chl-a concentration averaged from 2013-2018 for the same month.
Remotesensing 12 01938 g003
Table 1. Statistical comparison between the Chl-a estimation algorithms when compared with in-situ Chl-a. The average in-situ Chl-a value for all the matched pairs is 2.28 mg/m3, the values of RMSE and Bias are reported in mg/m3. Total number of observations were 80.
AlgorithmrSlopeInterceptRMSEBiasMean RatioAverage
RTA200.960.770.270.92−0.261.292.02
OC20.846.87−8.4416.124.962.897.24
OC30.80562.80−958.801460.13323.2239.53325.50
RTA160.766.80−7.2116.536.043.858.32
RTA170.765.49−5.5812.964.673.326.95
RTA190.76176.10−121.20524.12278.26158.87280.54

