Article

Effect of Organic Matter Content on the Spectral Signature of Iron Oxides across the VIS–NIR Spectral Region in Artificial Mixtures: An Example from a Red Soil from Israel

by
Daniela Heller Pearlshtien
* and
Eyal Ben-Dor
Remote Sensing Laboratory, Geography Department, Porter School of Environment and Earth Science, Faculty of Exact Science, Tel Aviv University, Tel-Aviv 699780, Israel
*
Author to whom correspondence should be addressed.
Remote Sens. 2020, 12(12), 1960; https://0-doi-org.brum.beds.ac.uk/10.3390/rs12121960
Submission received: 24 May 2020 / Revised: 14 June 2020 / Accepted: 16 June 2020 / Published: 18 June 2020

Abstract

:
The investigation of iron oxides in soil using spectral reflectance is very common. Their spectral signal is significant across the visible–near infrared (VIS–NIR) spectral range (400–1000 nm). However, this range overlaps with other soil chromophores, such as those for water and soil organic matter (SOM). This study aimed to investigate the effect of different SOM species on red soil from Israel, which is rich in hematite iron oxide, under air-dried conditions. We constructed datasets of artificially mixed soil and organic matter (OM) with different percentages of added compost from two sources (referred to as A2 and A5). Eighty subsamples of mixed soil–OM were prepared for each of the OM (compost) types. To investigate the effect of OM on the strong iron-oxide absorbance at 880 nm, we generated two indices: CRDC, the absorbance spectral depth change at 880 nm after continuous removal, and NRIR, the normalized red index ratio using 880 and 780 nm wavelengths. The different OM types influenced the soil reflectance differently. At low %SOM, up to 1.5%, the OM types behaved more similarly, but as the OM content increased, their effect on the iron-oxide signal was greater, enhancing the significant differences between the two OM sources. Moreover, as the SOM content increased, the iron-oxide signal decreased until it was completely masked out from the reflectance spectrum. The masking point was observed at different SOM contents: 4% for A5 and 8% for A2. A mechanism that explains the indirect chromophore activity of SOM in the visible region, which is related to the iron-oxide spectral features, was provided. We also compared the use of synthetic linear-mixing practices (soil–OM) to the authentic mixed samples. The synthetic mixture could not imitate the authentic soil reflectance status, especially across the overlapping spectral position of the iron oxides and OM, and hence may hinder real conditions.

Graphical Abstract

1. Introduction

Qualitative and quantitative detection of iron oxides using reflectance spectroscopy is an important task in soil mapping practice [1,2,3,4,5,6]. Soil iron oxide content reflects the duration and intensity of pedogenic processes [7,8]. Accordingly, they appear as either a standalone crystallized mineral (e.g., hematite (Fe2O3) and goethite (FeOOH)), or a pseudo amorphous entity (e.g., ferryhydrates) that coats the soil particle surface and colors the soil, even if their content is low [5]. The aim of the new NASA mission ‘Earth Surface Mineral Dust Source Investigation’ (EMIT) [9] is to map the surface mineralogy of the soil in order to investigate dust sources with a special emphasis on iron oxides using a hyperspectral remote-sensing sensor onboard the International Space Station (ISS) EMIT will help answer essential scientific questions on whether iron oxide type of aerosol warms or cools the atmosphere, and will enable better modeling of dust transmission. Soil organic matter (SOM) and iron oxides are spectrally active across the visible–near infrared (VIS–NIR) spectral region (400–1000 nm), but their spectral signatures overlap, potentially hindering their identification. Therefore, it is important to study the impact of different types of organic matter (OM) on the spectral signal of iron oxides. Soil is a complex system that is extremely variable in physical and chemical composition both temporally and spatially. Soil spectroscopy, although complex as well, can cluster several soil properties based on their spectral responses and can reduce the dimension of uncertainty in the soil system using multivariate algorithms [10].
In the last few decades, extensive studies have been performed to investigate the role of OM and iron oxides in the soil reflectance spectrum (e.g., [11,12,13,14,15,16,17,18]). OM is spectrally active across the entire VIS–NIR region and different spectral ranges across this region (as well the Short Wave Infra-Red, SWIR; 1000–2500 nm) have been found to correlate with OM content. For example, Mathews et al. [11] found that SOM correlates with reflectance values in the 500–1200 nm range, whereas Beck et al. [13] suggested that the 900–1220 nm region is more suitable for SOM detection. Tian et al. [18] deduced that the entire VIS–NIR spectral range (400–1000 nm) is sensitive to SOM detection. Iron oxides, as either crystallized or amorphous minerals, are also spectrally active across the VIS–NIR region based on the electronic transition of iron cations Fe3+, Fe2+, as summarized by Hunt et al. [6]. The most common iron oxides in Israeli soils are hematite and goethite minerals, whereas their reflectance spectra generally display specific features linked to Fe3+-induced absorption [19]. Along with other non-crystalline iron-oxide fractions, these minerals impact the common reddish color found in these soils. The main absorption of hematite is at around 550 nm and 880 nm (red color) and at 480 nm and near 920 nm (yellowish-brown color) for goethite. Thus, Henderson et al.’s [16] claim that the spectral regions of OM and iron (and Mn) oxides overlap and might spectrally affect each other is not surprising.
Although Sukhdev et al. [1] created an extended review of hyperspectral analysis for iron oxides in soils, the researches mostly considered iron oxides as a standalone parameter in soil. Li et al. [20] suspected that the high content of iron oxides masks the spectral features of SOM in the 600–1000 nm range. Peng et al. [21] showed that the SOM spectrum across the 622–851 nm range is obscured when iron-oxide content is high. Liu et al. [22] investigated the effects of iron oxides on predictions of SOM content using spectral-based models. They used 267 soil samples from South China which were replete with iron oxides to demonstrate that this overlap affects the spectral-based models. Adding the external parameter orthogonalization (EPO) algorithm provided a more accurate model. Richter et al. [23] observed that strong iron absorption makes it difficult to extract SOM content directly from the spectrum. As SOM content varies by up to 10% in mineral soils [24], the opposite effect, i.e., the SOM’s quantitative effects on iron-oxide spectral features is important. Baumgardner et al. [12] suggested that SOM plays a dominant role in spectral properties when its content exceeds 2.0%, but no actual measurements were provided. Galvao and Vitorello [25] demonstrated that SOM obliterates the effect of iron reflectance and color when its content is higher than 1.7%. Whereas there have been many studies on SOM, there is hardly any mention in the literature of differences between OM types (sources) at either low or high SOM contents in mineral soils. This is a crucial factor, as OM is not a homogeneous material and its composition can vary based on the chemical characteristics of its source and the effects of aging [26]. In this study, we systematically examined how the various amounts of different types of OM affect the iron oxides’ spectral signal.
To that end, we physically mixed two different pure decomposed OM types from different origins with a selected red soil from Israel (Rhodoxeralf) and compared the authentic result to a synthetic spectral linear-mixing model. The study reports the spectral effects of increasing levels of these OM types in the soil and provides spectral thresholds for the critical spectral changes, where quantitative assessment might be significantly biased.

2. Materials and Methods

2.1. Soil Samples and Laboratory Measurements

Red sandy soil (Rhodoxeralf) from the Sharon region in the center of Israel was collected, air-dried, and sieved to 2 mm. Hematite mineral is dominant in this soil type, which is characterized by a significant reddish color (Munsell color notation: 5YR 4/4 reddish-brown). Using the spectral proxy models for Israeli soils based on the Israel Soil Spectral Library [27], the following attributes were found: Clay 17%, Silt 0%, Sand 83%, free iron-oxide content (extracted by DCB [28]) 0.87%, and carbonates 0%.
For the OM analog, we selected two types of industrial compost that were systematically added to the red soil to generate a dataset of the same soil with different OM contents. The selected composts were derived from the industrial brands used for planting: Planting mixed titanium and Aben ari (commercial names), which, in this study, are referred to as A2 and A5, respectively (Figure 1). The main composition of both composts is turf enriched with NPK minerals and microelements, and the A5 compost also includes coconut fibers as a major ingredient. The OM was also air-dried, ground, and sieved to 2 mm before mixing it with the soil (see Section 2.2). The natural content of OM in the soil and both composts materials was measured by the loss on ignition (LOI) method under conditions of 400 °C for 8 h after Ben-Dor and Banin [29], who pointed out that for soils of Israel, there is a high correlation between the LOI and Walkley and Black [30] methods. Accordingly, the OM in the natural soil was 0.74%, 81% in A2, and 38% in A5. The difference in OM content in A2 and A5 was based on the nonorganic components in each, their different OM source, and the different composting processes to which they were subjected.

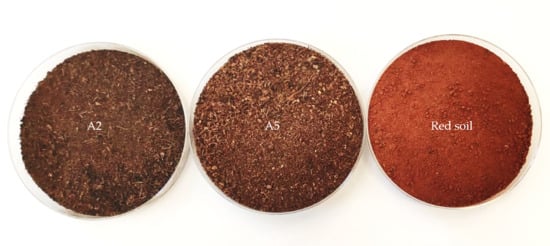
2.2. Artificial Sample Preparation I–Real OM–Soil Mixture (Authentic)

We prepared a set of physical samples composed of different amounts of OM and pure natural soil. The soil was divided into 160 subsamples of 35 g each, with different percentages of added compost (OM): 80 samples with the addition of compost A2 and 80 with added A5. The soil–OM artificial mixture samples were prepared by adding the 2-mm-sieved compost to the 2-mm-sieved soil in increments of 0.105 g (0.3%) OM per sample, increasing the OM content in 40 samples with two repetitions for each sample, thus creating 80 mixed soil–OM samples for each OM type. After mixing the OM with the soil, distilled water was added to the sample to saturation, and the paste was stirred to ensure the mixture’s homogeneity and left to air-dry. The dry mixture was ground again and completely sieved to pass a 2-mm sieve following the methodology in Ogen et al. [31]. This process was applied to approximate the SOM status in a real environment as closely as possible, and can be summarized in the following sequence: (a) First sieving, (b) mixing soil and OM, (c) adding distilled water, (d) second sieving after air-drying. For weight measurements, we used an R200D Electronic Semi-Microbalance (www.sartorius.com) with an accuracy of ±0.00002 g. Table 1 presents the OM contents of the mixtures’ components and their final SOM contents.

2.3. Spectral Measurements

The samples were measured using an ASD FieldSpec® (model FSP 350-2500P). The spectroradiometer has three detectors that supply 2151 bands in the 350–2500 nm spectral range: VIS-NIR (350–1000 nm), SWIR1 (1001–1800 nm), and SWIR2 (1801–2500 nm) with a spectral resolution of 3 nm in the VIS-NIR and 8 nm in the SWIR (1+2) spectral region. Each soil sample was measured three times. Before each measurement, the soil was remixed and prepared again for the spectral measurement. The average of these measurements was calculated using the spectra that gave standard deviations (SD) of less than 3% at 1650 nm. The spectral measurements were conducted according to the standard and protocols suggested by Ben-Dor et al. [32] using Lucky bay (LB) and Wylie bay (WB) internal soil standards to align the soil spectral readings to a benchmark, thereby minimizing systematic effects within the spectral measurement scheme.

2.4. Artificial Sample Preparation II–Spectral OM–Soil Mixture (Synthetic)

We mixed the pure OM and soil spectra in a “synthetic” mathematical way. Pure endmember spectra were linearly mixed using a given, known fraction. This linear-mixing process is widely used to study the effects of mixtures of different materials using pure mineral spectra that have either been measured or taken from a general spectral library (such as USGS [33] or LUCAS [34]). This type of synthetic mixture assumes that the product represents a close-to-real mixture description e.g., [35,36,37]. To examine how our artificial authentic mixtures differ from the synthetic one, we employed a mixed simulation process as follows: The original pure spectra of both OM targets (A2 and A5) were linearly mixed with the pure red soil spectrum (Ref(Mix)), according to the equation:
Ref(Mix) = a%*Ref(Soil) + b%*Ref(OM)
a + b = 100%
where a and b are the fractions of A2 and A5, respectively, Ref(Soil) is the red soil reflectance, and Ref(OM) is the reflectance of A2 or A5.

3. Results

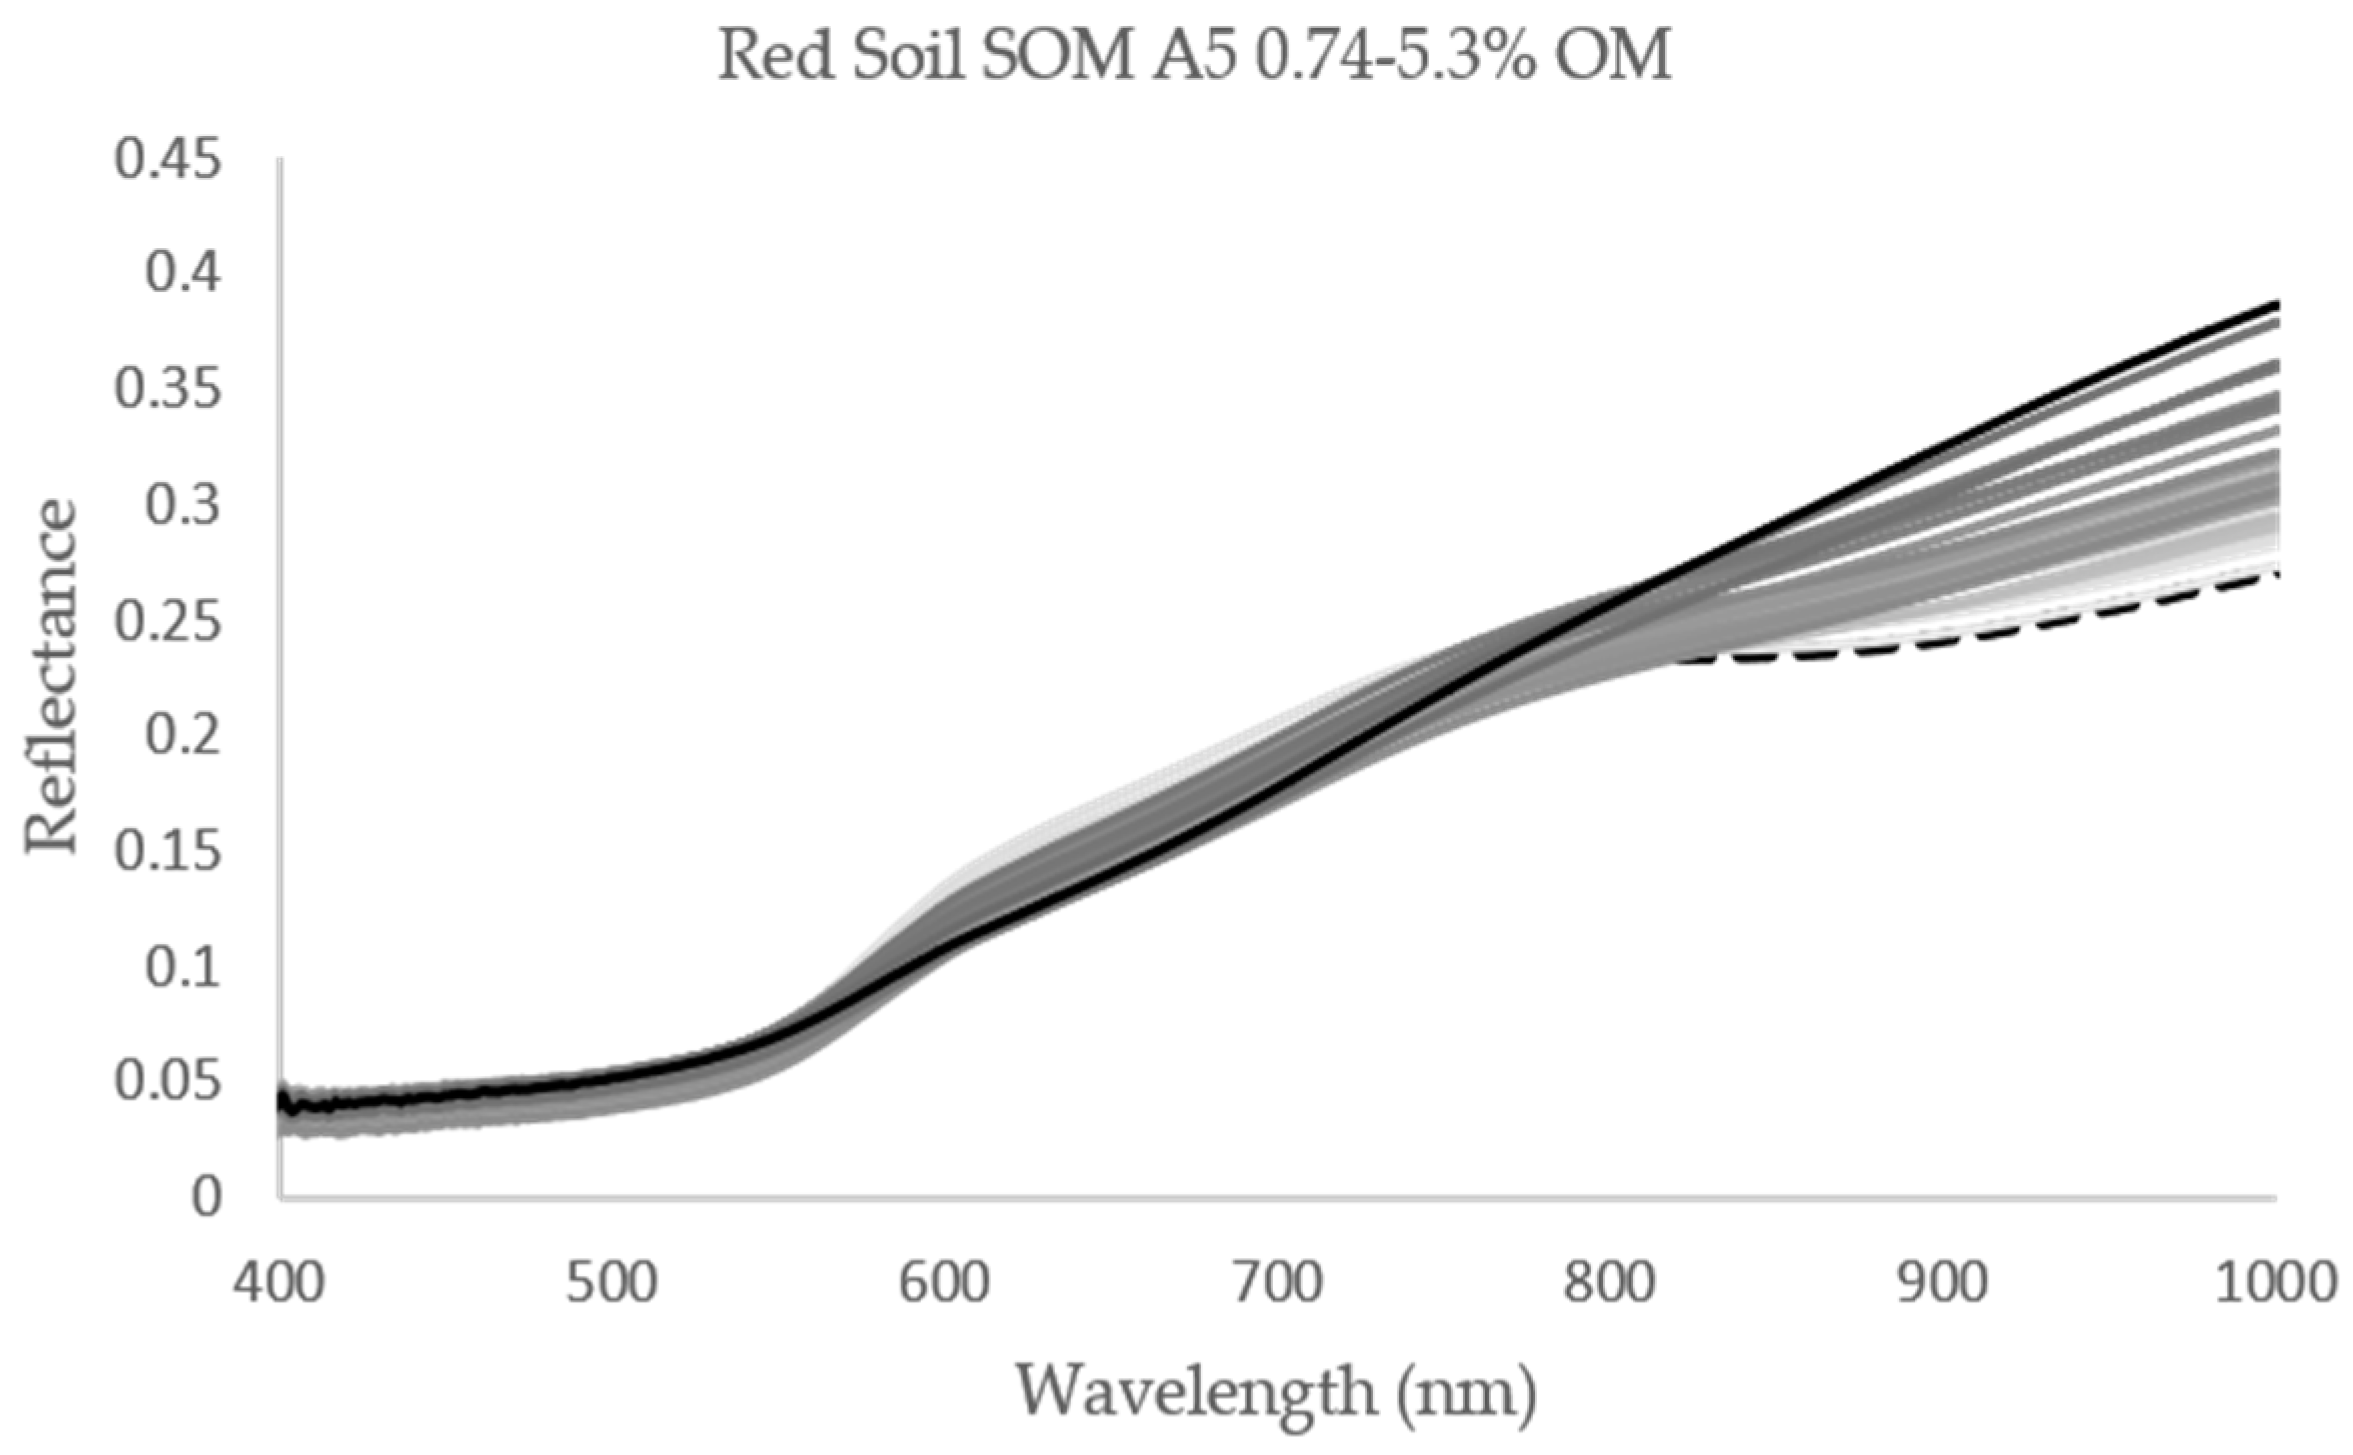
3.1. Pure Spectral Signatures of the OM and the Soil

The reflectance spectra of the two OM sources (A2, A5) and the natural red soil are shown in Figure 2. The soil spectral signature had a significant and broad feature centered at 550 nm and 880 nm due to the strong dominance of hematite in the soil’s total free iron oxides. The mineral is associated with an electron transition of ⁶A1 → ⁴T1g between 750 and 950 nm, and ⁶A1 → ⁴T2g between 550 and 650 nm [5]. The A5 OM’s reflectance maintained a higher albedo than that of OM A2. In Figure 2b, we zoomed in on the VIS–NIR spectral range where the strongest differences in the 400–1000 nm range were visible in the three materials (A2, A5, and red soil). At 550–800 nm, the red soil curve was convex, whereas, for the OM types (A5, A2), it was concave. This was due to the Fe3+ absorbance at 550 nm in the soil, where the OM signals showed the opposite tendency of OM to reduce the reflectance in the spectral range of 550–700 nm [25], where larger amounts of OM across the visible region created a concave curve [38]. In general, the OM affects the spectra by decreasing the overall reflectance and thereby decreasing the spectral contrast, which makes determining a relationship between spectral and physicochemical properties more difficult [39]. Nonetheless, an opposite effect occurred between 800 nm and 1000 nm, where the pure red soil showed a significant but broad absorbance characteristic feature of Fe3+ at around 880 nm that produced a convex structure. The spectral behavior of both OM samples (A2, A5) presented a slight change in slope across the 600–1000 nm spectral range. In this respect, A5 had a steeper slope than A2, mainly because its color was lighter than that of A2 (Munsell color notation of A2 is 7.5 YR 3/1, very dark gray, and of A5, 7.5YR 3/2, dark brown). Moreover, A2 had higher OM content than A5 (81% versus 38%, respectively).

3.2. Mixed Spectral Signatures: First Observation

The 80 mixed samples (two repetitions of 40 samples) for each OM type were grouped into a separate database for further analysis. The mixing process produced soil–A2 with 0.98–10.46% SOM and soil–A5 with 0.85–5.3% SOM (Table 1). Assuming that mineral soils are characterized by <10% SOM [24], the mixtures’ spectra simulated red mineral soil with elevated SOM content from two different OM sources. Figure 3 and Figure 4 show the spectral effects of elevated SOM content using A2 and A5 as the OM sources, respectively. The natural soil spectrum, which was dominated by hematite features at around 550 nm and 880 nm, was strongly affected by the SOM content and species. With increasing SOM (A2 and A5), the reflectance in the VIS–NIR region decreased, and the significant and broad spectral feature of hematite and the spectral baseline of the iron oxides gradually flattened out. Although this occurred for both OM types, different trends were observed: In the soil–A2 mixed spectra, the highest level of SOM was represented by a lower albedo beneath the iron-oxide signal, whereas in the soil–A5 mixed spectra, the highest SOM content produced higher albedo values over the iron-oxide signal. Also, the slope between 600 nm and 900 nm was steeper and divert with A5 than with A2.

3.3. Quantitative Effect of SOM Species on Iron-Oxide Spectral Features

To investigate the effect of the different OM species on the soil signal, we compared the same range of mixed SOM content, ranging between 0.74% and 5.36%. We used the continuum removal (CR) method [40] over the 800–1000 nm iron-oxide peak, where the strongest iron effect was observed before mixing (see Figure 5a,b). The systematic addition of OM to the soil significantly affected the 880 nm absorption spectral signal of Fe3+. This effect was more pronounced with A5 (Figure 5b) than with A2 (Figure 5a). To quantitatively analyze these changes, we used the indices of CR absorption spectral depth change (CRDC) and normalized red index ratio (NRIR).

3.4. Iron-Oxide Indices and OM Effects with Increasing SOM Content

The masking effect of the OM on the iron-oxide spectral signal can be quantitated by the following two constructed indices:
(a)
The spectral change at the maximum depth after CR at 880 nm by calculating the CR Depth Change (CRDC) according to:
%CRDC = ((Dpo − Dps)/(Dpo))*100
where Dpo is the original soil spectral depth [41] at 880 nm after applying the CR from 800–1000 nm, and Dps is the soil–OM mixture’s spectral depth at the same position with the same spectral manipulation.
(b)
The NRIR (Normalized Red Index Ratio) using wavelengths 880 nm and 780 nm, according to the equation:
NRIR = (R(880) − R(780))/(R(880) + R(780))
where R(880) and R(780) are the original reflectance values at these wavelengths for any given soil–OM mixture status. The masking effect of OM on the iron-oxide indices NRIR and CRDC was applied to all 160 mixture samples. The results are presented in Figure 6 and Figure 7.
Figure 6 shows the NRIR between 780 and 880 nm for A2 and A5 (Figure 6a,b, respectively) and both OM types together (Figure 6c for 0–10.46% SOM; Figure 6d for 0–5% SOM). A polynomial trendline was fitted to both OM types with R² values of 0.91 for A2 and 0.82 for A5 (Figure 6a,b). We mathematically compared the trendlines of both A2 and A5 by numerically solving the conjunction point within the NRIR index trendlines. We found that at up to 1.6% SOM (Figure 6d), the effects of both A2 and A5 on the hematite signal were similar. Above 1.6% SOM, the NRIR trendlines separated, and different effects on the iron-oxide signal were observed. Thus, the OM species is not important at low SOM contents (<1.6% in this case) with respect to the masking effect on the iron oxide) spectral signal, but above this threshold, it plays an important role. In fact, at higher SOM content, the OM species is just as important as the SOM content. Figure 7 shows the CRDC values versus SOM content for A2 and A5 (Figure 7a,b, respectively), and for both types in the 0–10.46% and 0–5% SOM range (Figure 7c,d, respectively). For A2 and A5 separately, a polynomial trendline was fitted to SOM with R² of 0.93 and 0.85, respectively. At CDRC = 0, the X value is the initial SOM content in the red soil samples (0.74%). As expected, the effect of SOM on the iron-oxide absorbance band at 880 nm was significant and well observed at the highest SOM content. Although this change occurred with both OM materials (A2 and A5), we selected 25% change in the CRDC value (CRDC25) as a threshold above which the SOM markedly affects the iron-oxide signals and perhaps also hinders its estimation. The CRDC25 at 25% change was found to be 1.9% for A2 and 1.6% for A5, which is close to the point previously found to separate the OM effect on the iron-oxide signal between A2 and A5 (1.6%). Just as with the NRIR index, the trendlines for both OM types began together and separated above 1.5% SOM (Figure 7d). Moreover, at 4% SOM, A5 obliterated the iron-oxide absorbance at 880 nm, whereas A2 was only affected by a 50% change in absorbance. The iron-oxide absorbance was completely masked by A5 SOM at 4% and by A2 SOM at 8% (Figure 7c).

3.5. Artificial Soil–OM Mixtures: “Synthetic” Versus “Authentic”

Nine synthetic mixtures of soil and OM ranging from 0.85–4.1% SOM were generated by applying a spectral linear-mixing calculation using the pure natural soil and OM spectra of both A2 and A5 (see Section 2.4). Figure 8 and Figure 9 show the spectra of the authentic mixtures and synthetic mixtures in this %SOM range. The figures present the reflectance across 400–1000 nm for both authentic and synthetic mixtures using A2 and A5 (Figure 8a,b and Figure 9a,b, respectively) and the CR manipulation of the original reflectance between 800 nm and 1000 nm that covered the major iron-oxide absorption feature at 880 nm for A2 and A5 (Figure 8c,d and Figure 9c,d, respectively). For both A2 and A5, the results are conclusive: At the lower %SOM, the synthetic mixture simulation did not show any of the spectral effects seen with the authentic groups. As previously discussed, significant changes can be obtained in the authentic groups with both OM types. In the synthetic A2 and A5 mixtures, we barely see any changes, especially above the suggested CRDC25 threshold at 880 nm with elevated SOM content, where a slight effect can be observed only for A5. From the previous observation using the authentic soil–A5 mixture, the iron-oxide absorbance was more affected by A5 than A2. The significant effect of the OM on the iron-oxide spectral signal was therefore neglected or very weak in the synthetic mixture. This raises a question as to the validity of using synthetic linear-mixing processes with pure minerals and OM (and perhaps also other groups of minerals).
We also calculated the CDRC and NRIR indices (see Section 3.4) for the synthetic mixtures and compared them to the authentic samples in the low-SOM content range (≤4.1% OM). Figure 10 presents the synthetic mixtures and authentic (real) CDRC (Figure 10a,b) and NRIR (Figure 10c,d) values versus the OM content in the soil mixture. The synthetic mixtures with A2 and with A5 barely affected the 880 nm absorption signals. Moreover, the synthetic mixture’s CRDC value did not even reach the 25% threshold value, which was previously suggested for significant spectral changes (see Figure 10a,b).

4. Discussion

A significant effect of OM on the spectral signal of iron oxide in red soil was observed at around 800–1000 nm. Although the spectral changes were visible at low OM content (0.85–1.5% SOM), we set a threshold of 25% spectral change, above which the effect was significant. The SOM values under this threshold were found to be around 1–2%. It is interesting to note that Baumgardner et al. [12] concluded that a quantitative assessment of SOM can only be achieved when it is above 2%. This stands in good agreement with Galvao and Vitorello [25], who found that the threshold value for masking out the iron-oxide signal is 1.7% SOM. It is then possible that the OM spectral assessment is strongly controlled by the iron-oxide signal. It is also interesting to note that at around 2% SOM, the OM effect began to depend on its type. Here, A2 and A5 had different spectral effects on the iron-oxide signal, especially above 2% SOM. This suggests that in OM-rich soils, SOM exerts a significant effect on the iron-oxide spectral response.
Many studies have reported that the spectral slope across the VIS–NIR region is a sufficient parameter to assess OM content e.g., [18,26,42,43,44], while others have provided specific spectral features across the VIS–NIR region [16,45,46,47]. Nonetheless, in the literature, there is no concrete explanation for these OM spectral assignments in the VIS–NIR spectral region. The slope in the visible region may be related to the irregularity of OM particles relative to the shape of the mineral, characterized by different scattering effects that then control the slope. The specific wavelengths reported in this region call for a more concrete explanation because OM itself has no absorption features in the VIS–NIR region except, most likely, chlorophyll residue at 670 nm [26]. Accordingly, and based on the results of this paper, we propose the following mechanism:
The iron oxides in mineral soils act as a stable background for the OM spectral response. As the slope of the OM in the VIS–NIR region increases with increasing OM, it actually, and practically, masks the stable iron-oxide spectral response (where iron oxides are present). Accordingly, when a specific wavelength is extracted in the spectral-based SOM models, it measures the changes in the iron-oxide absorption features due to the OM masking effect, and not only the change in the OM slope. As crystallized iron oxides have a specific wavelength (depending on environmental conditions), the spectral-based models that report specific wavelengths are based on the spectral features of the iron (or other) oxides in the soils. Accordingly, the SOM estimation by reflectance across the VIS–NIR region is subject to the soil-formation process, where iron oxides and OM are formed according to the five major soil-forming factors [48]. As the iron-oxide absorption features and the SOM spectral response can differ from one climate zone to another, caution must be exercised in establishing a generic model to assess OM in the presence of iron-oxide or vice versa. It should be noted that several studies have reported a saturation phenomenon with increasing SOM percentage e.g., [12,25]. The proposed mechanism can explain the nonlinearity of the OM’s masking effect on the iron oxide absorption signal. The results of this paper showed that below 1–1.5% SOM caused less than 25% change in the iron-oxide absorption band, the masking effect was robust, and no difference was observed between the two OM types (A2 and A5). Above this threshold, each OM species had a distinct spectral effect. This observation should be considered when different climatogenic soils are used to assess SOM spectrally. In an arid region where SOM content is low, no distinction between OM sources is necessary and a generic spectral-based model to assess SOM may be possible. In more humid regions, however, where the OM may change and the SOM content may be high, such a model should be generated with caution.
Based on this discussion, we can conclude that if spectral modeling is used to predict SOM content from soil spectroscopy information, both the origin of the SOM and the soil’s mineralogy need to be taken into account to improve SOM-detection accuracy. This may pose a problem if a robust SOM spectral analysis is conducted using continental or global soil spectral libraries in which both the iron oxides and the OM species might vary. As the VIS–NIR spectral region has some limitations in predicting SOM, as already noted, we strongly suggest that the entire spectral VIS–NIR–SWIR region be used for such predictions to obtain more spectral information as examined here.
It goes without saying that the opposite effect may also be significant, i.e., the analysis of iron oxides in the soil might be significantly affected by both OM content (up to 25% change at 1–2% SOM) and OM species (above 25% change at 2–10% SOM). This observation should be taken into account in any attempt to quantitatively estimate soil iron-oxide content using reflectance spectroscopy if the SOM content is above 2%.
The significant difference between authentic and synthetic mixtures occurs because of the complex situation in the authentic soil system relative to the simple linear-mixing effects (Hapke 1980 [49]). Both organic and mineral particles have different shapes and irregularities that affect the soil’s reflectivity differently across the VIS–NIR region. In the real world, OM is not a standalone endmember. Instead, it interacts with the soil minerals in many nonlinear processes. This makes it highly risky to try to mimic a real-life soil spectrum using the linear mixing of pure spectra taken from a spectral library or simple measurements. As soil is a complex system, we attempted to minimize other effects that might hinder accurate iron-oxide analysis, such as soil moisture and particle-size distribution. The carefully prepared authentic mixtures used in this study, although far from real natural conditions, nevertheless better represent “natural” conditions than the synthetic mixtures, and highlight the importance of the OM species in the spectral masking effect. Thus, a synthetic mixture of soil components such as OM and iron oxides (and perhaps also other soil minerals) should be used to form soil spectral analogs with caution. Any materials in such a mixture will have chemical and physical interactions amongst themselves, such as electrostatic adsorption, van der Waals bonding effects, and other physical adsorption processes that may bias the linear relationships. The authentic mixture as used here, with a preparation stage that renders it sufficiently homogeneous, is a more reliable approach to investigating such effects by simulating a near-real natural environment, thereby providing insight into the effects of two significant soil chromophores in the VIS–NIR region.

5. Conclusions

The origin of the OM has an effect on soil reflectance in the VIS–NIR region. At low SOM content, up to 1.5%, the two OM types behaved more similarly. However, as the OM content increased beyond this level, their effect on the iron-oxide signal was greater and different: A5 OM obliterated the iron-oxide signal at 4% SOM and A2 at 8% SOM. The overlapping spectral responses of OM and iron oxides in the VIS–NIR spectral region should be taken into account when both iron-oxide and OM contents in the soil are to be spectrally estimated due to this eventual obliteration ("saturation") effect of OM on the iron-oxide spectral signal. We set 25% spectral change as the threshold above which precaution should be taken in the quantitative assessment of iron oxides; this threshold corresponded to 1.9% and 1.6% SOM content for soil–A2 and soil–A5 authentic mixtures, respectively. The iron-oxide spectral feature acts as a secondary chromophore in the assessment of OM content where the saturation plot between OM content and the soil’s spectral response is due to the complete masking effect of the OM spectral response on the iron-oxide signal. The use of synthetic mixing models in soil research is problematic, especially if OM and mineral endmembers are mixed. The problem stems from the inability to mimic the nonlinear processes occurring in the complex soil system. Although this paper provides a case study of only two OM species and one soil sample, it demonstrates the problem posed by mixtures in soils and calls for an investigation of more mixtures that may be used in quantitative and qualitative analyses of soil spectral information. It is important to note that this paper presents an individual and artificial case study that highlights the effect of OM on iron-oxide spectral features. More studies investigating other soils and different types of OM, which better represent the natural interaction between soil minerals and OM, are strongly warranted.

Author Contributions

E.B.-D.: Raised the scientific question, supervised the research, and co-wrote the paper; D.H.P.: Designed the experiment, performed the experiment, analyzed the data, and co-wrote the paper. All authors have read and agreed to the published version of the manuscript.

Funding

This research received no external funding.

Conflicts of Interest

The authors declare no conflict of interest.

References

  1. Sukhdev Kayande, K.; Deshmukh, R.R.; Vinod Janse, P.; Kayte, J.N.; Ambedkar, B. Hyper spectral analysis of soil iron oxide using PLSR method: A review. Int. J. Future Rev. Comp. Sci. Commun. Eng. 2018, 337–341. [Google Scholar]
  2. Barrón, V.; Torrent, J. Diffuse reflectance spectroscopy of iron oxides. In Encyclopedia of Surface and Colloid Science; CRC Press: Boca Raton, FL, USA, 2002; Volume 1, pp. 1438–1446. [Google Scholar]
  3. Genú, A.M.; Dematte, J.A.M. Determination of soil attribute contents by means of reflected electromagnetic energy. Int. J. Remote Sens. 2006, 27, 4807–4818. [Google Scholar] [CrossRef]
  4. Ben-Dor, E. Quantitative remote sensing of soil properties. Adv. Agron. 2002, 75, 173–243. [Google Scholar] [CrossRef]
  5. Ben-Dor, E.; Levin, N.; Singer, A.; Karnieli, A.; Braun, O.; Kidron, G.J. Quantitative mapping of the soil rubification process on sand dunes using an airborne hyperspectral sensor. Geoderma 2006, 131, 1–21. [Google Scholar] [CrossRef]
  6. Hunt, G.R.; Salisbury, J.W.; Lenhoff, A. Visible and near-infrared spectra of minerals and rocks: III Oxides and hydroxides. Mod. Geol. 1971, 2, 195–205. [Google Scholar]
  7. Stucki, J.W.; Bernard, A.; Goodman, U.S. Iron in Soils and Clay Minerals; Springer: Berlin/Heidelberg, Germany, 2012. [Google Scholar]
  8. Arduino, E.; Barberis, E.; Ajmone Marsan, F.; Zanini, E.; Franchini, M. Iron oxides and clay minerals within profiles as indicators of soil age in Northern Italy. Geoderma 1986, 37, 45–55. [Google Scholar] [CrossRef]
  9. NASA’s Earth Observing System. Earth Surface Mineral Dust Source Investigation (EVI-4) (EMIT on ISS). Available online: https://eospso.gsfc.nasa.gov/missions/earth-surface-mineral-dust-source-investigation-evi-4 (accessed on 16 June 2020).
  10. Sørensen, L.K.; Dalsgaard, S. Determination of clay and other soil properties by near infrared spectroscopy. Soil Sci. Soc. Am. J. 2005, 69, 159. [Google Scholar] [CrossRef]
  11. Mathews, H.L.; Cunningham, R.L.; Peterson, G.W. Spectral reflectance of selected Pennsylvania soils. Soil Sci. Soc. Am. J. 1973, 37, 421–424. [Google Scholar] [CrossRef]
  12. Baumgardner, M.F.; Kristof, S.J.; Johannsen, C.J.; Zachary, A.L. Effects of organic matter on the multispectral properties of soils. Proc. Indian Acad. Sci. 1970, 79, 413–422. [Google Scholar]
  13. Beck, R.H.; Robinson, B.F.; McFee, W.H.; Peterson, J.B. Spectral Characteristics of Soils Related to the Interaction of Soil Moisture, Organic Carbon and Clay Content; LARS Information Note 081176; Laboratory Application of Remote Sensing, Purdue University: West Lafayette, IN, USA, 1976. [Google Scholar]
  14. Karmanova, L.A. Effect of various iron compounds on the spectral reflectance and color of soils. Sov. Soil Sci. 1981, 13, 53–60. [Google Scholar]
  15. Stoner, E.R.; Baumgardner, M.F. Characteristic variations in reflectance of surface soils. Soil Sci. Soc. Am. J. 1981, 45, 1161–1165. [Google Scholar] [CrossRef] [Green Version]
  16. Henderson, T.L.; Baumgardner, M.F.; Franzmeier, D.P.; Stott, D.E.; Coster, D.C. High dimensional reflectance analysis of soil organic matter. Soil Sci. Soc. Am. J. 1992, 56, 865–872. [Google Scholar] [CrossRef]
  17. Viscarra Rossel, R.A.; Tehrens, B. Using data mining to model and interpret soil diffuse reflectance spectra. Geoderma 2010, 158, 46–54. [Google Scholar] [CrossRef]
  18. Tian, Y.; Zhang, J.; Yao, X.; Cao, W.; Zhu, Y. Laboratory assessment of three quantitative methods for estimating the organic matter content of soils in China based on visible/near-infrared reflectance spectra. Geoderma 2013, 202–203, 161–170. [Google Scholar] [CrossRef]
  19. Madeira, J.; Bedidi, A.; Cervelle, B.; Pouget, M.; Flay, N. Visible spectrometric indices of hematite (Hm) and goethite (Gt) content in lateritic soils: The application of a Thematic Mapper (TM) image for soil-mapping in Brasilia, Brazil. Int. J. Remote Sens. 1997, 18, 2835–2852. [Google Scholar] [CrossRef]
  20. Li, D.; Chen, X.; Peng, Z.; Chen, S.; Chen, W.; Han, L.; Li, Y. Prediction of soil organic matter content in a litchi orchard of South China using spectral indices. Soil Tillage Res. 2012, 123, 78–86. [Google Scholar] [CrossRef]
  21. Peng, J.; Li, X.; Zhou, Q.; Shi, Z.; Ji, W.; Wang, J. Influence of iron oxide on the spectral characteristics of organic matter. J. Remote Sens. (Yaogan Xuebao) 2013, 17, 1396–1412. [Google Scholar] [CrossRef]
  22. Liu, Y.; Xie, X.; Wang, M.; Zhao, Q.; Pan, X. Removing the effects of iron oxides from Vis-NIR spectra for soil organic matter prediction. Soil Sci. Soc. Am. J. 2018, 82, 87–95. [Google Scholar] [CrossRef]
  23. Richter, N.; Chabrillat, S.; Kaufmann, H.; Gfz, G.P.; Sensing, S.R. Preliminary analysis for soil organic carbon determination from spectral reflectance in the frame of the EU project DeSurvey. In Proceedings of the 1st International Conference on Remote Sensing and Geoinformation in the Assessment of Land Degradation and Desertification, Trier, Germany, 7–9 September 2005. [Google Scholar]
  24. Soil Survey Stuff. Soil Taxonomy: A Basic System of Soil Classification for Making and Interpreting Soil Surveys, 2nd ed.; Natural Resources Conservation Service, U.S. Department of Agriculture: Washington, DC, USA, 1999.
  25. Galvao, L.S.; Vitorello, I. Role of organic matter in obliterating the effects of iron on spectral reflectance and colour of Brazilian tropical soils. Int. J. Remote Sens. 1998, 19, 1969–1979. [Google Scholar] [CrossRef]
  26. Ben-Dor, E.; Inbar, Y.; Chen, Y. The reflectance spectra of organic matter in the visible near infrared and short-wave infrared region (400–2500 nm) during a control decomposition process. Remote Sens. Environ. 1997, 61, 1–15. [Google Scholar] [CrossRef]
  27. Carmon, N.; Ben-Dor, E. An advanced analytical approach for spectral—Based modelling of soil properties. Int. J. Emerg. Technol. Adv. Eng. 2017, 7, 90–97. [Google Scholar] [CrossRef]
  28. Mehra, O.P. Iron oxide removal from soils and clays by a dithionite-citrate system buffered with sodium bicarbonate. Clays Clay Miner. 1958, 7, 317–327. [Google Scholar] [CrossRef]
  29. Ben-Dor, E.; Banin, A. Determination of organic matter content in arid-zone soils using a simple “loss-on-ignition” method. Commun. Soil Sci. Plant Anal. 1989, 20, 1675–1695. [Google Scholar] [CrossRef]
  30. Walkley, A.; Black, I.A. An examination of the degtjareff method for determining organic carbon in soils: Effect of variations in digestion conditions and of inorganic soil constituents. Soil Sci. 1934, 63, 251–263. [Google Scholar] [CrossRef]
  31. Ogen, Y.; Neumann, C.; Chabrillat, S.; Goldshleger, N.; ben Dor, E. Evaluating the detection limit of organic matter using point and imaging spectroscopy. Geoderma 2018, 321, 100–109. [Google Scholar] [CrossRef]
  32. Ben Dor, E.; Ong, C.; Lau, I.C. Reflectance measurements of soils in the laboratory: Standards and protocols. Geoderma 2015, 245–246, 112–124. [Google Scholar] [CrossRef]
  33. United States Geological Survey (USGS). USGS High Resolution Spectral Library. Available online: https://www.usgs.gov/energy-and-minerals/mineral-resources-program/science/usgs-high-resolution-spectral-library?qt-science_center_objects=0#qt-science_center_objects (accessed on 19 April 2020).
  34. European Soil Data Centre (ESDAC). LUCAS: Land Use and Coverage Area frame Survey. Available online: https://esdac.jrc.ec.europa.eu/projects/lucas (accessed on 19 April 2020).
  35. Adams, J.B.; Smith, M.O.; Johnson, P.E. Spectral mixture modeling: A new analysis of rock and soil types at the Viking Lander 1 Site. J. Geophys. Res. 1986, 91, 8098. [Google Scholar] [CrossRef]
  36. Settle, J.J.; Drake, N.A. Linear mixing and the estimation of ground cover proportions. Int. J. Remote Sens. 1993, 14, 1159–1177. [Google Scholar] [CrossRef]
  37. García-Haro, F.J.; Gilabert, M.A.; Meliá, J. Linear spectral mixture modelling to estimate vegetation amount from optical spectral data. Int. J. Remote Sens. 1996, 17, 3373–3400. [Google Scholar] [CrossRef]
  38. Huete, A.R.; Escadafal, R. Assessment of biophysical soil properties through spectral decomposition techniques. Remote Sens. Environ. 1991, 35, 149–159. [Google Scholar] [CrossRef]
  39. Ladoni, M.; Bahrami, H.A.; Alavipanah, S.K.; Norouzi, A.A. Estimating soil organic carbon from soil reflectance: A review. Precis. Agric. 2010, 11, 82–99. [Google Scholar] [CrossRef]
  40. Clark, R.N.; Roush, T.L. Reflectance spectroscopy: Quantitative analysis techniques for remote sensing applications. J. Geophys. Res. Solid Earth 1984, 89, 6329–6340. [Google Scholar] [CrossRef]
  41. Clark, R.N. Spectroscopy of Rocks and Minerals, and Principles of Spectroscopy; John Wiley and Sons, Inc.: Hoboken, NJ, USA, 1999. [Google Scholar]
  42. Shepherd, K.D.; Walsh, M.G. Development of reflectance spectral libraries for characterization of soil properties. Soil Sci. Soc. Am. J. 2002, 66, 988–998. [Google Scholar] [CrossRef]
  43. Bartholomeus, H.M.; Schaepman, M.E.; Kooistra, L.; Stevens, A.; Hoogmoed, W.B.; Spaargaren, O.S.P. Spectral reflectance-based indices for soil organic carbon quantification. Geoderma 2008, 145, 28–36. [Google Scholar] [CrossRef]
  44. Chen, F.; Kissel, D.E.; West, L.T.; Adkins, W. Field-scale mapping of surface soil organic carbon using remotely sensed imagery. Soil Sci. Soc. Am. J. 2000, 64, 746–753. [Google Scholar] [CrossRef] [Green Version]
  45. Daniel, K.W.; Tripathi, N.K.; Honda, K.; Apisit, E. Analysis of vnir (400–1100 nm) spectral signatures for estimation of soil organic matter in tropical soils of Thailand. Int. J. Remote Sens. 2004, 25, 643–652. [Google Scholar] [CrossRef]
  46. Viscarra Rossel, R.A.; Walvoort, D.J.J.; McBratney, A.B.; Janik, L.J.; Skjemstad, J.O. Visible, near infrared, mid infrared or combined diffuse reflectance spectroscopy for simultaneous assessment of various soil properties. Geoderma 2006, 131, 59–75. [Google Scholar] [CrossRef]
  47. Gao, L.; Zhu, X.; Han, Z.; Wang, L.; Zhao, G.; Jiang, Y. Spectroscopy-Based Soil Organic Matter Estimation in Brown Forest Soil Areas of the Shandong Peninsula, China. Pedosphere 2019, 29, 810–818. [Google Scholar] [CrossRef]
  48. Boul, S.W.; Southard, R.J.; Graham, R.C.; McDaniel, P.A. Soil Genesis and Classification; John Wiley and Sons, Inc.: Hoboken, NJ, USA, 2011. [Google Scholar]
  49. Hapke, B. Bidirectional reflectance spectroscopy. Geophys. Res. 1981, 86, 3039–3054. [Google Scholar] [CrossRef]
Figure 1. Composts A2 and A5, and red soil.
Remotesensing 12 01960 g001
Figure 2. Reflectance spectra of A2, A5, and the red soil (a) across the 400–2500 nm spectral region. (b) Zoom-in on the 400–1000 nm spectral region.
Remotesensing 12 01960 g002
Figure 3. Soil–A2 mixtures’ reflectance spectra across the 400–1000 nm spectral region. Dashed line is the lowest %SOM content, obtained in the natural red soil (natural SOM, 0.74%). The black line is the highest (SOM = 10.46%).
Remotesensing 12 01960 g003
Figure 4. Soil–A5 mixtures’ reflectance spectra across the 400–1000 nm spectral region. Dashed line is the lowest %SOM content, obtained in the natural red soil (natural SOM, 0.74%). The black line is the highest (SOM = 5.3%).
Remotesensing 12 01960 g004
Figure 5. Continuum removal (CR) for red soil mixed with OM. (a) CR A2, (b) CR A5. Dashed line represents the natural red soil signal (natural SOM, 0.74%) and the black line is the red soil mixed with the highest SOM content of 5.3% for comparison.
Remotesensing 12 01960 g005
Figure 6. Normalized Red Index Ratio (NRIR) index versus SOM content for (a) A2, (b) A5. The initial soil value is marked with an open circle. (c) NRIR for both A2 (gray triangles) and A5 (black dots), and (d) for both A2 and A5 up to 5% SOM. The point at which the trendlines are completely separate (1.6% SOM) is marked by a dashed line.
Remotesensing 12 01960 g006
Figure 7. CR Depth Change (CRDC) index versus SOM content for (a) A2 and (b) A5. The 25% CRDC threshold is marked by a dashed line. (c) CRDC index versus SOM content for both A2 (gray triangles) and A5 (black dots) and (d) for both A2 and A5 up to 5% SOM.
Remotesensing 12 01960 g007
Figure 8. Reflectance spectra of all authentic (a,c) and synthetic (b,d) soil–A2 mixtures. Reflectance at 400–1000 nm (a,b) and after applying CR between 800 nm and 1000 nm (c,d).
Remotesensing 12 01960 g008
Figure 9. Reflectance spectra of all authentic (a,c) and synthetic (b,d) soil–A5 mixtures. Reflectance at 400–1000 nm (a,b) and after applying CR between 800 nm and 1000 nm (c,d).
Remotesensing 12 01960 g009
Figure 10. The CRDC indices of (a) soil–A2 and (b) soil–A5 authentic (real: Black dots) and synthetic (crosses) mixtures. Dashed lines show the 25% spectral change in 880 nm after applying the CR procedure. (c,d) NRIR indices of (c) soil–A2 and (d) soil–A5 authentic and synthetic mixtures.
Remotesensing 12 01960 g010
Table 1. Mixed soil samples with A2 or A5 and the resulting soil organic matter (SOM) content in the authentic soil–organic matter (OM) mixtures.
SampleSoil%OM%OM Added (g)SOM% for Soil–A2 [(OM*0.81)+0.74]SOM% for Soil–A5 [(OM*0.38)+0.74]
199.70.30.1050.980.85
299.40.60.2101.230.97
399.10.90.3151.471.08
498.81.20.4201.711.20
598.51.50.5251.961.31
698.21.80.6302.201.42
797.92.10.7352.441.54
897.62.40.8402.681.65
997.32.70.9452.931.77
1097.03.01.0503.171.88
1196.73.31.1553.411.99
1296.43.61.2603.662.11
1396.13.91.3653.902.22
1495.84.21.4704.142.34
1595.54.51.5754.392.45
1695.24.81.6804.632.56
1794.95.11.7854.872.68
1894.65.41.8905.112.79
1994.35.71.9955.362.91
2094.06.02.1005.603.02
2193.76.32.2055.843.13
2293.46.62.3106.093.25
2393.16.92.4156.333.36
2492.87.22.5206.573.48
2592.57.52.6256.823.59
2692.27.82.7307.063.70
2791.98.12.8357.303.82
2891.68.42.9407.543.93
2991.38.73.0457.794.05
3091.09.03.1508.034.16
3190.79.33.2558.274.27
3290.49.63.3608.524.39
3390.19.93.4658.764.50
3489.810.23.5709.004.62
3589.510.53.6759.254.73
3689.210.83.7809.494.84
3788.911.13.8859.734.96
3888.611.43.9909.975.07
3988.311.74.09510.225.19
4088.012.04.20010.465.30

