Article

Evaluation of the TRMM Product for Monitoring Drought over Paraíba State, Northeastern Brazil: A Statistical Analysis

by
Reginaldo Moura Brasil Neto
1,
Celso Augusto Guimarães Santos
1,*,
Thiago Victor Medeiros do Nascimento
1,
Richarde Marques da Silva
2 and
Carlos Antonio Costa dos Santos
3
1
Department of Civil Engineering and Environmental Engineering, Federal University of Paraíba, 58051-900 João Pessoa, Brazil
2
Department of Geosciences, Federal University of Paraíba, 58051-900 João Pessoa, Brazil
3
Academic Unit of Atmospheric Sciences, Federal University of Campina Grande, 58109-970 Campina Grande, Brazil
*
Author to whom correspondence should be addressed.
Remote Sens. 2020, 12(14), 2184; https://0-doi-org.brum.beds.ac.uk/10.3390/rs12142184
Submission received: 16 June 2020 / Revised: 2 July 2020 / Accepted: 6 July 2020 / Published: 8 July 2020

Abstract

:
Drought is a natural phenomenon that originates from the absence of precipitation over a certain period and is capable of causing damage to societal development. With the advent of orbital remote sensing, rainfall estimates from satellites have appeared as viable alternatives to monitor natural hazards in ungauged basins and complex areas of the world; however, the accuracies of these orbital products still need to be verified. Thus, this work aims to evaluate the performance of Tropical Rainfall Measuring Mission (TRMM) satellite rainfall estimates in monitoring the spatiotemporal behavior of droughts at multiple temporal scales over Paraíba State based on the standardized precipitation index (SPI) over 20 years (1998–2017). For this purpose, rainfall data from 78 rain gauges and 187 equally spaced TRMM cell grids throughout the region are used, and accuracy analyses are performed at the single-gauge level and in four mesoregions at eight different time scales based on 11 statistical metrics calculations divided into three different categories. The results show that in the mesoregions close to the coast, the satellite-based product is less accurate in capturing the drought behavior regardless of the evaluated statistical metrics. At the temporal scale, the TRMM is more accurate in identifying the pattern of medium-term droughts; however, there is considerable spatial variation in the accuracy of the product depending on the performance index. Therefore, it is concluded that rainfall estimates from the TRMM satellite are a valuable source of data to identify drought behavior in a large part of Paraíba State at different time scales, and further multidisciplinary studies should be conducted to monitor these phenomena more accurately based on satellite data.
Keywords:
drought; SPI; TRMM; Paraíba

Graphical Abstract

1. Introduction

Water is the most important resource for life on the planet and for the development of society and the economy. In recent decades, water has become physically, economically and socially scarcer in several regions of the planet where it was previously considered to be abundant [1]. Among the factors that contribute to this decrease, climate changes stand out as being responsible for changes in the pattern of rainfall across the planet, which directly influences the pattern of drought occurrence and affects our planet [2]. Thus, drought is one of the most challenging phenomena in environmental monitoring and has been gaining more prominence due to the occurrence of severer and more frequent extreme phenomena worldwide [3], affecting increasingly more people, especially in arid and semiarid regions [4,5].
According to the National Drought Mitigation Center of Nebraska University [6], drought is a phenomenon that stems from a lack of precipitation over a period of time, resulting in a lack of water for a particular sector of activity, group or environment. In addition, drought is a recurring natural phenomenon that occurs in all climatic regimes [7]. Furthermore, the impacts of drought affect different sectors of society, such as electricity generation, agriculture, water resources, tourism and ecosystems [8]. Currently, droughts are responsible for various disorders in the population, which places these extreme events among the most severe natural disasters at both global and regional levels [9], as well as one of the most extensive disasters in the world [2].
Thus, droughts have attracted increasing attention from researchers to analyze the methodologies, characteristics and occurrence pattern of these disasters and to propose mitigation actions against these phenomena, as well as to assist public policies and minimize the impacts of droughts on the population. Currently, there are a large number of indices in the literature that are capable of monitoring the effect of droughts, and each index has its strengths and weaknesses. Notably, choosing the most appropriate drought index is important for monitoring droughts and their effects on a given area [10], and this decision is linked to different research aspects, such as (a) the purpose of the study and (b) the availability of meteorological data [11].
Although it is notoriously difficult to define a universal index, it can be said that the standardized precipitation index (SPI) [12] is one of the most commonly used indices for drought monitoring [13]. The SPI is a standardized statistical index that measures the severity of drought and wet events within a region in different categories and through multiple time scales based on rainfall data and is widely used to monitor droughts in different regions [14,15,16,17,18]. However, to analyze droughts in detail, long time series of data are necessary throughout a given study area to capture the regional rainfall regime. In Brazil, this task is challenging due to the country’s territorial extension, the variability in climatic zones, the poor spatial distribution of the rain gauge network and the absence of rainfall time series data [19,20,21].
Faced with this challenge, the use of satellite precipitation estimates appears to be an alternative to monitor the rainfall regime across the planet. Currently, several products are available and have been used in various studies, e.g., Precipitation Estimation from Remote Sensing Information using Artificial Neural Network (PERSIANN) [22], Climate Prediction Center Morphing (CMORPH) [23], Tropical Rainfall Measuring Mission (TRMM), Multisatellite Precipitation Analysis (TMPA) data [24], Global Satellite Mapping of Precipitation (GSMaP) [25], Integrated Multisatellite Retrievals for GPM mission (IMERG) [26] and Climate Hazards Group InfraRed Precipitation with Station (CHIRPS) data [27].
Among these products, the TRMM has been one of the most widely used for generating uninterrupted estimates of precipitation over tropical regions [28]. In this sense, several studies have analyzed the accuracy of TRMM products (e.g., [29,30,31,32,33,34]), and the results generally indicate a better performance between the TRMM products and rain gauge-measured data on both annual and monthly scales than on a daily basis. Thus, the availability of these precipitation data with refined and well-distributed spatiotemporal resolution has boosted several SPI applications by using TRMM products to capture the spatiotemporal pattern of droughts in different regions (e.g., [35,36,37,38,39,40,41,42,43,44]).
These works are more common in arid and semiarid regions, as is the case of Paraíba State, which is a predominantly semiarid area. Paraíba State is located in northeastern Brazil, which is one of the most vulnerable areas in the world due to climate change and frequent occurrences of droughts [45]. More recently, between 2012 and 2017, researchers pointed out that this region suffered one of the most severe droughts in its history, which caused severe socioeconomic damage to the population [4,46]. In addition, Paraíba State is a region with different physical characteristics related to relief, vegetation and precipitation [47], which makes for a complex task to monitor rainfall and drought on more detailed spatiotemporal scales.
Validating satellite-estimated rainfall data is a crucial step in using this type of data in several natural studies, including drought monitoring. In this sense, until now, no known studies have been carried out to validate and measure the accuracy of TRMM-estimated data in monitoring droughts over Paraíba State. Based on the aforementioned factors, the objective of this study is to evaluate the accuracy and performance of the TRMM satellite in capturing the spatiotemporal pattern of droughts over Paraíba State from 1998 to 2017 based on 11 different metrics at multiple time and spatial scales.

2. Materials and Methods

2.1. Study Area

The study area is Paraíba State, which is located between latitudes 5.875 to 8.375°S and longitudes 38.875 to 34.625°W. Paraíba is one of the 27 federative units in Brazil and one of the nine states that encompass the northeastern region of Brazil. Paraíba State borders Ceará State (to the west), Rio Grande do Norte State (to the north), the Atlantic Ocean (to the east) and Pernambuco State (to the south), with a total area of 56,469.78 km2, which, as an example, is larger than countries such as Croatia, Costa Rica and Denmark. Paraíba has a population of approximately four million inhabitants, contains 223 municipalities and is subdivided into four mesoregions, namely, Mata Paraibana, Agreste Paraibano, Borborema and Sertão Paraibano [48] (Figure 1). Köppen’s climate classifications include As’ (with dry summers) and BSh (low latitude and altitude) [49]. The temperature is characterized by high mean temperatures ranging from 22 to 30 °C, and the annual mean rainfall depth varies from 1400 mm in the region of Mata Paraibana to less than 500 mm in the interior areas. More details regarding the characteristics of the region can be found in [4,47].

2.2. Rainfall Data

2.2.1. Observed Data

In this work, rain gauge-measured data were obtained from the Agência Executiva de Gestão de Águas (AESA) for the period from 1998 to 2017, for a total of 251 daily time series throughout the state. Initially, an analysis of the missing data within each rainfall time series was carried out, and all series that presented missing data were excluded from the following analyses, resulting in a total of 78 complete series that are used in the present study. This decision was made to reduce the uncertainties regarding incomplete data series and thereby evaluate the accuracy of the TRMM-estimated data. Notably, the data used in this research were also evaluated in terms of errors and consistency. In addition, the use of the double mass method did not identify episodes of alteration in the region’s characteristics. The results indicated that all 78 selected time series were suitable for the proposed analysis.

2.2.2. Estimated Data

To monitor the droughts over Paraíba State, TRMM-estimated precipitation data were used. Launched in late 1997, TRMM was developed to monitor rainfall in tropical regions of the planet [24]. Among the available data, the TRMM Multisatellite Precipitation Analysis (TMPA) is the product that combines precipitation data estimated by remote sensing measurements with rainfall observations from rain gauges and radars when available. TMPA products are capable of covering extensive spatial domains, i.e., between latitudes 50°N to 50°S and longitudes 180°W to 180°E, with a refined spatial resolution of 0.25 × 0.25°, allowing for the monitoring of rainfall in various areas of the Earth [7].
In Paraíba State, several studies used the TMPA estimates, and in most cases, the results indicate that these estimates are viable alternatives for studies in the area of water resources (e.g., [4,30,47]. In this work, data from TMPA 3B42v7 were used, and the study area was divided into 187 grids (11 × 17), whose centroids vary every 0.25° from 5.875 to 8.375°S and from 38.875 to 34.875°W. It is worth noting that 99 out of the 187 grids were over Paraíba State. Figure 2 shows the spatial distribution of the TRMM cell grids and the rain gauges used in this work over Paraíba State. Notably, the daily rainfall time series were accumulated to obtain monthly rainfall time series from January 1998 to December 2017, producing approximately 45,000 monthly rainfall data points (187 TRMM-estimated series × 20 years × 12 months) over the entire study area.

2.3. Standardized Precipitation Index

Daily data were accumulated at the monthly level to calculate the SPI index and perform the drought analysis. The SPI calculation was based on the adequacy of the rainfall data for the gamma distribution of two parameters (α and β). In addition, eight different SPI indices were used to characterize the droughts at multiple time scales: (a) SPI-1, SPI-3 and SPI-6 for short-term droughts, (b) SPI-9 and SPI-12 for medium-term droughts and (c) SPI-18, SPI-24 and SPI-48 for long-term droughts. The data period used to compute the SPI indices was the same as the observed data (January 1998 to December 2017). The SPI for each time scale was calculated for the 187 TRMM-estimated and 78 rain gauge-measured time series.
In addition, four different severity classes were used to classify dry and wet events. Dry events are those with SPI values less than or equal to zero, while wet events have SPI values greater than zero. The categories regarding the severity of dry and wet events varied according to the SPI values, i.e., mild events (0.0 < |SPI| ≤ 1.0), moderate events (1.0 < |SPI| ≤ 1.5), severe events (1.5 < |SPI| ≤ 2.0) and extreme events (2.0 < |SPI|). In general, the SPI-x index for the y-month compares the accumulated precipitation in x months prior to the y-month in a given year, including the y-month, with the time series composed of the accumulated rainfall in x months for the y-month. In this work, all SPI values for each of the eight time scales and each of the available time series were calculated. For SPI-1, 240 values (20 years × 12 months) were computed for each of the available 78 rain gauge-measured rainfall time series and each of the 187 TRMM-estimated rainfall time series, which correspond to more than 60,000 data points for only this time scale (SPI-1). More details regarding the calculation of the SPI index can be found in [50].

2.4. Evaluation Metrics

The accuracy of the TRMM-estimated rainfall data in capturing the patterns of short-, medium- and long-term droughts was assessed by calculating different metrics. There are several methods that can be used to compare the SPI time series calculated based on satellite-estimated rainfall data for an area cell grid with those calculated based on rain gauge-measured rainfall data. One of the alternatives for performing such a task is (a) to interpolate the point rain gauge-measured data to the centroid of the corresponding cell grid ([19,40,51,52,53] or to interpolate the centroid data to the position of the rain gauges [30,54]; in other cases, it is possible to (b) compare the cell grid values with the average values of the rain gauge-measure data within the cell grid [4] or compare the rain gauge-measured data with the average of the nearest cell grid data [55,56]. Furthermore, it is worth noting that each methodology has its advantages and limitations, especially when it is intended to monitor SPI, which is based on precipitation data, a phenomenon with high spatiotemporal variability.
In this study, the accuracy of the TRMM-estimated data in capturing the pattern of short-, medium- and long-term droughts was assessed by calculating different metrics to avoid errors and inconsistencies caused by different factors. The adopted method demonstrated that if a rain gauge was within the limits of a given TRMM cell grid, the time series of that rain gauge would be compared with the time series of the respective cell grid. Thus, for each time scale, 78 distributed point time series were compared with the respective time series of cell grids into which the rain gauges were inserted, and for each metric, the 78 values were calculated and spatialized, as was performed by [31,32,57,58,59,60,61].
Thus, 11 different metrics for each of the eight SPI indices were evaluated, totaling more than 600 comparisons between time series (78 series × 8 time scales) and more than 6800 values spaced throughout the study area (11 metrics × 78 series × 8 time scales). The drought analysis was performed according to two spatial scales: (a) for each rain gauge and (b) for each mesoregion. The analyses by mesoregion were calculated by the weighted average of each metric based on the Thiessen polygons plotted according to the distribution of the rain gauges, as proposed by [20,36,62]. In addition, the metrics used were divided into three different groups: (a) metrics based on the SPI value, (b) metrics calculated based on the different categories of dry and wet events and (c) metrics exclusively based on dry and wet events.
In the case of the first group, the SPI values were used to compute the metrics. Thus, the following metrics were calculated: Pearson’s linear correlation coefficient (R), bias (B), relative bias (RB), mean square error (MSE) and root of the mean square error (RMSE):
R ( S R S , S G ) = i = 1 n ( S R S , i S R S ¯ ) ( S G , i S G ¯ ) i = 1 n ( S R S , i S R S ¯ ) 2 i = 1 n ( S G , i S G ¯ ) 2
B = i = 1 n ( S R S , i S G , i )
R B = i = 1 n ( S R S , i S G , i ) 1 n ( S G , i )
M S E = 1 n i = 1 n ( S R S , i S G , i ) 2
R M S E = M S E
where n is the quantity of data for each time series, SRS,i represents the SPI values calculated based on TRMM-estimated rainfall data, SG,i represents the SPI values calculated based on rain gauge-measured rainfall data, and ( S R S ¯ ) and ( S G ¯ ) are the averages of SPI values based on TRMM-estimated and rain gauge-measured data, respectively. The optimal coefficient R is 1, which indicates greater accuracy of the SPI based on TRMM-estimated data, and for the other metrics, the optimal value is 0, which indicates greater precision of the SPI based on TRMM-estimated data.
For the second group, the different categories of dry and wet events were considered, and the SPI values were reclassified. Thus, extremely dry events (SPI < −2) had a CL classification of 1 (CL1), severely dry events (−1.5 < SPI ≤ −2.0) received a CL classification of 2 (CL2) and so on up to a CL classification of 8 (CL8) for extremely wet events. After this adjustment, Kendall’s coefficient of concordance (Kd) [63] and Cohen’s kappa coefficient (Kp) [64] were calculated as follows:
K d = 12 S m 2 k ( k 2 1 )
S = i = 1 k ( R i   R ¯ ) 2 , R i = j = 1 m CL i j ,   R ¯ = 1 k i = 1 k R i  
K p = P O P E 1 P E  
where m is the number of databases, k is the number of events, CLij is the classification of event i of database j, PO is the observed relative concordance of the CL classifications between the databases, and PE is the hypothetical concordance of the probability of chance. In general, the kappa coefficient is more rigorous than Kendall’s coefficient of concordance, and this rigor is linked to the fact that even if an event is categorized as extremely dry (CL1) based on the TRMM-estimate data and categorized as severely dry (CL2) based on the rain gauge-measured data, from the point of view of the TRMM-estimated data, there is an error in detecting the class of the event. In other words, since there is no exact concordance by the TRMM-estimated data to identify the event type, even if it approached the classification based on rain gauge-measured data, this situation is computed as an error.
For the calculation of Kendall’s coefficient of concordance, although the events are not exactly the same, their categories are close, i.e., CL1 is close to CL2. Thus, the Kd calculation assumes that the error made when categorizing a CL1 event as CL2 is less than the error made when classifying a CL1 event as CL8 (SPI > 2), which is an indifferent situation under the view of Kp. The Kd values vary from zero to one, with 0 being the value that indicates perfect disagreement between the databases and 1 being the value that indicates perfect agreement between the classifications. The values of Kp, on the other hand, can be negative and can assume a maximum value of 1. The closer the values of Kd and Kp are to 1, the better the performance of the TRMM-estimated data in identifying the categories of dry and wet events.
For the analysis of the third group of metrics, the SPI series were readjusted and only two classes of events were considered: wet events (SPI > 0) and dry events (SPI ≤ 0). Following the logic of reclassification of the SPI values adopted for the calculation of Kd and Kp but only considering two types of events, four different performance indices were evaluated based on a 2 × 2 contingency table (Figure 3). In this work, when the SPI time series calculated based on rain gauge-measured rainfall data served as the reference, the correct proportion index (PC), the detection probability (POD), the false alarm index (FAR) and the index critical success rate (CSI) were calculated as follows:
P C = A + D A + B + C + D
P O D = A A + C
F A R = B A + B
C S I = A A + B + C
where A is the number of events categorized as dry based on rain gauge-measured and TRMM-estimated data, B is the number of events that were categorized as wet based on rain gauge-measured data and as dry according to the TRMM-estimated data, C is the number of times that events were considered to be dry according to rain gauge-measured data and to be wet events based on TRMM-estimated data, and D is the number of times the event was categorized as wet both by the TRMM-estimated and rain gauge-measured data. Figure 3 shows an example of the 2 × 2 contingency table used to assess the four performance indices and is made by the two-dimensional kernel density estimate plot, where the horizontal axis represents the SPI based on rain gauge-measured data, and the vertical axis represents the SPI based on TRMM-estimated data. All four metrics range from 0 to 1, such that for PC, POD and CSI, values equal to 1 indicate perfect agreement between the databases, while in the case of FAR, the value of 0 indicates the situation of best accuracy for the SPI values based on TRMM-estimated data. Table 1 shows a summary of the metrics used in the study, which shows the variation of each metric and the respective optimum value.

3. Results and Discussion

3.1. Analysis of the Rain Gauge-Measured Rainfall Data

Initially, an analysis was carried out regarding the quality of rainfall data in Paraíba State for the 1998–2017 period. Thus, 
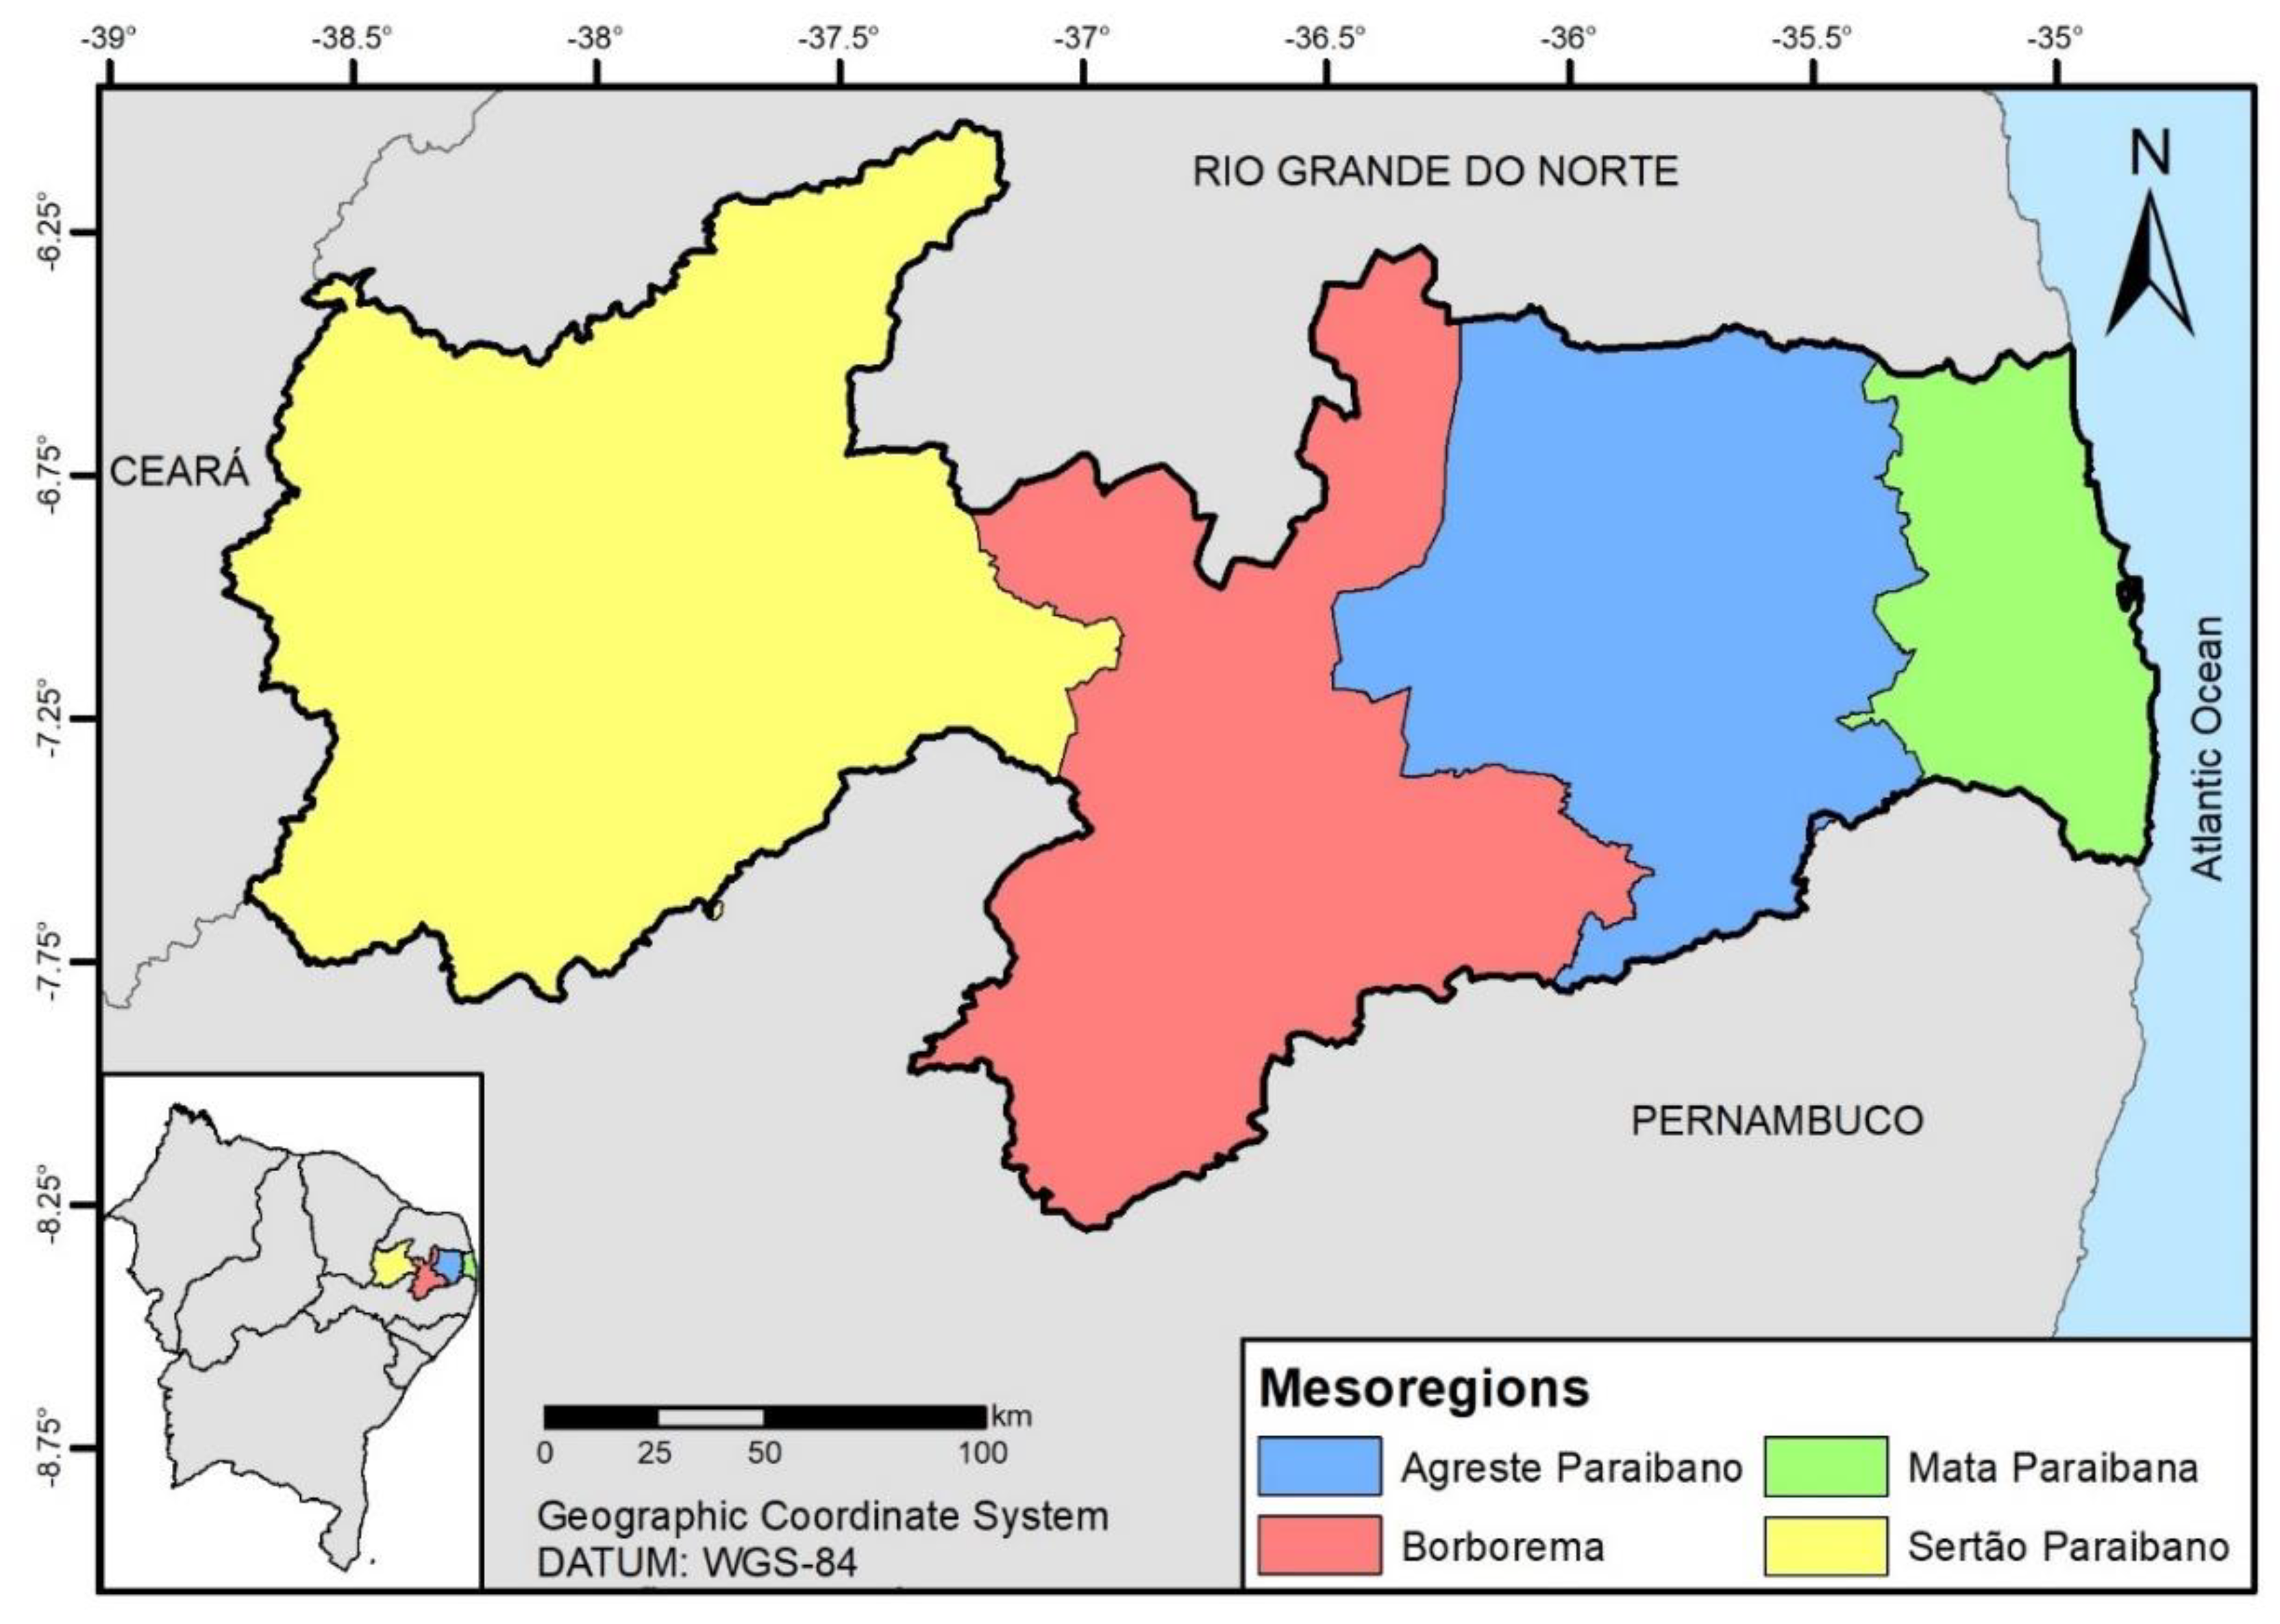
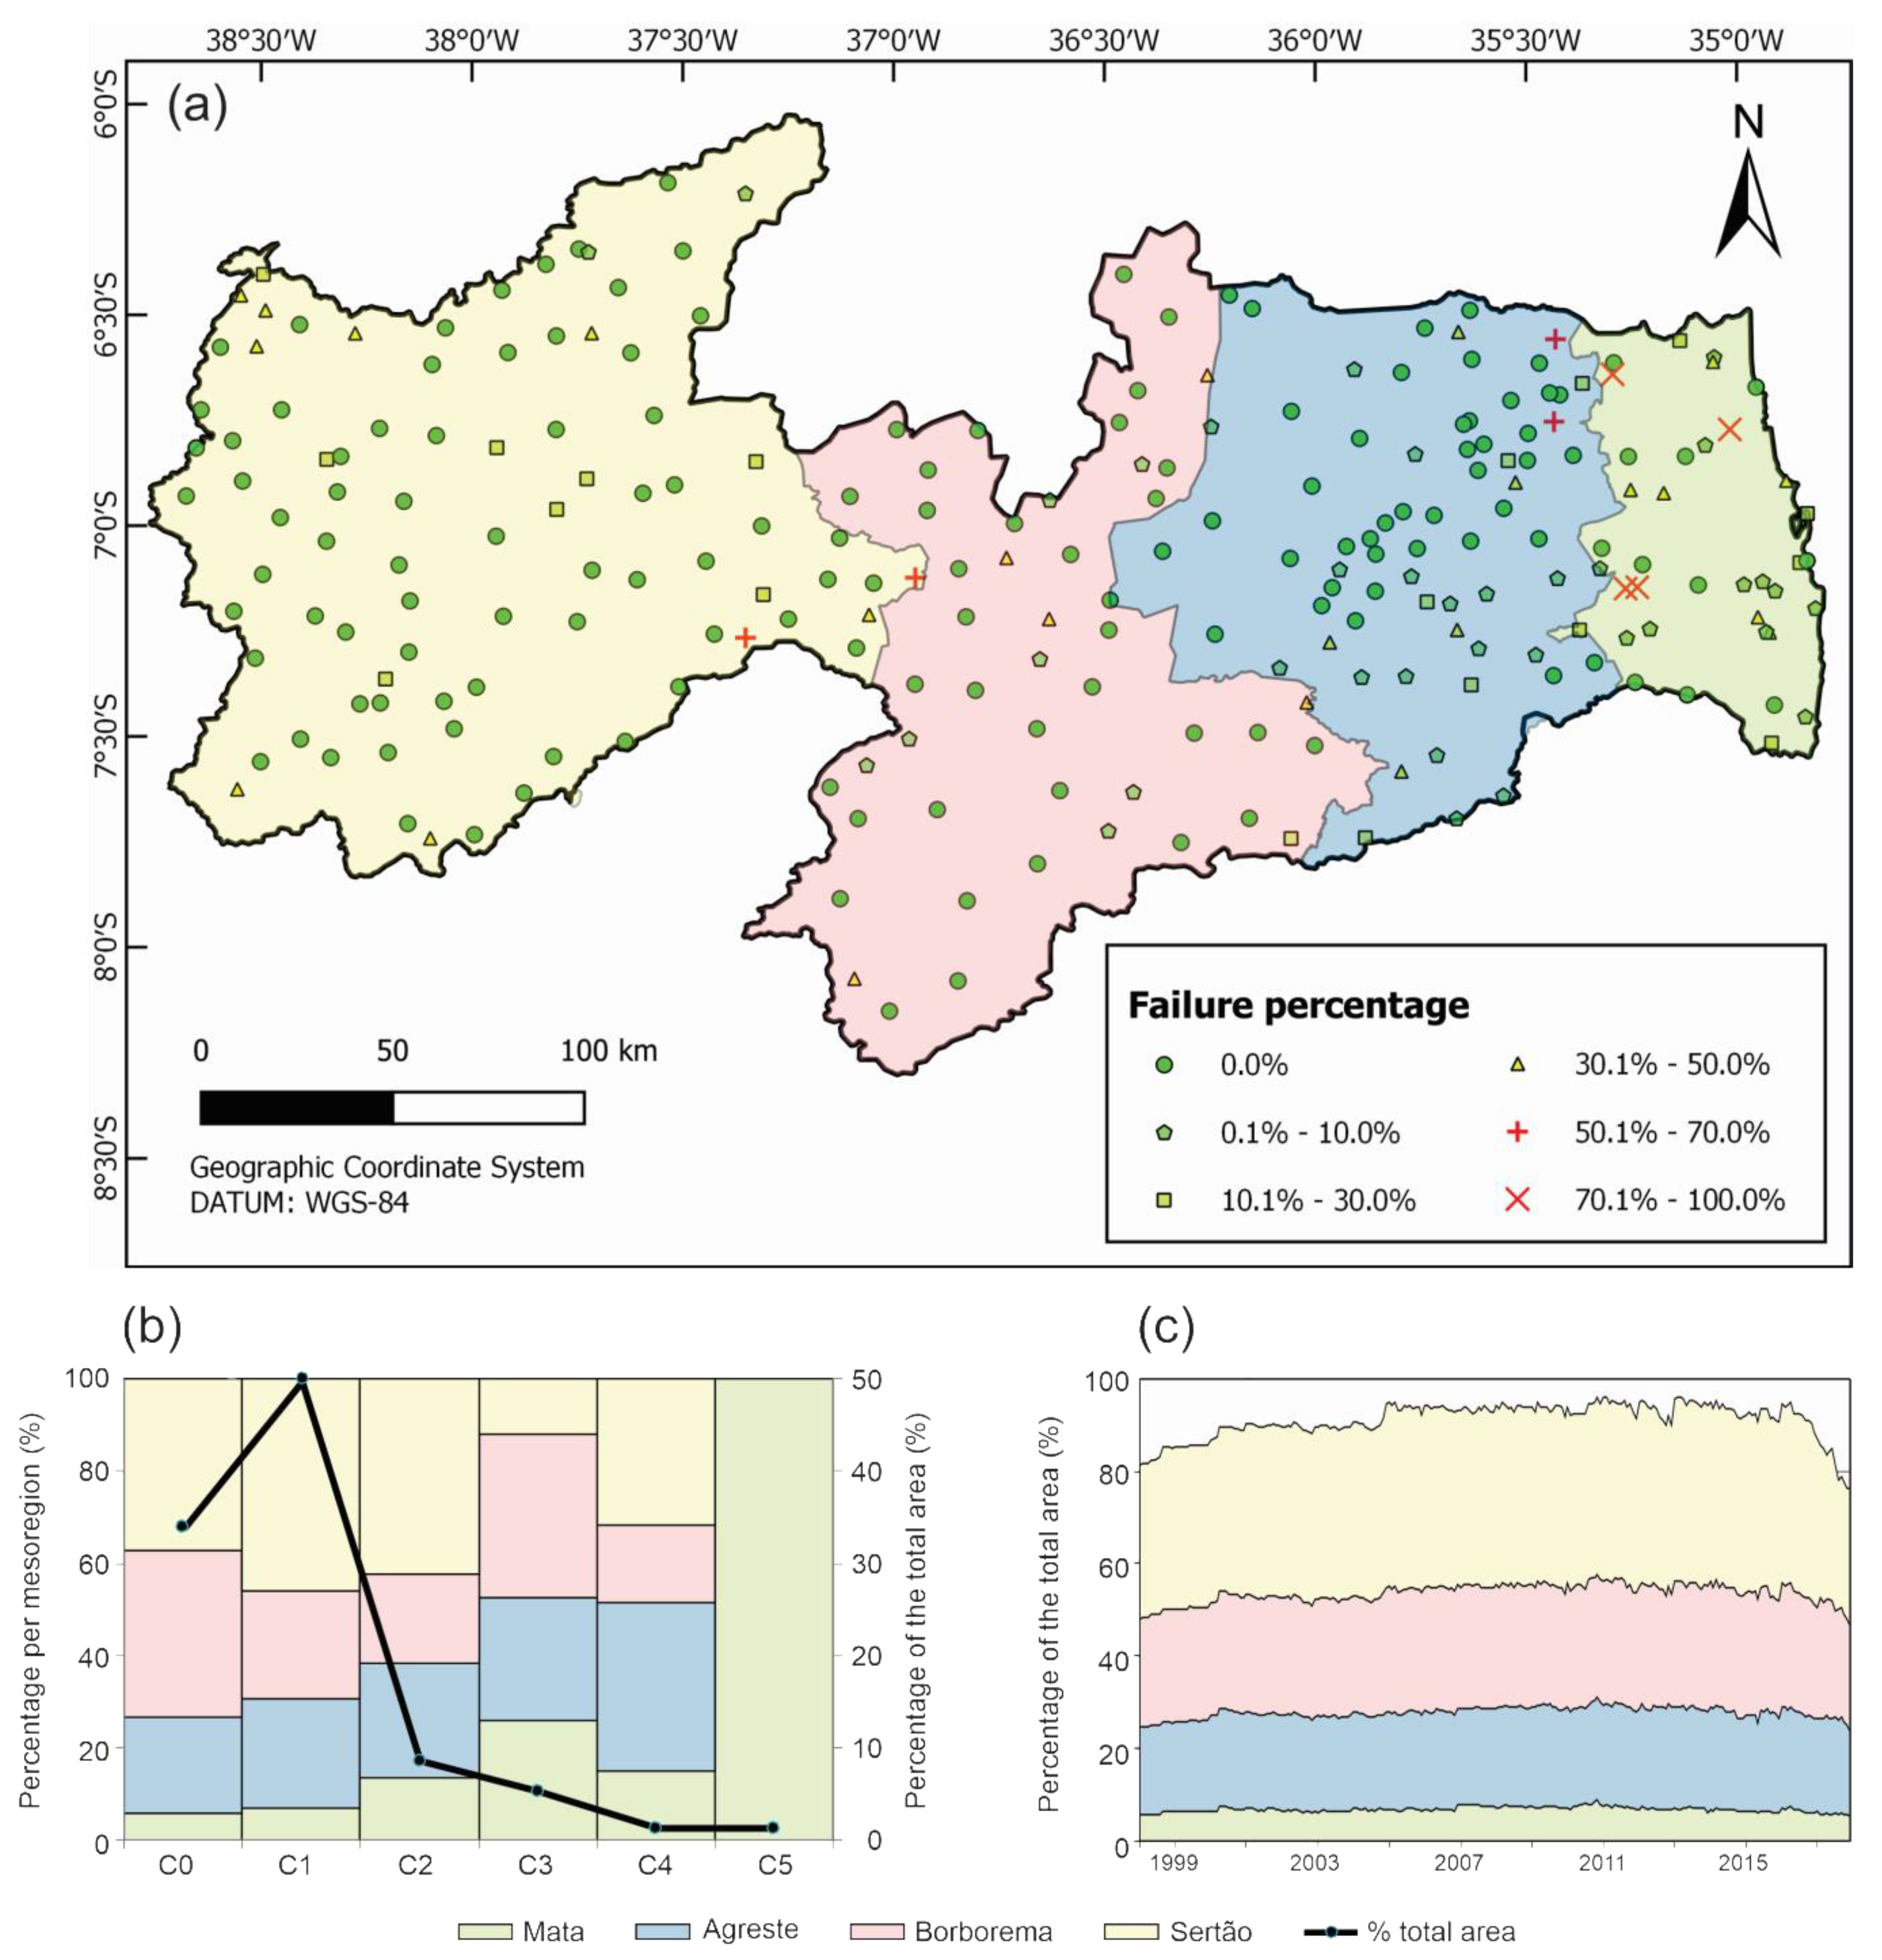
Figure 4 shows the spatial distribution of the missing data percentage in the rainfall time series, the percentage distribution of missing data for each mesoregion and the temporal evolution of the available data percentage for the analyzed period. In 
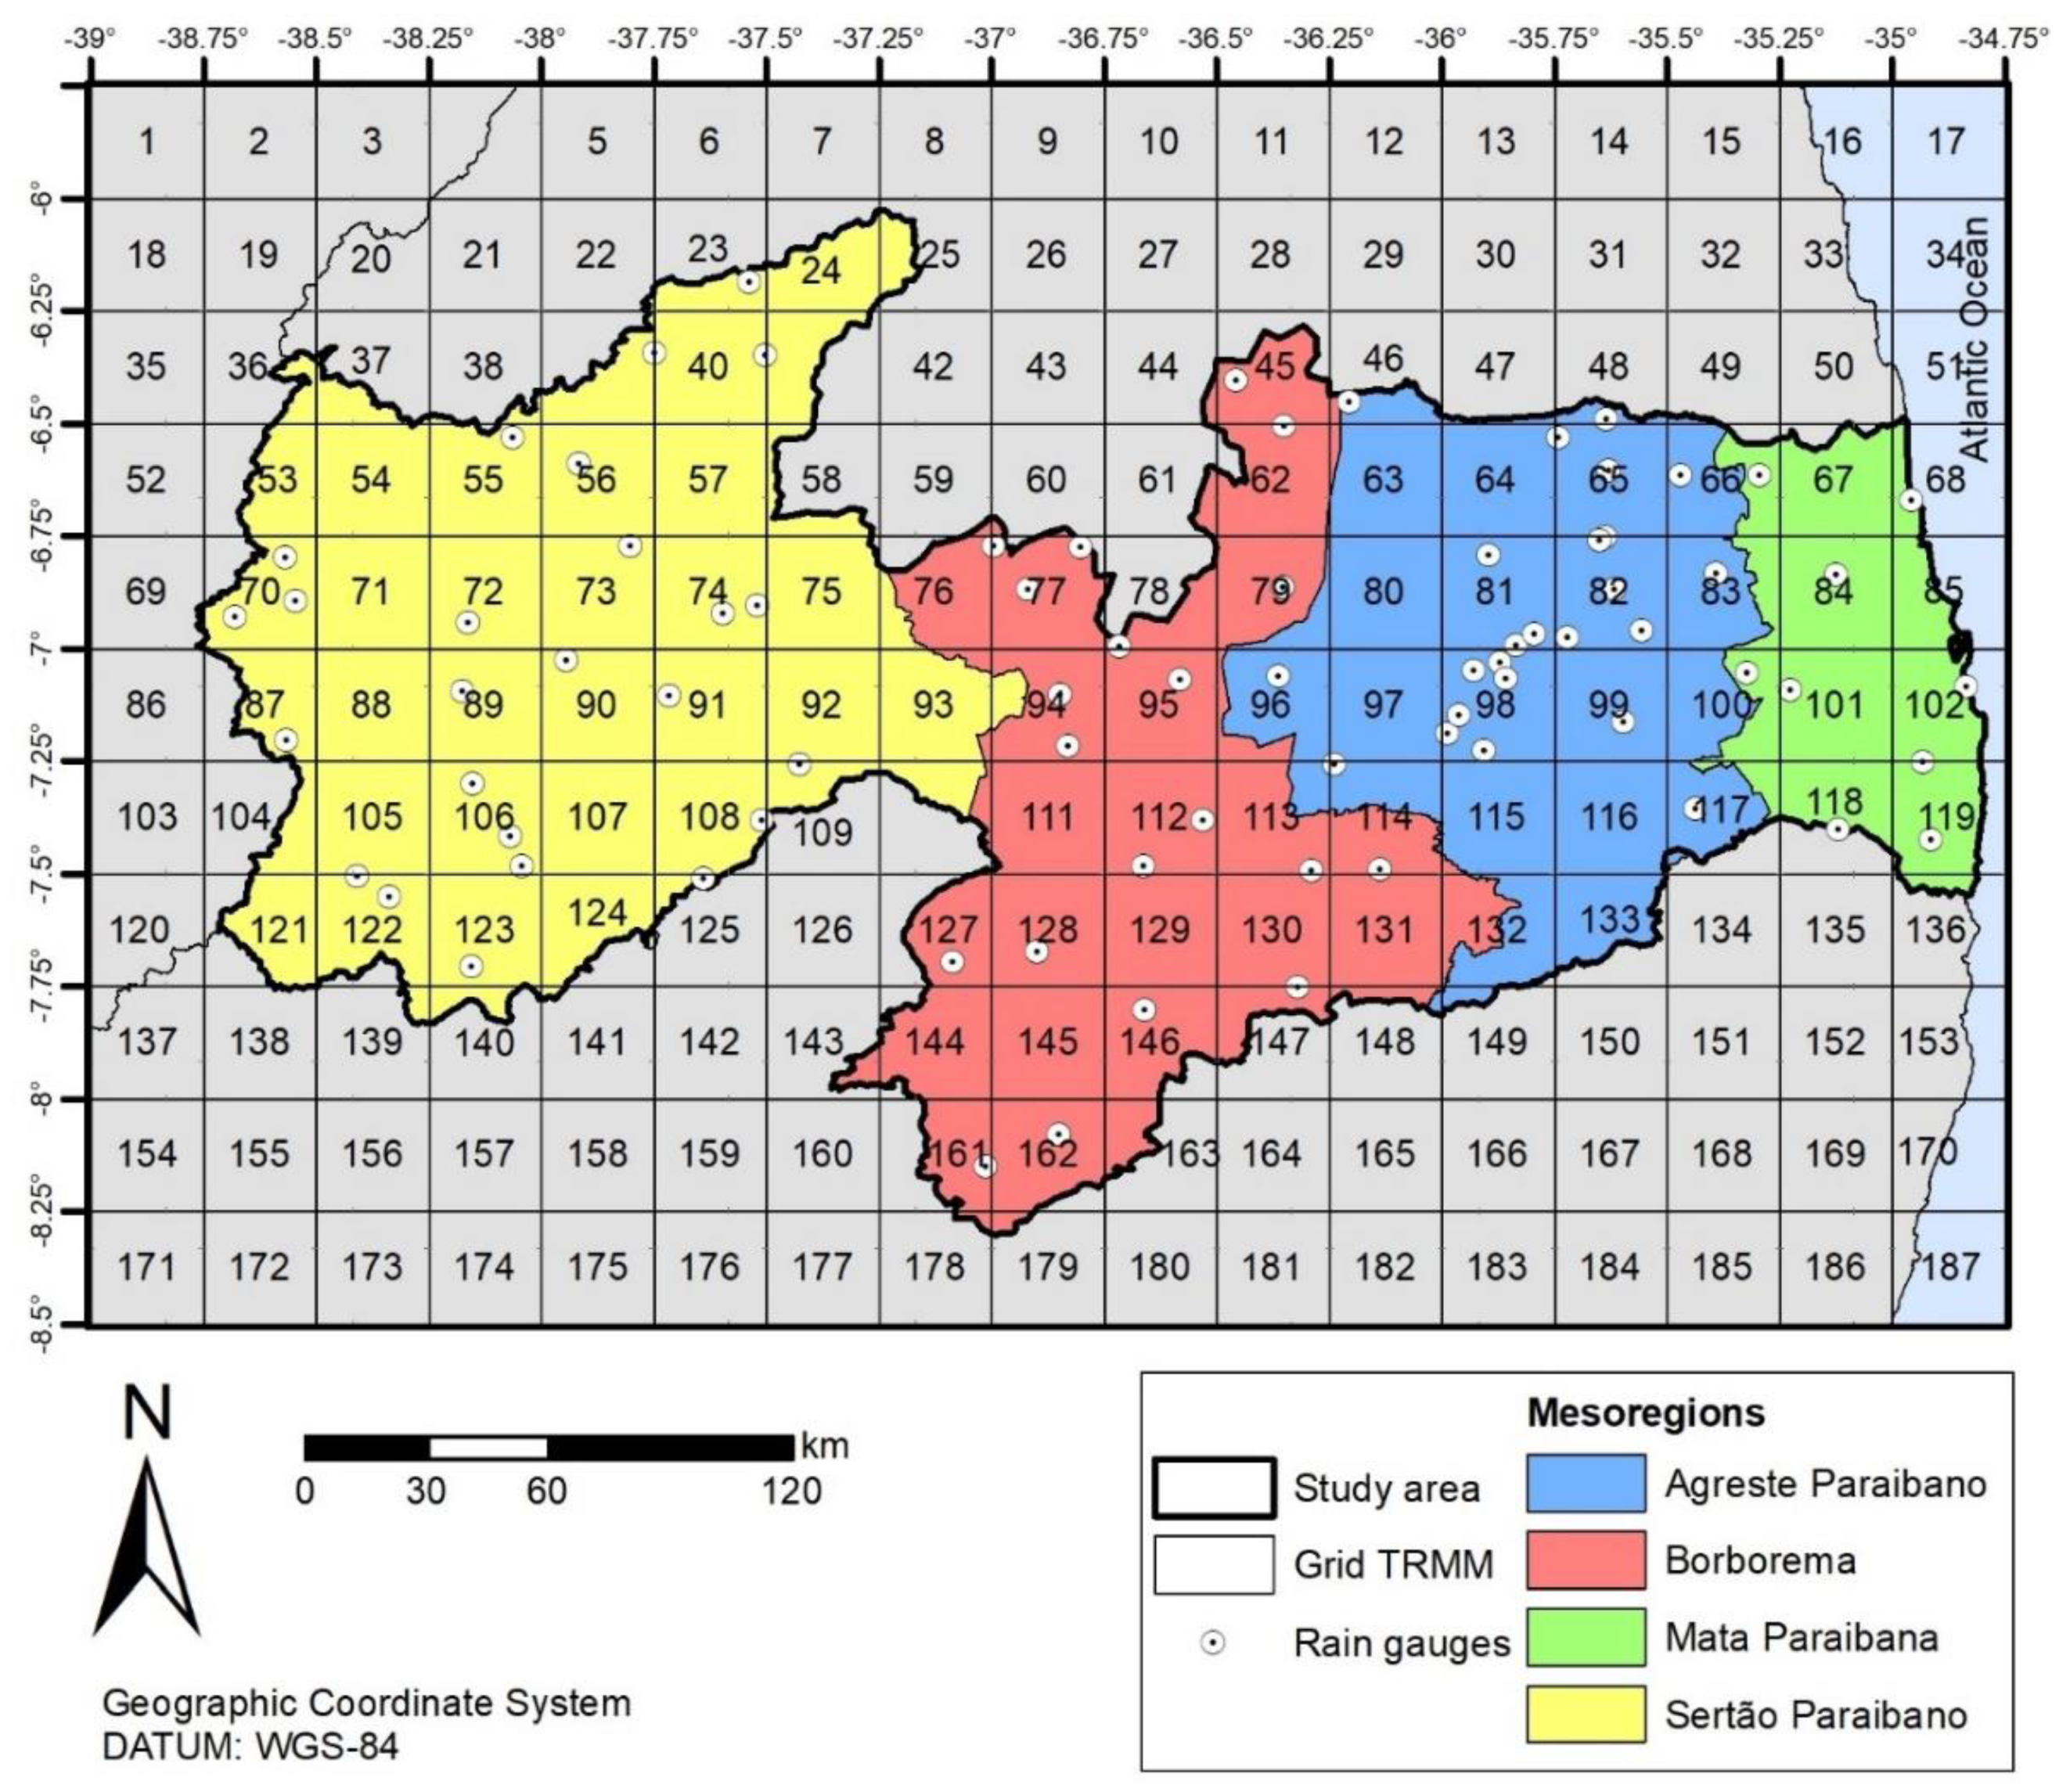
Figure 4a, there is a considerable irregularity in the spatial distribution of the rain gauges over Paraíba State. In quantitative terms, the mesoregion with the best instrumentation was Sertão Paraibano, followed by Agreste Paraibano, Borborema and Mata Paraibana. However, when considering the density of rain gauges per km2 for each mesoregion, Mata Paraibana has a greater number of rain gauges per km2, with a rate of approximately one station per 120 km2.
Agreste Paraibano, whose rain gauges are concentrated in the central portion, has the second highest rain gauge density in the state, with approximately one station every 170 km2. The situations in Sertão Paraibano and Borborema are considered to be the most critical of Paraíba State, such that there is only one rain station every 230 and 300 km2, respectively. Following the indications of [65], it is recommended that depending on the physiographic conditions of each region, the minimum area monitored by each rain gauge should be 575 km2 when considering areas with flat relief. On the other hand, in areas with complex topography, the amount of rain gauges per km2 must be higher to capture the rainfall regime in the region with greater precision. When using this rate as a reference, it is possible to notice that the instrumentation in Paraíba State is satisfactory, especially when dealing with Mata Paraibana and Agreste Paraibano.
However, the previously described rain gauge density was computed considering all rain gauges in each mesoregion without disregarding those with missing data within the records during the analyzed period. For this reason, it was estimated that the situation regarding the rain gauge density over Paraíba State is critical when considering only the rain gauges that do not present missing data from 1998 to 2017. Excluding stations with incomplete time series from this analysis, the rate changed to one station per 580, 540, 780 and 910 km2 for the mesoregions of Mata Paraibana, Agreste Paraibano, Borborema and Sertão Paraibano, respectively. Overall, Paraíba State has a density rate of approximately one station every 725 km2, exceeding the limit value established by [65] and highlighting the weakness in the instrumentation over the region.
In addition to the irregularity regarding the spatial distribution, it can be seen from Figure 4b that this rain gauge network also has qualitative deficiencies. Therefore, when defining different classes to assess the quality of Paraiba State’s rainfall time series, i.e., C0 (0.0%), C1 (0.0%–20.0%), C2 (20.0%–40.0%), C3 (40.0%–60.0%), C4 (60.0%–80.0%) and C5 (80.0%–100.0%), it can be seen that of the 251 time series spaced over the territory, there were no missing data in only 78 time series over the 20 analyzed years. For example, C0 was the class in which the rain gauge-measured data presented no missing data, C1 was the class in which the rain gauge-measured data presented a percentage of missing data varying between 0.1% and 20%. These 78 rain gauges represent only approximately 34% of the state’s area, which demonstrates that only one third of the territory of Paraíba State presented continuity of rainfall data over the entire period. A large part of the influential areas that did not register missing data along the time series (C0) were in the mesoregion of Sertão Paraibano (37.1%), followed by Borborema (36.4%), Agreste Paraibano (20.9%) and Mata Paraibana (5.6%).
In relation to the rain gauges with a low percentage of missing data (C1), it is noted that these gauges covered a total of approximately 50% of the territory, with 46.1% in Sertão Paraibano, while Mata Paraibana had the lowest percentages (6.9%). For the other classes, there was a decrease in relation to the percentage of the influential area overall, such that all rain gauges that presented more than 20% missing data (i.e., C2, C3, C4 and C5) together covered approximately 16% of Paraíba State. Among these results, the pattern found for C5 type rain gauges stands out in particular: unlike the other classifications, the entire area under control of those rain gauges was located in Mata Paraibana, and this same pattern can be observed in C3 type rain gauges (5.2%). This result shows that this mesoregion was deficient in quantitative and qualitative terms when compared to other regions.
For the temporal evolution of the area percentage with data availability, it can be seen from Figure 4c that there was no time when all rain gauges presented data. However, in some cases, more than 95% of the territory had rainfall monitored simultaneously. In this sense, it was indicated that although only one-third of the territory presented complete series, the percentage of area with data availability over time was still very high. In addition, from Figure 4c, it is noted that until 2004, the area percentage remained approximately 90%, while from 2005 to 2013, there was an increase in percentage values. In turn, for 2015, there was a decrease in the percentage of area with data availability, and the lowest values reached 75%. In relation to the pattern in the mesoregions, there was a greater variation in the values in the Sertão Paraibano, while in the Mata Paraibana, the values were practically constant over time.

3.2. Accuracy Analysis at Single-Gauge Level

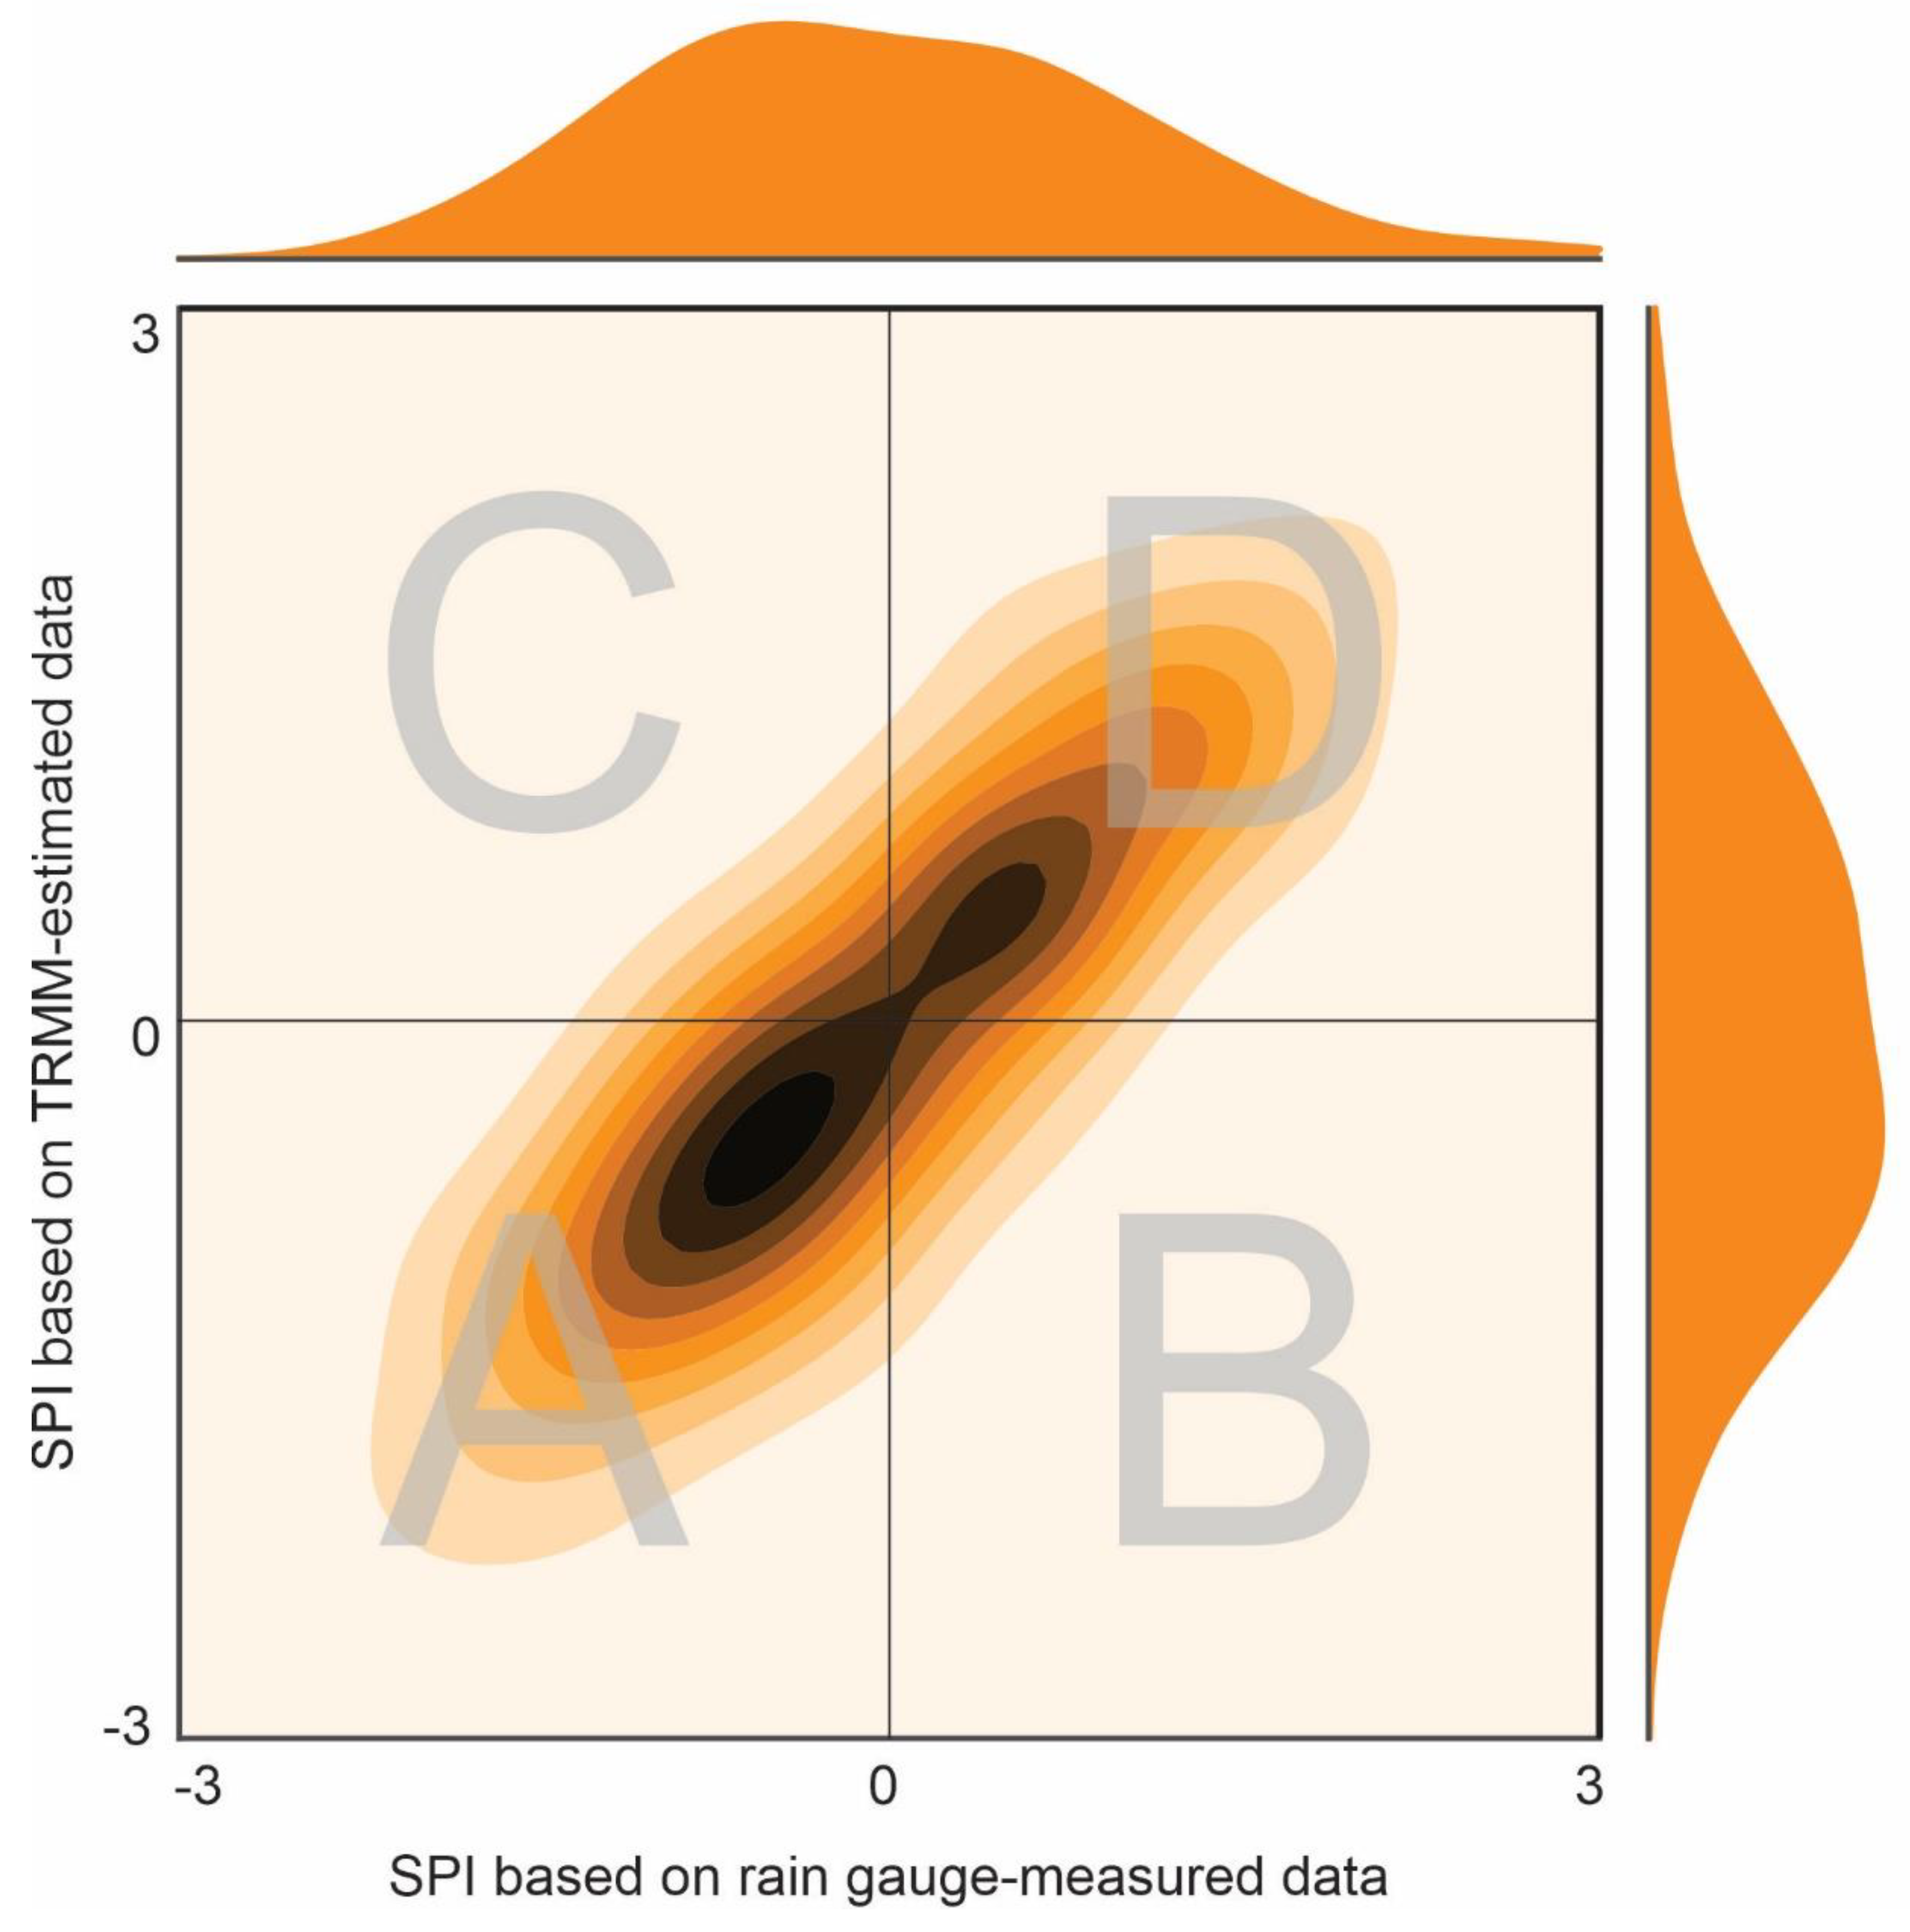
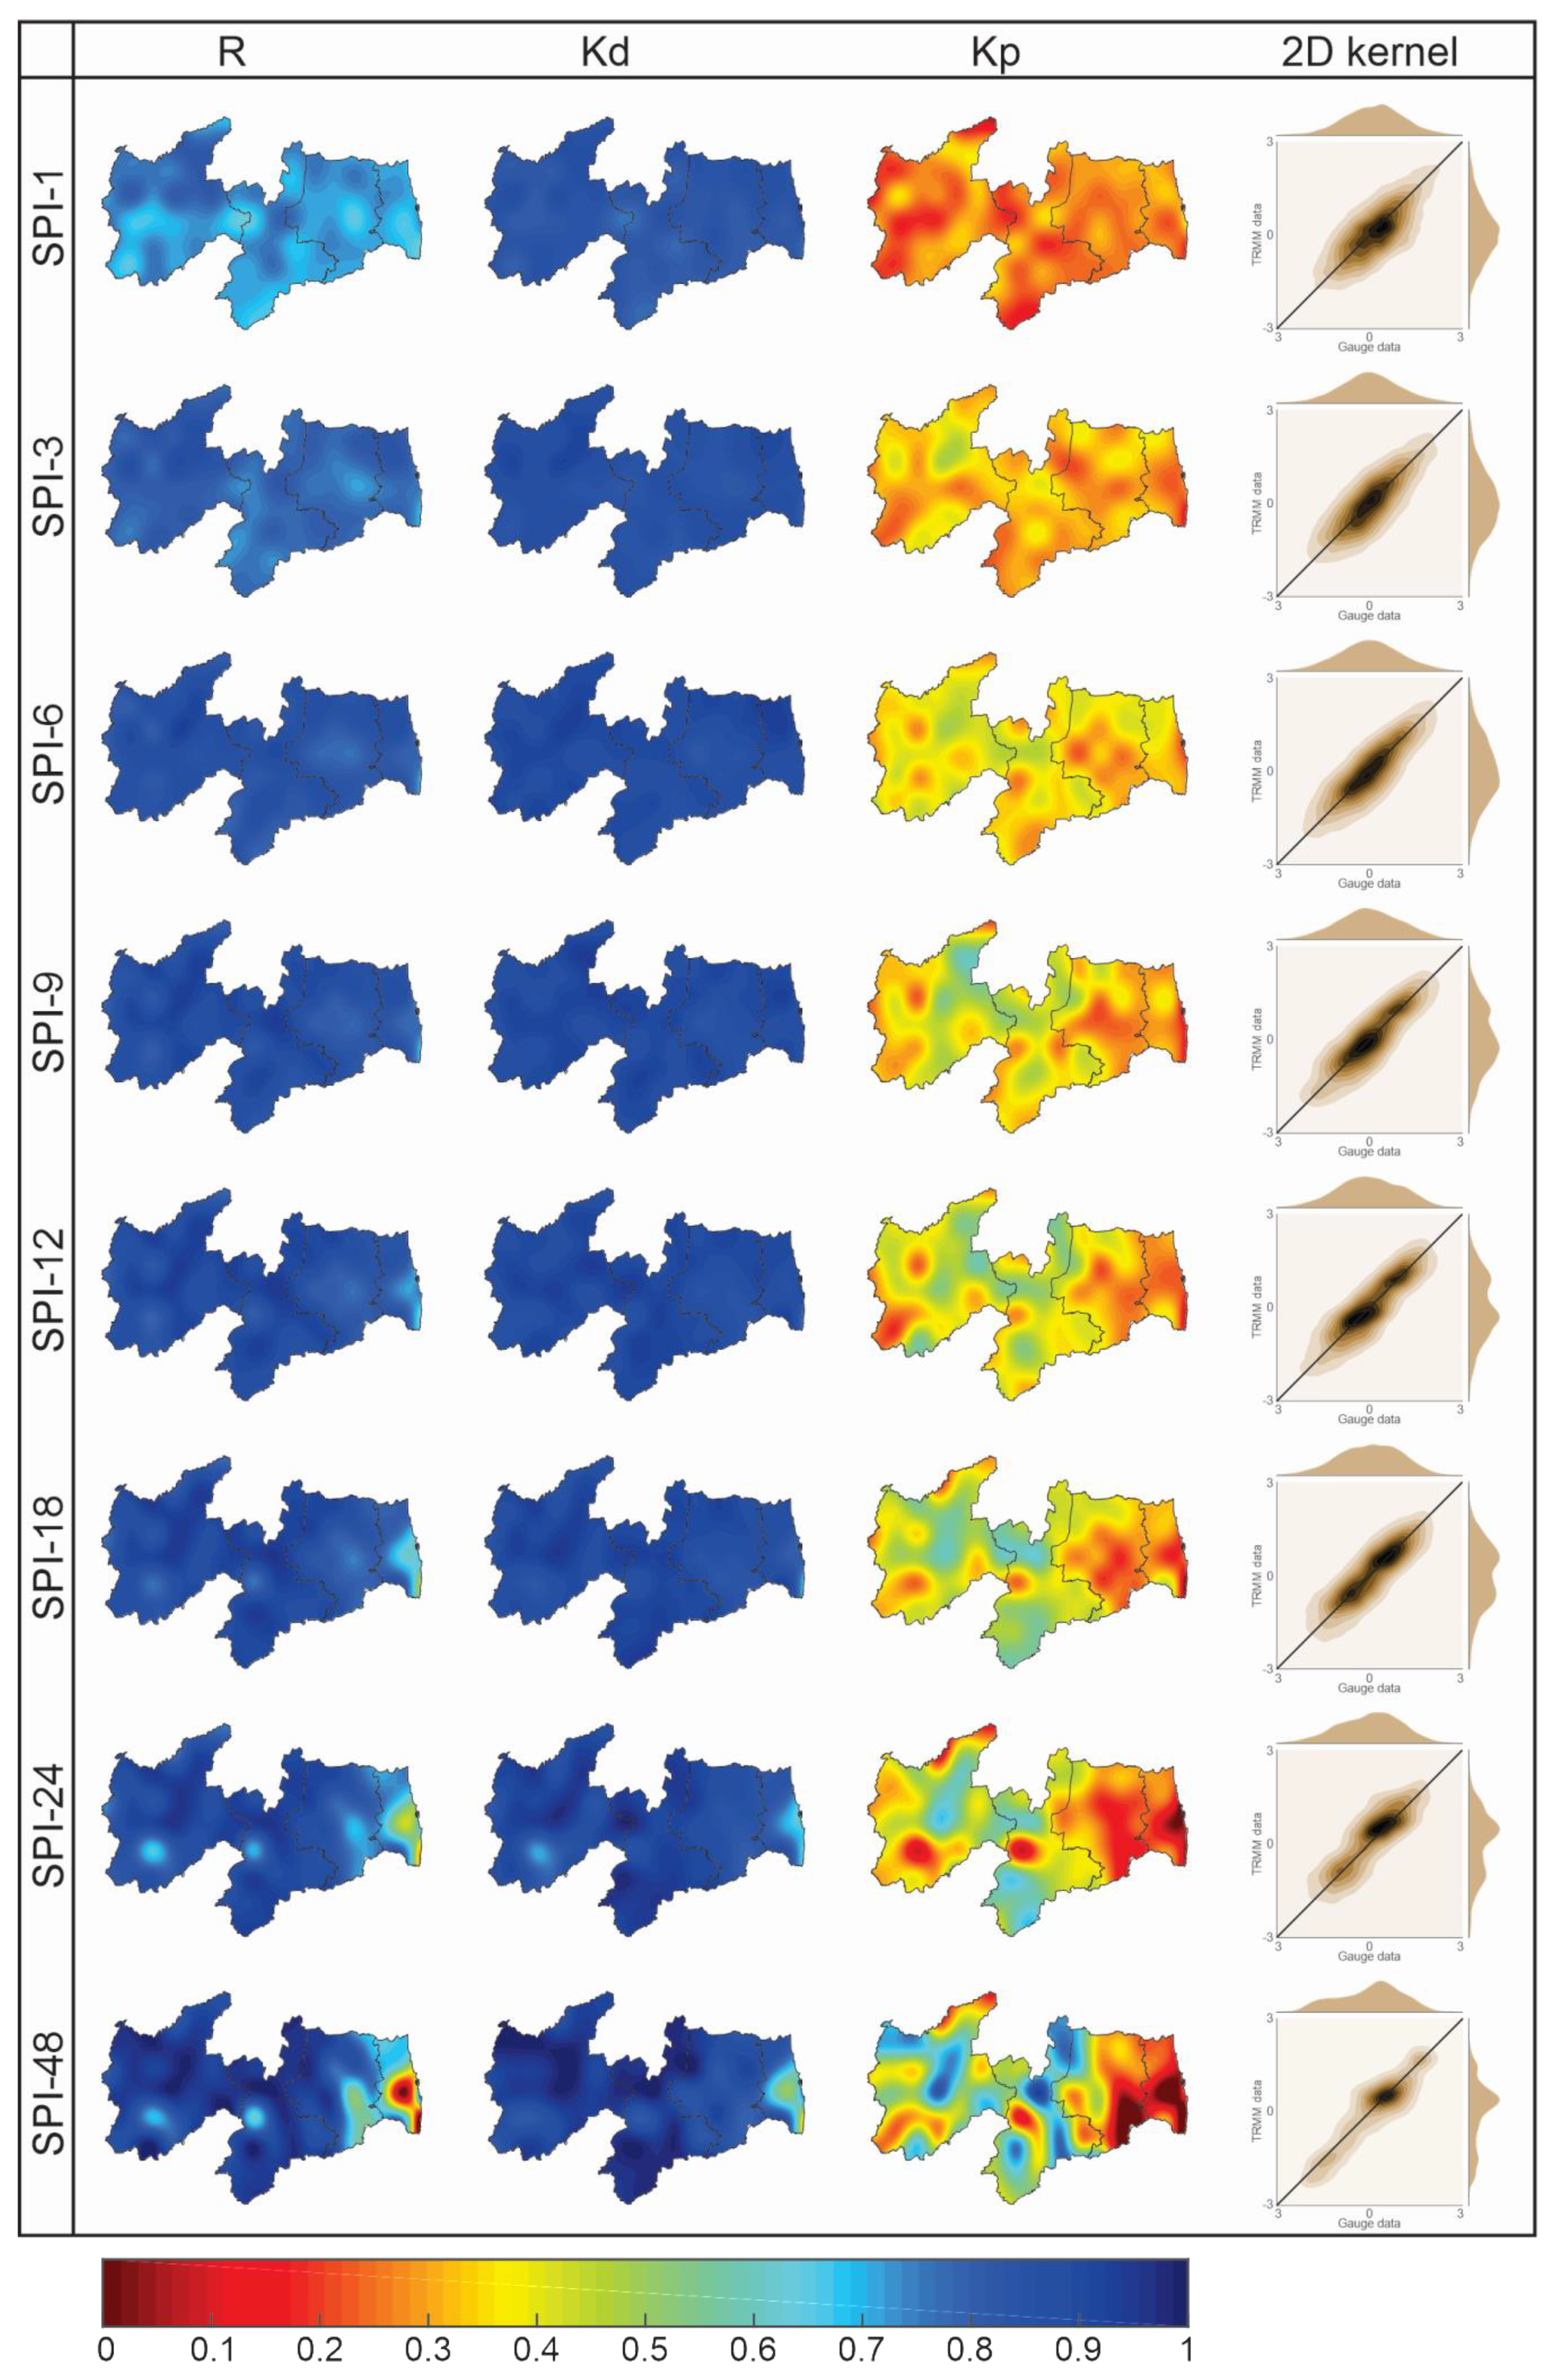
After carrying out the broadest analysis on the quality of the rain gauge network, the accuracy of the TRMM-estimated data in capturing the pattern of droughts at multiple time scales was assessed. In this way, Figure 5 shows the dispersion relationship (two-dimensional kernel density estimate plot) between SPI values based on rain gauge-measured and TRMM-estimated rainfall data and the spatial distribution of R, Kd and Kp over Paraíba for eight time scales. In general, the results showed high variability among the metrics, regions and time scales, a fact that highlights the importance of this result in the process of evaluating the spatiotemporal accuracy of TRMM-estimated rainfall data regarding drought assessment.
In terms of the dispersion relationship between the data, it is highlighted that for SPI-1, almost 19,000 (78 series × 240 months) points are plotted in Figure 5, representing the relationship between SPI-1 values based on rain gauge-measured data versus SPI-1 values based on TRMM-estimated data. Regardless of the time scale, there was a good linear association between the SPI values computed based on both databases, but it is clear that there were some differences between the products. For short-term droughts, for example, the worst results were for SPI-1, while the best results were for SPI-6. For medium-term droughts, there was a greater linear association between the data, especially when dealing with mild drought and wet events. Finally, among the long-term droughts, the worst result was that of SPI-48, which showed a slightly higher level of dispersion than other scales.
Although the dispersion ratio is generally a good indicator of the TRMM-estimated data accuracy in terms of capturing the patterns of different drought types, it is important to note that Figure 5 contains the results of 78 comparisons between the SPI time series based on rain gauge-measured and TRMM-estimated rainfall data, which makes it impossible to identify the regions with greater (or less) accuracy in characterizing the drought regime at multiple time scales. To solve this problem, the R values were spatialized over Paraíba State, allowing for the visualization of the spatial variability in the results. In general, the results corroborated the dispersion pattern but varied significantly among regions, making this result valuable for developing a more complete analysis.
For short-term droughts, the best results were obtained when evaluating SPI-6, especially in the Sertão Paraibano and Borborema mesoregions, while the worst results were found in the region closest to the coast under SPI-1 evaluation. Despite the spatial variability among the values, it is noted that these ranged from 0.60 in the worst cases to 0.90 in the best scenarios, which demonstrated the high accuracy of the TRMM-estimated data regarding the characterization of short-term droughts in the regions. For medium-term droughts, the results were even better than those for short-term droughts, and it is noted that the Sertão Paraibano and Borborema mesoregions had the highest values, while the Agreste Paraibano and Mata Paraibana mesoregions presented the worst results.
Surprisingly, the best and worst results from the three types of droughts (i.e., short-, medium- and long-term) were found simultaneously when evaluating long-term droughts. For SPI-48, there was an almost perfect linear association between the databases in the border area between the Borborema and Agreste Paraibano mesoregions, but on the other hand, in southeastern Agreste Paraibano and on the coast of Mata Paraibana, the results were unsatisfactory, since the linear correlation coefficients reach zero values. In China, [36] stated that the increase in the time scale positively influences the accuracy of the SPI values based on TRMM-estimated data, as found in the interior of Paraíba State. On the other hand, [41] concluded that the TRMM-estimated data become more inaccurate with the increase in the time scale in Malaysia and related this result to the size of the TRMM-estimated time series. These results indicate that it is necessary to investigate the accuracy of the SPI values based on TRMM-estimated data among the regions, as these values can vary, which highlights the importance of this study for Paraíba State.
Then, the spatial distribution of the Kendall (Kd) and kappa (Kp) concordance indices was determined. These metrics were chosen to measure the satellite’s accuracy to identify the types of drought and wet events and their categories. In general, it is noted that there was high spatial variability of the results, and this variability was similar to that obtained for the correlation coefficient R. For short-term droughts, the Kd values were mostly homogeneous in all regions and greater than 0.80. Conversely, the kappa concordance index values were lower than those of Kd and showed greater spatial variability. SPI-1 was the time scale that presented the worst results, while for SPI-6, there was greater accuracy in the values based on TRMM-estimated data. For SPI-9 and SPI-12, the Kd values were less variable but showed an increase when compared with short-term droughts.
Kp values increased in the center of Paraíba State, such that Sertão Paraibano and Borborema presented the highest values, while in regions close to the coast, the results indicated the low accuracy in capturing the types of drought and wet events. For long-term droughts, the Kd and Kp values had greater variability in terms of their magnitude and spatial distribution. For Kd, the improvement in the accuracy of SPI values based on TRMM-estimated data in Sertão Paraibano and Borborema was more evident, and there was a worsening of the TRMM-estimated data performance in the coastal region of Paraíba State, with values reaching 0.50. For Kp, the diversity among the regions made it difficult to define the mesoregions that performed better (or worse), especially for SPI-48. However, it is clear that the interior of the state had the best results.
In general, the results obtained from the evaluation of these metrics complemented and corroborated each other, such that the increase in the time scale resulted in an increase in the accuracy of the TRMM-estimated data in capturing the behavior of droughts, with the exception of Mata Paraibana. The results unanimously indicated that in Sertão Paraibano and Borborema, the results were more satisfactory than in Agreste Paraibano and Mata Paraibana. When comparing the performances of the three metrics, it is noted that the values of R and Kd were expected to be higher than those obtained for Kp, and it can be concluded that depending on the analyzed mesoregion, the TRMM-estimated data can be used as a precise alternative to monitor drought patterns and to identify the categories of dry and wet events at multiple time scales.
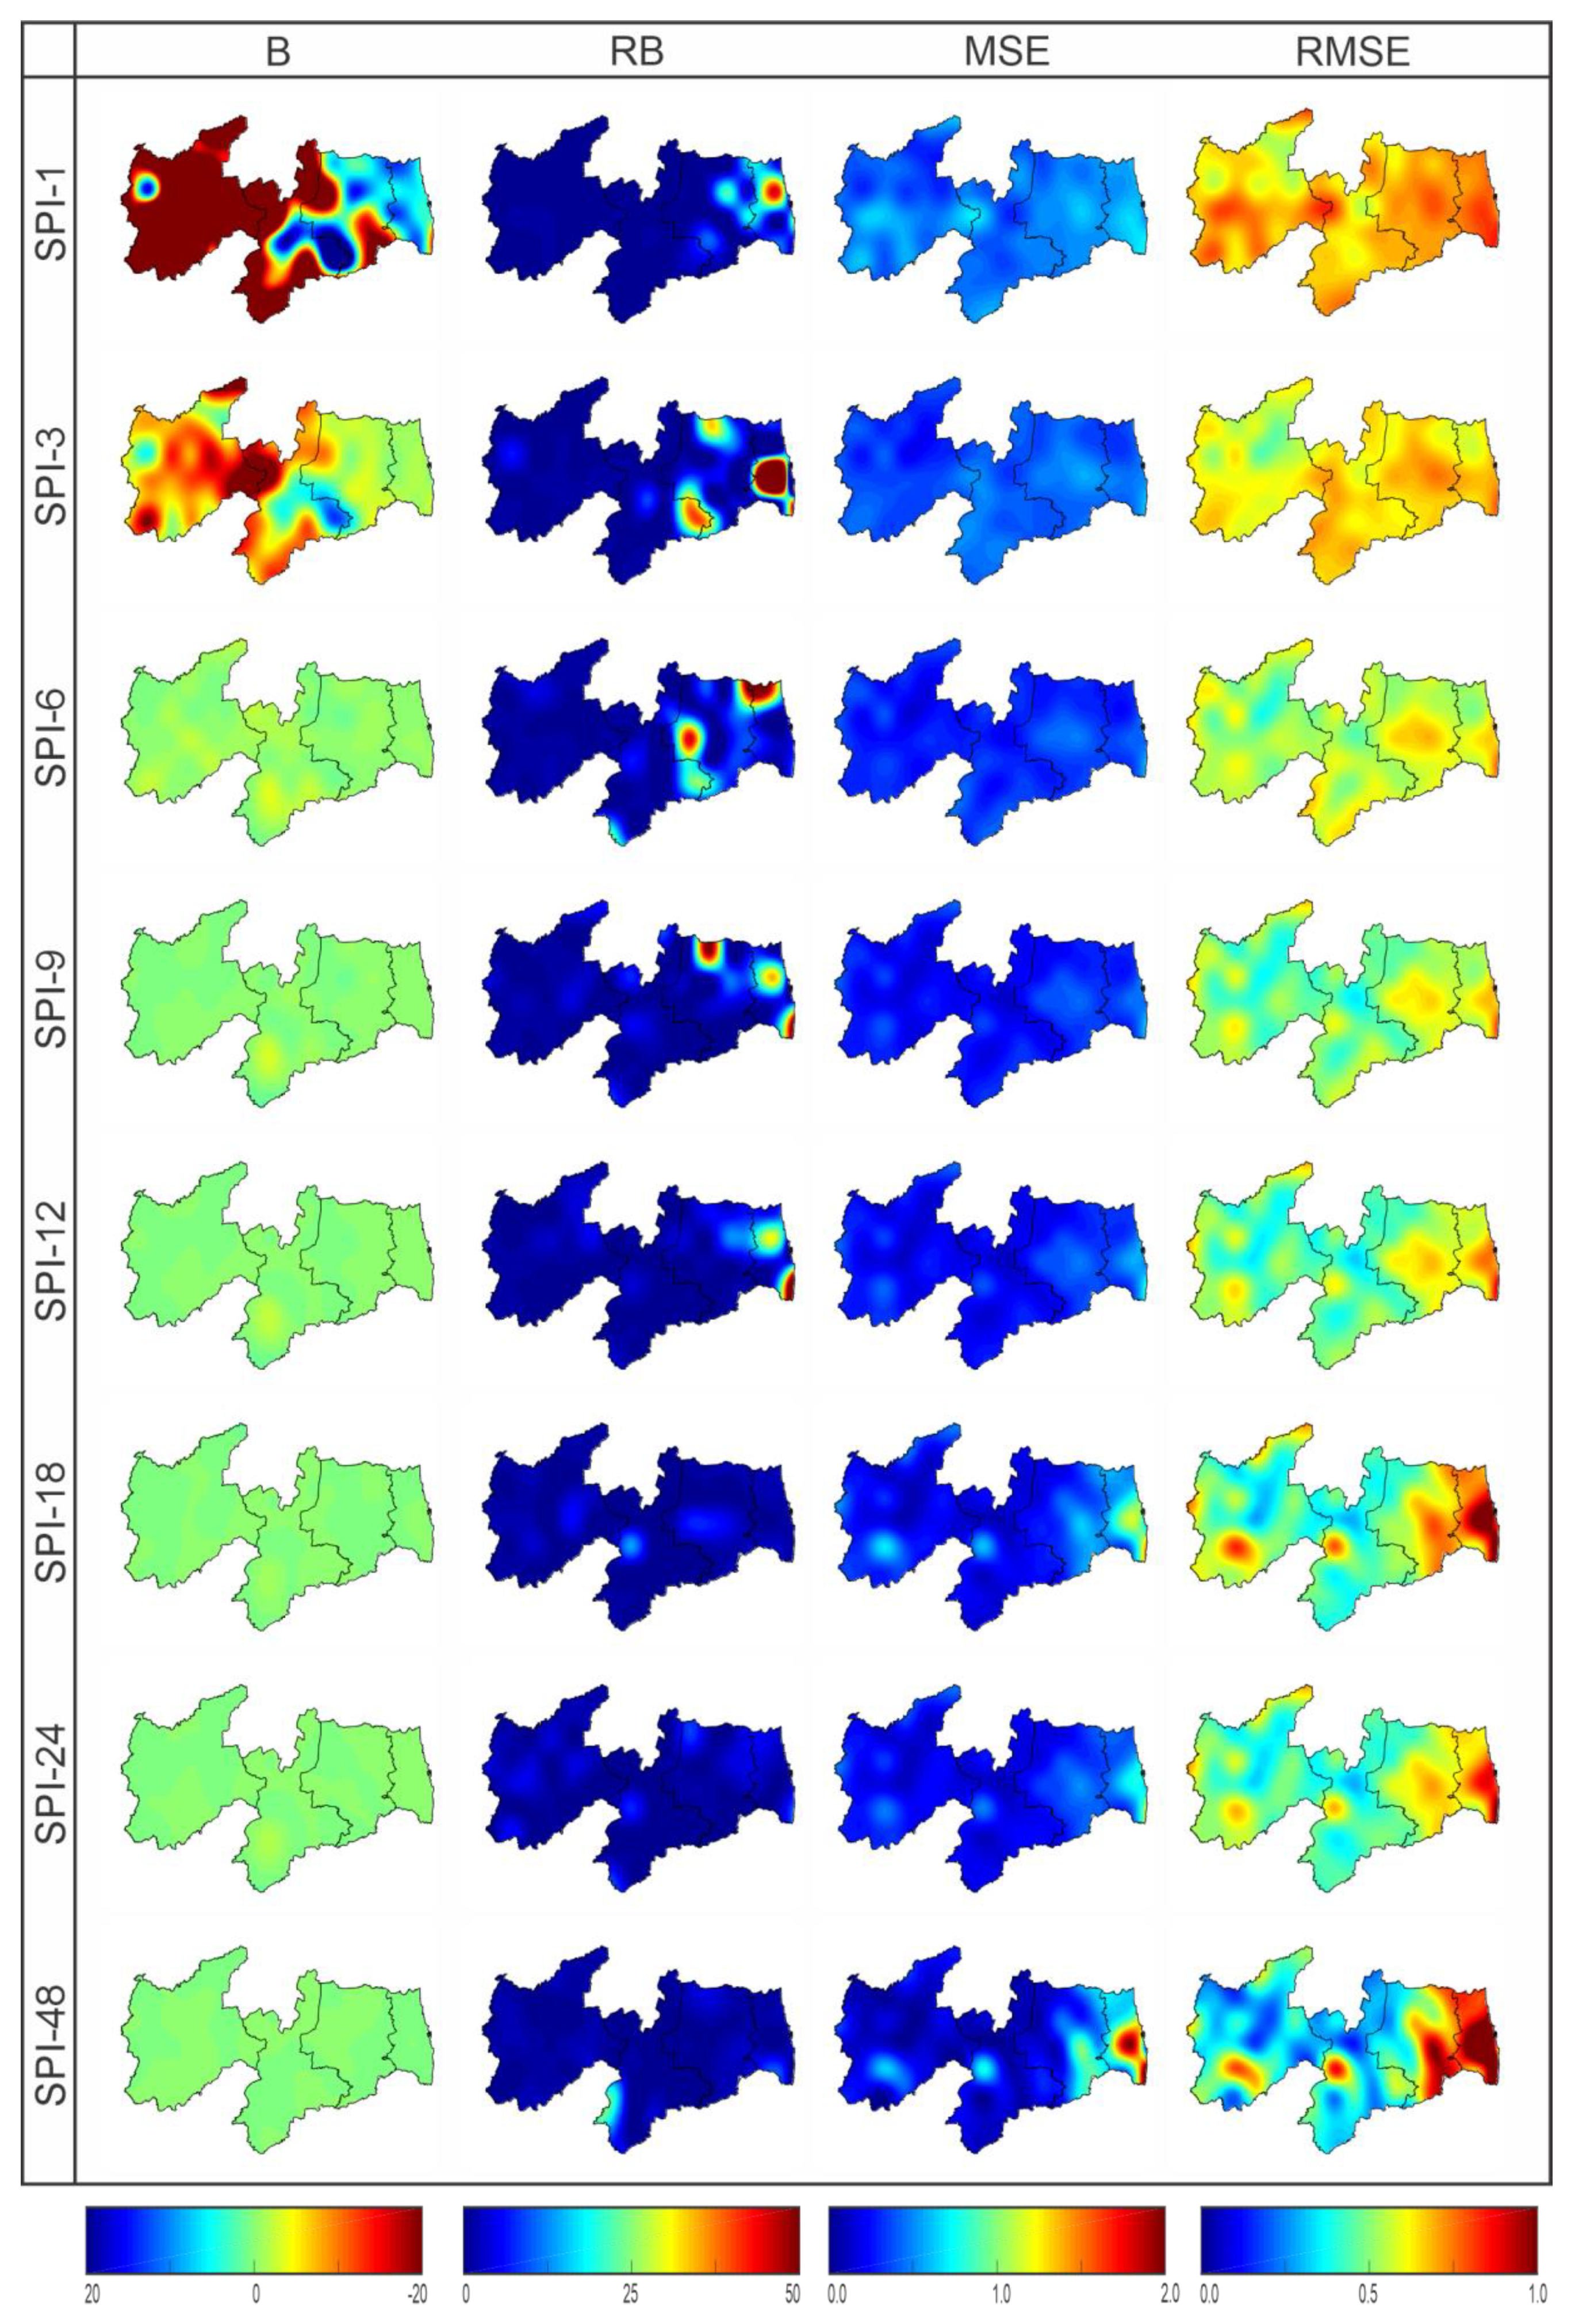
Continuing the statistical accuracy analysis of the TRMM-estimated data, Figure 6 shows the spatial distribution of B, RB, MSE and RMSE over Paraíba State for the eight SPI indices (1998–2017). In view of the variability in the results, it is fair to develop a detailed analysis of each temporal scale. For short-term droughts, a very particular pattern was noted when analyzing the B index of the SPI-1 and SPI-3 indices. The results indicated that the SPI-1 values that were computed based on TRMM-estimated data overestimated the SPI data obtained based on rain gauge-measured data in Mata Paraibana and in the southern border between Borborema and Agreste Paraibano, while in the interior of the state, this pattern was reversed (i.e., underestimated).
In this sense, there were indications that the assessed events based on TRMM-estimated data were wetter in the mesoregions of Mata Paraibana and in a large part of Agreste Paraibano and drier in the Sertão Paraibano and Borborema. For SPI-3, the same spatial distribution of values was maintained but to a lesser extent, such that B values were already lower. The results for the SPI-6 indicated that this was the time scale among those used to assess short-term droughts, which presented greater TRMM-estimated data accuracy. In the case of medium- and long-term droughts, B values were zero. Based on the relative bias (RB), it is noted how overestimated (or underestimated) the SPI values based on rain gauge-measured data were in relation to the SPI values based on TRMM-estimated data.
For SPI-3, for example, the results indicated that in most of the Mata mesoregion, there was an overestimation of more than 50 times the SPI time series based on rain gauge-measured data. There were two possible explanations for this result: the first was that the SPI data that were computed from the two databases were truly different, and there was a strong tendency to overestimate (or underestimate) on the part of some time series, a situation that can be identified based on the analysis of B. However, as the bias values were very low in this and other regions, this reason was ruled out as the cause of this result. On the other hand, the second and most adequate explanation for this situation was that in some cases, there was compensation between the positive and negative values of the SPI values by the rain gauge-measured data, such that the sum of the values over the period was almost zero.
For this reason, as the comparison of the RB in this study was based on the SPI calculated with the rain gauge-measured data, the ratio between the B values for these almost zero values resulted in high RB values. Hence, this error showed the inefficiency of the TRMM-estimated data in capturing the SPI values in the coastal region of Paraíba State, since there was a considerable overestimation of the rain gauge-measured data. However, for the other regions and time scales, the RB values were close to zero, and thus, it is noted that these values also need to undergo other investigations for a more complete analysis. In fact, although B and RB were close to zero, this does not mean that the SPI values based on TRMM-estimated data were the same as those based on rain gauge-measured data.
The low values of B and RB may have been the result of the compensation between the SPI values of the databases along the time series; however, much of the SPI values based on TRMM-estimated and rain gauge-measured data may differ greatly from each other in some moments, as the final result of the difference between the series can be null, and for this reason, the B and RB values were low. In this sense, the evaluation of the MSE and RMSE was necessary to increase the understanding of the accuracy of the TRMM-estimated data in capturing the SPI values over Paraíba State. When evaluating the mean quadratic error and the root of the mean quadratic error, a change in the spatial distribution of the values was noted which was different from that found for the analysis of B and RB, the results of long-term droughts showed greater variability.
For short-term droughts, the RMSE values were relatively satisfactory over the region, ranging from 0.40 in the best cases (e.g., in the Sertão Paraibano to SPI-6) to 0.80 in the worst cases (e.g., in the Mata Paraibana for SPI-1). In comparison with the results of B and RB, it was assumed that the results complemented each other, since in the areas where there was an overestimation (or underestimation) of the most expressive values, the largest errors were also obtained for MSE and RMSE. Conversely, for medium-term droughts, there was an increase in the variability in RMSE values among the mesoregions. In general, the results indicated an improvement in the accuracy of TRMM-measured data in Sertão Paraibano and Borborema, whose RMSE values were below 0.40, and a decrease in this accuracy, especially in Agreste Paraibano and Mata Paraibana, with values that exceeded 0.80.
It is interesting to note that this pattern intensified even more in the case of long-term droughts, since the RMSE values varied from 0.20 to 1.00 for the SPI-48. This result became even more intriguing when analyzing the distributions of B and RB, since for medium- and long-term droughts, the values were almost null throughout the region, and in general, it was expected that the RMSE values were also low. However, the explanation for the reason that the B and RB values were low and the MSE and RMSE values were high was in the trade-off between the positive and negative SPI values. For medium- and long-term droughts, unlike what occurred for short-term droughts, the SPI values based on TRMM-estimated and rain gauge-measured data were compensated for over the 20 years, which resulted in B and RB values of almost null.
This error was detected from the analyses of the MSE and RMSE, which highlighted the importance of carrying out a joint assessment between different statistical metrics. In regard to the analysis of these metrics, it should be noted that according to some studies, RMSE values below 0.50 are a good indicator of the accuracy of satellite-estimated data [53]. Adopting this value as a reference, the statistical accuracy of the TRMM-estimated data was rated as very good across much of Paraíba State when assessing droughts at different time scales. In addition, the results obtained in our work corroborated those of [37] for most of the Paraíba State (RMSE < 0.60). The caveat regarding the performance of the TRMM satellite was in the coastal region and especially when evaluating the long-term droughts, as the performance of the TRMM-estimated data was not relevant.
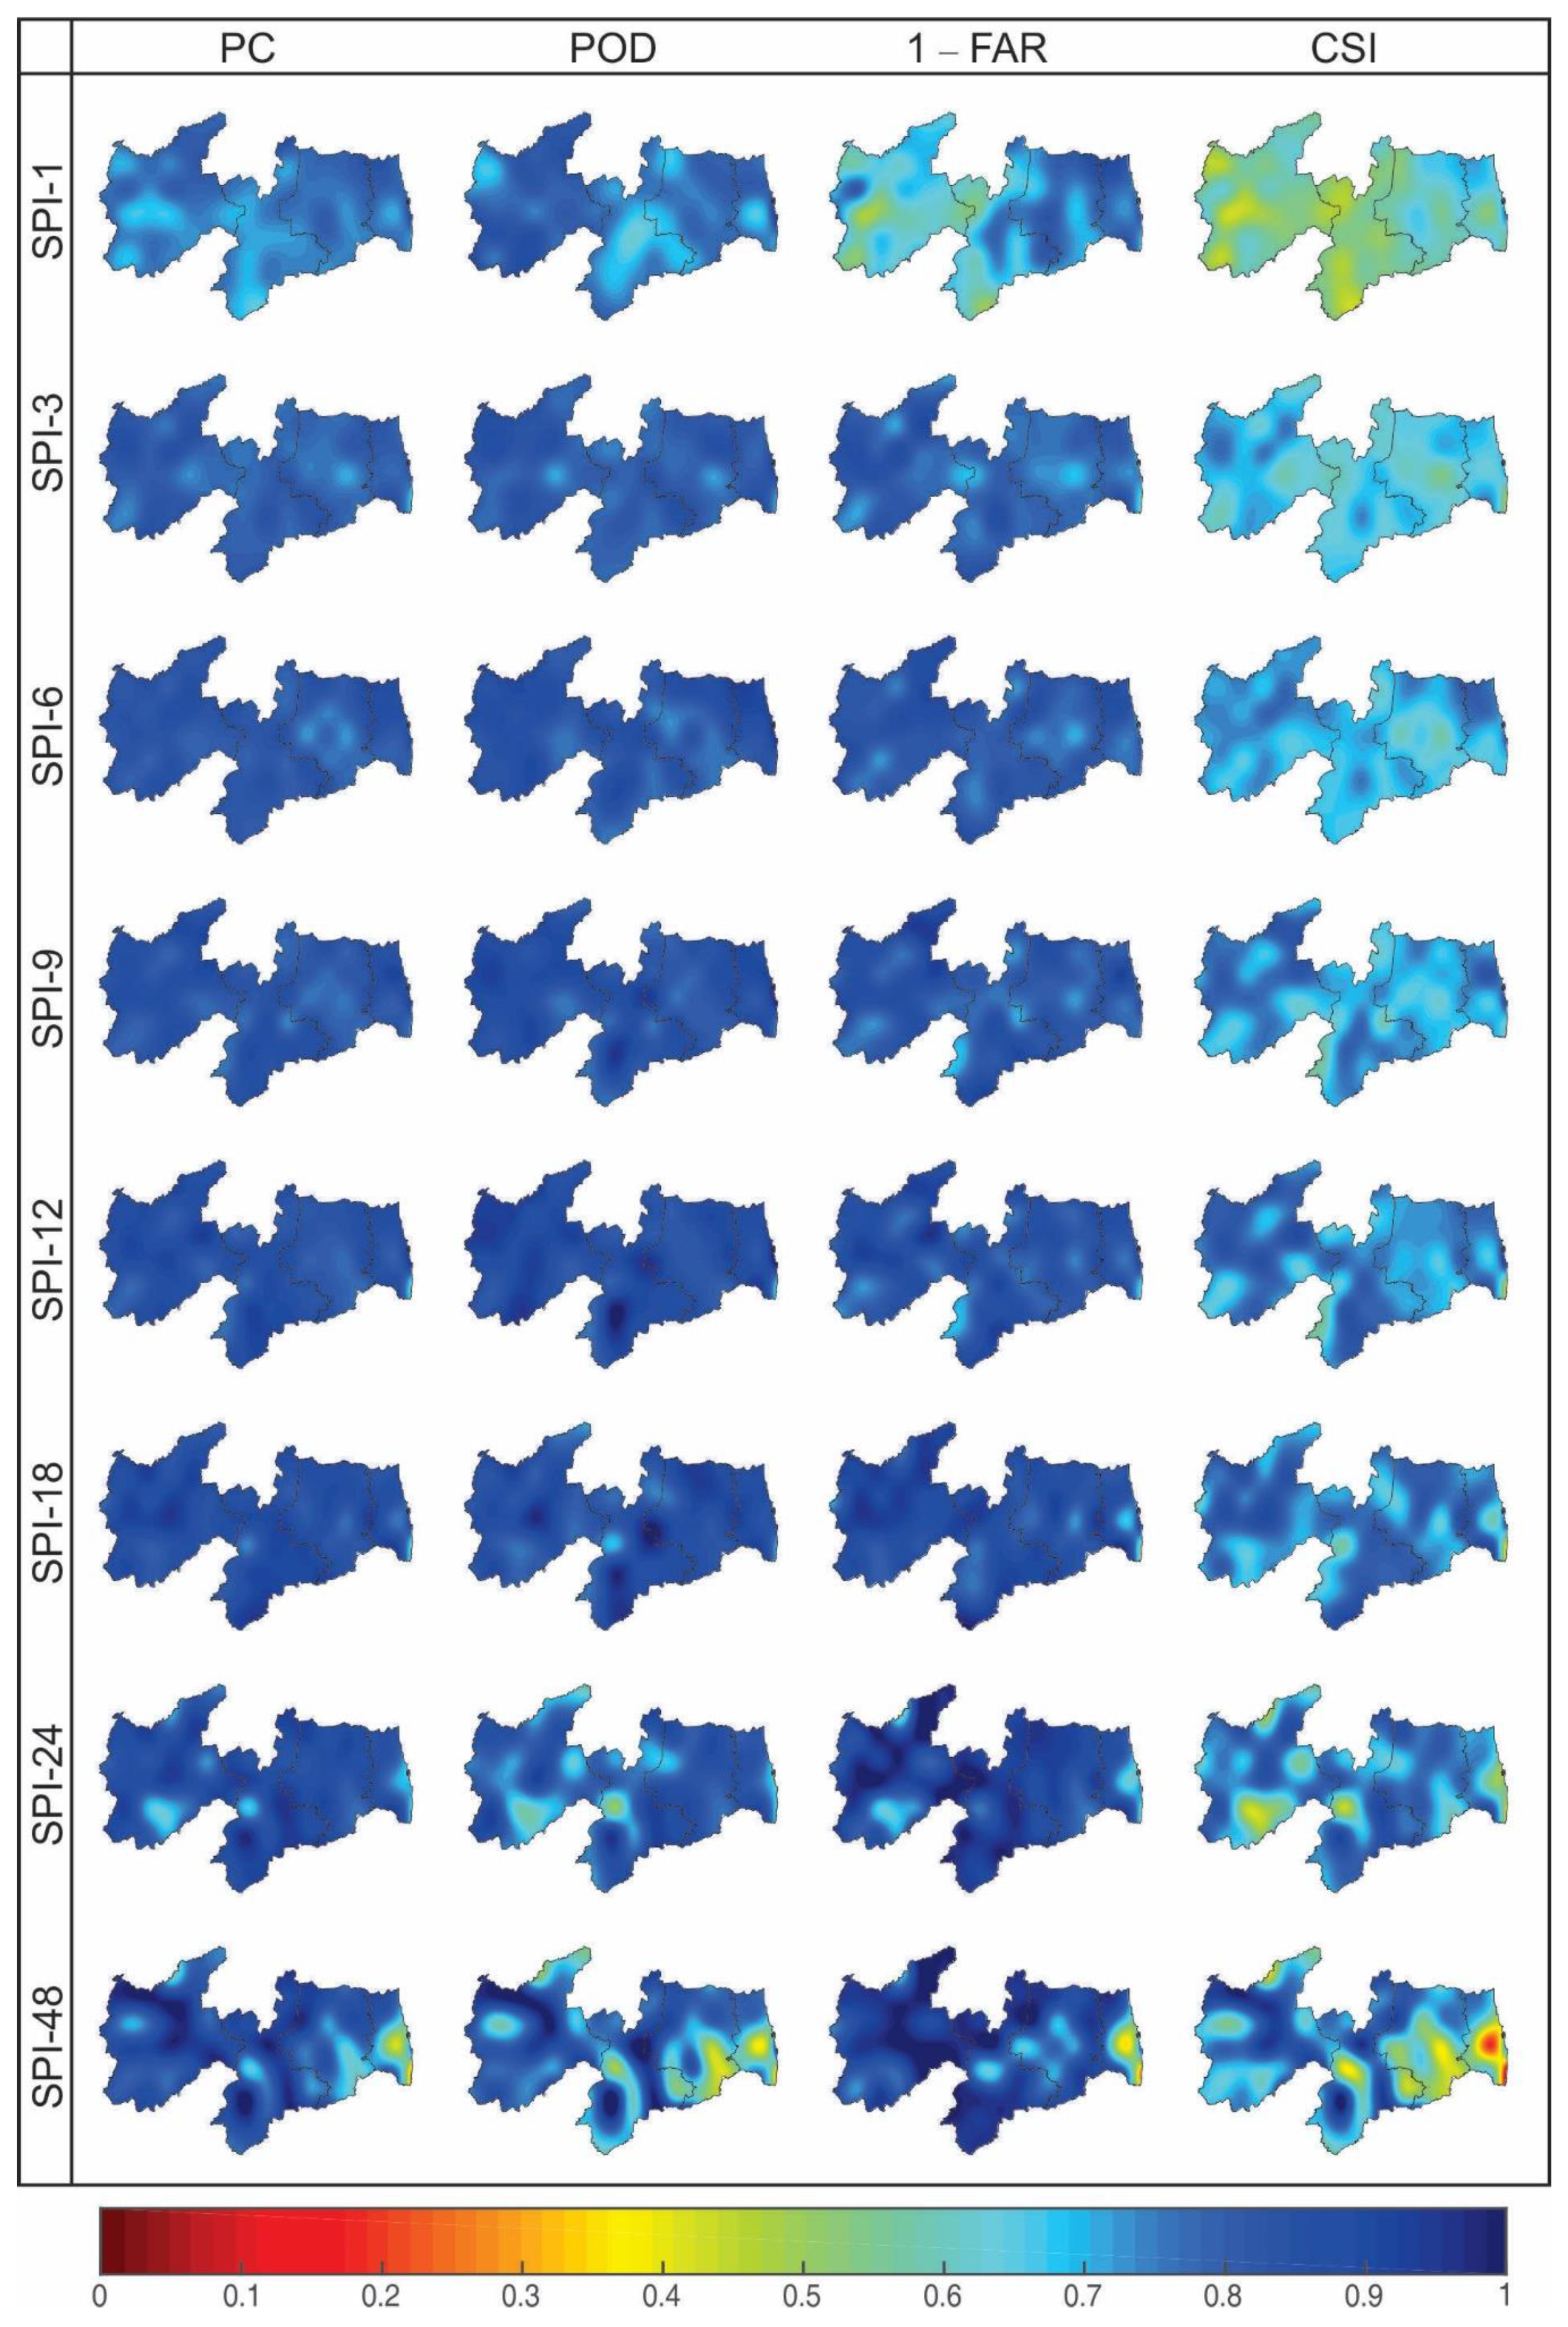
Finally, after performing the metrics analysis of the first two groups, a spatial evaluation of the performance indices that comprised the third group of metrics was conducted. Hence, Figure 7 shows the spatial distribution of the proportion correct (PC), the detection probability (POD), the false alarm index (1 − FAR) and the critical success index (CSI) over Paraíba State at various time scales (1998–2017). Regarding the metrics pattern, the best results were obtained when evaluating the PC, POD and (1 − FAR); in relation to the temporal scale, the most expressive results were obtained when evaluating medium-term droughts, and with regard to the spatial distribution of values, the precision in the Sertão Paraibano and Borborema mesoregions was obvious. In any case, there was considerable variability in the results due to the diversity in the physical characteristics over Paraíba State, and therefore, there is a need for a more detailed analysis.
PC was the metric that represents the number of times that TRMM-estimated and rain gauge-measured data agreed with each other when categorized as dry or wet events without distinction. The results were good and revealed the high accuracy of the TRMM-estimated data in categorizing dry or wet events during the 20 analyzed years. When assessing the pattern of short-term droughts, the worst results were obtained for SPI-1 in western Sertão Paraibano and part of Borborema, with values close to 0.65. Conversely, the best results were found for SPI-6 in Sertão Paraibano and Borborema, which exceeded a value of 0.85. For medium-term droughts, the PC values were even higher than those for short-term droughts, such that in most parts of the Paraíba State, they exceeded a value of 0.90, which showed a high level of agreement between the databases. For long-term droughts, it was clear that in Agreste Paraibano and especially in Mata Paraibana, there was a drop in values, which reached below 0.40, and this result was the worst among the analyzed time scales.
Regarding the results for short-term droughts, it is interesting to note that these results may have been related to the precipitation pattern in the Sertão Paraibano and Borborema mesoregions. In these regions, rainfall levels are not so high, and there is a predominance of heavy, short rainfalls. Thus, when dealing with short-term droughts, which consider the accumulated precipitation of a short period, any fluctuation in the rainfall pattern that may not be correctly identified by the satellite can cause different events to be classified as dry or wet by different databases. In this sense, it is noted that the error in the TRMM-estimated data becomes more susceptible to short-term droughts, but as the time scale increases, the accumulation of rainfall results in an increase in satellite-estimated data accuracy.
When assessing the accuracy of TRMM-estimated data in correctly identifying dry events, since these events occur according to the rain gauge-measured data, there was a considerable similarity between the POD pattern and the results obtained for the PC. As an explanation, when the POD value was 0.80, this meant that among all events categorized as dry based on rain gauge-measured data, there was an 80% correctness in the TRMM-estimated data when classified as dry. For short-term droughts, the areas in the central part of Borborema were those that had the worst results when evaluating SPI-1, as well as PC. In any case, the POD values were generally greater than 0.65, which indicated that the TRMM-estimated data were highly accurate when correctly detecting the occurrence of dry events.
On the other hand, for medium-term droughts, the POD results were even better and extended across all mesoregions, ranging from 0.80 to almost 1.00 in areas of Borborema. For long-term droughts, the worst results were obtained, especially the results of the Mata Paraibana mesoregion, the southern portion of Agreste Paraibano and the border area between Borborema and Sertão Paraibano. In these regions, the POD values were less than 0.50, which indicated a certain inaccuracy of the TRMM-estimated data in detecting the occurrence of dry events. In addition, it is also worth noting that the high POD values in Borborema may have been linked to the frequency of dry events in that mesoregion. In fact, when comparing the results of B (Figure 6) with POD (Figure 7), it is noted that in this region, the SPI values based on TRMM-estimated data were underestimated, which indicated a higher occurrence of drier events.
In addition, given the rainfall pattern over the region, it is easy to understand that the possibility of success by the satellite-estimated data to identify a dry event in areas where these types of events are more frequent is greater than in other areas where drought events are rare, as is the case in both Agreste Paraibano and Mata Paraibana, as suggested by [30]. Based on results obtained by [4,47], it is clear that Borborema is the least rainy mesoregion in the state, which further supports the results of this research. When assessing the FAR, a similar pattern to that of both the PC and POD indices was noted: when the FAR value was assumed to be 0.10, this meant that among all events classified as dry by the TRMM-estimated data over time, the events were categorized as wet in only 10% of the cases based on rain gauge-measured data. In this work, the expression (1 − FAR) was only used to maintain the same color scale among the figures, such that 0 indicated the worst accuracy scenario and 1 indicated the best.
For short-term droughts, there was a very unique pattern in the behavior of SPI-1, such that in western Sertão Paraibano and in a large part of Borborema, the values were approximately 0.45, which was not a satisfactory result compared with that obtained for the PC and POD indices. When dealing with SPI-3 and SPI-6, the results returned to show more adequate precision over the entire state, exceeding values of 0.80. For medium-term droughts, there was an increase in the accuracy of the TRMM-estimated data, such that the values in some regions of the Sertão Paraibano and Borborema exceeded 0.90. For long-term droughts, it was assumed that the results were better than those of the PC and POD indices, such that for SPI-18, the values were 0.90 over Paraíba State. For SPI-24, the least satisfactory results were found in southern Sertão Paraibano and for SPI-48, in Agreste Paraibano and on the Paraíba coast.
Finally, when disregarding the correct classification when both databases categorized the same event as wet, there was a decrease in the CSI values compared with the results of the PC, POD and FAR indices. In general, this result showed how accurate the TRMM-estimated data were when correctly estimating the occurrence of wet events because if this number of hits was not significant, the PC and CSI values should have been very close. Although the drop in CSI values was obvious, it is worth noting that the spatial pattern of the results was basically the same as those of the other performance indices. For short-term droughts, the values were lower in the Sertão Paraibano and Borborema mesoregions when dealing with SPI-1, but they tended to increase with the increase in the time scale. For SPI-9 and SPI-18, the best results were found for the state, but for SPI-24 and SPI 48, there was an even more sudden drop in the CSI values, especially in southern Sertão Paraibano and in much of Agreste Paraibano and Mata Paraibana. Notably, although the study area was different, this result corroborated that found by [40] in China, who also realized that the increase in time scale influences the decrease in CSI values.

3.3. Accuracy Analysis in the Mesoregions

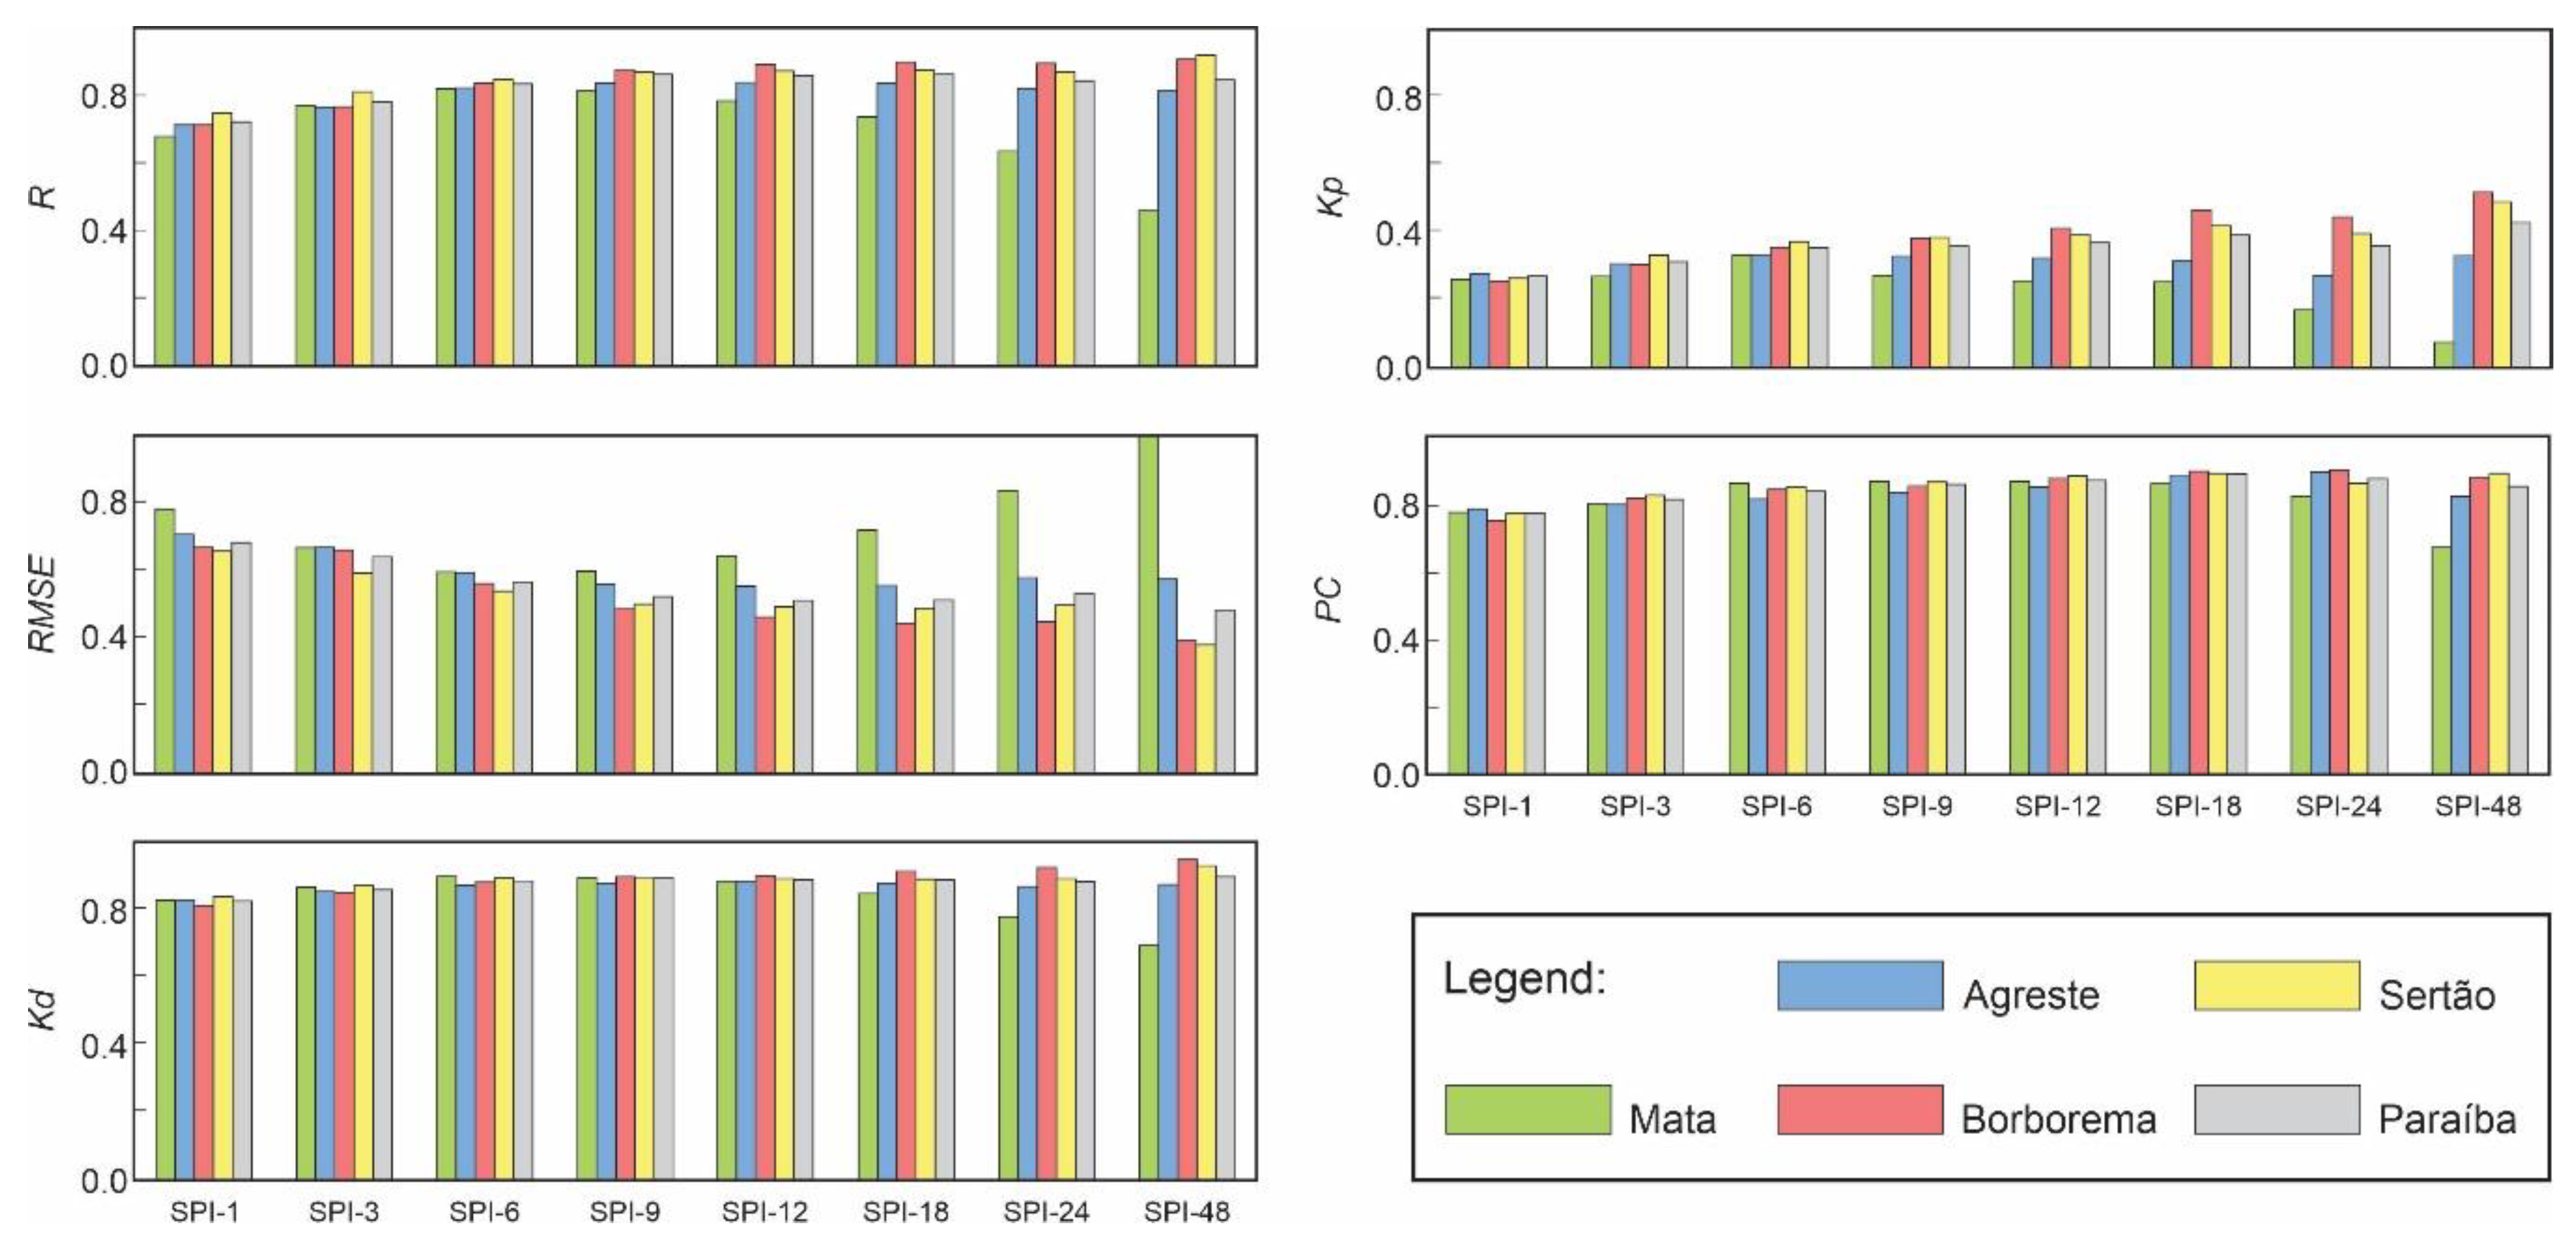
After the spatial analysis of the 11 metrics over Paraíba State at multiple scales, an accuracy analysis was performed for each mesoregion. Figure 8 shows the analysis of the R, RMSE, Kd, Kp and PC indices for each mesoregion, and for that purpose, metrics from each of the existing groups of metrics were selected to obtain an overview of the accuracy of the TRMM-estimated data in each mesoregion.
For the correlation coefficient R, there was an increase in values with an increase in temporal scale, and this pattern was found in all mesoregions, with the exception of Mata Paraibana, which presented the lowest values when assessing long-term droughts. In general, Borborema and Sertão Paraibano were the regions that had the most expressive R values, while Agreste Paraibano and especially Mata Paraibana had the least satisfactory results. In any case, the results for Paraíba State were relevant and varied from 0.70 for SPI-1 to approximately 0.80 for medium- and long-term droughts. In terms of the metrics evaluation of the first group, it is noted that in the case of RMSE, the increase in the time scale caused a decrease in the RMSE values, indicating greater accuracy of the TRMM-estimated data when estimating the SPI magnitude.
Notably, when considering short- and medium-term droughts, the results obtained between the mesoregions were homogeneous, but it is possible to note that the pattern found in Mata Paraibana was the least satisfactory among the mesoregions. In the case of longer-term droughts, the results of Agreste Paraibano and mainly of Mata Paraibana tended to differ from those found in Sertão Paraibano and Borborema, indicating a relevant drop in the statistical accuracy of the TRMM-estimated data, as found in the correlation coefficient case. The RMSE values for Paraíba State generally did not exceed 0.70, which indicated that the accuracy of the TRMM-estimated data in capturing the magnitudes of the SPI values was still satisfactory. In the case of the Kendall Kd and kappa Kp concordance indices, there was a great similarity between these results.
For Kd, it is noteworthy that at all time scales, with the exception of the pattern of Mata Paraibana, in the case of SPI-48, the minimum value of all mesoregions was equal to 0.80, which indicated an extremely satisfactory statistical accuracy of the TRMM-estimated data to capture the occurrence patterns of different dry and wet event categories. In addition, it is worth noting that these results were better than those of the Pearson’s correlation coefficient and that there was homogeneity of values among the mesoregions, i.e., there was no significant variability among the mesoregions, especially when assessing short- and medium-term droughts. In the case of long-term droughts, the overall precision in Borborema, Sertão Paraibano and Paraíba State is emphasized.
Conversely, when evaluating SPI-48, the Kp values were the lowest among all other metrics used in this work, ranging from 0.10 in Mata Paraibana to 0.50 in Sertão Paraibano. Unlike the Kd results, it is possible to notice that there was variability among the results of the mesoregions and that there was a clear relationship between Kp and the variability in the time scale. For short- and medium-term droughts, the values did not exceed 0.40, whereas for long-term droughts, in Borborema and Sertão Paraibano the values were much higher. In general, the results for Mata Paraibana and Agreste Paraibano were the worst, with Paraíba State showing a regular pattern, similar to the other regions.
When evaluating the PC, the correct proportion index, the similarity of these results with those obtained for the Kd was obvious in terms of the pattern among the mesoregions as well as the magnitude of the values. Although there was a slight increase in values with the increase in temporal scale, the behavior in the mesoregions was homogeneous, and the average values were approximately 0.80, which showed the very high accuracy of the TRMM-estimated data in identifying the occurrence of drought or wet events. As in the case of R, RMSE, Kd and Kp, the worst results were found in Mata Paraibana in the case of SPI-48; however, in this situation, these were not as bad as in the other metrics, as the accuracy percentage was 0.65. In general, there was no significant distinction among the patterns of the mesoregions, and the values for Paraíba State were satisfactory (i.e., PC > 0.80).
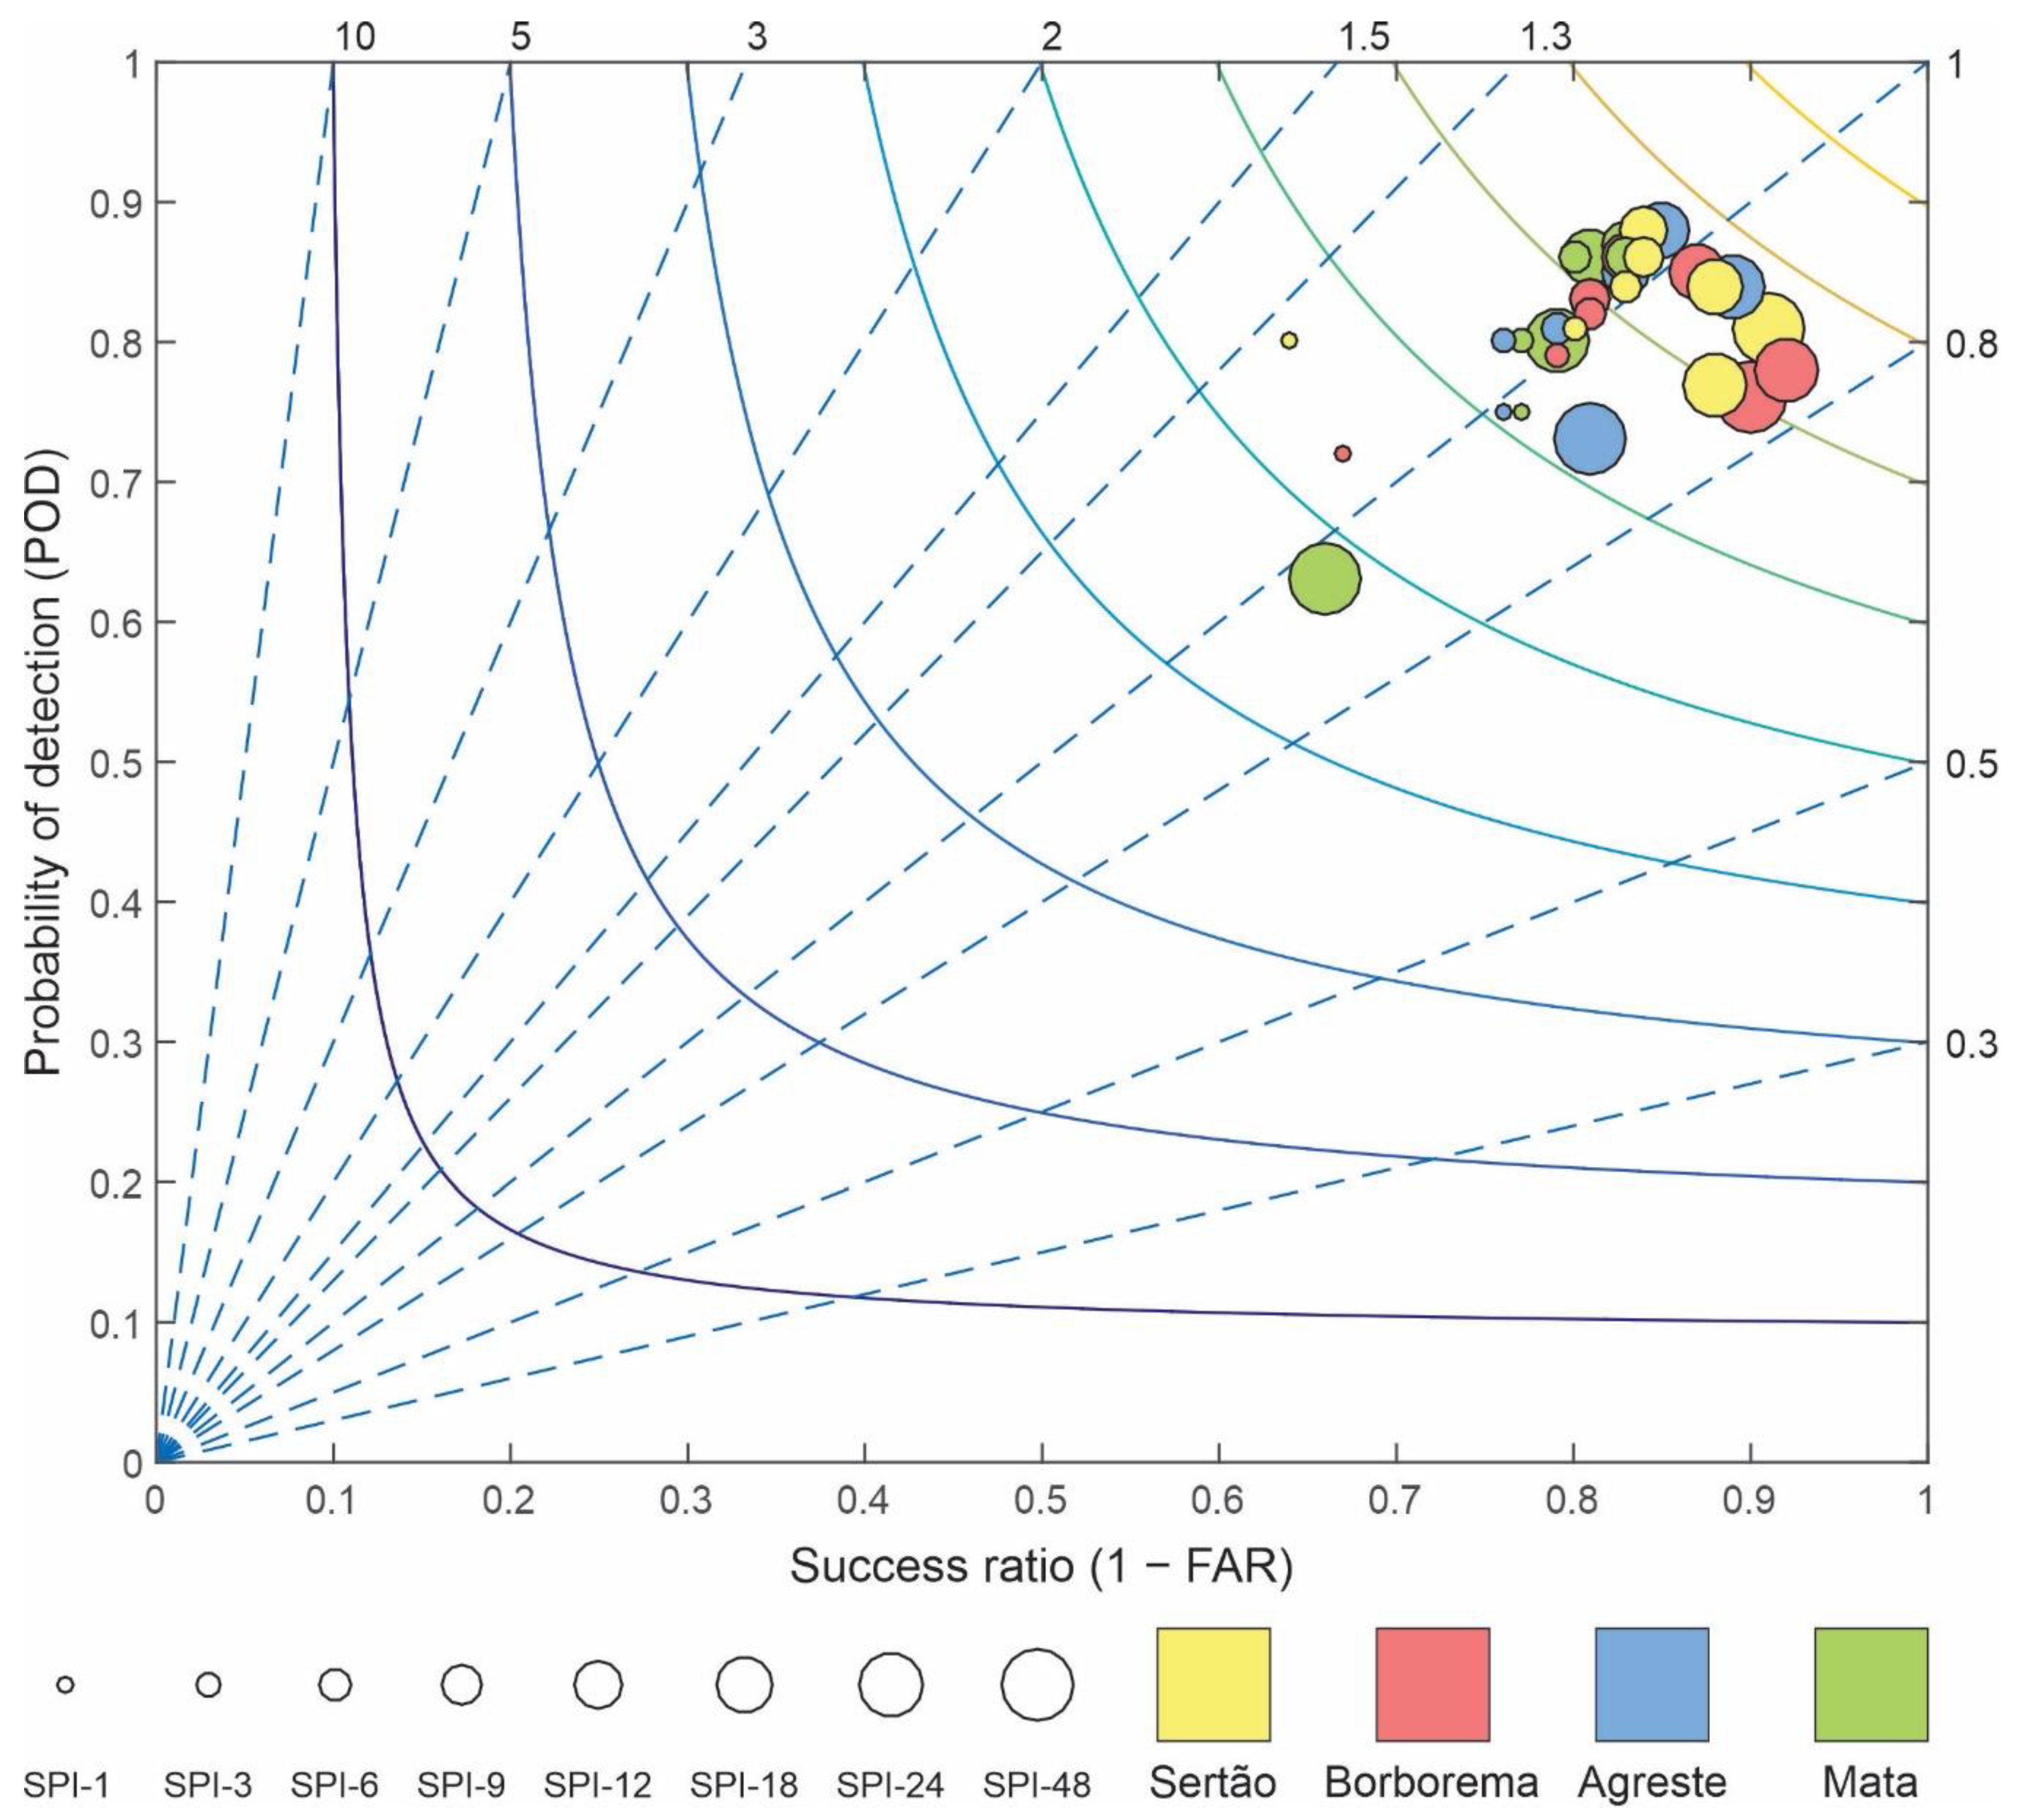
Finally, to assess the performance of TRMM-estimated data in capturing the occurrence of dry or wet events related to the third group of metrics, the performance diagram proposed by [66] was used to assess the probability of detecting drought events (POD), the false alarm index (1 − FAR) and the CSI (critical success index) for the mesoregions at multiple time scales (Figure 9). The abscissa axis is the probability of detecting drought events, the ordinate axis represents the false alarm index, and the continuous lines characterize the critical success index. In this sense, it is clear that the results between the mesoregions and time scales revealed good satellite accuracy in terms of the identification of dry or wet events, but some points deserved to be highlighted in this analysis.
In general, most of the results were under the slope line of θ = 45°, which characterized the best accuracy situation of the TRMM-estimated data, as it indicated that the relationship between the false alarm index and detection probability was linear, without underestimation or overestimation of errors within the metrics. However, when evaluating long-term droughts, it is noted that there was a tendency for the detection probability values to be lower than those of the false alarm index, which caused several points to be below the line of θ = 45°. On the other hand, when assessing droughts with a shorter time scale, the scenario was reversed, and the values of the axis of ordinates (1 − FAR) became lower than those of the abscissa (POD). The results indicated that most of the mesoregions had an average critical success rate greater than 0.70 and less than 0.80, which indicated high accuracy.
For Mata Paraibana, the worst results were found when evaluating SPI-48, as both POD and 1 − FAR were approximately 0.60 and CSI was less than 0.50, which was the lowest value among all analyses. For this mesoregion, the results were more expressive in the case of medium-term droughts, as both the false alarm index and the POD were greater than 0.80, and the critical success index maintained an accuracy greater than 0.70. For Agreste Paraibano, the POD results were similar to those of Mata Paraibana but slightly better. For the false alarm index, the results found in relation to those of Mata Paraibana were almost equal in the case of short- and medium-term droughts but notably better than those of long-term droughts. The CSI index in this mesoregion ranged from 0.60 to 0.75 in the best cases.
For Borborema, the POD values were higher than those in Mata Paraibana and Agreste Paraibano, with the exception of the SPI-48 pattern. The false alarm index showed more expressive values than those in these regions, especially when dealing with long-term droughts. When evaluating the critical success index, it is worth highlighting the result obtained when evaluating the SPI-1, which represented one of the worst results among the analyses, but the other results ranged between 0.65 and 0.75. In the case of Sertão Paraibano, the POD values were the highest among the mesoregions and varied by approximately 0.80, with the results of medium-term droughts being the best among the time scales. In the case of the false alarm index, with the exception of SPI-1, the results indicated high accuracy of the TRMM-estimated data, and these values were mostly the best in the state.
In addition, it is emphasized that there was a tendency for the values of the false alarm index to be more expressive than the probability of detection, as in the case of Borborema. Finally, it is worth noting that the critical success index had the same magnitude as the values in the Borborema region, with a particular focus on the SPI-1 behavior, whose value was 0.55. The results showed that this pattern of imprecision in the TRMM-estimated data in the coastal regions of northeastern Brazil had already been discussed in other studies [31,67], which evaluated the performance of the TRMM-estimated data in Brazil and concluded that in northeastern Brazil, a region to which Paraíba State belongs, the TRMM-estimated data do not present satisfactory accuracy on the coast. In contrast, in the semiarid region, where 80% of Paraíba State is located [68], studies point out the most satisfactory precision, as confirmed by the results obtained in this study. More specifically, the results corroborated those obtained by [30], who also identified that on the coast with the highest rainfall levels, the accuracy of the TRMM-estimated data is reduced.

4. Conclusions

In this work, droughts and their characteristics over Paraíba State are evaluated at multiple time scales using rain gauge-measured and TRMM-estimated rainfall data over various perspectives. Regarding the statistical accuracy of the TRMM-estimated rainfall data, there is high variability between the mesoregions of the state, and the time scale influences the accuracy of the TRMM-estimated data. In general, the Mata Paraibana and Agreste Paraibano mesoregions, which are closest to the coast, are areas where the greatest estimation inaccuracies exist, while in Sertão Paraibano and Borborema, the results are satisfactory. With regard to time scales, medium-term droughts show the most expressive results, but the patterns of short- and long-term droughts are also relevant in most of the state. Finally, it is concluded that the TRMM-estimated rainfall data are a valuable source for identifying the drought pattern in a large part of Paraíba State at multiple time scales; therefore, it is estimated that the results obtained in this research may contribute to the validation of this data source in relation to the monitoring of droughts, and this study can be developed in other regions of the planet with similar characteristics to those of Paraíba State.

Author Contributions

R.M.B.N. and C.A.G.S. designed the research; R.M.B.N. and C.A.G.S. wrote the original draft; R.M.B.N., C.A.G.S., T.V.M.d.N. and R.M.d.S. conducted the manuscript review and editing; C.A.C.d.S., C.A.G.S. and R.M.d.S. provided funding acquisition, project administration and resources; and R.M.B.N., C.A.G.S., T.V.M.d.N., R.M.d.S. and C.A.C.d.S. wrote the final paper. All authors have read and agreed to the published version of the manuscript.

Funding

This study was financed in part by the Brazilian Federal Agency for the Support and Evaluation of Graduate Education (Coordenação de Aperfeiçoamento de Pessoal de Nível Superior—CAPES)—Finance Code 001 (Grant Nos. 88887.091737/2014-01 and 88887.123949/2015-00), the National Council for Scientific and Technological Development, Brazil—CNPq (Grant Nos. 304213/2017-9, 304540/2017-0 and 304493/2019-8) and Federal University of Paraíba.

Acknowledgments

The data from the Tropical Rainfall Measuring Mission (TRMM) and Agência Executiva de Gestão de Águas—AESA (www.aesa.pb.gov.br/aesa-website) are gratefully acknowledged.

Conflicts of Interest

The authors declare no competing interests.

References

  1. Sousa Júnior, W.; Baldwin, C.; Camkin, J.; Fidelman, P.; Silva, O.; Neto, S.; Smith, T.F. Water: Drought, Crisis and Governance in Australia and Brazil. Water 2016, 8, 493. [Google Scholar] [CrossRef] [Green Version]
  2. Thomas, T.; Jaiswal, R.K.; Galkate, R.; Nayak, P.C.; Ghosh, N.C. Drought indicators-based integrated assessment of drought vulnerability: A case study of Bundelkhand droughts in central India. Nat. Hazards 2016, 81, 1627–1652. [Google Scholar] [CrossRef]
  3. Caloiero, T.; Veltri, S.; Caloiero, P.; Frustaci, F. Drought analysis in Europe and in the Mediterranean basin using the Standardized Precipitation Index. Water 2018, 10, 1043. [Google Scholar] [CrossRef] [Green Version]
  4. Santos, C.A.G.; Brasil Neto, R.M.; Silva, R.M.; Santos, D.C. Innovative approach for geospatial drought severity classification: A case study of Paraíba state, Brazil. Stoch. Environ. Res. Risk Assess. 2019, 33, 545–562. [Google Scholar] [CrossRef] [Green Version]
  5. Santos, C.A.G.; Freire, P.K.M.M. Analysis of precipitation time series of urban centers of northeastern Brazil using wavelet transform. Int. J. Environ. ChemEcolGeol Geophys. Eng. 2012, 6, 845–850. [Google Scholar] [CrossRef]
  6. National Drought Mitigation Center. Available online: http://drought.unl.edu (accessed on 1 November 2019).
  7. Zhao, Q.; Chen, Q.; Jiao, M.; Wu, P.; Gao, X.; Ma, M.; Hong, Y. The temporal-spatial characteristics of drought in the Loess Plateau using the remote-sensed TRMM precipitation data from 1998 to 2014. Remote Sens. 2018, 10, 838. [Google Scholar] [CrossRef] [Green Version]
  8. Ionita, M.; Scholz, P.; Chelcea, S. Assessment of droughts in Romania using the Standardized Precipitation Index. Nat. Hazards 2016, 81, 1483–1498. [Google Scholar] [CrossRef] [Green Version]
  9. Merino, A.; López, L.; Hermida, L.; Sánchez, J.L.; García-Ortega, E.; Gascón, E.; Fernández-González, S. Identification of drought phases in a 110-year record from Western Mediterranean basin: Trends, anomalies and periodicity analysis for Iberian Peninsula. Glob. Planet. Chang. 2015, 133, 96–108. [Google Scholar] [CrossRef]
  10. Adnan, S.; Ullah, K.; Shuanglin, L.; Gao, S.; Khan, A.H.; Mahmood, R. Comparison of various drought indices to monitor drought status in Pakistan. Clim. Dyn. 2017, 51, 1885–1899. [Google Scholar] [CrossRef]
  11. Morid, S.; Smakhtin, V.; Moghaddasi, M. Comparison of seven meteorological indices for drought monitoring in Iran. Int. J. Clim. 2006, 26, 971–985. [Google Scholar] [CrossRef]
  12. McKee, T.B.; Doesken, N.J.; Kleist, J. The Relationship of Drought Frequency and Duration to Time Scales. In Proceedings of the Eighth Conference on Applied Climatology, Anaheim, CA, USA, 17–22 January 1993; pp. 179–184. [Google Scholar]
  13. Heim, R.R. A review of twentieth-century drought indices used in the United States. Bull. Am. Meteorol. Soc. 2002, 83, 1149–1165. [Google Scholar] [CrossRef] [Green Version]
  14. Rahmat, S.N.; Jayasuriya, N.; Bhuiyan, M. Assessing droughts using meteorological drought indices in Victoria, Australia. Hydrol. Res. 2015, 46, 463–476. [Google Scholar] [CrossRef]
  15. Timimi, Y.K.; Osamah, O.A. Comparative study of four meteorological drought indices in Iraq. J. Appl. Phys. 2016, 8, 76–84. [Google Scholar] [CrossRef]
  16. Haied, N.; Foufou, A.; Chaab, S.; Azlaoui, M.; Khadri, S.; Benzahia, K.; Benzahia, I. Drought assessment and monitoring using meteorological indices in a semi-arid region. Energy Procedia 2017, 119, 518–529. [Google Scholar] [CrossRef]
  17. Wable, P.S.; Jha, M.K.; Shekhar, A. Comparison of Drought Indices in a Semi-Arid River Basin of India. Water Resour. Manag. 2018, 33, 75–102. [Google Scholar] [CrossRef]
  18. Li, F.; Li, H.; Lu, W.; Zhang, G.; Kim, J.-C. Meteorological drought monitoring in Northeastern China using multiple indices. Water 2019, 11, 72. [Google Scholar] [CrossRef] [Green Version]
  19. Pereira, G.; Silva, M.E.S.; Moraes, E.C.; Cardozo, F.S. Avaliação dos Dados de Precipitação Estimados pelo Satélite TRMM para o Brasil. Rev. Bras. Recur. Hídricos 2013, 18, 139–148. [Google Scholar] [CrossRef]
  20. Curtarelli, M.P.; Renno, C.D.; Alcantara, E.H. Evaluation of the Tropical Rainfall Measuring Mission 3B43 product over an inland area in Brazil and the effects of satellite boost on rainfall estimates. J. Appl. Remote Sens. 2014, 8, 1–14. [Google Scholar] [CrossRef] [Green Version]
  21. Rao, V.B.; Franchito, S.H.; Santo, C.M.E.; Gan, M.A. An update on the rainfall characteristics of Brazil: Seasonal variations and trends in 1979–2011. Int. J. Clim. 2015, 36, 291–302. [Google Scholar] [CrossRef]
  22. Sorooshian, S.; Hsu, K.L.; Gao, X.; Gupta, H.V.; Imam, B.; Dan, B. Evaluation of PERSIANN system satellite–based estimates of tropical rainfall. Bull. Am. Meteorol. Soc. 2000, 81, 2035–2046. [Google Scholar] [CrossRef] [Green Version]
  23. Joyce, R.J.; Janowiak, J.E.; Arkin, P.A.; Xie, P. CMORPH: A method that produces global precipitation estimates from passive microwave and infrared data at high spatial and temporal resolution. J. Hydrometeorol. 2004, 5, 487–503. [Google Scholar] [CrossRef]
  24. Huffman, G.J.; Bolvin, D.T.; Nelkin, E.J.; Wolff, D.B.; Adler, R.F.; Gu, G.; Stocker, E.F. The TRMM multisatellite precipitation analysis (TMPA): Quasi-global, multiyear, combined-sensor precipitation estimates at fine scales. J. Hydrometeorol. 2007, 8, 38–55. [Google Scholar] [CrossRef]
  25. Kubota, T.; Shige, S.; Hashizume, H.; Aonashi, K.; Takahashi, N.; Seto, S.; Kachi, M. Global precipitation map using satellite-borne microwave radiometers by the GSMaP project: Production and validation. IEEE Trans. Geosci. Remote Sens. 2007, 45, 2259–2275. [Google Scholar] [CrossRef]
  26. Hou, A.Y.; Kakar, R.K.; Neeck, S.; Azarbarzin, A.A.; Kummerow, C.D.; Kojima, M.; Iguchi, T. The global precipitation measurement mission. Bull. Am. Meteorol. Soc. 2014, 95, 701–722. [Google Scholar] [CrossRef]
  27. Funk, C.; Peterson, P.; Landsfeld, M.; Pedreros, D.; Verdin, J.; Shukla, S.; Michaelsen, J. The climate hazards infrared precipitation with stations—A new environmental record for monitoring extremes. Sci. Data 2015, 2, 150066. [Google Scholar] [CrossRef] [Green Version]
  28. Kummerow, C.; Barnes, W.; Kozu, T.; Shiue, J.; Simpson, J. The Tropical Rainfall Measuring Mission (TRMM) sensor package. J. Atmos. Ocean. Technol. 1998, 15, 809–816. [Google Scholar] [CrossRef]
  29. Collischonn, B.; Collischonn, W.; Tucci, C.E.M. Daily hydrological modeling in the Amazon basin using TRMM rainfall estimates. J. Hydrol. 2008, 360, 207–216. [Google Scholar] [CrossRef]
  30. Soares, A.S.D.; Da Paz, A.R.; Piccilli, D.G.A. Avaliação das estimativas de chuva do satélite TRMM no Estado da Paraíba. Rev. Bras. Recur. Hídricos 2016, 21, 288–299. [Google Scholar] [CrossRef]
  31. Rozante, J.R.; Vila, D.A.; Chiquetto, J.B.; Fernandes, A.A.; Alvim, D.S. Evaluation of TRMM/GPM Blended Daily Products over Brazil. Remote Sens. 2018, 10, 882. [Google Scholar] [CrossRef] [Green Version]
  32. Xu, F.; Guo, B.; Ye, B.; Ye, Q.; Chen, H.; Ju, X.; Guo, J.; Wang, Z. Systematical Evaluation of GPM IMERG and TRMM 3B42V7 Precipitation Products in the Huang-Huai-Hai Plain, China. Remote Sens. 2019, 11, 697. [Google Scholar] [CrossRef] [Green Version]
  33. Le, M.H.; Lakshmi, V.; Bolten, J.; Bui, D.D. Adequacy of Satellite-derived Precipitation Estimate for Hydrological Modeling in Vietnam Basins. J. Hydrol. 2020, 586, 124820. [Google Scholar] [CrossRef]
  34. Peng, F.; Zhao, S.; Chen, C.; Cong, D.; Wang, Y.; Ouyang, H. Evaluation and comparison of the precipitation detection ability of multiple satellite products in a typical agriculture area of China. Atmos. Res. 2020, 236, 104814. [Google Scholar] [CrossRef]
  35. Naumann, G.; Barbosa, P.; Carrao, H.; Singleton, A.; Vogt, J. Monitoring drought conditions and their uncertainties in Africa using TRMM data. J. Appl. Meteorol. Clim. 2012, 51, 1867–1874. [Google Scholar] [CrossRef] [Green Version]
  36. Li, X.; Zhang, Q.; Ye, X. Dry/wet conditions monitoring based on TRMM rainfall data and its reliability validation over Poyang Lake basin, China. Water 2013, 5, 1848–1864. [Google Scholar] [CrossRef]
  37. Sahoo, A.K.; Sheffield, J.; Pan, M.; Wood, E.F. Evaluation of the Tropical Rainfall Measuring Mission Multi-Satellite Precipitation Analysis (TMPA) for assessment of large-scale meteorological drought. Remote Sens. Environ. 2015, 159, 181–193. [Google Scholar] [CrossRef]
  38. Jesús, A.; Breña-Naranjo, J.A.; Pedrozo-Acuña, A.; Yamanaka, V.H.A. The Use of TRMM 3B42 Product for Drought Monitoring in Mexico. Water 2016, 8, 325. [Google Scholar] [CrossRef]
  39. Tao, H.; Fischer, T.; Zeng, Y.; Fraedrich, K. Evaluation of TRMM 3B43 precipitation data for drought monitoring in Jiangsu Province, China. Water 2016, 8, 221. [Google Scholar] [CrossRef] [Green Version]
  40. Jiang, S.; Ren, L.; Zhou, M.; Young, B.; Zhang, Y.; Ma, M. Drought monitoring and reliability evaluation of the latest TMPA precipitation data in the Weihe River Basin, Northwest China. J. Arid Land 2017, 9, 256–269. [Google Scholar] [CrossRef] [Green Version]
  41. Tan, M.L.; Tan, K.C.; Chua, V.P.; Chan, N.W. Evaluation of TRMM product for monitoring drought in the Kelantan River Basin, Malaysia. Water 2017, 9, 57. [Google Scholar] [CrossRef] [Green Version]
  42. Zambrano, F.; Wardlow, B.; Tadesse, T.; Lilo-Saavedra, M.; Lagos, O. Evaluating satellite-derived long-term historical precipitation datasets for drought monitoring in Chile. Atmos. Res. 2017, 186, 26–42. [Google Scholar] [CrossRef]
  43. Zhong, R.; Chen, X.; Lai, C.; Wang, Z.; Lian, Y.; Yu, H.; Wu, X. Drought monitoring utility of satellite-based precipitation products across mainland China. J. Hydrol. 2019, 568, 343–359. [Google Scholar] [CrossRef]
  44. Suliman, A.H.A.; Awchi, T.A.; Al-Mola, M. Evaluation of remotely sensed precipitation sources for drought assessment in Semi-Arid Iraq. Atmos. Res. 2020, 242, 105007. [Google Scholar] [CrossRef]
  45. IPCC. Central and South America. In Climate Change 2014: Impacts, Adaptation, and Vulnerability. Part B: Regional Aspects; Contribution of Working Group II to the Fifth Assessment Report of the Intergovernmental Panel on Climate Change; Field, C.B., Barros, V.R., Dokken, D.J., Mach, K.J., Mastrandrea, M.D., Bilir, T.E., Chatterjee, M., Ebi, K.L., Estrada, Y.O., Genova, R.C., et al., Eds.; Cambridge University Press: Cambridge, UK; New York, NY, USA, 2014; pp. 1499–1566. [Google Scholar]
  46. Marengo, J.A.; Torres, R.R.; Alves, L.M. Drought in Northeast Brazil–past, present, and future. Appl. Clim. 2017, 129, 1189–1200. [Google Scholar] [CrossRef]
  47. Santos, C.A.G.; Brasil Neto, R.M.; Silva, R.M.; Costa, S.G.F. Cluster analysis applied to spatiotemporal variability of monthly precipitation over Paraíba state using Tropical Rainfall Measuring Mission (TRMM) data. Remote Sens. 2019, 11, 637. [Google Scholar] [CrossRef] [Green Version]
  48. IBGE, Instituto Brasileiro de Geografia e Estatística. Divisão Regional do Brasil em Mesorregiões e Microrregiões Geográficas Territorial Brasileira. 2016. Available online: http://biblioteca.ibge.gov.br/visualizacao/livros/liv2269_1.pdf (accessed on 15 November 2019).
  49. Alvares, C.A.; Stape, J.L.; Sentelhas, P.C.; Gonçalves, J.L.M.; Sparovek, G. Köppen’s climate classification map for Brazil. Meteorol. Z. 2014, 22, 711–728. [Google Scholar] [CrossRef]
  50. Santos, C.A.G.; Brasil Neto, R.M.; Passos, J.S.A.; Silva, R.M. Drought assessment using a TRMM-derived standardized precipitation index for the upper São Francisco River basin, Brazil. Environ. Monit. Assess. 2017, 189, 250–270. [Google Scholar] [CrossRef] [PubMed]
  51. Fensterseifer, C.; Allasia, D.G.; Paz, A.R. Assessment of the TRMM 3B42 Precipitation Product in Southern Brazil. J. Am. Water Res. Assoc. 2016, 52, 367–375. [Google Scholar] [CrossRef]
  52. Lelis, L.C.S.; Bosquilia, R.W.D.; Duarte, S.N. Avaliação dos dados de precipitação gerados pelos satélites GPM e TRMM. Rev. Bras. Meteorol. 2018, 33, 153–163. [Google Scholar] [CrossRef] [Green Version]
  53. Satgé, F.; Ruelland, D.; Bonnet, M.-P.; Molina, J.; Pillco, R. Consistency of satellite-based precipitation products in space and over time compared with gauge observations and snow- hydrological modelling in the Lake Titicaca region. Hydrol. Earth Syst. Sci. 2019, 23, 595–619. [Google Scholar] [CrossRef] [Green Version]
  54. Ren, M.; Xu, Z.; Pang, B.; Liu, W.; Liu, J.; Du, L.; Wang, R. Assessment of Satellite-Derived Precipitation Products for the Beijing Region. Remote Sens. 2018, 10, 1914. [Google Scholar] [CrossRef] [Green Version]
  55. Cao, Y.; Zhang, W.; Wang, W. Evaluation of TRMM 3B43 data over the Yangtze River Delta of China. Sci. Rep. 2018, 8, 5290–5301. [Google Scholar] [CrossRef] [PubMed] [Green Version]
  56. Cruz, M.A.S.; Rocha, L.T.; Aragão, R.; Almeida, A.Q. Aplicabilidade da precipitação TRMM para modelagem hidrológica em uma bacia no Agreste Paraibano do Nordeste Brasileiro. Rev. Bras. Meteorol. 2018, 33, 57–64. [Google Scholar] [CrossRef] [Green Version]
  57. Almeida, C.T.; Delgado, R.C.; Oliveira-Júnior, J.F.; Gois, G.; Cavalcanti, A.S. Avaliação das Estimativas de Precipitação do Produto 3B43-TRMM do Estado do Amazonas. Floresta E Ambiente 2015, 22, 279–286. [Google Scholar] [CrossRef]
  58. Barbosa, L.R.; Freitas, E.S.; Almeida, C.N.; Melo, D.C.D. Rainfall in an experimental watershed: A comparison between observed and TRMM 3B42V7 dataset. Int. Arch. Photogramm. Remote Sens. Spat. Inf. Sci. ISPRS Arch. 2015, 40, 1447–1452. [Google Scholar] [CrossRef] [Green Version]
  59. Michot, V.; Vila, D.; Arvor, D.; Corpetti, T.; Ronchail, J.; Funatsu, B.M.; Dubreuil, V. Performance of TRMM TMPA 3B42 V7 in replicating daily rainfall and regional rainfall regimes in the Amazon basin (1998–2013). Remote Sens. 2018, 10, 1879. [Google Scholar] [CrossRef] [Green Version]
  60. Nogueira, S.M.C.; Moreira, M.A.; Volpato, M.M.L. Evaluating precipitation estimates from Eta, TRMM and CHRIPS data in the south-southeast region of Minas Gerais state-Brazil. Remote Sens. 2018, 10, 313. [Google Scholar] [CrossRef] [Green Version]
  61. Wei, G.; Lu, H.; Crow, W.T.; Zhu, Y.; Wang, J.; Su, J. Comprehensive Evaluation of GPM-IMERG, CMORPH, and TMPA Precipitation Products with Gauged Rainfall over Mainland China. Adv. Meteorol. 2018, 2018, 3024190. [Google Scholar] [CrossRef] [Green Version]
  62. Chen, C.; Chen, Q.; Duan, Z.; Zhang, J.; Mo, K.; Li, Z.; Tang, G. Multiscale Comparative Evaluation of the GPM IMERG v5 and TRMM 3B42 v7 Precipitation Products from 2015 to 2017 over a Climate Transition Area of China. Remote Sens. 2018, 10, 944. [Google Scholar] [CrossRef] [Green Version]
  63. Kendall, M.G.; Smith, B.B. The Problem of m Rankings. Ann. Math. Stat. 1939, 10, 275–287. [Google Scholar] [CrossRef]
  64. Cohen, J. A coefficient of agreement for nominal scales. Educ. Psychol. Meas. 1960, 20, 37–46. [Google Scholar] [CrossRef]
  65. WMO, World Meteorological Organization. Guide to Hydrological Practices: Data Acquisition and Processing, Analysis, Forecasting and Other Applications; WMO: Geneva, Switzerland, 1994. [Google Scholar]
  66. Roebber, P.J. Visualizing Multiple Measures of Forecast Quality. Weather Forecast. 2009, 24, 601–608. [Google Scholar] [CrossRef] [Green Version]
  67. Melo, D.C.D.; Xavier, A.C.; Bianchi, T.; Oliveira, P.T.S.; Scanlon, B.R.; Lucas, M.C.; Wendland, E. Performance evaluation of rainfall estimates by TRMM Multi-satellite Precipitation Analysis 3B42V6 and V7 over Brazil. J. Geophys. Res. Atmos. 2015, 120, 9426–9436. [Google Scholar] [CrossRef] [Green Version]
  68. Macedo, M.J.H.; Guedes, R.V.S.; Souza, F.A.S.; Dantas, F.R.C. Analysis of the standardized precipitation index for the Paraíba state, Brazil. Ambiente Água 2010, 5, 204–214. [Google Scholar] [CrossRef]
Figure 1. Location of Paraíba State with mesoregions in northeastern Brazil.
Remotesensing 12 02184 g001
Figure 2. Tropical Rainfall Measuring Mission (TRMM) cell grid and spatial distribution of the rain gauges used over the study area.
Remotesensing 12 02184 g002
Figure 3. Contingency table applied to assess the performance indices (PC, POD, FAR and CSI) based on the two-dimensional kernel density estimate plot.
Remotesensing 12 02184 g003
Figure 4. (a) Spatial distribution of the missing data percentages in the rainfall time series; (b) percentage distribution of the missing data for each mesoregion; and (c) temporal evolution of the percentage of data available over the 20 years.
Remotesensing 12 02184 g004
Figure 5. Spatial distribution of the R, Kd and Kp indices over Paraíba State.
Remotesensing 12 02184 g005
Figure 6. Spatial distributions of the B, RB, MSE and RMSE indices in Paraíba State.
Remotesensing 12 02184 g006
Figure 7. Spatial distribution of the PC, POD, (1 − FAR) and CSI indices in Paraíba State.
Remotesensing 12 02184 g007
Figure 8. Statistical accuracy analysis of the indices R and RMSE (group 1), Kd and Kp (group 2) and PC (group 3) for each of the mesoregions in Paraíba State (1998–2017).
Remotesensing 12 02184 g008
Figure 9. Roebber performance diagram for the Paraíba mesoregions.
Remotesensing 12 02184 g009
Table 1. Details of the evaluation metrics.
GroupMetricEquationRangeBest Value
1R1[−1, 1]1
B2[−∞,∞]0
RB3[−∞,∞]0
MSE4[0, ∞]0
RMSE5[0, ∞]0
2Kd6[0, 1]1
Kp8[−∞, 1]1
3PC9[0, 1]1
POD10[0, 1]1
FAR11[0, 1]0
CSI12[0, 1]1

