Technical Note

First Evidence of Peat Domes in the Congo Basin using LiDAR from a Fixed-Wing Drone

1
School of GeoSciences, University of Edinburgh, Edinburgh EH9 3FF, UK
2
School of Geography, University of Leeds, Leeds LS2 9JT, UK
3
Department of Geography, University College London, London WC1E 6BT, UK
4
École Normale Supérieure, Université Marien Ngouabi, Brazzaville 99324, Republic of the Congo
5
Faculté des Sciences et Techniques, Université Marien NGOUABI, Brazzaville 99324, Republic of the Congo
6
School of Geography and Sustainable Development, University of St Andrews, Scotland KY16 9AJ, UK
7
Department of Geography and Sustainable Development, University of St Andrews, St Andrews KY16 9AL, UK
8
School of Geography, Geology and the Environment, University of Leicester, Leicester LE1 7RH, UK
*
Author to whom correspondence should be addressed.
Remote Sens. 2020, 12(14), 2196; https://0-doi-org.brum.beds.ac.uk/10.3390/rs12142196
Submission received: 7 May 2020 / Revised: 23 June 2020 / Accepted: 6 July 2020 / Published: 9 July 2020

Abstract

:
The world’s most extensive tropical peatlands occur in the Cuvette Centrale depression in the Congo Basin, which stores 30.6 petagrams of carbon (95% CI, 6.3–46.8). Improving our understanding of the genesis, development and functioning of these under-studied peatlands requires knowledge of their topography and, in particular, whether the peat surface is domed, as this implies a rain-fed system. Here we use a laser altimeter mounted on an unmanned airborne vehicle (UAV) to measure peat surface elevation along two transects at the edges of a peatland, in the northern Republic of Congo, to centimetre accuracy and compare the results with an analysis of nearby satellite LiDAR data (ICESat and ICESat-2). The LiDAR elevations on both transects show an upward slope from the peatland edge, suggesting a surface elevation peak of around 1.8 m over ~20 km. While modest, this domed shape is consistent with the peatland being rainfed. In-situ peat depth measurements and our LiDAR results indicate that this peatland likely formed at least 10,000 years BP in a large shallow basin ~40 km wide and ~3 m deep.

Graphical Abstract

1. Introduction

Peatlands cover three percent of the Earth’s land surface but store one third of global soil carbon [1,2]. The carbon in these systems is vulnerable to release due to land use and climate change, especially in the tropics where they are often drained and used for the cultivation of oil palm and pulpwood plantations. Indeed, it is estimated that 2.5 petagrams of carbon stored in peat swamps in SE Asia were released to the atmosphere over the period 1990 to 2015 through peat oxidation driven by a combination of peatland vegetation clearance and drainage [3,4]. However, such large carbon losses have not occurred so far in other tropical regions [5,6].
While it was once thought that only southeast Asia has vast tracts of tropical peat, recent field measurements and analysis [5] have shown that the Cuvette Centrale depression in the central Congo Basin (Figure 1) also houses a large area of tropical peatland, recently estimated at 145,500 km2 (95% CI 131,900–156,400) [5]. In terms of carbon, the Cuvette Centrale peatlands store 30.6 Pg C (95% CI 6.3–46.8 Pg), suggesting that this region comprises a third of the tropical peatland carbon store [5]. Dated peat cores suggest that the peatlands formed when central Africa became wetter at the end of the last glaciation, with in situ peat depth measurements along transects from peatland edges towards their centres showing an increase in peat depth, suggesting that large-scale shallow interfluvial basins gradually filled with peat during the Holocene [5].
These early hypotheses of the development of the central Congo peatlands need more data to refine them. In order to model and predict the response of peatlands to environmental changes, we need to understand how they function, which in part is related to their size and shape. Furthermore, when combined with peat depth measurements, the topography of the underlying mineral layer can be deduced, providing further information about the system. Peat domes or "raised bogs" are found elsewhere in the tropics [5,7,8,9] typically indicating a rain-fed system, but investigations into the topography of the Cuvette Centrale using SRTM (Shuttle Radar Topography Mission) and ASTER (Advanced Spaceborne Thermal Emission and Reflection Radiometer) GDEM (Global Digital Elevation Model) did not reveal clear domes [5].
The attempt to map topography using SRTM and ASTER GDEM were limited in their precision and accuracy, but the failure to detect domes does not mean that domes do not exist; any elevation variation of ~3 m would be undetectable with these instruments [5]. The objective of the work reported herein was to quantify elevation variation across a large interfluvial peatland using (i) an unmanned aerial vehicle (UAV) fitted with LiDAR and (ii) satellite-based ranging LiDAR remote sensing instruments.

2. Materials and Methods
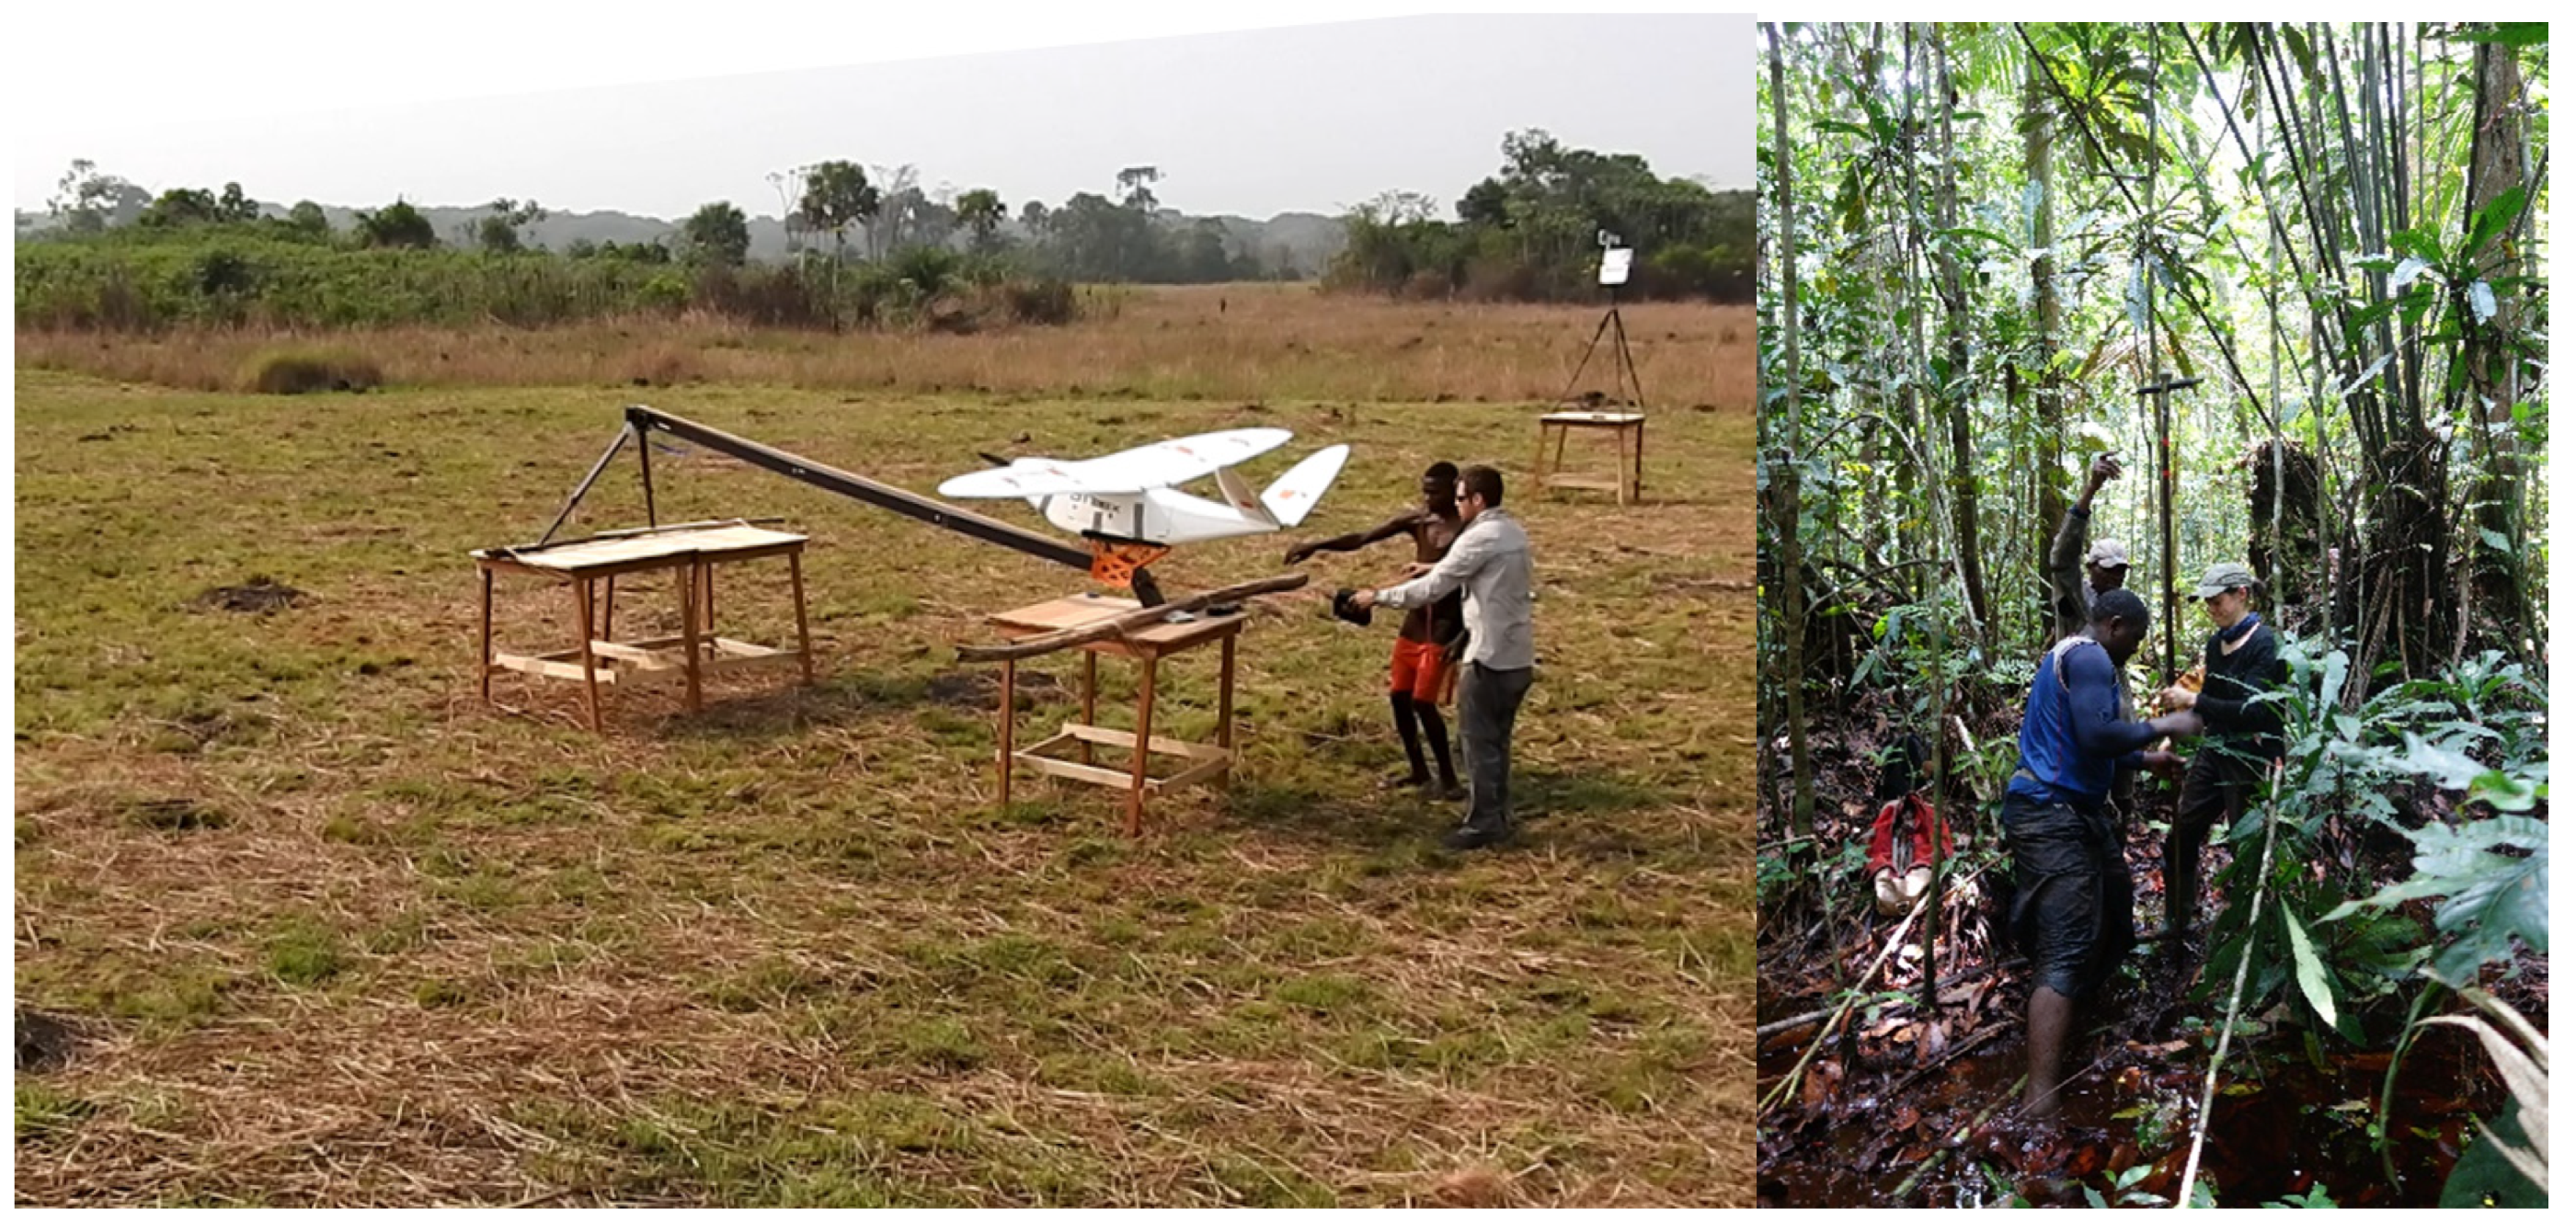
Figure 2 shows the forest area studied in this work. This region is covered by hardwood trees or palm-dominated areas of swamp further from the peatland edge [2] between the Likouala-aux-Herbes and Ubangi rivers, and has water above or close to the surface year-round [5], containing underlying peat as detailed below. The field site is in Likouala Department, Republic of Congo. Field and remotely-sensed data were combined to build up a picture of peatland topography along a path between Epena and Ekolongouma, as shown in Figure 2.

2.1. UAV LiDAR

A DelAir DT26x fixed-wing UAV equipped with a Riegl VUX-1UAV LiDAR scanner was deployed from two sites, namely on the west and east of the peatland. From Ekolongouma, on the east, (Figure 3) the UAV crossed the eastern edge of the forest at 17.901°E 1.204°N, flew at a 257° bearing for 7.1 km and returned. The furthest 2.2 km of the flight line had been previously ground-surveyed [5] and confirmed as peatland. On the west of the peatland, the UAV was launched from a site near Epena, crossed the edge of the forest at 17.479°E 1.330°N and flew 7.9 km at a bearing of 124°, covering a 5.8 km long profile from the western edge of the peatland before returning. The UAV operated at a nominal altitude of 240 m above ground, and the LiDAR operated at an angle up to 30 degrees off-nadir, creating in practice a swathe between 330 m and 350 m wide. Laser beam divergence was 0.5 mrad, generating a spot diameter at ground level of about 12 cm. Data was recorded on the outgoing and return legs of each flight, with trajectories differing only by a few meters. A differential GPS station was operated near the launch sites for a 24 hour period to establish an accurate position, and during each mission, to allow georeferencing of the LiDAR return elevations to centimetric accuracy. The regions over which data were gathered are shown in Figure 2.
While this is a labour-intensive approach requiring months of planning and weeks of effort to cover an area of a few square kilometres, accurate GNSS measurements of the peat surface are not feasible at this site because of the dense tree canopy, meaning there is no sufficiently-accurate field alternative. The 12-cm spot diameter and point density up to 35 m–2 provided by UAV LiDAR should allow ground measurements in most forests, and we are actively testing the system in Peru and Gabon. The main requirements are a clear site for launch and landing, and a line-of-sight from the antenna to the UAV, which is a function of the site geometry and can be calculated from antenna height, canopy height, distance from antenna to forest edge and flight altitude.
To estimate the ground topography along each acquisition, a straightened trajectory line was drawn between the entry point of the UAV to the peat area and the point where it turned for the return trip. Ground elevation for each 1 m segment of the line was estimated by finding the return with the lowest elevation amongst the returns between the segment and the edges of the swathe. This introduced an overall downward bias, as these points would have the largest downward error. The points acquired during the outward and return flights were processed separately, producing a pair of ground-level estimates for each 1 m segment. The mean difference and root mean square difference (RMSD) between these pairs was calculated to evaluate the measurements. The canopy top elevation was estimated from the local maximum return over 100 m.

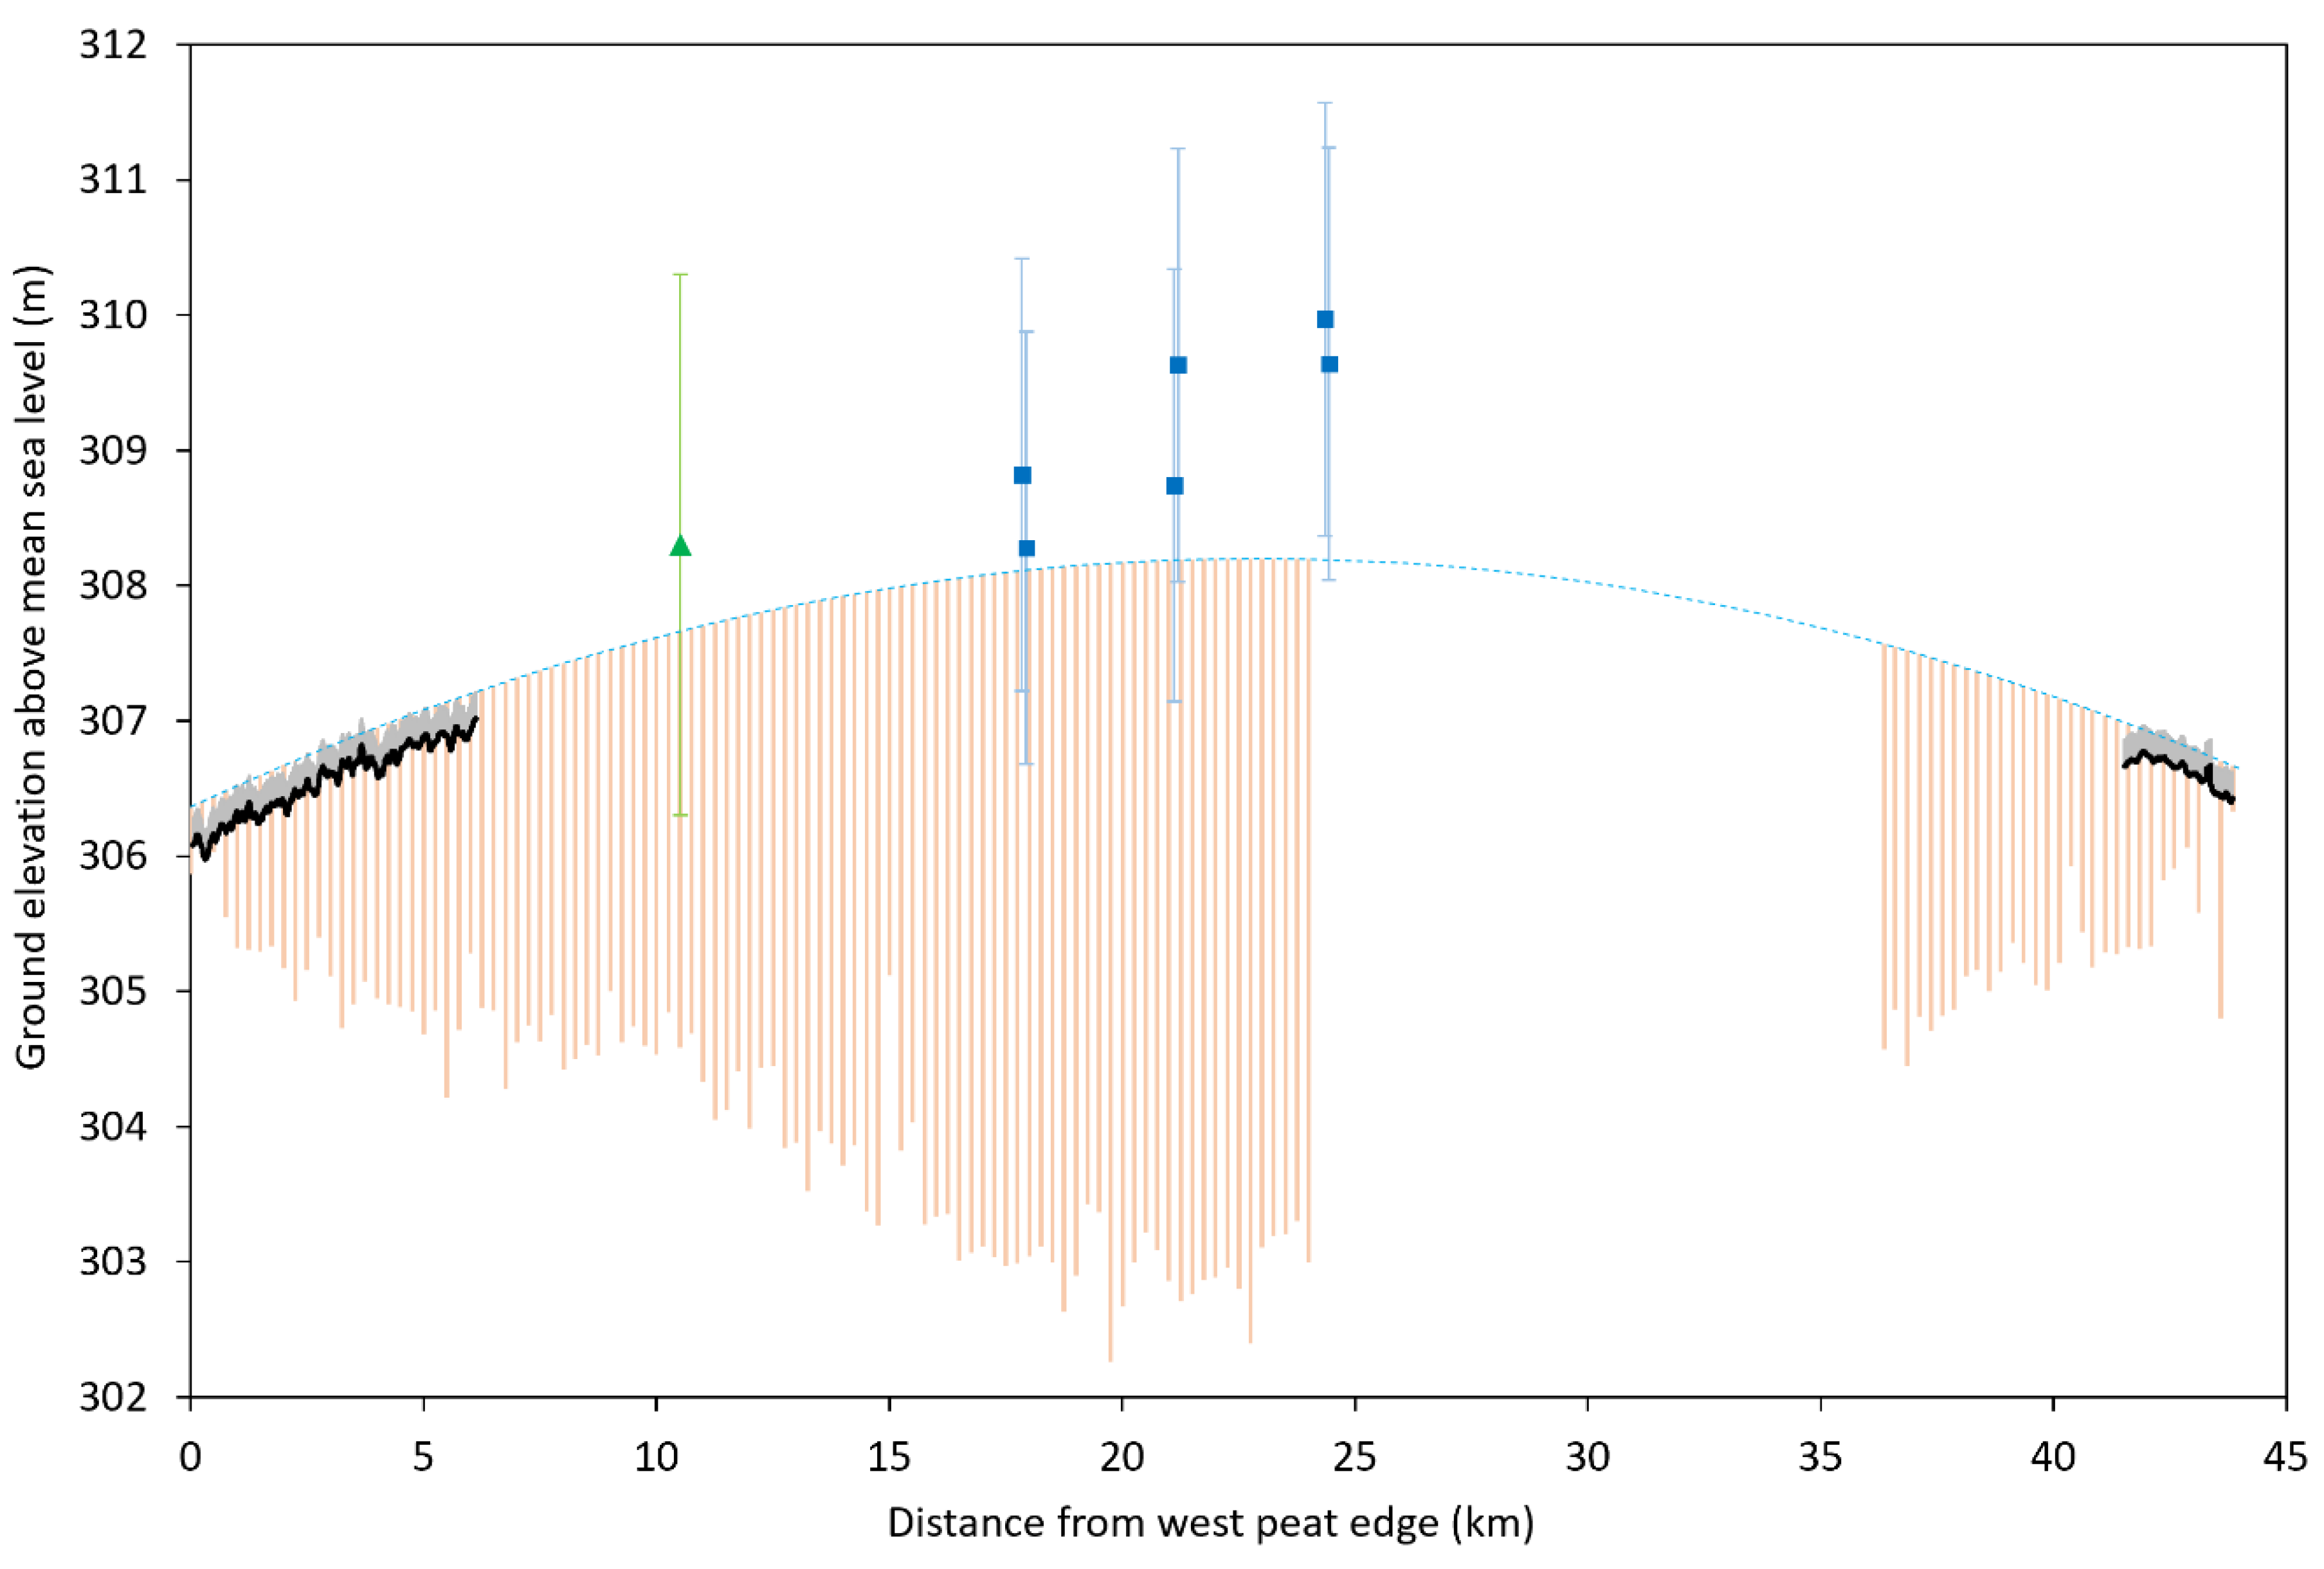
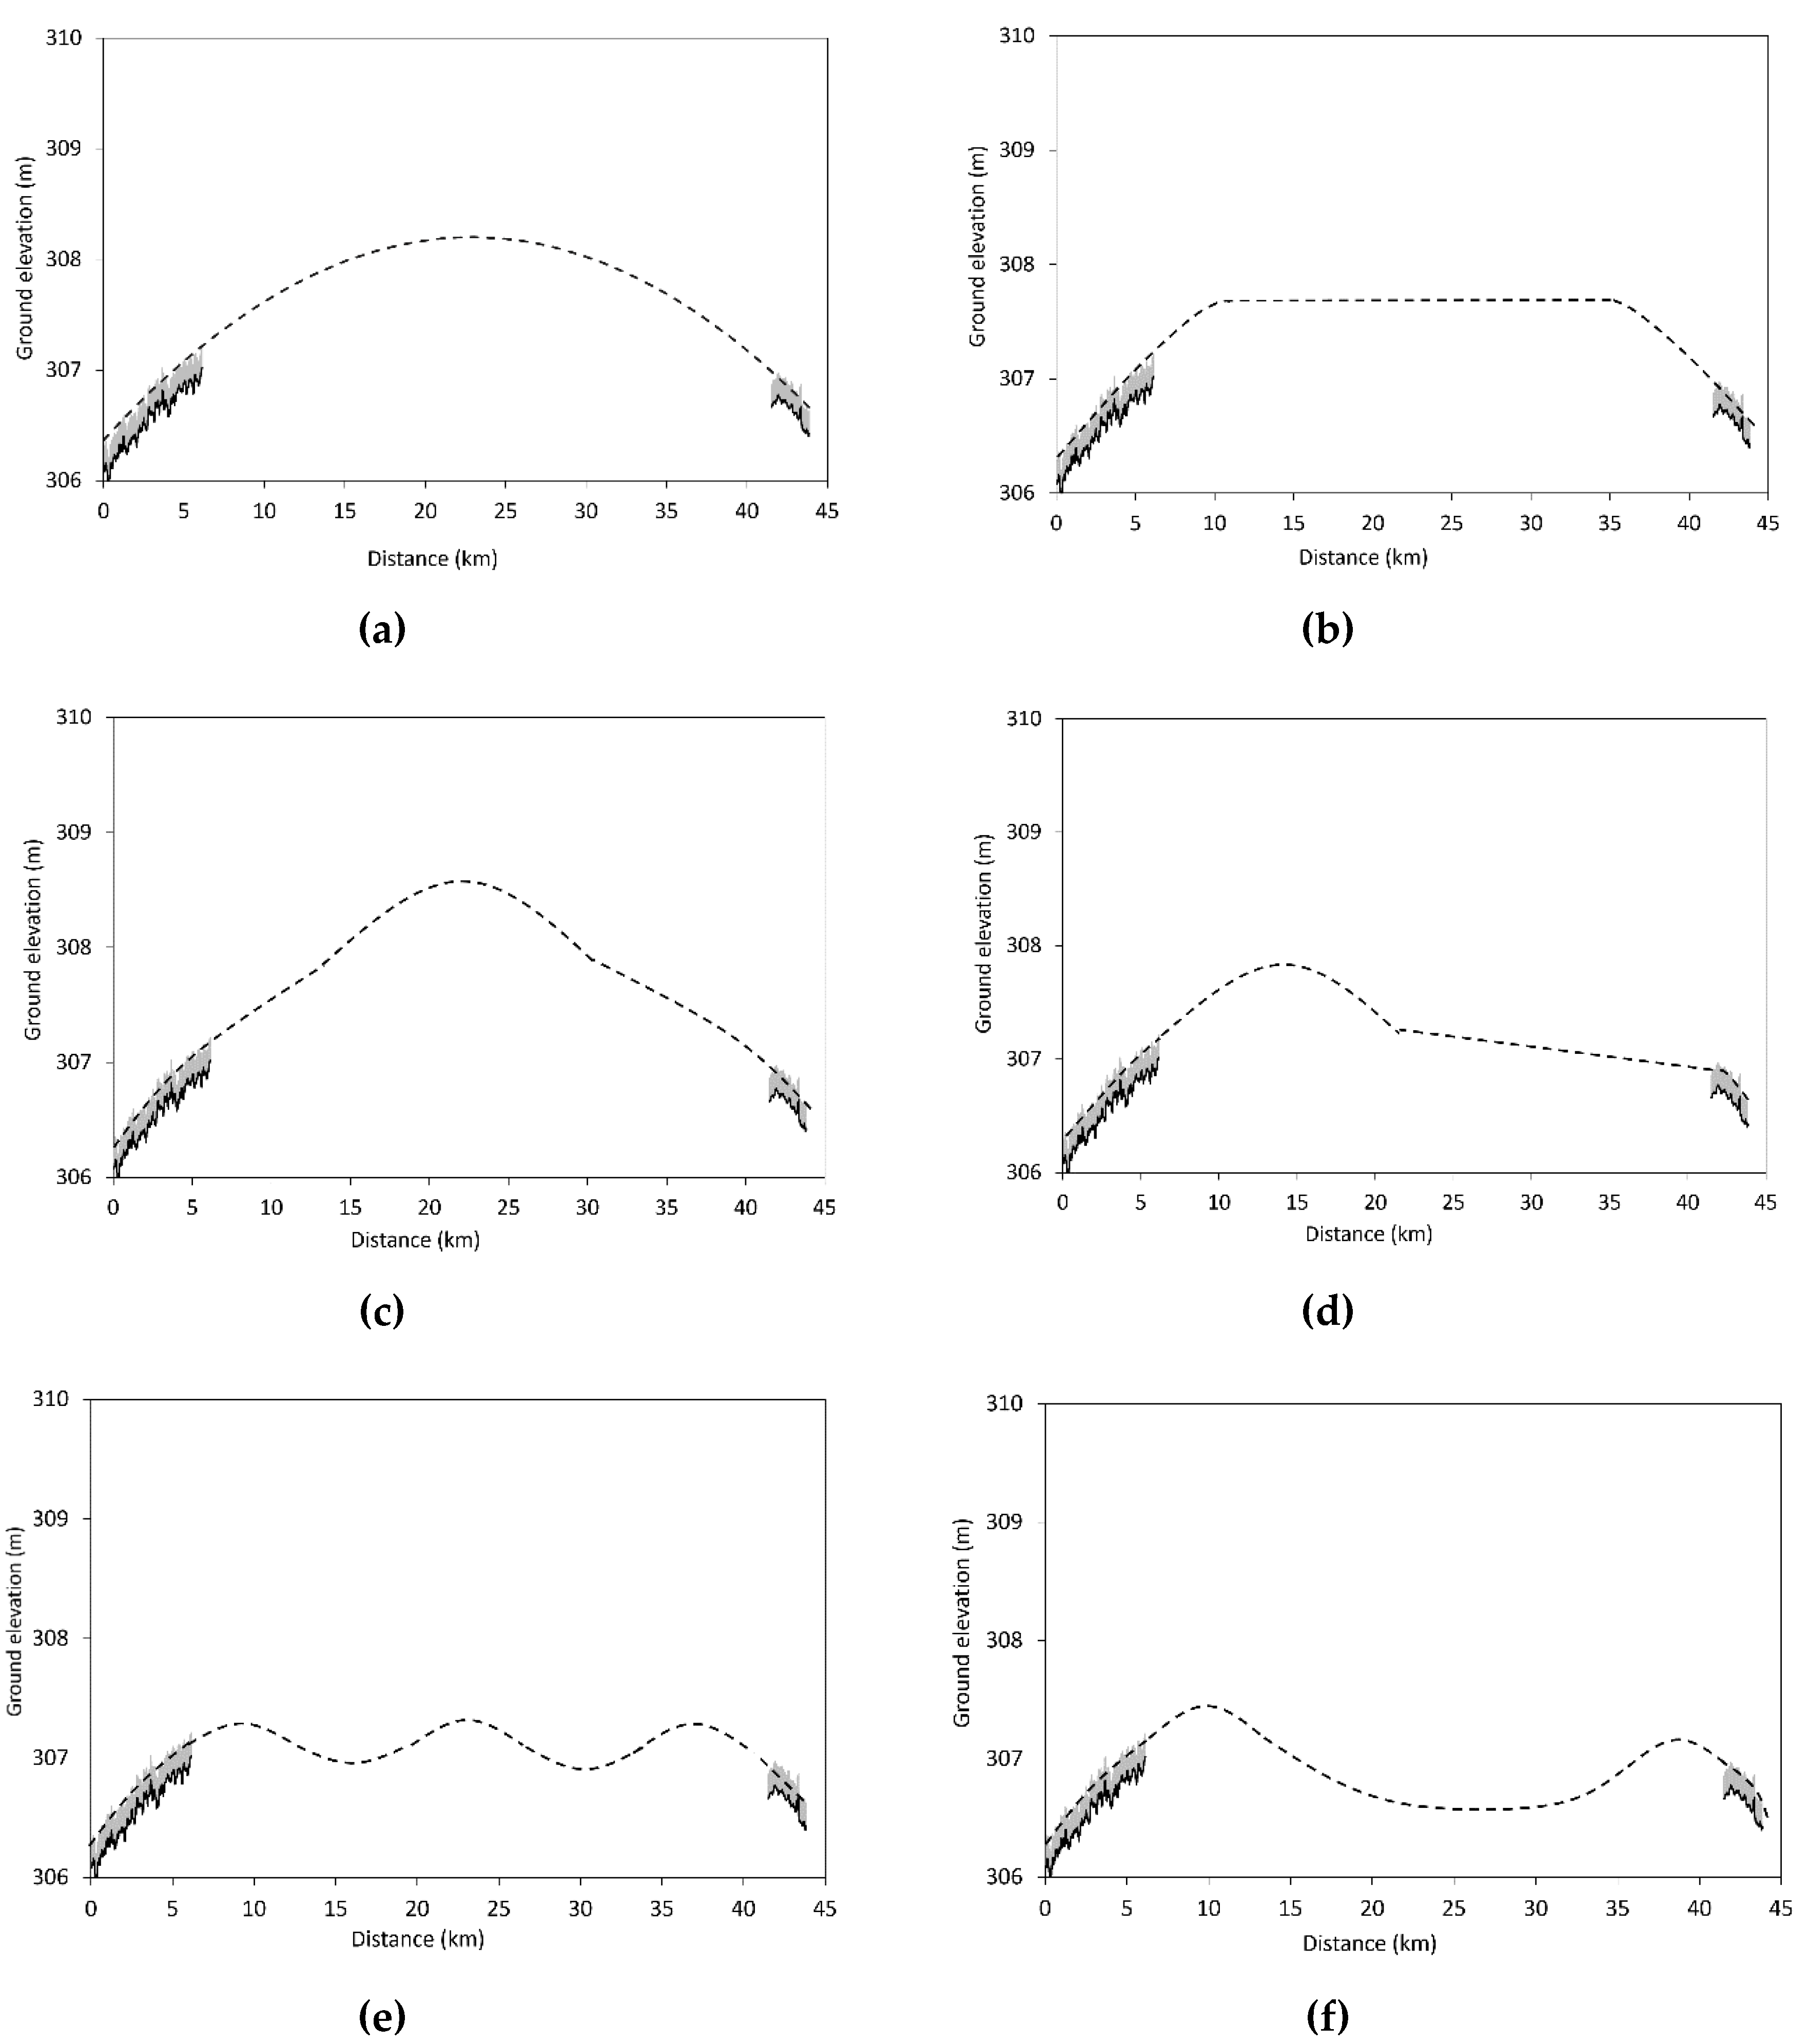
2.2. Peat Depth Field Measurements

Peat depth (where peat is defined as material consisting of at least 65% organic matter to a depth of at least 0.3 m) was estimated every 250 m along transects established during three field expeditions [5], starting on each side where savannah gives way to hardwood forest, using a pole pushed through the peat until it reached the subsurface clay. More precise measurements were made every km along the two edge transects and every 4 km along the central transect using loss on ignition in a laboratory to assess the organic matter content. The pole measurements were calibrated to the laboratory methods using 44 peat depth estimates derived from both the pole and laboratory methods [5]. One transect started from the Ubangi River side 3 km in from the forest edge at Ekolongouma village (17.87514°E, 1.19859°N) and proceeded on a 257° bearing for 9 km, finding peat from 4.5 km into the forest onwards. A second transect started from the Likouala-aux-Herbes River and reached 6 km on a 78° bearing from Itanga village (17.43449°E, 1.20250°N), finding peat consistently from about 1.25 km into the forest. A third continued this transect at a bearing of 102° in the direction of the Ekolongouma transect, also finding peat consistently from the beginning of the transect for 20 km.
To determine the topography of the subsurface on which the peat is developing, we needed measurements of ground elevation and peat depth at the same location. While the flight line in the east coincided with the eastern field peat measurement transect and so could be compared directly to LiDAR elevation estimates, the western transect from Itanga started some 12 km south of the aerial flight line and approached it at the centre of the peat (Figure 2). To compare the western field data with the aerial data, we needed to estimate where the peat began beneath the flight line. We used normalised difference vegetation index (NDVI) profiles along the field transect and flight-line derived from Sentinel-2 bands four and eight. Along the field transect from Itanga, the mean NDVI, averaged over 500 m, dropped nearly monotonically from 0.602 at the edge of the forest to 0.557 at a distance of 2.5 km into the forest. It dropped below 0.59 at the start of the continuous peat measurements, 1 km into the forest at longitude 17.452°E. Along the flight-line from Epena, NDVI dropped similarly, passing 0.59 at 17.493°E, about 1.3 km into the forest. We approximated, therefore, that the peat cover along the Epena line starts around 17.493°E. For a rough comparison between the datasets, the measurement corresponding to the western end of the peat transect was plotted at 17.493°E, the final point in the centre of the field remained unmoved, and all points between were proportionately shifted.

2.3. ICESat and ICESat-2

The Geoscience Laser Altimeter System (GLAS) instrument on the ICESat platform used a 1064 nm laser with a footprint about 65 m in diameter between 2003 and 2010, and light returns were processed to estimate the surface from the first significant return (the Level 1B product GLAH06 [10]) and terrain from the last return (the level 2 product GLAH14 [11,12]) elevations. The Advanced Topographic Laser Altimeter System (ATLAS) instrument on the ICESat-2 platform was launched in September 2018 and pulses a 552 nm laser at the Earth’s surface, illuminating a 17 m-diameter footprint. The ATL03 product [13], comprising latitude, longitude and elevation for each received photon, was used in this work.
No ICESat or ICESat-2 tracks crossed either of the UAV LiDAR transects; however, both instruments provided returns in the gap between the transects, and the returns around the line between the transects, drawn in white in Figure 2, were extracted. Two ICESat tracks crossed the line between the two transects, and the GLAH06 and GLAH14 elevation estimates were analysed. One ICESat-2 track crossed the line, and the ATL03 returns in the region around this line were analysed. Since these products had not previously been tested for ground/vegetation discrimination in these areas, the GLAH06, GLAH14 and ATL03 data were analysed by building local histograms of elevations, to try to identify the ground elevation in the context of the return distribution, and by comparison with the other data sources.

2.4. TanDEM-X

The Tandem-X 90 digital elevation model [14] is a 90 m DSM derived from the TanDEM-X X-band synthetic aperture radar (SAR) instrument via interferometry. The elevations corresponding to the path illustrated in Figure 2 were extracted from this dataset.

3. Results and Discussion
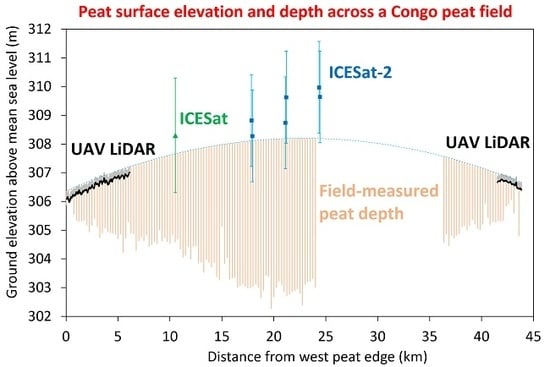
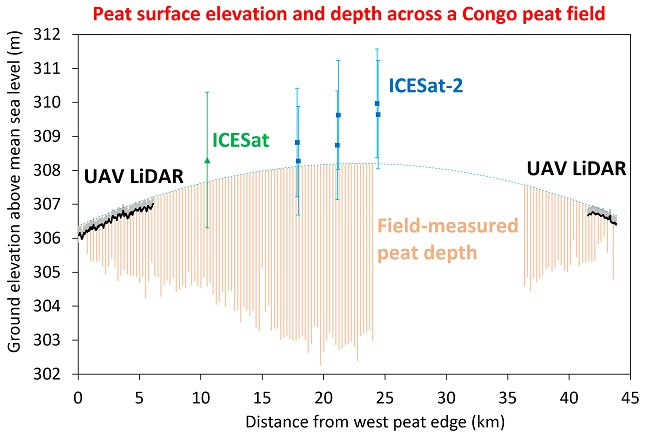
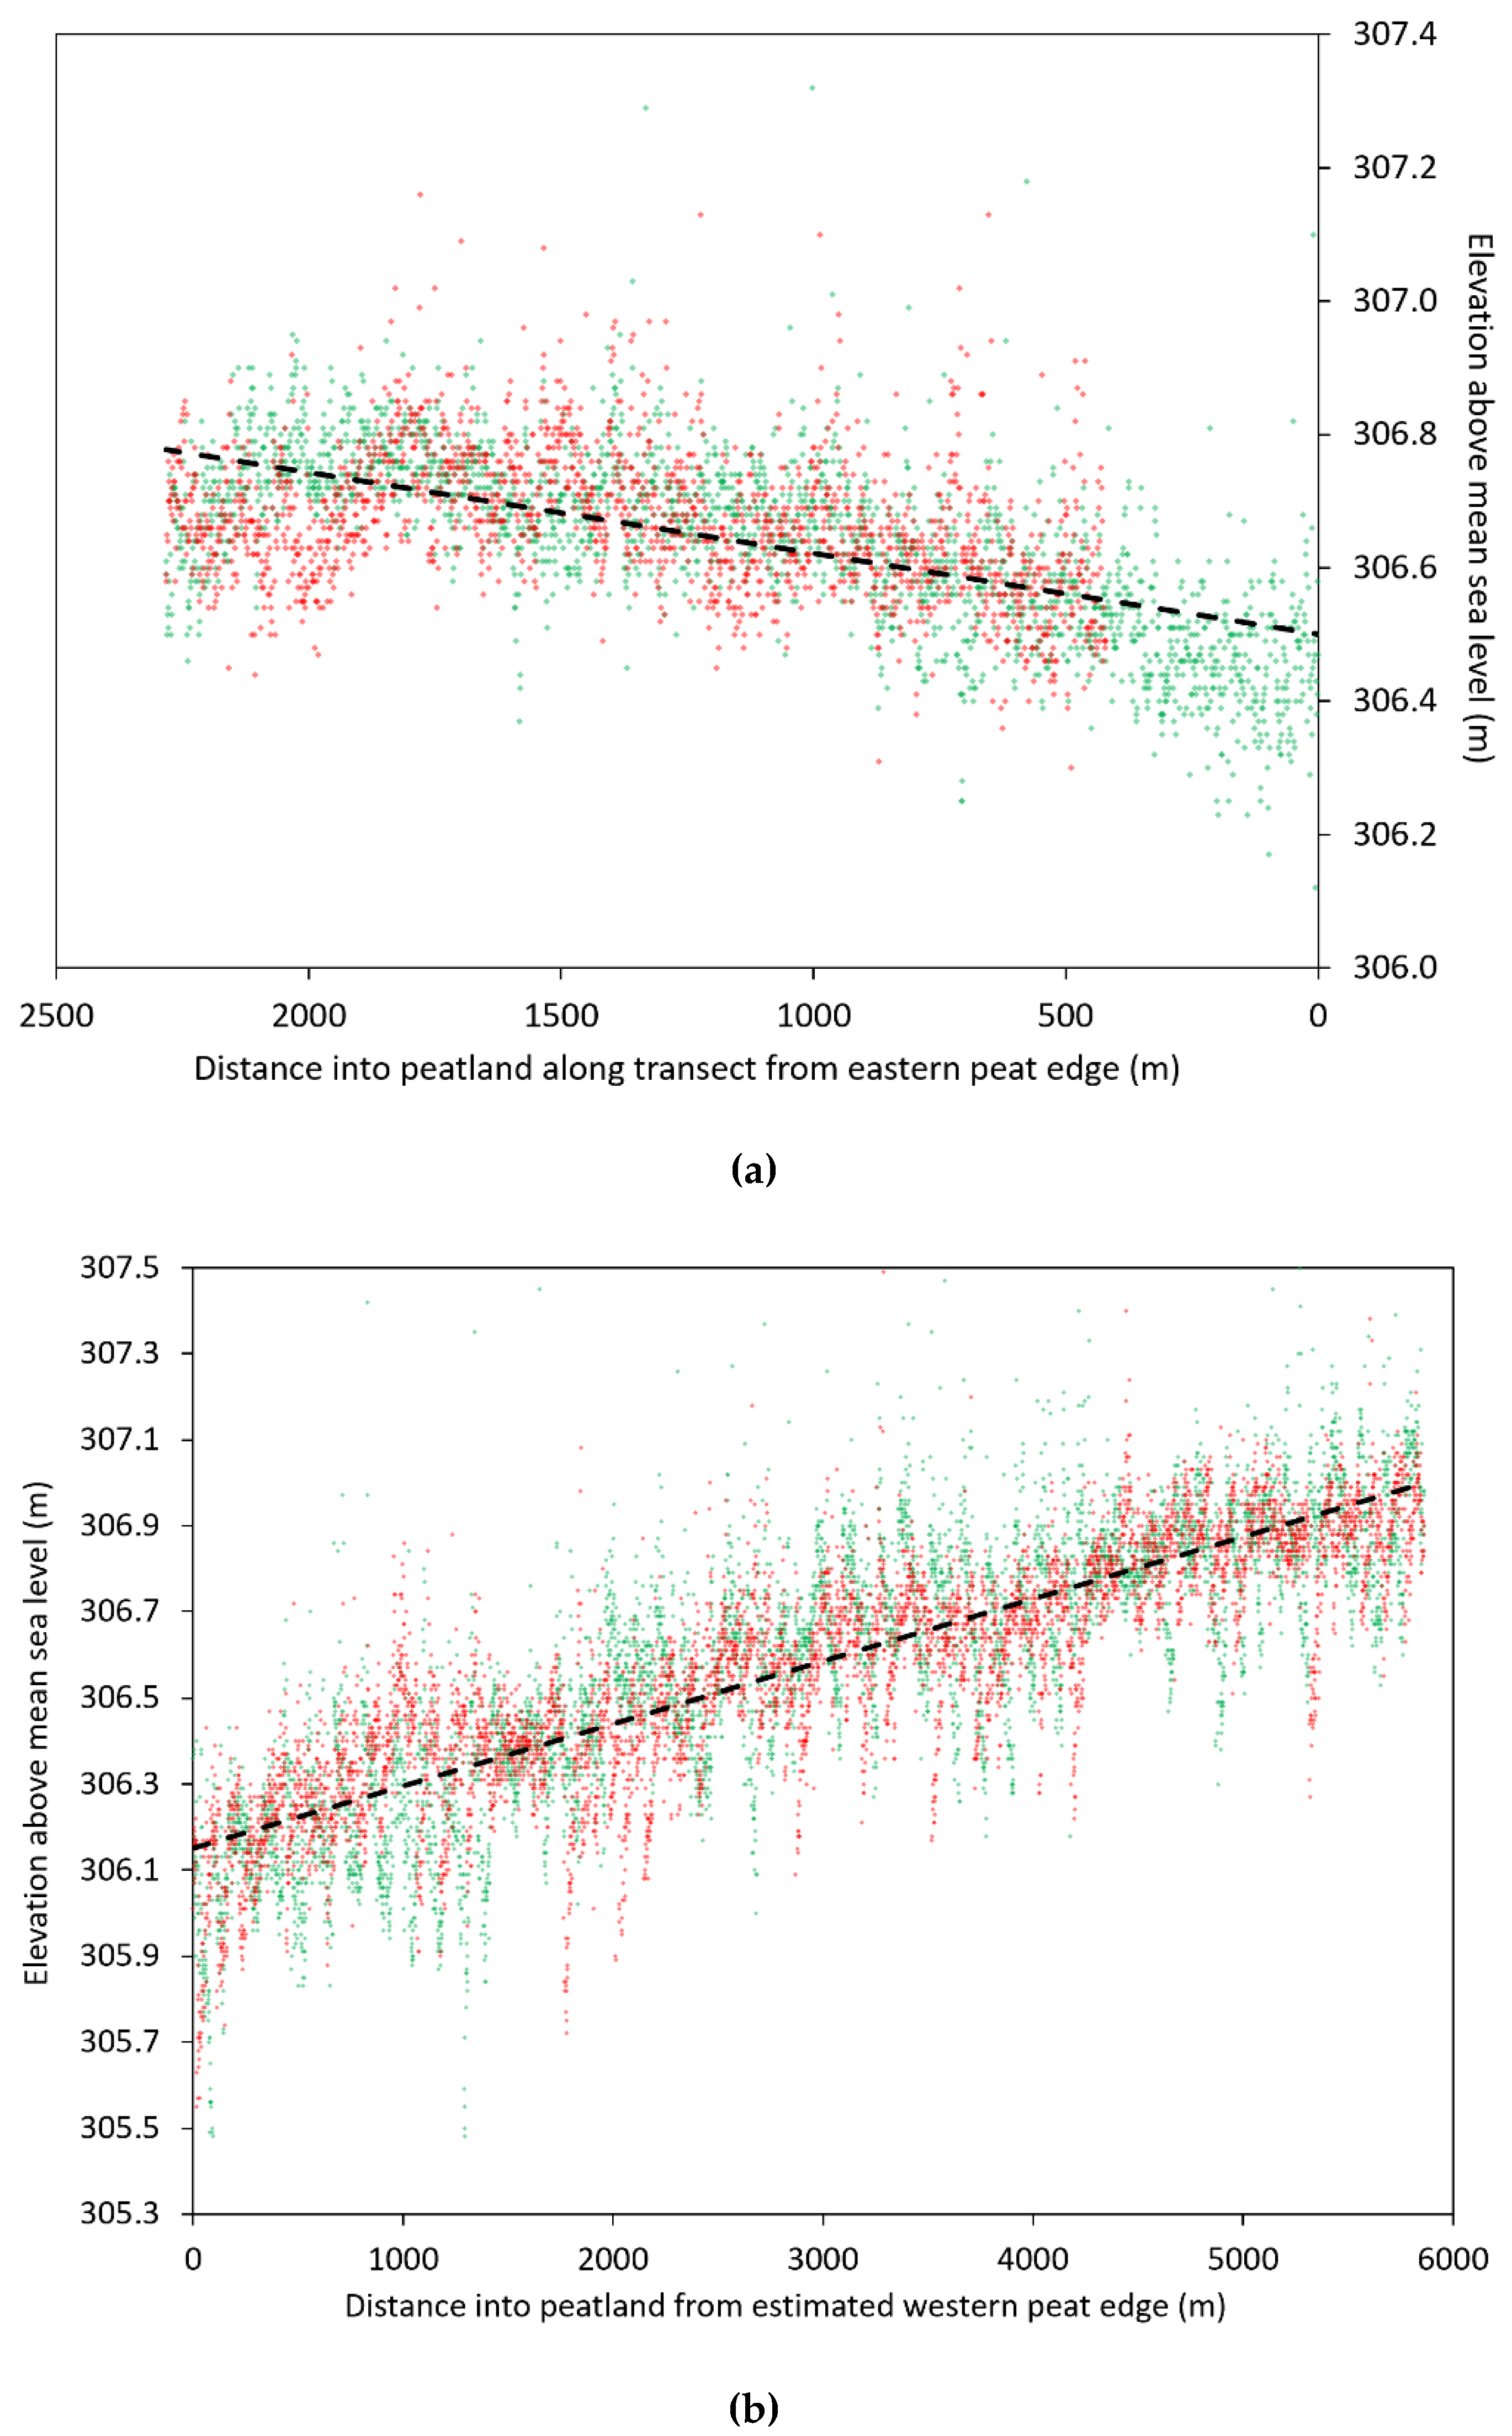
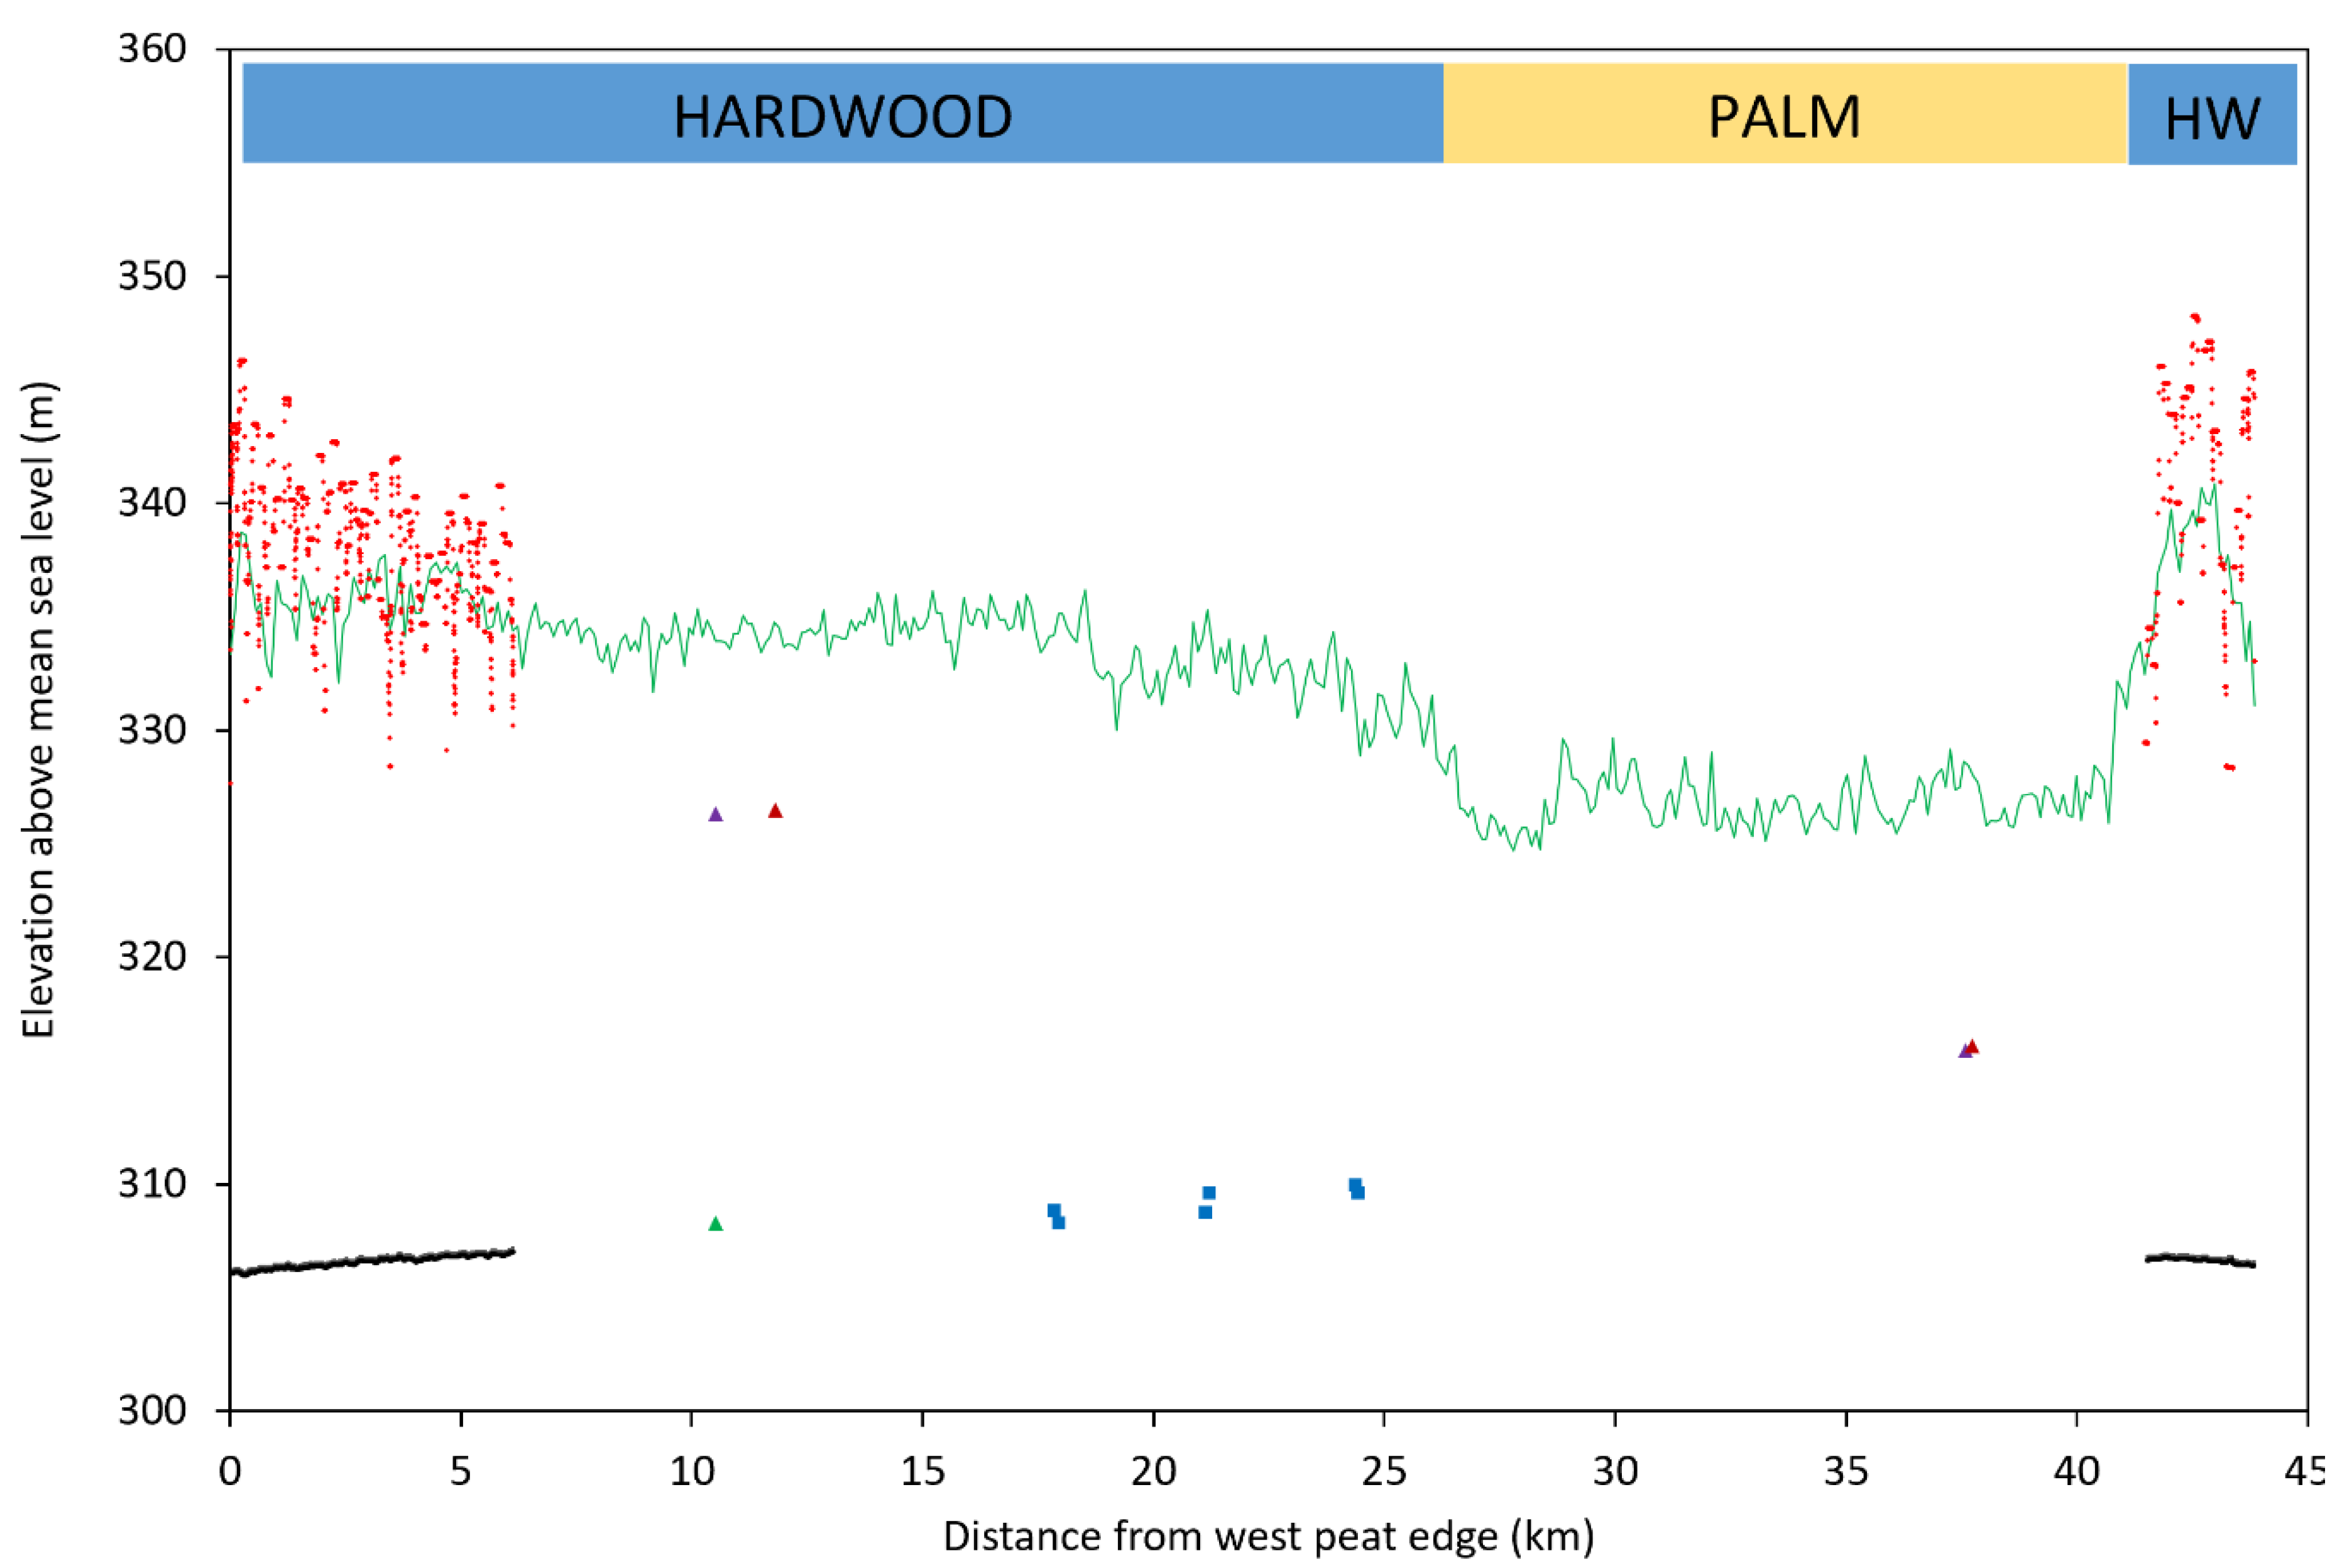
3.1. UAV LiDAR

The minimum returns per 1 m along each transect for the outgoing and return transects starting from the two locations on the edge of the peatland, are shown in Figure 4. The return flight to Ekolongouma suffered a data loss, and 400 m of the returns in the peat area could not be processed and analysed. For the Epena flight, the extent of peat was inferred as above, and the plot shows estimated elevation over that extent.
For the Ekolongouma flight, the mean difference between the outgoing and return flights’ lowest points for each 1 m segment was 0.0064 m, with an RMSD between the outgoing/return pairs of 0.13 m. For the Epena flight, the mean difference between outward and return ground estimates was 0.021 m, with an RMSD of 0.29 m. The Epena measurements likely have a larger uncertainty because of the longer mission length. The Ekolongouma measurements used in the analysis were taken over 4 km of flying during about 6 min, whereas the Epena measurements covered a total of 12 km with a flight time of about 17 min, allowing more time for GNSS elevation drift to affect measured heights. The low mean differences indicated local consistency in elevation measurement over the duration of the flights of 2 cm, suggesting that the GNSS location of the aircraft and laser timing measurement contributed only a small systematic uncertainty. The RMSD was due to a combination of the individual laser return timing uncertainty and ground level vegetation variability. For both sites, fitting a linear trend showed a slope upwards away from the edge of the peatland of around 0.00012 m·m–1 for the eastern Ekolongouma side and around 0.00015 m·m–1 on the western Epena side.
Since this analysis used a minimum of around 5000 measurements corresponding to each 1 m stretch, the uncertainty in each measurement gave rise to a systematic downward bias in the ground level estimate. The scatter in Figure 4 and similar work [15] suggested this would be about 20 cm.

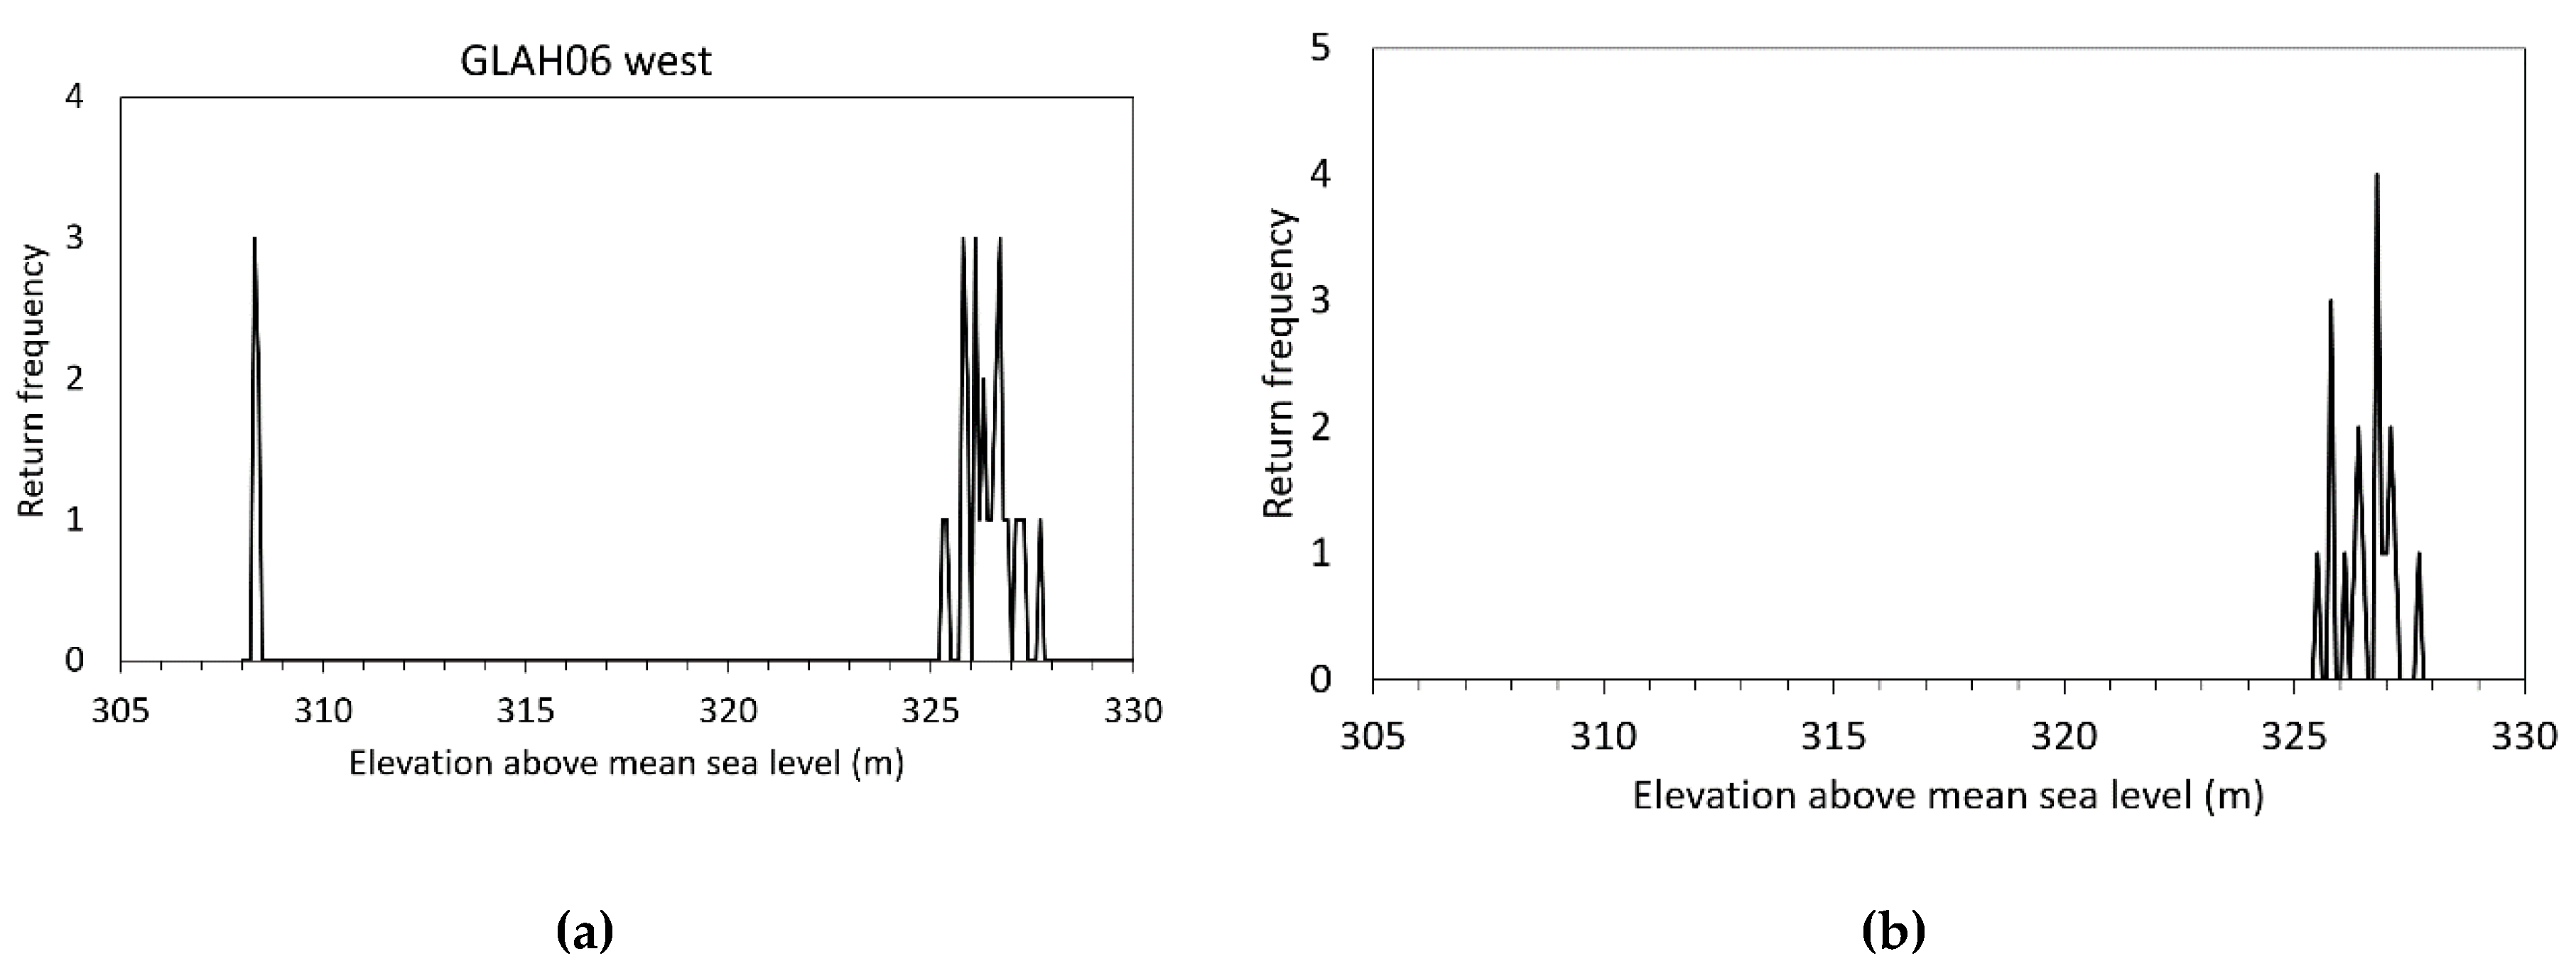
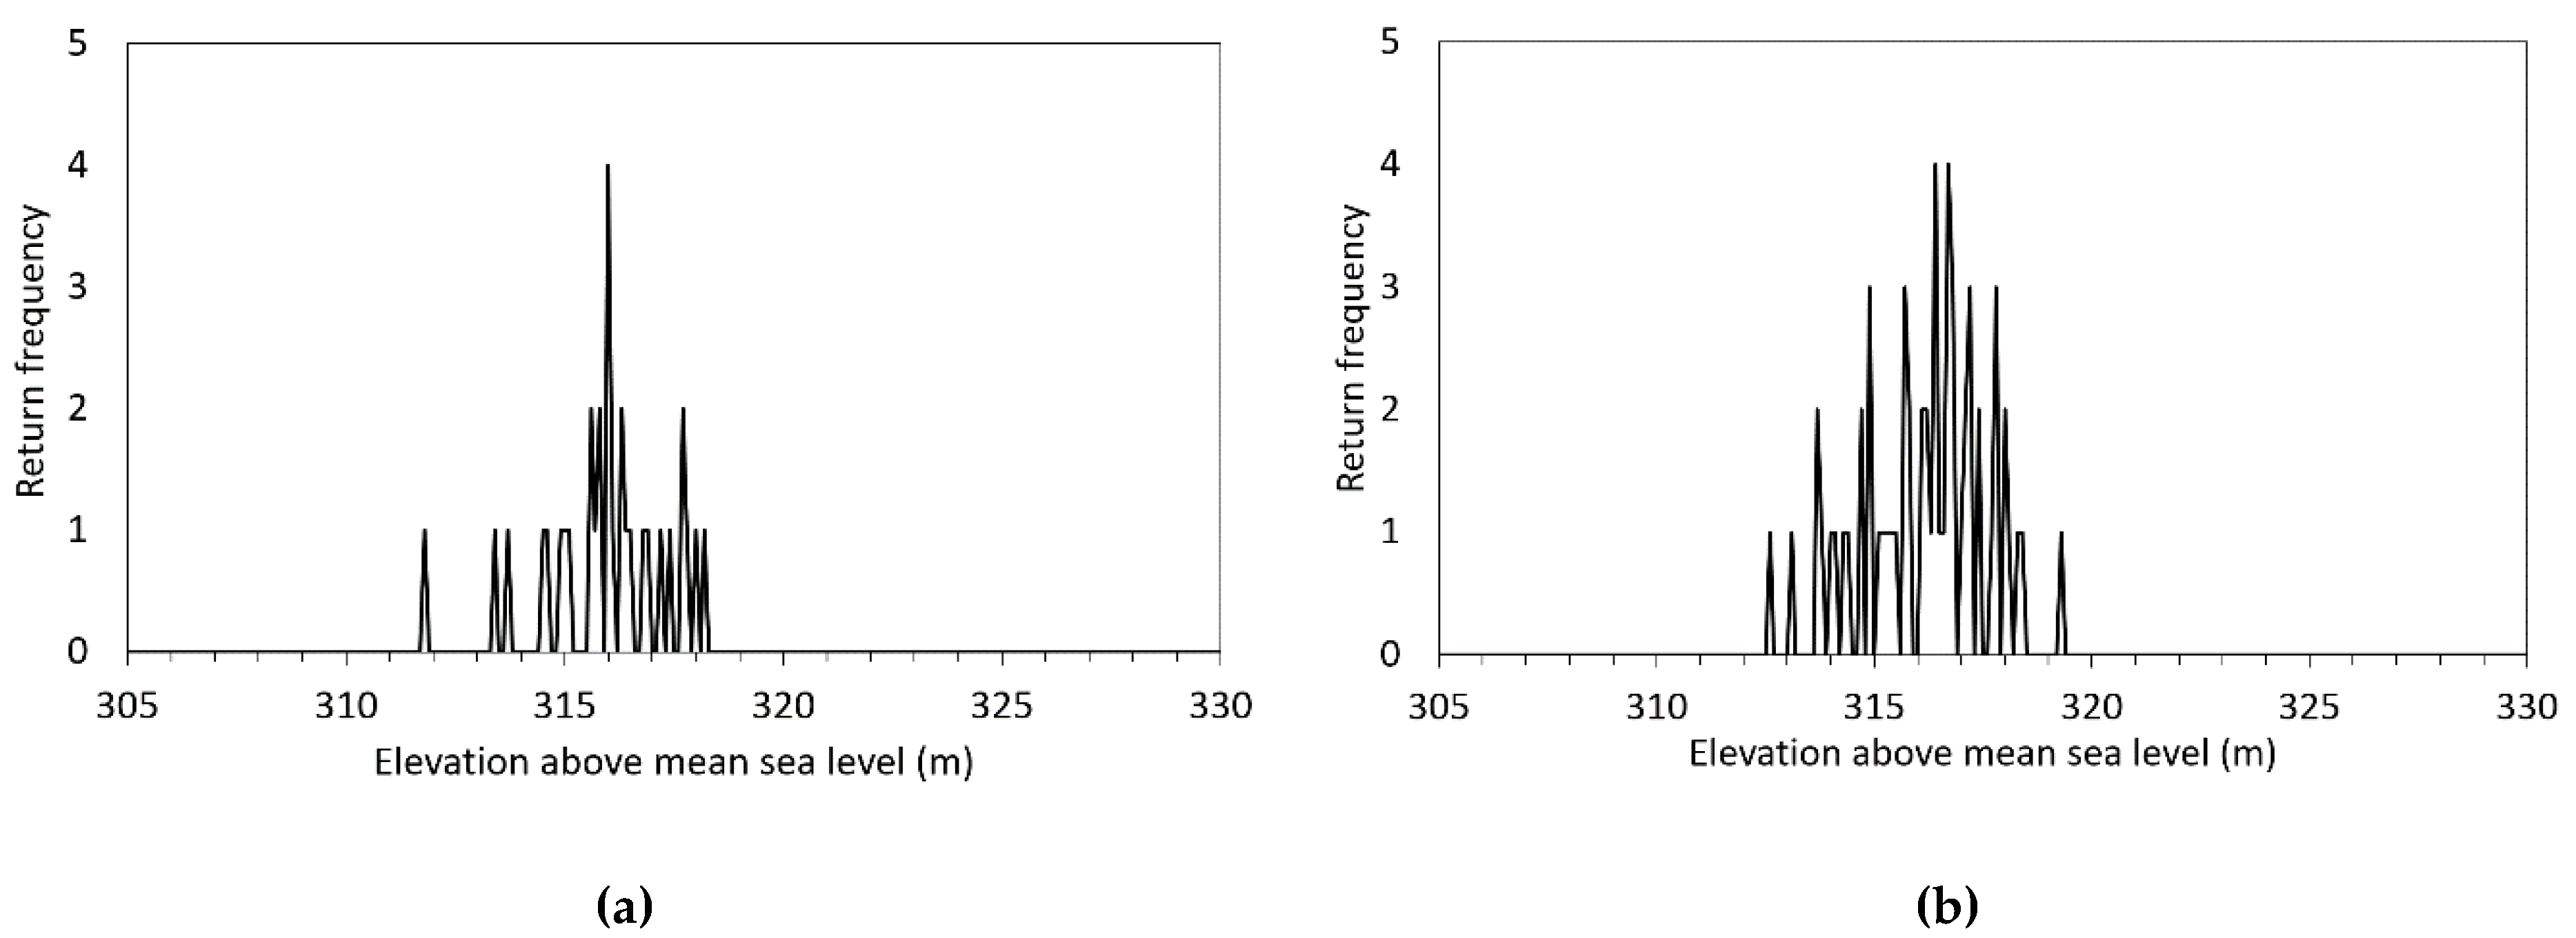
3.2. ICESat GLAH14 (Terrain) and GLAH06 (Surface)
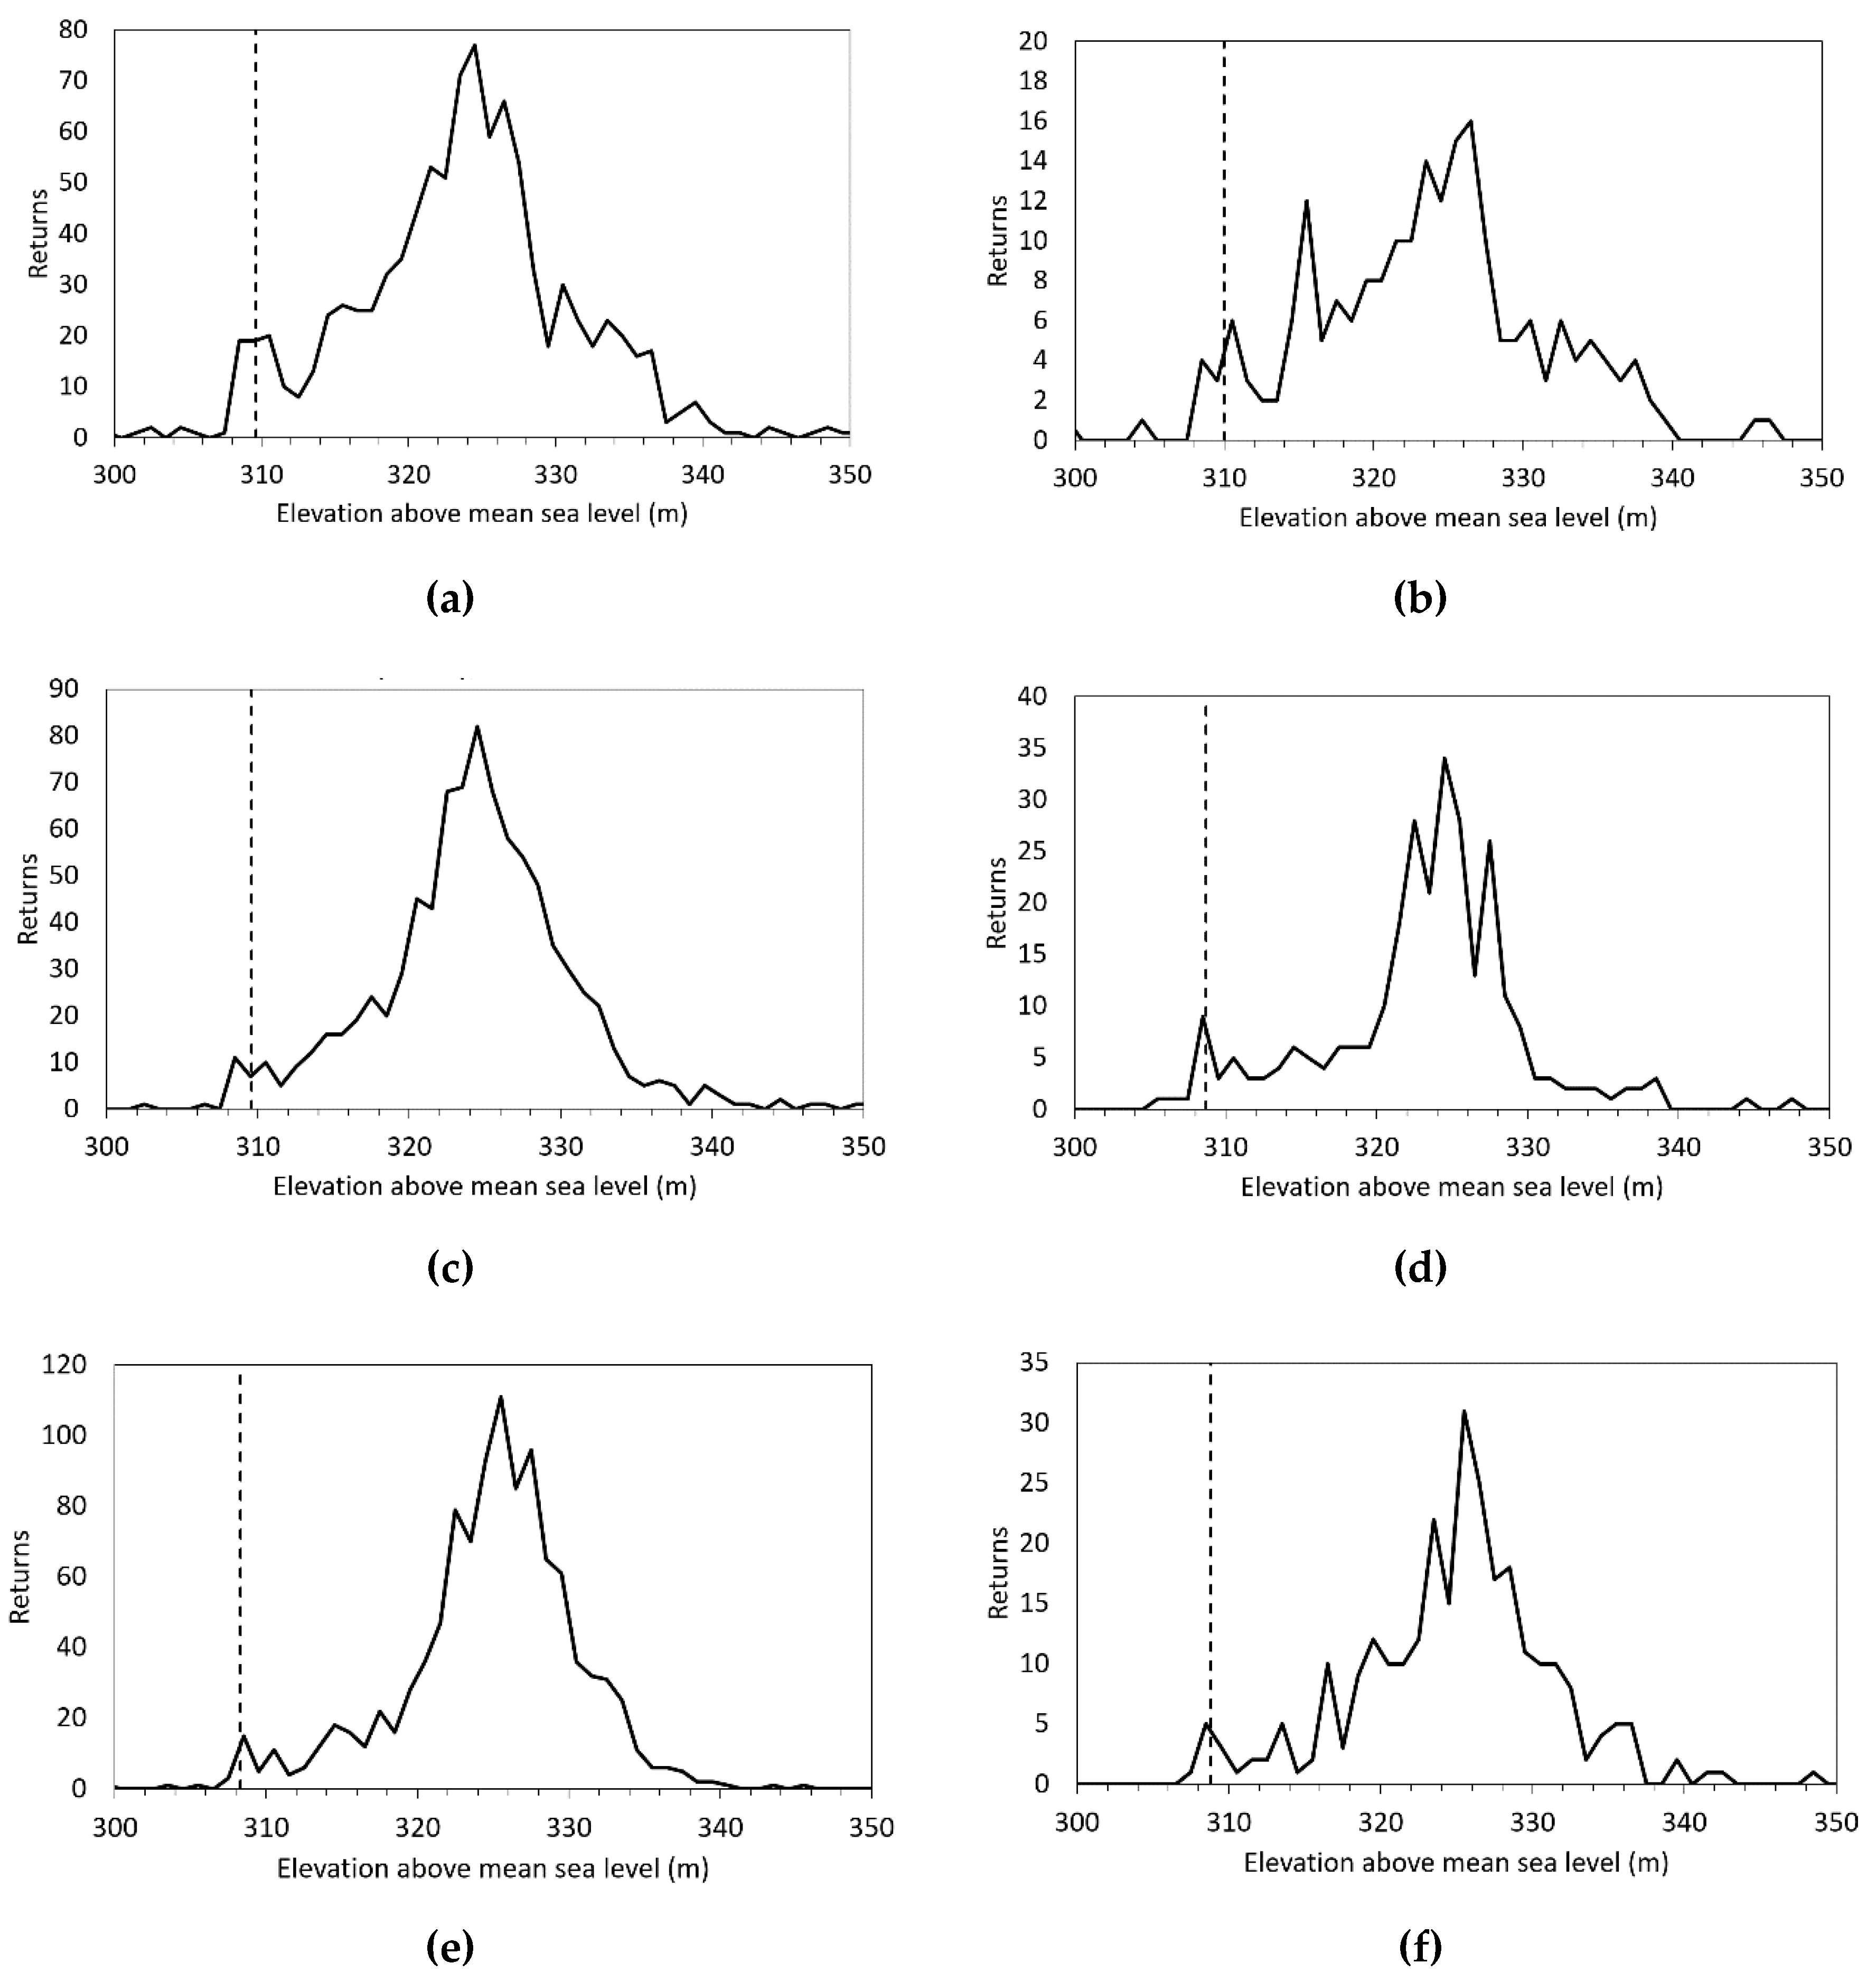
ICESat tracks crossed the line joining the two UAV transects several times between 25th February 2003 and 23rd March 2005. In the west, track 402 crossed at 17.579°E 1.278°N, and in the east track 156 crossed at 17.809°E 1.201°N. The GLAH06 and GLAH14 returns not classified as noise within 0.015° latitude of these two locations were analysed. As there were only between 19 and 61 points in each of these data sets, and the tracks were closely grouped, each area and return type was treated as one group.
In the west (Figure 5a), the 33 GLAH06 returns showed a bimodal distribution, with five elevation estimates between 308.27 m and 308.37 m and a mean of 308.30 m, potentially representing the ground, and a cluster of 28 between 325.24 m and 327.65 m with a mean of 326.34 seeming to represent the canopy as mapped by TanDEM-X. There were also two outliers, at 653.52 m and 663.05 m. The 19 GLAH14 returns (Figure 5b) showed points with a unimodal distribution between 325.44 m and 327.61 m, with a mean of 326.52 m, close to the local TanDEM-X elevations, strongly suggesting that the GLAH14 data in this case corresponded to the canopy rather than the underlying terrain.
In the east track, the 61 GLAH14 (terrain) returns (Figure 6a) showed a unimodal distribution, around 317 m above mean sea level, and the 31 GLAH06 returns showed a unimodal distribution (Figure 6b) centred at 316 m. Since the terrain–canopy separation should be 10 m or more, both of these seemed to be representing either canopy or terrain. The nearest UAV measurements showed the terrain about 10 m below this, and TanDEM-X showed an elevation of 316–318 m in this region. The classification, as shown in Figure 2, indicated that this area is palm-dominated, whereas the other satellite and UAV altimetry used here was acquired over hardwood tree regions, suggesting that the larger leaves of the palm swamp forming a more even and lower canopy prevented ground returns.

3.3. ICESat-2 ATL03

ICESat-2 ATLAS photon returns crossing the line between the UAV transects were only available for track 236 on 13th April 2019. ICESat-2 beams were divided into strong and weak pairs to enhance the radiometric dynamic range [16]. The strong/weak spot pair tracks crossed this line at three points: 17.639°E 1.258°N, 17.667°E, 1.248°N and 17.695°E, 1.240°N. Photon return locations from within a 0.005 degree N–S extent of these points were extracted, noise-classified points removed and histograms formed of the remaining points, numbering around 250 photon returns for each weak spot and 1000 returns for each strong spot. Given the large number of returns per spot and the relatively high separation, the returns for each spot were analysed separately. All six spot sets returned histograms (Figure 7) showing distributions consistent with a discrete ground return and an extended vegetation return. The returns apparently corresponding to a ground return were estimated by identifying the ground return spike with the estimated 1.6 m elevation instrument uncertainty scatter [17] and a mean used to estimate the ground elevation for each spot. The mean estimated ground elevation over the six spots was 309.18 m, and the mean location was at 17.67E 1.25N, within 0.01E of the W–E centre of the path through the peatland.

3.4. TanDEM-X

Figure 8 shows the elevations along the Figure 2 path between the peat edges, derived as above, and the TanDEM-X profile along the same path.
Figure 9 shows all of the acquired data believed to describe the ground elevation along the west–east path from Epena to Ekolongouma shown in Figure 2. Because of the estimated downward bias of the UAV LiDAR ground elevation estimates, a 20 cm upward error bar was marked. Error bars for ICESat were marked as 2.0 m [18], and for ICESat-2 as 1.6 m [17]. While the sparsity of data around the centre of the peatland precluded identifying the precise shape, a parabola was fitted to the data with a peak of 308.2 m above mean sea level, 306.1 m at the western edge of the peat and 306.7 m at its eastern edge, suggesting a peat dome with a highest point approximately 1.8 m above its edges. While this line falls 1–2 m below the satellite-based measurements, we are much more confident in the UAV-based measurements and, given the slopes at either edge, a slope increase to reach the ICESat-2 central elevations indicated seems implausible, and we have to conclude that the ICESat and ICESat-2 measurements exhibit a systematic upward bias.
Vertical lines below the fit indicate the depth of the peat, approximated in the west as discussed above, showing that the peat depth is around twice the elevation increase, and it is reasonable to infer that the peatland originated in a shallow basin at 3–4 m in depth, although if the peat peak is higher than estimated, the basin depth would be correspondingly shallower.
Due to the limited range of the UAV, a complete transect of high-quality LiDAR data across the entire peatland was not possible. While we focused on the simplest, most likely interpretation of the data, we cannot exclude the possibility of other, more complex topographies (Figure 10). The shape and size of a peatland, including the formation of a peat dome, result from complex feedbacks between climate, litter production, peat decay, peat permeability (hydraulic conductivity) and water-balance processes, including surface and subsurface water flows on and through the peat (e.g., [19,20,21,22]). Currently, we know little about the controls on peat formation at the site, and it is important to recognise that other topographies are consistent with our data, as shown in Figure 10. Future work on the topography of Congolese peatlands could usefully focus on (i) validating the UAV LiDAR measurements to reduce uncertainty in the peak height by deploying on a platform with a longer range, and (ii) analysing newly-available data from the GEDI LiDAR instrument on the International Space Station [23]. We are investigating options for an alternative aircraft platform and have analysed the initial 8-week GEDI data release, which included some acquisitions along our transect that were unfortunately blocked by cloud cover.

4. Conclusions

Two transects of UAV LiDAR data have defined the edges of a large peatland in the central Congo basin. The data shows a gentle slope from the edges, towards the centre of the peatland, suggesting, albeit not proving, that the surface is domed. This is the first evidence of a domed peatland surface surveyed in this region. This peatland has a span of 45 km east–west and reaches a dome height of 1.8 m, as estimated from a parabolic fit to the LiDAR data, and a larger dome height of 3.0 m from simple extrapolation of the mean slope of both LiDAR transects from edge to centre of the peatland. Peat depth measurements indicate that the underlying topography is a shallow basin; the peat reaches a maximum depth of 5.9 m at 17.4 km from the western peatland edge. By contrast peat domes in southeast Asia with diameters greater than 40 km have a steeper topography with domes rising up to 20 m (e.g., [24]). Smaller peatlands in southeast Asia (diameters of ~10 km) also have steeper topography, rising to six or more metres above their margins (e.g., [25,26]). Southeast Asian peatlands also have greater peat depths and can be between 10 and 20 m deep towards their centres (e.g., [24]). In Amazonian Peru, only small domes 10 km in diameter and <2 m in height, with 3–7 m of peat, have so far been reported ([7,27]). It therefore appears that the Congolese example is unusual in being both large and shallow. This may relate to the relatively low rainfall in central Congo (~1700 mm yr–1) compared to southeast Asian and Peruvian sites (~3000 mm yr–1) resulting in lower peat accumulation rates in the central Congo compared to the other sites (Table 1 in ref [5]).

Author Contributions

S.L.L., E.T.A.M. and G.D. conceived the experiment; I.M., I.J.D., G.D., S.L.L., I.S., Y.E.B. and B.M. organised and conducted the fieldwork; I.J.D. analysed and interpreted the measurements and wrote most of the manuscript; D.H., A.J.B. and I.L. evaluated the implications; S.P., I.L., A.J.B. and S.L.L. reviewed and edited the manuscript. All authors have read and agreed to the published version of the manuscript.

Funding

This work was funded by CongoPeat, a NERC Large Grant (NE/R016860/1) to S.L.L. and E.T.A.M. (UAV data collection, I.J.D. time), a NERC Open CASE Studentship to S.L.L., I.L. and G.D. and a Phillip Leverhulme Prize to S.L.L. (peat depths).

Acknowledgments

We are grateful for the cooperation of the villages of Ekolongouma and Epena, the government of the Republic of Congo, the Likouala Prefecture, the Ministry of Environment and Tourism, Marien N’gouabi University and the World Conservation Society (WCS) Congo for assistance. Mbongo Roger of the WCS, Abia Platini, Angoni Tresor, Bobetolo Jean Bosco, Mouapeta Fulgence, Elongo Bienvenu, Fatty Carlos, Mokondo Ismael, Iwango Michel, Mobembe Amalphi, Moniobo Belen Ekous, Ngongo Guy and Chancel helped collect the field data.

Conflicts of Interest

The funders had no role in the design of the study; in the collection, analyses, or interpretation of data; in the writing of the manuscript; or in the decision to publish the results.

References

  1. Rydin, H.; Jeglum, J.K. The Biology of Peatlands; Oxford University Press: Oxford, UK, 2006; pp. 230–233. [Google Scholar]
  2. Page, S.E.; Rieley, J.O.; Banks, C.J. Global and regional importance of the tropical peatland carbon pool. Glob. Chang. Biol. 2011, 17, 798–818. [Google Scholar] [CrossRef] [Green Version]
  3. Mitchard, E.T.A. The tropical forest carbon cycle and climate change. Nature 2018, 559, 527–534. [Google Scholar] [CrossRef] [PubMed]
  4. Miettinen, J.; Hooijer, A.; Vernimmen, R.; Liew, S.C.; Page, S.E. From carbon sink to carbon source: Extensive peat oxidation in insular Southeast Asia since 1990. Environ. Res. Lett. 2017, 12, 024014. [Google Scholar] [CrossRef]
  5. Dargie, G.C.; Lewis, S.L.; Lawson, I.T.; Mitchard, E.T.A.; Page, S.E.; Bocko, Y.E.; Ifo, S.A. Age, extent and carbon storage of the central Congo Basin peatland complex. Nature 2017, 542, 86–90. [Google Scholar] [CrossRef] [PubMed]
  6. Lähteenoja, O.; Page, S. High diversity of tropical peatland ecosystem types in the Pastaza-Marañón basin, Peruvian Amazonia. J. Geophys. Res. Biogeosci. 2011, 116, G0202. [Google Scholar] [CrossRef] [Green Version]
  7. Anderson, J.A.R. Tropical peat swamps of western Malesia. In Ecosystems of the World; Gore, A.J.P., Ed.; Elsevier: Amsterdam, The Netherlands, 1983; Volume 4B, pp. 181–200. [Google Scholar]
  8. Lähteenoja, O.; Ruokolainen, K.; Schulman, L.; Alvarez, J. Amazonian floodplains harbour minerotrophic and ombrotrophic peatlands. Catena 2009, 79, 140–145. [Google Scholar] [CrossRef]
  9. Phillips, S.; Rouse, G.E.; Bustin, R.M. Vegetation zones and diagnostic pollen profiles of a coastal peat swamp, Bocas del Toro, Panama. Palaeogeogr. Palaeoclimatol. Palaeoecol. 1997, 128, 301–338. [Google Scholar] [CrossRef]
  10. Zwally, H.J.; Schutz, R.; Bentley, C.; Bufton, J.; Herring, T.; Minster, J.; Spinhirne, J.; Thomas, R. GLAS/ICESat L1B Global Elevation Data, Version 34; [GLAH06]; NASA National Snow and Ice Data Center Distributed Active Archive Center: Boulder, CO, USA, 2014. [CrossRef]
  11. Zwally, H.J.; Schutz, R.; Bentley, C.; Bufton, J.; Herring, T.; Minster, J.; Spinhirne, J.; Thomas, R. GLAS/ICESat L2 Global Land Surface Altimetry Data, Version 34; [GLAH14]; NASA National Snow and Ice Data Center Distributed Active Archive Center: Boulder, CO, USA, 2014. [CrossRef]
  12. Ballhorn, U.; Jubanski, J.; Siegert, F. ICESat/GLAS Data as a Measurement Tool for Peatland Topography and Peat Swamp Forest Biomass in Kalimantan. Indones. Remote Sens. 2011, 3, 1957–1982. [Google Scholar] [CrossRef] [Green Version]
  13. Neumann, T.A.; Brenner, A.; Hancock, D.; Robbins, J.; Luthcke, S.B.; Harbeck, K.; Lee, J.; Gibbons, A.; Saba, J.; Brunt, K. ATLAS/ICESat-2 L2A Global Geolocated Photon Data, Version 1; ATL03; NSIDC: National Snow and Ice Data Center: Boulder, CO, USA, 2019. [CrossRef]
  14. Hawker, L.; Neal, J.; Bates, P. Accuracy assessment of the TanDEM-X 90 digital elevation model for selected floodplain sites. Remote Sens. Environ. 2019, 232, 111319. [Google Scholar] [CrossRef]
  15. Bakula, K.; Ostrowski, W.; Pilarska, M.; Szender, M.; Kurczynski, Z. Evaluation and Calibration of Fixed-Wing uav Mobile Mapping System Equipped with Lidar and Optical Sensors; International Archives of the Photogrammetry, Remote Sensing and Spatial Information Sciences: Beijing, China, 2018; Volume XLII-1, pp. 25–32. [Google Scholar]
  16. Neumann, T.A.; Martino, A.J.; Markus, T.; Bae, S.; Bock, M.R.; Brenner, A.C.; Brunt, K.M.; Cavanaugh, J.; Fernandes, S.T.; Hancock, D.W.; et al. The Ice, Cloud, and Land Elevation Satellite–2 mission: A global geolocated photon product derived from the Advanced Topographic Laser Altimeter System. Remote Sen. Environ. 2019, 233, 111325. [Google Scholar] [CrossRef] [PubMed]
  17. Wang, C.; Zhu, X.; Nie, S.; Xi, X.; Li, D.; Zheng, W.; Chen, S. Ground elevation accuracy verification of ICESat-2 data: A case study in Alaska, USA. Opt. Express 2019, 27, 38168–38179. [Google Scholar] [CrossRef] [PubMed]
  18. Ensle, F.; Heinzel, J.; Koch, B. Accuracy of vegetation height and terrain elevation derived from ICESat/GLAS in forested areas. Int. J. Appl. Earth Obs. Geoinf. 2014, 31, 37–44. [Google Scholar] [CrossRef]
  19. Belyea, L.R.; Baird, A.J. Beyond “the limits to peat bog growth”: Cross-scale feedback in peatland development. Ecol. Monogr. 2006, 76, 299–322. [Google Scholar] [CrossRef]
  20. Morris, P.J.; Baird, A.J.; Belyea, L.R. The DigiBog peatland development model: Ecohydrological simulations in 2D. Ecohydrology 2012, 5, 256–268. [Google Scholar] [CrossRef]
  21. Frolking, S.; Roulet, N.T.; Tuittila, E.; Bubier, J.L.; Quillet, A.; Talbot, J.; Richard, P.J.H. A new model of Holocene peatland net primary production, decomposition, water balance, and peat accumulation. Earth Syst. Dyn. 2010, 1, 1–21. [Google Scholar] [CrossRef] [Green Version]
  22. Page, S.E.; Baird, A.J. Peatlands and global change: Response and resilience. Annu. Rev. Environ. Resour. 2016, 41, 35–57. [Google Scholar]
  23. Dubayah, R.; Goetz, S.J.; Blair, J.B.; Fatoyinbo, T.E.; Hansen, M.; Healey, S.P.; Hofton, M.A.; Hurtt, G.C.; Kellner, J.; Luthcke, S.B.; et al. The Global Ecosystem Dynamics Investigation. In Proceedings of the American Geophysical Union, Fall Meeting 2014, AGU, San Francisco, CA, USA, 15–19 December 2014. [Google Scholar]
  24. Page, S.E.; Rieley, J.O.; Shotyk, O.W.; Weiss, D. Interdependence of peat and vegetation in a tropical peat swamp forest. Philos. Trans. R. Soc. Lond. B 1999, 354, 1885–1897. [Google Scholar] [CrossRef] [PubMed]
  25. Anderson, J.A.R. The structure and development of peat swamps of Sarawak and Brunei. J. Trop. Geogr 1964, 18, 7–16. [Google Scholar]
  26. Andriesse, J.P. The Soils of West Sarawak (East Malaysia); Memoir 1; Department of Agriculture: Sarawak, Malaysia, 1972; Volume 1.
  27. Swindles, G.T.; Reczuga, M.; Lamentowicz, M.; Raby, C.L.; Turner, T.E.; Charman, D.J.; Gallego-Sala, A. Ecology of testate amoebae in an Amazonian peatland and development of a transfer function for palaeohydrological reconstruction. Microb. Ecol. 2014, 68, 284–298. [Google Scholar] [CrossRef] [PubMed]
Figure 1. The location of the Centrale Cuvette peat deposit (green) in the Republic of Congo (ROC) and Democratic Republic of Congo (DRC) [5]; (a) large scale; (b) local scale, field site in yellow.
Remotesensing 12 02196 g001
Figure 2. The locations of acquired data UAV LiDAR, ICESat, ICESat-2, field-measured peat depth and the area believed to be palm swamp (white hatched) [5]. A white line joins the LiDAR transects forming a path between the peat edges 43.8 km long, compared to 43.3 km direct-line distance. Background image is a Sentinel-2 composite, Copyright European Space Agency. Caption font colours correspond to figure data colours.
Remotesensing 12 02196 g002
Figure 3. The unmanned aerial vehicle (UAV) prepared for launch at the cleared site near Ekolongouma, and peat depth field measurements being made in the hardwood forest.
Remotesensing 12 02196 g003
Figure 4. Estimated ground elevation points per meter along UAV transect from the estimated peat edge. Green points are derived from the outgoing flight and red from the returning flight. (a). Ekolongouma. The total transect is 2269 m long, for 1862 m of which we have both outgoing and returning flight data. The fitted line slope is 0.121 m·km–1. (b). Epena. Total transect length is 5861 m. The fitted line slope is 0.145 m·km–1.
Remotesensing 12 02196 g004
Figure 5. ICESat GLAS west region returns; (a) GLAH06, (b) GLAH14.
Remotesensing 12 02196 g005
Figure 6. ICESat GLAS east region returns (a) GLAH06, (b) GLAH14.
Remotesensing 12 02196 g006
Figure 7. ICESat-2 ATLAS return histograms for each spot, inferred ground elevation indicated by a dashed line. (a) GT1L (strong), (b) GT1R (weak), (c) GT2L (strong), (d) GT2R (weak), (e) GT3L (strong), (f) GT3R (weak). Abscissa scales varied for legibility.
Remotesensing 12 02196 g007
Figure 8. Measured elevations along the Figure 2 Epena–Ekolongouma path from ICESat GLAH06 ( ground, canopy), GLAH14 (), ICESat-2 ground returns (), UAV LiDAR canopy (), UAV LiDAR ground 100-m moving average (), TanDEM-X (). Forest type at top of figure.
Remotesensing 12 02196 g008
Figure 9. Plot of peat depths (orange vertical bars), ground elevations from ICESat (), ICESat-2 (), UAV LiDAR 100m moving average (black line with grey error bars) and parabolic fit (blue dashed line) with a peak at 308.2 m, along the Figure 2 Epena–Ekolongouma path.
Remotesensing 12 02196 g009
Figure 10. Potential peat dome morphologies: (a) convex dome, (b) plateau dome, (c) stepped dome, (d) sloping dome, (e) undulating dome, (f) double dome with intervening basin.
Remotesensing 12 02196 g010

