1. Introduction
The total area of agriculture plastic film, including plastic covered greenhouses (PCG), walk-in tunnels (high tunnels; HT), low tunnels (LT), and plastic-mulched farmland (PMF), has been steadily increasing throughout the world at a rate close to 20% per year [
1], especially in China. This technology has been introduced and developed during the last 70 years as a tool to move up the first harvest and increase crops’ yield, being considered a step forward in the evolution from extensive to intensive farming [
2]. In this way, PCG have reached a total coverage of 3019 million hectares around the world, mainly located in China, Europe (Mediterranean areas), North Africa, and the Middle East [
3]. China also has the largest area of plastic-mulched farmland in the world, with around 25 million hectares [
4,
5], and this area is growing rapidly [
6].
Since its first use in 1948 [
7], plastic covering has been widely used in the cultivation of vegetables and fruits to control environmental conditions and growth [
8,
9,
10]. In the case of Mediterranean countries such as Spain, horticultural crops (tomato, pepper, zucchini, melon, watermelon, etc.) are the most frequent type of greenhouse crops, although plastic coverings are also often used for vines in Southern Italy. Likewise, plastic coverings are also beginning to be used for growing tropical fruits (woody crops) such as papaya, mango, loquat, nectarine, and citrus. Regarding low tunnels and plastic-mulched crops, the most frequent crops would be berries, asparagus, lettuce, and broccoli. In the case of China, flowers and vegetables (cabbage, tomato, beans, pepper, lettuce, and celery) form the basis of plastic-covered crops. It is also common to grow a very varied set of aromatic plants for culinary use and even crops such as cotton, rice, and wheat.
This technology can protect crops from adverse conditions, such as cold, heat, heavy rain, wind, harmful insects, and diseases, optimizing the use of water and increasing the soil temperature. However, plastic coverings also have negative impacts on the local or regional environment, since they reduce plant biodiversity by changing the pollination cycle and deteriorate the soil structure by leaving plastic film residues [
11]. Furthermore, they produce large amounts of plastic and crop waste [
12], also contributing to the contamination of aquifers and eutrophication of surface water due to fertilizer leaching [
13]. Finally, land use and land cover (LULC) changes can directly affect the status and integrity of ecosystems. For instance, natural and multifunctional landscapes can be converted into areas of intensive farming, altering the main land use type and natural character of a region. In fact, the plastic covering-based agricultural model is linked to an important anthropic impact due to the construction of greenhouses and auxiliary infrastructures [
12] that contribute significantly to the modification of the environment [
14] and the increase in the visual impact [
15]. In this sense, management decisions should promote a transition towards sustainable landscape strategies while simultaneously maintaining the delivery of ecosystem services [
16].
The mentioned transition requires a deep understanding of the spatio-temporal distribution of plastic covered crops. Here, remote sensing seems to be the only feasible approach to obtain information on its impact on climate and environment in a large geographic area [
17,
18,
19]. However, due to the peculiar characteristics of plastic coverings, such as different material and spectral signatures, types of crops and phenological status, age, state of conservation, and cleanliness of the plastic film, and local agricultural practice, remote sensing-based mapping of this particular type of land cover is still pending, judging by the increasing number of scientific works produced in the last few years [
20].
Regarding the topic discussed in this work, several research lines have emerged throughout the 21st century based on (i) input satellite data sources; (ii) image processing approach (i.e., pixel-based (PB) or object-based image analysis (OBIA)); (iii) input vector features for image classification (multispectral or hyperspectral, geometrical, texture, 3D information, radar, lidar, and data fusion); (iv) image classification methods (unsupervised or supervised, parametric or non-parametric, and machine learning or deep learning-based approaches); (v) single or multitemporal remotely sensed data; vi) only mapping plastic covering structures or going a step further to classify and map plastic-covered crops. The following is a summary of a representative sample of papers dealing with the previously outlined research lines classified according to their primary focus on image processing (PB and OBIA), which is used to define the biunivocal relation between the pixels constituting an image and the classes of information set as the goal of the detection.
1.1. Pixel-Based Approach
The PB approach operates on single pixels and considers only their spectral and textural (moving window) characteristics. In this sense, Levin et al. [
21] used the AISA-ES hyperspectral airborne sensor (1 m spatial resolution), together with the Landsat-5 Thematic Mapper (TM) and Landsat-7 ETM + time series, to identify PCG. They reported that white and transparent plastic films presented three absorption peaks at 1218 nm, 1732 nm, and 2313 nm wavelengths, which are not affected by dust, whitening, or the underlying surface. Agüera et al. [
22] used the supervised parametric method maximum likelihood classifier (MLC) to identify PCG from a single QuickBird satellite image in order to later delineate the contour of classified greenhouses by applying an algorithm based on the Hough transformation. Agüera et al. [
23] also applied MLC and texture analysis to compare Ikonos and QuickBird data in greenhouse mapping. Carvajal et al. [
24] tested four increasing levels of atmospheric correction as a preprocessing step for PCG mapping over single Ikonos and QuickBird imagery, while Picuno et al. [
25] combined supervised classification and geographic information system (GIS) analysis using Landsat TM images to assess the impact of agricultural plastic coverings on the landscape of Southern Italy. Koc-San [
26] worked with WorldView-2 (WV2) satellite imagery to compare performance in mapping plastic and glass greenhouses in Turkey according to different classifiers such as MLC, random forest (RF), and support vector machine (SVM), achieving the best results with the SVM method. An unsupervised method to classify greenhouses based on an approximate spectral clustering ensemble using a hybrid geodesic similarity criterion was also tested by working on the same dataset [
27], outperforming earlier unsupervised extraction methods. Lu et al. [
11] developed a simple but robust decision tree (DT) classifier to detect PMF from only two Landsat-5 TM images taken during an agricultural season, proposing a specific index called the Plastic-Mulched Landcover Index (PMLI) based on red and shortwave infrared (SWIR)1 reflectance. With the same objective, Lu et al. [
28] used dense time series of MODIS images (surface reflectance 250 m pixel size). Landsat-8 Operational Land Imager (OLI) imagery and GoogleEarth data (training phase) have been also used to map PMF using spectral and textural characteristics [
29,
30], while Hasituya et al. [
31] also used full polarization SAR data (Radarsat-2) to classify PMF, obtaining poor overall accuracy of 75%. In the same way, Novelli and Tarantino [
32] combined Landsat-8 OLI and thermal infrared sensor (TIRS) data to provide several useful indices for mapping plastic-covered vineyards in Italy, while Yang et al. [
33] developed a specific index for the detection of PCG (Plastic Greenhouse Index; PGI) from Landsat TM and Landsat-8 OLI images.
1.2. Object-Based Image Analysis Approach
Unlike the PB approach, the OBIA paradigm focuses on objects made of several pixels (segmentation step) that correspond to homogeneous and meaningful objects on the study site which are grouped according to both spectral and spatial information (e.g., 3D information). Furthermore, object analysis represents the ideal framework to carry out data fusion at the object level, obtaining a valuable features vector (including object texture, shape, and neighborhood) for further classification [
34].
The OBIA approach to detect PCG and PMF is much more recent than PB analysis. Tarantino and Figorito [
35] published the first work based on OBIA to map plastic-covered vineyards from true color aerial data in Southern Italy. Novelli et al. [
20] carried out the first work based on Sentinel-2A Multispectral Instrument (MSI) and Landsat-8 OLI images to map PCG by adopting an OBIA approach and RF classifier. In this case, the segmentation step was performed on a very high resolution (VHR) image (WV2), thus focusing the classification step on the spectral information provided by Landsat-8 and Sentinel-2A data. Balcik et al. [
36] employed Sentinel-2 images to classify greenhouses in Turkey, demonstrating the valuable contribution of the PGI index proposed in [
33]. It is necessary to highlight that the OBIA approach has usually performed better than the PB approach, even working on medium resolution satellite imagery such as Landsat-8 OLI (e.g., [
3]).
1.3. Extraction of Greenhouses and Plastic-Mulched Farmland from Remote Sensing: Summary of Methods and Accuracy Results
Regarding the PB approach, Agüera et al. [
22] reported a PCG detection percentage value of 91.45% when working on a single QuickBird image, but it was achieved after applying two algorithms to refine the raw classification. The same authors [
23] compared single QuickBird and IKONOS imagery in PCG detection, obtaining overall accuracy values of 89.61% and 88.26% for QuickBird and IKONOS, respectively. They also concluded that the addition of texture information in the classification process did not improve the classification accuracy. Working on WV2 pan-sharpened imagery, Koc-San [
26] reported overall accuracy values ranging from 87.80% to 93.88% by using different PB classification techniques (MLC, RF, and SVM), while Arcidiacono and Porto [
37] reported a greenhouse detection percentage of 85.71% by using RGB very high resolution satellite bands only, although this accuracy was improved to 88.42% by adding texture descriptors. Lanorte et al. [
38] used Landsat-8 OLI images and SVM classifier to identify PCG, reporting outstanding overall accuracy of 94.54%. They subsequently utilized the classification data to spatially quantify the amount of agricultural plastic waste in Southern Italy.
With respect to the accuracy results provided by the OBIA approach, Arcidiacono and Porto [
39] compared both PB and OBIA approaches to classify greenhouses from RGB aerial images over the same study site. They found that the best accuracy results, ranging from 83.15% to 94.73%, were attained by using OBIA techniques. In the same way, Aguilar et al. [
40] also applied OBIA on WV2 and GeoEye-1 imagery using nearest neighbor (NN) and SVM classifiers to achieve overall accuracy close to 90%, while Tarantino and Figorito [
35] achieved overall accuracy of 90.25% by using OBIA classification for mapping plastic-covered vineyards from high resolution aerial photographs.
These PB and OBIA classification results can be notably improved when using data fusion or time series. In fact, time series satellite images have proven to be a very interesting way to ensure the stability of the PCG/PMF classification results and their transferability to other areas [
11,
18]. For example, Lu et al. [
11] used Landsat-5 TM images (two per agricultural season) and a DT classifier trained by analyzing the spectral characteristics of transparent PMF. The classifier was applied at the study area for years 1998, 2007, and 2011, achieving overall accuracy values of 95%, 85.27%, and 97.82%, respectively. In the same research line, Hasituya and Chen [
6] tried out RF and SVM classifiers on Landsat-8 OLI time series (up to five images per agricultural season) for mapping PMF through combining spectral bands, vegetation indices, texture, and thermal features, and the best overall accuracy value obtained was 97.01%. González-Yebra et al. [
2] applied OBIA data fusion combining panchromatic and RGB aerial images (pixel size ranging from 0.5 m to 1 m) and Landsat-5 TM and Landsat-7 ETM + data for multitemporal mapping of PCG in Southern Spain, obtaining overall accuracy figures ranging from 92.05% to 98.58%, while Novelli et al. [
20] used OBIA classification (RF) on time series of Sentinel-2A MSI and Landsat-8 OLI images to provide overall accuracy values of up to 93.4%. The same results were obtained by Aguilar et al. [
41] through the combined use of very high resolution satellite data (WV2) and Landsat-8 OLI time series within the context of an OBIA and decision tree classification. In this case, WV2 was mainly used to segment the study area, focusing on individual greenhouses. In addition, Lu et al. [
42] recently fused Sentinel-1 (SAR) and Sentinel-2 MSI (optical) data to classify PMF growing areas, achieving overall accuracy of 94.3% by applying the SVM classifier.
1.4. Research Objective
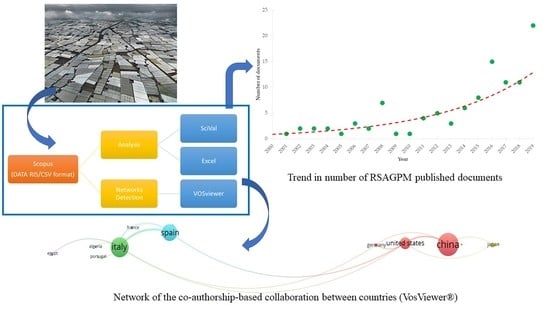
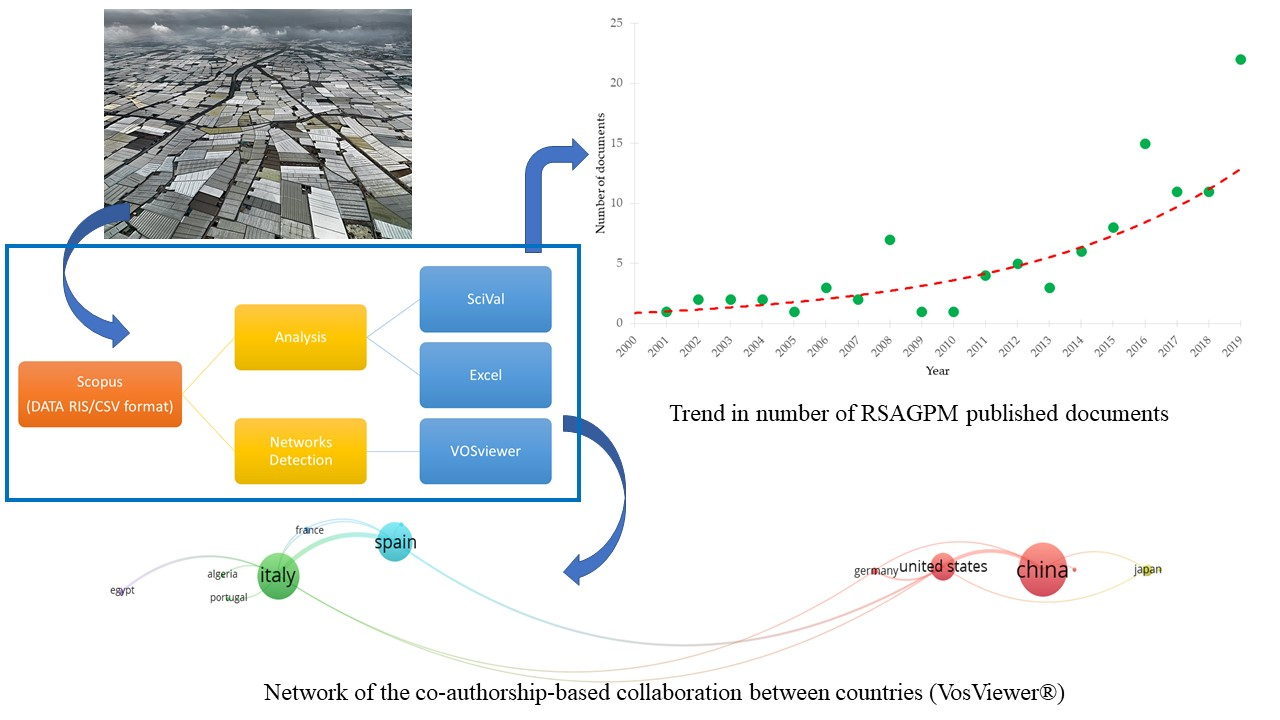
The current work aims to provide an overview of the general research dynamics regarding the topic of remote sensing-based mapping of agricultural greenhouses and plastic-mulched crops (RSAGPM henceforth) throughout the 21st century. In doing this, a quantitative analysis was carried out using bibliometric methods [
43] to identify, organize, and analyze the main characteristics of scientific production within the mentioned research topic [
44,
45,
46]. This information can be very valuable for researchers but also for analysts and decision-makers who may be interested in knowing how, where, and by whom research is being conducted on the arrangement and spatio-temporal dynamics of this increasingly important model of intensive agriculture to guarantee its sustainability and capacity to produce quality food at a relatively affordable cost.
3. Results
3.1. Types and Languages of Publications
The chosen time frame, which includes the last 20 years, returned 107 documents, including 71 articles (66%), 34 conference papers (32%), and, to a lesser extent, one review (1%) and one letter (1%).
Considering the international scope of the indexed documents, English was the most common language, comprising 101 (95%) out of the 107 documents in the database. The remaining languages presented limited use, with four documents in Chinese (4%), one in Korean (1%), and one in Spanish (1%).
3.2. Scientific Production and Characteristics
The analysis of the number of documents published during 2000–2019 shows that research on RSAGPM has attracted increasing attention in recent years (
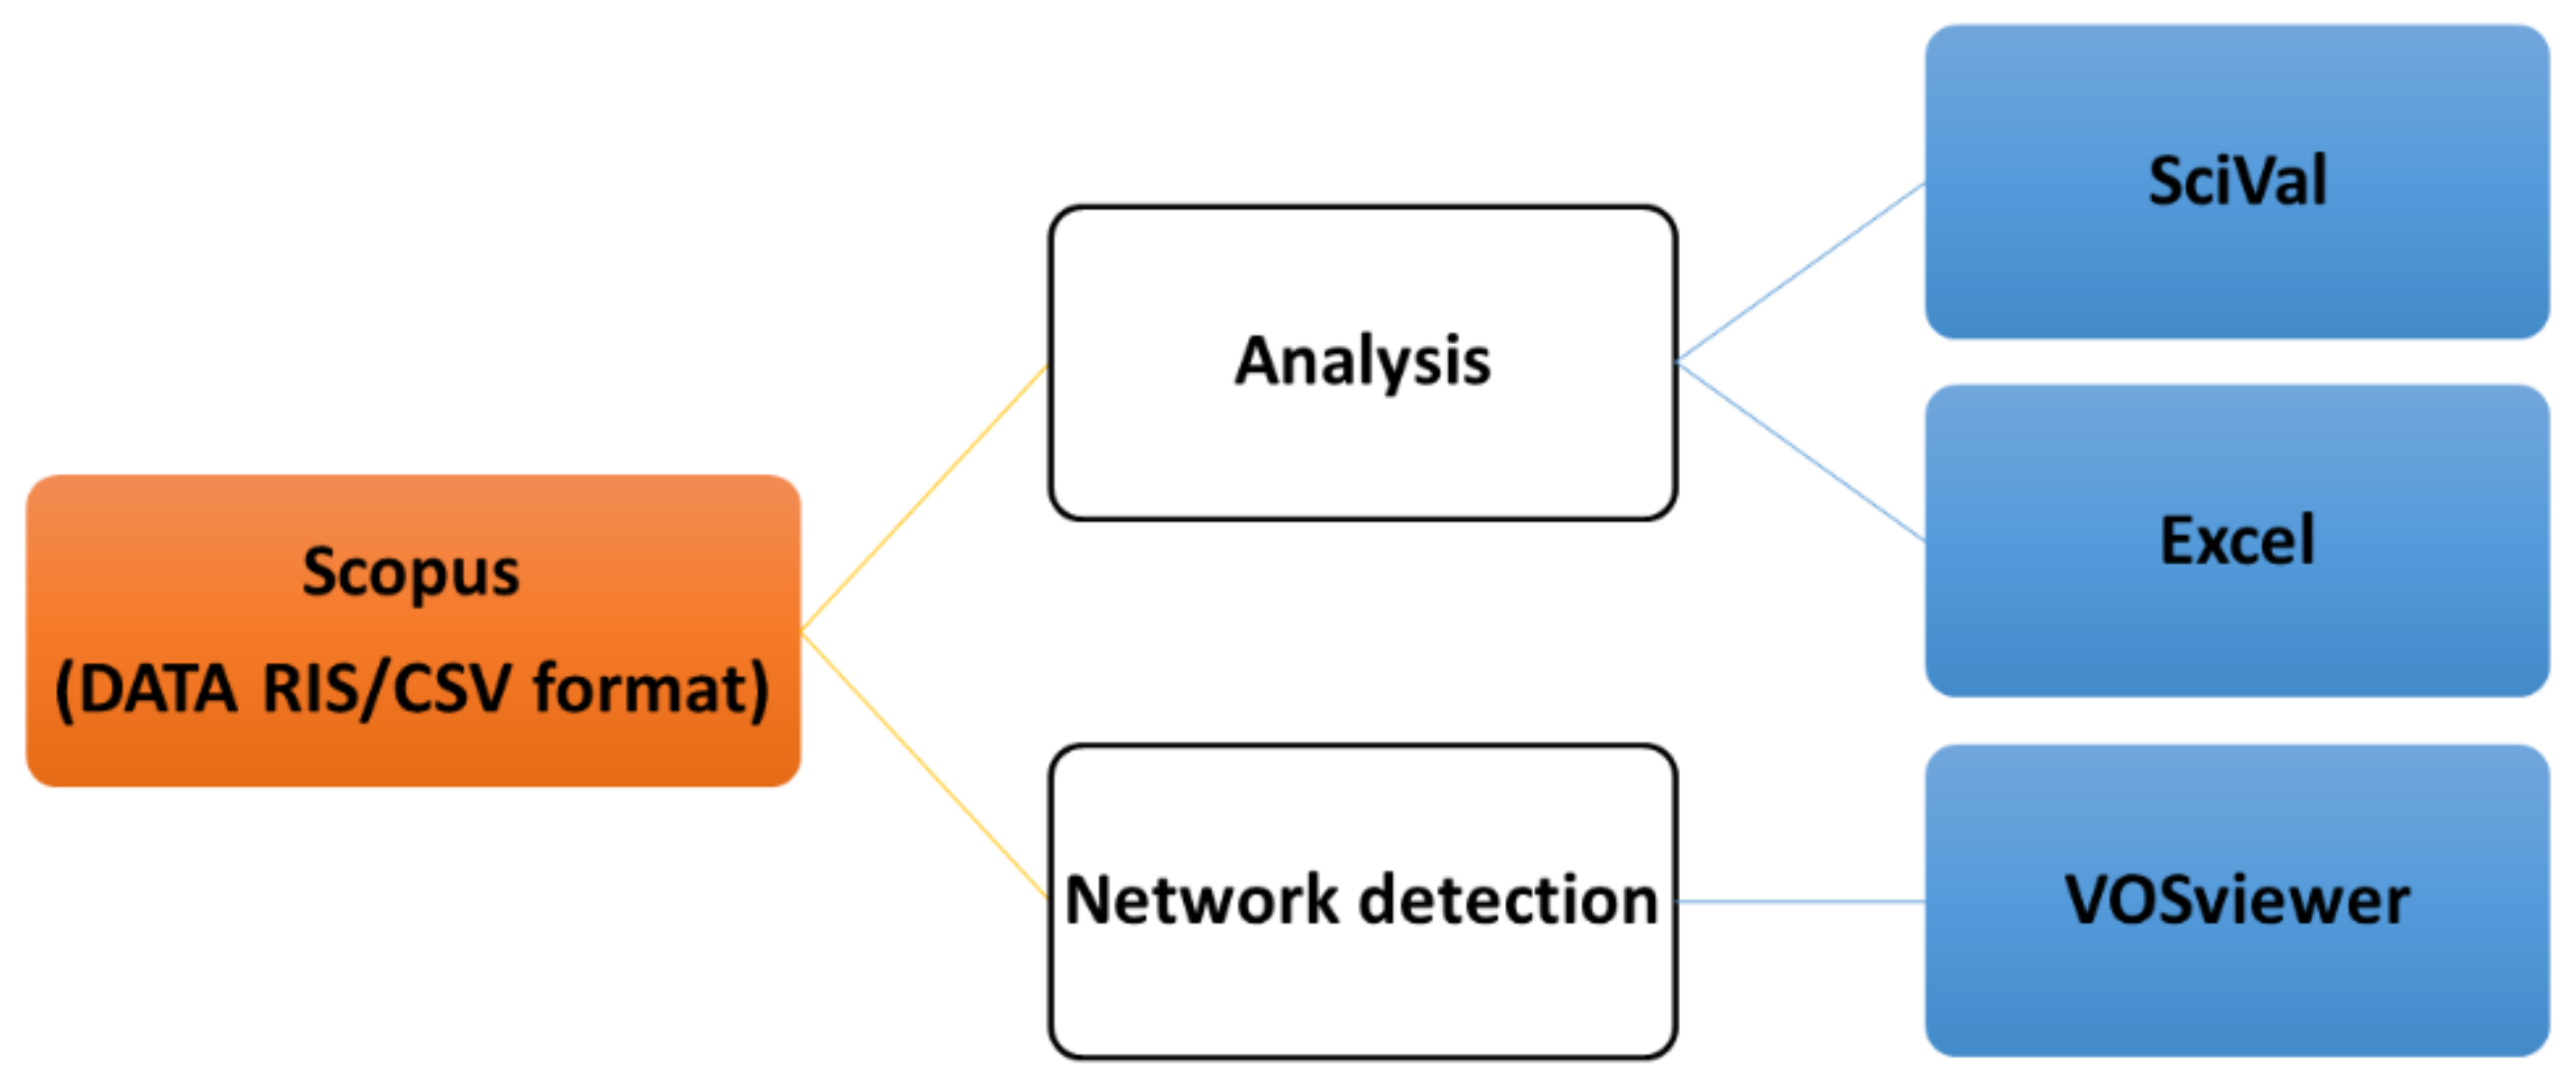
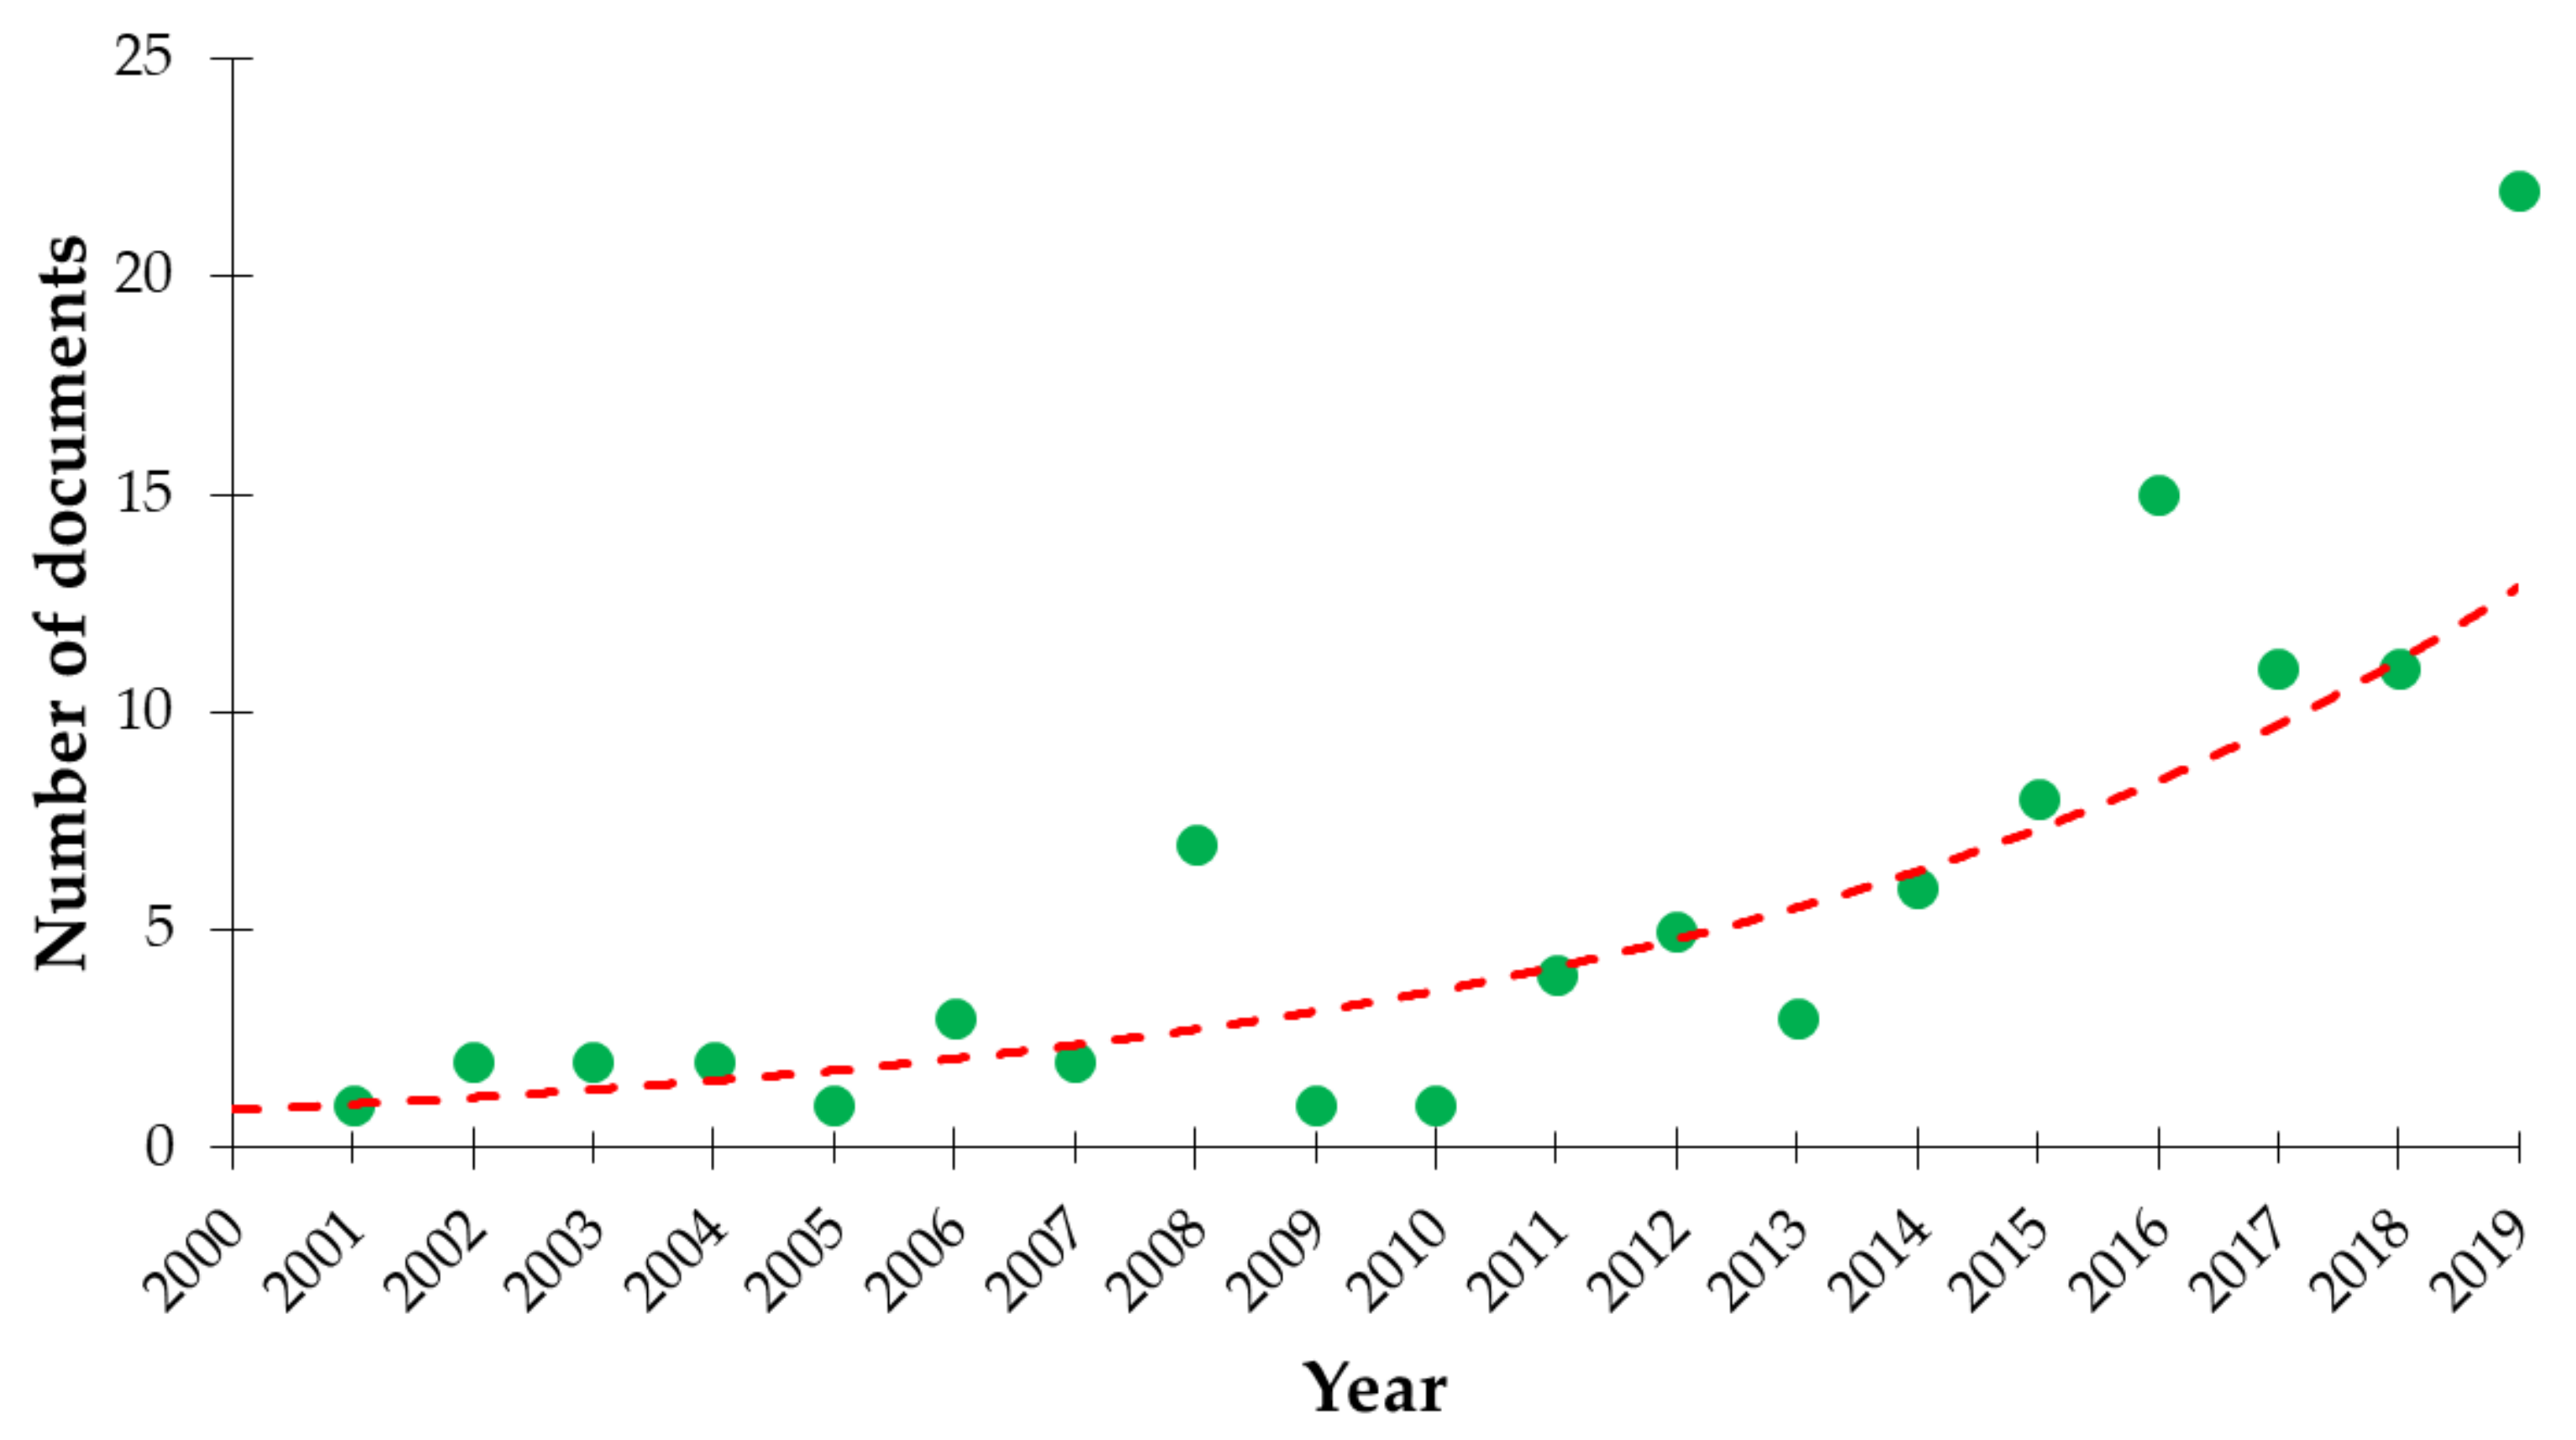
Table 1). In fact, most documents (55.2%) were published in the last four years (2016–2019), while the greatest number of documents were published in 2019 (20.6%). This proves that RSAGPM is an emerging topic in continuous progress that will probably increase its number of publications in the next few years.
Figure 2 depicts how the number of documents published within this thematic field has grown exponentially during the period 2000–2019. This growing interest in this topic is also shown by the increase in the number of authors, journals, and countries. In this sense, the number of authors (AU) increased from just one in 2001 to 94 in 2019. The number of publications in journals (J) (excluding conference papers) also increased from one in 2003 to 18 in 2019, while the number of countries (C) to which their authors belonged rose from one to 23 between 2001 and 2019. In summary, and excluding year-on-year repetitions, 160 authors, 46 Scopus indexed journals and conferences, and 23 countries were involved in the publication of the 107 documents included in the sample, showing the growth of this topic, which is becoming a notable field of research for the remote sensing scientific community. This increasing impact can also be deduced from the up to 1014 references (number of references; NR) cited in the 22 articles published in 2019 and the 1453 total citations (TC) referring to the 107 sample documents accumulated from 2000 to 2019 (
Table 1).
3.3. Subject Categories and Journals/Conferences
The documents published on RSAGPM between 2000 and 2019 were classified into 15 different categories according to the Scopus database, which can be considered a clear indication of the wide interest that this field of research has aroused in the scientific community.
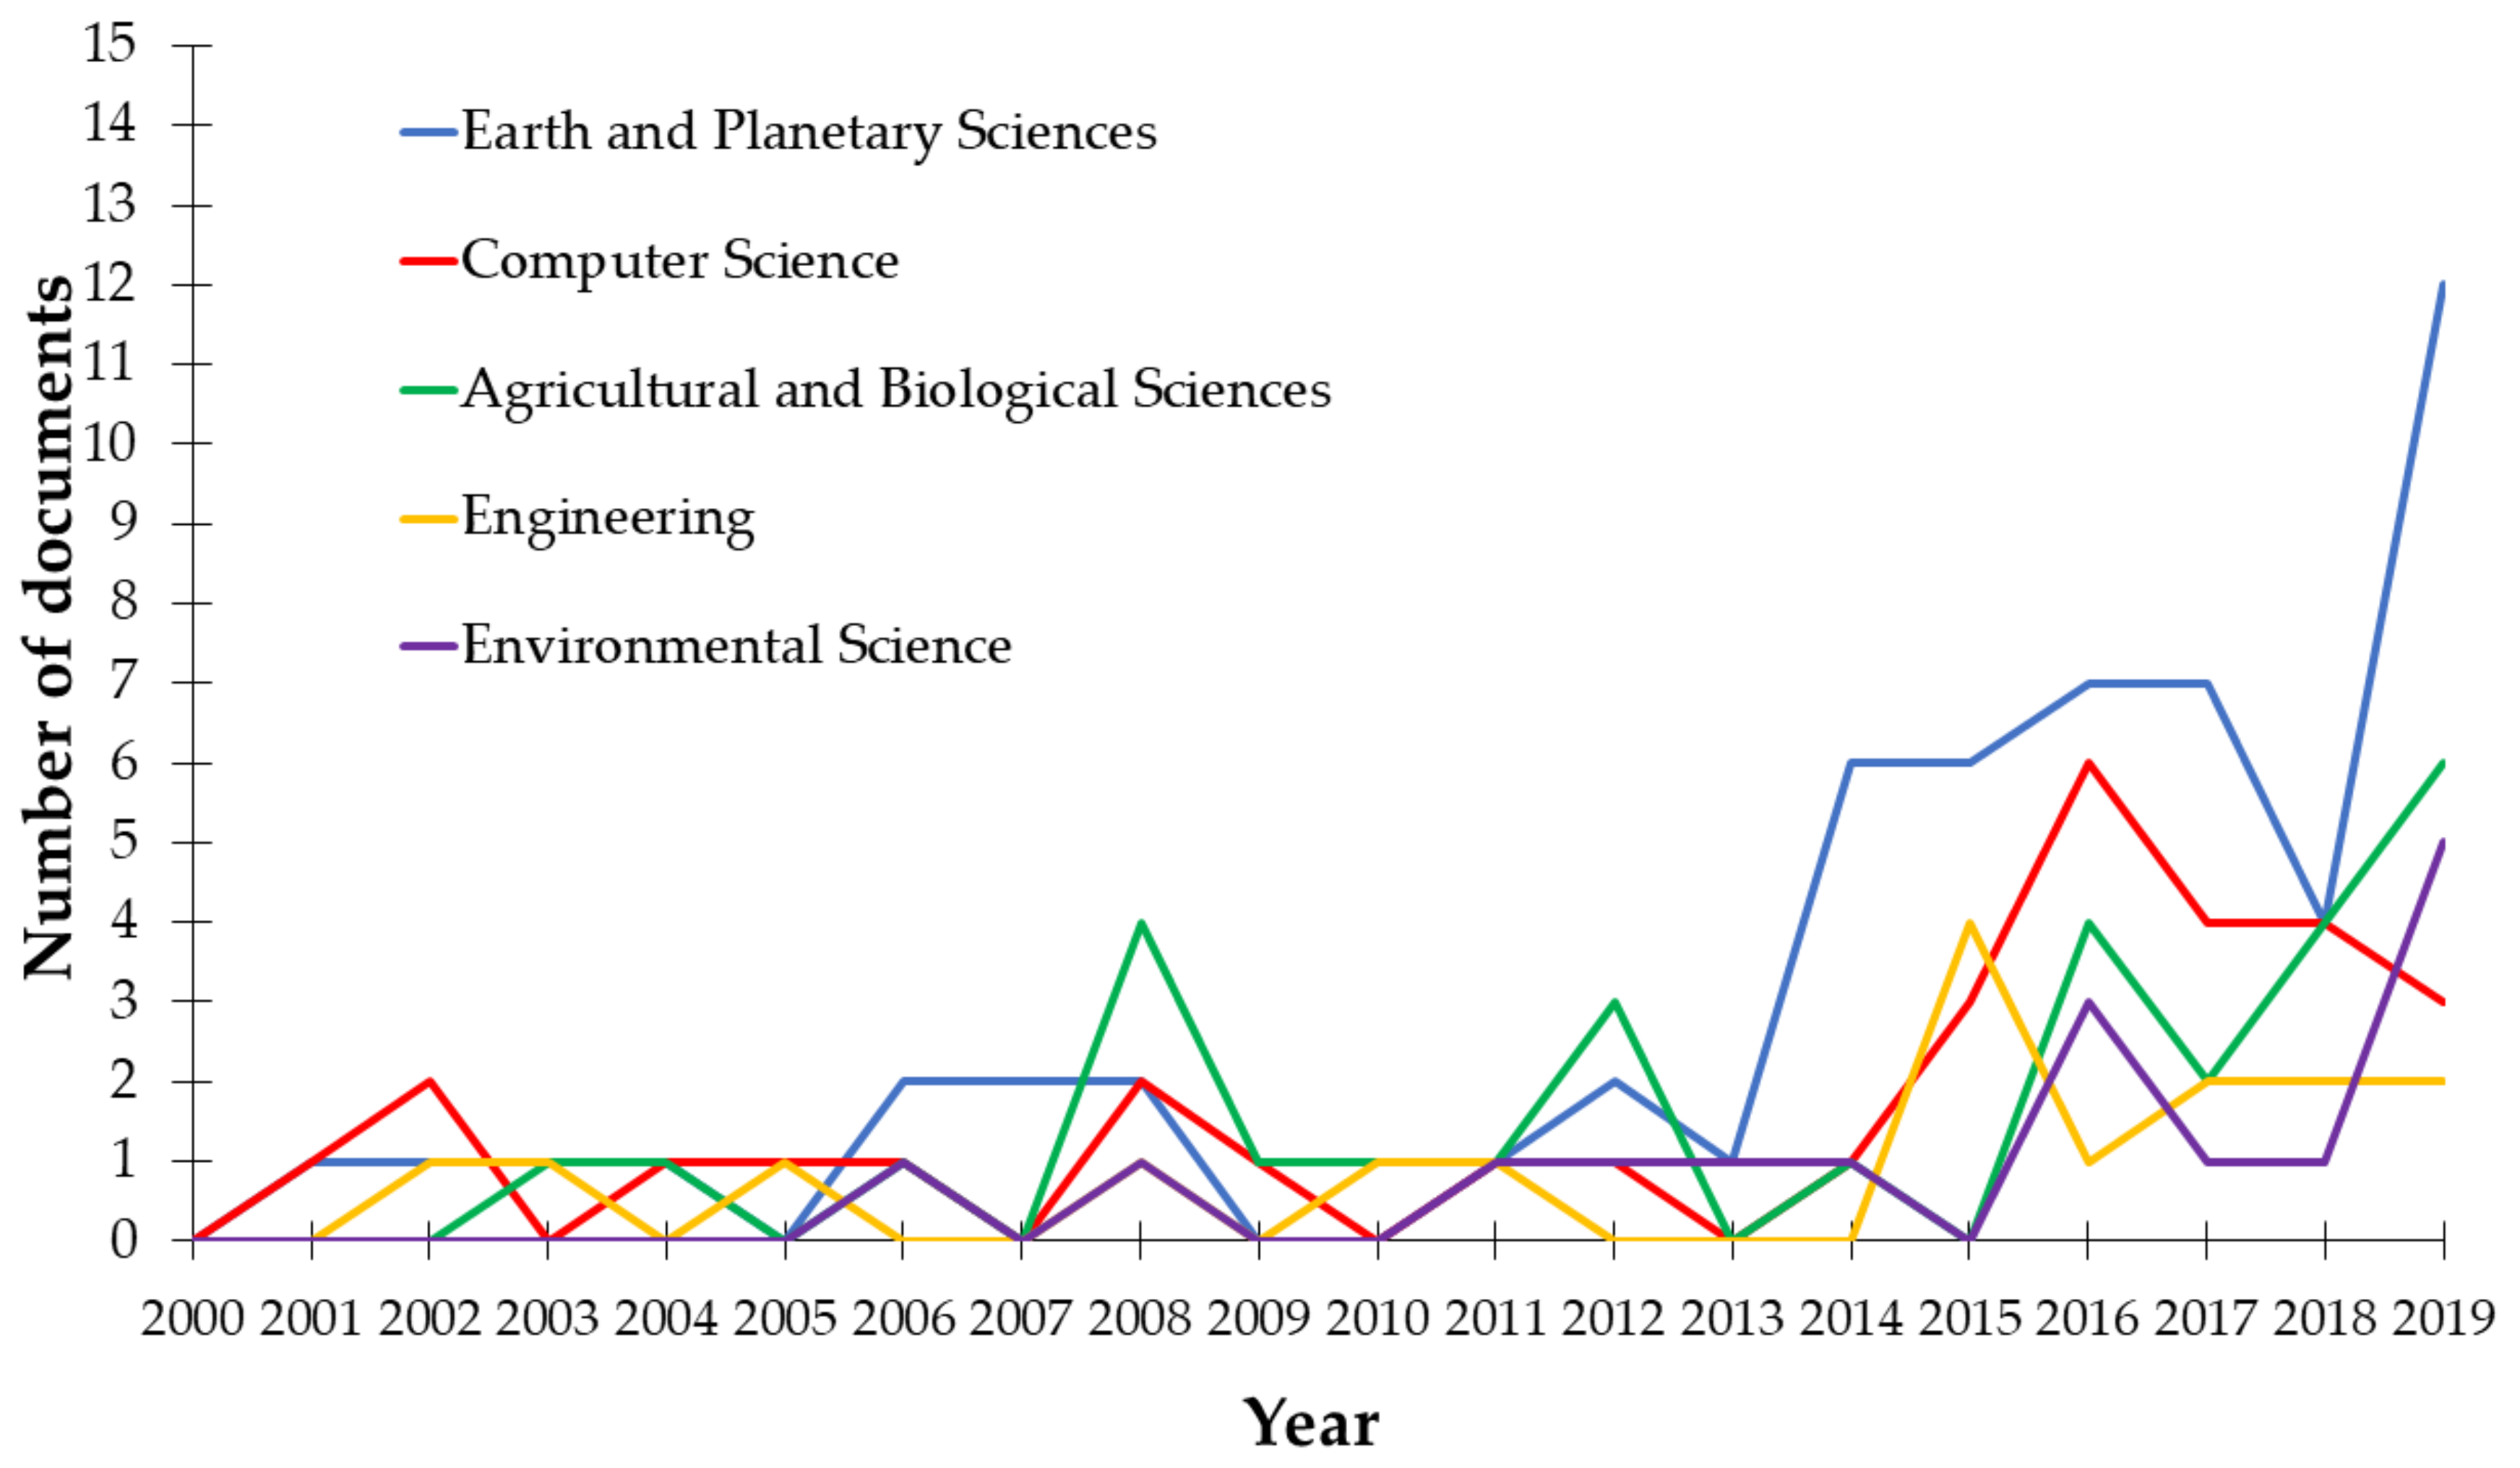
Figure 3 shows the evolution of the principal subject categories into which Scopus classified the 107 documents related to RSAGPM. It is worth noting that each document may be allocated to two or more categories at the same time. In this way, a significant portion of the sample was attributed to three domains, classifying up to 53% of the published documents as Earth and Planetary Sciences, 30% as Computer Science, and 28% as Agricultural and Biological Sciences. The classification was changing between the main categories just at the beginning of the period considered due to the low number of registered publications. However, a more consistent trend is observed at the end of the period, where the three predominant categories stand out along with the emergence of the category of Environmental Science.
The 15 Scopus indexed journals and conferences with the highest number of published works on RSAGPM from 2000 to 2019 are presented in
Table 2. To facilitate the analysis during the period analyzed, five sub-periods of three years were distinguished. The most productive journal in this field was “Remote Sensing”, which was launched in 2009, and it is currently leading the list of the top journals, with 22 documents. The first article in this journal related to RSAGPM (first A in
Table 2) appeared in 2012. However, it did not take the first place in the number of articles published until the last sub-period analyzed. It is also the journal with the most citations. The second journal with the largest number of published articles is “Acta Horticulturae”, which achieved the first position in two sub-periods (2000 to 2003 and 2008 to 2011).
With respect to journal impact indicators, “Remote Sensing” is the journal that accumulated the highest total number of citations on RSAGPM (254), followed by “Institute of Electrical and Electronics Engineers (IEEE) Transactions on Geoscience and Remote Sensing” (186) and “International Society of Photogrammetry and Remote Sensing (ISPRS) Journal of Photogrammetry and Remote Sensing” (145) (
Table 2). This result is clearly associated with the general impact of each journal, with “IEEE Transactions on Geoscience and Remote Sensing” and “ISPRS Journal of Photogrammetry and Remote Sensing” being the journals with the highest numbers of citations per article, with 93 and 72.5 citations per article published on RSAGPM, respectively. This means that these two journals, together with “Landscape and Urban Planning” (44 citations per article), have a great impact on the RSAGPM topic. Note that the number of citations per article is closely related to the age of publication, it being more likely that an article accumulates more citations as more time passes after its publication.
Regarding quality indices (
Table 2), “ISPRS Journal of Photogrammetry and Remote Sensing” was the journal that published articles on RSAGPM with the highest SJR index (3.122), followed by “IEEE Transactions on Geoscience and Remote Sensing” (2.616). Furthermore, most of the documents on RSAGPM were found to be situated within the first quartile according to their SJR (2019 SJR edition) index, which demonstrates the high quality of international journals covering this emerging topic. It is necessary to recall that an SJR index of 1.0 means that a journal’s articles are cited at the average rate for all journals in the same subject area, while an SJR index over 1.0 indicates more citations than average in the field and vice versa. An SJR index of more than 1.5 generally indicates a very well-cited journal.
With respect to the h-index (2019 SJR edition), “IEEE Transactions on Geoscience and Remote Sensing” presents the highest value (236), followed by “International Journal of Remote Sensing” (164) and “Proceedings of SPIE - The International Society for Optical Engineering” (162). In this case, prestigious journals such as “Landscape and Urban Planning” (149) and “ISPRS Journal of Photogrammetry and Remote Sensing” (126) are one step below. Note that journals that started recently have not accumulated enough citations to increase their h-index yet (this may be the case for the journal “Remote Sensing”), as an article will not generate a number of citations until some years after publication. In this sense, Hirsch [
49] estimates that, after 20 years of research, an h-index of 20 is good, 40 is outstanding, and 60 is truly exceptional.
It should be noted that just five journals are from the USA, publishing altogether around 13% of the total documents on RSAGPM. The remaining journals are from Europe (four of them from the Netherlands), and together they have published around 53% of RSAGPM documents.
3.4. Countries, Institutions, and Authors
The topic analyzed in this work has been investigated by researchers belonging to up to 23 countries, proving again the great interest that RSAGPM has attracted worldwide (
Table 3). In this analysis, each of the authors who appear in the documents has been considered. In this way, the same document can be assigned to more than one country if the authors are of different nationalities (i.e., international collaboration). China ranked first, followed by Italy and Spain, which published more than 20 publications each in the period analyzed. It should be noted that 75% of the publications in China were published in the last sub-period analyzed.
Table 3 also shows the number of documents published per million inhabitants of each country (APC). If this variable is considered, Spain ranks first, practically tied with Italy, also having the largest number of total citations, followed by Italy and China. However, considering the number of citations per publication, the Netherlands took first place, with 89.5 citations per publication, followed by Spain (20.58) and Italy (16.2).
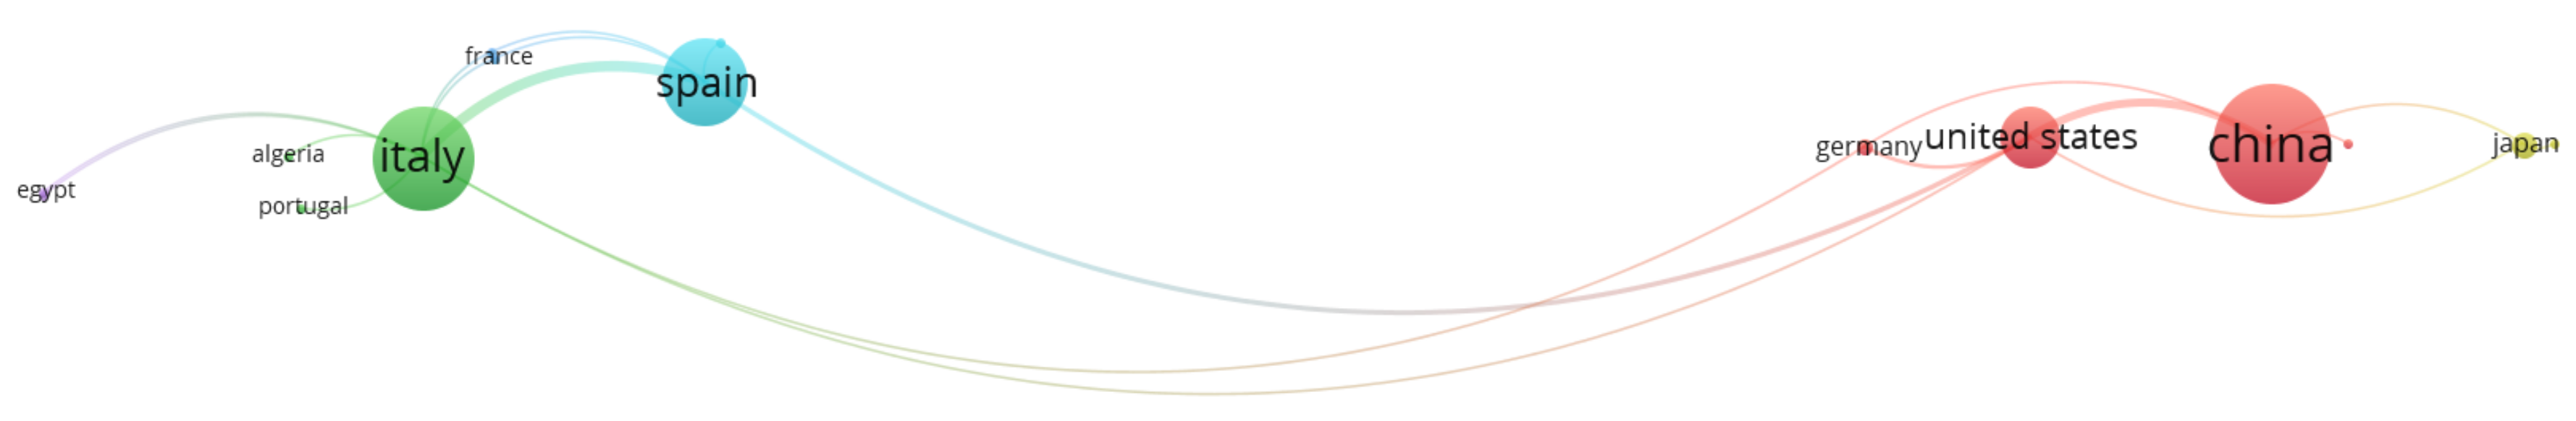
Figure 4 shows a network illustrating the international collaboration between publishing countries on RSAGPM. The size of each circle has been scaled with the number of publications of each country, while the thickness of each line joining two countries represents the number of collaborations between them. The assigned color allows us to distinguish the different groups formed by sets of countries (network cluster). As can be seen in
Figure 4, three main clusters can be differentiated. The first cluster (red) is led by China, the most productive country. The second cluster (green) is headed by Italy, while the third (blue) is led by Spain, which presents a strong collaboration with Italy.
Table 4 presents data regarding the international collaborations of the most productive countries regarding the RSAGPM topic. The parameters shown refer to the percentage of publications that each country produced in collaboration with another (IC), the number of countries with which such collaborations occurred (NC), and the main collaborating countries. In this regard, Germany only published documents produced in collaboration with other countries. The United States produced up to 80% of their documents in collaboration with other countries, although Italy was determined to be the country with the largest number of collaborations (nine countries). On the contrary, both Turkey and the Netherlands did not show collaborations with other countries in the RSAGPM research area between 2000 and 2019.
The main production and impact indicators of the institutions with the highest number of publications on RSAGPM are depicted in
Table 5. Note that some publications were authored by researchers belonging to different countries and institutions. Therefore, the total number of publications by country/institution in
Table 5 is greater than the number of publications in the sample (107). The University of Almeria is in first place, with a total of 23 documents published between 2000 and 2019. It is followed by Zhejiang University, with 11 documents, while the Chinese Academy of Sciences, the Polytechnic of Bari, and the Chinese Academy of Agricultural Sciences contributed 10 publications each. With respect to the total number of citations, the University of Almeria had 452 citations, followed by Zhejiang University with 192, the Polytechnic of Bari with 189, and the University of Basilicata with 116.
When considering the average number of citations per publication, the Nederlandse Organisatie voor toegepast natuurwetenschappelijk onderzoek (TNO) (Netherlands) ranked first, with 89.5 citations per document, although it does not appear in
Table 5 because it only published two articles in the period analyzed. George Mason University took the second position, with 20.5 citations per publication, while the University of Maryland, also absent in
Table 5 as it had only two publications, had the third position, with 20 citations per document. Both universities were closely followed by the University of Almeria and the University of Basilicata, which scored 19.65 and 19.33 citations per article, respectively. It was observed that there are some institutions that only had publications in international collaborations, as is the case of Ohio State University, not counting a research group specifically focused on RSAGPM.
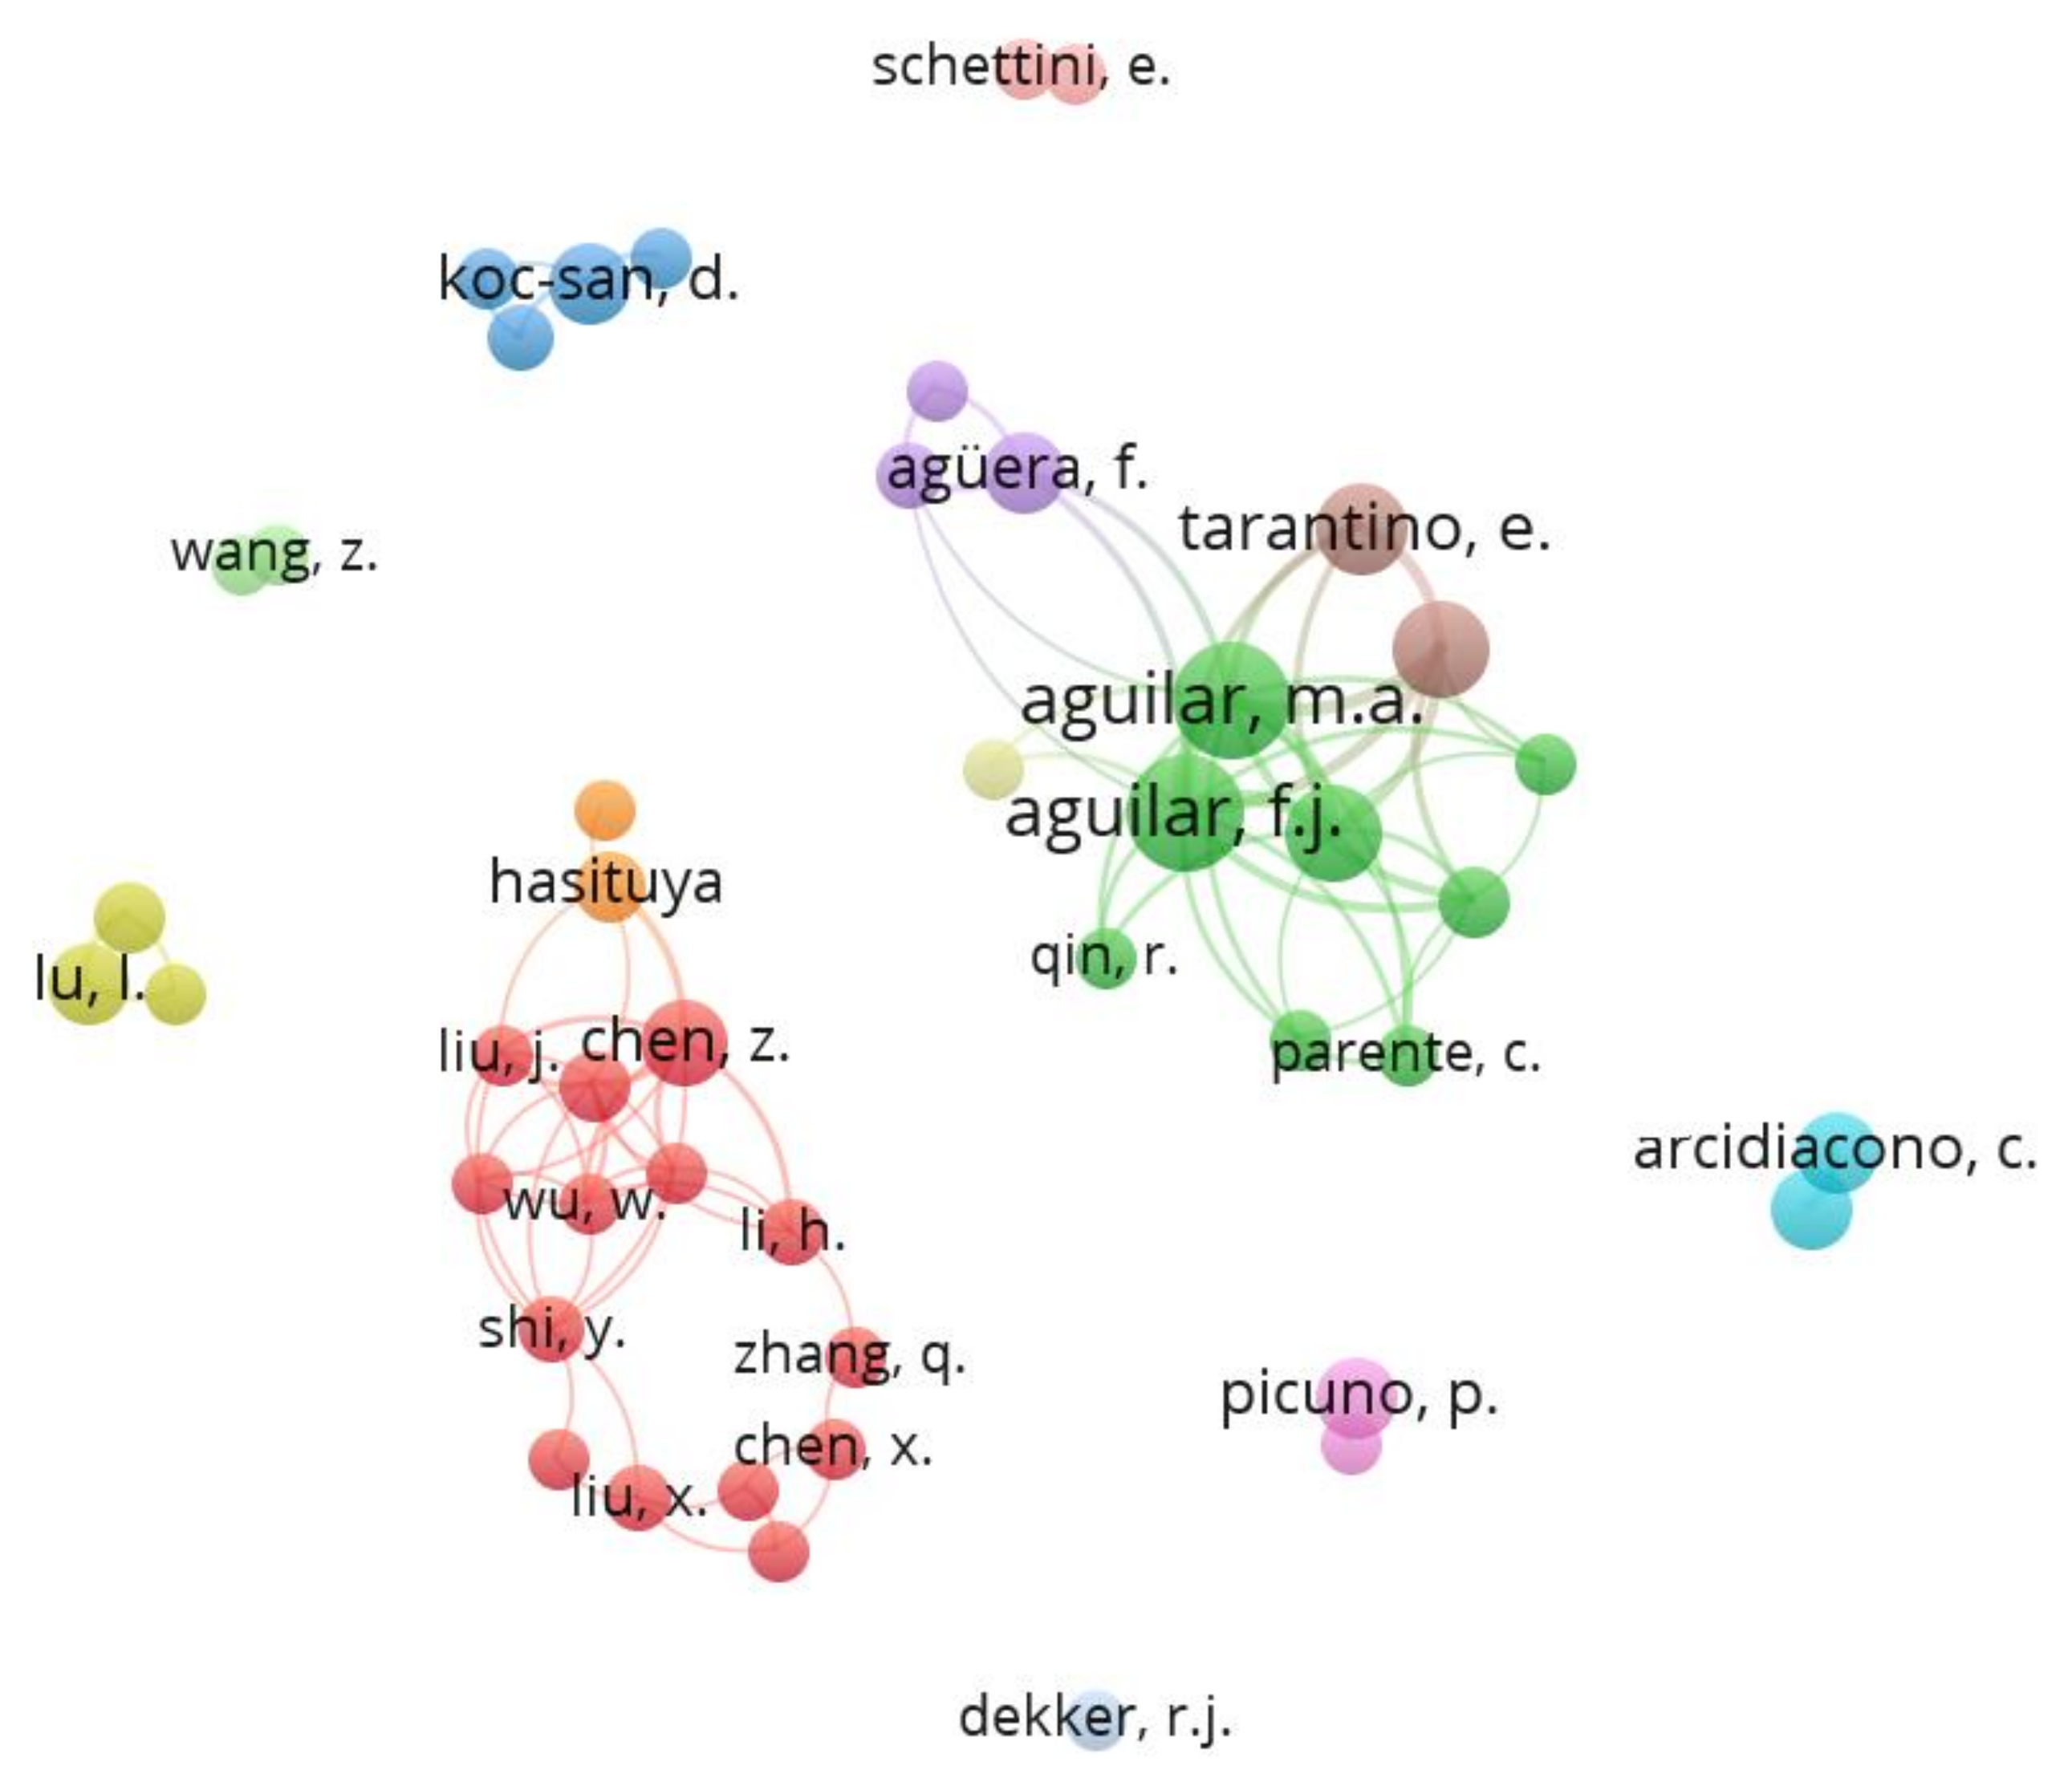
Figure 5 shows a network map illustrating collaborative co-authorship on RSAGPM from 2000 to 2019, where the different colors represent the clusters made up of different authors who usually collaborate with each other. From the obtained results, the most interrelated co-authorships are shown. Although several clusters are observed, mainly two can be pointed out. One is made up of mainly Chinese authors and the other is composed of Spanish and Italian authors. In this sense, it can be stated that these are the two more relevant research groups currently working on RSAGPM around the world. In addition, a highly complex and atomized collaboration network is observed within them.
Table 6 includes the most productive authors within the topic analyzed in this work, showing the main variables related to production (A) and the impact of their publications (TC). In addition, it depicts some reference data related to the author’s affiliation, country (C), year of their first publication (First P), and last publication on RSAGPM (Last P). The first three authors of the list belong to the University of Almeria, with more than 10 publications each. All authors listed in
Table 6 come from the five most productive countries (
Table 3) and they represent up to 11 different institutions. The author with the most publications in the list is Aguilar, M.A. [
22] from Spain. All authors listed in
Table 6 published their last document on RSAGPM between 2016 and 2019, indicating that they continue to work on this topic. The only exception is the case of Porto, S.M.C., whose last article is dated 2012.
3.5. Keyword Analysis
The 18 most frequently used keywords in publications on RSAGPM are displayed in
Table 7 for the period analyzed in this work. The period was conveniently divided into five sub-periods to study the evolution of keywords. The data shown in
Table 7 refer to the position that keywords occupied in each sub-period compared with the total number of keywords of the sample, the number of publications in which it appeared (R (A)), and the repetition percentage (%). As expected, the terms most recurrent during the entire study period were “Remote Sensing” and “Greenhouse/Greenhouses”. These keywords also took the first positions in the ranking by sub-period.
“Remote Sensing” and “Agriculture” were the most repeated keywords from the list in the 2000–2003 sub-period. In this first period, research was mainly oriented towards the territorial development of plastic-covered crops. During the second period (2004–2007), research preferences for keywords changed slightly. Although “Remote Sensing” continued to occupy the first position in the ranking, keywords that refer to “Image Analysis” and “Crops” emerged, displacing the keyword “Greenhouse” from the first position. The periods 2008–2011 and 2012–2015 represented a shift towards the current configuration of the keyword research framework. In fact, the “Satellite Imagery” keyword, along with related terms like “Landsat” and “Image Classification”, managed to climb to fifth place in the ranking. Furthermore, the term “Greenhouse” clearly confirmed its main role for the RSAGPM topic. The last period, 2016–2019, maintained the marked trend established during the two previous sub-periods. In this way, the final classification was configured in a similar way to that offered by the set of the last sub-periods due to an increasing number of publications and, consequently, to the increase in the number of keywords used.
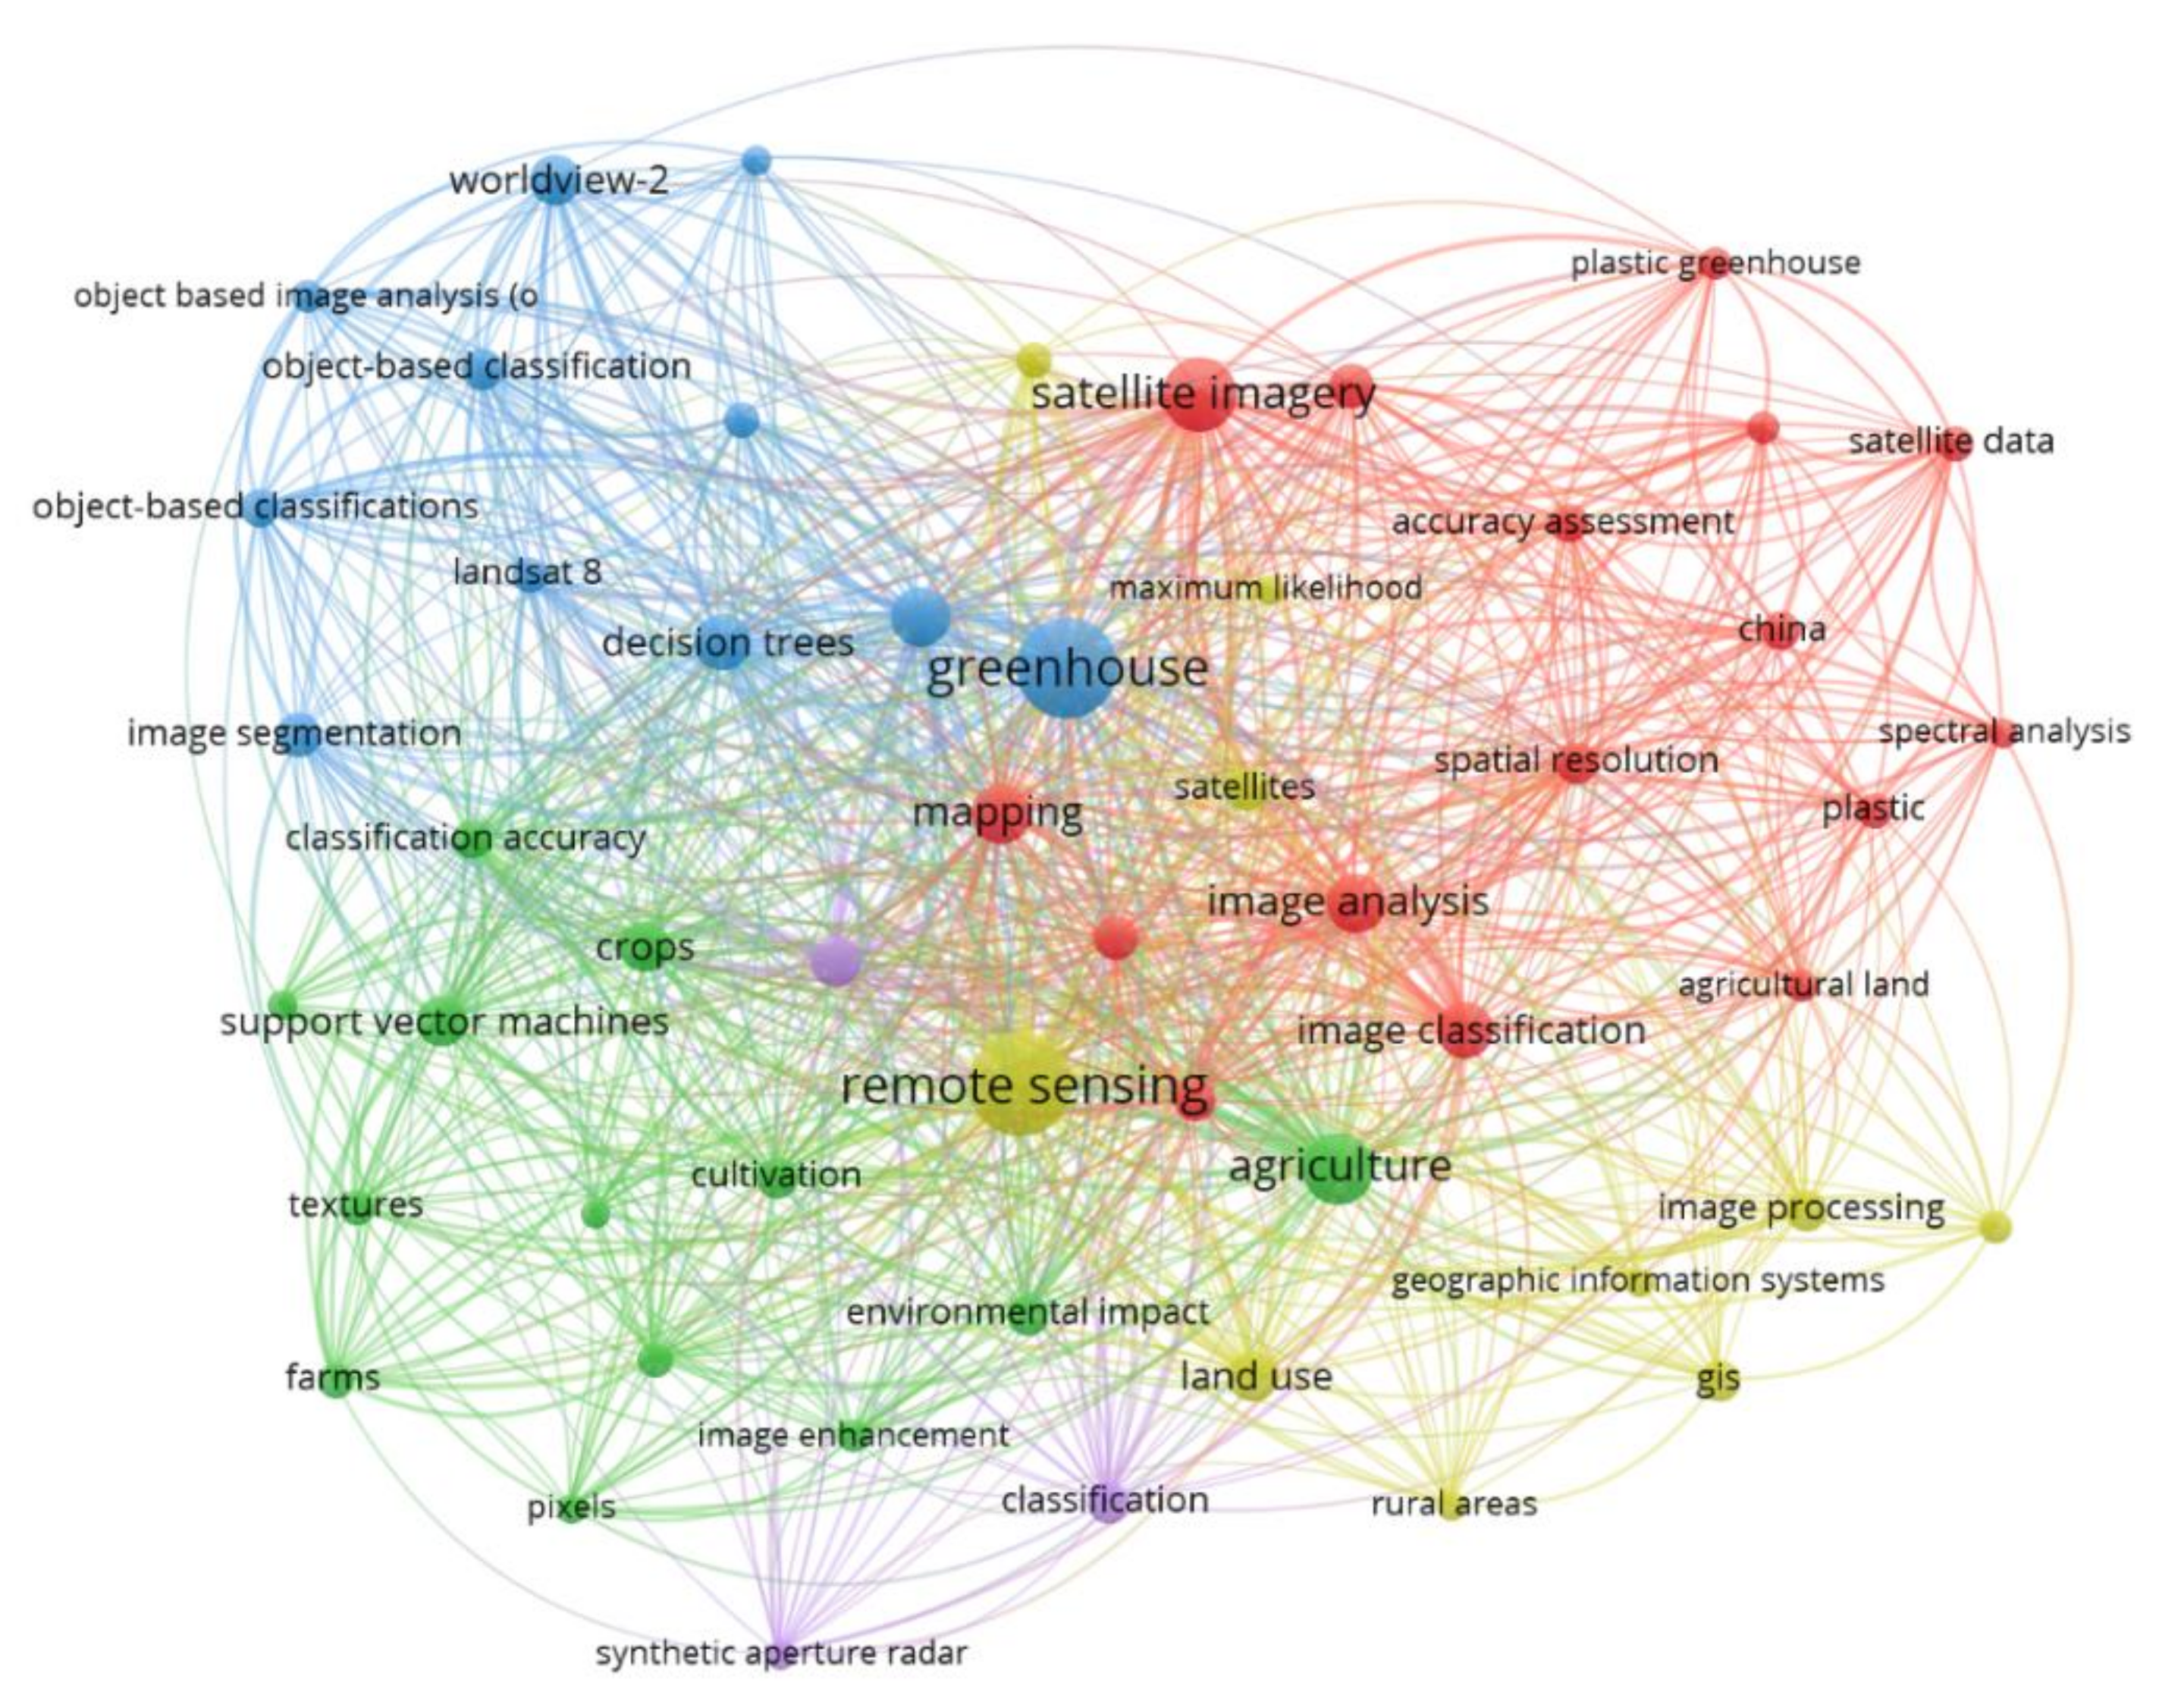
Figure 6 shows the network map that links the keywords to the entire sample of the publications analyzed. The size of the circle represents the number of publications in which each keyword appears, and the color represents the cluster in which the keyword is included according to the number of co-appearances. The first cluster (light brown) falls under the term “Remote Sensing”. It is also the cluster with the highest number of connections. The second group (blue) has “Greenhouse” as its main keyword, representing the productive agrosystem in which the analyzed topic focuses (intensive crop production). In the third group (red), the most frequent terms are “Satellite Imagery”, “Image Analysis”, “Mapping”, and “Image Classification”, which represent the most frequent tools (image analysis/classification from satellite imagery for mapping greenhouses) used to carry out the extraction and analysis of significant information from remote sensing data on the topic studied. The other colored clusters mainly refer to different methodologies for analyzing image data (e.g., “Object-based image analysis”); thus, they have less representation in
Figure 6.
4. Discussion
The aim of this study was to carry out a rigorous bibliometric analysis to provide quantitative data about the status of international research on RSAGPM throughout the 21st century based on objective indicators such as (i) evolution of scientific production, (ii) main actors involved (research groups, institutions, and countries), (iii) information dissemination and search tools (Scopus-indexed journals/conferences and keywords), (iv) scientific impact (citations, h-index), and (v) scientific collaboration networks. Note that bibliometric methods are now firmly established as scientific specialties and are an integral part of the research evaluation methodology, especially within the scientific and applied fields [
56]. In this way, this approach should not be confused with a review article, as the latter tries to summarize critically selected scientific content by using an extensive bibliography of the field. In contrast, a bibliometric analysis focuses on statistical related data, being driven by a need to evaluate scientific production and make the results available to researchers, policymakers, or other stakeholders [
56].
Regarding the limitations of the current study, the subject analyzed has proven to be an incipient research discipline within remote sensing. In fact, scientific production has only increased remarkably during the last five years, and the number of indexed Scopus documents registered during the 21st century can be considered very low (107 documents including conference papers). It is worth noting that citations not only take time to accumulate but also continue to accumulate over time [
57]. Some studies have shown that documents need at least two to three years after publication to accumulate enough citations for bibliometric indicators to be reliable [
58,
59]. In this sense, the pioneering countries on the topic of RSAGPM, such as Spain and Italy, with more than 450 citations each and only a few institutions involved (only the University of Almería in Spain and four institutions in Italy), formed the core of the topic for some years. Later, China was added, although it broke in strongly, having currently accumulated almost 450 citations and up to eight institutions among the 16 most productive institutions in the world.
What are the reasons behind the rise in scientific publications on RSAGPM in recent years? Without a doubt, plastic-covered agriculture has represented a great shift in the evolution from traditional agriculture to industrial agriculture. At the same time, there has been a growing awareness throughout the 21st century about its environmental impact associated with the generation of plastic waste, soil contamination, visual impact, degradation of biodiversity, and alteration of local runoff, among others. In addition, it is urgent to understand the climate–water–energy–food (CWEF) nexus and rationalize water-related policies in a scenario in which the demand for water, energy, and food will grow by approximately 40%, 50%, and 35%, respectively, by 2030, due to expanding world population and consumption patterns [
60]. Specific CWEF nexus policies are urgently needed for the sustainable management of resources and the creation of new synergies between nexus actors through water diplomacy. Such policies are important to avoid competition for natural resources and the resulting negative effects on ecosystems and their services [
61]. In this context, plastic-covered agriculture (food component) will play a relevant role, and a growing demand is anticipated to develop efficient and precise mapping and monitoring tools to determine the spatio-temporal locations of production/consumption units (e.g., greenhouse structures and associated crops). Since conventional methods for the development of inventories of production units based on in situ studies (ground-monitoring) are expensive and inefficient, they are being replaced by semi-automatic methods based on machine learning technology applied to geo-referenced digital information commonly extracted from the growing industry of satellite imagery [
17,
19].
With respect to detected research trends on the topic, many researchers have tried to improve the accuracy of PCG and PMF mapping by applying both PB and OBIA supervised classification algorithms to high and medium resolution satellite imagery and by means of both static and multitemporal approaches, reporting overall accuracy ranging between 85% and 98%. OBIA usually provides better accuracy results than PB, while time series approaches frequently overcome those based on mono-temporal data, although the accuracy results turn out to be highly dependent on the arrangement of each study site and the characteristics (e.g., radiometry, off-nadir angle, sun position) of the data sources.
In the next few years, we foresee a trend towards research lines in RSAGPM related to combining data from different remote sensors (e.g., optical imagery, SAR, LiDAR, and hyperspectral) and even detecting and classifying under greenhouse crops. Very recently, Nemmaoui et al. [
62] carried out a pioneering work based on an OBIA approach, DT classifier, and time series of Landsat-8 and Sentinel-2 images, which dealt not only with mapping PCG but also identifying under greenhouse horticultural crops in Southern Spain. The segmentation stage was carried out by applying a multi-resolution segmentation algorithm [
63] on preprocessed WV2 data. They attained an overall accuracy figure of 93.97% in extracting PCG. With regard to the classification of crops under PCG, pepper in autumn and melon and watermelon in spring provided the best results (F
β around 84% and 95%, respectively). In this case, it was crucial to count on time series satellite images throughout the different growing seasons to increase the stability and robustness of the DT model developed, which is currently favored by the combination of data from Sentinel-2 (2A/2B) and Landsat-8 that provide a global average revisit interval of 2.9 days [
64] and reasonable consistency regarding the similarity between their multiband surface reflectance over PCG land cover [
65].
With few exceptions focused on PMF land cover extraction [
31,
42,
66], SAR data has been practically not used as a data source for PCG mapping. However, with the very recent arrival of very high spatio-temporal resolution SAR data provided by the new generation of small satellites (e.g., ICEYE SAR (
https://www.iceye.com/)), with X-band radar imaging available even at a 1 m ground sample distance resolution [
67], it is likely that there will be a need to test its promising potential in RSAGPM. Further work is needed in order to understand the physical aspects of the interaction between microwaves and plastic film sheets.
Deep learning technology has recently demonstrated that it can be applied to crop-type mapping, obtaining even better performance than object-oriented machine learning methods when dealing with remote sensing image classification problems [
68,
69]. However, to the best of our knowledge, only one report has been published in which a deep learning Single Shot MultiBox Detector (SSD) was applied to detect agricultural greenhouses using images from GaoFen series satellites [
70]. Therefore, much remains to be done in this field, especially with regards to greenhouse crop detection from high resolution time series imagery taken throughout the growing season.
In the same way, the rise of the new breed of very high resolution optical satellites allows us to obtain stereo images for the extraction of digital surface models (DSM) with reasonable altimetric accuracy using automatic correlation photogrammetric procedures [
71]. Although few works have specifically focused on PCG areas [
40,
72,
73], Aguilar et al. [
40] and Celik and Koc-San [
74] proved the importance of integrating the normalized digital surface model (nDSM) for improving PCG mapping accuracy.
Finally, from our point of view, it would be necessary to go a step further by delving into the physical phenomenon of the transmittance of electromagnetic radiation through the plastic cover and of the reflectance that actually reaches the remote sensor after passing through the plastic film, depending on real field conditions such as plastic film type and thickness, age of and dirt on the plastic sheet, roof geometry, presence of double plastic cover, crop management, and crop development and phenology.
5. Conclusions
The results obtained in this work showed that the selected scientific communications were mostly published in articles (66%) and conference papers (32%), being predominantly published in English (95%). The results of the bibliometric analysis indicated that the number of articles per year increased exponentially, growing from one document published in 2001 to 22 in 2019. There was a particularly strong increase in the last four years, in which more than 55% of all documents were published.
The main categories with respect to the analyzed topic were Earth and Planetary Sciences (53%), Computer Science (30%), and Agricultural and Biological Sciences (28%). The results obtained point to an increasing number of journals that publish research on RSAGPM, highlighting the “Remote Sensing” journal, with 22 articles published since its appearance in 2009.
The country with the highest number of documents published was China, while the University of Almeria (Spain) was the top institution in RSAGPM research, showing close collaboration with some Italian universities. In fact, China and Spain/Italy were the two main clusters worldwide producing research on RSAGPM, which is strongly correlated with the extent and economic importance of this kind of intensive agrosystem in China and the Mediterranean countries.
In summary, the evolution of the number of publications on RSAGPM found throughout the period 2000–2019 allows the classification of the subject studied as an emerging research topic that is attracting an increasing level of interest worldwide, although its relative significance is still very limited within the remote sensing discipline. Nevertheless, the growing demand for information on the arrangement and spatio-temporal dynamics of this increasingly important model of intensive agriculture will likely boost this research line in the next few years.


