1. Introduction
Increased regulatory control of waste, which is partly due to a heightened public sense of sustainable development, has created the conditions whereby waste crime operates alongside a legitimate waste sector [
1]. Such environmental crime exploits the physical characteristics of waste, taking advantage of vulnerabilities in regulation enforcement, the complexity of its downstream infrastructure, and market opportunities for profit; therefore, legitimate economies are short-changed through the unlawful and often dangerous disposal and storage of waste. While this is a widespread issue that covers all manner of waste material, tyres and plastics are of particular concern.
Stockpiles of waste tyres have been identified as a significant danger to both human and environmental health [
1]. More than one billion tyres are estimated to exist in poorly managed or unmanaged stockpiles across Europe, posing several serious risks [
2]. While tyres are challenging to ignite, once lit, they have the potential to burn for months or years. The fire itself not only provides a serious threat but may also contaminate food and water supplies through the distribution of partially combusted hydrocarbon. In 1989, an arson attack on the Heyope Tyre Dump in Powys, Wales, led to a record burn time with the nine million tyres located at the dump emitting a measurable heat signature until 2003 and 2004 [
3,
4]. Similar cases have also been recorded on a global scale, e.g., Rhinehart, USA, 1983 [
5]; Westly, USA, 1999 [
5]; Watertown USA, 2005 [
6]; Fforestfach, Wales, 2011 [
7]; and Sulaibiya, Kuwait, 2012 [
8]. In addition to the potential fire risks from stockpiled tyres, if intact waste tyres are stored improperly, they may also provide a habitat for several disease vectors such as the West Nile virus, encephalitis, and dengue fever [
9,
10]. Such risks, alongside the longevity of tyres, highlights the importance of efficient waste management of the material.
Due to its lightweight and versatile structure, plastics have become a staple of modern life, with an estimated 60 million tonnes of plastic used every year across Europe [
11]. Used for purposes ranging from packaging to construction, and across a wide range of industries, plastic waste presents a serious threat to environmental health because the materials are non-biodegradable. Additional concerns have arisen in recent years with regard to waste materials being wrapped in plastics and disguised as other forms of legal waste such as silage bales, which increases the difficulty of illegal waste detection and regulation enforcement [
12,
13].
With increased pressure on governing bodies to combat pollution and harmful environmental practices, the European Union has outlined a strategy for becoming a resource-efficient and competitive low-carbon economy in its “living well, within the means of our planet” proposal [
14]. As part of its aim to become “the most resource-efficient economy in the world,” an innovative partnership was formed in 2014 through the LIFE SMART Waste (LSW) project, to establish novel ways of understanding, tackling and reducing waste-crime [
15]. Due to the varied ways in which waste is handled by operators and the scale needed to efficiently monitor waste crime at national and international levels, many attempts to develop an accurate, prompt, and cost-effective detection methodology have proven challenging. However, thanks to more recent advances in data quality and increases in accessibility, previously less-applied methods that utilise satellite remote sensing now offer a viable solution to the problem of waste crime.
The overall objective of this study was to develop an accurate classification method for both tyre and plastic waste in order to provide a viable platform for repeatable, cost-effective, and large-scale monitoring. More specifically, this study assessed the suitability of a Sentinel-1 and -2 synergy product for waste detection and evaluate the use of random forests (RF) as a classification tool for tyres and plastics. The fusion of Sentinel-1 and -2 for land cover mapping provides the combined spectral and structural characteristics of the land surface, with the results often having a higher accuracy than using either of the datasets individually [
16].
2. Materials and Methods
2.1. Study Region and Data
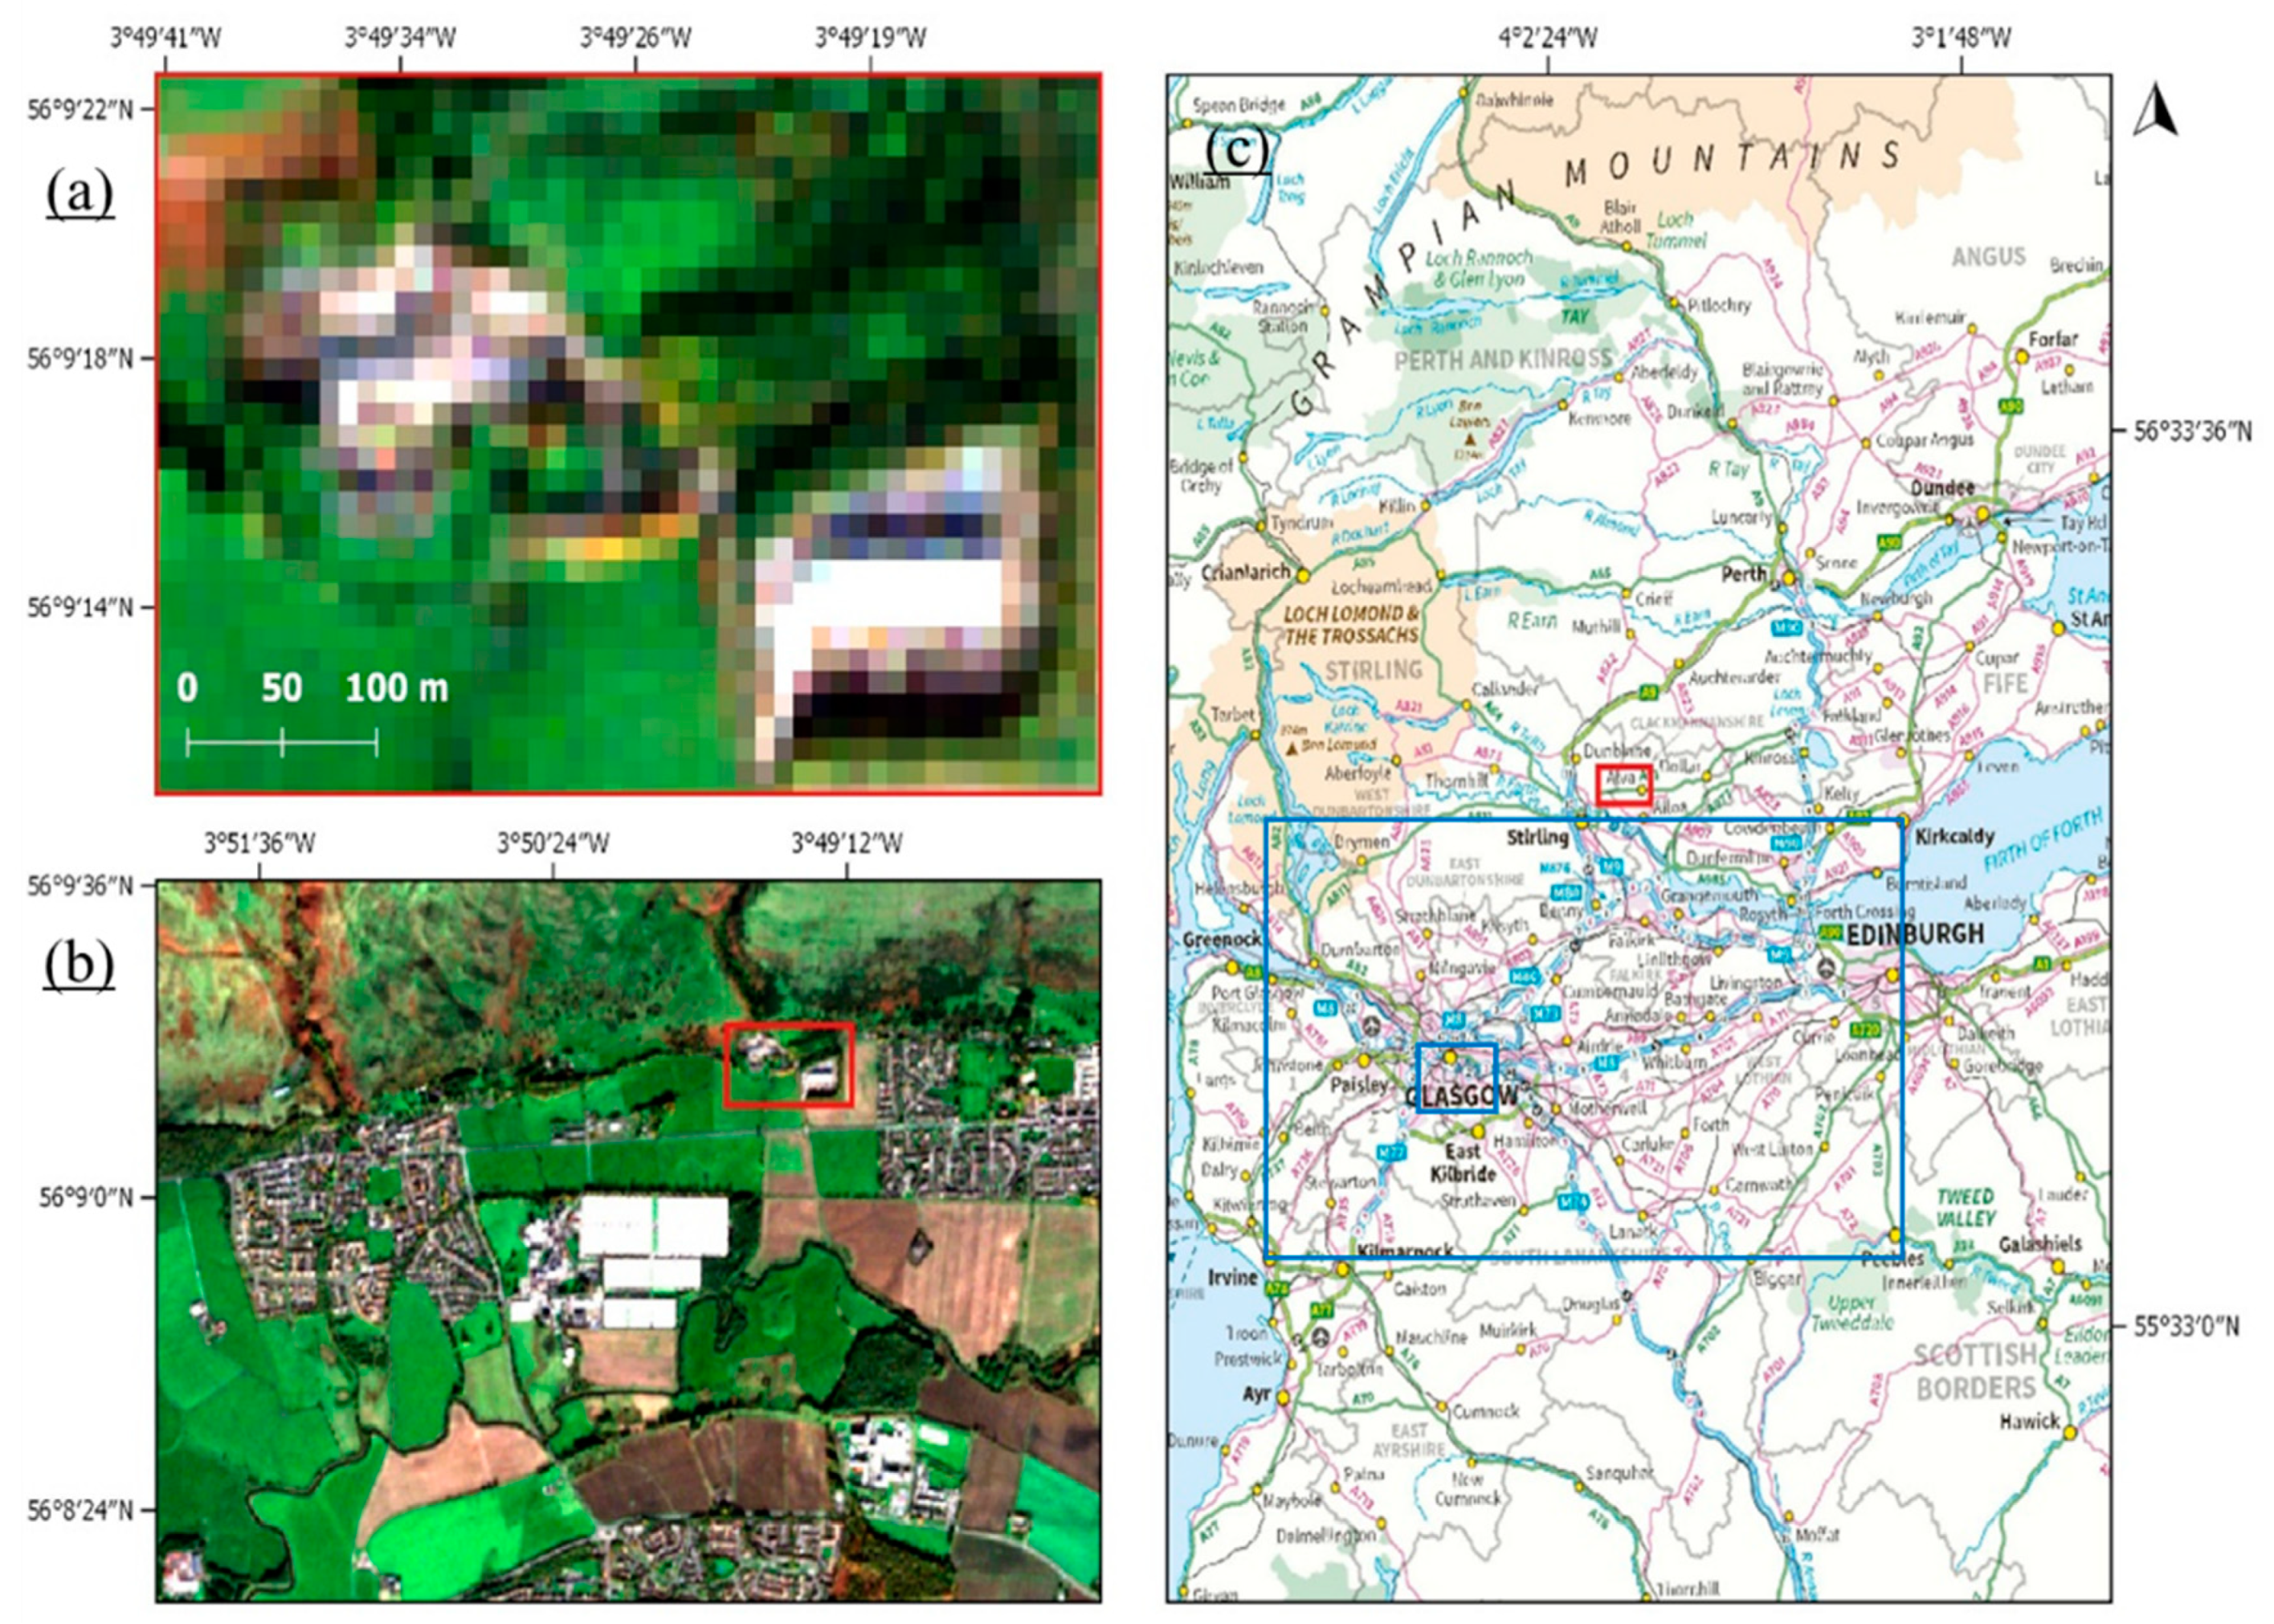
A regional subsection of Scotland that spans the breadth of Glasgow to Edinburgh was initially used for classification training (
Figure 1c, blue box). This region covers both urban and rural environments, with waste sites occurring in both. Also, plastics can be found due to other activities, e.g., artificial sports pitches and plastic used to cover stockpiles of material with tyres often used to hold the plastic down. Therefore, the classification results will detect all surfaces with the signature of plastics and tyres.
Due to the sensitive nature of illegal waste monitoring, a single waste study site is shown in detail (
Figure 1a,b), as approved by the Scottish Environment Protection Agency (SEPA). The site, which is home to an environmental management company, represents a legal waste management operation that houses both tyre and plastic deposits, and allows the demonstration of the proposed machine learning satellite data solution to waste monitoring. It is in a rural location, but the site itself is complex with the waste situated near buildings that are encircled by trees.
A series of Copernicus Sentinel-1 C-band Synthetic Aperture Radar (SAR) and Sentinel-2 Multi-Spectral Instrument (MSI) images covering the period from May 2016 to October 2018 were compared against waste site location reference data, and analysed for the highest amount of visible waste material present (in terms of being identifiable with Goggle Earth imagery), minimal cloud cover, and temporal synchronicity between Sentinel-1 and Sentinel-2 data. Synchronicity is preferred as the two types of remotely sensed imagery should be jointly detecting the land cover types, which becomes more critical for waste as it is often accumulated and then moved on to another location.
This paper focuses on Sentinel data acquired in June 2018, including:
Multi-temporal Sentinel-2B images created using MSI data acquired on the 24 June 2018 at around 11:20 UTC, 27 June 2018 at around 11:30 UTC and 30 June 2018 at around 11:40 UTC, and processed with Sentinel-1A data acquired on the 26 June 2018 at around 06:30 UTC.
The example waste study site data acquired on the 27 June 2018 at around 11:30 UTC for the Sentinel-2B MSI data, and on 26 June 2018 at around 06:30 UTC for the Sentinel-1A SAR data.
2.2. Image Processing
All Sentinel series images were downloaded through the Copernicus Open Access Hub (
https://scihub.copernicus.eu/) and processed using the European Space Agency’s (ESA) open-source Sentinel Application Platform (SNAP) [
17] version 7.0.
2.2.1. Pre-Processing
Sentinel-1 Level-1 Ground Range Detected (GRD) VV polarised data was converted to backscatter values using SNAP through: (i) the application of an orbit file to correct for orbital error; (ii) radiometric correction using a
Gamma0 coefficient calibration; (iii) Range-Doppler terrain correction through orthorectification against the Shuttle Radar Topography Mission 1-second HGT Digital Elevation Model; (iv) the application of a Lee Sigma speckle filter; and (v) conversion to decibels (dB) to produce a non-linear valued output. This workflow is a modified version of the standard SNAP pre-processing workflow to determine the radar backscatter in dB [
18], but the thermal noise correction was dropped as it was found to introduce artefacts and is primarily of use for the cross-polarisation channel. The Lee Sigma filtering was included to reduce the speckle while preserving edges [
19]. The terrain flattening and thermal noise filtering were improved in SNAP version 7.0, and so, the thermal noise filtering will be reassessed in the future. The vertical single polarisation (VV) rather than cross-polarisation (VH) data was chosen because it is more sensitive to rough surface scattering [
20], and its primary role in the classification process is the separation of water from land.
Sentinel-2 Level-2A data produced by ESA was used to provide bottom-of-atmosphere reflectance imagery. Where Level-2A data was unavailable, Level-1C products were atmospherically corrected through the Sen2Cor processor [
21] available in SNAP.
2.2.2. Thematic Indices
To aid in the differentiation between land cover types and waste products, a range of optical indices were calculated covering vegetation, biophysical, water and soil thematic groups. Following a review of nineteen such indices (
Table 1) and a comparison of training samples across several feature classes, any indices returning inconsistent or non-discernible spectral relationships, or causing classification overfitting (as RF training was tested) were removed. This reduction process left a revised set of three thematic indices to be included as additional classification layers: NDVI, SAVI, NDWI2.
The normalised difference vegetation index (NDVI) algorithm can be used to exploit the vitality of vegetation. Designed by Tucker [
22], it is based on a high reflectance in the near-infrared (NIR) by plant matter in contrast to the strong absorption by chlorophyll-a in the red wavelengths, which is known as the red edge. The NDVI is a measurement of photosynthetic activity and is strongly correlated with both the density and vitality of vegetation [
23].
The soil adjusted vegetation index (SAVI) provides a hybrid between ratio-based and perpendicular indices, and is based on simple radiative transfer and more coherent theoretical background than other vegetation indices. Developed by Huete [
24], it is necessary to use a correction value that varies from 0 for very high vegetation cover to 1 for very low. For use across a variety of land cover types, an intermediate correction value (L) of 0.5 has been used in this instance.
The second normalised difference water index (NDWI2) was developed by McFeeters [
25] to detect surface waters in wetlands and to allow the measurement of the extent of surface water. The index has been used to reduce errors in the misclassification of both tyres and plastics as water. Investigations across the study site, as a visual comparison and accuracy assessment of different RF classification results, demonstrated more consistent values for all target land cover classes for NDWI2 compared to its predecessor, NDWI.
All thematic indices were stacked into one file alongside a subset of Sentinel-2 bands, and the Sentinel-1 Gamma0 VV data. The resulting file used for classification consists of 13 bands, covering a range of spectra and indices (
Table 2). Different layers have different spatial resolutions in the original Sentinel datasets, and so the coarser spatial resolution layers were resampled to 10 m. For Sentinel-2, this occurs just before inclusion in the stack using the SNAP raster resampling tool, and for Sentinel-1 it is included as part of the terrain correction.
2.2.3. Cloud Masking
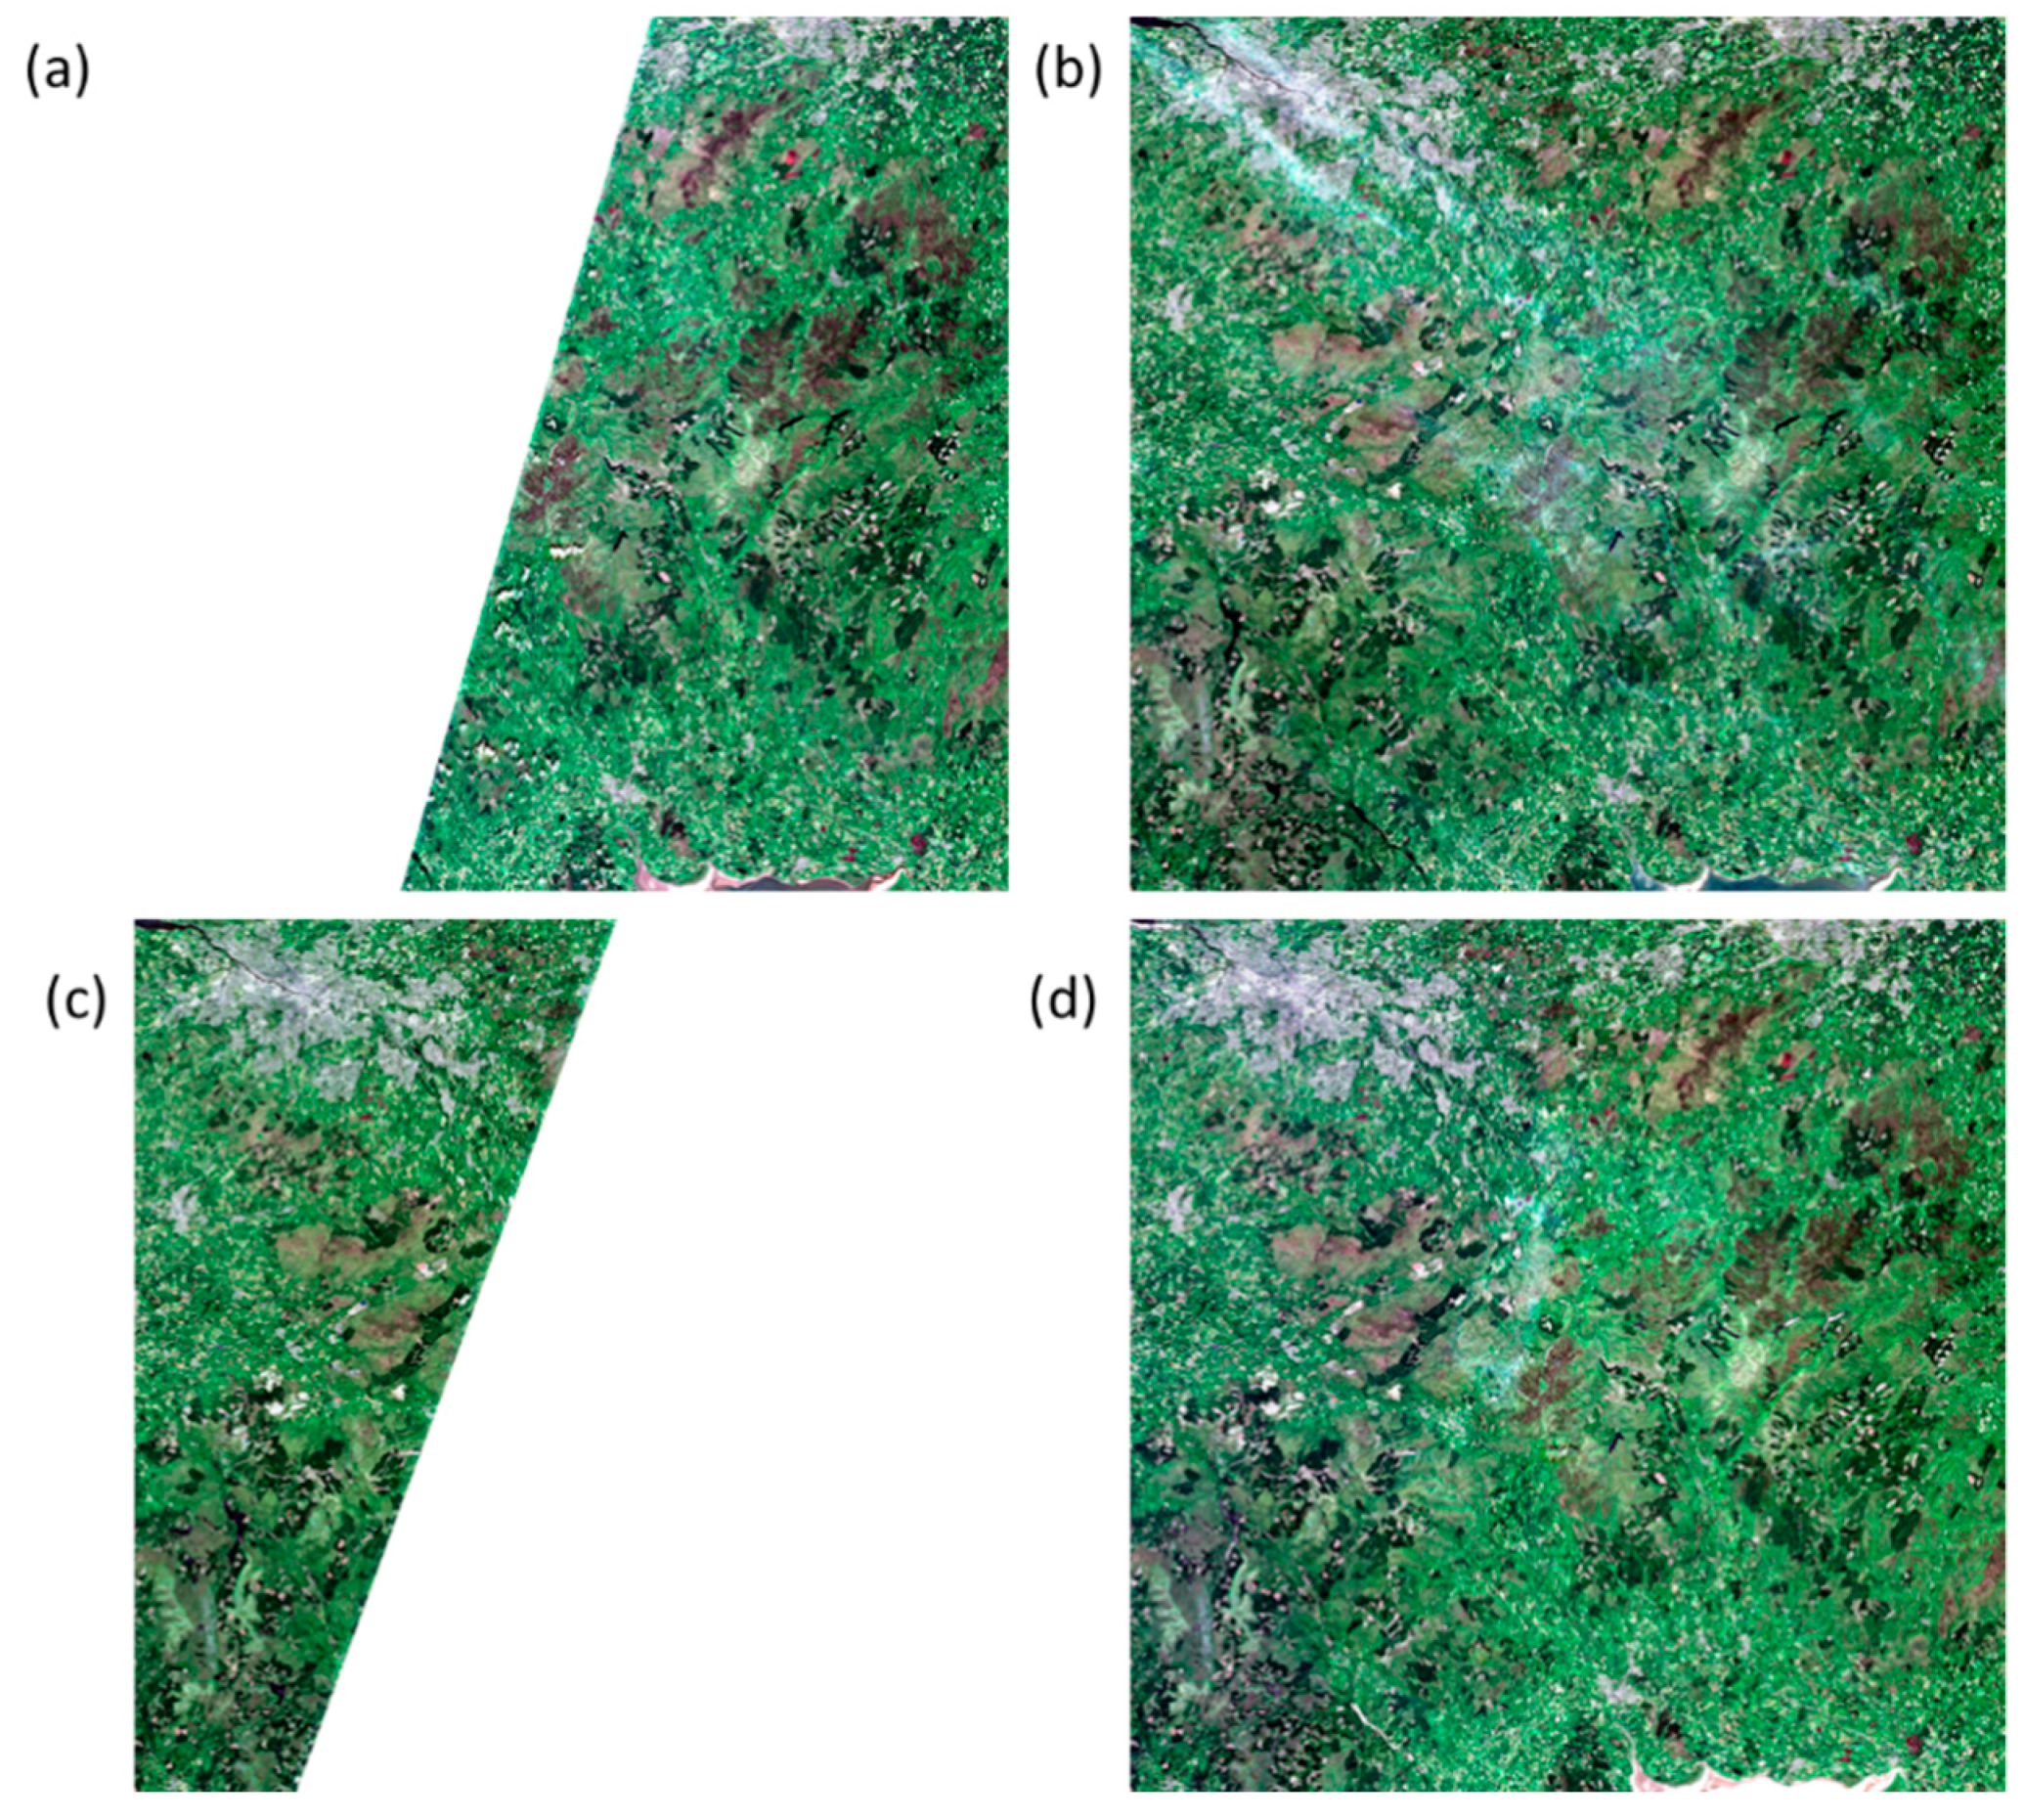
For optical imagery, both cloud and cloud shadow present issues for classification in the form of object obstruction and pixel misclassification. While several cloud masking algorithms were tested, the classification of industrial and continuous urban regions as cloud was a persistent problem, often causing the loss of potential areas of interest. Therefore, an alternative approach to cloud removal was taken where necessary, using a temporal composite of Sentinel-2 imagery to mosaic pixels and based on keeping the pixel within the temporal time-series with the highest NDVI value. Rather than the complete removal of pixels affected by cloud cover, this method reduces any loss of data by substituting pixels with alternate values, thus retaining the entire dataset while reducing any atmospheric obstruction, as seen in
Figure 2.
2.3. Image Classification
A conceptual framework for using high-resolution multispectral remotely-sensed imagery for waste tyre detection was developed by Quinlan and Foschi [
2]. In general, waste tyre dumps appeared as dark tones but can be confused with other persistently dark features such as water, shadows, asphalt, rusted metal, or black plastic used on farms. Therefore, in this research, SAR data was used alongside the multispectral data to separate dark smooth surfaces from tyres.
The augmented land cover classification is the output of the RF classifiers, and was used to map surface types across the study site by utilising: (i) the multispectral bands of Sentinel-2; (ii) NDVI, SAVI and NDWI2 thematic indices; and (iii) Gamma0 VV Sentinel-1 data as the stack input to the classifier. The classification was separated into nine classes (
Table 3, which were adapted from the CORINE land cover mapping scheme [
26], a consistent classification system developed for application in Europe, by adding Tyres and Plastics as additional Level 2 classes.
Separate tyre and plastics classifiers were trained to minimise any confusion in the classification of these two classes. Misclassification occurs because of spectral similarities between these two classes and because this waste often co-exists, i.e., tyre waste is often covered in plastic sheeting and plastic sheeting is often weighed down with tyres.
The supervised RF classifier available in SNAP, uses decision trees and independent random vectors and the approach is driven by the relationship between the training and the response dataset rather than starting with a data model [
27]. It provides several benefits over other supervised classification algorithms, including the ability to calculate internal error estimates and variable importance, as well as the capacity to handle weak explanatory variables [
28]. It has received increasing attention due to both its classification accuracy and the speed of processing, which made it particularly useful for this project, which was a six-month feasibility study.
The training data used satellite imagery collected over the study region (see the larger blue box shown in
Figure 1c) with training samples manually identified using Google Earth. For each target class, up to 2000 homogeneous training samples were taken across the study region, and 15 classifier decision trees were built. Testing was conducted utilising additional decision trees but was found to cause overfitting, and so, the number was kept at 15.
Then, for testing, the classifiers were run over the same location for a period that spanned from March 2018 to October 2018. In this paper, the results are shown for June 2018, which was investigated in detail as June had the advantage of being a summer month with reduced cloud cover.
2.4. Accuracy Assessment
Classification accuracy was assessed through three metrics: (i) internal SNAP evaluation; (ii) calculation of error matrices; and (iii) calculation of KAPPA coefficients.
As a by-product of generating the RF classifier, SNAP produces an internally assessed accuracy value based on the percentage of correct predictions made from an automated test dataset. The size of the test dataset for assessment is manually defined, in this case it included 10,000 points.
As a more manual alternative calculation of accuracy, a series of error matrices were also created. The output classification was compared to high-resolution EO data in the form of Google Earth, Worldview-2, and RapidEye-4. Random points across all land cover classes were generated and compared against reference data for consistency with user’s (errors of commission) and producer’s (errors of omission) accuracy, and the overall accuracy was assessed. The producer’s accuracy indicates the number of samples that were erroneously omitted despite belonging to that class, and may also be considered a measure of uncertainty, while the user’s accuracy indicates the occurrence of the erroneous assignment of a pixel to a class to which it does not belong [
29].
As an additional measure, Cohen’s KAPPA coefficient was also calculated, which is a statistical measure of agreement that provides a more robust result than percentage agreement calculations [
30]. In the equations below, p
o is the observed agreement (percentage of instances classified correctly from the error matrix), and p
e is the expected agreement. The overall expected agreement is calculated using Equation (5), where the expected agreement is calculated for each class, then these are added together and divided by the total number of samples.
3. Results
3.1. Band Importance
Training data collected from across the study region indicated several potential spectral relationships that can be exploited to improve the classification of the tyre and plastic waste from satellite data. An investigation into feature importance, which was performed in SNAP, provided each input band with a contribution score calculated from the percentage of correct predictions made. Across all of the classifiers for both tyres and plastics, the utility of Sentinel-1 data was highlighted, with the band ranking third and second, respectively. Sentinel-2′s 1610 nm SWIR band was calculated to be of most importance to the classifier, with the rankings also showing the importance of the three thematic indices used in the classification. A summary of these rankings is presented in
Table 4.
3.2. Classification Results for the Study Region
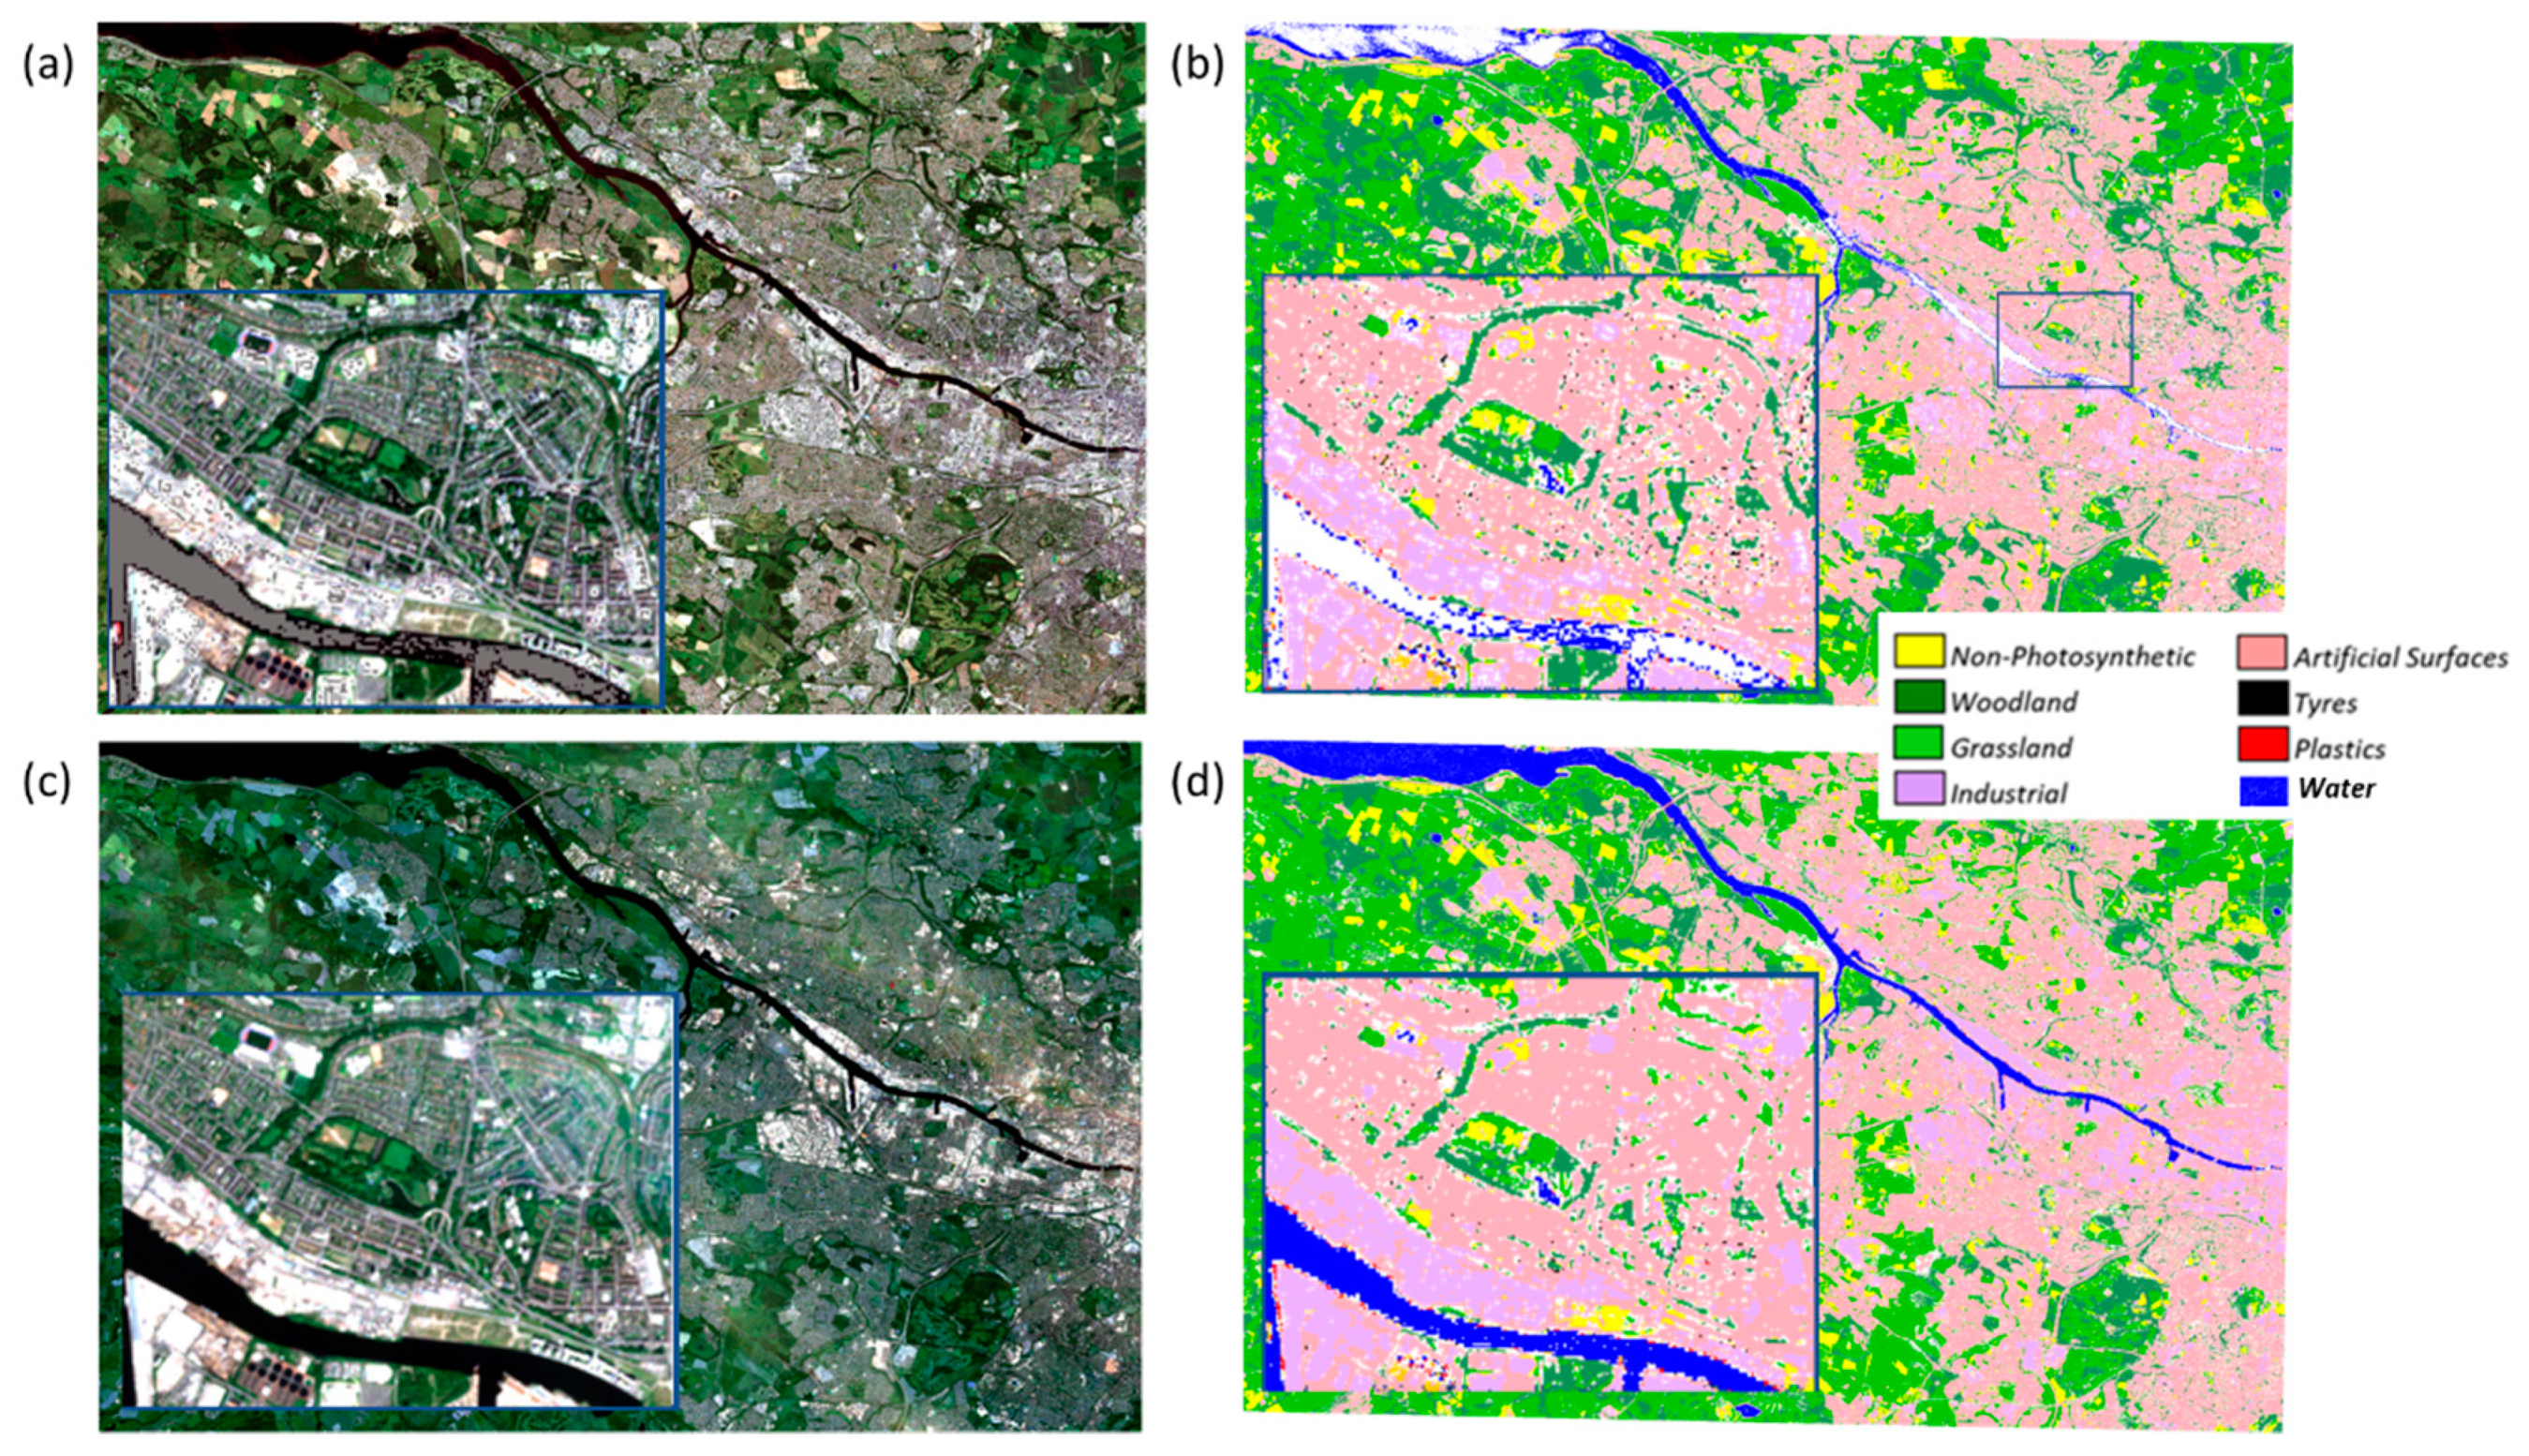
To demonstrate the results of the classification for the broader study region, a sub-region was extracted for Glasgow (the smaller blue rectangle in
Figure 1c) and was processed using the plastics RF classifier. The results are shown for both the (
Figure 3a,b) Sentinel-2 temporal composite and (
Figure 3c,d) the single Sentinel-2 image for 27 June 2018.
In the temporal composite, there are missing pixels (grey) in the river and across the land that failed to classify (white). Also, there are more individual pixels in the land area with a classification that is different to the surrounding pixels. Therefore, it was concluded that the single input Sentinel-2 image produces more consistent classification results, and so it should be used in preference, although the temporal composite is useful during periods when there is significant cloud cover or haze.
For the entire study region, the classification of tyres returned 71 confirmed waste locations on 26–27 June 2018, while 140 locations were confirmed for plastics; each site was confirmed through the visual inspection of Google Earth. The classifier showed successful results down to a single pixel scale, and identified several land uses relating to the waste products of interest including mixed waste sites (e.g., landfill), silage bales/pits, and plastic sheeting (e.g., tarpaulin). Many of the classified results returned single-pixel sites for both tyres and plastic waste, which represented stockpiles measuring approximately 10 × 10 m (
Table 5). There were far fewer large tyre deposits with only two confirmed locations with an area above 100 m
2. In contrast, a significant number of large waste plastic stockpiles were detected, with 20 individual locations areas measuring 100 m
2 and above, primarily because of landfill complexes.
3.3. Classification Results for an Example Waste Study Site
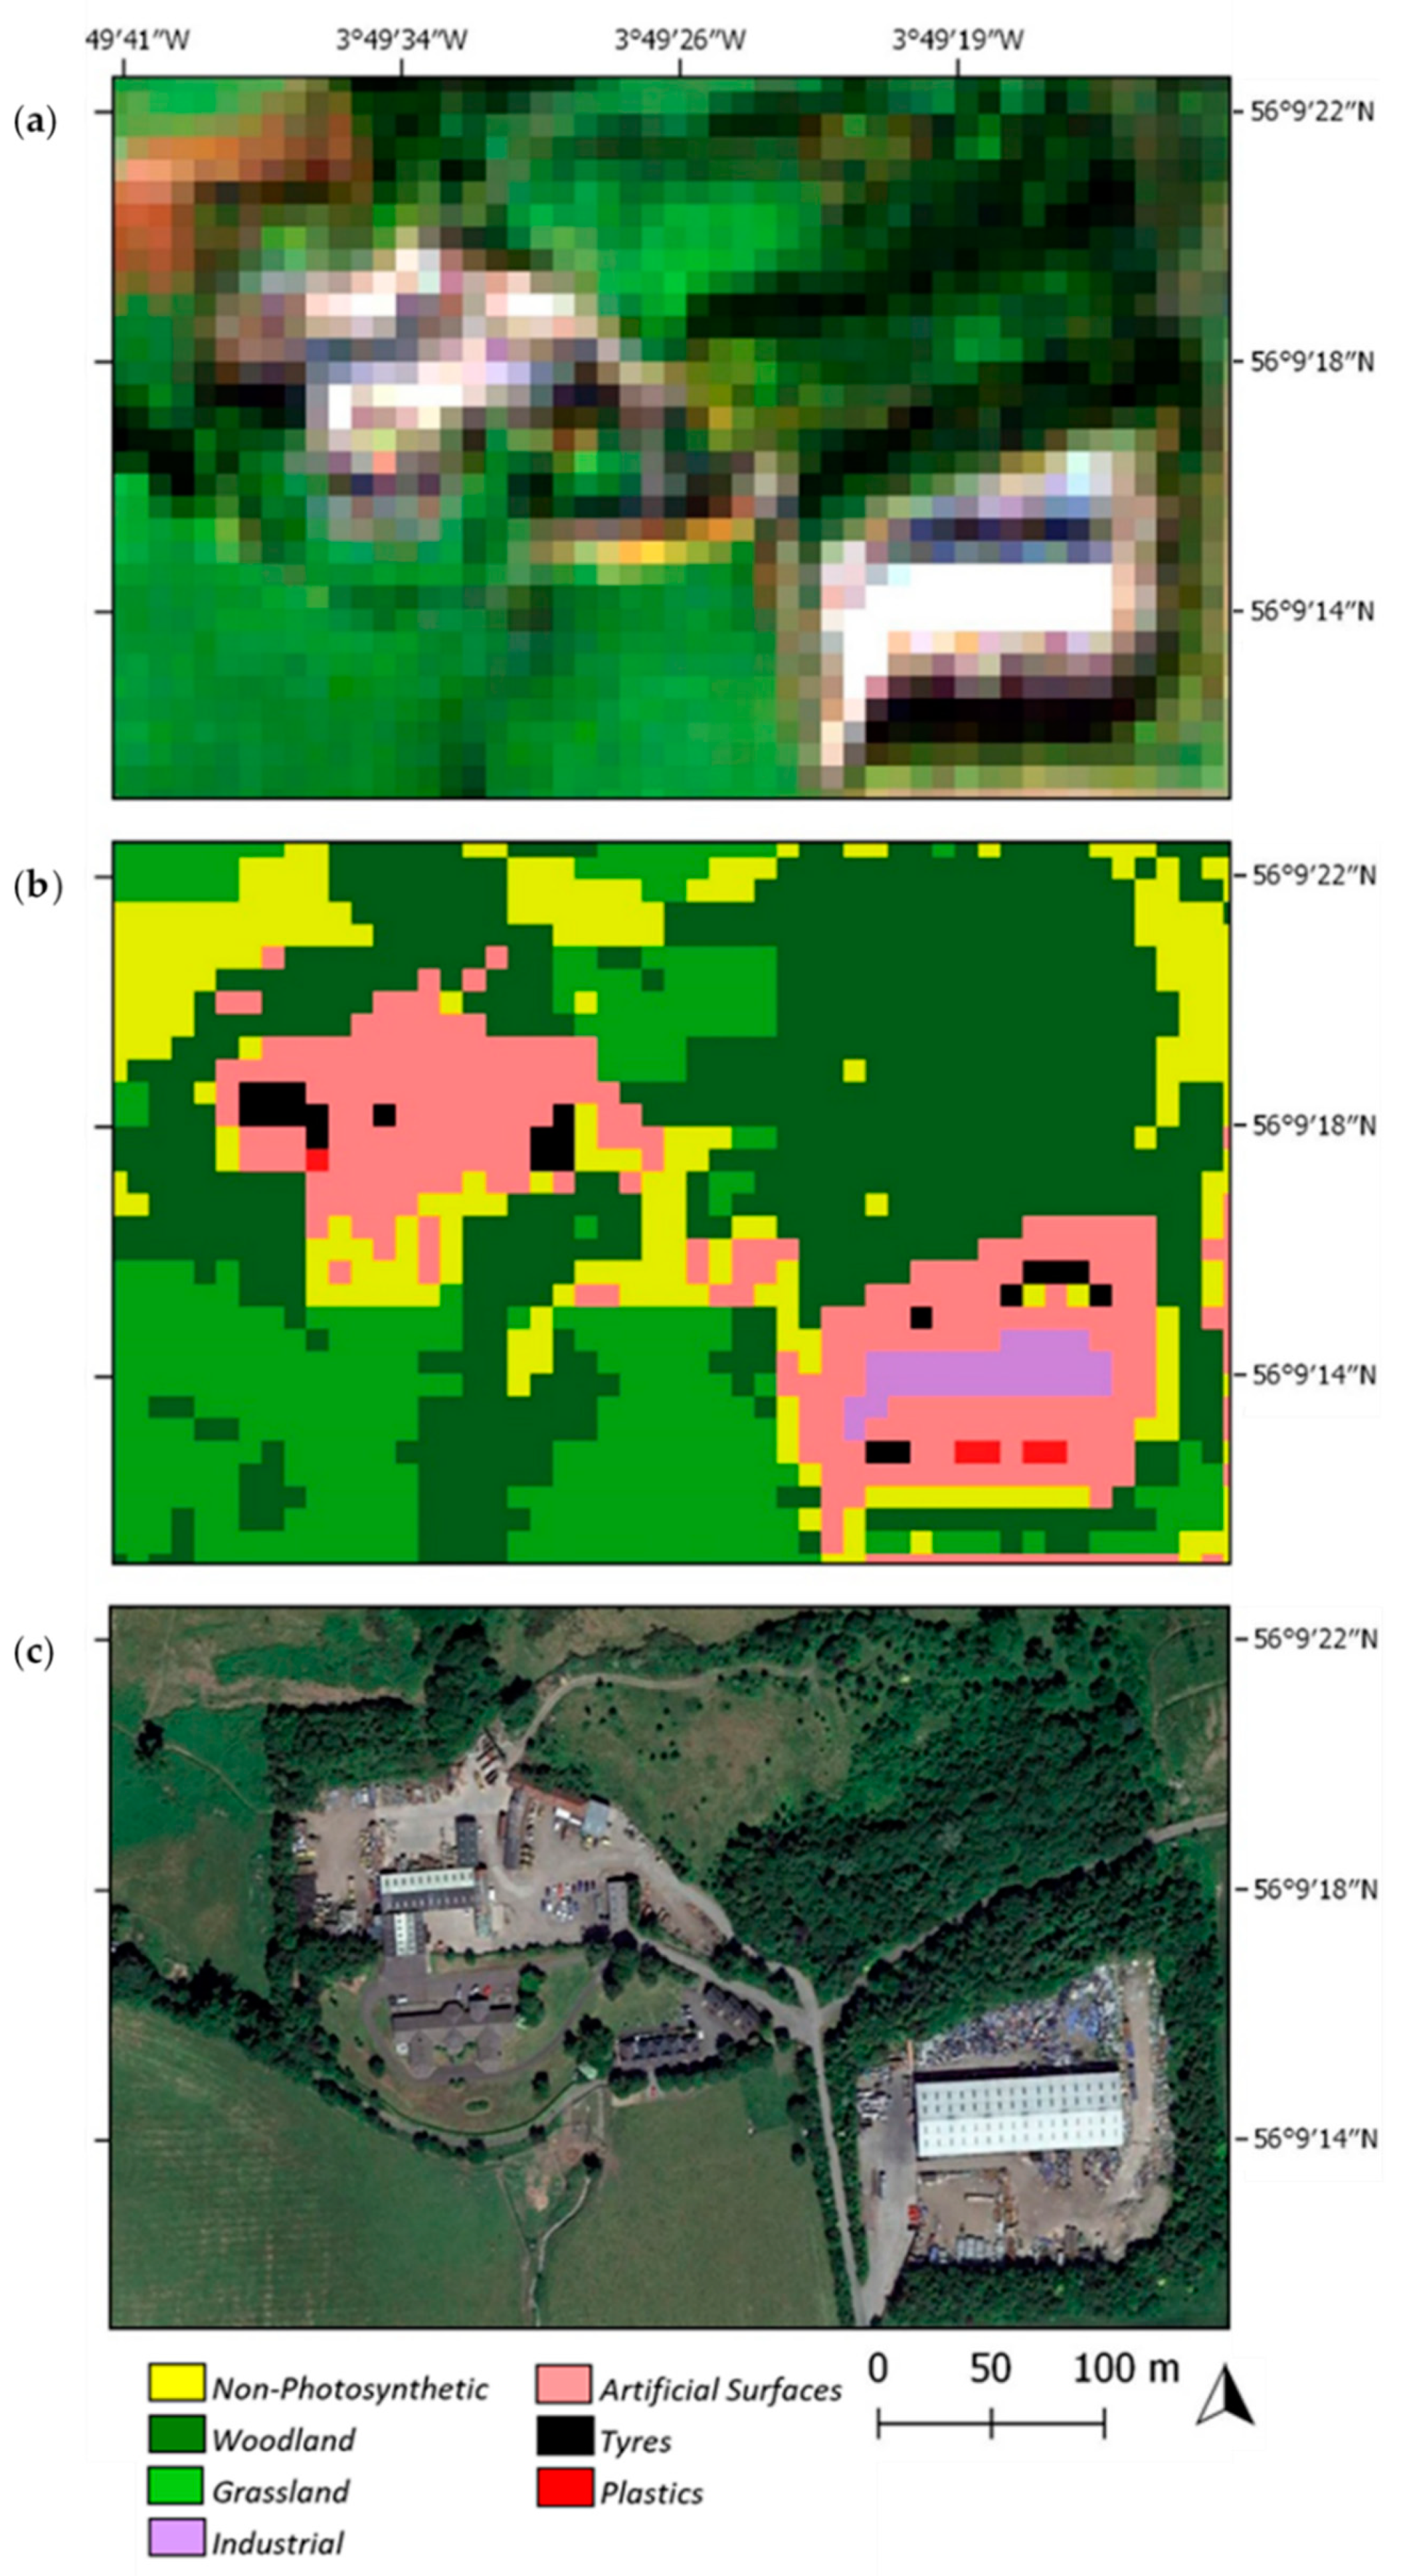
This section details the classifier results for a specific waste site, an environmental management company in Alva, which showed variations in the size and location of tyre and plastic deposits across the site throughout 2018.
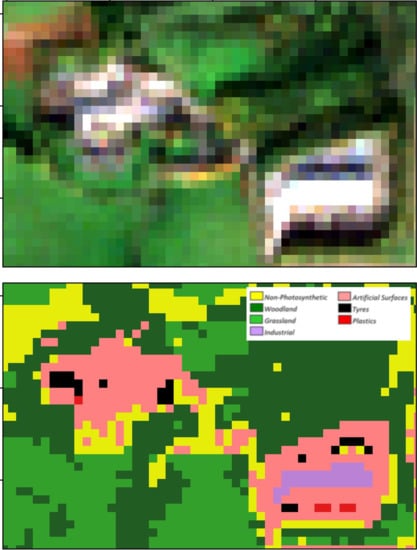
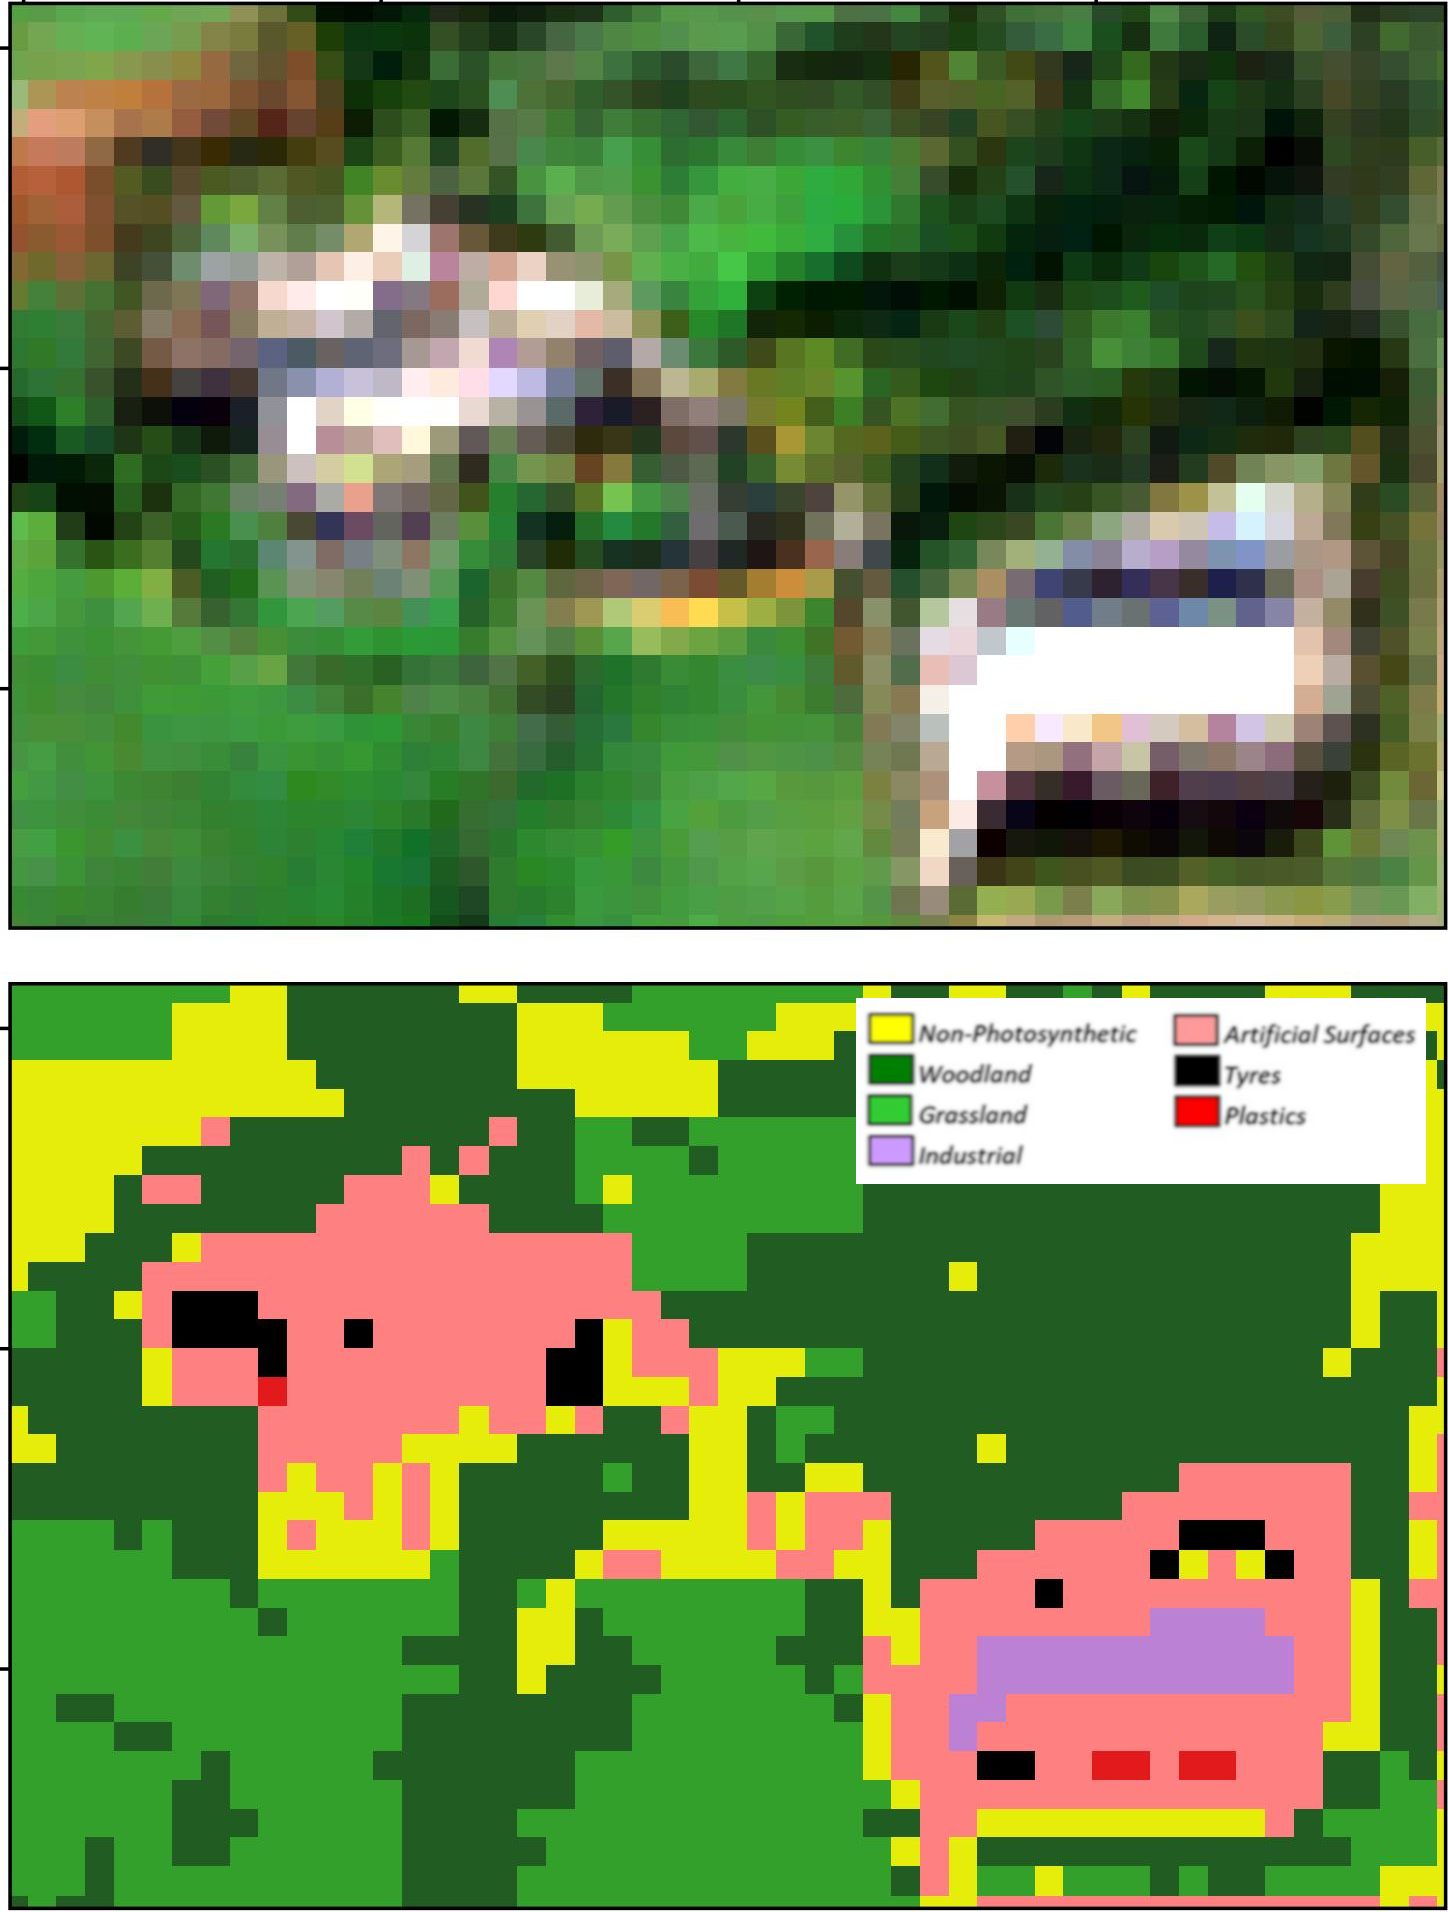
The classifier output for late June is presented in
Figure 4, alongside Sentinel-2 RGB data and Google Earth. The results show several tyre clusters across the site, varying in size from 10 × 10 m to 50 × 20 m. The classifier also highlighted the plastic deposits. A comparison to Google Earth data shows the presence of these waste materials in similar clusters (to the north and south of the building on the right). However, temporally synchronous high-resolution data was not available for validation. Therefore, these results were validated by SEPA, which confirmed the presence of waste materials and the success of the classifier.
3.4. Accuracy Assessment
The classification accuracy was assessed through comparison to Google Earth imagery alongside known waste site locations supplied by the Scottish Environmental Protection Agency. Creation of the waste site location reference data was an iterative process. Additional sites were identified using the RF classifier and then confirmed visually, before being updated in the reference dataset—thus it contained a set of plastic and tyre locations that was as comprehensive as possible. Three measures of accuracy were calculated by using an internal SNAP evaluation, an appraisal of error matrices, and KAPPA coefficient assessment.
An internally assessed accuracy assessment was calculated by SNAP based on the percentage of correct predictions made from an automated test dataset that included 10,000 points. Accuracy predictions for the tyre and plastics classifiers were calculated as 99.06% and 99.15%, respectively, across all classes.
Utilising a more traditional method of accuracy assessment, error matrices were created for both classifiers. Randomly generated points from all land cover classes were interpreted, with the user’s, producer’s and overall accuracies calculated. For the primary classes of interest, the overall accuracy was calculated as 88% for tyres, and 84% for plastics. The overall accuracies for all classes for both classifications were 94% and 93% for tyres and plastics, respectively. The error matrices for both classifications are presented in the
Appendix A,
Table A1 and
Table A2.
Cohen’s KAPPA coefficient was also calculated; this offers a more robust measure than percentage agreement calculations by including agreement by change [
30]. KAPPA coefficients for both classifiers return an “almost perfect” agreement at a confidence level of 95%.
A summary of all of the accuracy assessment results is presented in
Table 6.
4. Discussion
The highest accuracies were found over rural scenes and less complex environments, in keeping with the abundance of rural land in the study region. Complex urban environments presented a problem for the Sentinel-1 and -2 based classification, with the impact of mixed pixels degrading the overall accuracies. Higher-resolution EO data will be required to address such issues, for example, initial testing of Worldview-2 data using a similar methodology returned more promising results across urban regions.
The final RF classifiers were tested across several datasets covering a wide temporal range. While initial training of the classification was carried for data from June 2018, as demonstrated in this paper, additional datasets were tested that cover the most recent updates to the format of both sensors’ product (March 2018–October 2018). Across this timescale, all classifications returned similar accuracies to the original training data. Still, it is recognised that this study focused on spring/summer imagery and so the technique may not be so accurate for other seasons, and further work is needed. Preliminary tests have been conducted on a larger spatial scale, with results across Europe returning accuracies >70%, thus, expanding the spatial and temporal validity will be the focus of further research.
The RF approach proved to be a powerful yet sensitive tool in the detection of waste. Utilising data from the Copernicus programme allows for a cost-effective, accurate and repeatable methodology, with an average revisit period of three days over Scotland for Sentinel-1 and -2. However, any changes to the product format or the data evolution of either dataset will require the complete retraining of each classifier.
Results for the plastic classifications also indicate the ability of this approach to detect plastic-based construction materials (e.g., synthetic roofing) and artificial surfaces (e.g., astroturf) to a high level of accuracy, as well as high sediment yields and pollution in inland water and coastal environments. While the algorithm has not been trained with any marine data, the results indicate the potential for the methodology to be transposed to more water-orientated classifications.
5. Conclusions
A methodology has been presented for the detection of waste across Scotland from satellite data. An augmented land cover classification was used that combines Sentinel-2 optical data with NDVI, SAVI, NDWI2 and Sentinel-1 Gamma0 VV. Two RF classifiers were successfully trained, with the ability to detect tyres and plastics at an accuracy of 87.5% and 84%, respectively. All other land cover classes were measured to an accuracy of >90%. The method was proven to be reliable across both a temporal and spatial range, with data tested across Europe over eight months. Also, preliminary testing of the same methodology for higher spatial resolution RapidEye-4 and Worldview-2 data shows the potential for similarly positive results.
Author Contributions
Conceptualisation, R.P. and S.L.; Methodology, R.P.; Software, S.L. and D.T.; Validation, R.P.; Formal Analysis, I.B., J.B., K.B., E.U., G.F., M.H., R.P. and S.S.; Investigation, R.P.; Resources, R.P. and S.L.; Data Curation, R.P. and S.L.; Writing—Original Draft Preparation, R.P.; Writing—Review and Editing, R.P., S.L. and S.S.; Visualization, R.P.; Supervision, S.L.; Project Administration, S.L.; Funding Acquisition, S.L. All authors have read and agreed to the published version of the manuscript.
Funding
This project received funding from the LIFE Programme of the European Union, grant number LIFE13-ENV/UK/000549.
Conflicts of Interest
The authors declare no conflict of interest. There is no potential conflict of interest with Pixalytics Ltd.
Appendix A
Table A1.
Error matrix for tyre classification; bold shows the correct classification.
Table A1.
Error matrix for tyre classification; bold shows the correct classification.
| | AD | AS | IN | GR | WD | NP | PL | TY | WA |
|---|
| AD | 85 | 1 | | | | | 4 | | |
| AS | | 96 | 4 | | | 7 | 2 | | |
| IN | | | 98 | | | 3 | | | |
| GR | | | | 280 | 6 | | | | |
| WD | | | | 6 | 138 | | | | 3 |
| NP | 6 | 5 | | 2 | 1 | 100 | | | |
| PL | 2 | 2 | | | 1 | 1 | 38 | 3 | |
| TY | | 2 | 1 | | | | 1 | 24 | |
| WA | | | | | 1 | | | | 102 |
| User’s | 94% | 88% | 97% | 98% | 94% | 88% | 81% | 86% | 99% |
| Producer’s | 91% | 91% | 95% | 97% | 94% | 90% | 84% | 89% | 97% |
| Overall | 93.76% | | | | | | | | |
Table A2.
Error matrix for plastics classification; bold shows the correct classification.
Table A2.
Error matrix for plastics classification; bold shows the correct classification.
| | AD | AS | IN | GR | WD | NP | PL | TY | WA |
|---|
| AD | 86 | 1 | | | | | 5 | | |
| AS | | 93 | 3 | | | 11 | 2 | | |
| IN | | 1 | 87 | | | 3 | 1 | | |
| GR | | | | 284 | 2 | 3 | | | |
| WD | | | | 8 | 132 | 2 | | | 2 |
| NP | 2 | 3 | | 3 | | 100 | 2 | | 1 |
| PL | 1 | 4 | | | 1 | 1 | 59 | 4 | |
| TY | | 2 | | | 1 | 1 | | 19 | |
| WA | | | | | | | | | 95 |
| User’s | 93% | 85% | 95% | 98% | 92% | 90% | 83% | 83% | 100% |
| Producer’s | 97% | 89% | 97% | 96% | 97% | 83% | 85% | 83% | 97% |
| Overall | 93.17% | | | | | | | | |
References
- Baird, J.; Curry, R.; Cruz, P. An overview of waste crime, its characteristics, and the vulnerability of the EU waste sector. Waste Manag. Res. 2014, 32, 97–105. [Google Scholar] [CrossRef] [PubMed]
- Quinlan, B.L.; Foschi, P.G. Identification of waste tires using high-resolution multispectral satellite imagery. Photogramm. Eng. Remote Sens. 2012, 10, 463–471. [Google Scholar] [CrossRef]
- Dumped On. Available online: https://www.theguardian.com/society/2002/may/15/environment.waste (accessed on 20 September 2018).
- Mavroulidou, M.; Figueiredo, J. Discarded tyre rubber as concrete aggregate: A possible outlet for tyres. Global Nest J. 2010, 12, 359–367. [Google Scholar]
- Tire Fires. Available online: https://archive.epa.gov/epawaste/conserve/materials/tires/web/html/fires.html (accessed on 20 March 2020).
- Crews Battle Large Tire Fire. Available online: https://www.latimes.com/archives/la-xpm-2005-jul-20-na-tires20-story.html (accessed on 20 September 2018).
- Fforestfach Tyre Fire: Swansea council Seeks £1.5 m Costs. Available online: https://www.bbc.co.uk/news/uk-wales-south-west-wales-15886101 (accessed on 20 September 2018).
- Fire in Kuwait. Available online: https://earthobservatory.nasa.gov/images/77678/fire-in-kuwait (accessed on 20 September 2018).
- Andreadis, T.G. A survey of mosquitos breeding in used tire stockpiles in Connecticut. J. Am. Mosq. Control Assoc. Suppl. 1988, 4, 256–260. [Google Scholar]
- Battling the Zika Virus, One Old Tyre at a Time. Available online: http://www.bbc.com/autos/story/20160422-battling-the-zika-virus-one-old-tyre-at-a-time (accessed on 20 September 2018).
- Plastics—The Facts. 2017. Available online: https://www.plasticseurope.org/en (accessed on 20 March 2020).
- Waste Disguised as Hay Bales at Turnhouse Farm in Edinburgh. Available online: https://www.bbc.co.uk/news/uk-scotland-edinburgh-east-fife-29567276 (accessed on 20 March 2020).
- Household Waste Disguised as Hay Bales Dumped in Essex. Available online: https://www.bbc.co.uk/news/uk-england-essex-22135870 (accessed on 20 March 2020).
- Living Well, within the Limits of Our Planet. Available online: https://ec.europa.eu/environment/pubs/pdf/factsheets/7eap/en.pdf (accessed on 20 March 2020).
- Life Smart Waste Project. Available online: http://www.lifesmartwaste.com/ (accessed on 20 March 2020).
- Liang, J.; Liu, D. A local thresholding approach to flood water delineation using Sentinel-1 SAR imagery. ISPRS J. Photogramm. Remote Sens. 2020, 159, 53–62. [Google Scholar] [CrossRef]
- STEP: Science Toolbox Exploitation Platform. Available online: http://step.esa.int/main/toolboxes/snap/ (accessed on 20 March 2020).
- Truckenbrodt, J.; Freemantle, T.; Williams, C.; Jones, T.; Small, D.; Dubois, C.; Thiel, C.; Rossi, C.; Syriou, A.; Giuliani, G. Towards Sentinel-1 SAR Analysis-Ready Data: A Best Practices Assessment on Preparing Backscatter Data for the Cube. Data 2019, 4, 93. [Google Scholar] [CrossRef] [Green Version]
- Filipponi, F. Sentinel-1 GRD Preprocessing Workflow. Proceedings 2019, 18, 11. [Google Scholar] [CrossRef] [Green Version]
- Joshi, N.; Baumann, M.; Ehammer, A.; Fensholt, R.; Grogan, K.; Hostert, P.; Jepsen, M.R.; Kuemmerle, T.; Meyfroidt, P.; Mitchard, E.T.A.; et al. A review of the application of optical and radar remote sensing data fusion to land use mapping and monitoring. Remote Sens. 2016, 8, 70. [Google Scholar] [CrossRef] [Green Version]
- Louis, J.; Debaeeker, V.; Pflug, B.; Main-Knorn, M.; Bieniarz, J.; Mueller-Wilm, U.; Cadau, E.; Gascon, D. Sentinel-2 Sen2Cor: L2A Processor for users. In Proceedings of the Living Planet Symposium 2016, Prague, Czech Republic, 9–13 May 2016. [Google Scholar]
- Tucker, C.J. Red and photographic infrared combinations for monitoring vegetation. Remote Sens. Environ. 1979, 8, 127–150. [Google Scholar] [CrossRef] [Green Version]
- Curran, P.J. Remote sensing of foliar chemistry. Remote Sens Environ. 1989, 29, 271–278. [Google Scholar] [CrossRef]
- Huete, A.R. A soil-adjusted vegetation index (SAVI). Remote Sens. Environ. 1988, 25, 295–309. [Google Scholar] [CrossRef]
- McFeeters, S.K. The use of normalised difference water index (NDWI) in the delineation of open water features. Int. J. Remote Sens. 1996, 17, 1425–1432. [Google Scholar] [CrossRef]
- CORINE Land Cover. Available online: https://www.eea.europa.eu/publications/COR0-landcover (accessed on 19 September 2018).
- Breiman, L. Random forest. Mach. Learn. 2001, 45, 5–32. [Google Scholar] [CrossRef] [Green Version]
- Gislason, P.O.; Benediktsson, J.A.; Sveinsson, J.R. Random Forests for land cover classification. Pattern Recognit. Lett. 2006, 27, 294–300. [Google Scholar] [CrossRef]
- Zeferino, L.B.; de Souza, L.F.T.; do Amaral, C.H.; Filho, E.I.F.; de Oliveira, T.S. Does environmental data increase the accuracy of land use and land cover classification? Int. J. Appl. Earth Obs. Geoinf. 2002, 91, 102128. [Google Scholar] [CrossRef]
- Viera, A.J.; Garrett, J.M. Understanding interobserver agreement: The Kappa statistic. Fam. Med. 2005, 37, 360–363. [Google Scholar] [PubMed]
© 2020 by the authors. Licensee MDPI, Basel, Switzerland. This article is an open access article distributed under the terms and conditions of the Creative Commons Attribution (CC BY) license (http://creativecommons.org/licenses/by/4.0/).

 ,
, 


