Letter

Interdisciplinary Teaching Using Satellite Images as a Way to Introduce Remote Sensing in Secondary School

1
Jagiellonian University Medical College, Department of Biophysics, Sw. Lazarza 16, 31-530 Krakow, Poland
2
Centrum Badań Kosmicznych Polskiej Akademii Nauk (CBK PAN), Bartycka 18A, 00-716 Warszawa, Poland
*
Author to whom correspondence should be addressed.
Remote Sens. 2020, 12(18), 2868; https://0-doi-org.brum.beds.ac.uk/10.3390/rs12182868
Submission received: 30 July 2020 / Revised: 24 August 2020 / Accepted: 25 August 2020 / Published: 4 September 2020
(This article belongs to the Collection Teaching and Learning in Remote Sensing)

Abstract

:
This article aims to meet two needs: (i) the need for skilled workers and students in the area of remote sensing and (ii) the need to make school science interesting for students. This article addresses both needs by proposing a project for high school students entitled “the Colors of Earth”. The main aim for students was to distinguish between different types of land cover via the creation of various false color band compositions from the satellite Sentinel-2. Achieving this goal requires knowledge from various subjects and enables their practical application via work performed using real data. The project was presented to 39 high-school teachers and 184 high-school students (K-9 and K-10) in the summer semester of the 2019/2020 school year, and their opinions about the project were collected. Overall, both students and teachers judged the project to be interesting, worth introducing to the school, and capable of influencing student opinions of science. In addition, introducing remote sensing elements during pre-university education can help meet the demands for students and workers to study Earth observation.

1. Introduction

Remote sensing techniques are used extensively for research on and monitoring of a large range of natural and socioeconomic processes and phenomena that occur in Earth systems. It supports studies on geology [1], the atmosphere, hydrology, the cryosphere, the climate [2,3,4], the biosphere and environment [5,6], forestry [7], agriculture [8], urban environments [9], natural hazards [10], and many other topics. Due to the numerous fields in which remote sensing is applied, the revenues of the Earth observation (EO) service industry grows consistently. According to the 2020 European Association of Remote Sensing Companies (EARSC) Industry Survey [11], revenues grew 9.7% in 2019 to reach a value of 1.37 billion Euros. Development of the sector has led to an increase in the number of employees, with average annual employment growth rates of approximately 6% from 2012 to 2018 and 17% in 2019. However, 80% of employers who took part in the survey noted difficulty finding and hiring candidates. This can lead one to the conclusion that remote sensing education does not meet sector needs.
Traditionally, courses in remote sensing have been offered mainly at the university level and have been connected to the following disciplines: geography (36%), engineering (18.3%), geology (14.8%), forestry (9.1%), Earth sciences and natural resources (8%), physical sciences (3.3%), meteorology (2%), computer and information science (0.7), etc. [12]. Currently, about 3% of students who graduate each year take part in EO-related courses. These students major in natural sciences, environmental science, natural environment and wildlife, Earth sciences, environmental protection, mining and extraction technologies, agriculture, forestry, and fishery management [13]. Since public perception and knowledge of remote sensing applications and data do not extend beyond satellite-based weather forecasts or visual interpretation of data provided by Google Maps or Google Earth services [14], young people have little opportunity to become familiar with EO data and techniques before selecting their university path. Although discussions regarding the excellent potential for use of remote sensed data in schools have been carried out for years [15,16], its use remains low. In Turkey, South Korea, and the US, fewer than 50% of students have worked with satellite images in school. In Germany and Poland, this proportion exceeds 50% and in England it exceeds 80% [17]. The latter appears to be an exceptional case. At secondary schools, satellite data are seldom used. Satellite images are usually considered in printed form during geography classes as an example of a type of map or to illustrate phenomena that are being discussed. Most examples are related to weather conditions.
Another problem is that few students select environmental or physical studies [18,19]. Current societies exhibit ambivalent attitudes towards science education [20,21]. Science is unpopular among secondary school youth. This is frequently because students perceive science as irrelevant or even useless for them [18,22]. However, this attitude contradicts their general perception of the importance of a scientific knowledge in our technological world [23].
The introduction of remote sensing into secondary school curricula could solve both problems. On the one hand, students would have early contact with EO data. On the other hand, the inherent multidisciplinary nature of remote sensing, which connects various subjects (i.e., geography, biology, physics, math, and computer science) indicates that its active use can help in the implementation of constructivist learning theory, which is considered an effective method of teaching [24,25]. The theory says that “people construct their own understanding and knowledge of the world, through experiencing things and reflecting on those experiences” [26]. Voss et al. [27] listed the main advantages of including remote sensing in the classroom:
  • the possibility of addressing a range of curriculum-specific STEM (science, technology, engineering, and mathematics) topics in a problem-oriented, integrated manner;
  • the opportunity to use archived and newly acquired data to analyze up-to-date and dynamic problems;
  • enhanced visualization of problems in a manner that offers a high degree of vividness;
  • higher motivation and fascination among students;
  • providing students with new methodological skills in image processing and computer science; and
  • introduction of new forms of teaching and learning.
A partial solution to the problem is provided by educational projects and programs. They are usually created by specialists in pedagogy and Earth observation science within international partnerships. They provide teaching and learning materials that are interesting for young people and demonstrate modern applications that use school-derived knowledge and multidisciplinary science.
The most commonly known program is EduSpace from European Space Agency (ESA). EduSpace’s website offers teaching and learning tools, as well as didactic material for secondary school students and teachers. It also offers space image data and applications for education and training. Teachers are provided with dedicated lesson scenarios and tutorials. Further educational content is offered by the Copernicus program. It is targeted mainly at higher education, but there is also content that can be used by secondary school teachers. The Copernicus site offers massive open online courses (MOOCs) designed for first-time and intermediate users. There are also standalone Earth observation education projects: the Landsat-7 Project Science Office in the USA [15], “Fernerkundung in Schulen” (German for “Remote Sensing in Schools”) in Germany [26], “Promoting independent enquiry learning skills in the New Senior Secondary Curriculum through Satellite Remote Sensing and Geo-Information Science” in Hong Kong [28], and Science Education through Earth Observation for High Schools (SEOS) in Europe [29]. These programs seek to include remote sensing in school science education curricula. Unfortunately, the materials described above require that each teacher dedicates effort to tailoring it for school needs, as many topics are not directly connected to school curricula.
Classroom adoption of remote sensing content seeks to provide secondary school students and teachers with learning and teaching tools. It is intended as an entry point for space image data and to provide widespread visibility for EO applications within education and training. Below, we present a detailed description of “the Colors of Earth” educational lesson, which describes application of remote sensing via physics, geography, and biology curricula. The lesson is not about teaching remote sensing, but rather about demonstrating it as a tool that modern societies can use to perceive and understand the physical, biological, and geographical phenomena in the world around us. We also show teacher and student evaluations of the project.

2. Materials and Methods

2.1. Overview

The Colors of Earth is a part of the SAT Project, which is a short for a project’s proper name: “Od śrubki do satelity - dobre praktyki w nauczaniu fizyki w gimnazjach oraz fizyki z elementami astronomii w szkołach gimnazjalnych” (stated in Polish). The project used the inquiry-based learning methods that try to follow practices of a scientific process in a classroom [30]. The idea is to familiarize students with the methods and tools allowing us to discover objective relations [31]. The lesson scenarios are aimed to lower and upper secondary schools; they demonstrate the multidisciplinary nature of science and combine individual topics from the core curricula of physics, geography, biology, informatics, and other sciences. To assure high interest among students, they cover topics related to space. The scenarios employ a collaborative approach, link knowledge and skills, and allow the use of real-life problems in the process of extended inquiry. Within this method, a teacher is only an advisor who moderates the discussions among groups of students.
The Colors of Earth project combined knowledge from various subjects and enabled their practical application. Its content had direct links with basic school curricula (e.g., geography ( analyzing the land cover surrounding of the school), physics (electromagnetic waves), Information and Communications Technology (ICT), (use of digital data and software), and biology (human sight)). The main objectives of this project were:
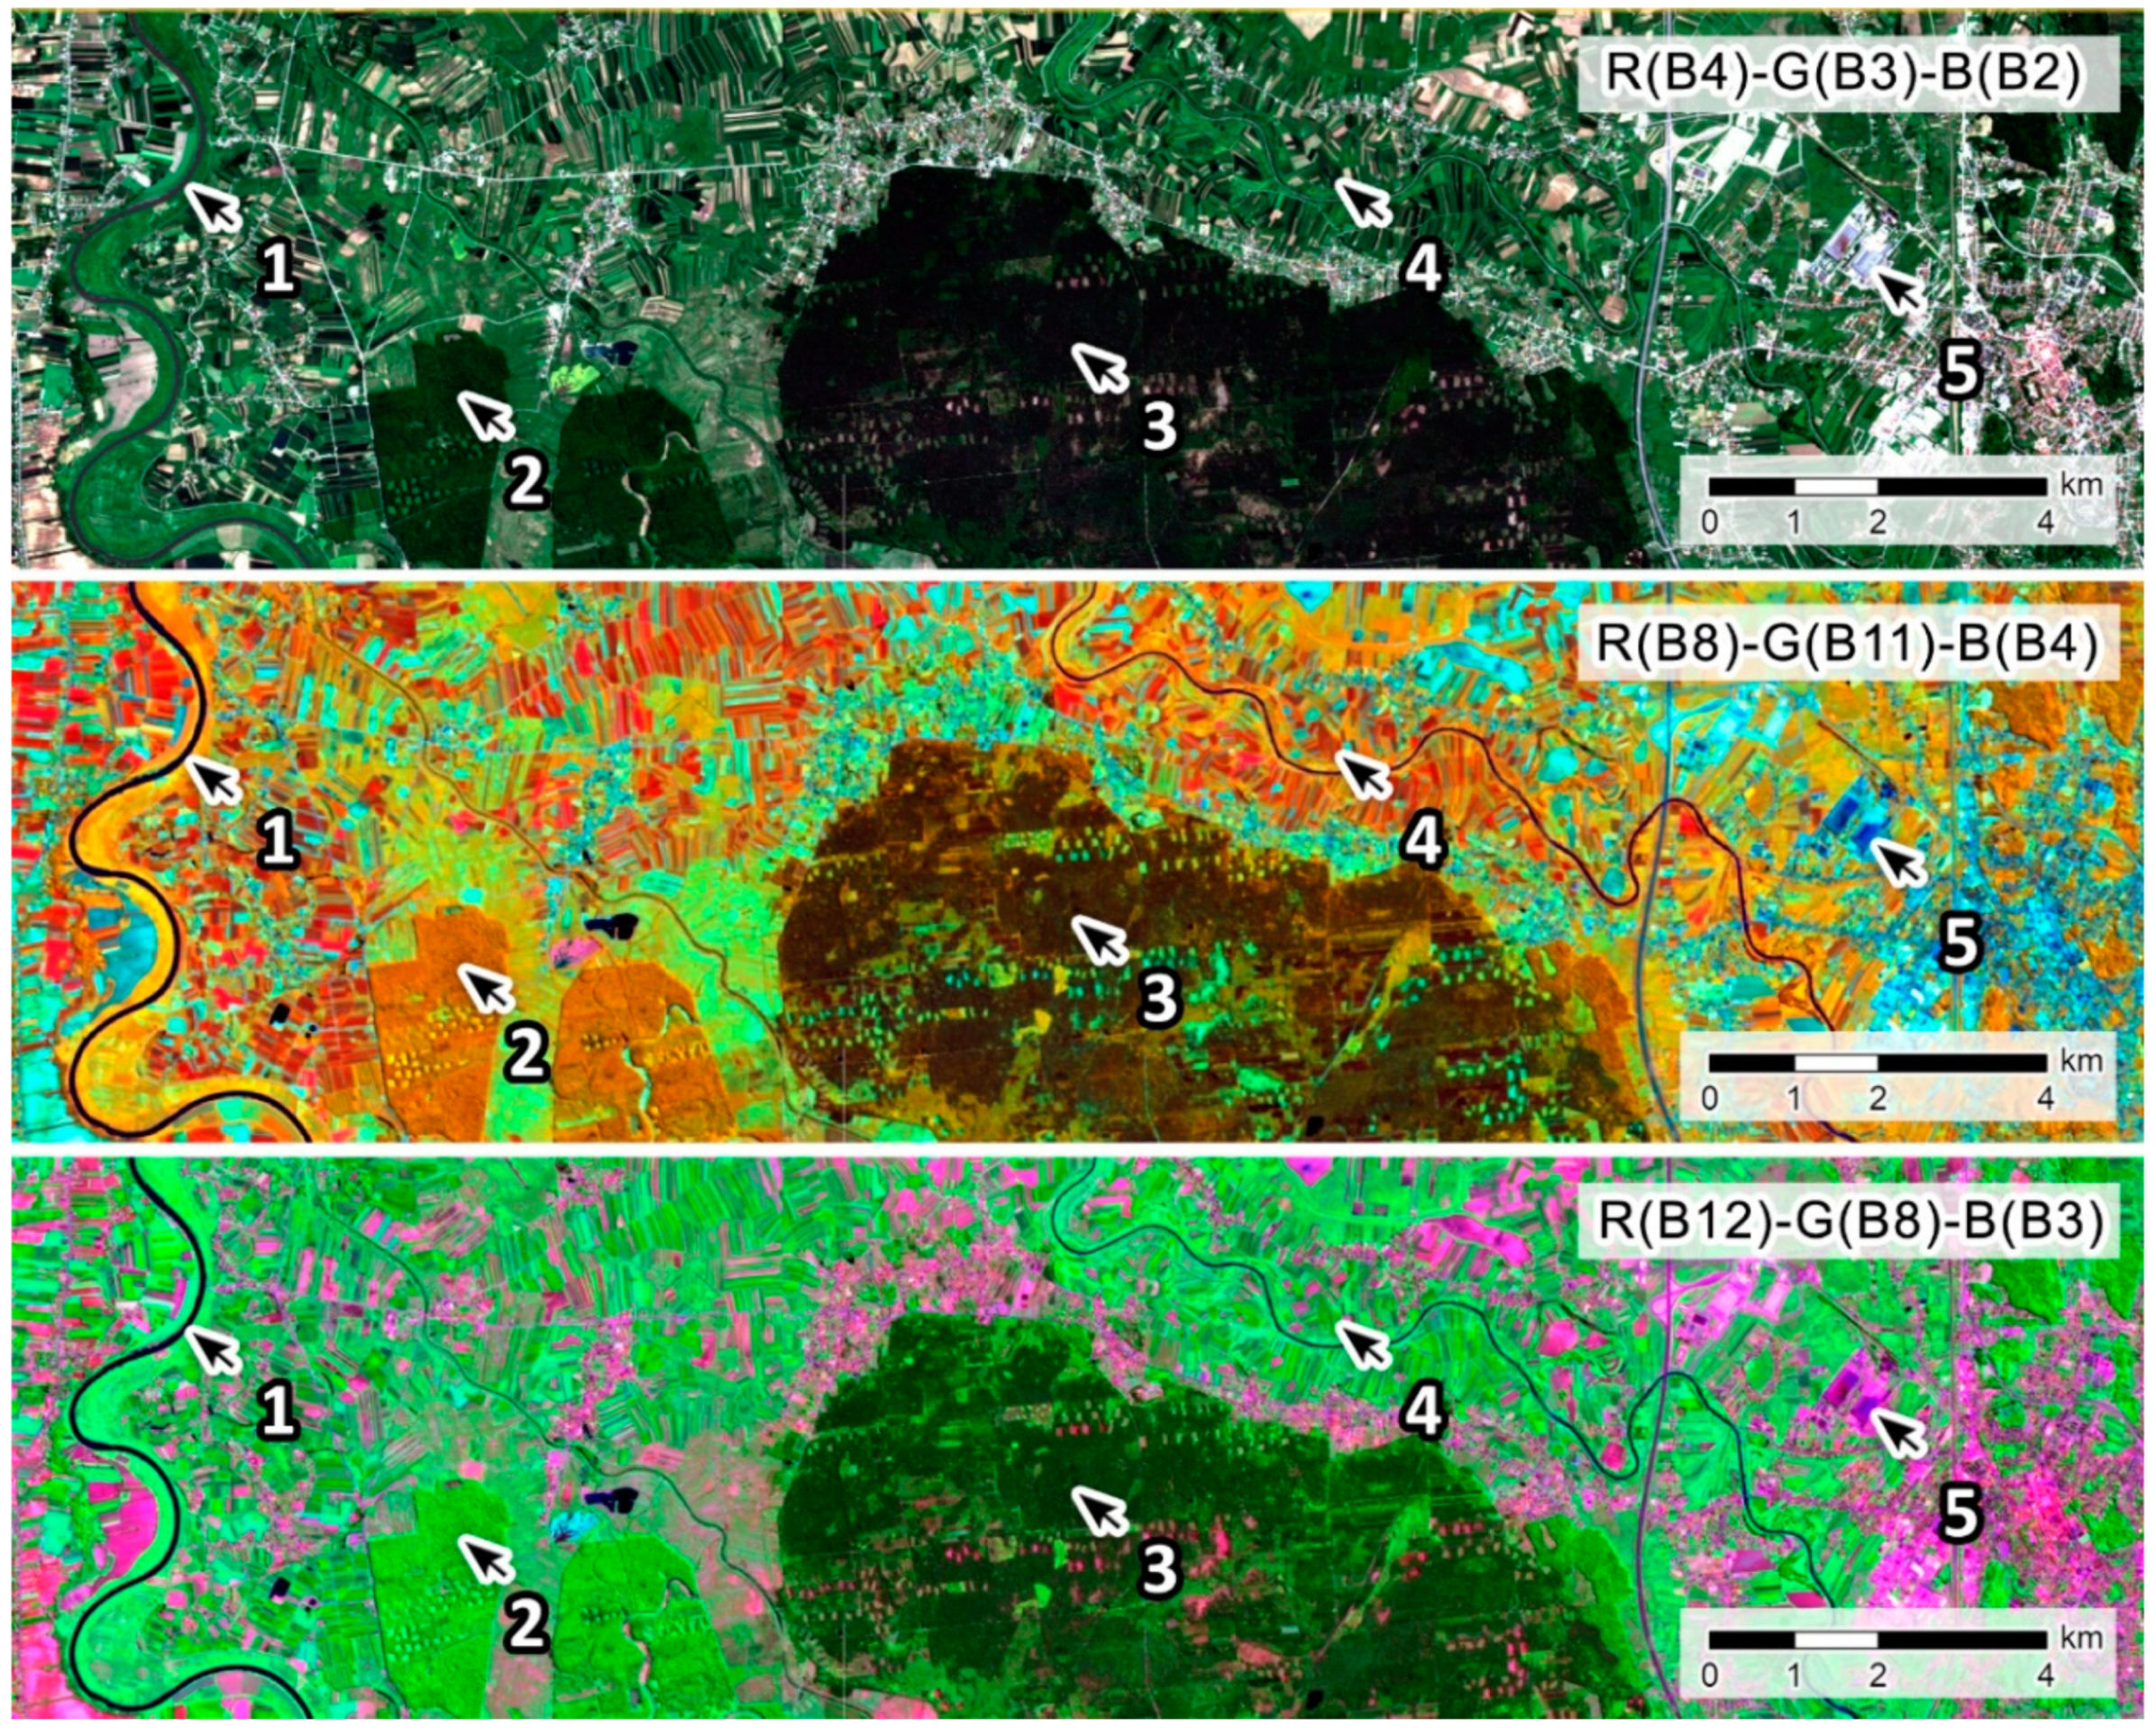
  • to provide an opportunity for students to work with real satellite data using dedicated software (in contrast to the current practice where satellite images are used in printed form);
  • to show students that they can analyze up-to-date satellite images that show the surroundings of their schools so that the subject is familiar instead of abstract;
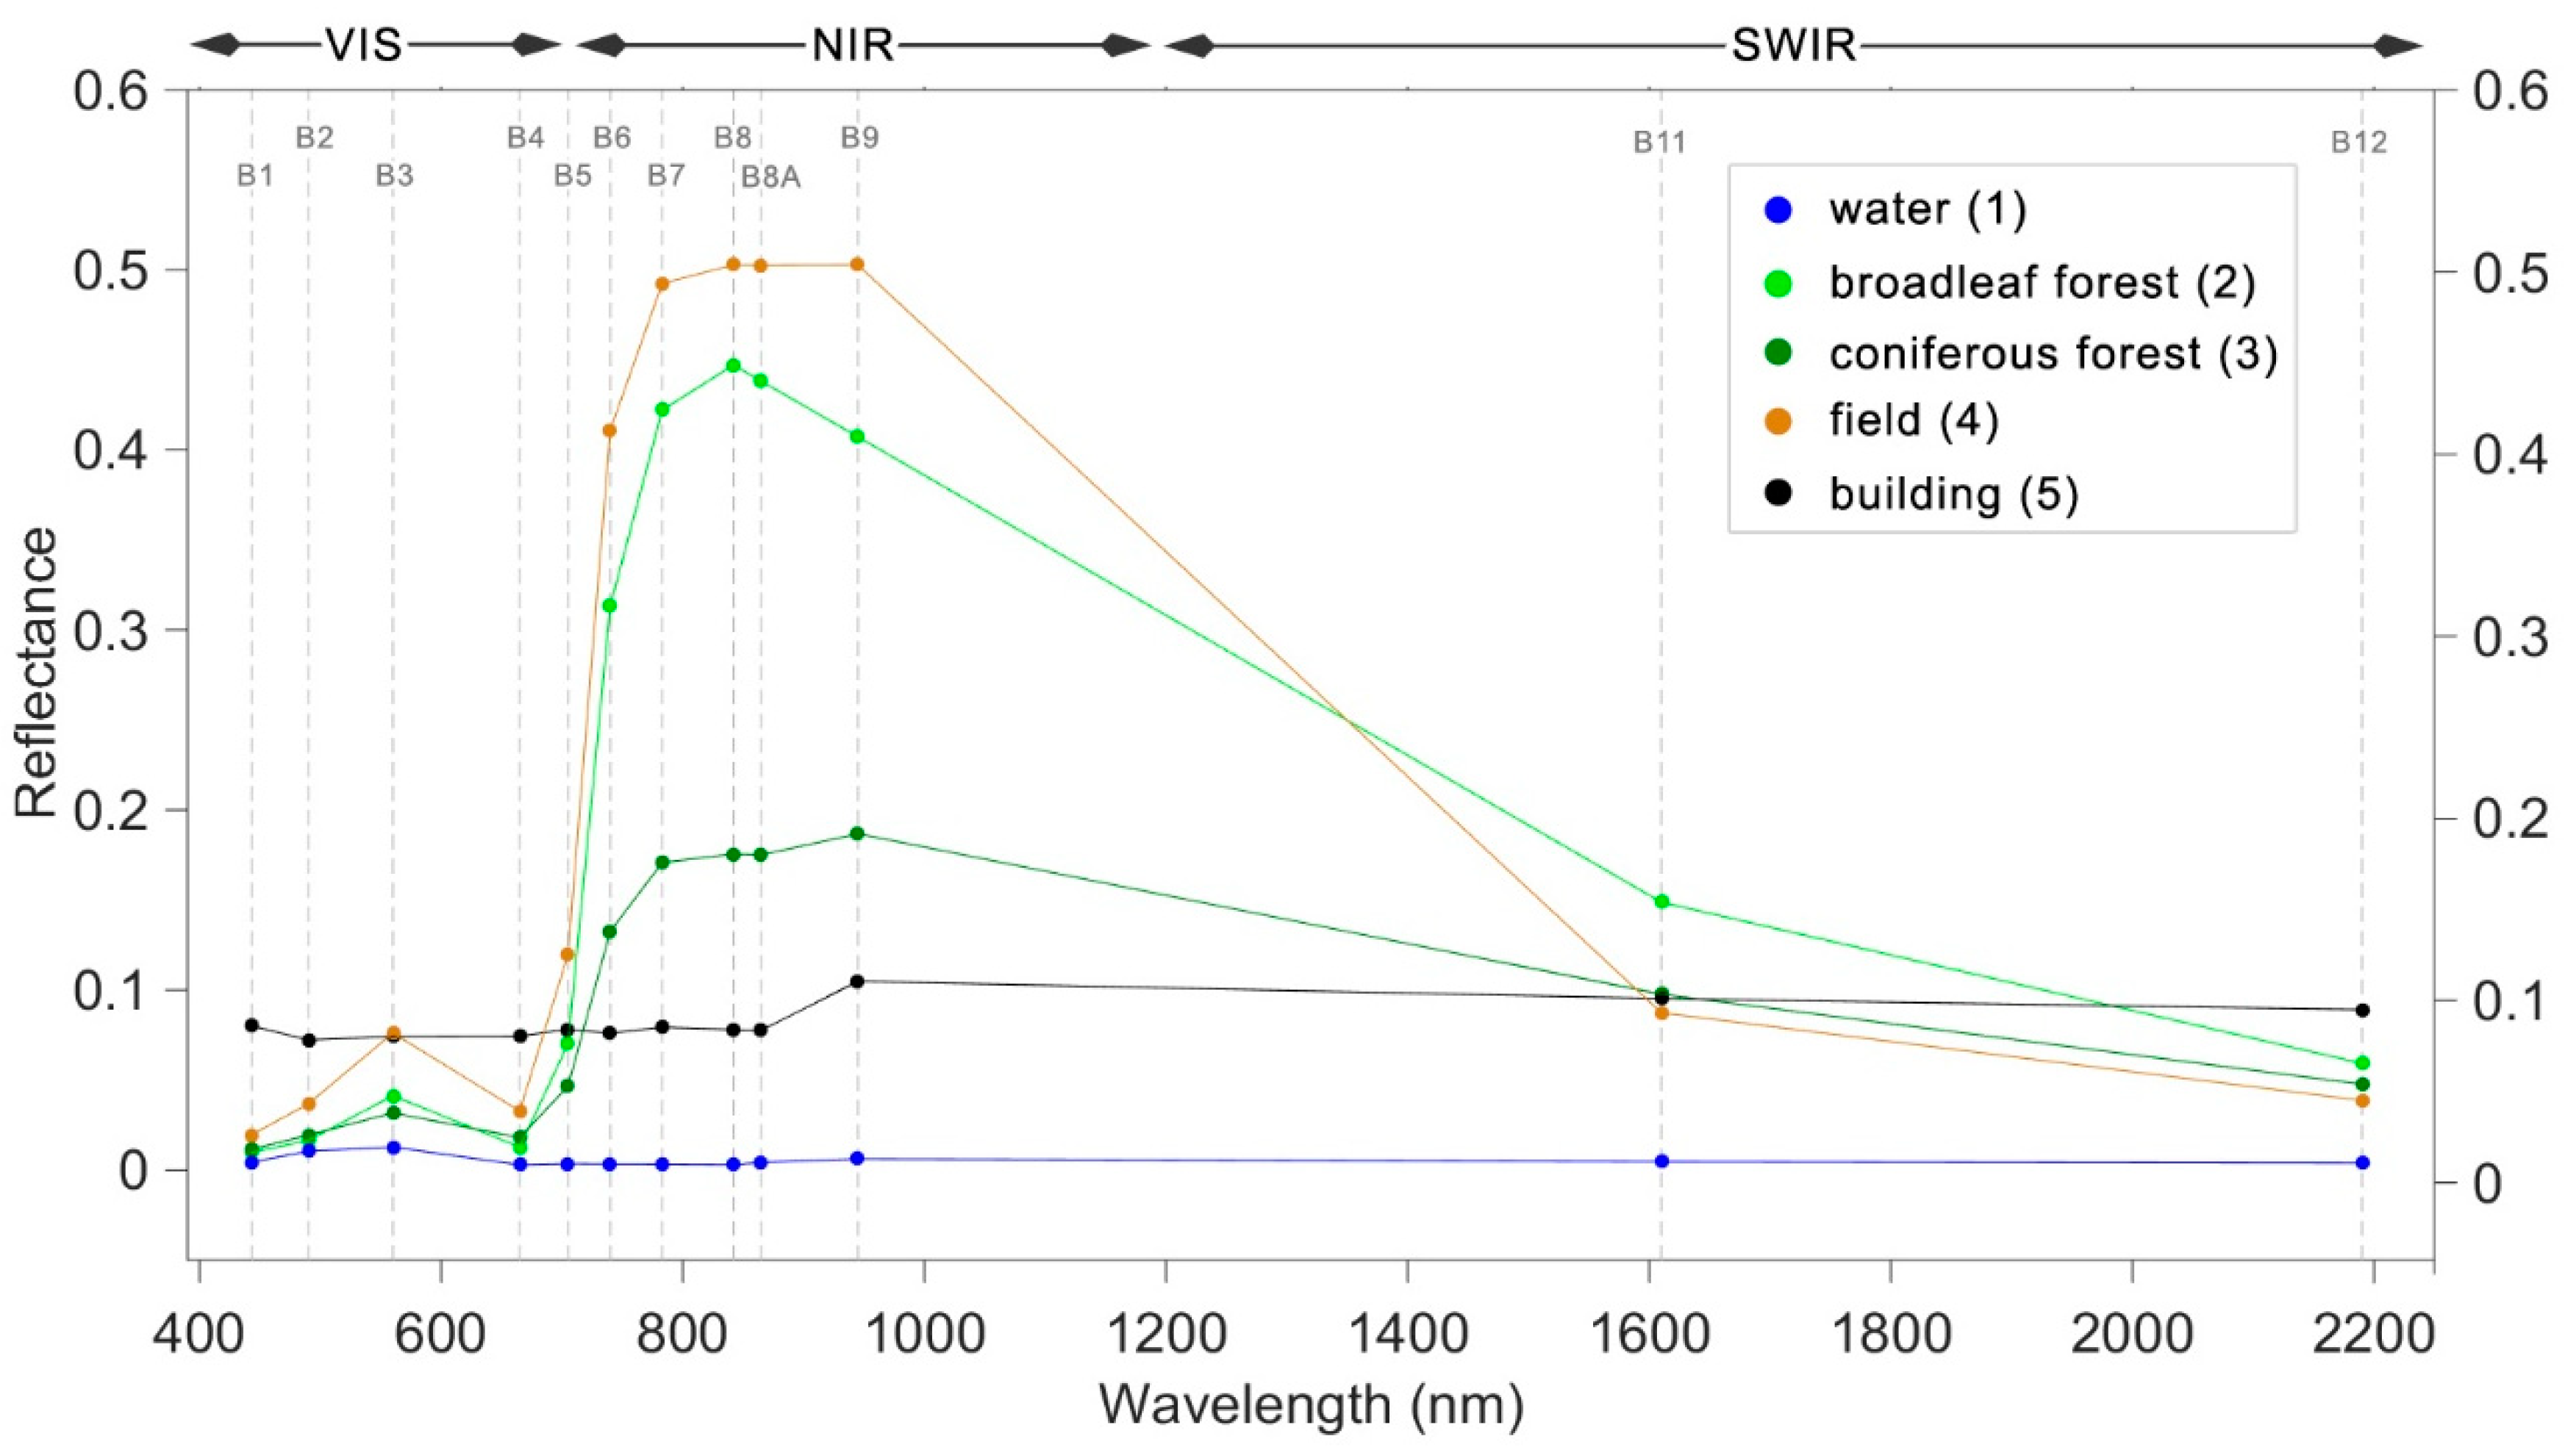
  • to show a practical application of the physical phenomenon of electromagnetic waves;
  • to demonstrate a mapping approach used in modern geography;
  • to show analogies between technology and biology;
  • to make students feel like real scientists doing their own experiments in digital environment;
  • to underline the necessity of a critical view of results;
  • to encourage students to choose future careers related to the Earth observation sector; and
  • to make science learning more attractive.
It was assumed that students already had basic knowledge about the electromagnetic spectrum (physics), maps (geography), human sight (biology), and digital graphical data (ITC).

2.2. Requirements

To implement the project, we used imagery acquired by Sentinel-2 satellites within the European Copernicus program. This provided the highest level of detail among freely available satellite imagery with a large number of spectral bands (13). Alternatively, images from the Landsat program could be used. Thus, students could work with data that presented the area around their school, which they are familiar with. All tasks prepared for students could be done using the Sentinel Application Platform (SNAP) [32], which is a free, open source toolbox designed for the scientific exploitation of Earth observation missions. Materials for teachers included an introduction presentation with a description for each slide, a step-by-step manual for exercises, and a sample of Sentinel-2 data (see Supplementary Materials).

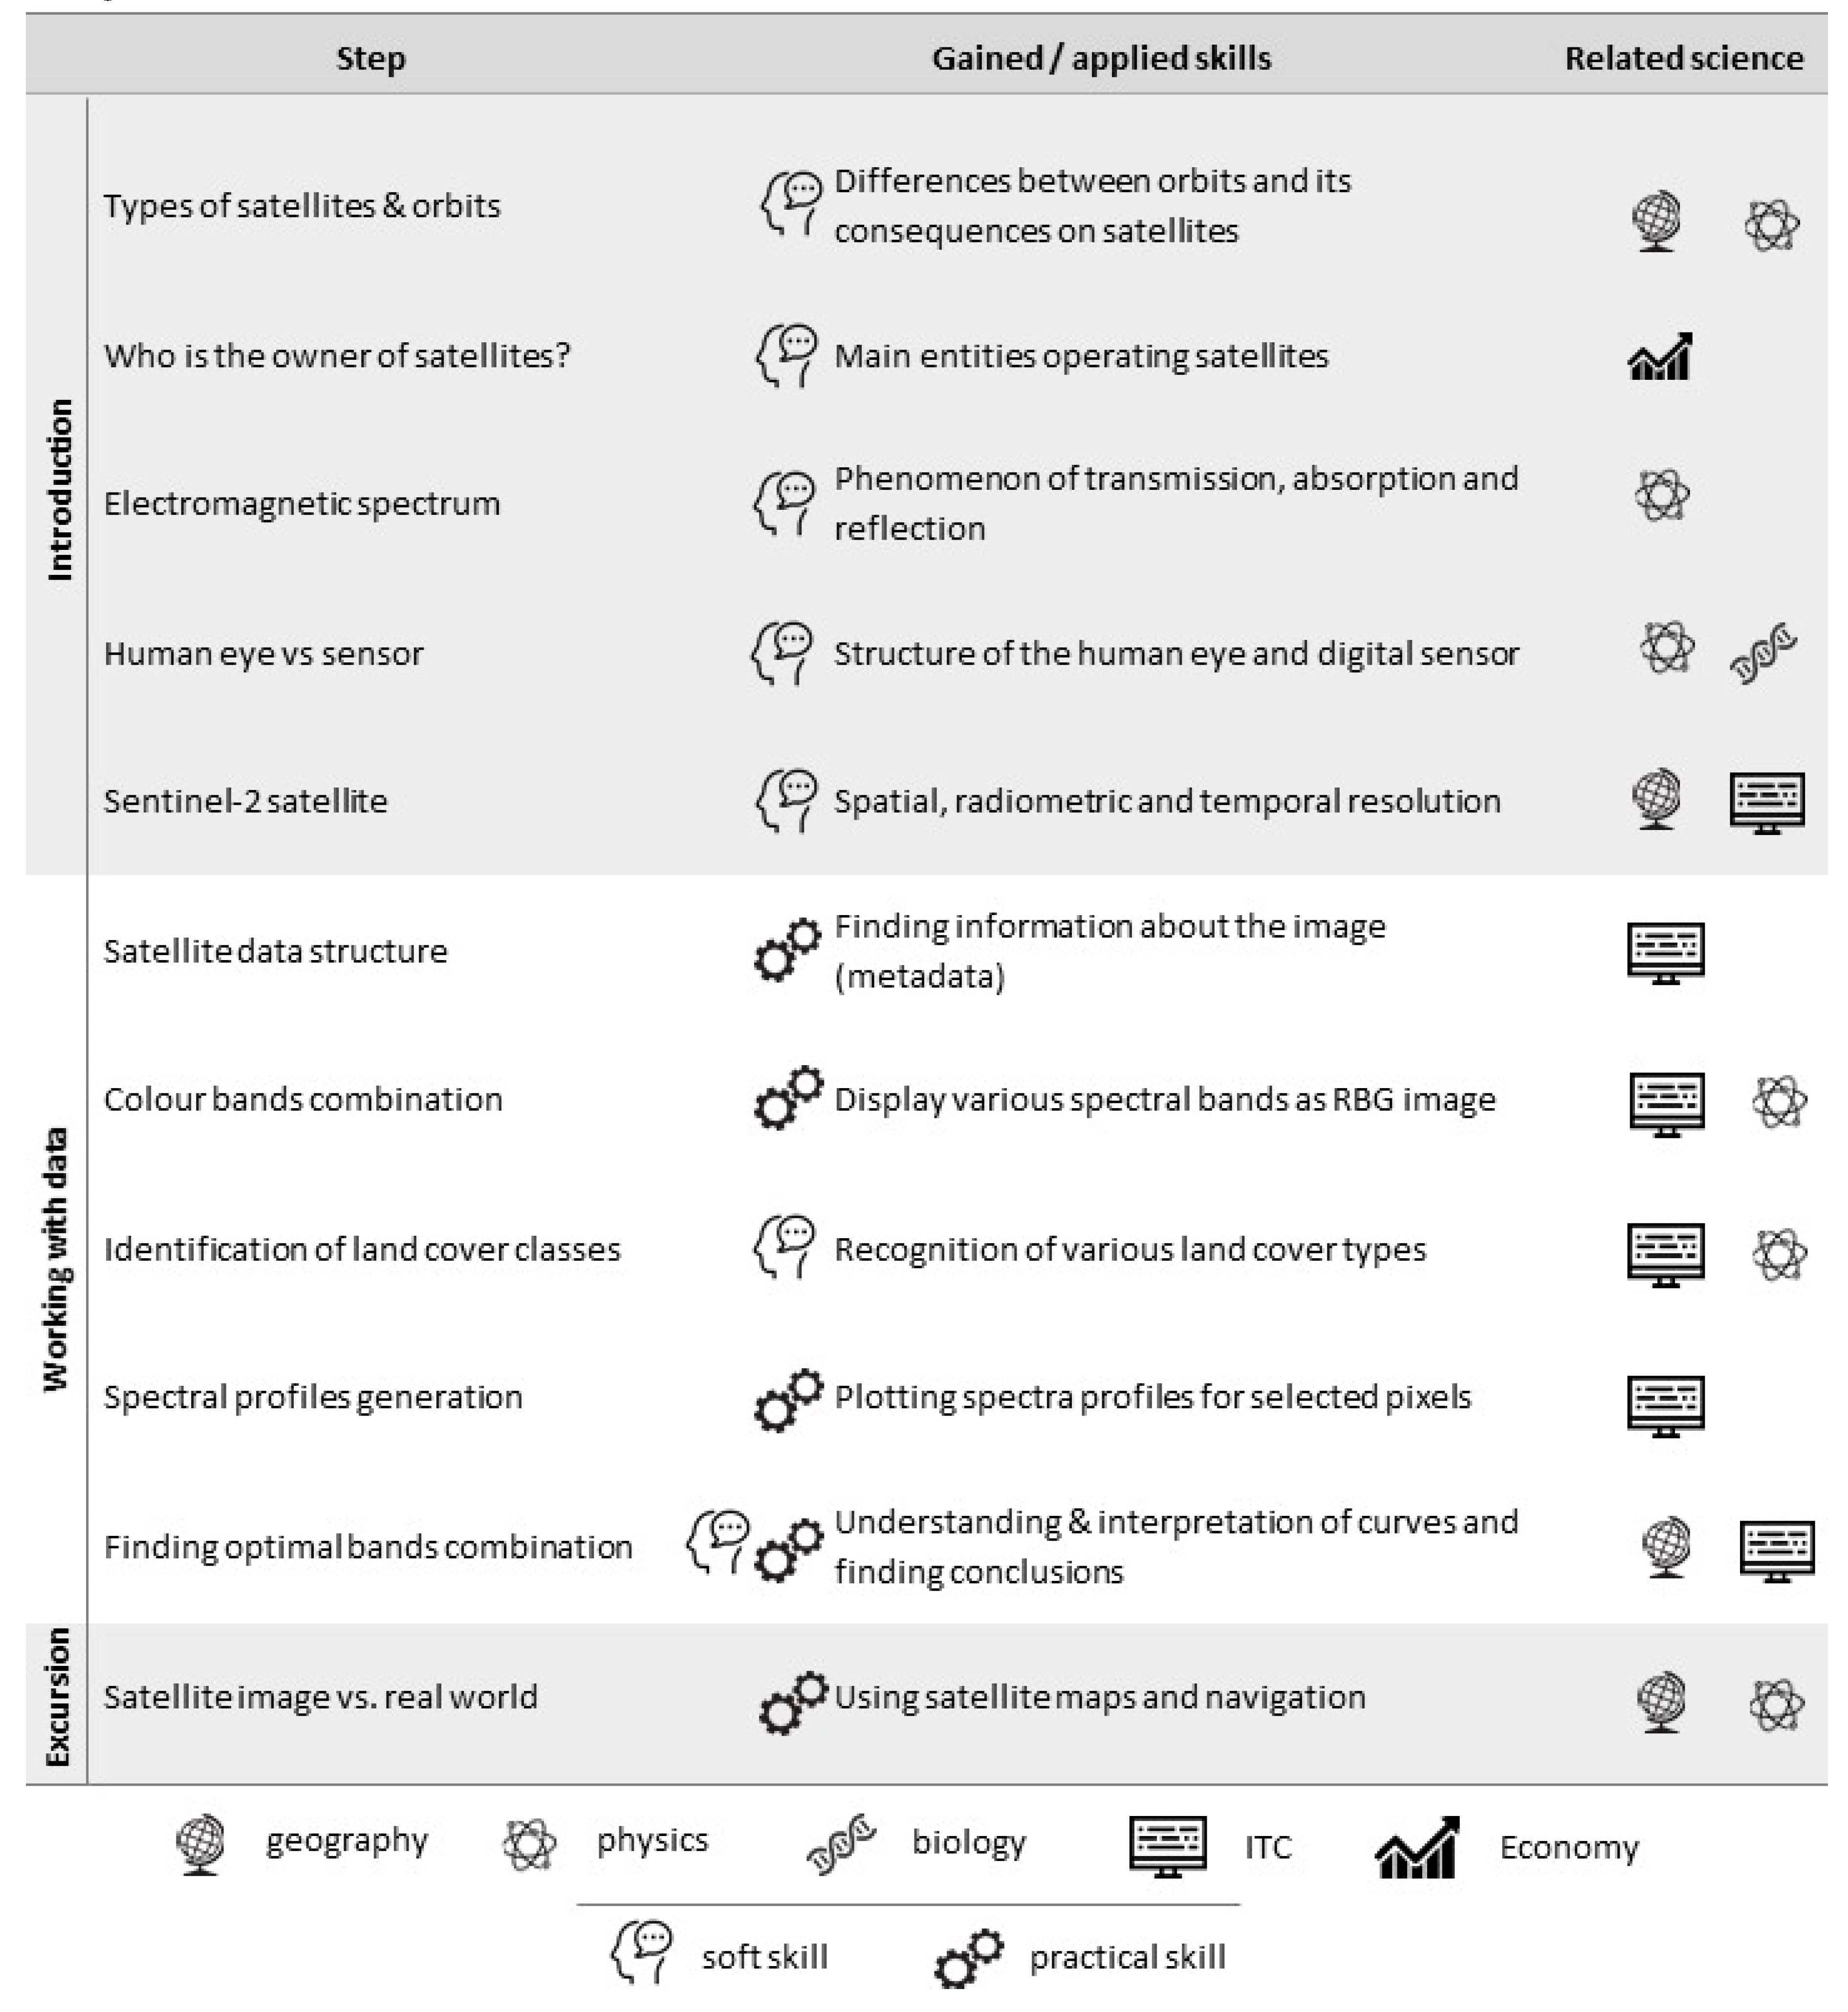
2.3. Scheme of the Project

The overall project contained three parts: (I) the introduction, (II) working with data, and (III) the field excursion. The scheme of the project is presented in Figure 1. In the introduction section, the problem of analysis of land cover in the area surrounding the school was presented. A discussion about possible sources of information and their advantages and disadvantages was carried out. Students were led by the teacher to conclude that satellite images can be a good source of data. Then, students became familiar with general information about satellites. This included understanding the differences between natural and artificial satellites, the types of orbits and their influences on satellite images properties, such as their spatial and temporal resolution, in relation to the problem being considered.
In addition, information related to satellite cost and ownership was outlined and the unbalanced share of satellites owned by the USA (over 900 satellites) versus the rest of the world (over 700 satellites) was mentioned. The main interaction with physics was covering the topic of the electromagnetic spectrum and its role in Earth observation. Students became familiar with (or reminded of) the ranges registered by satellites, as well as terms like transmission, absorption, and reflection by understanding their significance with regard to Earth observation techniques (it was recommended that teachers introduce this project after lessons about the electromagnetic spectrum since this topic is addressed within the project). Knowledge from biology and ITC was combined to answer the question of how satellites can see the Earth. To answer this question, similarities and differences between sensors and the human eye were enumerated. One of the conclusions related to the broader perception abilities of imaging sensors relative to the narrow range registered by the human eye. Methods of producing color images were also mentioned. The final part of the introduction was focused on specific image parameters that could be used in other parts of the lesson. We proposed to use satellite images acquired by Sentinel-2A or Sentinel-2B. They were located at the same orbit and provide images of the same area every five days in 13 spectral bands. Depending on the wavelength, the spectral bands could be acquired with 10 m, 20 m, or 60 m pixel sizes.
In the second part of the project, students had an opportunity to work on real data: satellite images of the area around their school. All steps within this part were presented by the teacher and applied individually by each student. First, file structures were presented. A Sentinel-2 image provides 13 spectral bands, but computers could display images using only three bands at once. The students displayed a natural color composition and analyzed how many types of objects could be recognized. Then, they tried other false color band combinations (e.g., Figure 2) to understand whether the possibility of object recognition changed.
This raised the issue of determining which bands should be used. The discussion moderated by the teacher typically lead to the conclusion that the correct band choice depends on the purpose of the project. Once students had tried empirically to find the best band composition for land cover recognition, an explanation of the spectral properties of various objects was given and the concept of spectral profiles of objects was introduced. The teacher provided instruction on how to collect spectral profiles from an image and explained how to interpret the resulting curves. For example: water absorbs most electromagnetic radiation, resulting in a flat spectral profile with a reflectance that is close to zero and black color in all band combinations. Another flat profile is that of a building. In this case, we chose a large building with fabric construction and a white roof in natural colors (combination of bands B4-B3-B2). That the spectral values are almost identical explains the white color on the image, etc. Students collected spectral profiles of various objects that they expected to be able to identify on the image based on their personal knowledge of the terrain (Figure 3). To verify understanding, samples of spectral profiles were compared between students, and the students and teacher checked that the profiles matched the corresponding objects. Next, the students found the optimum band combinations based on the spectral profiles of the objects. Shape analysis could allow them to select the bands in which reflectance varied for specific objects. There could sometimes be several appropriate solutions. When this occurred, all such solutions would be synchronously displayed and compared.
The third part of the lesson consisted of a field excursion. Students displayed the color composition of an image that they selected on tablets or mobile phones and checked the terrain to see if their interpretation of the object was correct. Moreover, they tried to explain why various parts of the forest are the same or different on satellite images and why some objects are visible but others are not.

3. Project Verification

3.1. Methodology

This project was presented to 39 high-school teachers and 184 high-school students (K-9 and K-10) during the summer semester of the 2019/2020 school year. The teachers who participated in the project taught the following subjects: geography (9), biology (8), chemistry (4), physics (9), mathematics (5), and informatics (4). The students were from classes with various extended profiles. Due to pandemic restrictions, activities were conducted online, therefore without field excursion. Participants had the opportunity to access prepared data and software beforehand. All participants were volunteers from various Polish schools. After the activity, teacher and student opinions about the project were collected. The teachers were interviewed using four main questions:
  • (QT1): What is your opinion regarding the project? Do you think that it might be interesting for students?
  • (QT2): Do you think that it is possible to carry out the project at school? What difficulties do you expect?
  • (QT3): What do you think are the project’s advantages and disadvantages?
  • (QT4): Can these types of projects influence student interests and choices with regard to field of study?
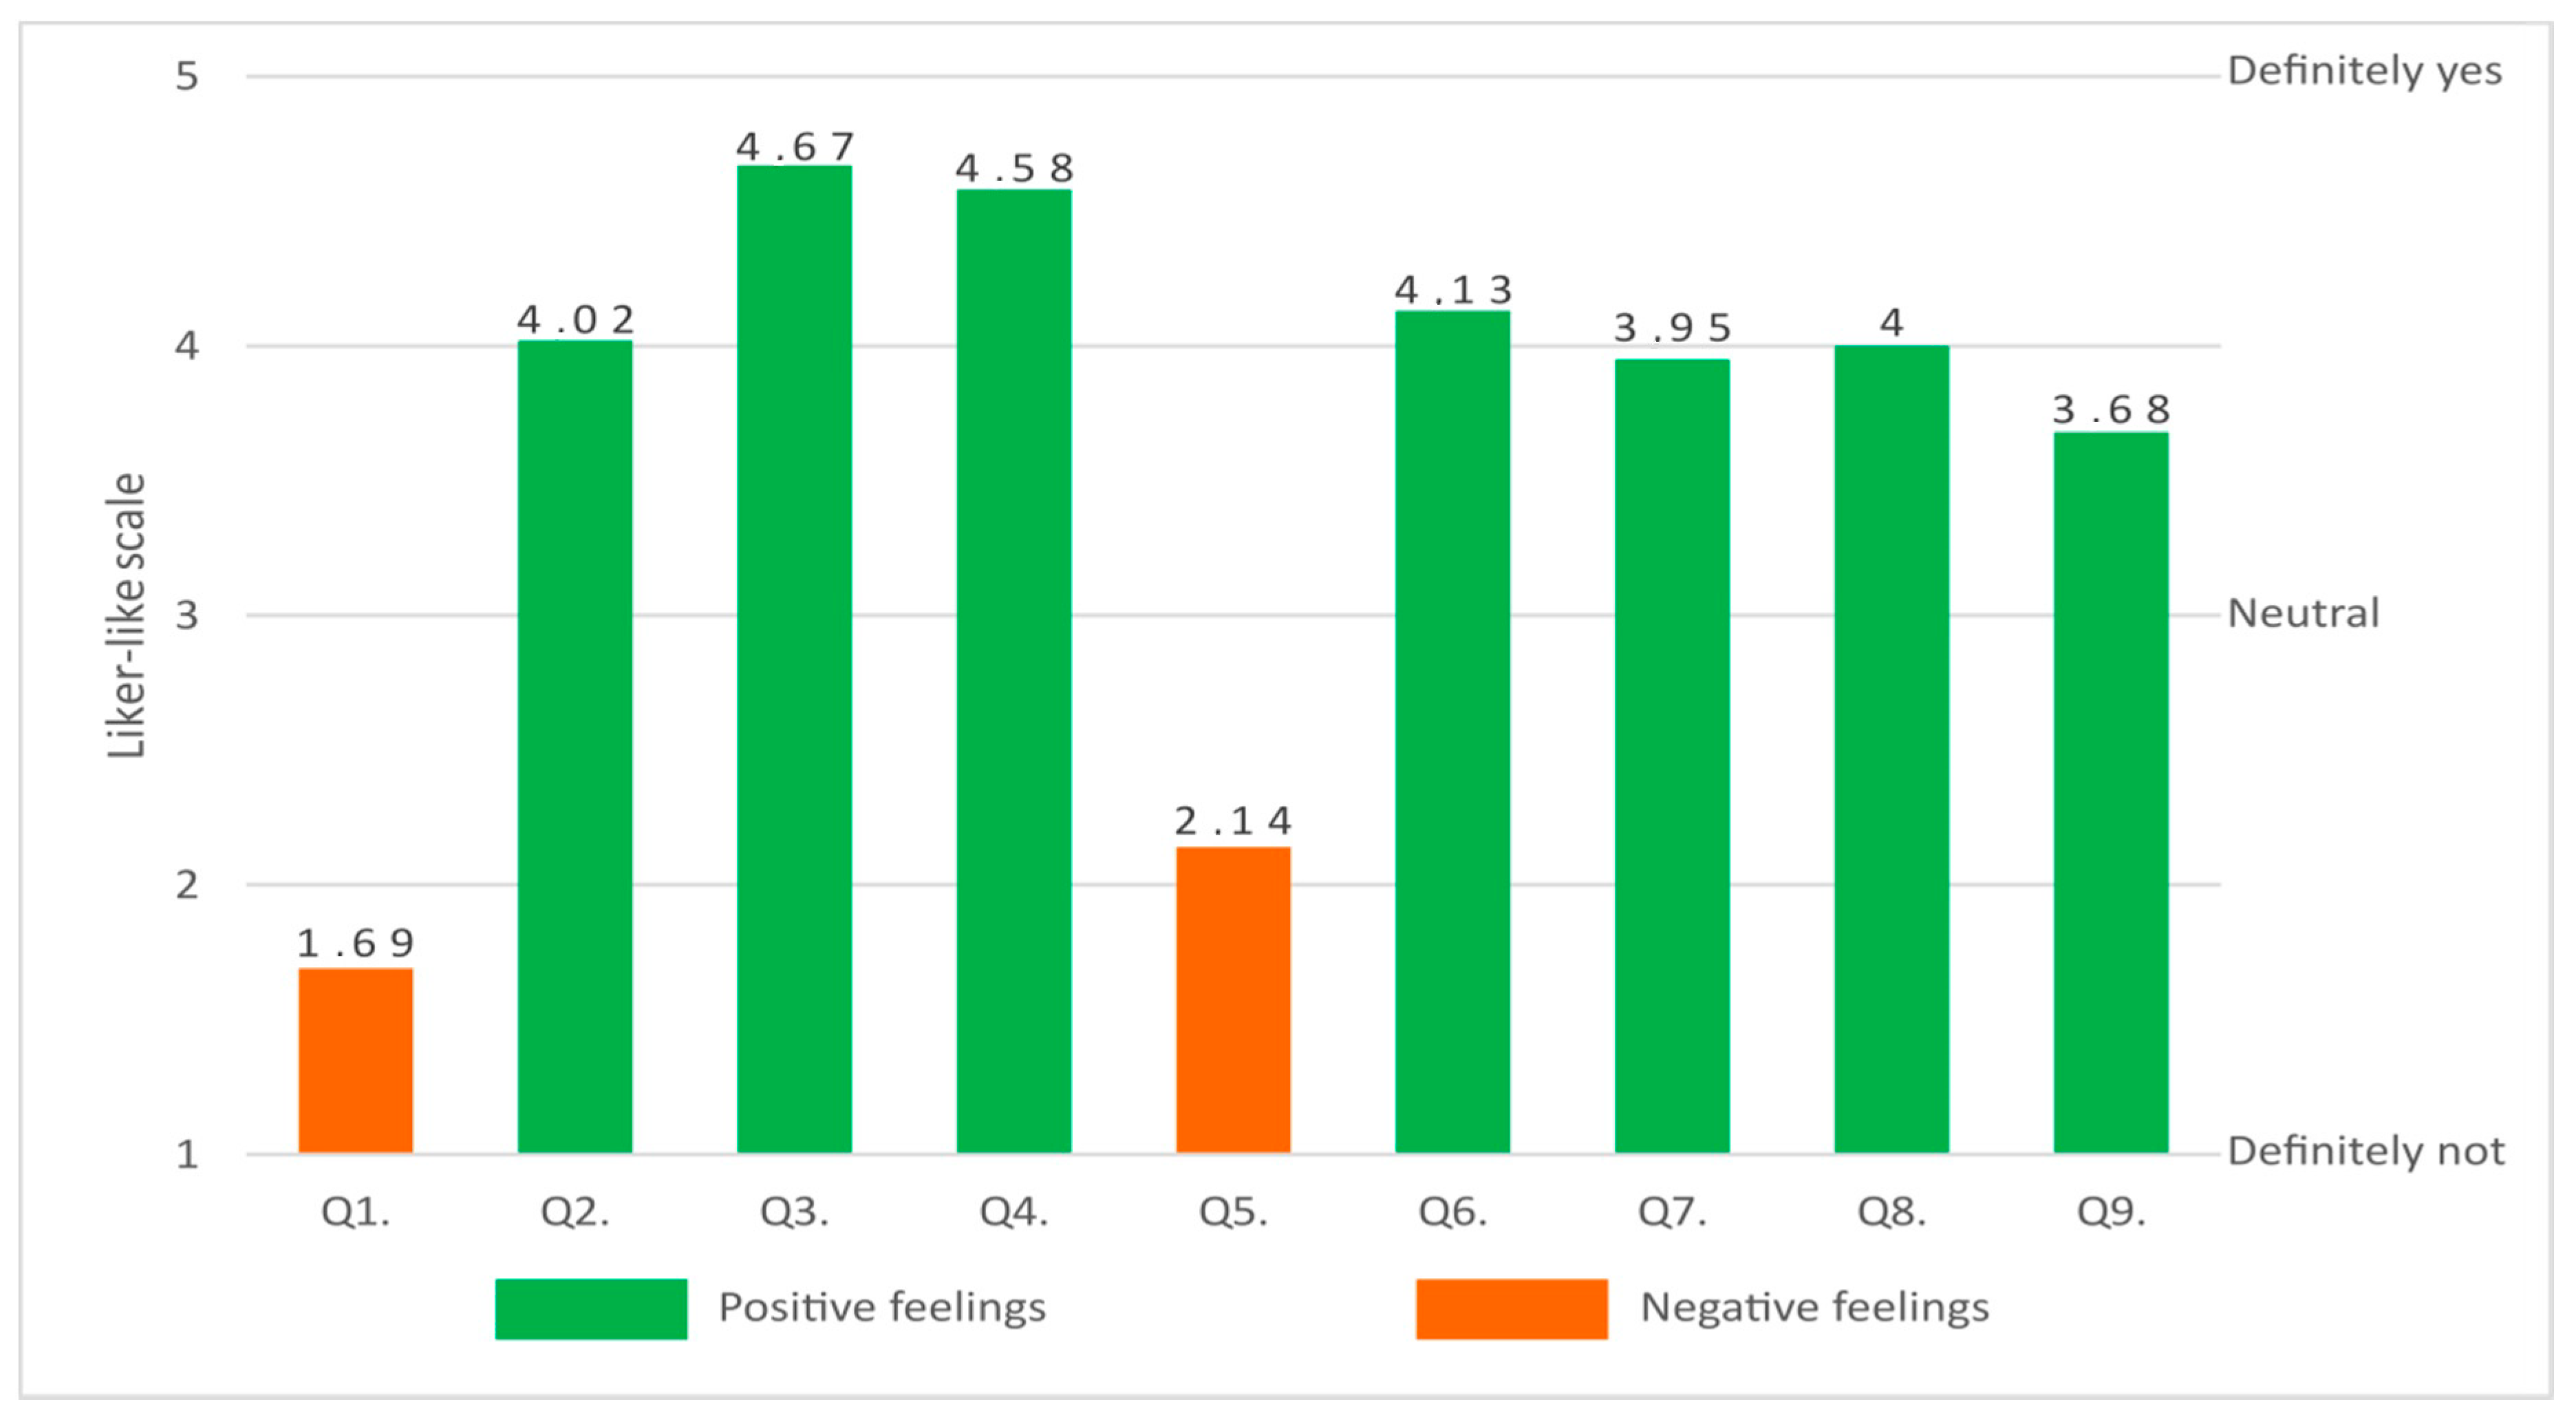
Students were asked to state their agreement to the nine sentences (see Table 1) on a Likert-like scale. We summarize their answers later in this paper. Both approaches are widely used to evaluate introduced educational innovations [33,34] and in the field of remote sensing education [35].

3.2. Results

The first question asked of teachers was: “What is your opinion regarding the project? Do you think that it might be interesting for students”? The vast majority (92%) of teachers said that the project was interesting and might be interesting for students. They stressed the substantial benefit from working on real data that students could obtain by themselves. Some of them (36%) said that this was a type of real scientific experiment that could bring science closer to students and also show how laboratory work takes place. We cite one of the geography teachers:
“It is tremendous that students could finally feel how various maps are created! Even when we discussed maps during lessons, they never bother their heads with questions about how maps are prepared or what additional information they provide. There is a big difference between working on a map from an old atlas with low resolution, for instance with an entire country on one page, and working on freshly acquired data of their own neighborhoods. Of course, the latter wins”.
The second question was: “Do you think that it is possible to carry out the project at school? What difficulties do you expect”? All teachers agreed that the project could or even should be conducted at school. However almost half of them suggested offering it as an additional class instead of during a regular lesson. In total, 15 teachers indicated that computer availability might be a problem, especially when the entire class would be working. A quarter of them expressed concern that they would have to spend a lot of time beforehand to prepare to teach the software. They suggested that preparing detailed instructions for students in advance would make their work easier and more comfortable. One biology teacher said: “I am afraid that I might not be able to handle this software, but the students certainly will. It is great to connect this activity with outdoor hands-on activities and field trips, which are already in the curricula. Combining plant recognition and IT technologies can motivate students to act and consider plant cover more broadly”.
Third, teachers were asked about the advantages and disadvantages of the project. With regard to the additive value of the project, teachers mainly mentioned working with real data (87%), the possibility of adjusting the project to fit regions and times of interest (79%), the possibility that the students could generate their own color maps (64%), and combining knowledge from various subjects (49%). It is interesting that a few (18%) teachers noted the latter point as a difficulty. For example, a physics teacher said: “I can simply introduce how satellites work, what they are, how an electromagnetic wave is reflected, or how a spectral curve appears, but it will be hard for me to interpret various color maps. For this, I will need assistance from a geography or biology teacher or really good descriptions of the maps in advance”.
This request for additional materials for themselves was the most common project shortcoming mentioned by the teachers (64%). Before teaching, they would like to have and familiarize themselves with a description of the color maps already included in the Sentinel-2 images as well as examples of possible interpretations, e.g., deciduous and coniferous forests in various maps. We notice, however, that these are comments that allow them to feel more confident in the project, which they all judged to be very interesting.
Finally, the teachers were asked if such projects could influence students’ future careers and directions of study. In the responses of 24 teachers there was a suggestion that this might depend on the class and the subjects in which they sought to advance. They believed that such a project would not change anything for a student who joined a biological-chemical class with the intention of medical studies in future, but that it might change the rest of the class. This is especially true since a high school student knows only a few obvious professions, such as construction worker, architect, or surveyor, and does not know many others. The best summary of this phenomenon came from a math teacher: “We definitely need to broaden student horizons. They usually think about studying in run of the mill way: they know only a few of the most popular fields. Any activity like this shows them something new and can inspire at least some of them. Of course, not everyone will consider remote sensing, but everyone will see that it exists. That is a lot”.
Mean values of student answers to the nine questions discussed earlier are presented in Figure 4 (more detailed descriptive statistics of students’ answers are available in Appendix A).
In general, students judge that the project is interesting (inversion of Q1: The project was boring). They appreciate working with real data (Q4: It was interesting to work with real data) and they want to have such classes at school (Q3: I would like to have similar classes at school). The answers to these three questions are closest to the ends of the scale, so they can be considered the strongest student beliefs. This is an important finding since it shows how the idea of introducing a remote sensing element into school is perceived by students. In addition, students notice that the project combines knowledge from various subjects (Q6: The project combines knowledge from various school subjects), but they do not find it difficult to do (Q5: The project was too difficult). The quite strong mean answer to Q2 (The project showed me that not only astronomers deal with satellite images) is also interesting, since it shows the extent of misconceptions about remote sensing among students. Questions Q7 (Such classes can increase interest in science subjects among my colleagues) and Q8 (More classes of this type would help me choose a future profession) indicate that the project not only changes their view about their future but also might influence their colleagues. It is also positive that at least a small number of students are motivated by the project to work further with satellite data (Q9: I will try to find and analyze satellite data of my area on my own).

4. Discussion

Both students and teachers indicated that the project was interesting. This was because of the topic itself, use of color maps of the vicinity, and the proposed form, which represents a beneficial problem-based approach [36,37,38,39,40] to finding the best band configuration for better land cover recognition. It is well known that students are more willing to learn what they find the material to be relevant and interesting [41,42,43]. Thus, such a project may change the attitudes of some students towards science, as noted in the student questionnaires. The topic requires knowledge from various fields and therefore demonstrates connections between school subjects and connections between school-based knowledge and real scientific and industry applications. The problem of rifts between school-based knowledge and student experiences from real life is already presented the literature [44,45,46,47]. Projects such as this one might address these rifts by demonstrating relevant applications and relationships. This is quite important nowadays, when scientific disciplines intersect and both literacy and curiosity with regard to science are increasing [22,48]. Such projects create opportunities for teachers to cooperate with others, share their subject-matter knowledge, and establish connections between STEM subjects. This is in line with actual trends in education, and puts forward the idea of teaching STEM subjects together without dividing science into increasingly specialized disciplines [49,50,51]. Teachers are willing to pursue such a challenge but require a guidance and support, which can be provided by researchers via preparation of such projects and training opportunities [52,53,54].
The project deals with digital data and IT software. It is interesting to note that this might be difficult for teachers, but not for students. Students use IT everywhere. They are familiar with it and therefore learning another “app” is not a problem for them. This project also gives students a new view of science. Many school experiments are conducted using traditional equipment, which is legitimate [55,56] but can also increase students’ feeling that science is out of date [57]. Introducing ICT into to schools is a popular trend in education [58,59,60,61], which this project follows. Playing with digital data via sophisticated software is not an obstacle, but rather motivates students to gain knowledge.
According to the teacher and student opinions, this simple (from a remote sensing point of view) project allowed students to become acquainted with new technology used by Earth observation specialists. They got to know basic properties of satellite images (spatial, temporal, and spectral resolutions) and had an opportunity to use professional software. Thanks to the application of the project to an environment that the students were familiar with, image interpretation was easy and students absorbed complex concepts effortlessly. The field trip permitted to evaluate the findings and underlined the necessity of result validation. It is worth stressing that similar positive findings about introducing elements of remote sensing at the pre-university level are also presented in other research [27,35,51]. Since this is an unexplored area, especially for teachers and pupils, they need a strong guidance from researchers [52]. However, pupils, teachers, and researchers agree that it is worth the effort. Another important aspect is that the project can be easy modified in several ways in order to make it even more attractive to students:
  • it can be placed in a wider real life context, e.g., students can be asked to act as urban planners and to find the best locations for new investments such as roads, industrial areas, etc., in their neighborhoods;
  • temporal changes in land cover can be analyzed using updated and historical data;
  • the project can focus on one type of land cover, e.g., vegetation, which can be analyzed in a more detailed way;
  • images from different parts of the world can be used to show students other environments, e.g., peat bogs and deserts, or concerns other than land cover such as geology and water resources; and
  • night-time images may be additionally used in the context of urbanization [62] and light pollution issues [63].
Notice, however, that in this paper primarily the opinions of students and teachers were presented. This is sufficient to let one conclude that the project might be introduced to schools and students might benefit from it. It also provides a way to introduce further, more specific studies. For example, one might seek insight on which educational strategies influence students during the project. Further studies could also be conducted to verify the effectiveness of the project with other age groups.

5. Conclusions

The project presented remote sensing as a tool that integrates basic concepts that are already included in basic school subject curricula. It also allows schools to extend students’ knowledge about Earth observation resources and techniques. Due to its form, it also develops soft and scientific skills among students.
The project was presented to 39 high-school teachers and 184 high-school students. The teachers concluded that the project was interesting and might be attractive to students as it combines knowledge from various school subjects. They underlined, as a form of added value, the opportunity to work with real, up-to-date satellite data from specific regions. The manner of implementing the project, which was considered a small experiment, was also appreciated. Teachers concluded that the project can bring students closer to scientific work. Teachers appreciated that the project gives students a broader view of career possibilities. Although the teachers were quite enthusiastic about the project, they pointed out that it required additional preparation from them, especially regarding the use of software, which took them out of their comfort zone. Thus, they asked for highly detailed auxiliary material. Moreover, access to computers in the classroom was identified as a possible constraint on application of the project in schools.
Students evaluated the project positively. They found it interesting and expressed their wish to have more such classes at school. In the students’ opinion, the project was easy to implement. They also underlined its interdisciplinary character. Critically, students had a positive impression regarding the influence of the project on their interest in science. They declared that this kind of project would help them to choose a professional career and that this project encouraged them to analyze satellite data by themselves.
Based on the teacher and student opinions, the introduction of remote sensing into the secondary school classroom could produce desirable effects for the Earth observation sector, as it increases students’ interest in the subject. However, further studies should be done to remove the novelty effect.

Supplementary Materials

The Colors of Earth and other educational projects are available at: http://sat.cbk.waw.pl/.

Author Contributions

Conceptualization, D.D., M.K., E.W., and R.G.; methodology, D.D., M.K., E.W., and R.G.; validation, D.D.; formal analysis, D.D.; investigation, D.D.; resources, M.K.; data curation, M.K.; writing—original draft preparation, D.D., M.K., E.W., and R.G.; writing—review and editing, D.D., M.K., E.W., and R.G.; visualization, M.K.; project administration, R.G.; funding acquisition, R.G.. All authors have read and agreed to the published version of the manuscript.

Funding

This research was funded by FPCUP project which is financed by the European Commission under the FPA no.: 275/G/GRO/COPE/17/10042.

Acknowledgments

This paper was supported by the SAT Project (‘Od śrubki do satelity—dobre praktyki w nauczaniu fizyki w gimnazjach oraz fizyki z elementami astronomii w szkołach ponadgimnazjalnych’) completed within the framework of ERASMUS+ Key Action 2—Strategic Partnerships, Project No: 2015-1-PL01-KA201-016801.

Conflicts of Interest

The authors declare no conflict of interest.

Appendix A

Table A1. Basic descriptive statistics for students’ answers on 9 questions.
QuestionMeanSDMedianMinMaxLower QuartileUpper Quartile
Q11.690.782.001.004.001.002.00
Q24.021.034.001.005.003.005.00
Q34.670.485.003.005.004.005.00
Q44.580.625.002.005.004.005.00
Q52.140.872.001.005.002.002.00
Q64.130.714.003.005.004.005.00
Q73.950.934.001.005.003.005.00
Q84.000.674.001.005.004.004.00
Q93.680.954.001.005.003.004.00

References

  1. Gupta, R.P. Remote Sensing Geologyp; Springer Publishing Company Inc.: Berlin, Germany, 2017; p. 428. [Google Scholar] [CrossRef]
  2. Tag, Q.; Gao, H.; Lu, H.; Lettenmaler, D.P. Remote sensing: Hydrology. Prog. Phys. Geog. 2009, 33, 490–509. [Google Scholar] [CrossRef]
  3. Yang, J.; Gong, P.; Fu, R.; Zhang, M.; Chen, J.; Liang, S.; Xu, B.; Shi, J.; Dickinson, R. The role of satellite remote sensing in climate change studies. Nat. Clim. Chang. 2013, 3, 875–883. [Google Scholar] [CrossRef]
  4. Emery, W.; Camps, A. Introduction to Satellite Remote Sensing: Atmosphere, Ocean, Land and Cryosphere Applications; Elsevier Inc.: Cambridge, MA, USA, 2017; p. 860. [Google Scholar]
  5. Ustin, S.L. Manual of Remote Sensing, Remote Sensing for Natural Resource Management and Environmental Monitoring; John Wiley & Sons: Hoboken, NJ, USA, 2004; p. 768. [Google Scholar]
  6. Hobbs, R.; Mooney, H.A. Remote Sensing of Biosphere Functioning; Springer Science & Business Media: New York, NY, USA, 2012; p. 312. [Google Scholar]
  7. Franklin, S.E. Remote Sensing for Sustainable Forest Management; CRC Press: Boca Raton, FL, USA, 2001; p. 424. [Google Scholar]
  8. Lynch, J.M.; Stamatiadis, S.; Schepers, J.S. Remote Sensing for Agriculture and the Environment; Goulandris Natural History Museum: Athens, Greece, 2004; p. 285. [Google Scholar]
  9. Weng, Q.; Quattrochi, D.; Gamba, P.E. Urban Remote Sensing; CRC Press: Boca Raton, FL, USA, 2018; p. 315. [Google Scholar]
  10. Gillespie, T.W.; Chu, J.; Frankenberg, E.; Duncan, T. Assessment and prediction of natural hazards from satellite imagery. Prog. Phys. Geog. 2007, 31, 459–470. [Google Scholar] [CrossRef] [PubMed] [Green Version]
  11. EARSC. Industry Survey 2020. Available online: https://earsc.org/wp-content/uploads/2020/07/Industry-survey-2020-Final-version-1.pdf (accessed on 20 July 2020).
  12. Jensen, J.R.; Dahlberg, R.E. Status and content of remote sensing education in the United States. Int. J. Remote Sens. 1983, 4, 235–245. [Google Scholar] [CrossRef]
  13. European Commission Copernicus Market Report–February 2019. Available online: https://www.copernicus.eu/sites/default/files/2019-02/PwC_Copernicus_Market_Report_2019_PDF_version.pdf (accessed on 20 July 2020).
  14. Voss, K.; Goetzke, R.; Thierfeldt, F.; Menz, G. Integrating applied Remote Sensing Methodology in Secondary Education. In Proceedings of the IEEE International Geoscience and Remote Sensing Symposium, Barcelona, Spain, 23–27 July 2007; pp. 2167–2169. [Google Scholar] [CrossRef]
  15. Ante, U.; Busche, D. Hindernisse beim Einsatz von Satellitenbildern im Geographieunterricht. Geogr. Rundsch. 1979, 31, 82–86. [Google Scholar]
  16. Merry, C.J.; Stockman, S. Educational outreach activities for Landsat-7. Remote Sens. Environ. 2001, 78, 217–220. [Google Scholar] [CrossRef]
  17. Naumann, S.; Siegmund, A.; Ditter, R.; Haspel, M.; Jahn, M.; Siegmund, A. Remote sensing in school–Theoretical concept and practical implementation. In E-Learning Tools, Techniques and Applications; König, G., Lehmann, H., Eds.; ISPRS: Potsdam, Germany, 2009. [Google Scholar]
  18. Holbrook, J. Introduction to the special issue of science education international devoted to PARSEL. Sci. Educ. Int. 2008, 19, 257–266. [Google Scholar]
  19. Sithole, A.; Chiyaka, E.T.; Mccarthy, P.; Mupinga, D.M.; Bucklein, B.K.; Kibirige, J. Student attraction, persistence and retention in STEM programs: Successes and continuing challenges. High. Educ. Stud. 2017, 7, 46–59. [Google Scholar] [CrossRef]
  20. Schreiner, C.; Sjøberg, S. Sowing the seeds of ROSE.; Background, Rationale, Questionnaire Development and Data Collection for ROSE (The Relevance of Science Education)-a comparative study of students’ views of science and science education. In Acta Didactica; Deptartment of Teacher Education and School Development, University of Oslo: Oslo, Norway, 2004; ISBN 82-90904-79-7. [Google Scholar]
  21. Stuckey, M.; Hofstein, A.; Mamlok-Naaman, R.; Eilks, I. The meaning of ‘relevance’ in science education and its implications for the science curriculum. Stud. Sci. Educ. 2013, 49, 1–34. [Google Scholar] [CrossRef]
  22. Dillon, J. On scientific literacy and curriculum reform. Int. J. Environ. Sci. Educ. 2009, 4, 201–213. [Google Scholar]
  23. Burmeister, M.; Rauch, F.; Eilks, I. Education for Sustainable Development (ESD) and secondary chemistry education. Chem. Educ. Res. Prac. 2012, 13, 59–68. [Google Scholar] [CrossRef]
  24. Bada, S. Constructivism Learning Theory: A Paradigm for Teaching and Learning. IOSR J. Res. Meth. Educ. 2015, 5, 2320–7388. [Google Scholar]
  25. Kurt, S.; Ayas, A. Improving students’ understanding and explaining real life problems on concepts of reaction rate by using a four step constructivist approach. Energ. Educ. Sci. Technol. B 2012, 4, 979–992. [Google Scholar]
  26. Bereiter, C. Constructivism, socioculturalism, and Popper’s World 3. Educ. Res. 1994, 23, 21–23. [Google Scholar] [CrossRef]
  27. Voss, K.; Goetzke, R.; Hodam, H. Learning modules–A way to integrate remote sensing methods in school education. ISPRS Arch. 2009, 34. [Google Scholar]
  28. Pang, Y.C.M.; Lin, H.; Lee, C.K.J. Enable Spatial Thinking Using GIS and Satellite Remote Sensing—A Teacher-Friendly Approach. Procedia Soc. Behav. Sci. 2011, 21, 130–138. [Google Scholar] [CrossRef] [Green Version]
  29. Reuter, R. SEOS-Earsel’s project on science education through earth observation for high schools, Ambiência Guarapuava (PR) Ed. Especial 2012, 8, 583–590. [Google Scholar] [CrossRef] [Green Version]
  30. Keselman, A. Supporting inquiry learning by promoting normative understanding of multivariable causality. J. Res. Sci. Teach. 2003, 40, 898–921. [Google Scholar] [CrossRef]
  31. Pedaste, M.; Mäeots, M.; Leijen, Ä.; Sarapuu, S. Improving students’ inquiry skills through reflection and self-regulation scaffolds. Technol. Instr. Cogn. Learn. 2012, 9, 81–95. [Google Scholar]
  32. Sentinel Application Platform 2017 SNAP 5.0.0. Available online: https://step.esa.int/main/toolboxes/snap/ (accessed on 20 July 2020).
  33. Poh, K.L.; Ang, B.W.; Bai, F. A comparative analysis of R&D project evaluation methods. R D Menag. 2001, 31, 63–75. [Google Scholar]
  34. Mertens, D.M. Research and Evaluation in Education and Psychology: Integrating Diversity with Quantitative, Qualitative, and Mixed Methods; SAGE Publications: Thousand Oaks, CA, USA, 2015. [Google Scholar]
  35. Hodam, H.; Rienow, A.; Jurgens, C. Bringing Earth Observation to Schools with Digital Integrated Learning Environments. Remote Sens. 2020, 12, 345. [Google Scholar] [CrossRef] [Green Version]
  36. Albanese, M.; Mitchell, S. Problem-based learning: A review of literature on its outcomes and implementation issues. Acad. Med. 1993, 68, 52–81. [Google Scholar] [CrossRef] [PubMed]
  37. Barron, B.J.S.; Schwartz, D.L.; Vye, N.J.; Moore, A.; Petrosino, A.; Zech, L.; Bransford, J.D. Doing with Understanding: Lessons From Research on Problem- and Project-Based Learning. J. Learn. Sci. 1998, 7, 3–4. [Google Scholar]
  38. Evensen, D. Observing Self-Directed Learners in a Problem-Based Learning Context: Two Case Studies Problem-Based Learning: A Research Perspective on Learning Interactions; Evensen, D., Hmelo, C.E., Eds.; Erlbaum: Mahwah, NJ, USA, 2000; pp. 263–297. [Google Scholar]
  39. Gallagher, S.A. Problem-based learning: Where did it come from, what does it do, and where is it going? J. Educ. Gift. 1997, 20, 332–362. [Google Scholar] [CrossRef]
  40. Hmelo-Silver, C.E. Problem-based learning: What and how do students learn? Educ. Psychol. Rev. 2004, 16, 235–266. [Google Scholar] [CrossRef]
  41. Frymier, A.B.; Schulman, G.M. “What’s in it for me?” Increasing content relevance to enhance students’ motivation. Commun. Educ. 1995, 44, 40–50. [Google Scholar] [CrossRef]
  42. Jaeger, B.; Freeman, S.; Whalen, R. Do they like what they learn, do they learn what they like-and what do we do about it? In Proceedings of the ASEE Annual Conference and Exposition, Pittsburgh, PA, USA, 22 June 2008. [Google Scholar]
  43. Martin, A.J.; Dowson, M. Interpersonal relationships, motivation, engagement, and achievement: Yields for theory, current issues, and educational practice. Rev. Educ. Res. 2009, 79, 327–365. [Google Scholar] [CrossRef]
  44. Aikenhead, G. Science Education for Everyday Life; Teachers’ College Press: New York, NY, USA, 2006. [Google Scholar]
  45. Brickhouse, N.W.; Potter, J.T. Young women’s scientific identity formation in an urban context. J. Res. Sci. Teach. 2001, 38, 965–980. [Google Scholar] [CrossRef]
  46. Calabrese-Barton, A. Reframing science for all through the politics of poverty. Educ. Policy 1998, 12, 525–541. [Google Scholar] [CrossRef]
  47. Gilbert, J.K. On the nature of ‘context’ in chemical education. Int. J. Sci. Educ. 2006, 28, 957–976. [Google Scholar] [CrossRef] [Green Version]
  48. Holbrook, J.; Rannikmae, M. The nature of science education for enhancing scientific literacy. Int. J. Sci. Educ. 2007, 29, 1347–1362. [Google Scholar] [CrossRef]
  49. English, L.D. STEM education K-12: Perspectives on integration. Int. J. STEM Educ. 2016, 3, 1–8. [Google Scholar] [CrossRef]
  50. Honey, M.; Pearson, G.; Schweingruber, A. STEM Integration in K-12 Education: Status, Prospects, and an Agenda for Research; National Academies Press: Washington, DC, USA, 2014. [Google Scholar]
  51. Woźniak, E.; Gabryszewski, R.; Dziob, D. Remote sensing and electromagnetic wave behaviour to measure vegetation phenology with physics. Phys. Educ. 2020, 55, 045012. [Google Scholar]
  52. Čepič, M. Introduction of current scientific results to education: Experiences from the case of liquid crystals. In Key Competences in Physics Teaching and Learning: Selected Contributions from the International Conference GIREP EPEC 2015, Wrocław, Poland, 6–10 July 2015; Greczylo, T., Debowska, E., Eds.; Springer Proceedings in Physics: Cham, Switzerland, 2017; Volume 190, pp. 41–54. [Google Scholar]
  53. Deng, Z. The distinction between key ideas in teaching school physics and key ideas in the discipline of physics. Sci. Educ. 2001, 85, 263–278. [Google Scholar] [CrossRef]
  54. Lavonen, L.; Jauhiainen, J.; Koponen, I.T.; Kurki-Suonio, K. Effect of a long-term in-service training program on teachers’ beliefs about the role of experiments in physics education. Int. J. Sci. Educ. 2012, 26, 309–328. [Google Scholar] [CrossRef]
  55. Feisel, D.; Rosa, A. The Role of the Laboratory in Undergraduate Engineering Education. J. Eng. Educ. 2013, 94, 121–130. [Google Scholar] [CrossRef]
  56. Dziob, D.; Sokolowska, D. Experiment on percolation for Introductory Physics Laboratories—A case study. Am. J. Phys. 2020, 88, 456–464. [Google Scholar] [CrossRef]
  57. Wilcox, B.; Lewandowski, H. Students’ views about the nature of experimental physics. Phys. Rev. Phys. Educ. Res. 2017, 13, 0201110. [Google Scholar] [CrossRef]
  58. Gikas, J.; Grant, M. Mobile computing devices in higher education: Student perspectives on learning with cellphones, smartphones & social media. Internet High. Educ. 2013, 19, 18–26. [Google Scholar]
  59. Hammond, M. Introducing ICT in schools in England: Rationale and consequences. Br. J. Educ. Technol. 2014, 45, 191–201. [Google Scholar] [CrossRef]
  60. Paakkari, A.; Raution, P.; Valasmo, V. Digital labour in school: Smartphones and their consequences in classrooms. Learn. Cult. Soc. Interact. 2019, 21, 161–169. [Google Scholar] [CrossRef]
  61. Wastiau, P.; Blamire, R.; Kearney, C.; Quittre, V.; Gaer, E.; Monseur, C. The Use of ICT in Education: A survey of schools in Europe. Eur. J. Educ. 2013, 48, 11–27. [Google Scholar] [CrossRef]
  62. Kotarba, A.Z.; Aleksandrowicz, S. Impervious surface detection with nighttime photography from the International Space Station. Remote Sens. Environ. 2016, 176, 295–307. [Google Scholar] [CrossRef]
  63. Levin, N.; Kyba, C.C.M.; Zhang, Q.; Sánchez de Miguel, A.; Román, M.O.; Li, X.; Portnov, B.A.; Molthan, A.L.; Jechow, A.; Miller, S.D.; et al. Remote sensing of night lights: A review and an outlook for the future. Remote Sens. Environ. 2020, 237, 111443. [Google Scholar] [CrossRef]
Figure 1. Workflow of the project with main steps, associated skills, and branches of science.
Remotesensing 12 02868 g001
Figure 2. Five points that represent various land cover and land use classes on a satellite image of the same area, presented in three color band combinations. Satellite image acquired by Sentinel-2 at 6th June 2020.
Remotesensing 12 02868 g002
Figure 3. Spectral profiles of the points presented in Figure 2. In addition, the Sentinel-2 spectral bands are indicated (B1–B12) at the top of the plot.
Remotesensing 12 02868 g003
Figure 4. Mean student answers to each question (reference question numbers to Table 1). The numbers above bars indicates the mean value. Notice that Q1 and Q5 was asked in the inverted form.
Remotesensing 12 02868 g004
Table 1. Questions asked of students after participation in the project.
Questions. Likert-like scale: 1-definitely do not agree, 5-definitely agree
Q1. The project was boring.
Q2. The project showed me that not only astronomers deal with satellite images.
Q3. I would like to have similar classes at school.
Q4. It was interesting to work with real data.
Q5. The project was too difficult.
Q6. The project combines knowledge from various school subjects.
Q7. Such classes can increase interest in science subjects among my colleagues.
Q8. More classes of this type would help me to choose a future profession.
Q9. I will try to find and analyze satellite data of my area on my own.

