Spatiotemporal Trends in Wildfires across the Western United States (1950–2019)


Idaho State University GIS TReC, 921 S. 8th Ave., stop 8104, Pocatello, ID 83209-8104, USA
*
Author to whom correspondence should be addressed.
Remote Sens. 2020, 12(18), 2959; https://0-doi-org.brum.beds.ac.uk/10.3390/rs12182959
Submission received: 21 July 2020
/
Revised: 8 September 2020
/
Accepted: 9 September 2020
/
Published: 11 September 2020
(This article belongs to the Special Issue Remote Sensing and Pyrogeography)
Abstract
:Wildfire regimes are changing across the globe with several ecosystems witnessing more frequent fires across longer fire seasons. The western United States is one such region. The NASA RECOVER Historic Fires Database (HFD) contains all documented wildfires across the western United States occurring between 1950 and 2019 (n = 55,566). This study analyzed the spatiotemporal patterns of these wildfires using ArcGIS Pro Geographic Information System (GIS) software to characterize changes in fire frequency, size, and severity over time. Analysis of annual fire frequency and acres burned reveals a near exponential growth in fire frequency (R2 = 0.71, P < 0.001) and size (R2 = 0.67, P < 0.001) since 1950. A comparison of mean and median acres burned annually suggests the occurrence of mega-fires (wildfires burning more than 100,000 acres) is also increasing. To illustrate this, this study found the mean size of fires occurring in the decade of the 1950s was 1204 acres while in the most recent decade (2010–2019) mean fire size has more than doubled, reaching an average of 3474 acres. The trend in fire severity between 2001 and 2017 used 365 Differenced Normalized Burn Ratio (dNBR) layers calculated using Landsat or Sentinel-2 satellite imagery. Results suggest fire severity has remained relatively stable in light of increasing fire frequency and size, however more research is required to more fully understand changes in fire severity. The results of this study and other related studies are important as they provide useful information to land managers and policy makers regarding the changing wildfire regime currently being witnessed across the western United States.
1. Introduction
Across the globe, wildfires have become a common event, and while many reports focus on the negative impacts of wildfire, fire also plays an essential role in several forest ecosystems. Concerns arise however in response to an observed increase in fire frequency, longer fire seasons, and a resulting increase in the impact of fires being reported worldwide [1,2]. A long-term study of fire using Antarctic ice cores by Wang et al. [3] suggests a 200-year oscillation in fire frequency, with an increase in biomass burning observed between the 1600s and 1800s followed by a decrease beginning in the 1800s. Today, the increase in wildfire frequency and size over the past decades is accompanied by concomitant concerns regarding the ecological, socio-economic, and land-resource impacts of these fires. For example, Shvidenko et al. examined the impact of wildfire on the global carbon budget [4]. More recently, McWethy et al. [5] explored resilience to wildfire. As a result of these observations and concerns, numerous studies have been undertaken to improve wildfire detection [6], fire behavior modeling [7,8,9], and risk reduction [10,11]. Fire severity has also received a great deal of interest and is typically quantified using the differenced normalized burn ratio (dNBR, https://burnseverity.cr.usgs.gov/pdfs/LAv4_BR_CheatSheet.pdf) as it provides an objective and consistent assessment of fire severity [12]. Robichaud et al. [13] compiled a near comprehensive description of possible ecosystem impacts that can occur as the result of a wildfire. Some of these impacts include the potential to cause losses in soil productivity, increased potential for encroachment by invasive plants [14], and downstream sedimentation due to surface erosion and degradation of streambank stability.
In addition, various hypotheses have been developed offering explanations for this alarming trend [15,16]. Common causes for the current wildfire upsurge are human population increase especially within the wildland urban interface [17,18], changes in fuel load and fuel continuity [9,19], invasive species [20,21], weather, and climatic conditions [22]. Ultimately, the causes of wildfire are part of a dynamic and complex system that is influenced by environmental and human activities.
The complexity of ecosystem services and their valuation add to the complexity of management and reestablishment of those services [23]. The impact of wildfires on social systems does not carry uniformly across areas where fires occur. Rather, the social aspects of wildfires are a composite suite of changes that are difficult to quantify [24,25]. Federal wildfire policy has tried to accommodate non-market social perceptions in an effort to preserve social benefits from burned areas [26]. The value of information in pre- and post-wildfire decision making can be seen in its ability to reduce uncertainty in wildfire environments [27]. Uncertainty in decision making drives the value of information higher, and the best decisions are made with the most relevant and current information [28,29].
To support well informed decisions and provide information relative to present fire trends, the current study carefully explored historic wildfires using the Geographic Information System (GIS) and earth observing satellite system data available through the Historic Wildfires Database (HFD) [30]. The HFD is shared and available online by visiting https://giscenter.isu.edu/research/Techpg/HFD/index.htm (Supplementary Materials) The HFD provides as comprehensive as possible spatiotemporal documentation of all recorded wildfires across the western United States between 1950 and 2019. The authors used these data to quantitatively describe and characterize annual and decadal trends of fire frequency and size. This study also investigated trends in fire severity between 2001 and 2017 to determine if fire severity was also changing over time. The results of this study provide insight into the future by allowing fire ecologists and land managers to better understand the past. In so doing, past trends can be expected to continue in the future unless the factors driving wildfire are modified or mitigated. Thus, the reason to explore spatiotemporal trends is quite important. Furthermore, this study can be used to support land managers and policy makers in their future recommendations.
2. Materials and Methods
The spatial extent of this study covers the entire western contiguous United States including Arizona, California, Colorado, Idaho, Montana, New Mexico, Nevada, Oregon, Utah, Washington, and Wyoming (Figure 1). The majority of wildfires occurring in the United States and the analysis discussed here is limited to that same extent. The HFD is a database that uses a standardized spatial reference system; Albers Equal-Area Conic (WKID: 102039) which uses unequally spaced parallels and equally spaced meridians to prevent distortion in scale and shape along two parallels [31]. This Albers spatial reference system is commonly used throughout government agencies in the United States, and is ideal for this study as it provides a single spatial reference system for the entire region (unlike Universal Transverse Mercator (UTM) which splits the study area into four zones) while preserving the property of area. The HFD is maintained by Idaho State University’s GIS Training and Research Center (GIS TReC) and is updated annually to include the most recent fire year. For example, during the spring of 2020 researchers at the GIS TReC reviewed and added 2019 fire perimeters acquired from the Geospatial Multi-Agency Coordination (GeoMAC) and the National Interagency Fire Center’s (NIFC) Wildland Fire Open Data resource (http://data-nifc.opendata.arcgis.com/). Fire perimeter polygons were acquired by these federal agencies through incident intelligence sources, global navigation satellite system (GNSS) data, and infrared imagery from aircraft and satellites. The resulting GIS layers include attributes such as: “perimeter mapping method”, “fire name”, “date started”, “fire year”, and at least one unique identifier. While not all source attributes are preserved in the HFD, all identifiers used to uniquely distinguish a given fire are preserved, allowing users to access additional details of the fire as needed by referencing these identifiers along with fire name and year. The source attributes are managed to conform to the standards of the HFD. All documented wildfires are retained in the HFD with no minimum mapping unit being applied by the HFD project team.
The fire polygons contained in the HFD are as comprehensive and complete as possible across the time period of this study (i.e., 1950–2019) (Figure 2). While the Federal Records Act was enacted in 1950, the use of computers and digital databases did not become commonplace until much later, even into the 1980s. While additional records of wildfires may currently exist, these data are not readily available because they have not been converted into digital format. Therefore, it is nearly certain that a larger number of fires have occurred but were not documented during early periods of this study (1950s) relative to the number of fires omitted during later periods (2000s). Equally true however is the likelihood that fire frequency, area burned, and the incidence of mega-fires assessed in this study are accurately portrayed using the best data available. To examine this assertion, the authors applied average imputation/regression substitution analysis [32]. This approach used high confidence data (e.g., annual fire frequency from 1980–2019) to predict expected fire frequency in years of lower confidence (i.e., 1950–1979). The result was interesting as all imputed years (1950–1979) had higher expected fire frequency. This suggests that indeed some additional wildfires likely occurred that were not documented. However, the difference between documented annual fire frequency and imputed or expected fire frequency was not great. On average, documented annual fire frequency accounted for 63% of expected fire frequency. Secondly, this difference lends credence to the observation that the wildfire regime has changed over time. Furthermore, it would be an error to assume the difference is entirely attributable to missing data as such as assumption would presume no effect from changing climate, weather, or management practices/policies between 1950 and 2019. The result of this assessment helps validate the HFD and the spatiotemporal study completed by the authors. Lastly, this assessment of uncertainty allows the reader to better understand these data and the conclusions drawn from the analysis.
The HFD contained all data necessary to determine the pattern of wildfire occurrence from 1950 to 2019 across the western US study area and address the questions posed by this study. That is, to quantitatively describe and characterize annual trends of wildfire frequency and size. Fire frequency and total acres burned were calculated using the Summary Statistics geoprocessing tool in ArcGIS Pro using fire year as the case field. The resulting table provided annual fire frequency as well as both mean and median fire acreage per year. These tables were exported into Microsoft Excel where all graphs were created and a trend line was fitted to these data. The selected trend line algorithm was the type that provided the best fit, with lowest residuals and highest R2 value. The spatial pattern and distribution of wildfire occurrence was examined using the Global Moran’s I spatial autocorrelation tool in ArcGIS Pro 2.6. This analysis informs the user regarding the correlation between the geography of a feature (i.e., wildfire polygons) and an associated attribute such as fire year or size. The results of this analysis can be informative and help interpret temporal trends.
For the purposes of this study, wildfire severity is defined as the extent to which a fire affects the vegetation and soils in a given area, as indicated using the Differenced Normalized Burn Ratio (dNBR) [33,34]. Statistical analyses performed as part of this study were derived using dNBR layers generated from Landsat 5 TM, Landsat 7 ETM+, Landsat 8 OLI, and Sentinel-2 satellite images. These data were acquired from the Monitoring Trends in Burn Severity (MTBS) program and included 365 large wildfires (minimum area = 10,000 acres; x = 41,949 acres) burning between 2001 and 2017. Since these data rely upon specific earth observing satellite imagery and the US Forest Service MTBS program (https://www.mtbs.gov/project-overview), dNBR data were not available prior to 2001. Furthermore, at the time of this writing, dNBR data was not available past 2017. While dNBR has been widely used and is the source for the fire severity data used in this study, it is a technique not without criticism [35]. While, a recent 2020 study found dNBR to be a better and more reliable index of fire severity than relative differenced normalized burn ratio (RdNBR) [36], the debate over whether dNBR or RdNBR (or yet another band ratio) is the best approach has not been laid to rest. In all likelihood, the decision to use dNBR or RdNBR will be decided based on individual experience and the specific ecosystem to which the technique is applied.
To ensure a reasonable spatial distribution of dNBR data, two dNBR datasets were acquired annually for each state (n = 11) in the study area. In addition, dNBR data were sought for relatively large fires (10,000 acres or more), albeit not strictly mega-fires of 100,000 acres or more. This approach helped ensure a sufficient sample of pixels were available within each fire polygon. In addition, such fires would more likely contain a variety of fire severities and be more meaningful to this study than smaller, more homogenous wildfire areas. The dNBR pixel values were extracted using the corresponding fire perimeter polygon and Zonal Statistics as table geoprocessing tool in ArcGIS Pro. The resulting individual fire tables were merged into an annual table and ultimately exported into a single Microsoft Excel spreadsheet containing the fire’s unique identifier, fire year, pixel count, as well as the mean, median, and standard deviation of the dNBR fire severity index (i.e., dNBR values). These data were graphed to visualize annual trends in fire severity and statistically analyzed using analysis of variance (ANOVA).
3. Results and Discussion
The spatial distribution of wildfires from 1950 to 2019 across the study area follow a clustered spatial distribution (Figure 1) suggesting the occurrence of wildfires is dependent on a host of complicated and interacting factors like vegetation type, fuel load, fuel moisture, drought conditions, weather patterns, previous fire history, climate, and human activities [37,38]. An assessment of spatial autocorrelation using Moran’s I resulted in a significantly clustered distribution of wildfire events (P < 0.001) when assessed using either fire year or area (size) of the fire. This affirms that wildfires are not random events but rather the result of a complex interaction of numerous factors, not the least of which is the presence of an ignition source on an already susceptible landscape (i.e., an area with sufficient fuel load and fuel continuity, etc.).
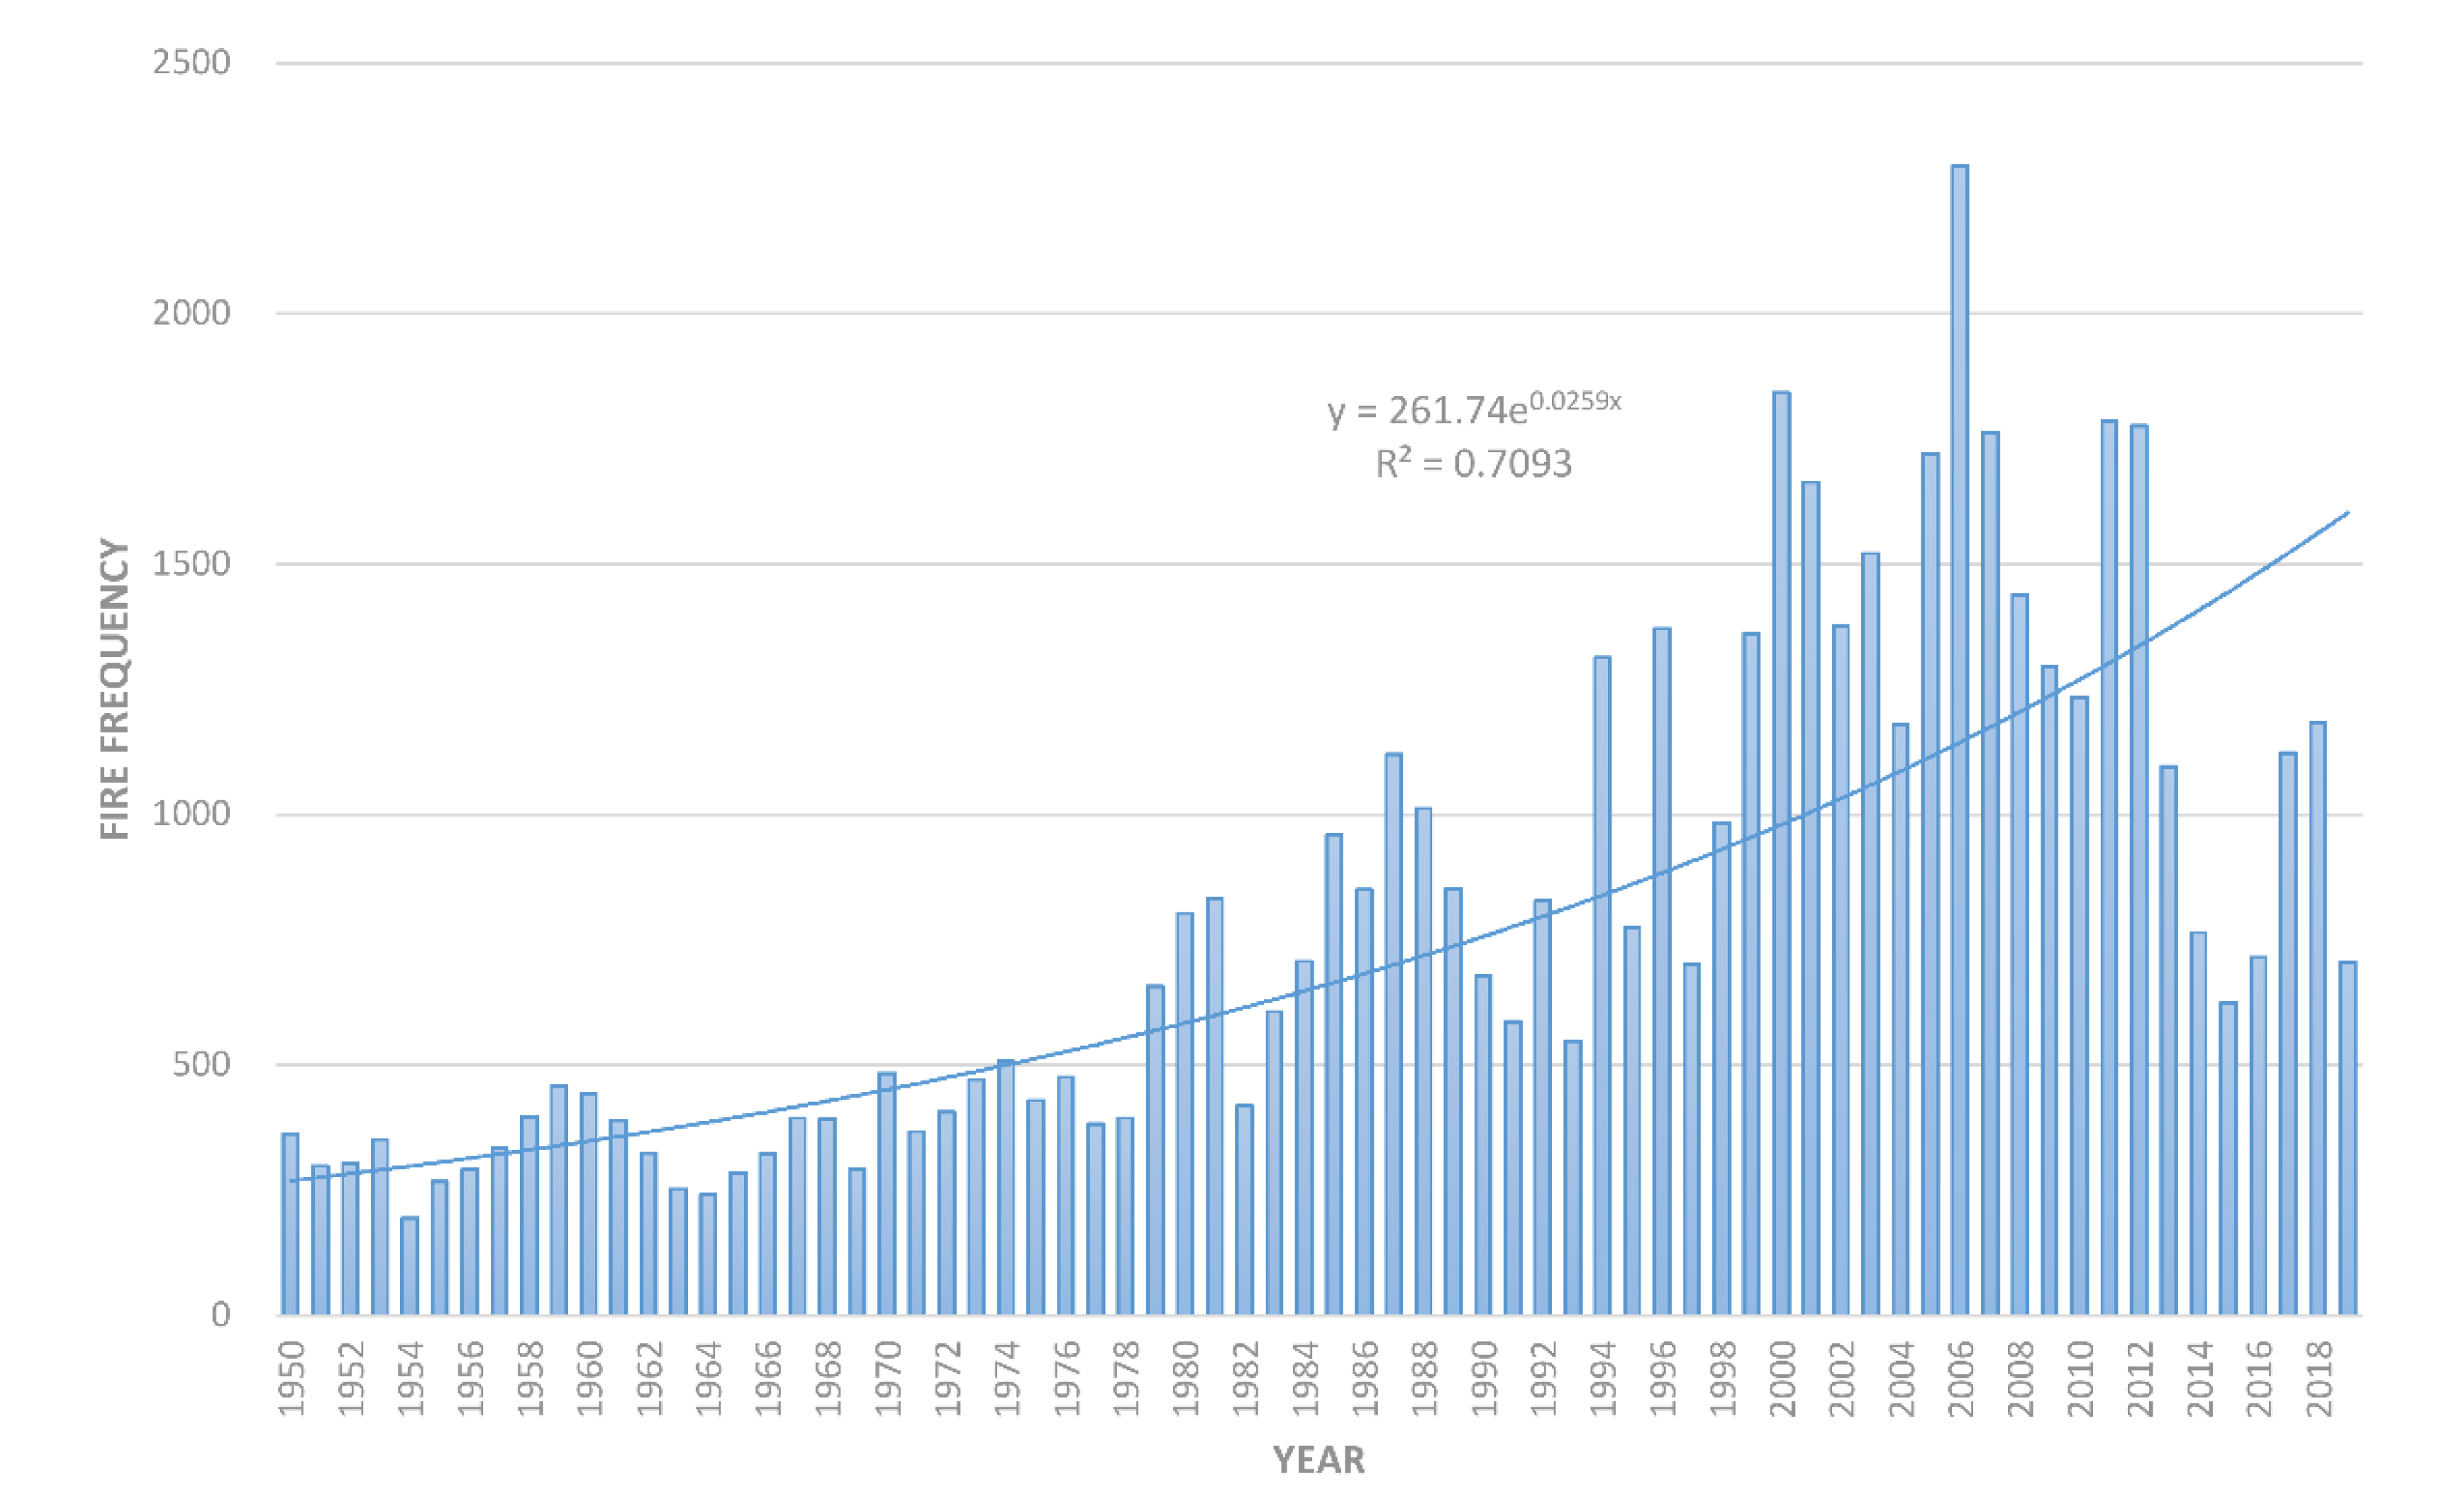
The temporal trend of fire frequency was described using a line of best fit approach. In this study, the line of best fit followed an exponential trend with an R2 of 0.71 (Figure 3). This trend was analyzed using ANOVA and found to be significant (P < 0.001). It is interesting however that fire frequency over the past two decades, while quite high compared to previous decades, has been relatively static with even a declining slope observed (Figure 4). The reason for this is unclear but likely represents a brief oscillation in the overall larger trend already described.
The total area burned annually within the Western US also best follows an exponential trend line with an R2 of 0.67 (Figure 5). This trend was similarly assessed using ANOVA and found to be significant (P < 0.001). During the most recent decades however, total area burned annually has been somewhat sporadic while still exhibiting a slight overall increase (Figure 6). This result corresponds well with previous observations of fire frequency in recent decades but also suggests the influence of mega-fires (Figure 4).
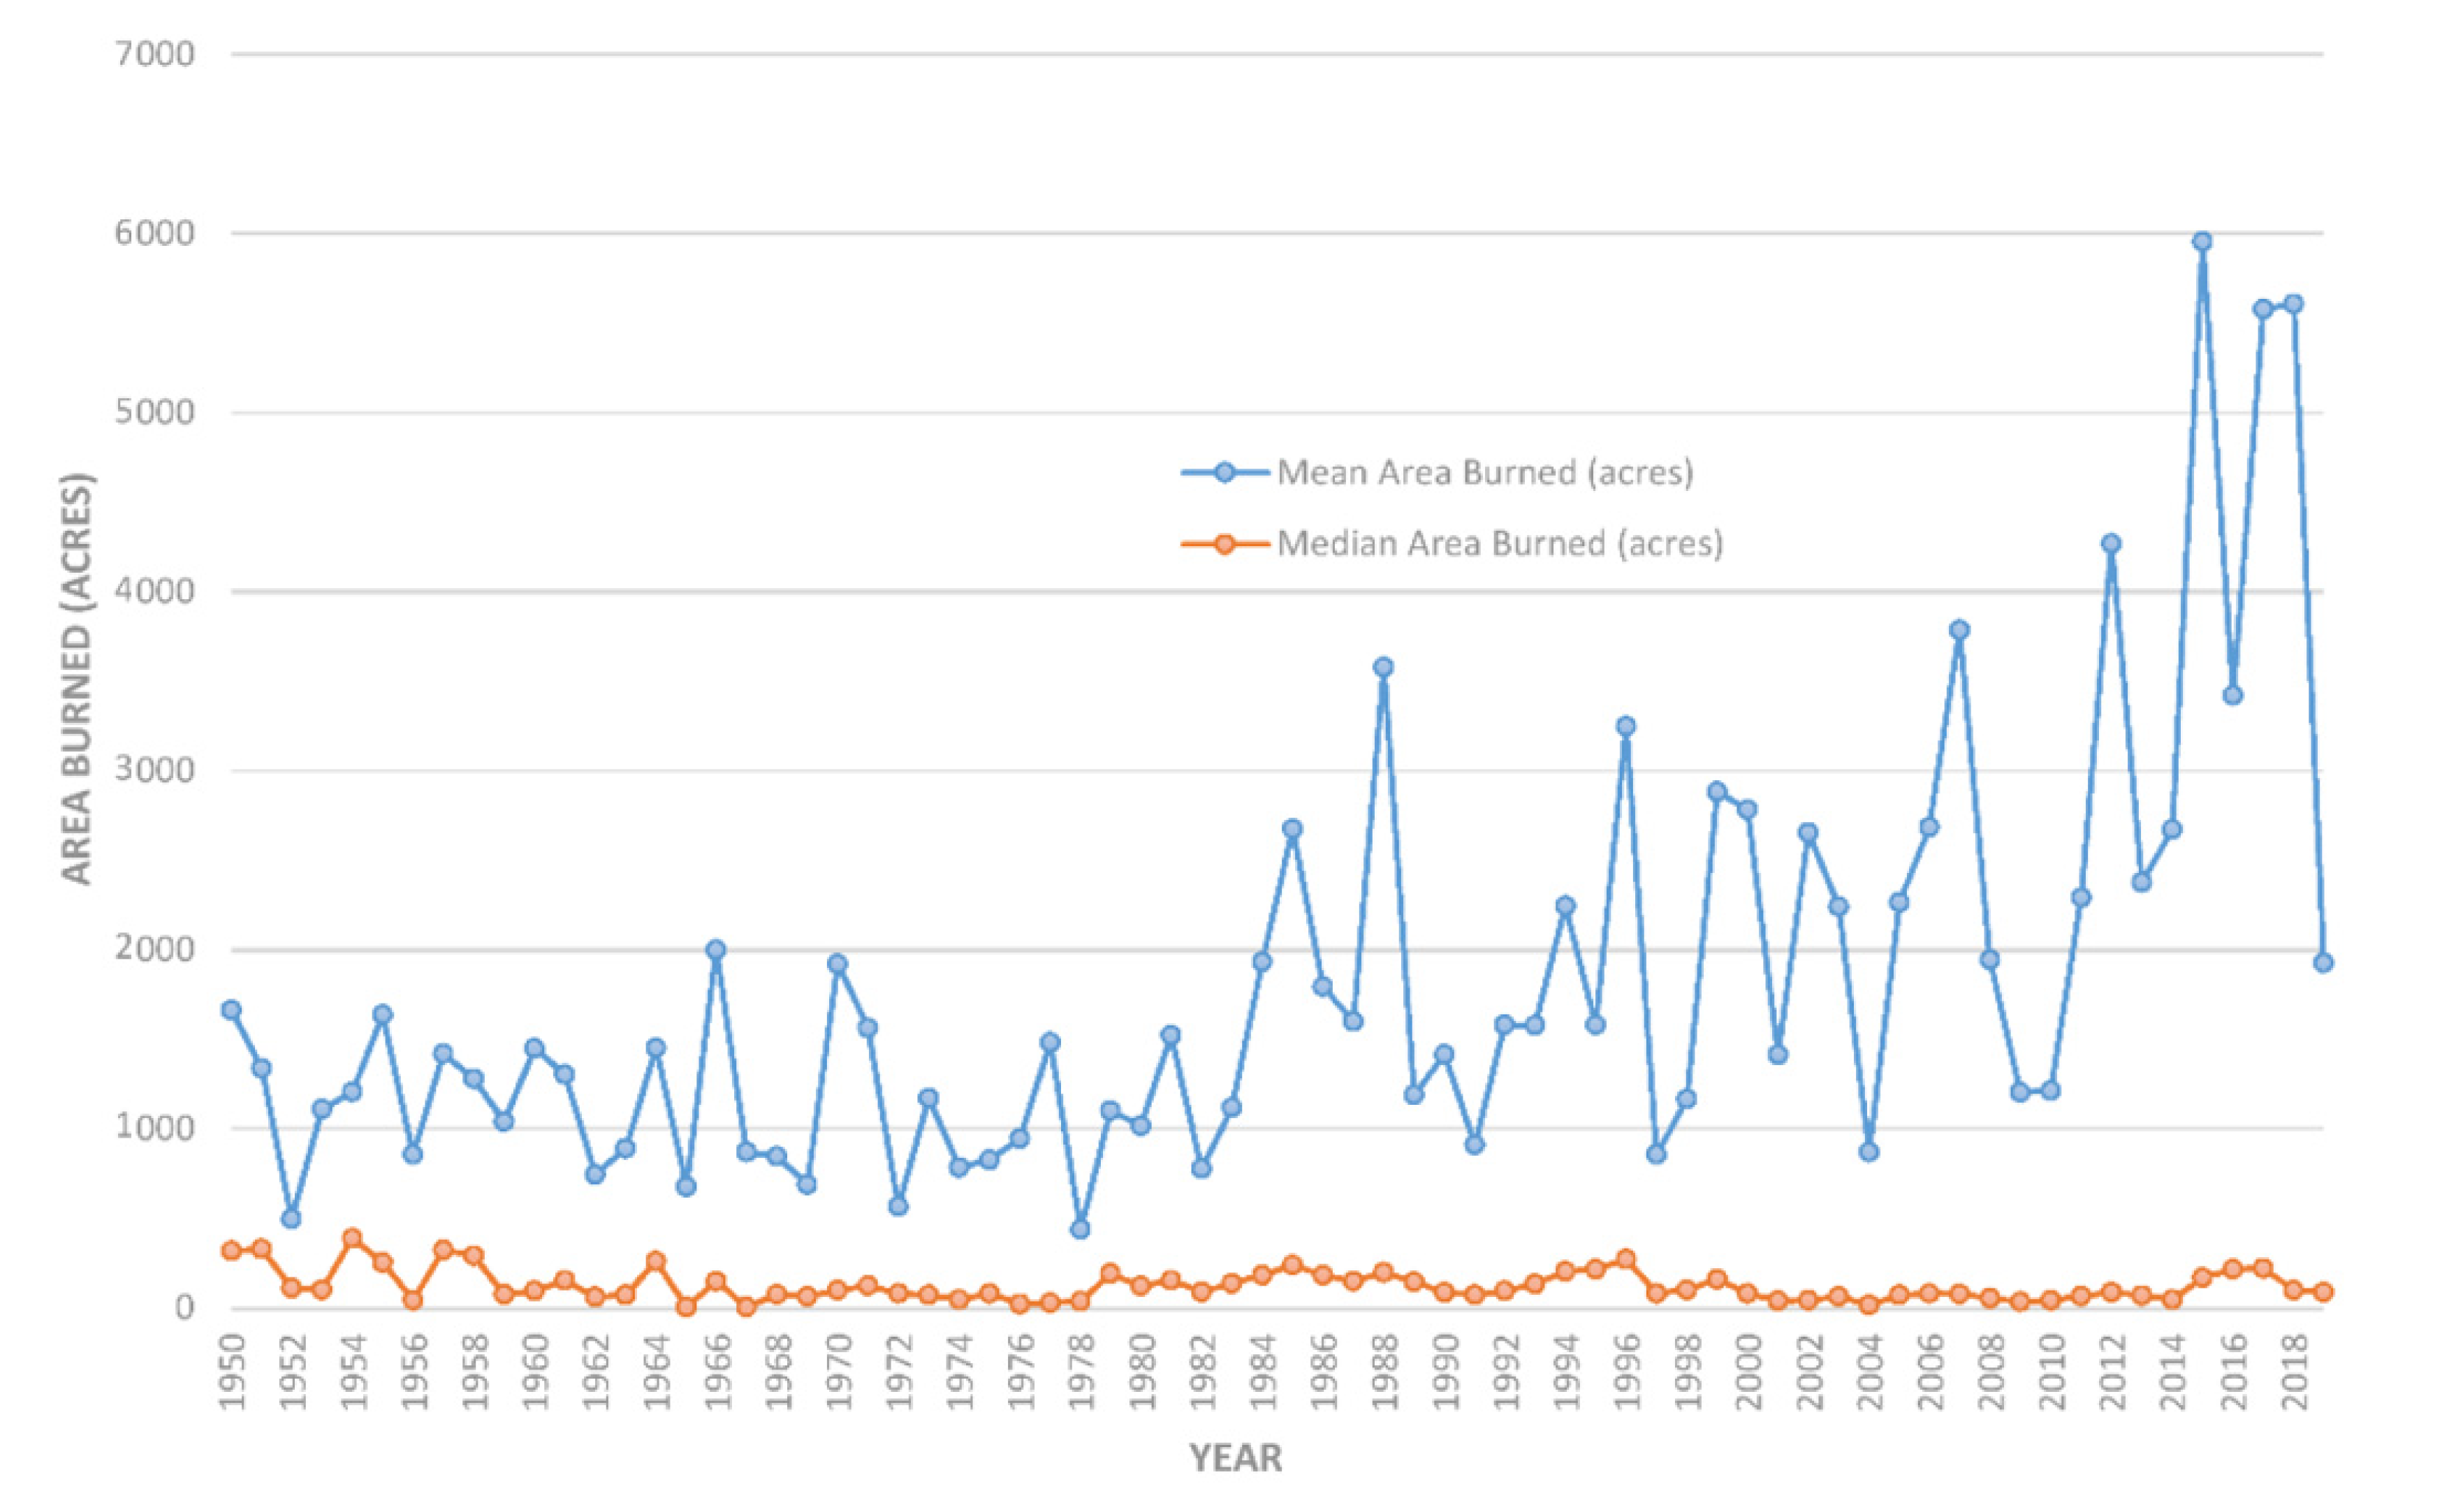
Not only has the number of fires increased since 1950, but total area burned has increased as well. It may seem intuitive to assume such a correspondence but the relationship between fire frequency and area burned is not perfectly linear. The observed relationship (R2 = 0.82) indicates area burned is outpacing fire frequency. These data taken together with other data presented by this research suggests the occurrence of mega-fires (fires burning 100,000 acres or more) are likely driving this relationship. While Figure 3 and Figure 5 illustrate generally similar trends, a closer investigation reveals an increasing number of mega-fires (wildfires burning more than 100,000 acres) have occurred causing total area burned to outpace what would be expected by fire frequency alone. This is further evidenced by comparing annual mean fire size with annual median fire size (Figure 7). Such an approach proves a useful comparison as the mean statistic is influenced by high magnitude, low frequency values found either above or below the remaining “normal” values. The median, or middle-most value, is a resilient statistic that is not influenced by individual extreme values. Thus, where mean and median agree we can assume a normal distribution. In contrast, when mean and median disagree, we must look for the presence of extreme values or sometimes outliers that may be skewing the distribution. In Figure 5 we see median fire size is quite static while mean fire size exhibits a rapid increase very similar to the trends in fire frequency and fire size seen throughout the same time period. The prevalence of abnormally large wildfires (i.e., mega-fires) is increasing over time across the western US.
A total of 365 differenced normalized burn ratio layers (dNBR) for wildfires occurring between 2001 and 2017 were used to investigate trends in fire severity. Overall, these data follow a near constant, albeit downward trend with a slope of –0.13 and a very low R2 value (0.0007). ANOVA results comparing annual mean (P = 0.43) and median (P = 0.36) showed no difference in fire severity as indicated by dNBR values across these years. Furthermore, these fires tended to be classified as low severity fires save for fires occurring in 2003 and 2013 which showed a trend toward more moderate severity fires. Fire severity data used in this study was derived from relatively large fires (x = 41,949 acres). It is possible—though not substantiated by this study—that these fires grew large in size because they burned very quickly and as a result, burned less severely. The results observed in this study suggest fire severity may not be a function of the same drivers affecting fire frequency and fire size. Rather, fire severity is more likely influenced by the intrinsic, site-specific factors associated with the specific landscape on which a fire occurs. Although this portion of the study used only 17 years of data and only 365 individual wildfires, these data suggest the emergence of an oscillatory pattern in fire severity. This could be the result of climate and weather trends, but further research is needed to verify this observation. If so, the interaction of longer-term (non-annual) and perhaps decadal factors would need to be assessed and incorporated into future wildfire trend modeling. Additional research on fire severity is certainly warranted as this characteristic plays an important role in determining the proper rehabilitation treatments that need to be applied to fire affected areas.
4. Conclusions
This study used the historic fires database (HFD) to examine annual trends in wildfire frequency and area burned between 1950 and 2019 across the western United States. The results indicate both annual frequency and annual area burned have increased dramatically since 1950 (P < 0.001). However, since 2001, annual fire frequency has begun to decline while area burned is increasing only moderately. In addition to these observations is the overall trend toward an increasing frequency of mega-fire events (fires burning 100,000 acres or more) (Figure 7). The reason for the observed long-term changes in fire regime may be explained in part by the quality and availability of record keeping between 1950 and the present. More importantly however, these changes are attributable to a host of real and interacting factors such as decades of successful fire suppression resulting in increased fuel load and fuel continuity, as well as changes in land management policy, and long-term changes in weather and climate [1,2,38].
This study also explored trends in fire severity between 2001 and 2017 as indicated by the differenced normalized burn ratio (dNBR). Fire severity was relatively stable between 2001 and 2017, and shows very little correlation with either fire frequency or area burned statistics. These results suggest fire severity is not a function of the same drivers affecting fire frequency and fire size. Rather, fire severity is likely influenced more by the intrinsic, site-specific factors associated with the particular landscape on which a fire occurs. Additional research on trends in fire severity is warranted as this characteristic of wildfires plays an important role in the rehabilitation and recovery of fire affected areas anywhere in the world.
The results of this study show how wildfire frequency, annual area burned, and the incidence of mega-fires has increased across the western US in contrast to conditions in the 1950s. These temporal trends provide important information to land managers and policy makers as past trends can be looked to as a predictor of future conditions. Furthermore, these results support land managers and policy makers with quantitative, scientific data to drive well-informed decisions that improve fire management, wildfire policy, and ultimately improve ecosystem health.
Supplementary Materials
The Historic Fires Database (HFD) is shared and available online by visiting https://giscenter.isu.edu/research/Techpg/HFD/index.htm.
Author Contributions
The research described in this paper was conceptualized, planned, and designed by the primary author, K.T.W.; in addition, K.T.W. wrote the original draft of this paper, supervised student research related to this study and administered the NASA project that funded this research; this paper’s co-author, R.Y., completed various spatial analyses and reviewed and edited this paper. All authors have read and agreed to the published version of the manuscript.
Funding
The research was funded by the National Aeronautics and Space Administration (NASA) Applied Sciences Grant (NNX12AQ78G).
Acknowledgments
The authors would like to acknowledge the assistance of two former students at Idaho State University’s GIS TREC, Jonah Davis and Justin Turverey, for their work completing various spatial analyses and technical reports related to this study.
Conflicts of Interest
The authors declare no conflict of interest. Furthermore, the sponsors had no role in the design, execution, interpretation, or writing of the paper.
References
- Duguy, B.; Paula, S.; Pausas, J.G.; Alloza, J.A.; Gimeno, T.; Vallejo, V.R. Effects of Climate and Extreme Events on Wildfire Regime and Their Ecological Impacts. In Advances in Global Change Research; Springer Science and Business Media LLC: Berlin, Germany, 2012; Volume 51, pp. 101–134. [Google Scholar]
- Brotons, L.; Aquilué, N.; De Cáceres, M.; Fortin, M.-J.; Fall, A. How Fire History, Fire Suppression Practices and Climate Change Affect Wildfire Regimes in Mediterranean Landscapes. PLoS ONE 2013, 8, e62392. [Google Scholar] [CrossRef] [Green Version]
- Wang, Z.; Chappellaz, J.; Park, K.; Mak, J.E. Large Variations in Southern Hemisphere Biomass Burning During the Last 650 Years. Science 2010, 330, 1663–1666. [Google Scholar] [CrossRef] [Green Version]
- Shvidenko, A.; Shchepashchenko, D.G.; Vaganov, E.A.; Sukhinin, A.I.; Maksyutov, S.; McCallum, I.; Lakyda, I. Impact of wildfire in Russia between 1998–2010 on ecosystems and the global carbon budget. Dokl. Earth Sci. 2011, 441, 1678–1682. [Google Scholar] [CrossRef]
- McWethy, D.B.; Schoennagel, T.; Higuera, P.E.; Krawchuk, M.; Harvey, B.J.; Metcalf, E.C.; Schultz, C.; Miller, C.; Metcalf, A.L.; Buma, B.; et al. Rethinking resilience to wildfire. Nat. Sustain. 2019, 2, 797–804. [Google Scholar] [CrossRef]
- Csiszar, I.; Schroeder, W.; Giglio, L.; Ellicott, E.; Vadrevu, K.P.; Justice, C.; Wind, B. Active fires from the Suomi NPP Visible Infrared Imaging Radiometer Suite: Product status and first evaluation results. J. Geophys. Res. Atmos. 2014, 119, 803–816. [Google Scholar] [CrossRef]
- Finney, M.A. FARSITE: A fire area simulator for fire managers. In Proceedings of the Biswell Symposium: Fire Issues and Solutions in Urban Interface and Wildland Ecosystems, Walnut Creek, CA, USA, 15–17 February 1994; Weise, D.R., Martin, R.E., Eds.; (Technical Coordinators); General Technical Report PSW-GTR-158. U.S. Department of Agriculture, Forest Service, Pacific Southwest Research Station: Albany, CA, USA, 1995; pp. 55–56. [Google Scholar]
- Green, K.; Finney, M.A.; Campbell, J.; Weinstein, D.; Landrum, V. Fire! Using GIS to predict fire behavior. J. For. 1995, 93, 21–25. [Google Scholar]
- Kreye, J.K.; Brewer, N.W.; Morgan, P.; Varner, J.M.; Smith, A.M.S.; Hoffman, C.M.; Ottmar, R.D. Fire behavior in masticated fuels: A review. For. Ecol. Manag. 2014, 314, 193–207. [Google Scholar] [CrossRef]
- Hardy, C.C.; Schmidt, K.M.; Menakis, J.P.; Sampson, R.N. Spatial data for national fire planning and fuel management. Int. J. Wildland Fire 2001, 10, 353. [Google Scholar] [CrossRef]
- Chuvieco, E.; Aguado, I.; Yebra, M.; Nieto, H.; Salas, J.; Martín, M.P.; Vilar, L.; Martínez-Vega, J.; Martín, S.; Ibarra, P.; et al. Development of a framework for fire risk assessment using remote sensing and geographic information system technologies. Ecol. Model. 2010, 221, 46–58. [Google Scholar] [CrossRef]
- Chen, D.; Loboda, T.; Hall, J. A systematic evaluation of influence of image selection process on remote sensing-based burn severity indices in North American boreal forest and tundra ecosystems. ISPRS J. Photogramm. Remote Sens. 2020, 159, 63–77. [Google Scholar] [CrossRef]
- Robichaud, P.R.; Beyers, J.L.; Neary, D.G. Evaluating the Effectiveness of Postfire Rehabilitation Treatments; US Department of Agriculture, Forest Service, Rocky Mountain Research Station: Fort Collins, CO, USA, 2000. Available online: https://www.fs.fed.us/rm/pubs/rmrs_gtr063.pdf (accessed on 10 September 2020).
- Keegan, C.E., III; Morgan, T.A.; Hearst, A.L.; Fiedler, C.E. Impacts of the 2000 wildfires on Montana’s forest industry employment. For. Prod. J. 2004, 54, 26. [Google Scholar]
- Westerling, A.L.; Hidalgo, H.G.; Cayan, D.R.; Swetnam, T.W. Warming and Earlier Spring Increase Western U.S. Forest Wildfire Activity. Science 2006, 313, 940–943. [Google Scholar] [CrossRef] [Green Version]
- Goetz, S.J.; Mack, M.C.; Gurney, K.R.; Randerson, J.T.; Houghton, R.A. Ecosystem responses to recent climate change and fire disturbance at northern high latitudes: Observations and model results contrasting northern Eurasia and North America. Environ. Res. Lett. 2007, 2, 045031. [Google Scholar] [CrossRef]
- Radeloff, V.C.; Hammer, R.B.; Stewart, S.I. Rural and Suburban Sprawl in the U.S. Midwest from 1940 to 2000 and Its Relation to Forest Fragmentation. Conserv. Boil. 2005, 19, 793–805. [Google Scholar] [CrossRef]
- Stewart, S.I.; Radeloff, V.C.; Hammer, R.B.; Hawbaker, T.J. Defining the Wildland–Urban Interface. J. For. 2007, 105, 201–207. [Google Scholar]
- Kane, J.M.; Varner, J.M.; Knapp, E.E. Novel fuel bed characteristics associated with mechanical mastication treatments in northern California and southwestern Oregon, USA. Int. J. Wildland Fire 2009, 18, 686–697. [Google Scholar] [CrossRef] [Green Version]
- Dewey, S.A.; Jenkins, M.J.; Tonioli, R.C. Wildfire Suppression—A Paradigm for Noxious Weed Management. Weed Technol. 1995, 9, 621–627. [Google Scholar] [CrossRef]
- Studley, H.; Weber, K.T. 2009 Range Vegetation Assessment in the Big Desert, Upper Snake River Plain, Idaho. In Final Report: Assessing Post-Fire Recovery of Sagebrush-Steppe Rangelands in Southeastern Idaho (NNX08AO90G); Weber, K.T., Davis, K., Eds.; Idaho State University: Pocatello, ID, USA, 2011; 252p, Available online: http://giscenter.isu.edu/research/Techpg/nasa_postfire/pdf/Ch2.pdf (accessed on 10 September 2020).
- Gill, A.M.; Stephens, S.L.; Cary, G.J. The worldwide “wildfire” problem. Ecol. Appl. 2013, 23, 438–454. [Google Scholar] [CrossRef] [Green Version]
- Carpenter, S.R.; Mooney, H.A.; Agard, J.; Capistrano, D.; DeFries, R.S.; Díaz, S.; Dietz, T.; Duraiappah, A.K.; Oteng-Yeboah, A.; Pereira, H.M.; et al. Science for managing ecosystem services: Beyond the Millennium Ecosystem Assessment. Proc. Natl. Acad. Sci. USA 2009, 106, 1305–1312. [Google Scholar] [CrossRef] [Green Version]
- Calkin, D.; Jones, G.; Hyde, K. Nonmarket resource valuation in the postfire environment. J. For. 2008, 106, 305–310. [Google Scholar]
- Paveglio, T.B.; Brenkert-Smith, H.; Hall, T.; Smith, A.M.S. Understanding social impact from wildfires: Advancing means for assessment. Int. J. Wildland Fire 2015, 24, 212–224. [Google Scholar] [CrossRef]
- Venn, T.J.; Calkin, D.E. Accommodating non-market values in evaluation of wildfire management in the United States: Challenges and opportunities. Int. J. Wildland Fire 2011, 20, 327. [Google Scholar] [CrossRef]
- Williamson, R.; Hertzfeld, H.R.; Cordes, J.; Logsdon, J.M. The socioeconomic benefits of Earth science and applications research: Reducing the risks and costs of natural disasters in the USA. Space Policy 2002, 18, 57–65. [Google Scholar] [CrossRef]
- Kangas, A.S.; Horne, P.; Leskinen, P. Measuring the value of information in multi-criteria decision making. For. Sci. 2010, 56, 558–566. [Google Scholar]
- Schnase, J.L.; Carroll, M.L.; Weber, K.T.; Brown, M.; Gill, R.L.; Wooten, M.; May, J.; Serr, K.; Smith, E.; Goldsby, R.; et al. RECOVER: An Automated, Cloud-Based Decision Support System for Post-Fire Rehabilitation Planning. ISPRS Int. Arch. Photogramm. Remote Sens. Spat. Inf. Sci. 2014, 40, 363–370. [Google Scholar] [CrossRef] [Green Version]
- Weber, K.T.; Idaho State University GIS Training and Research Center. Historic Fires Database (HFD) Version 3.0. 2020. Available online: http://giscenter.isu.edu/research/Techpg/HFD/ (accessed on 17 June 2020).
- Snyder, J.P. Map Projections Used by the US Geological Survey (No. 1532); US Government Printing Office: Washington, DC, USA, 1982.
- Taghavi-Shahri, S.M.; Fassò, A.; Mahaki, B.; Amini, H. Concurrent spatiotemporal daily land use regression modeling and missing data imputation of fine particulate matter using distributed space-time expectation maximization. Atmos. Environ. 2019, 224, 117202. [Google Scholar] [CrossRef]
- Bobbe, T.; Finco, M.V.; Quayle, B.; Lannon, K. Field Measurements for the Training and Validation of Burn Severity Maps from Spaceborne, Remotely Sensed Imagery. In Final Project Report, Joint Fire Science Program-2001-2; Remote Sensing Applications Center, USDA Forest Service: Salt Lake City, UT, USA, 2001. Available online: http://www.fs.fed.us/eng/rsac/baer/final_report_01B-2-1-01.pdf (accessed on 10 September 2020).
- Weber, K.T.; Seefeldt, S.S.; Norton, J.M.; Finley, C. Fire Severity Modeling of Sagebrush-Steppe Rangelands in Southeastern Idaho. GISci. Remote. Sens. 2008, 45, 68–82. [Google Scholar] [CrossRef] [Green Version]
- Miller, J.D.; Thode, A.E. Quantifying burn severity in a heterogeneous landscape with a relative version of the delta Normalized Burn Ratio (dNBR). Remote Sens. Environ. 2007, 109, 66–80. [Google Scholar] [CrossRef]
- Cai, L.; Wang, M. Is the RdNBR a better estimator of wildfire burn severity than the dNBR? A discussion and case study in southeast China. Geocarto Int. 2020, 1–15. [Google Scholar] [CrossRef]
- Marlon, J.; Bartlein, P.J.; Gavin, D.G.; Long, C.J.; Anderson, R.S.; Briles, C.E.; Brown, K.J.; Colombaroli, D.; Hallett, D.J.; Power, M.J.; et al. Long-term perspective on wildfires in the western USA. Proc. Natl. Acad. Sci. USA 2012, 109, E535–E543. [Google Scholar] [CrossRef] [Green Version]
- Alencar, A.A.; Brando, P.; Asner, G.P.; Putz, F.E. Landscape fragmentation, severe drought, and the new Amazon forest fire regime. Ecol. Appl. 2015, 25, 1493–1505. [Google Scholar] [CrossRef] [PubMed]
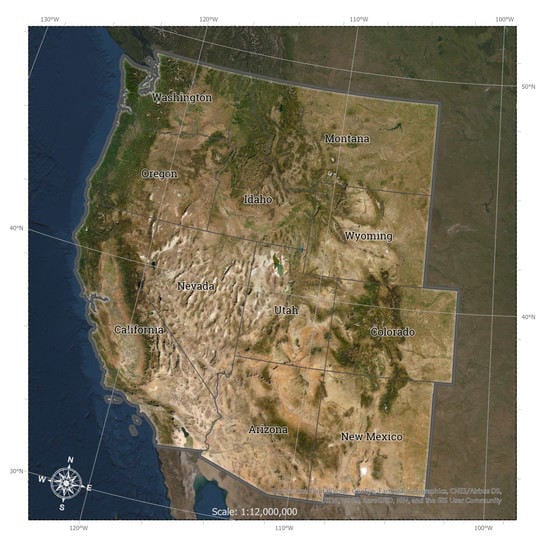
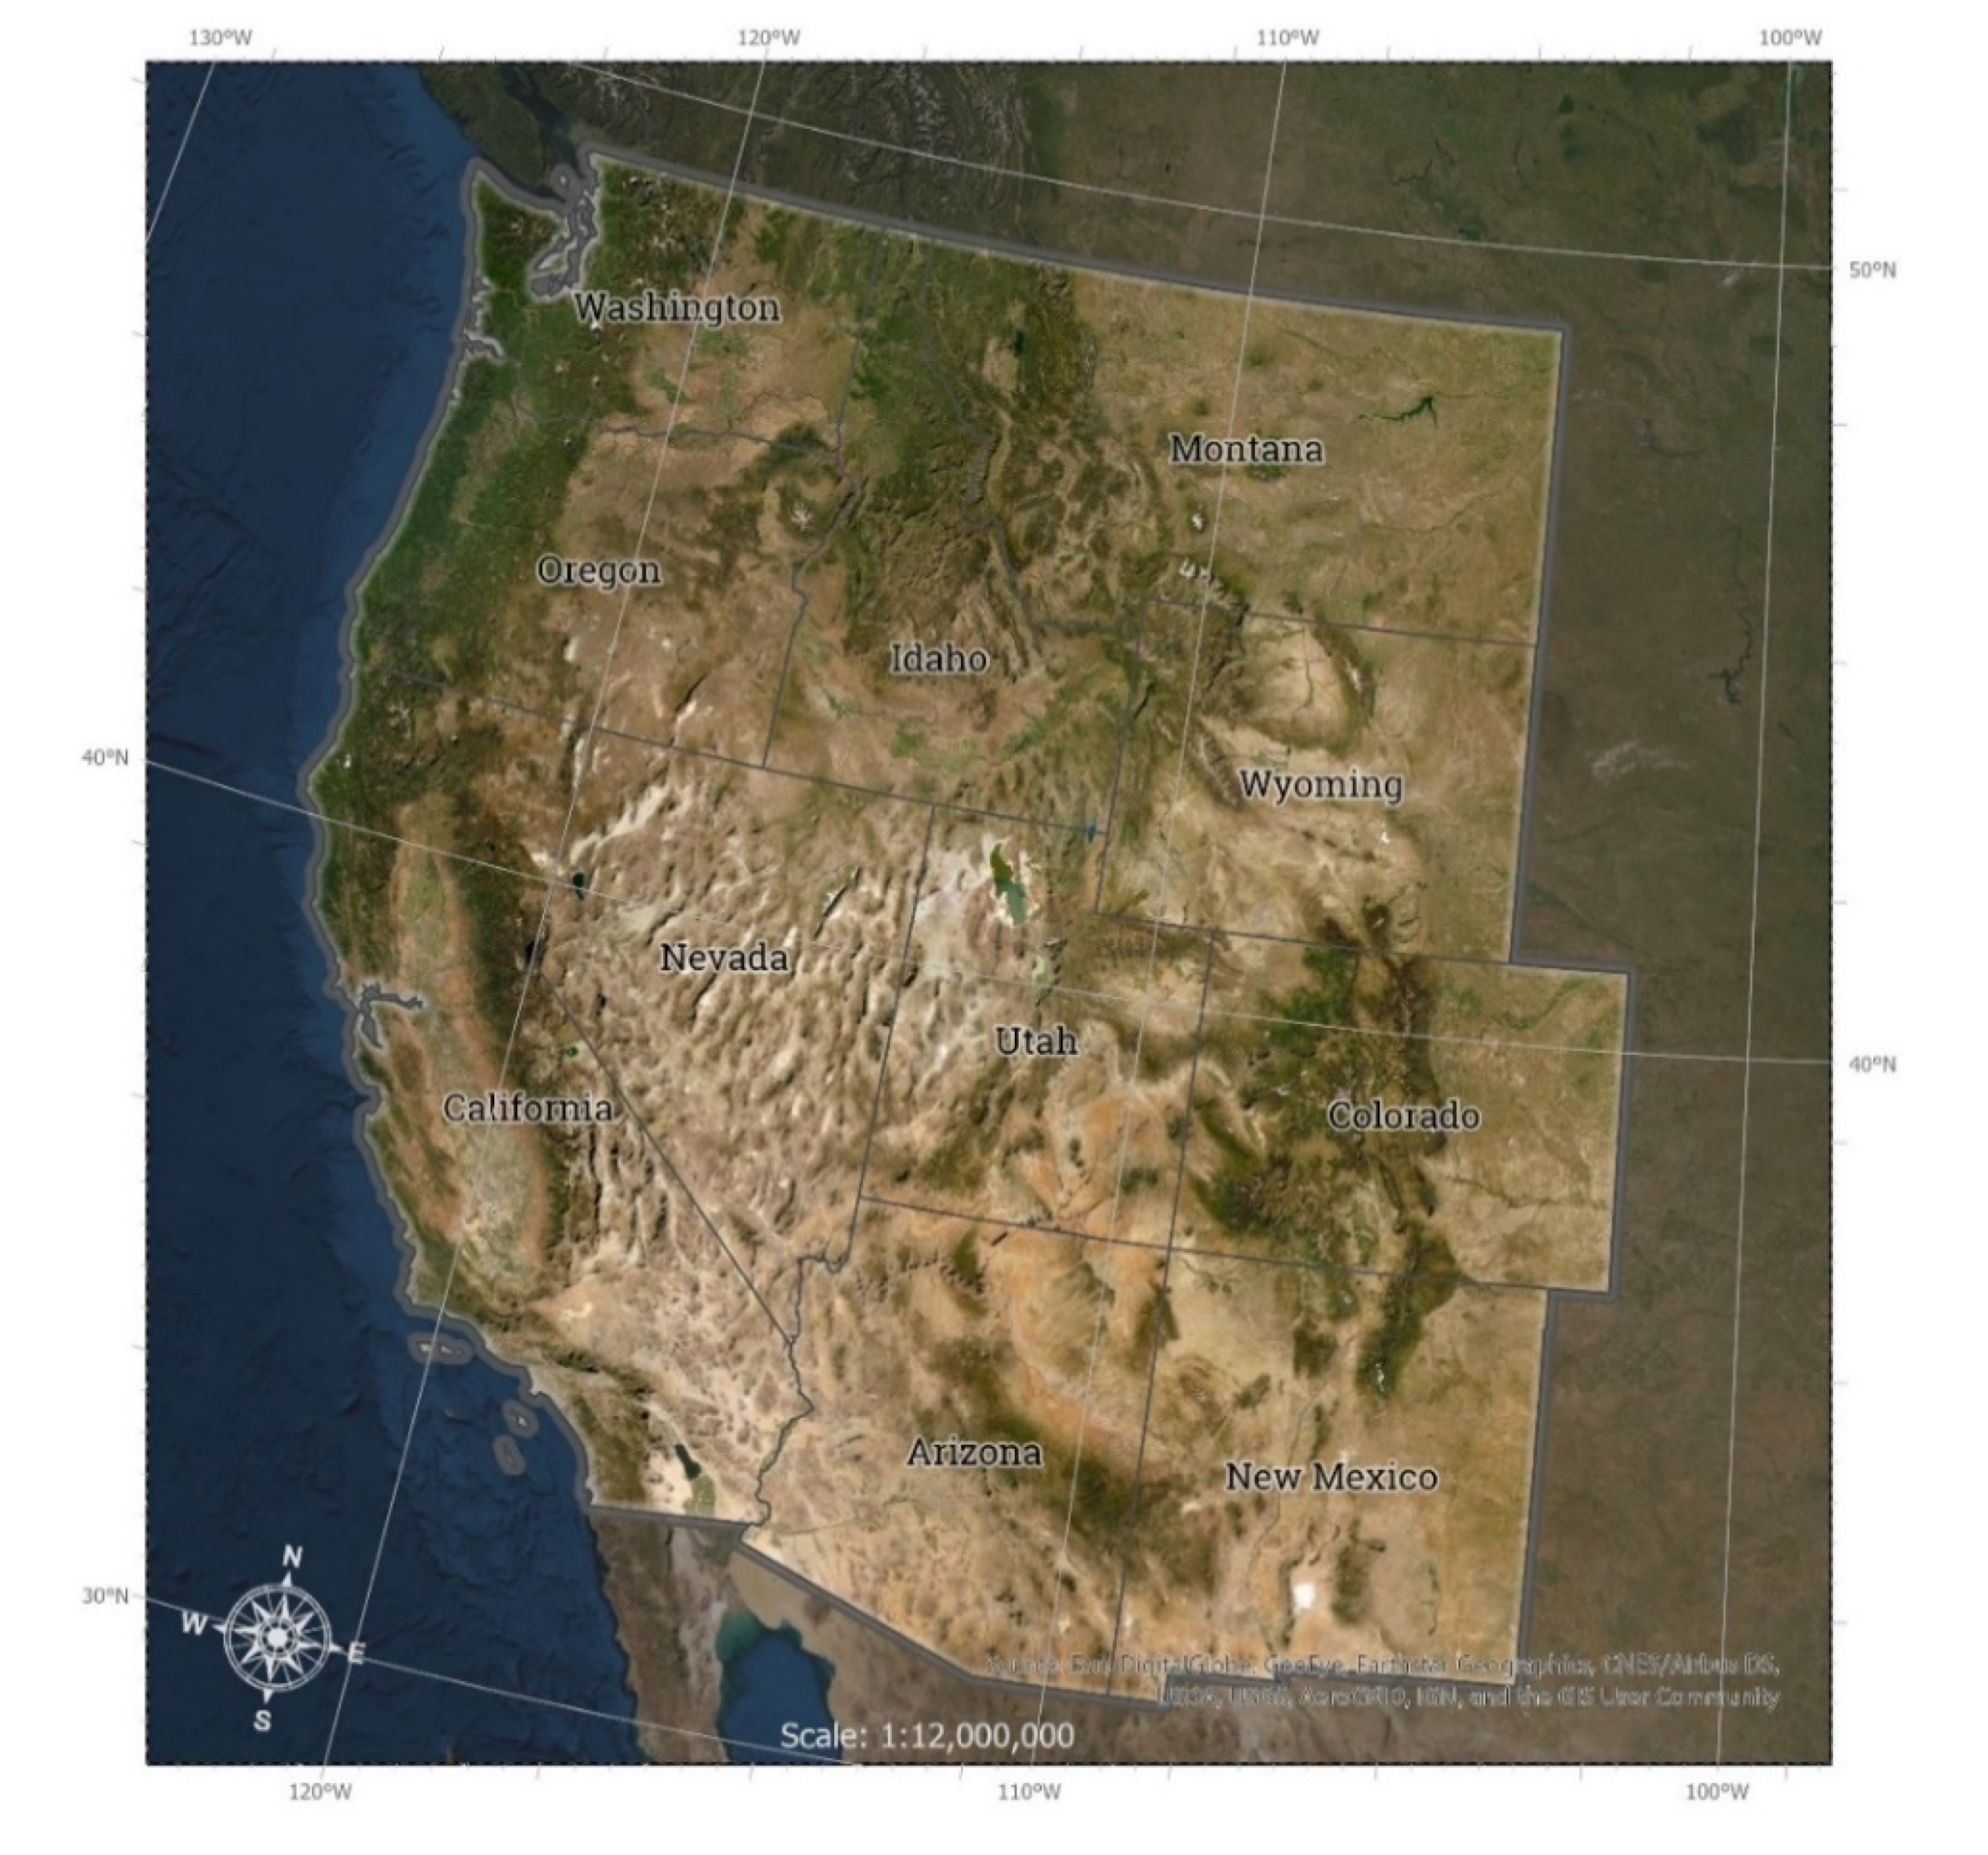
Figure 1.
The study area for this project included 11 western states. An area where wildfires are a common occurrence.
Figure 1.
The study area for this project included 11 western states. An area where wildfires are a common occurrence.

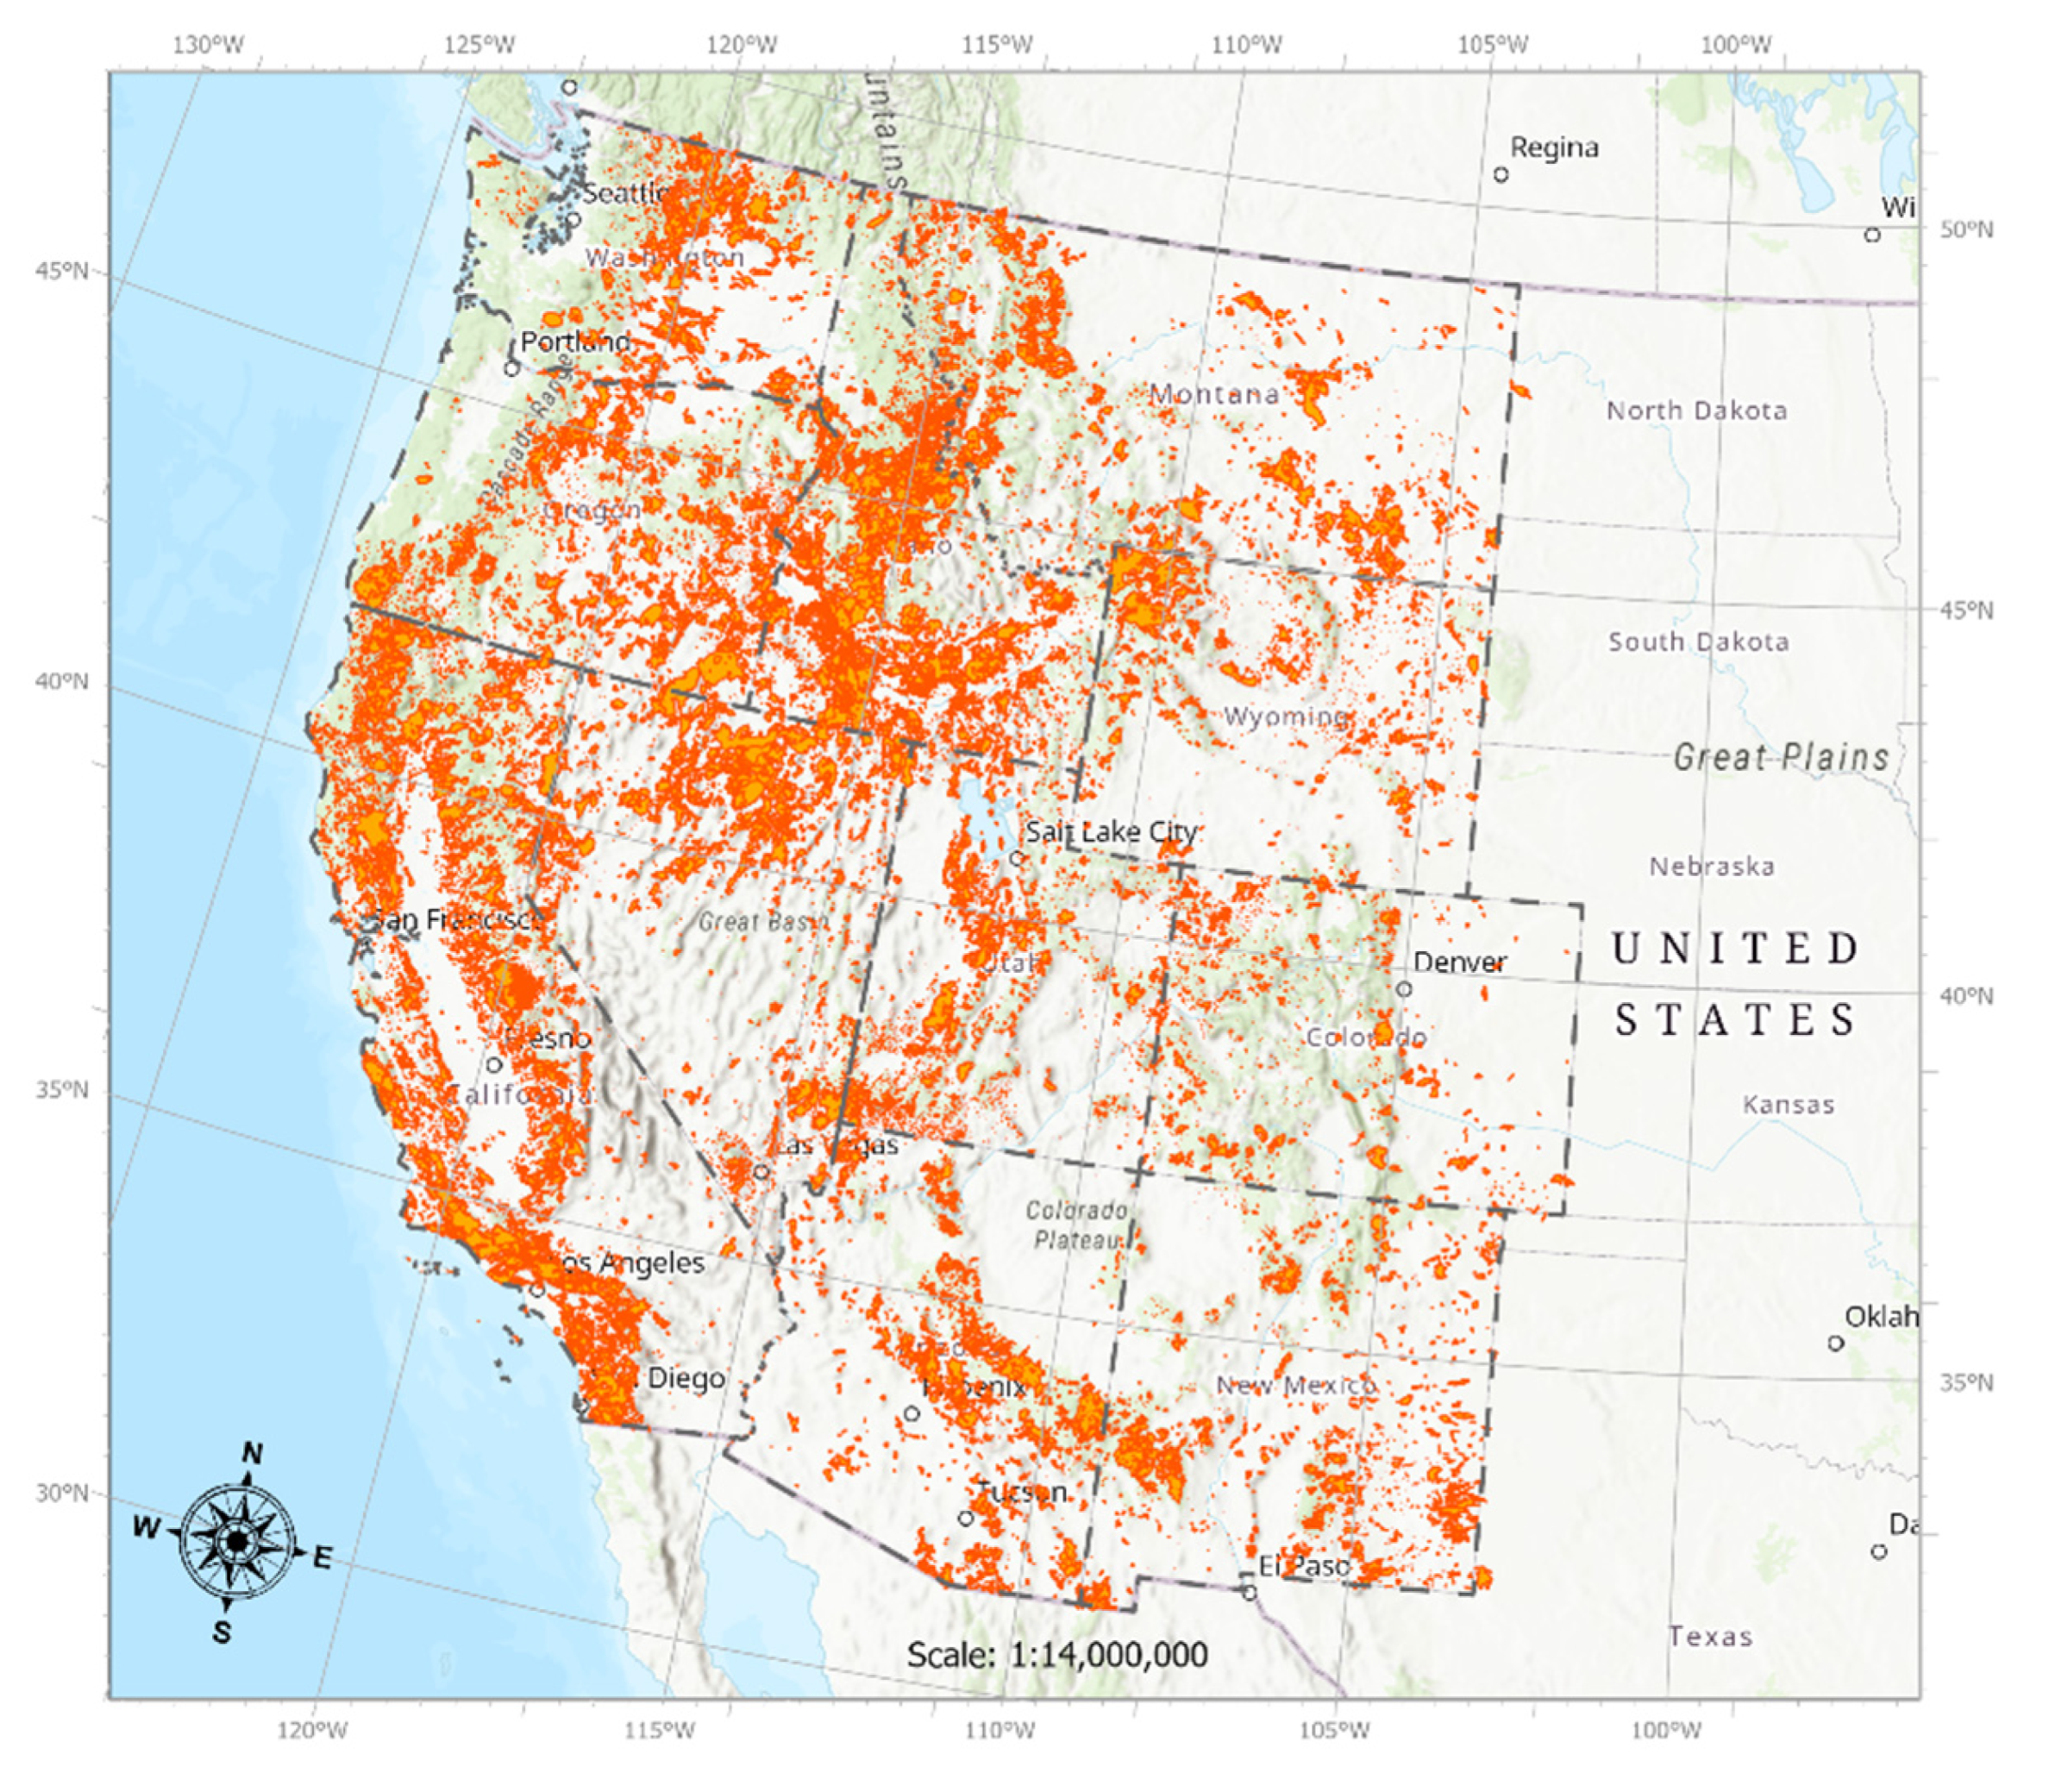
Figure 2.
Map of the western United States with nearly 56,000 wildfires documented in the Historic Fires Database (HFD) to have burned between 1950 and 2019 (sources: Esri, United States Geologic Survey (USGS), National Aeronautics and Space Administration (NASA), Garmin, National Oceanic and Atmospheric Administration (NOAA_, and the GIS user community).

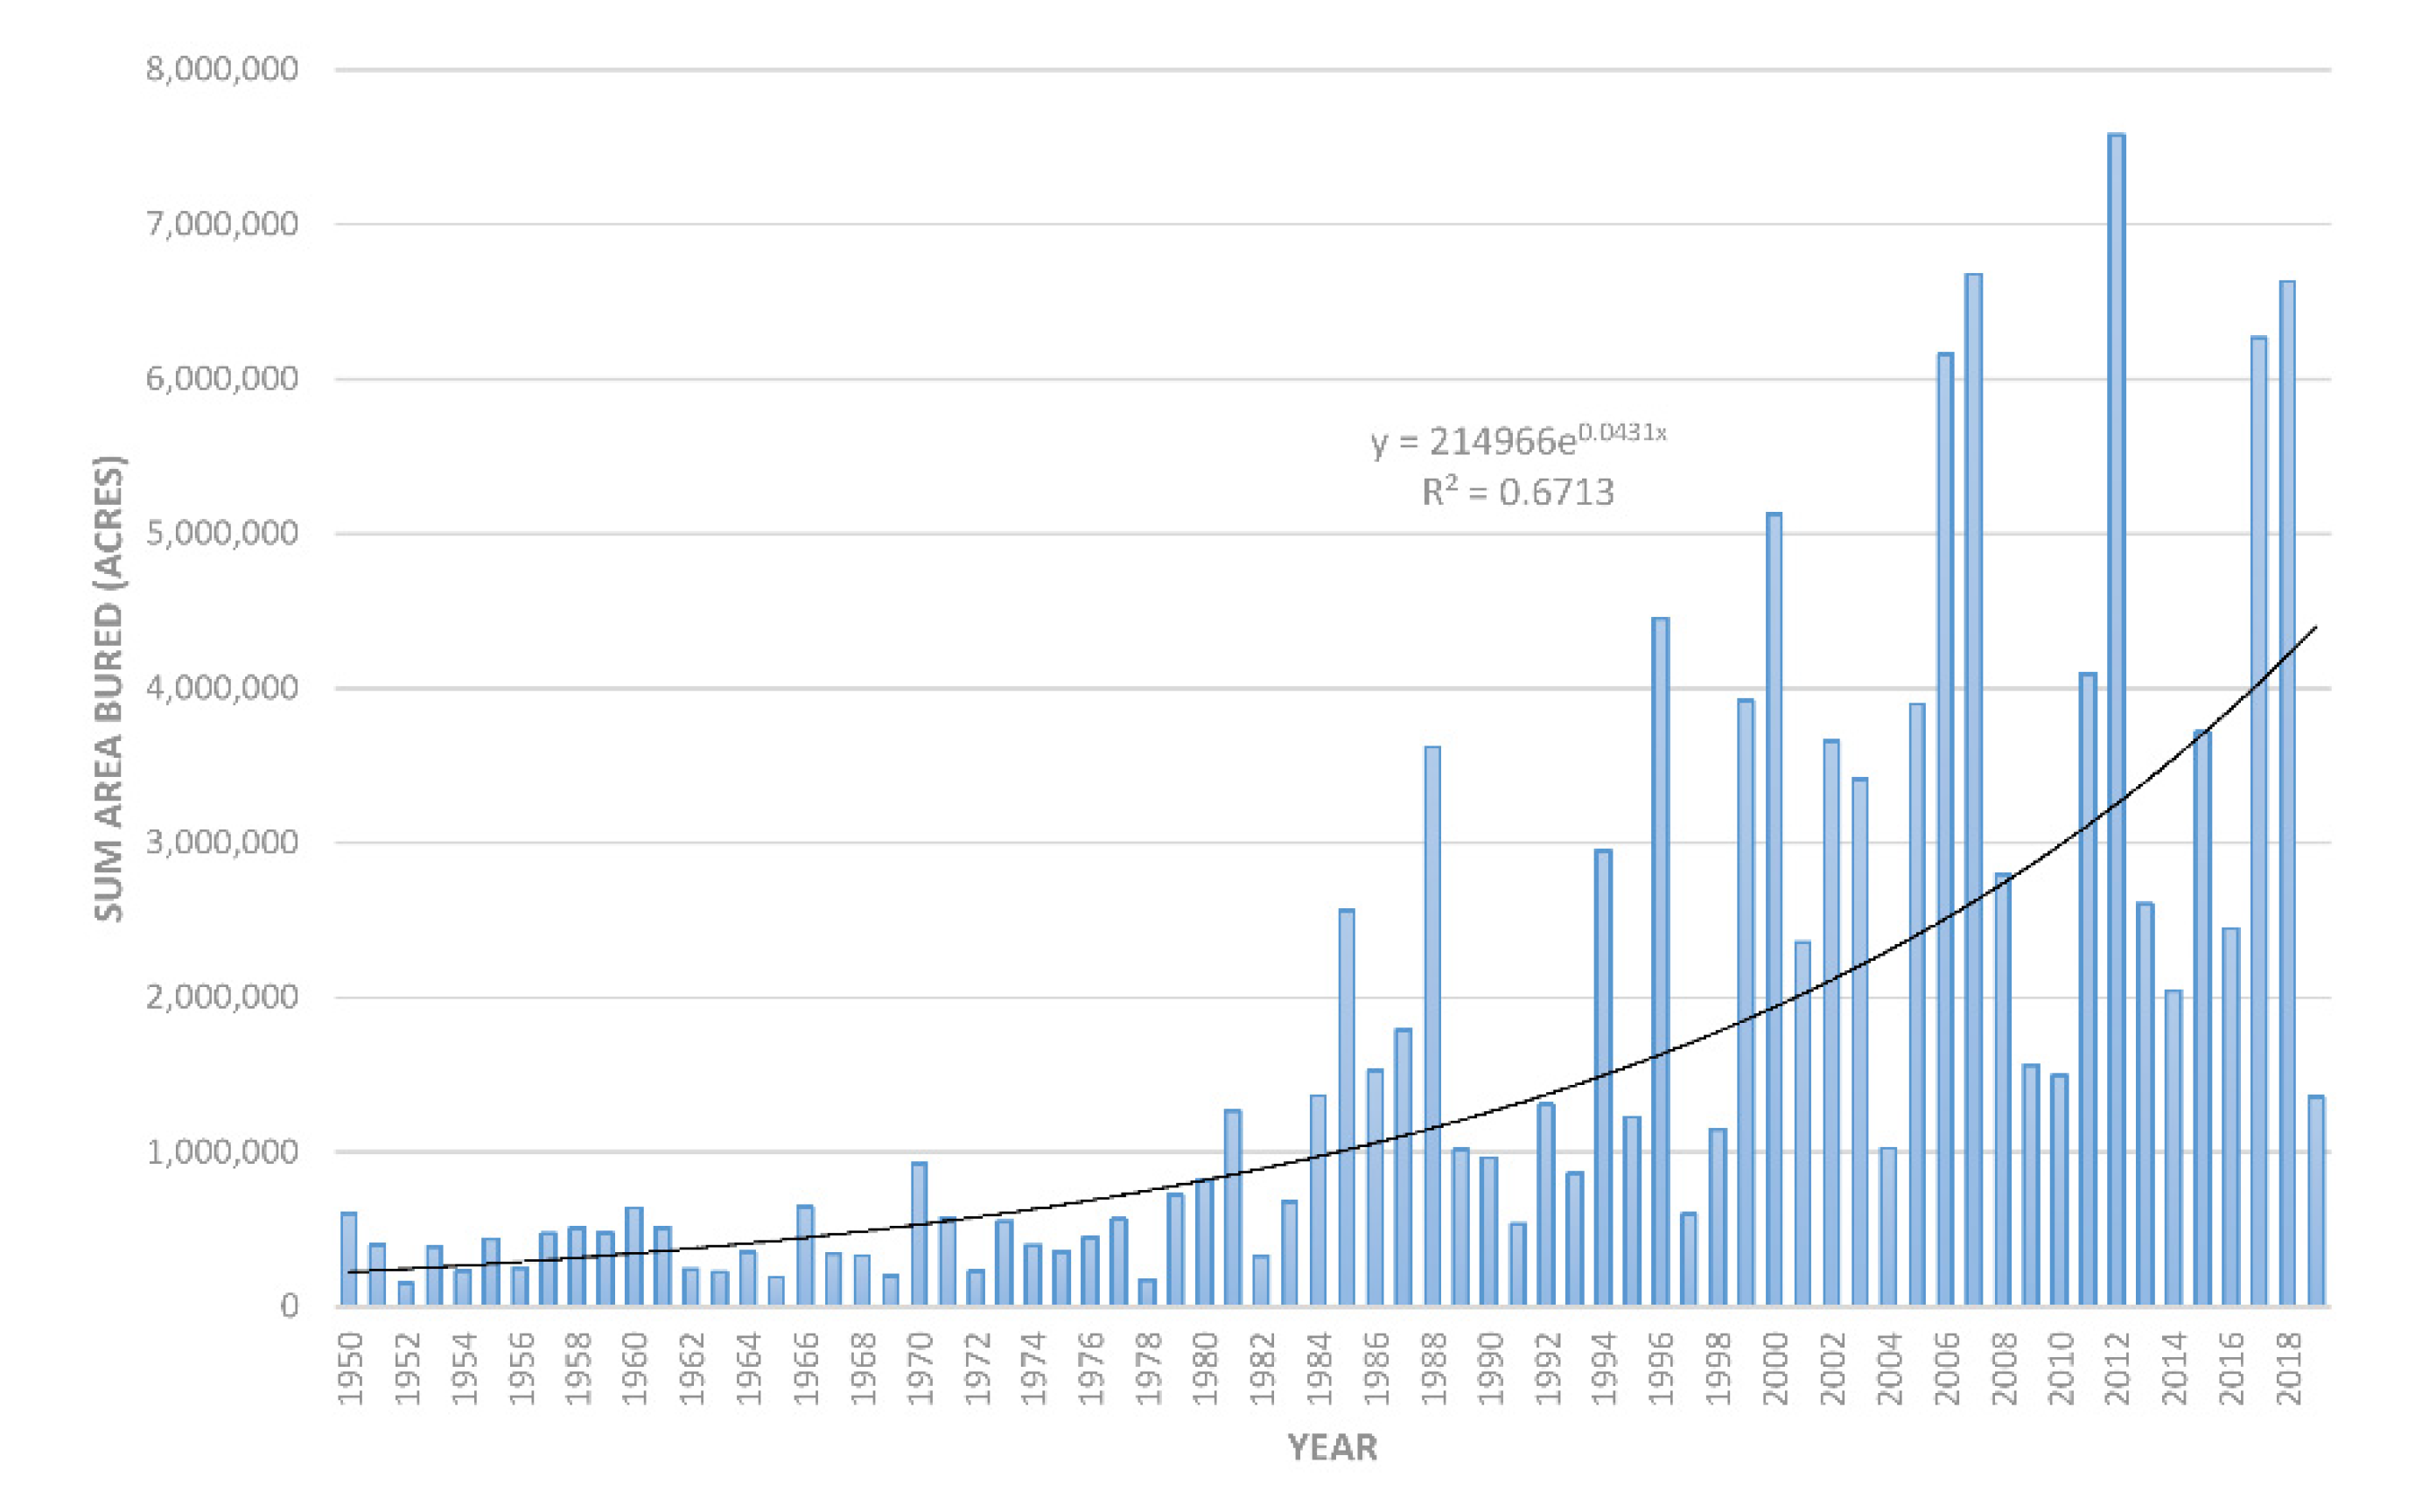
Figure 3.
The annual frequency of wildfires across the study area between 1950 and 2019 can be approximated by an exponential growth curve (R2 = 0.71). It is likely that more fires occurred than reported in the Historic Fires Database (HFD). It is equally likely that more data is missing from early in the study (left side of the graph) than from later in the study. Even considering this uncertainty, it seems apparent that wildfires are becoming more frequent.

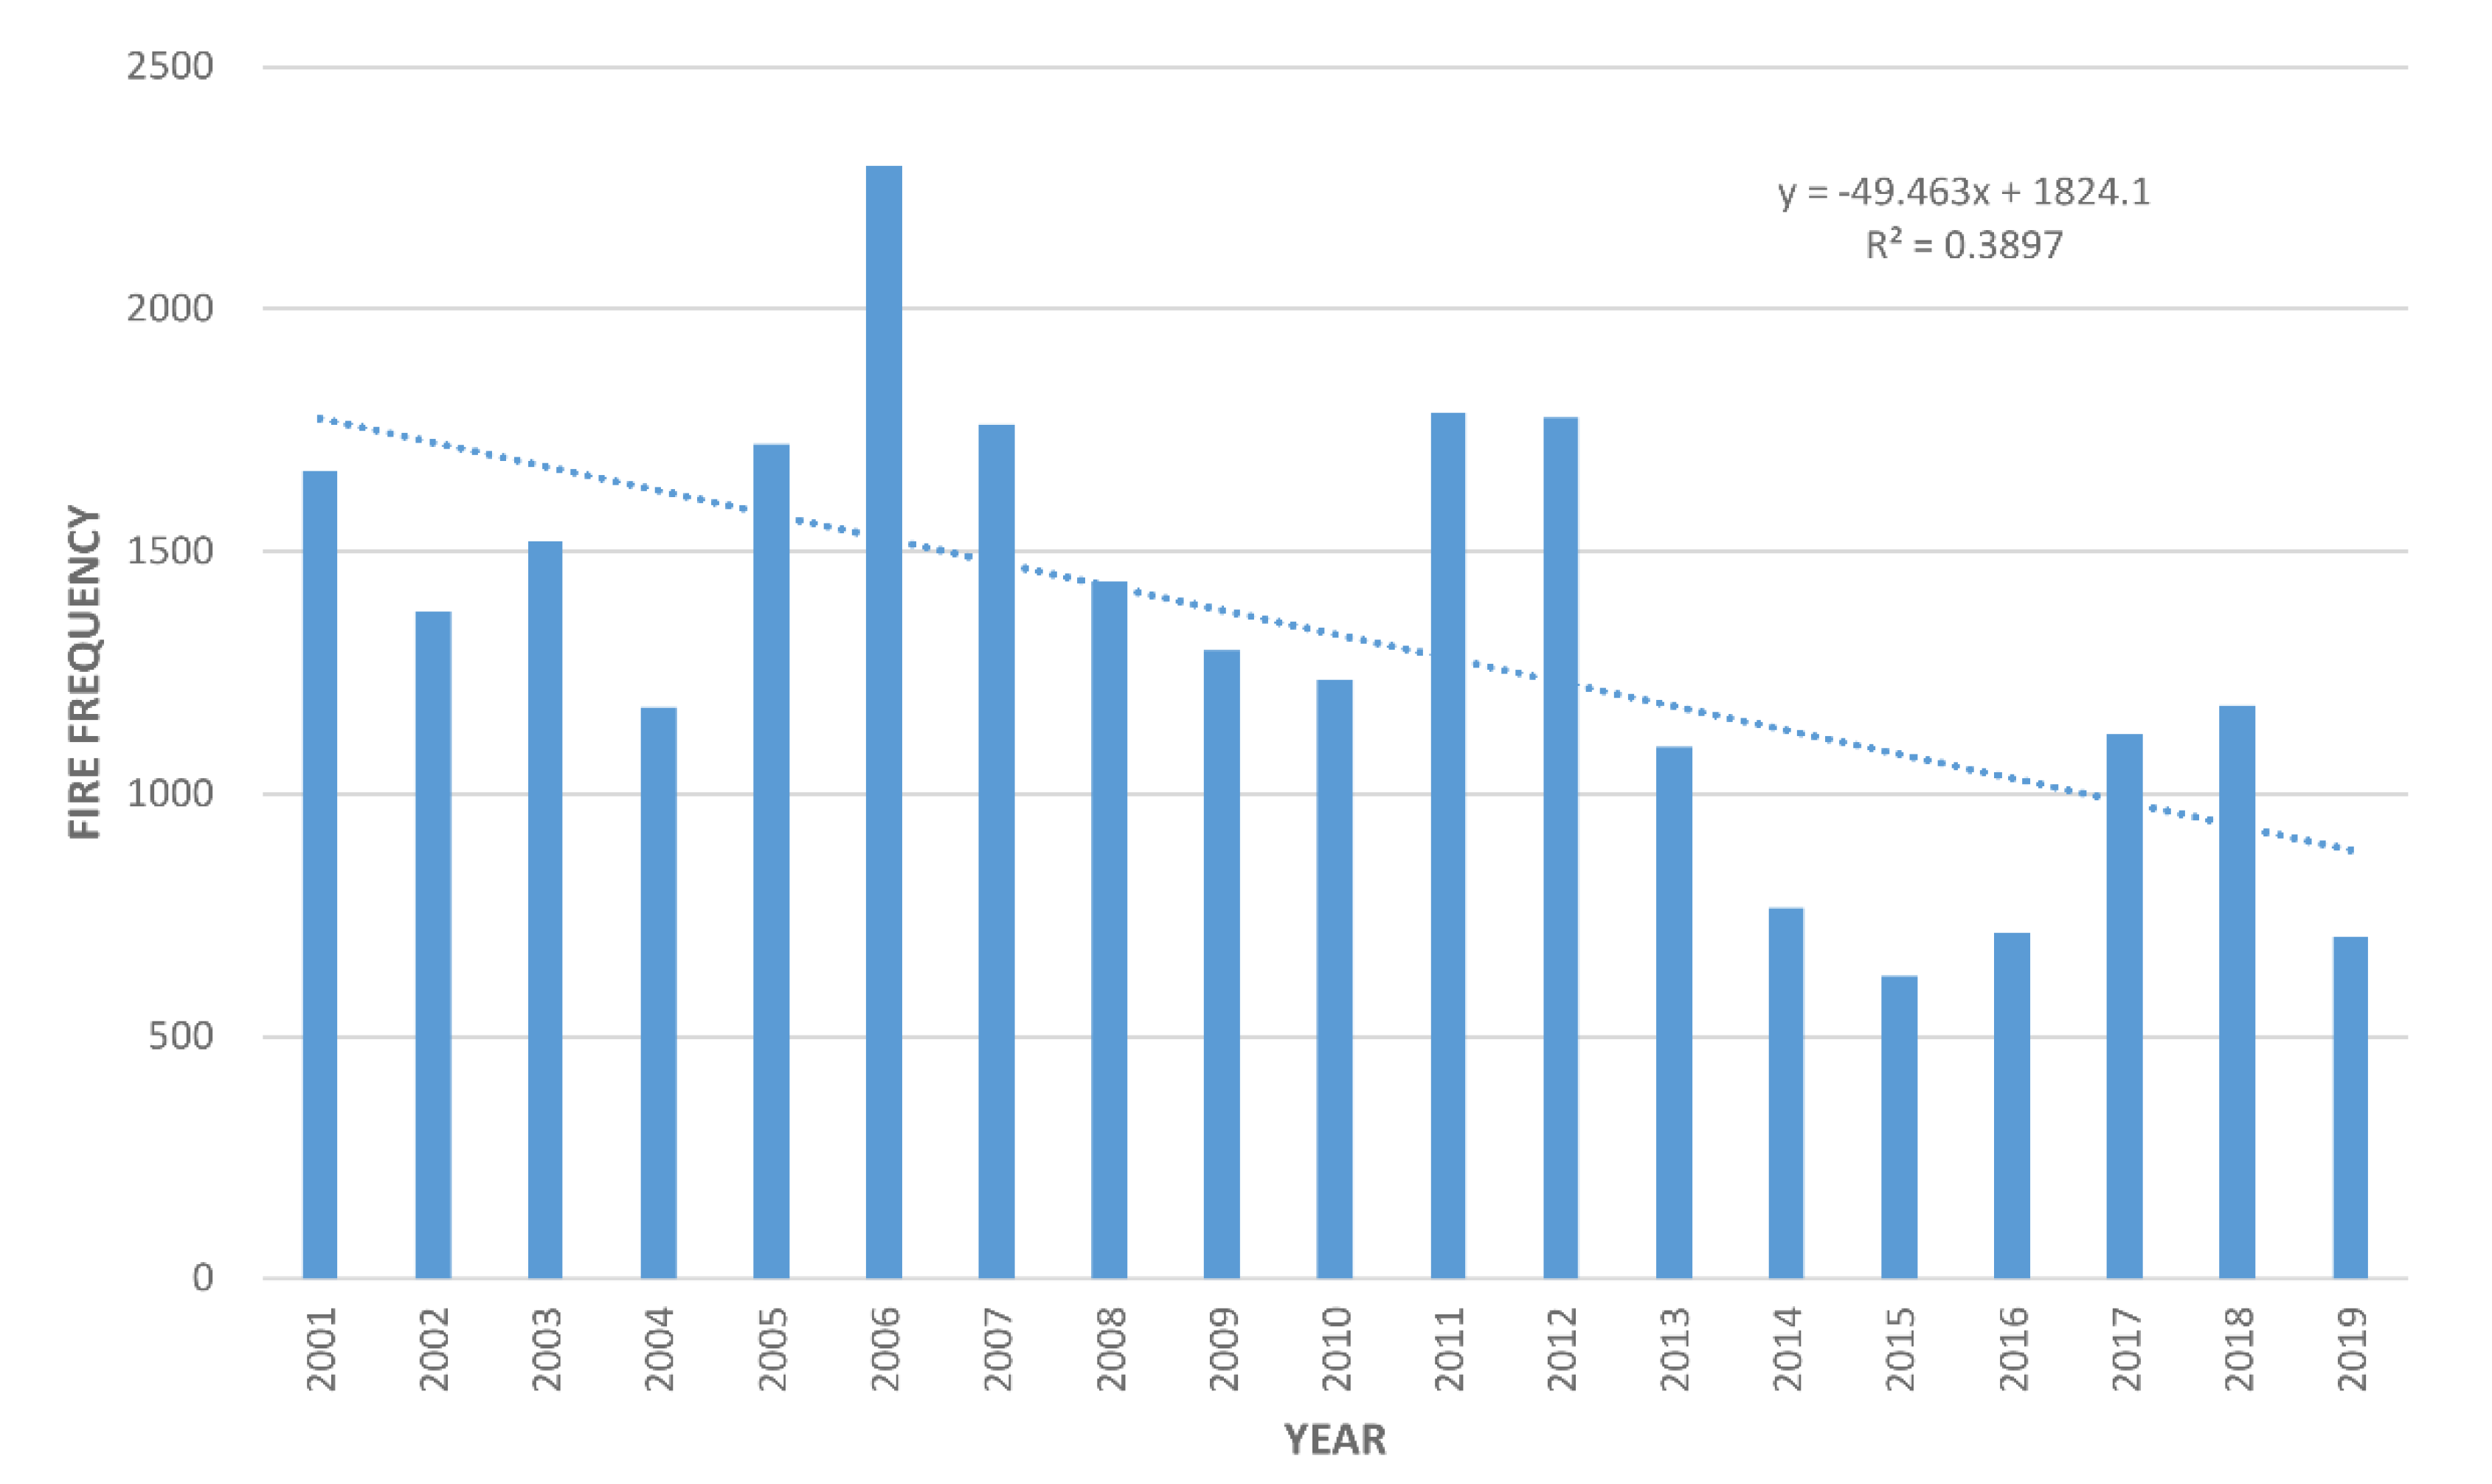
Figure 4.
The annual frequency of wildfires across the study area between 2001 and 2019 reveal a declining trend. However, mean annual frequency (1329 fires) is much higher in these decades relative to that seen between 1950 and 2019 (793 fires). Further, standard error in recent years (SE = 102.3) is nearly double that for the entire study period (SE = 59.6) indicating high inter-annual variability in fire frequency.

Figure 5.
Similar to fire frequency given in Figure 3, the annual total area burned across the study area between 1950 and 2019 is best approximated by an exponential growth curve (R2 = 0.67).
Figure 5.
Similar to fire frequency given in Figure 3, the annual total area burned across the study area between 1950 and 2019 is best approximated by an exponential growth curve (R2 = 0.67).

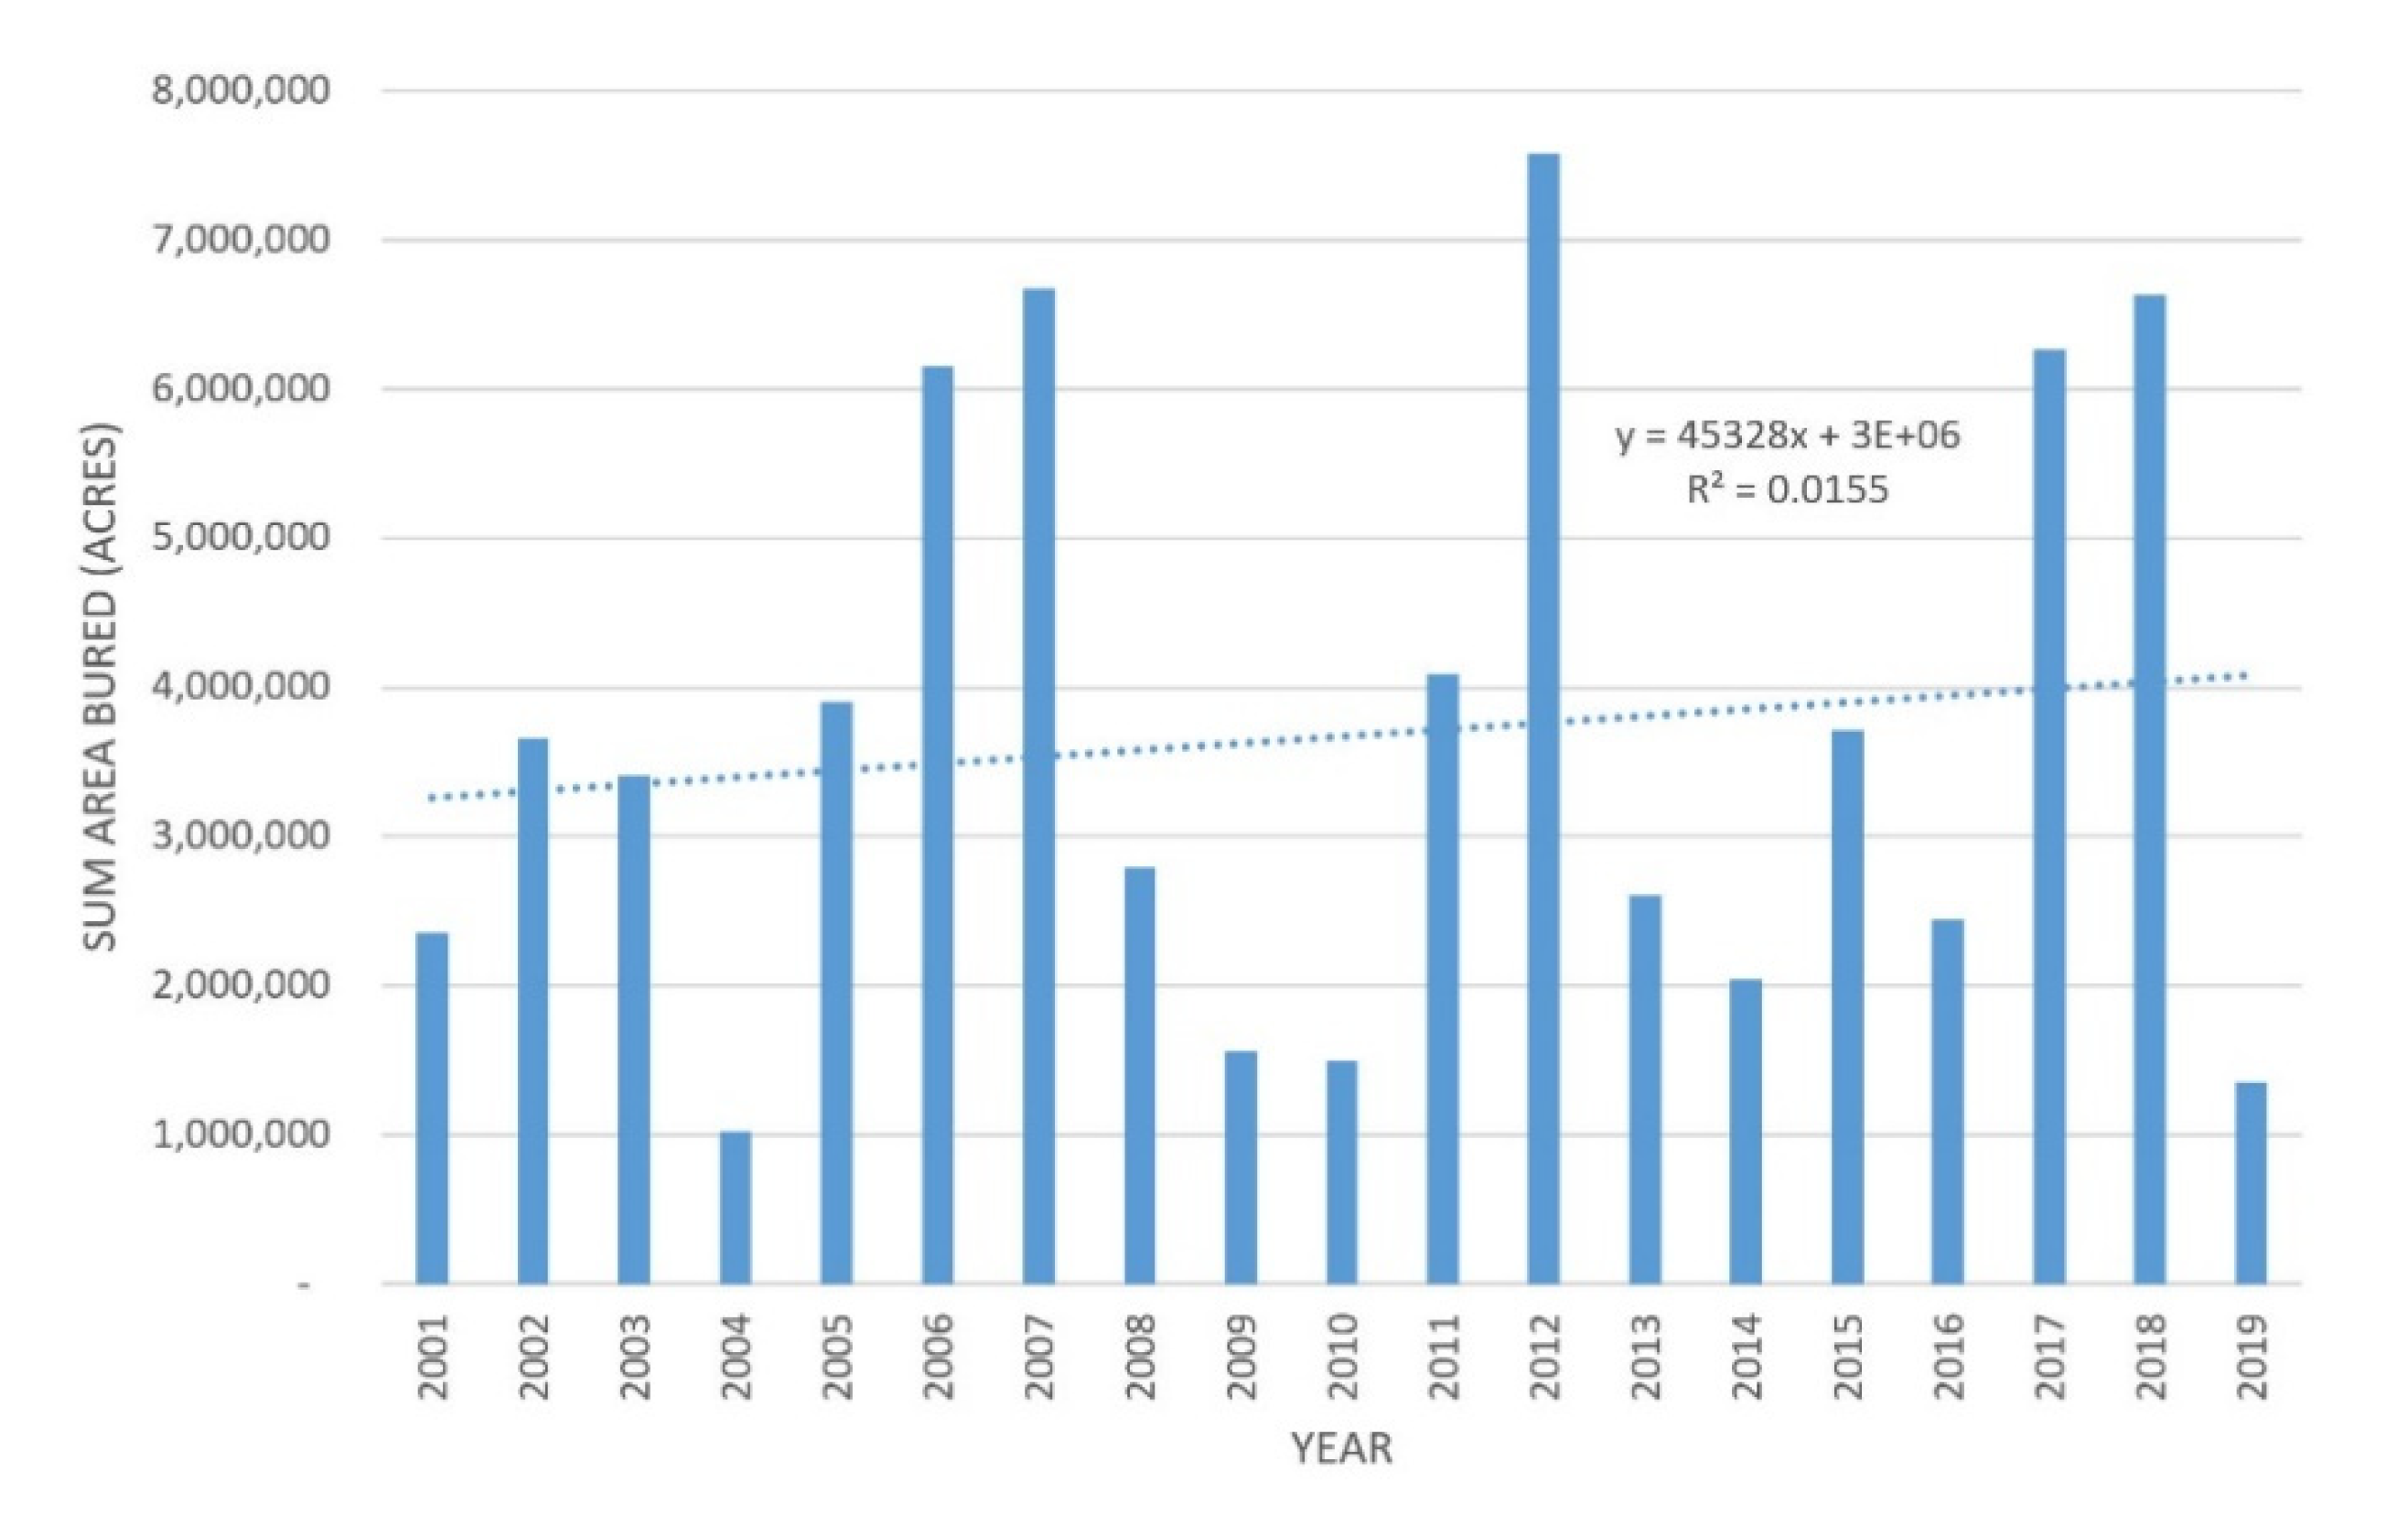
Figure 6.
Annual area burned between 2001 and 2019. In contrast to fire frequency which was shown to be declining during the same time period (cf. Figure 4), total area burned reflects a slight overall increasing trend, albeit one with a weak correlation (R2 = 0.02) due to high inter-annual variability.

Figure 7.
Graph of annual mean area burned (top) and median area burned (bottom) across the study area between 1950 and 2019. The disparity between mean and median indicates the occurrence of individual mega-fires which appear to be more prominent in later years (right side) as the difference between mean and median is increasing over time.

© 2020 by the authors. Licensee MDPI, Basel, Switzerland. This article is an open access article distributed under the terms and conditions of the Creative Commons Attribution (CC BY) license (http://creativecommons.org/licenses/by/4.0/).
Share and Cite
MDPI and ACS Style
Weber, K.T.; Yadav, R. Spatiotemporal Trends in Wildfires across the Western United States (1950–2019). Remote Sens. 2020, 12, 2959. https://0-doi-org.brum.beds.ac.uk/10.3390/rs12182959
AMA Style
Weber KT, Yadav R. Spatiotemporal Trends in Wildfires across the Western United States (1950–2019). Remote Sensing. 2020; 12(18):2959. https://0-doi-org.brum.beds.ac.uk/10.3390/rs12182959
Chicago/Turabian StyleWeber, Keith T., and Rituraj Yadav. 2020. "Spatiotemporal Trends in Wildfires across the Western United States (1950–2019)" Remote Sensing 12, no. 18: 2959. https://0-doi-org.brum.beds.ac.uk/10.3390/rs12182959
Note that from the first issue of 2016, this journal uses article numbers instead of page numbers. See further details here.