AdQSM: A New Method for Estimating Above-Ground Biomass from TLS Point Clouds


1
School of Information Science and Technology, Beijing Forestry University, Beijing 100083, China
2
Engineering Research Center for Forestry-Oriented Intelligent Information Processing, National Forestry and Grassland Administration, Beijing 100083, China
3
3D Geoinformation Research Group, Faculty of Architecture and the Built Environment, Delft University of Technology, 2628 BL Delft, The Netherlands
*
Author to whom correspondence should be addressed.
Remote Sens. 2020, 12(18), 3089; https://0-doi-org.brum.beds.ac.uk/10.3390/rs12183089
Submission received: 2 September 2020
/
Revised: 18 September 2020
/
Accepted: 19 September 2020
/
Published: 21 September 2020
(This article belongs to the Special Issue 3D Point Clouds in Forest Remote Sensing)
Abstract
:Forest above-ground biomass (AGB) can be estimated based on light detection and ranging (LiDAR) point clouds. This paper introduces an accurate and detailed quantitative structure model (AdQSM), which can estimate the AGB of large tropical trees. AdQSM is based on the reconstruction of 3D tree models from terrestrial laser scanning (TLS) point clouds. It represents a tree as a set of closed and complete convex polyhedra. We use AdQSM to model 29 trees of various species (total 18 species) scanned by TLS from three study sites (the dense tropical forests of Peru, Indonesia, and Guyana). The destructively sampled tree geometry measurement data is used as reference values to evaluate the accuracy of diameter at breast height (DBH), tree height, tree volume, branch volume, and AGB estimated from AdQSM. After AdQSM reconstructs the structure and volume of each tree, AGB is derived by combining the wood density of the specific tree species from destructive sampling. The AGB estimation from AdQSM and the post-harvest reference measurement data show a satisfying agreement. The coefficient of variation of root mean square error (CV-RMSE) and the concordance correlation coefficient (CCC) are 20.37% and 0.97, respectively. AdQSM provides accurate tree volume estimation, regardless of the characteristics of the tree structure, without major systematic deviations. We compared the accuracy of AdQSM and TreeQSM in modeling the volume of 29 trees. The tree volume from AdQSM is compared with the reference value, and the determination coefficient (R2), relative bias (rBias), and CV-RMSE of tree volume are 0.96, 6.98%, and 22.62%, respectively. The tree volume from TreeQSM is compared with the reference value, and the R2, relative Bias (rBias), and CV-RMSE of tree volume are 0.94, −9.69%, and 23.20%, respectively. The CCCs between the volume estimates based on AdQSM, TreeQSM, and the reference values are 0.97 and 0.96. AdQSM also models the branches in detail. The volume of branches from AdQSM is compared with the destructive measurement reference data. The R2, rBias, and CV-RMSE of the branches volume are 0.97, 12.38%, and 36.86%, respectively. The DBH and height of the harvested trees were used as reference values to test the accuracy of AdQSM’s estimation of DBH and tree height. The R2, rBias, and CV-RMSE of DBH are 0.94, −5.01%, and 9.06%, respectively. The R2, rBias, and CV-RMSE of the tree height were 0.95, 1.88%, and 5.79%, respectively. This paper provides not only a new QSM method for estimating AGB based on TLS point clouds but also the potential for further development and testing of allometric equations.

1. Introduction
Above-ground biomass (AGB) estimation, which measures forest productivity or carbon sequestration, is an essential step in forest management [1,2,3]. The direct method of measuring AGB is to cut down and weigh all the trees in the plot, which is costly and time-consuming [4,5]. Therefore, it is necessary to develop indirect biomass estimation methods. Common methods for estimating forest AGB are based on indirect relationships between tree structure parameters such as diameter at breast height (DBH) and tree height [6,7]. An allometric equation established by destructive sampling is an indirect method for estimating AGB, which can be applied to large-scale sample estimation [8,9]. However, the accuracy is not satisfactory when estimating individual trees or small samples. Due to different assumptions, it is difficult to conduct reliable verification based on the measurement results and to quantify the uncertainties [10,11,12]. This indirect estimation method produces an error propagation chain, in which the largest source of error is allometric equation [13,14]. This allometric measurement is valid when it is applied within the productivity and species range of calibration data, but it may lead to greater uncertainty in large-scale biomass mapping [6,8,9]. Thus, it is necessary to develop a method for non-destructive biomass estimation that can properly balance the relationship between accuracy and efficiency. LiDAR is one of the most effective and accurate methods to estimate biomass of single trees [5,15]. This indirect estimation method based on LiDAR data has been increasingly used for biomass estimation. Terrestrial laser scanning (TLS) can measure the tree three-dimensional (3D) structure with high precision [16,17]. The TLS point clouds can be used to not only validate allometric equation but also to develop and test a new allometric relationship [18,19,20]. Since large trees are not often harvested and measured to calibrate allometric growth, the absolute error increases with the DBH [10,21,22].
High-density LiDAR point clouds can describe detailed tree information, which lays the foundation for the reconstruction of tree geometry and topology [11,23]. Three-dimensional reconstruction of trees based on LiDAR point clouds can directly obtain the structure or size distribution of trees branches, the size of tree crowns, etc. [24,25]. The quantitative structure model (QSM) is a geometric model that describes a complete above-ground tree in a hierarchical order [26]. QSM can reconstruct a 3D model based on the point clouds of the individual tree, and then extract tree attributes [27,28]. QSM can directly calculate the tree volume from the TLS data, and further derive AGB by combining the wood density information [29,30]. The remote sensing estimation of AGB is almost entirely dependent on the allometric form based on tree height or DBH. QSM does not require any prior information about allometric growth when estimating AGB [28]. Accurate tree information provided by LiDAR data is necessary to improve the calibration and verification of AGB remote sensing estimates [31,32,33,34]. The tree size will affect the accuracy of allometric equation to estimate AGB, while the QSM method estimates AGB independent of the tree size [32,35]. The QSM method can better quantify the errors caused by wood density and the allometric model. It should be noted that it cannot replace the allometric measurement method. The QSM method based on LiDAR point clouds still relies on validation by destructive sampling [36,37].
Some results show that the QSM method is feasible and effective for forest AGB estimation [16,32]. TreeQSM, developed by Pasi Raumonen et al., is a QSM that has been widely used [26,27]. Destructive experiments have confirmed TreeQSM’s high accuracy, and some researchers have used it to model trees from TLS data. Raumonen et al. automatically reconstructed a quantitative structural model of each tree in the forest plot from TLS data and estimated the AGB of oak and eucalyptus trees in combination with the wood density [29]. Compared with the biomass of destructive harvest, the average relative absolute error of oak was between 23.7% and 25.5%, and the calculated biomass was overestimated by 15.3–18.8%. The average relative absolute error of eucalyptus biomass was approximately 28.5%. Sruthi M. Krishna Moorthy et al. calculated the biomass and volume of lianas stem using TreeQSM from TLS data in tropical forests [38]. The results show that the consistency correlation coefficient (CCC) between the TLS-derived volume and the reference volume of synthetic lianas was 0.94. The CCC values of all allometric models and the most commonly used pantropical model were relatively low, reaching 133% compared with the biomass derived from TLS. Kim Calders et al. used TreeQSM to estimate the volume of 65 eucalyptus trees from TLS data and combined with the basic density information to infer AGB [37]. Estimates of AGB from TLS showed higher agreement with reference values for destructive sampling (CCC = 0.98). The estimates of AGB from allometric equation were in low agreement with the reference values (CCC = 0.68 − 0.78), and the total AGB was underestimated by 36.57–29.85% compared with allometric equation. Jose Gonzalez DE Tanago used TreeQSM to estimate AGB of large tropical trees from TLS data [10]. The comparison between the AGB estimation through the QSM method and destructive harvest measurement shows that the best agreement (coefficient of variation of root mean square error (CV-RMSE) is 28.37% and CCC is 0.95), and the QSM model outperforms the pantropical allometric models tested.
Shenglan Du et al. proposed a method called AdTree that provides the geometric basis for automatic, detailed, and accurate 3D reconstruction of real-world trees [39]. The AdTree method is robust to different types and sizes of trees. As long as the input point clouds has a clear branch structure, high-quality tree models can be generated. Compared to other open-source tree cylindrical modeling methods (PypeTree, TreeQSM, and SimpleTree) [40,41], the tree stem and branches generated based on AdTree have higher geometric accuracy. Specifically, the distances between the input point and the output model are less than 10 cm. In 2020, Guangpeng Fan et al. [42] further extended the AdTree method and defined the calculation method for deriving DBH, tree height, and volume from the model. However, the above research did not use destructive tree measurement data to validate the AdTree-based QSM method. In this work, we further optimized and tested the research results of Shenglan Du, Guangpeng Fan, and others, and we call the new QSM model AdQSM. We also use the destructive sampling data of 29 large trees from tropical forests in Indonesia, Peru, and Guyana as reference values to verify the accuracy of DBH, tree height, tree volume, branch volume, and AGB estimated from AdQSM.
In summary, the contribution of this work includes: (1) a novel QSM model based on AdTree, which is suitable for the study of tree volume, biomass or carbon storage based on forest 3D point clouds. (2) The use of destructive tree measurement data to validate the potential and accuracy of volume reconstruction using AdQSMs for estimating AGB of large tropical forest trees.
2. Materials and Methods
2.1. Data Preparation
To effectively test the performance and accuracy of AdQSM, this paper used a large tropical tree dataset collected by Wageningen University in Indonesia, Peru, and Guyana (http://lucid.wur.nl/datasets/terrestrial-lidar-of-tropical-forests). The data set consists of 29 individual tree TLS point clouds, forest inventory data, and destructive sampling measurement data. Most of the trees sampled were medium to very large tropical trees, with a rather complex canopy structure, and they were scanned in their natural environment. This dataset is an interesting example for testing the performance of a given 3D tree model. This dataset was published for the first time in the study of Jose Gonzalez de Tanago [10]. Table 1 provided relevant description information of the geographic environment and plot characteristics of the dataset.
2.1.1. TLS Data
The TLS data were collected using the (RIEGL VZ-400 3D®) ground laser scanner (RIEGL Laser Measurement Systems GmbH, Horn, Austria). TLS scanned 29 plots and then destructively sampled the largest tree in each plot. Plot spatial design were designed to cover the expected area where the tree to be harvested will land: 30 × 50 m in Peru and 30 × 40 m in Indonesia and Guyana. The TLS scan locations within each plot followed a systematic spatial pattern within each plot. It must be noted that the spatial sampling applied was optimized for plot scanning and not for individual trees, which could improve the data quality for target trees. Each scan had an angular resolution of 0.06°. To acquire a full hemispherical scan, two scans were taken at each scan location; one in an upright position (scanner rotation perpendicular to the ground) and the other in a tilted position (scanner parallel to the ground). Please refer to the paper published earlier on the dataset for the detailed configuration of the scanner, plot space design, and tree selection [10].
2.1.2. Forest Inventory Data
Tree species were identified by an experienced taxonomy expert. Table 2 provides species information of 29 trees, a total of 18 different species of tropical trees range from medium to large. Some attributes (the DBH, tree height, the height of the living crown, and crown size of each tree) were measured before the tree was harvested. The DBH was measured with a forestry tape with a precision of 0.01 m. The tree height was measured with the Nikon “Forestry-Pro” (Hayama, Japan) laser altimeter with a precision of 0.2 m. The maximum DBH was 127.6 cm and the maximum tree height was 50.5 m. The average DBH was 73.5 cm and the average tree height was 33.34 m.
2.1.3. Tree Geometry Measurement Based on Destructive Sampling
The geometry of trunks, branches, and buttresses of 29 harvested trees from Guyana, Peru, and Indonesia was measured. As shown in Figure A1(1) in Appendix A, the trunk diameter (1a) was measured every meter along the trunk (1b) according to the method of Kankare et al. [43]. For trees with buttresses or major irregularities, the method shown in Figure A1(2) was used. Finally, the measurement of all branches was completed by measuring each internode individually until the tapered diameter is ≤10 cm, as shown in Figure A1(3).
2.2. Tree Volume Estimation
2.2.1. Tree Volume Estimation Based on Reference Measurements
The reference volume of the 29 harvested sample trees was determined based on the tree geometric measurement values. For the geometric measurement method, please refer to Section 2.1.3. The total volume of an individual tree is calculated as the sum of the trunk, larger branches (diameter > 10 cm), and buttresses. After obtaining the tree geometry measurement data, the Smalian formula in Nogueira, Nelson, and Fearnside was used to estimate the volume of the trunk and branches [44], and the general prism volume formula was used to calculate the buttress volume. Detailed information can be found in Appendix A.
As stated by Berger, McRoberts, and Fearnside [44,45], any misrepresentation of the trunk and branch volumes by Smalian approximation and any measurement errors taken were considered negligible and ignored. Furthermore, it is assumed that the sum of all cylinders represents the real tree volume without error, and the measurement of wood volume has no error.
2.2.2. Tree Volume Estimation from 3D Reconstruction—A New Quantitative Structure Model of Trees
In 2019, the AdTree method proposed by Shenglan Du et al. can accurately reconstruct the three-dimensional geometric and topological structure of trees. In 2020, Guangpeng Fan et al. updated and expanded the AdTree method and proposed a new quantitative estimation method for tree parameters [39,42]. Based on Adtree’s research, the minimum spanning tree algorithm (MST) was used to extract the initial skeleton of the tree from the input point clouds and trim it. Then fit a series of cylinders to approximate the geometry of tree trunks and branches. At this time, trees were a group of generalized cylindrical surfaces. After closing the ends of the main branch, the tree changed from a generalized cylindrical surface to a closed convex hull polyhedron.
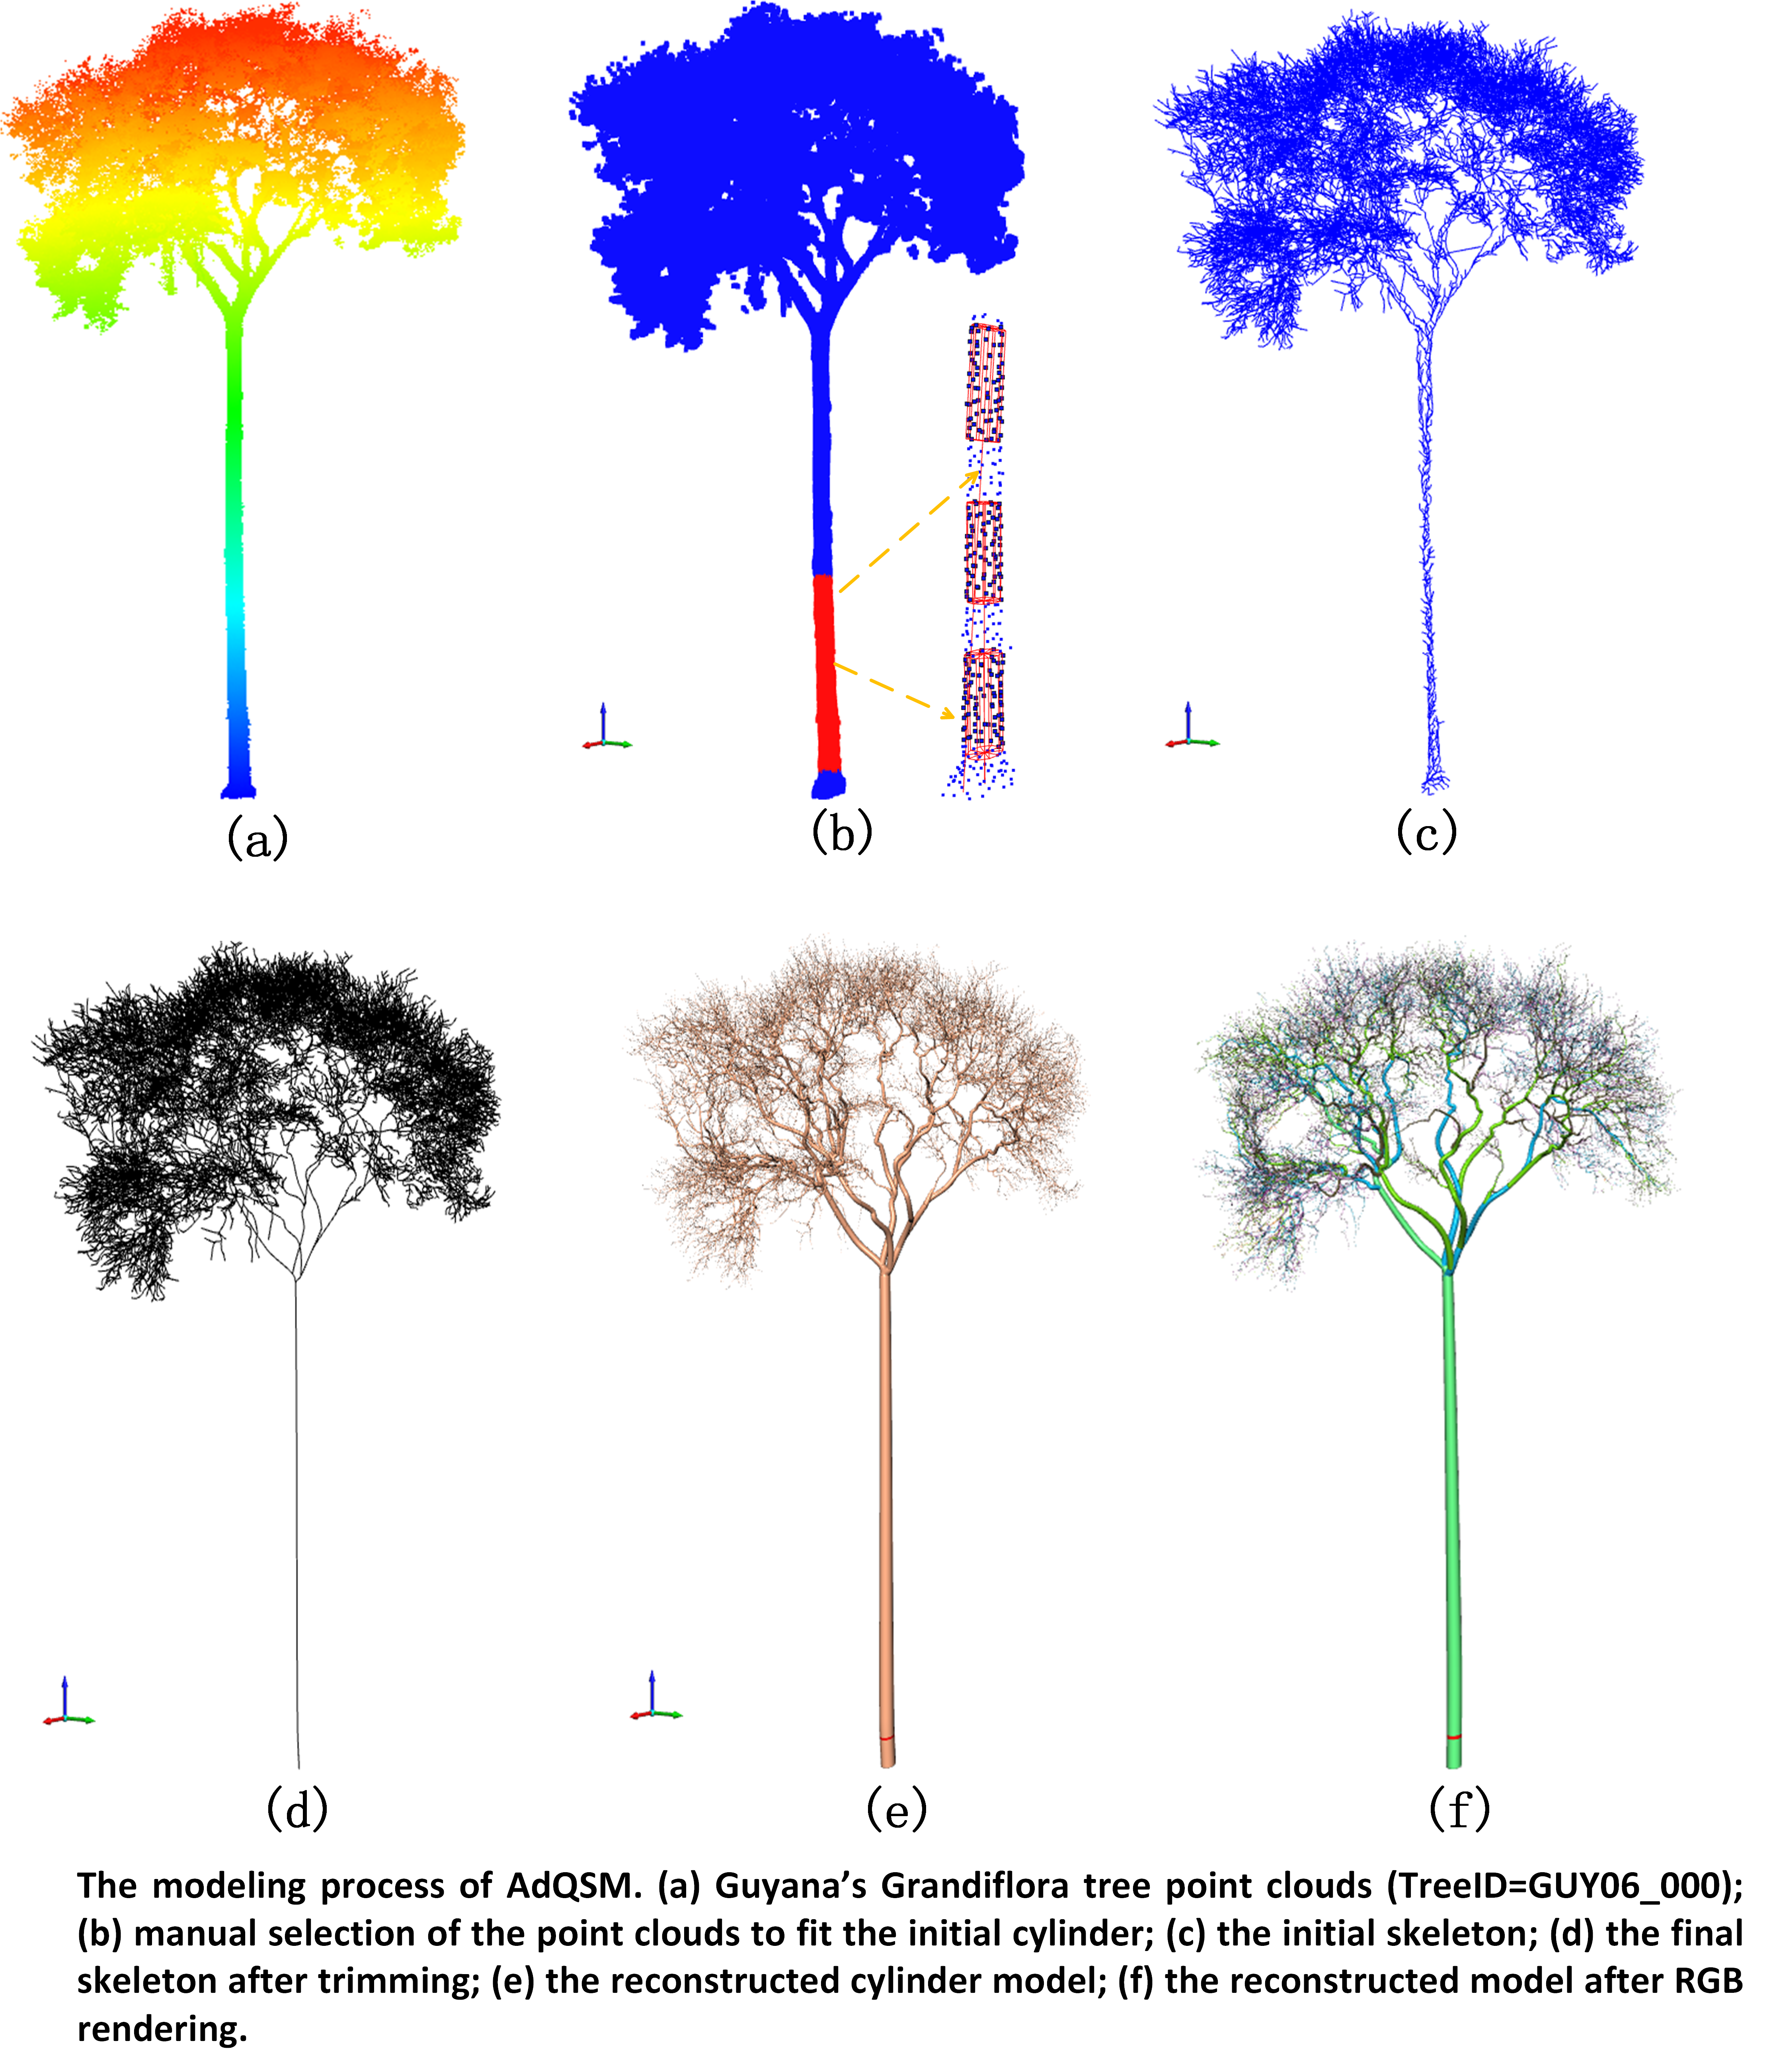
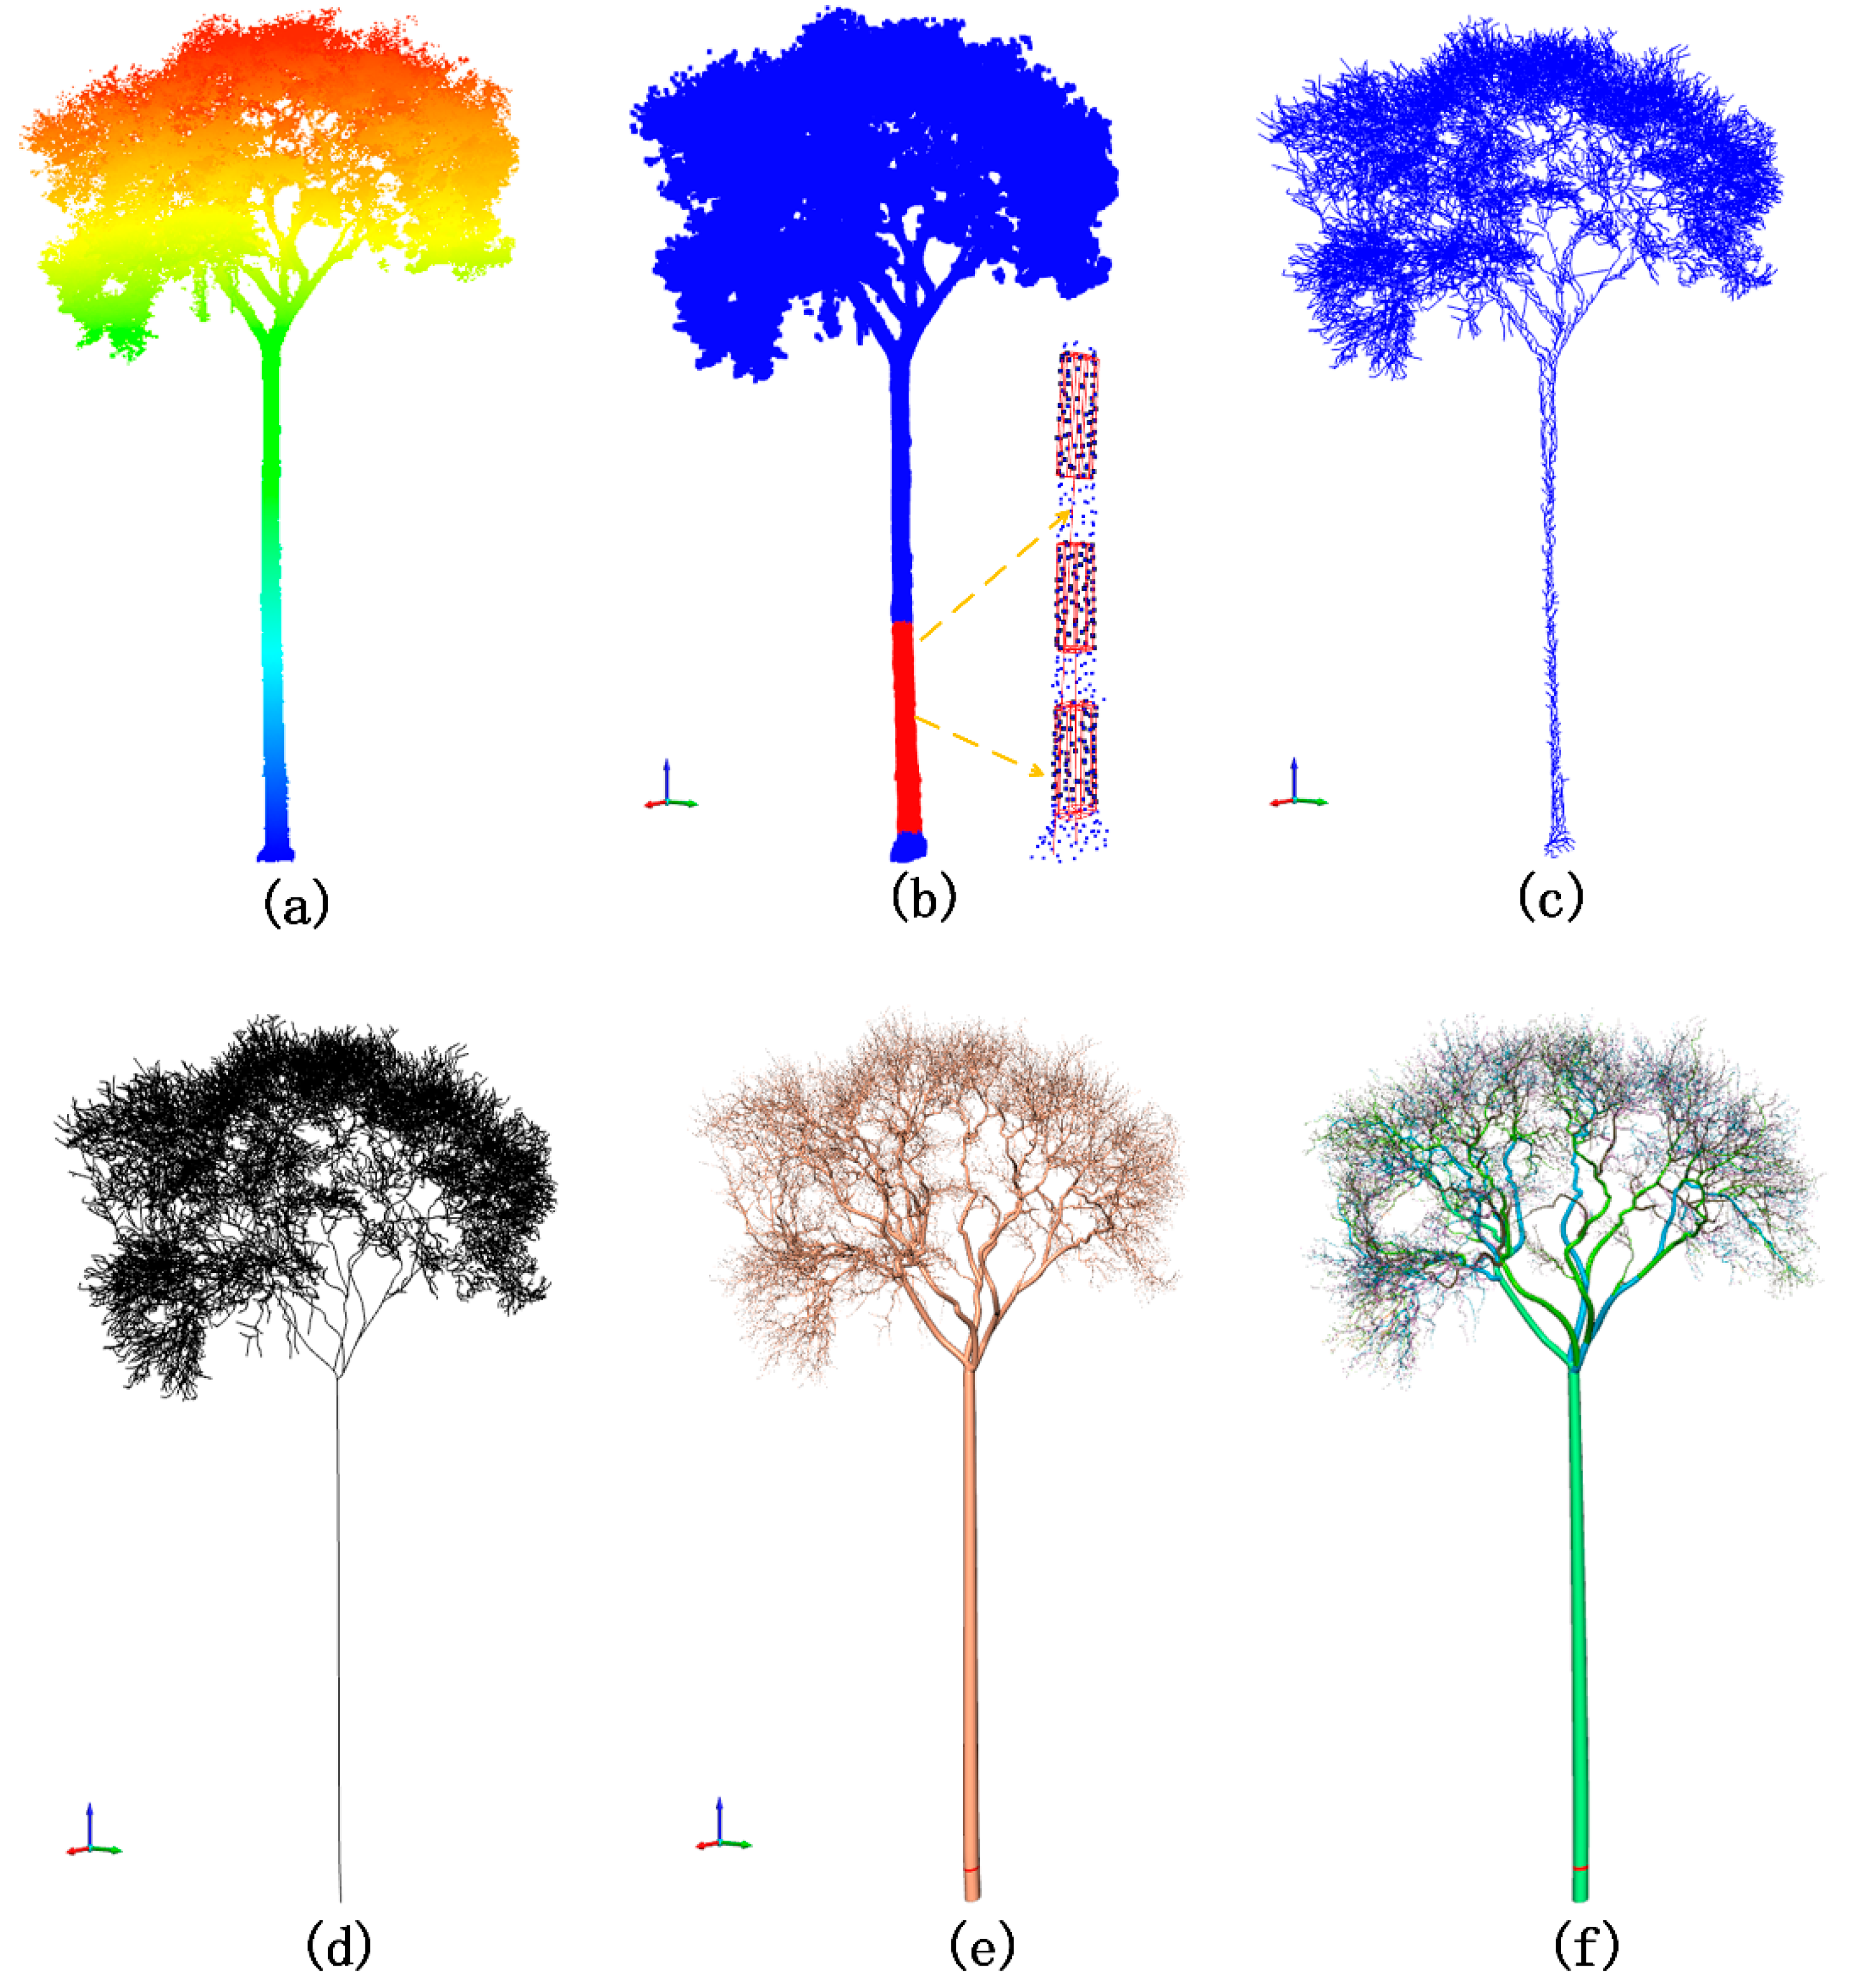
In this study, C++ was used in Visual Studio 2015 to implement the quantitative structure model based on AdTree, which further improved the accuracy for estimating tree parameters based on the reconstruction model. In the original AdTree method, the points near the bottom of the tree were used as a reference to automatically fit the cylinder to obtain the initial radius of the tree bottom. However, compared with the trunk point clouds, the buttress point clouds are abrupt and non-linear. There may also be a lot of noise points in the point clouds at the bottom of the stem, which will eventually cause the radius of the entire tree cylinder model to be inaccurate. These factors will reduce the accuracy of the model to estimate tree attributes. These issues were not considered in the original modeling method. Deviations in the radius of the tree bottom will lose the accuracy of attributes such as tree volume or DBH. To make the modeling method more accurate and detailed, this paper modified the original fully automated modeling method to a semi-automated modeling method. As shown in Figure 1, after manually selecting a relatively stable trunk points to fit a cylinder, the algorithm will automatically take the non-overlapping parts from the top, middle, and bottom of the selected point clouds. After calculating the cylinder radius of the intersection point between the three parts of the point clouds and the tree bottom, the average of the three radii was finally taken as the initial cylindrical radius. Determine the intersection point of the three-section cylinder with the ground after the central axis extends downward, and take the average of the three intersection points as the position of the tree bottom. The point with the largest Z value of each part of the point clouds was taken as the center of the top surface, and the point with the smallest Z value was taken as the center of the bottom surface. Half of the length or width of the minimum bounding box of this part of the point clouds (take the maximum value) was the radius, which was used as the initial rough cylinder in the tree cylinder fitting process. After determining the initial cylinder (the center of the top surface, the center of the bottom surface, radius), the nonlinear least square method was used to optimize the cylinder, and the optimized cylinder was the fitting cylinder of the final tree reconstruction model.
We named the improved QSM method AdQSM, which is a new, accurate, and detailed 3D reconstruction model of trees based on TLS point clouds. It can measure tree components such as trunks or branches. Parameters such as the tree height, DBH, tree volume, volume/length of branches and trunks, total number of branches, the height of the living crown, and crown size can be estimated from the tree model reconstructed by AdQSM.
2.3. Tree AGB Estimation Based on Volume Model and Wood Density
We only obtained the dry mass of 10 trees from Indonesia that were dried in the oven, and 19 trees from Peru and Guyana lacked the dry mass values. Therefore, this paper uses the dry mass of 10 trees from Indonesia to verify the accuracy of AGB estimation based on the AdQSM reconstruction of tree volume. We multiply the estimated volume of 10 individual trees by the average basic wood density (ρ) to calculate the individual AGB. The average basic wood density (g/cm3) of a tree comes from the different tree components of the destructive measurement [46,47]. The tree components can be stems, branches, fruits, leaves, and buttresses. All 10 trees have a corresponding average basic wood density (See Table 3). The AdQSM method does not consider the biomass of leaves or fruits when evaluating AGB, but it does not affect the accuracy of the test results. Table 3 counted the biomass of leaves or fruits of 10 individual trees sampled destructively. The contribution of leaves and fruits to the total biomass was only 1.1%.
2.4. Measurement Comparison
2.4.1. Accuracy Index
We used the destructively sampled tree measurement data as the reference value, and calculated the Bias, rBias, root mean square error (RMSE) and RMSE% of the AdQSM estimated value (the DBH, tree height, branch volume, tree volume, AGB), and the corresponding reference measurement value. The following equations are the definitions of various accuracy indicators. The concordance correlation coefficient estimated (CCC) by variance components based on the R language is used to evaluate the consistency between the AGB of AdQSM and the reference measurement value.
represents the estimated value of the i-th tree from AdQSM, represents the reference measurement value, represents the average of the reference measurement value, and represents the number of trees.
2.4.2. Compare the Accuracy of Tree Volume Reconstruction with TreeQSM
Tree volume reconstruction is one of the important functions of QSM. To more accurately evaluate the accuracy of the estimated volume of AdQSM, we not only compare the volume value estimated by AdQSM with the destructive reference measurement value, but also the tree volume estimated by TreeQSM. TreeQSM is a QSM method developed by Raumonen et al. to reconstruct the wooden structure of trees and further developed by Calders, Newnham, and Raumonen et al. [26,27,37]. This method first segmented the TLS point clouds, reconstructed the topological branch structure of the entire tree, and then reconstructed the segmented surface and volume by fitting a cylinder to each segment. The resulting cylindrical model was used to automatically calculate the volume of the entire wooden part of a single tree (trunk and branches). TreeQSM performed cylindrical fitting to the topological structure of the entire tree based on the point clouds of a single tree, calculated the volume of each cylindrical part, and then calculated the volume of the trunk and branches of each tree.
TreeQSM has two important input parameters, d and l [37]. These two parameters define the patch size and relative length for the second cover. Given that the cover generation is random, the final TreeQSM is always a little different, even if using the same input parameters. We randomly selected nine trees from three research sites for sensitivity analysis. We made 10 models for each of these 9 trees, a total of 90 models. We implement the TreeQSM method in MATLAB (windows10 64-bit operating system). Although there are relatively few samples retained for sensitivity analysis (9 out of 29 trees), the PatchDiam setting in Table 4 is relatively stable in the data performance of this paper regardless of the characteristics of the randomly selected trees.
3. Results
3.1. DBH and Tree Height
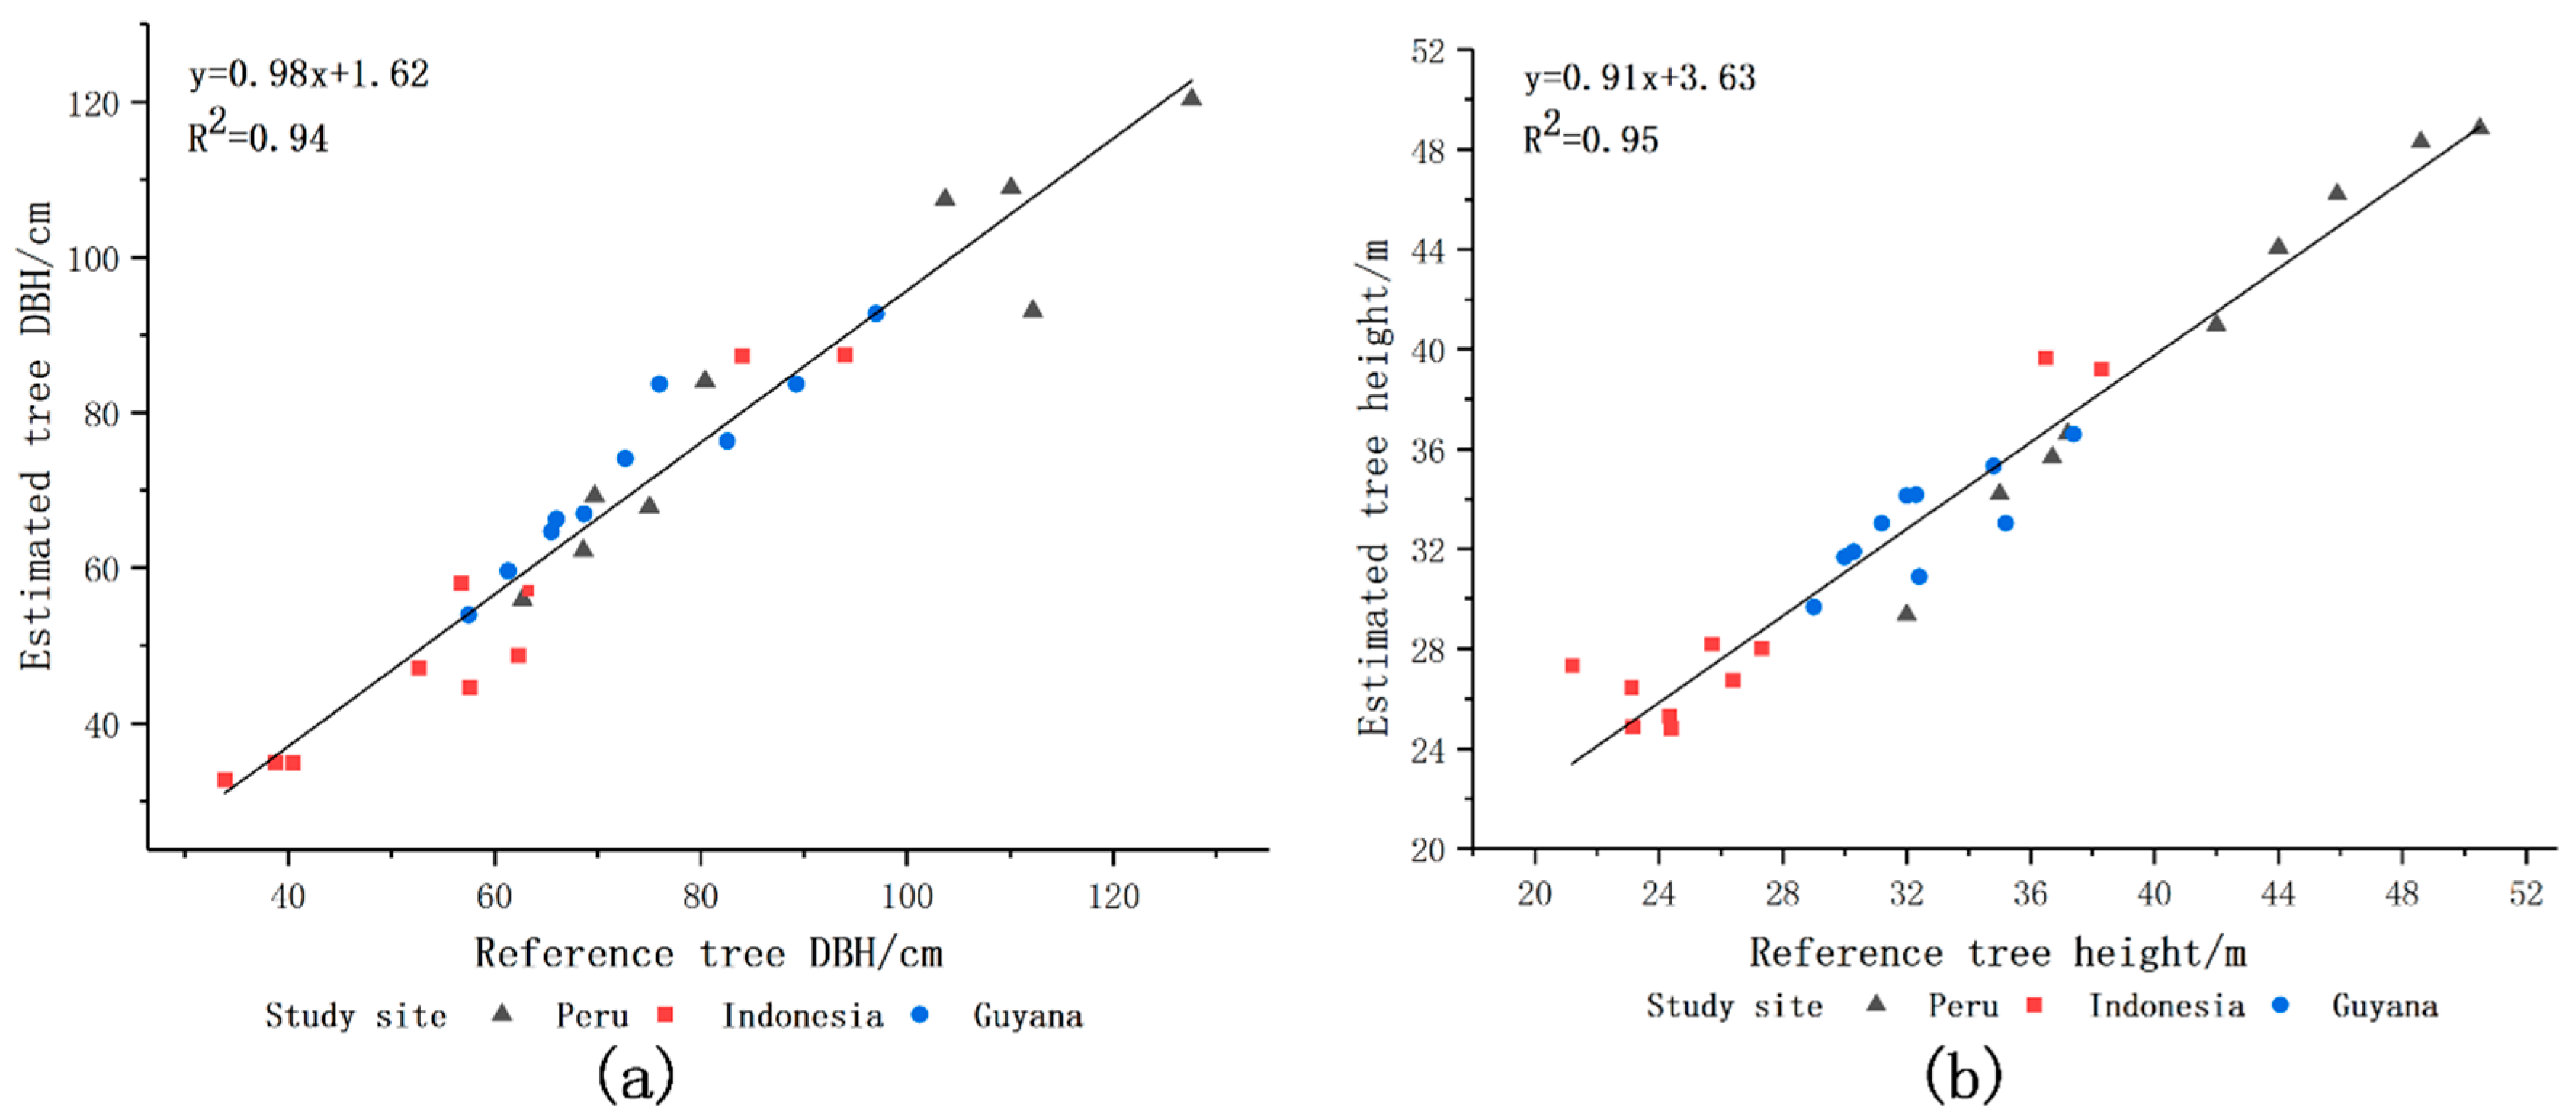
We used the DBH and tree height of 29 trees from destructive sampling as reference values for AdQSM. The reference value of DBH ranged from 33.9 cm to 127.6 cm. The reference value of tree height ranged from 21.2 m to 50.5 m. The estimated value of DBH ranged from 32.7 cm to 120.3 cm, and the estimated value of tree height ranged from 24.81 m to 48.83 m. Figure 2a showed that the R2 of the linear fit of the DBH estimate from AdQSM to the reference value was 0.94, and its slope was 0.98. AdQSM’s estimation of DBH did not change significantly with the increase of DBH. Figure 2b showed that the R2 of the linear fit between the estimated tree height of AdQSM and the reference value was 0.95, and its slope was 0.91. AdQSM’s estimation of tree height did not change significantly with the increase of tree height. AdQSM did not have large deviations in the estimation of the DBH and tree height of 29 trees from three different ecosystems.
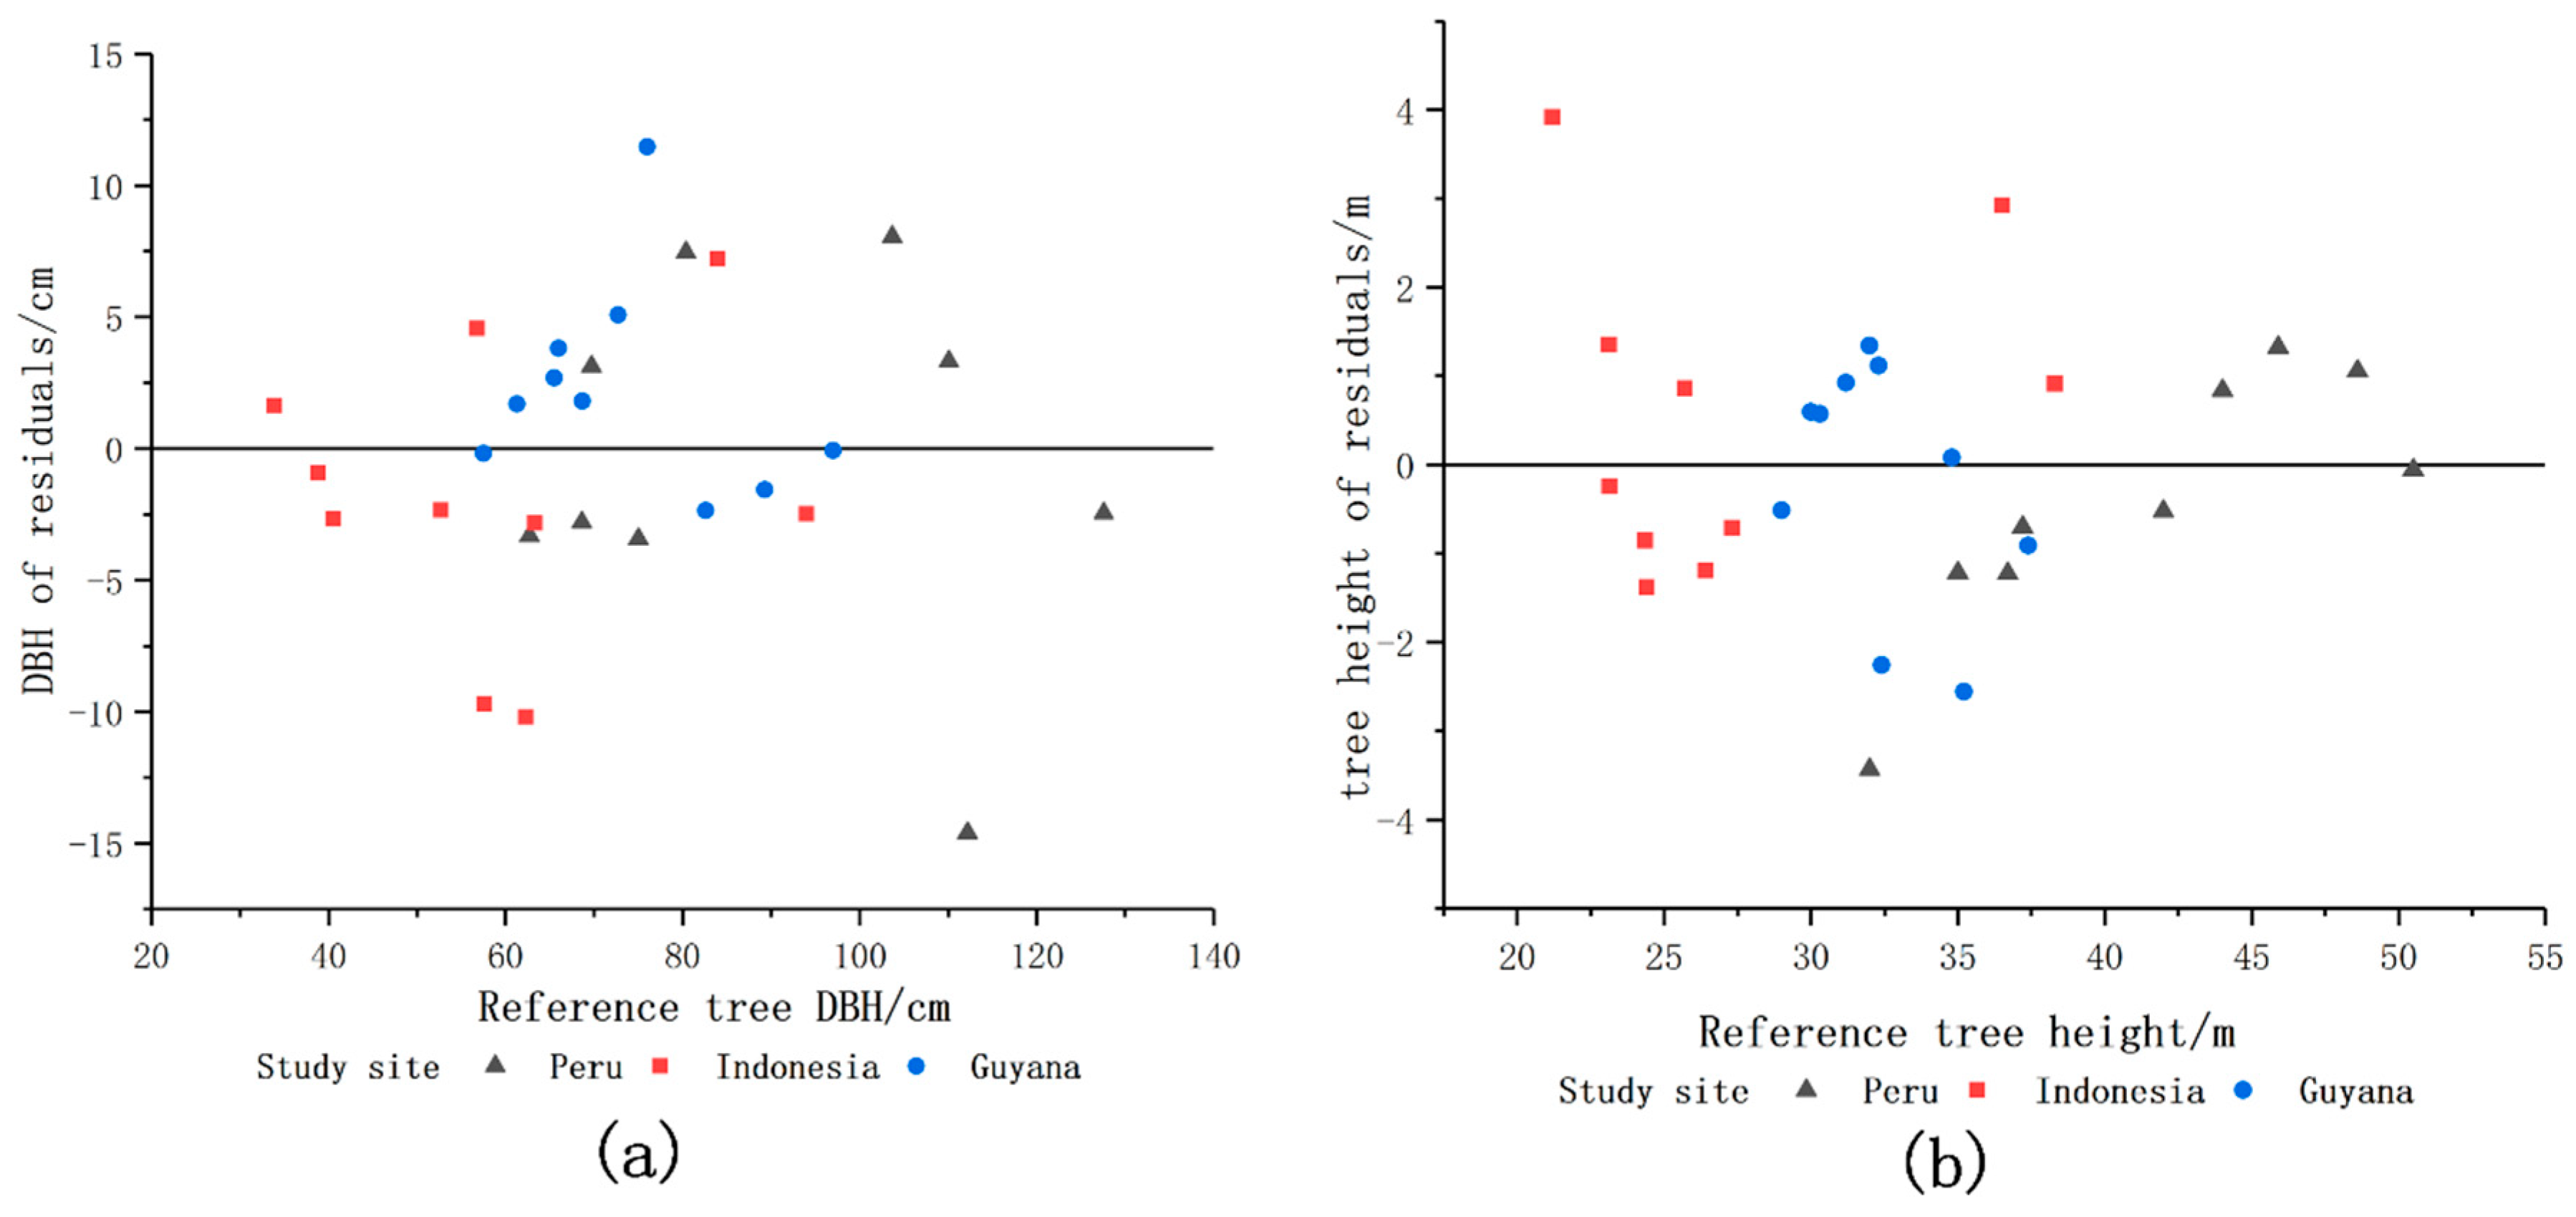
Figure 3a showed the residual distribution of DBH. Most DBH residuals were between −5.0 cm and 5.0 cm. There was no significant difference in the distribution range of residual value with the increase of DBH, and it was evenly distributed on both sides of the y = 0 line. Figure 3b showed that most of the residual values of tree height were between −2 m and 2 m. There was no significant difference in the distribution range of the residual value with the increase of tree height, and the residual error was evenly distributed on both sides of the y = 0 line. Although the three study sites contained different tree species, sizes, and shapes, AdQSM’s estimates of DBH and tree height performed similarly in the three different locations.
Table 5 shows the accuracy of DBH and tree height estimates based on AdQSM. The Bias and RMSE calculated by the least square method were −3.68 cm and 6.65 cm, respectively. The DBH deviation of 75.9% of the sample trees was less than 6.65 cm. The Bias and RMSE of the tree height were 0.63 m and 1.93 m, respectively. The tree height deviation of 75.9% of the sample trees was less than 1.93 m.
3.2. Volume
3.2.1. Tree Volume
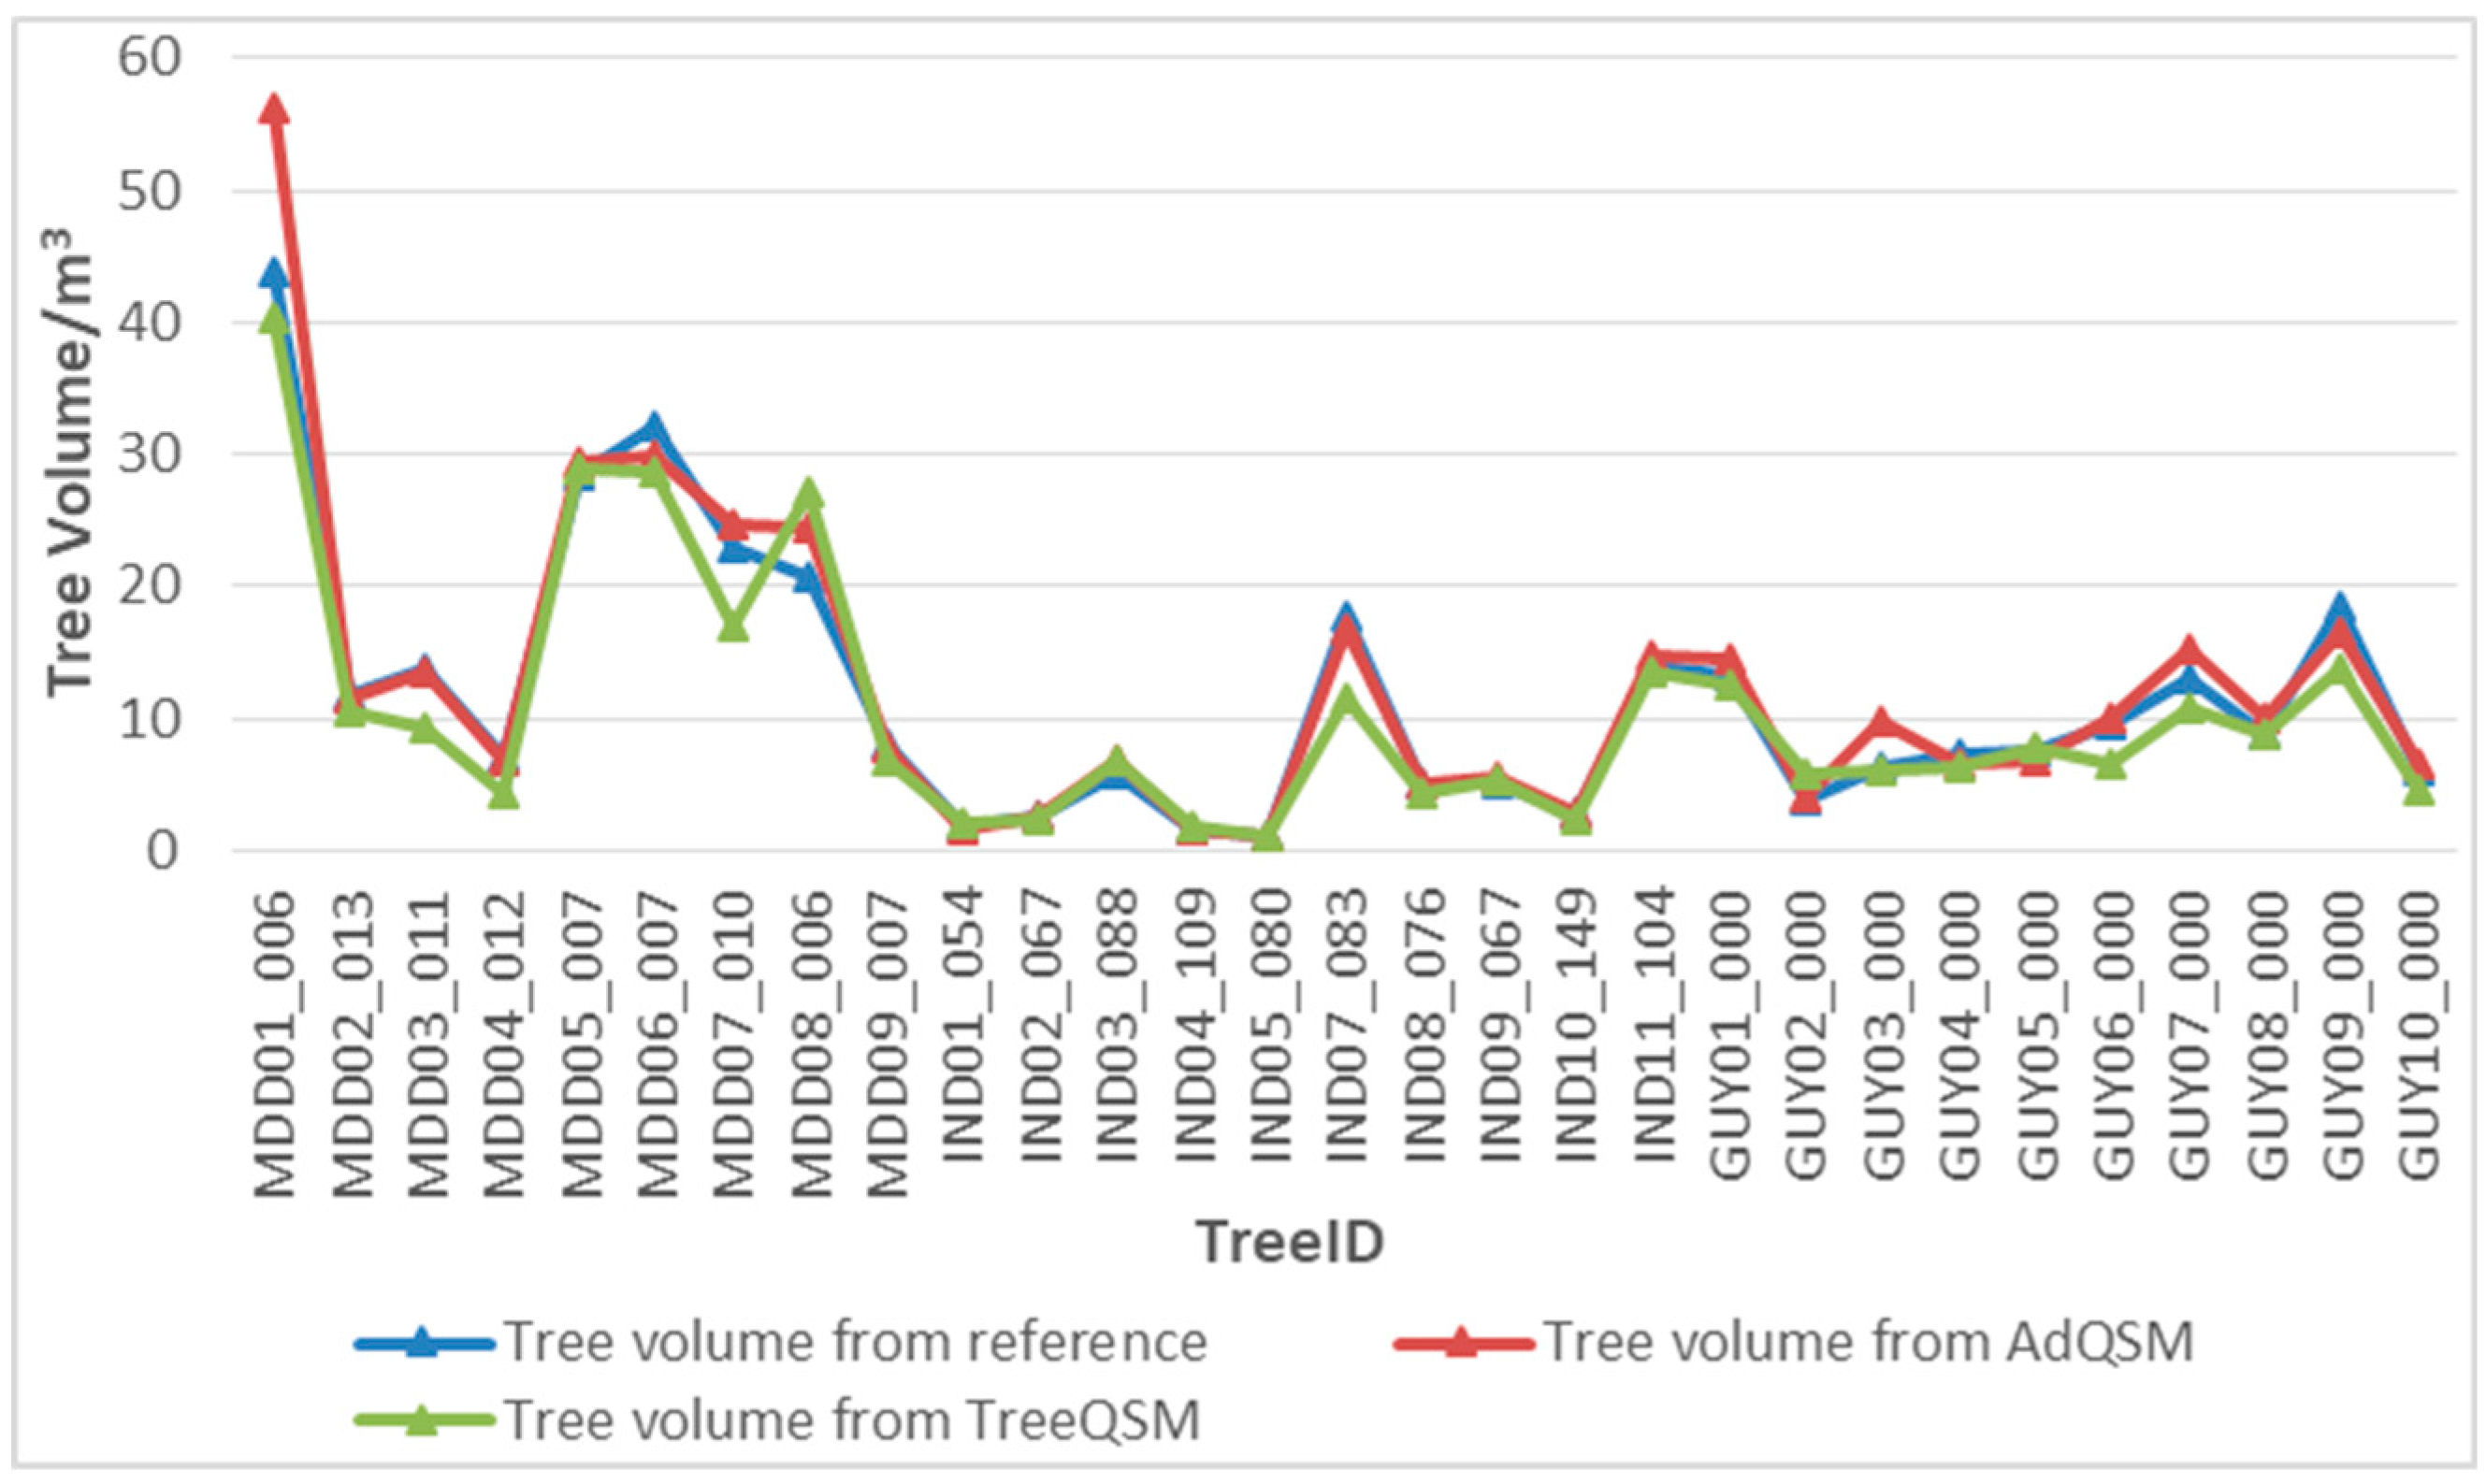
To test the accuracy of AdQSM’s estimation of tree volume, we compared the tree volume estimated by AdQSM and TreeQSM with the tree volume of destructive sampling respectively. We use the volume of 29 trees (the sum of the volume of trunks, branches, and buttresses) from Peru, Guyana, and Indonesia as reference values. The reference value of tree volume ranged from 1.041 m3 to 43.894 m3, and the volume value estimated by TreeQSM ranged from 1.029 m3 to 40.333 m3. The volume value estimated by AdQSM ranged from 1.147 m3 to 56.224 m3. Figure 4 provides the performance of TreeQSM and AdQSM in each tree.
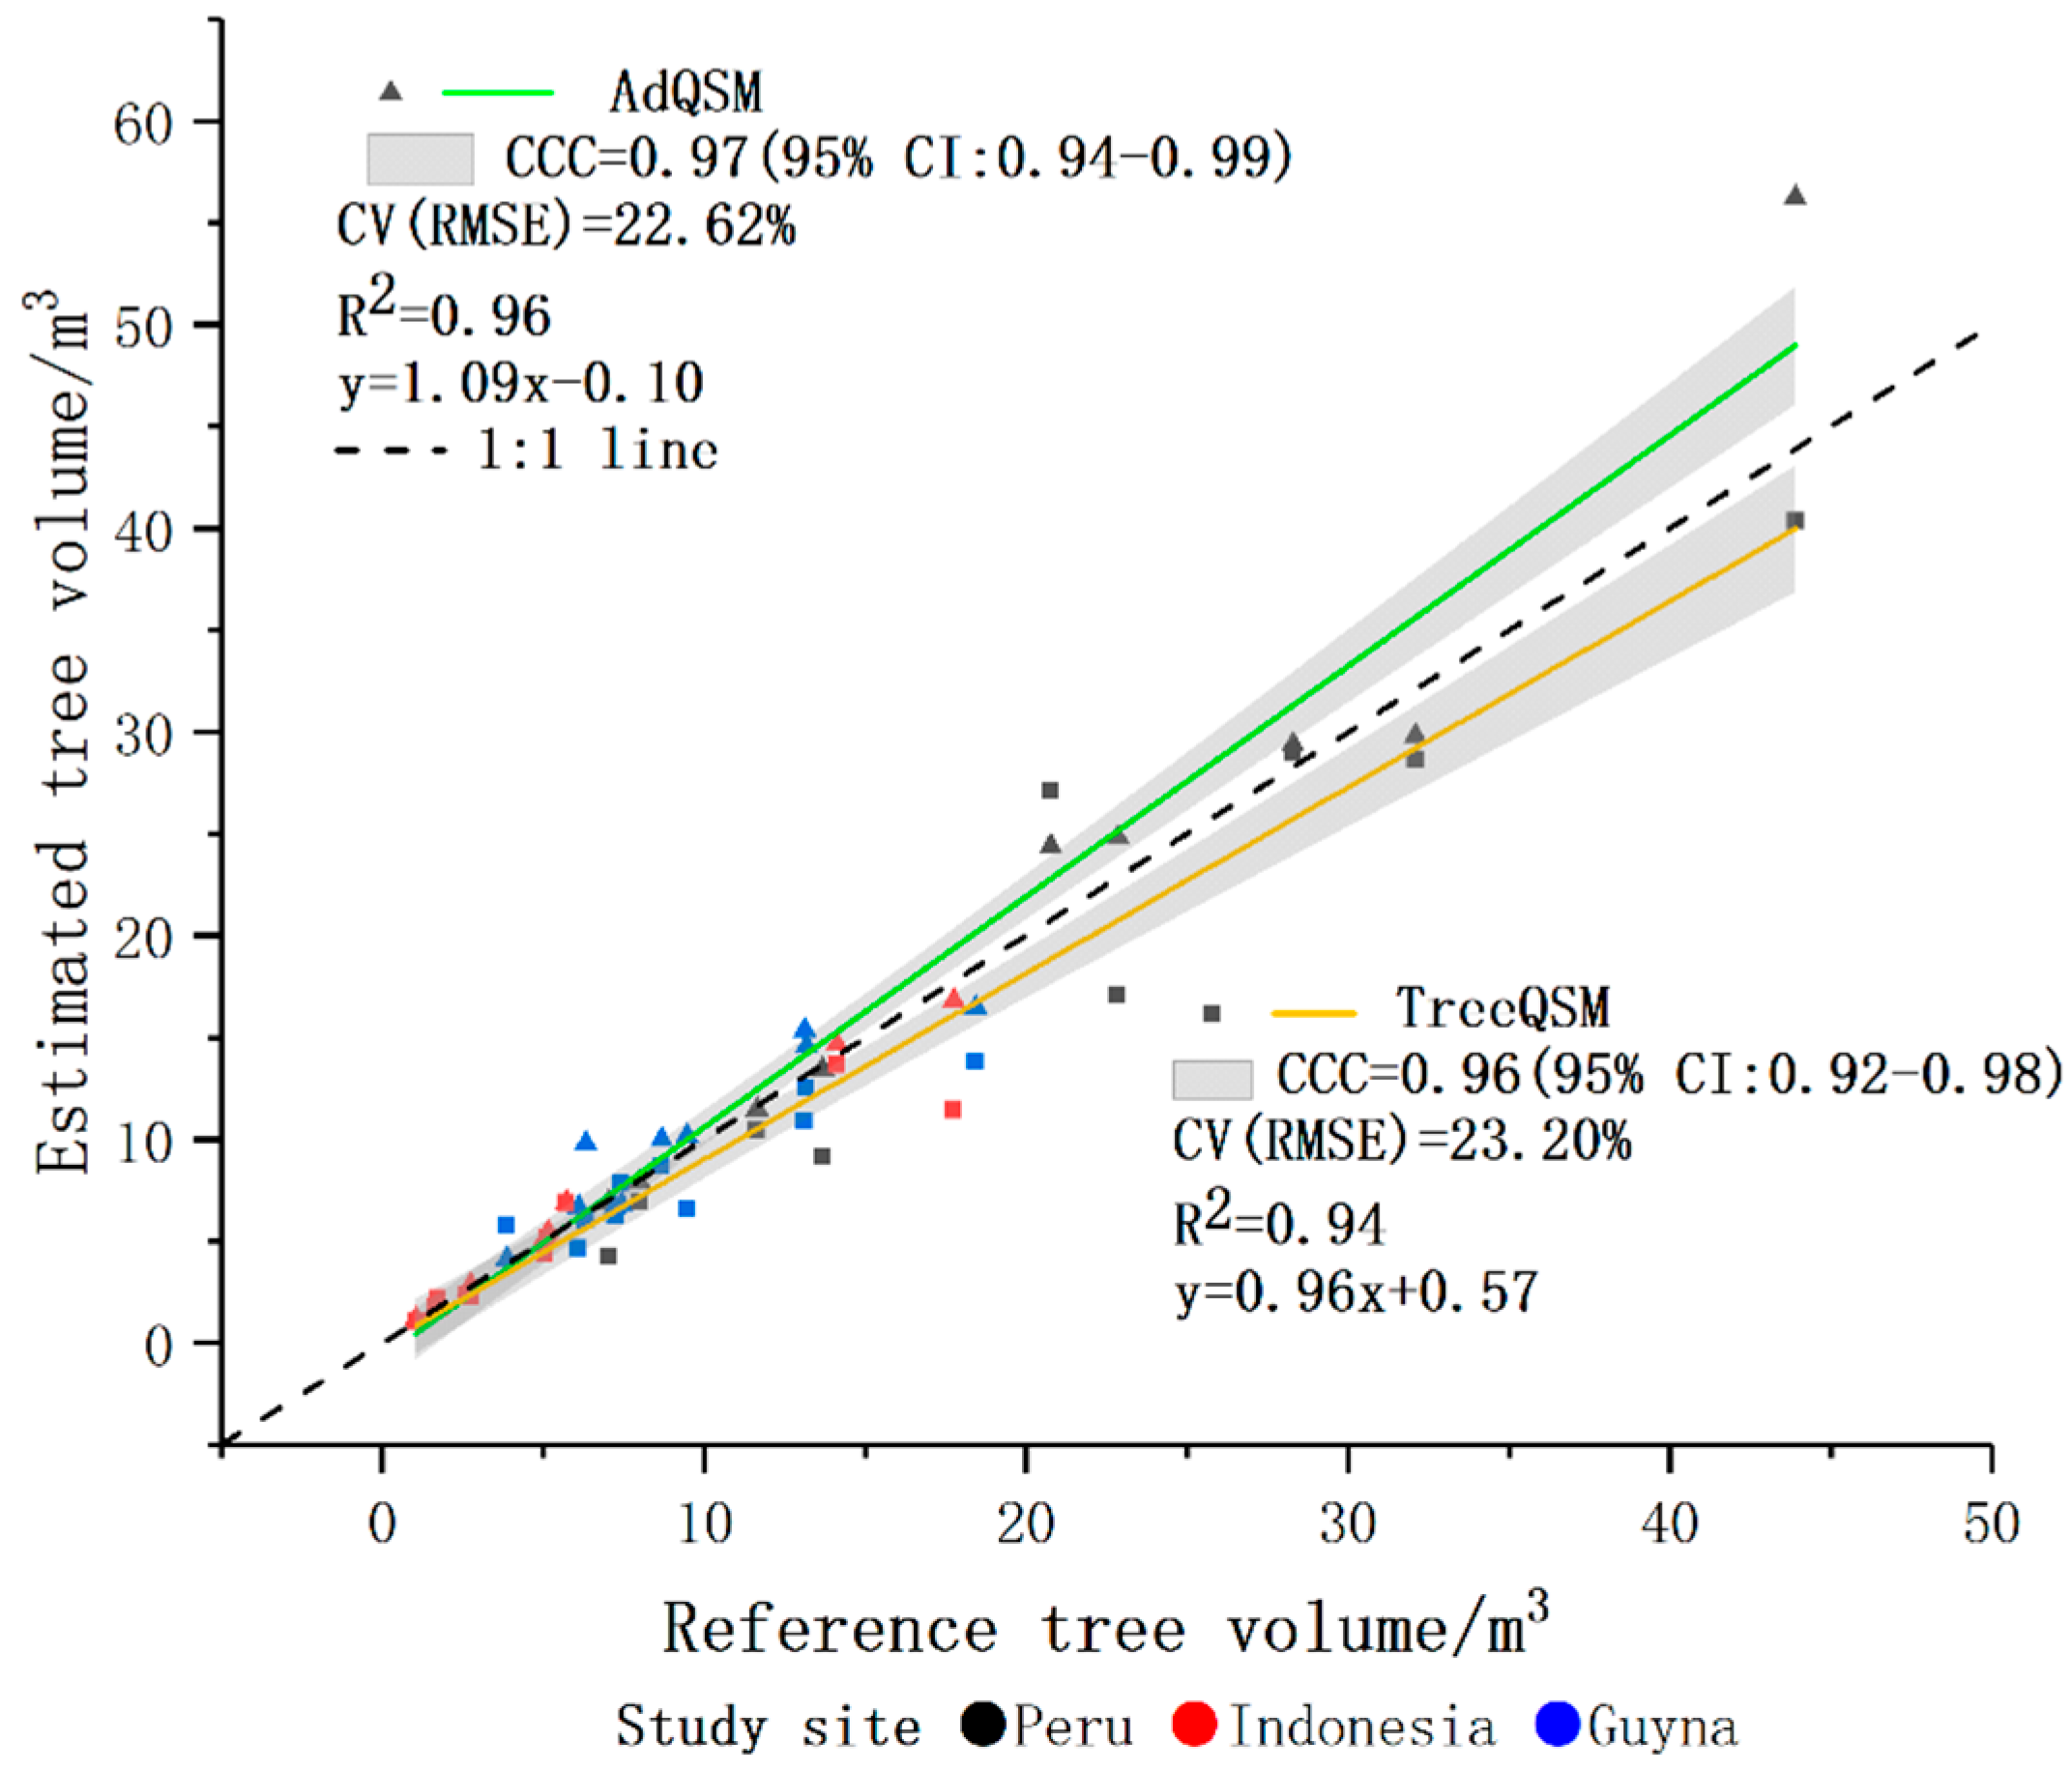
Figure 5 shows that the R2 of the linear fit between the estimated volume of AdQSM and the volume reference value was 0.96. The slope was 1.09, indicating that AdQSM slightly overestimated the volume of the largest tree. The RMSE was 2.651 m3, and the average volume was 11.717 m3, resulting in a CV (RMSE) of 22.62%. The R2 of the linear fit between the estimated volume of TreeQSM and the volume reference value was 0.94. The slope was 0.96, indicating that TreeQSM slightly underestimated the volume of the largest tree. The RMSE was 2.719 m3, and the CV (RMSE) was 23.20%. The CCCs between the volume estimates based on AdQSM and TreeQSM and the volume reference values were 0.97 and 0.96.
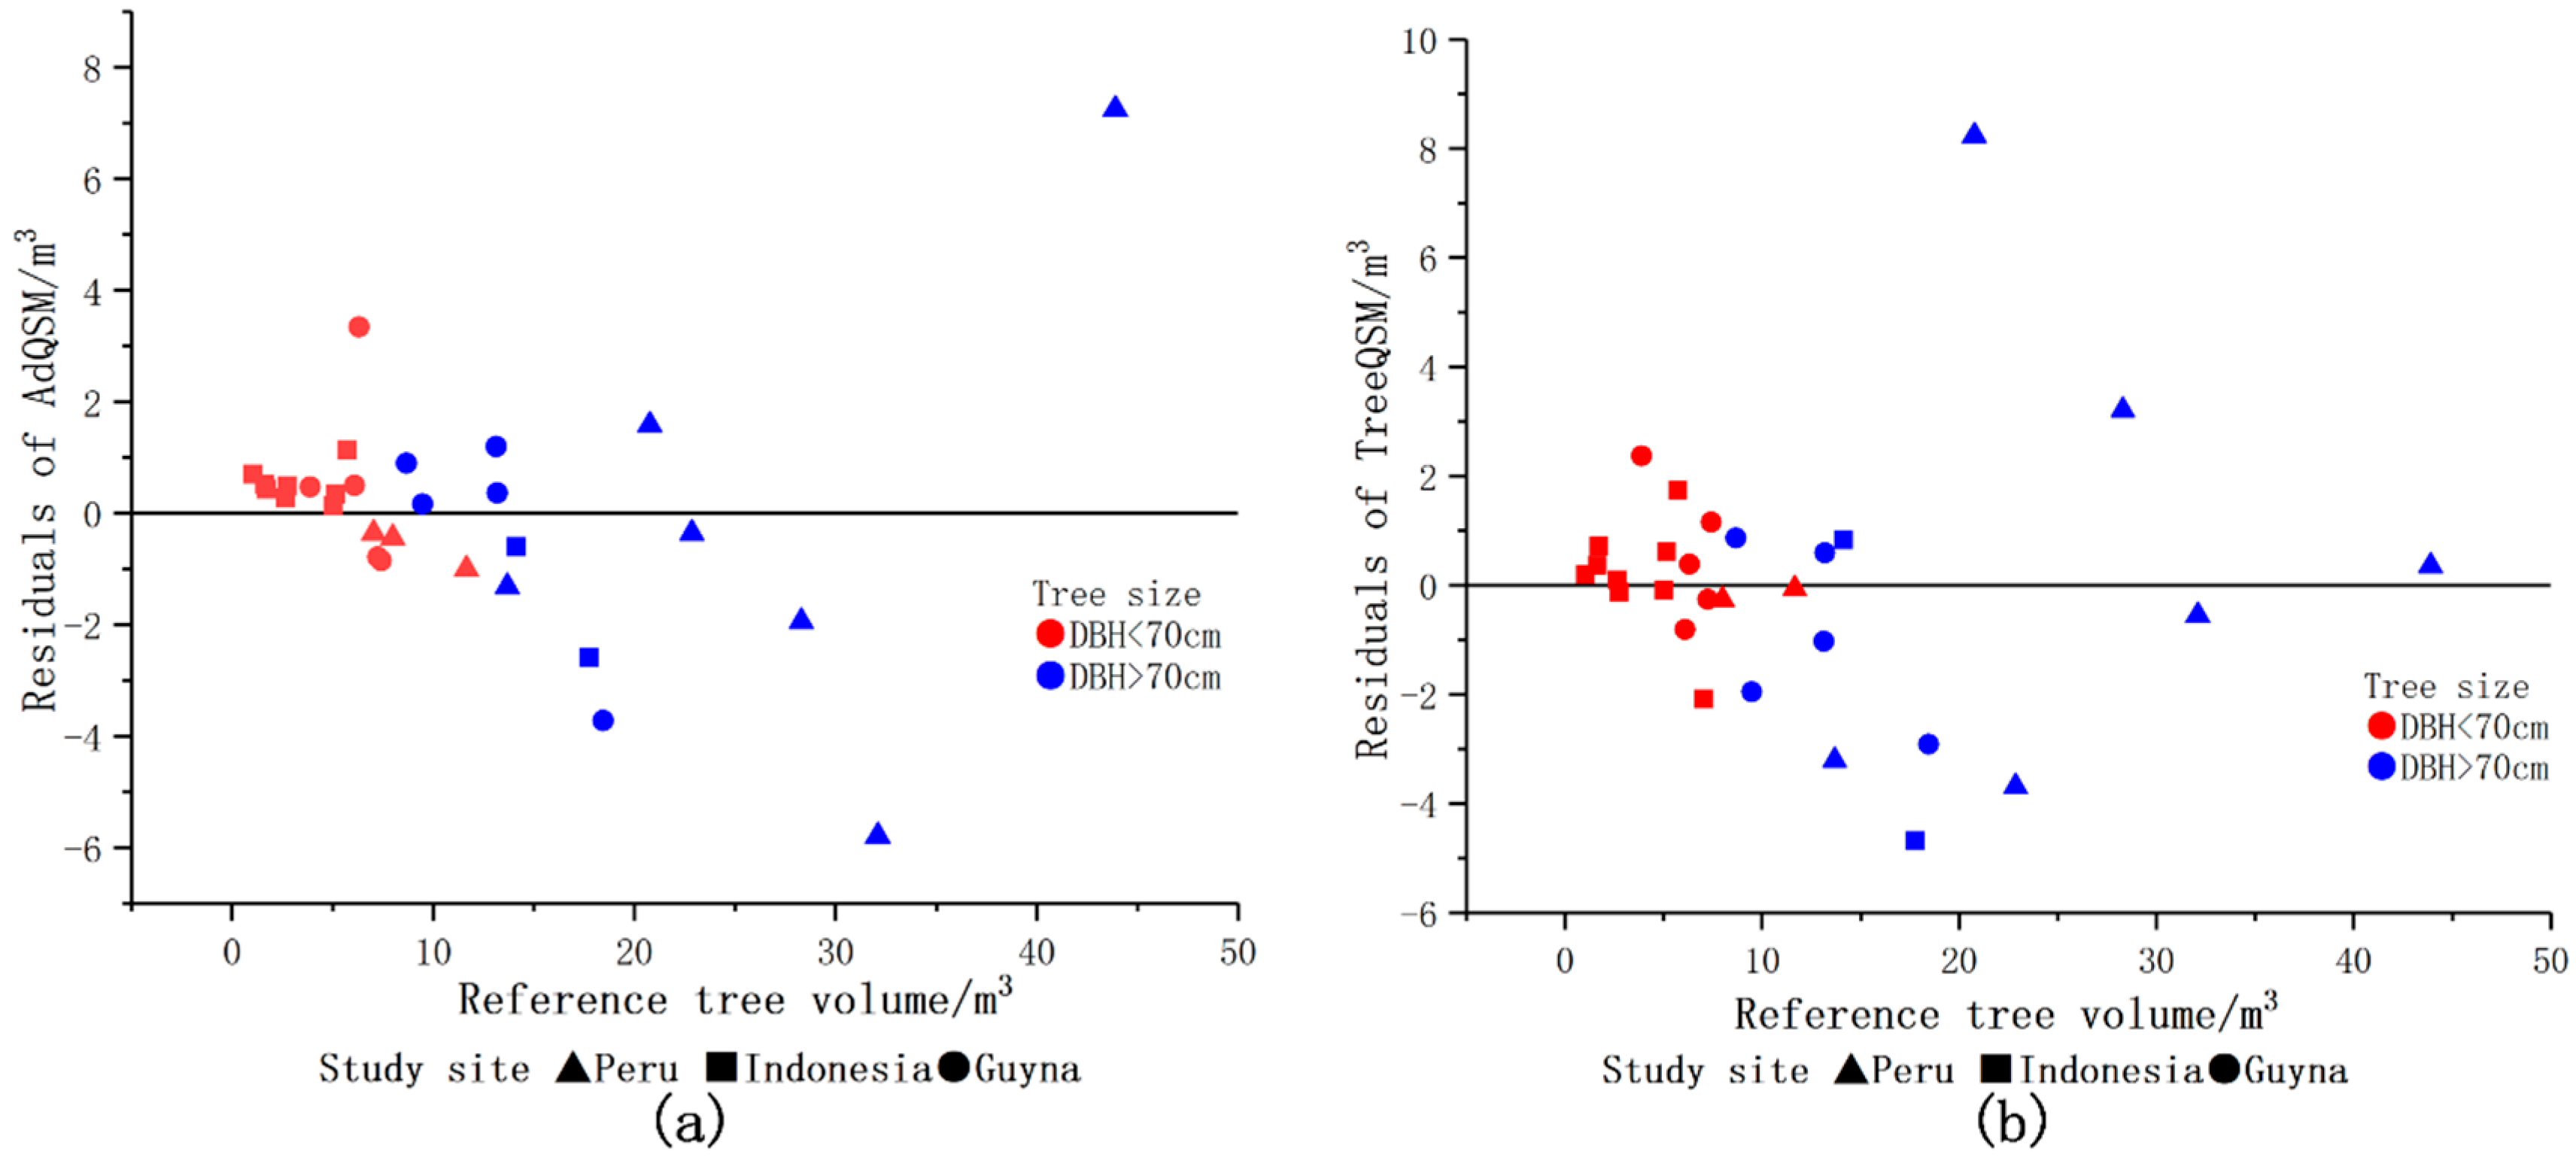
Figure 6 shows the volume residual distribution of AdQSM and TreeQSM. Most of the residuals of AdQSM and TreeQSM ranged from −2 m3 to 2 m3, and most of the volume residuals distributed evenly on both sides of the y = 0 line. Although the three study sites contained different tree species, sizes, and shapes. The performance of AdQSM and TreeQSM was similar in three different study sites. The results of ‘small tree’ (DBH ≤ 70 cm) and ‘large tree’ (DBH > 70 cm) were different. Compared with large trees, the tree reconstruction based on AdQSM and TreeQSM show less uncertainty and deviation from reference values for small trees, mainly Indonesian TLS data sets.
Table 6 provides the accuracy of AdQSM and TreeQSM in estimating tree volume. The Bias and rBias of AdQSM calculated by the least square method were 0.818 m3 and 6.98%, respectively. The tree volume deviation of 89.7% of all sample trees was less than 2.651 m3. The Bias and rBias of TreeQSM calculated by the least square method were −1.135 m3 and −9.69%, respectively. The tree volume deviation of 69.0% of all sample trees was less than 2.719 m3.
3.2.2. Branch Volume
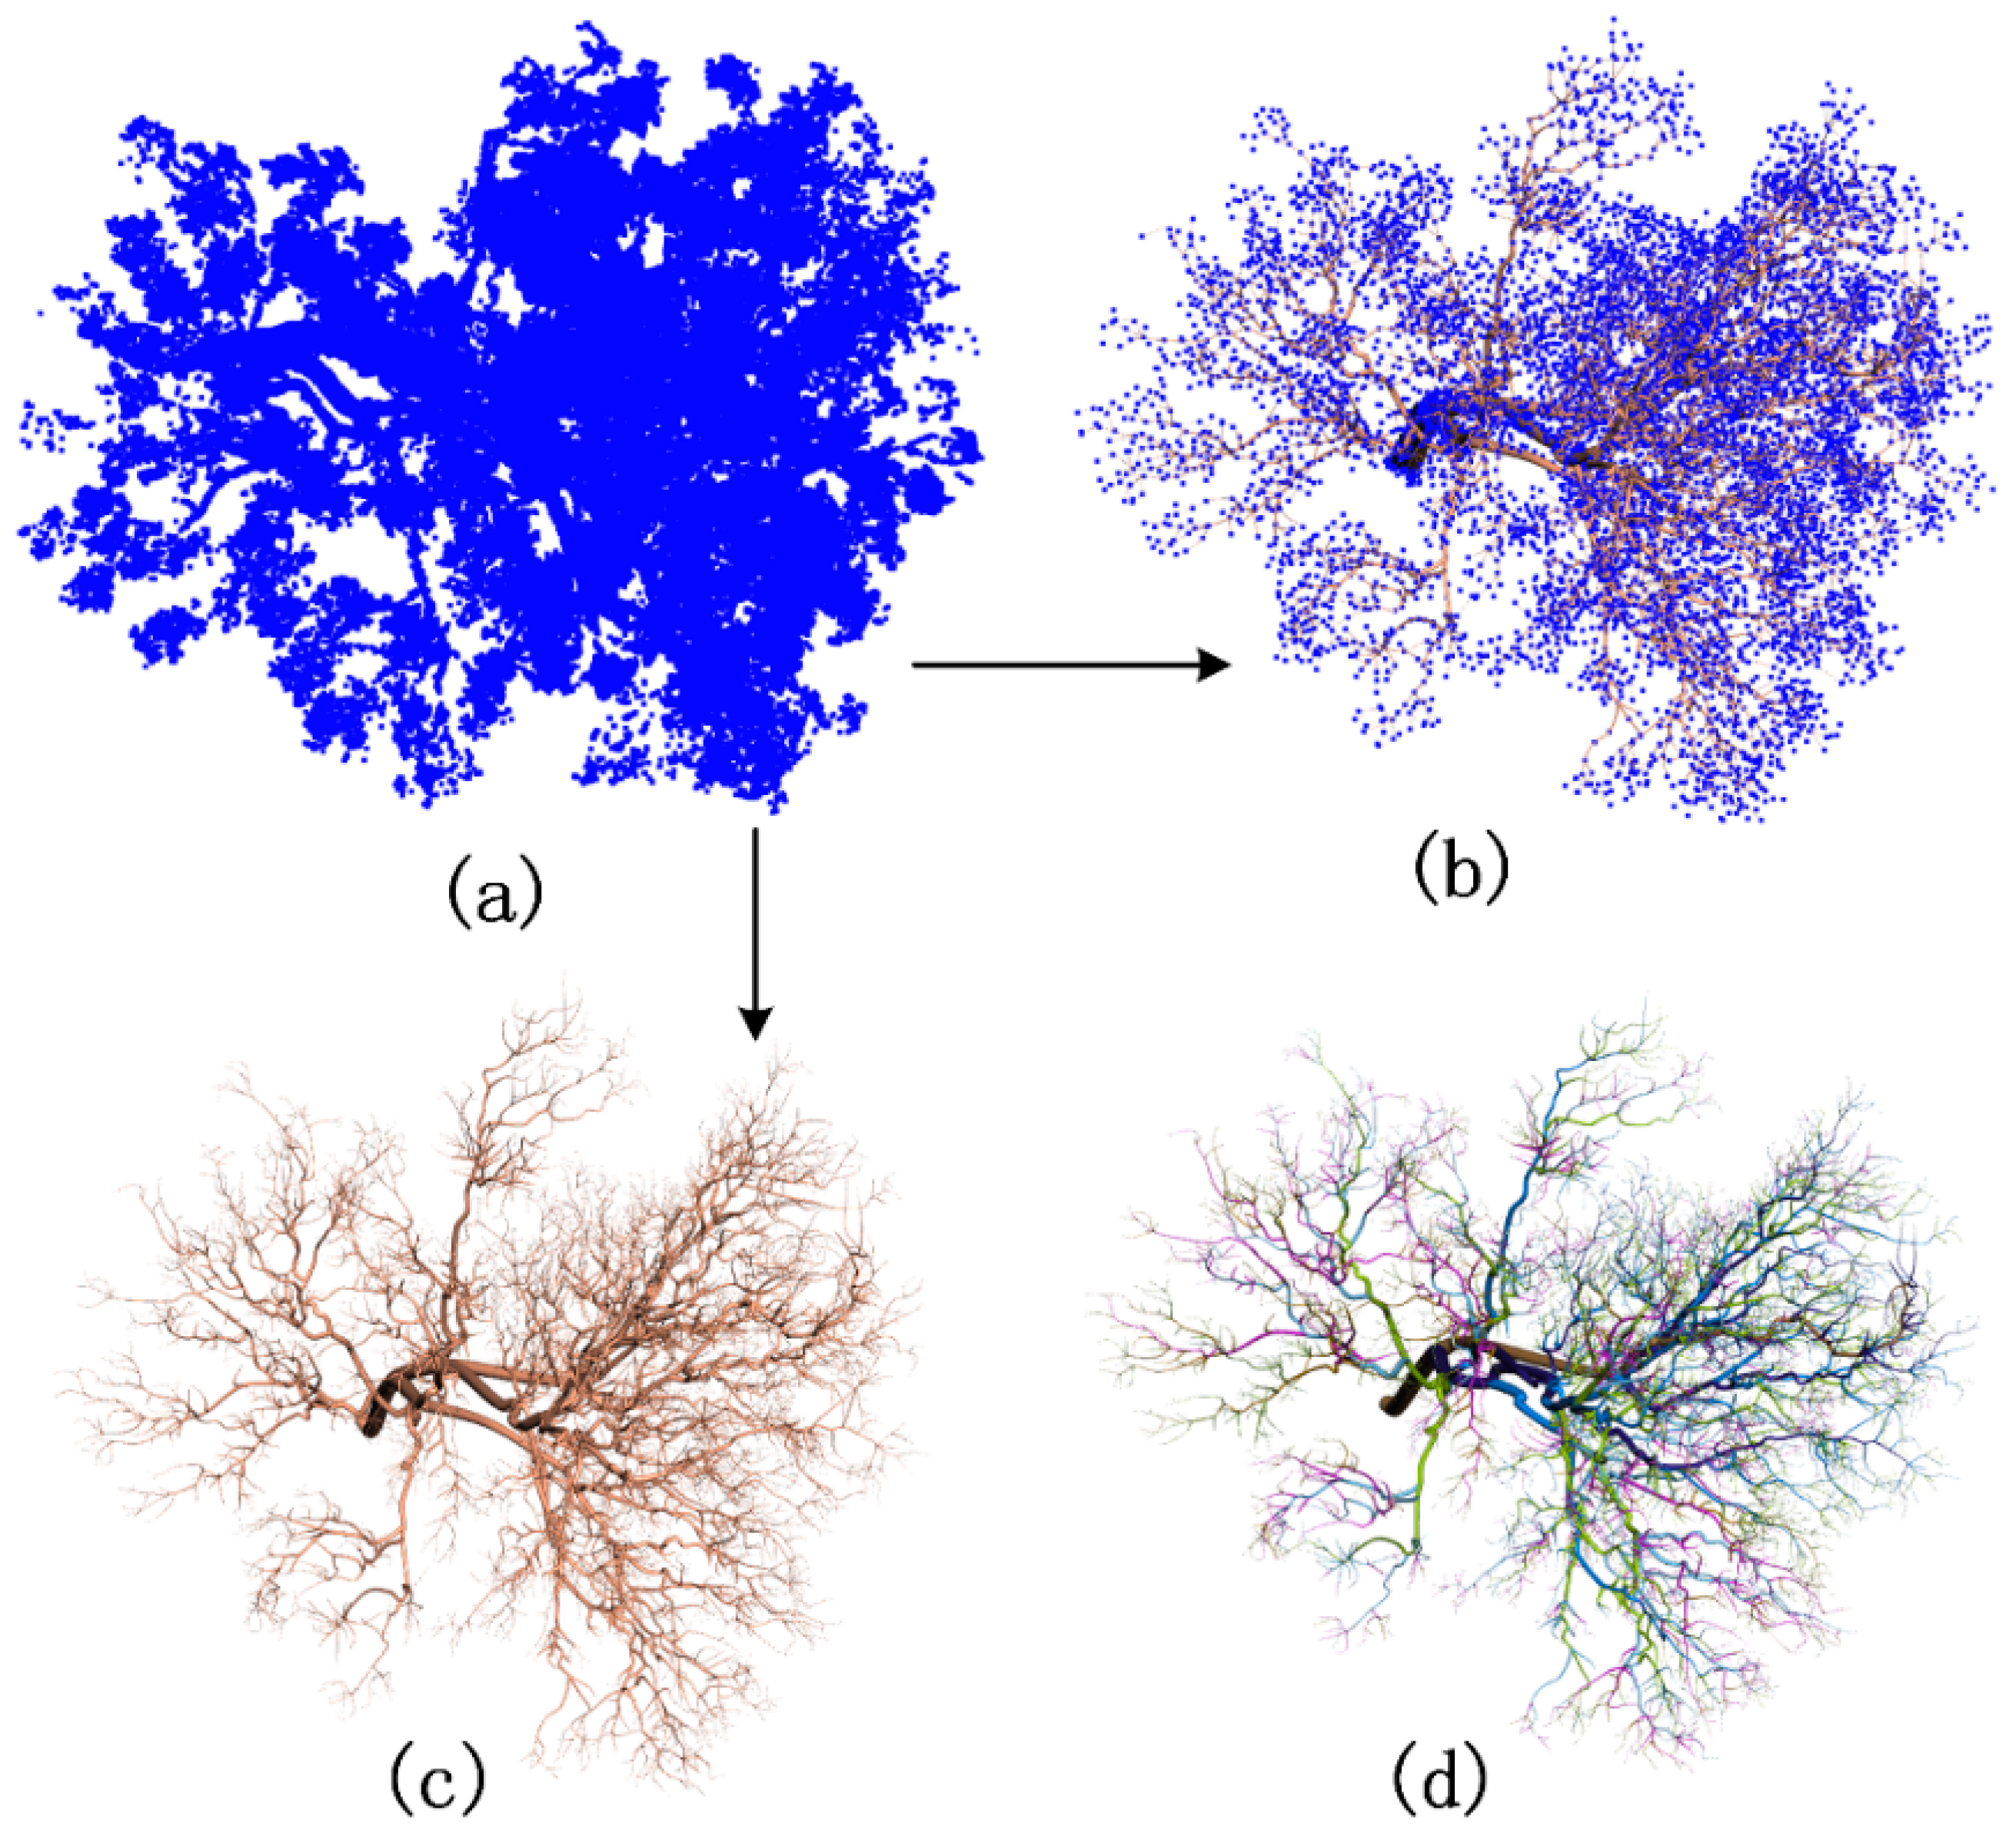
AdQSM can model branches in detail (See Figure 7). The detailed branch structure can improve the accuracy of AGB estimates. To evaluate the accuracy of AdQSM modeling branches, we used the branches volume as an evaluation indicator.
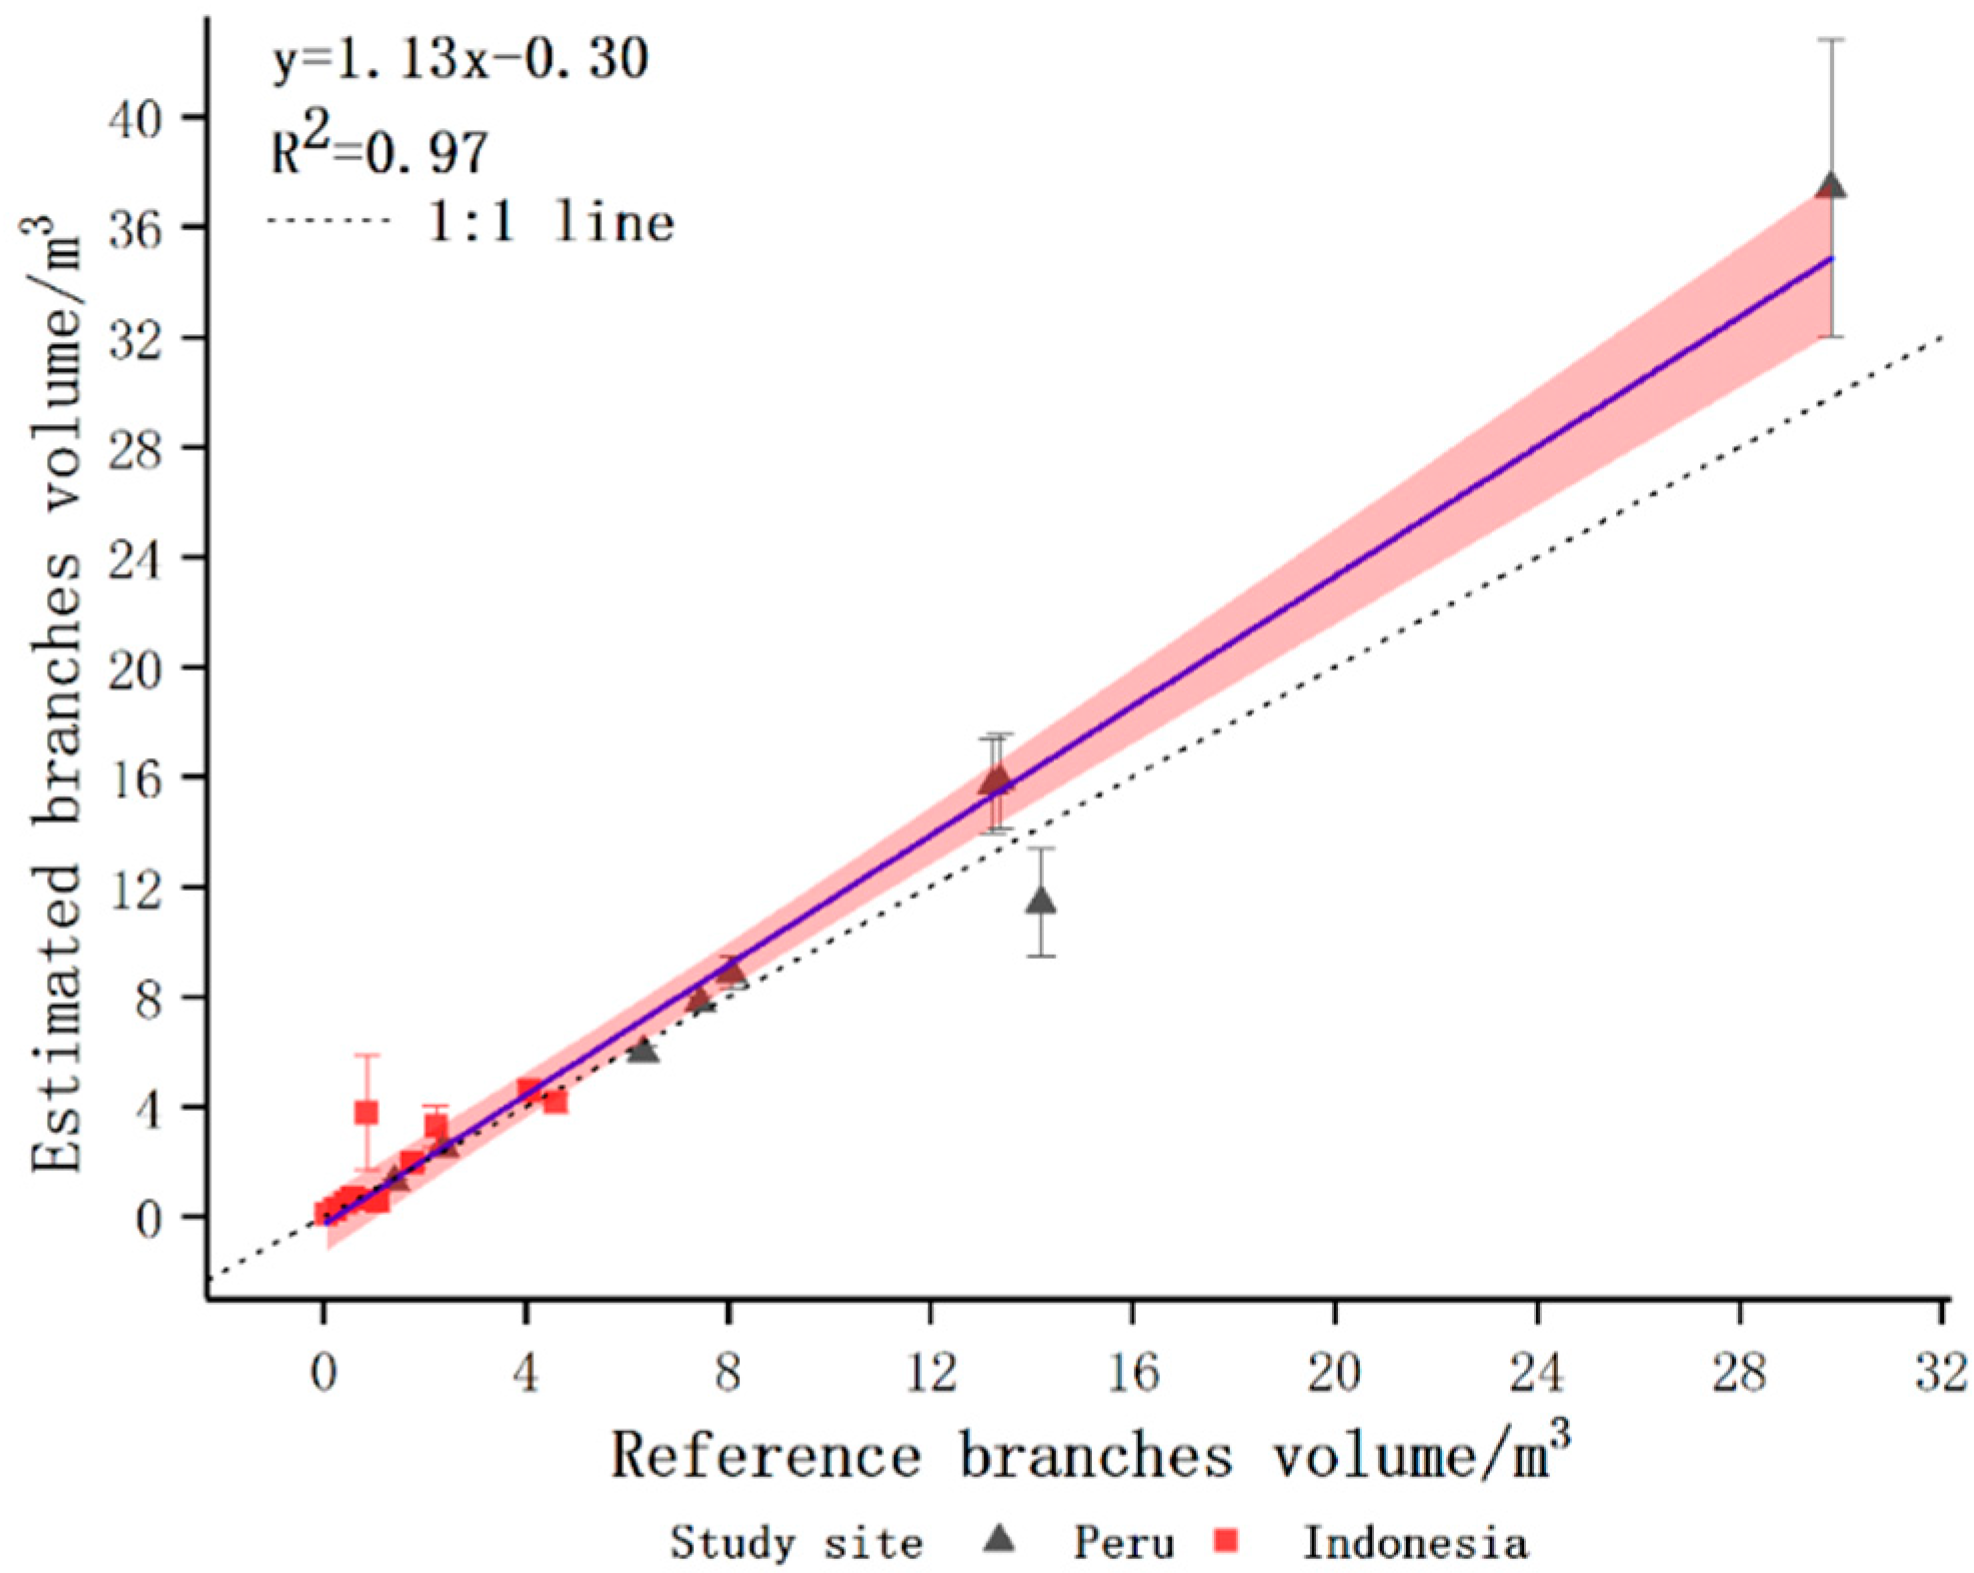
The geometrically measured branches volume of each tree was used as the reference value of AdQSM modeling branches. AdQSM estimated branches volume in a range from 0.105 m3 to 37.421 m3. Figure 8 shows that the R2 of the linear fit between the estimated branches volume and the reference branches volume was 0.97. The slope was 1.13, indicating that AdQSM slightly overestimated the volume of branches, which was consistent with the test results of 3.2.1 individual tree volume. The RMSE was 2.174 m3, and the average volume was 5.898 m3, resulting in a CV (RMSE) of 36.86%.
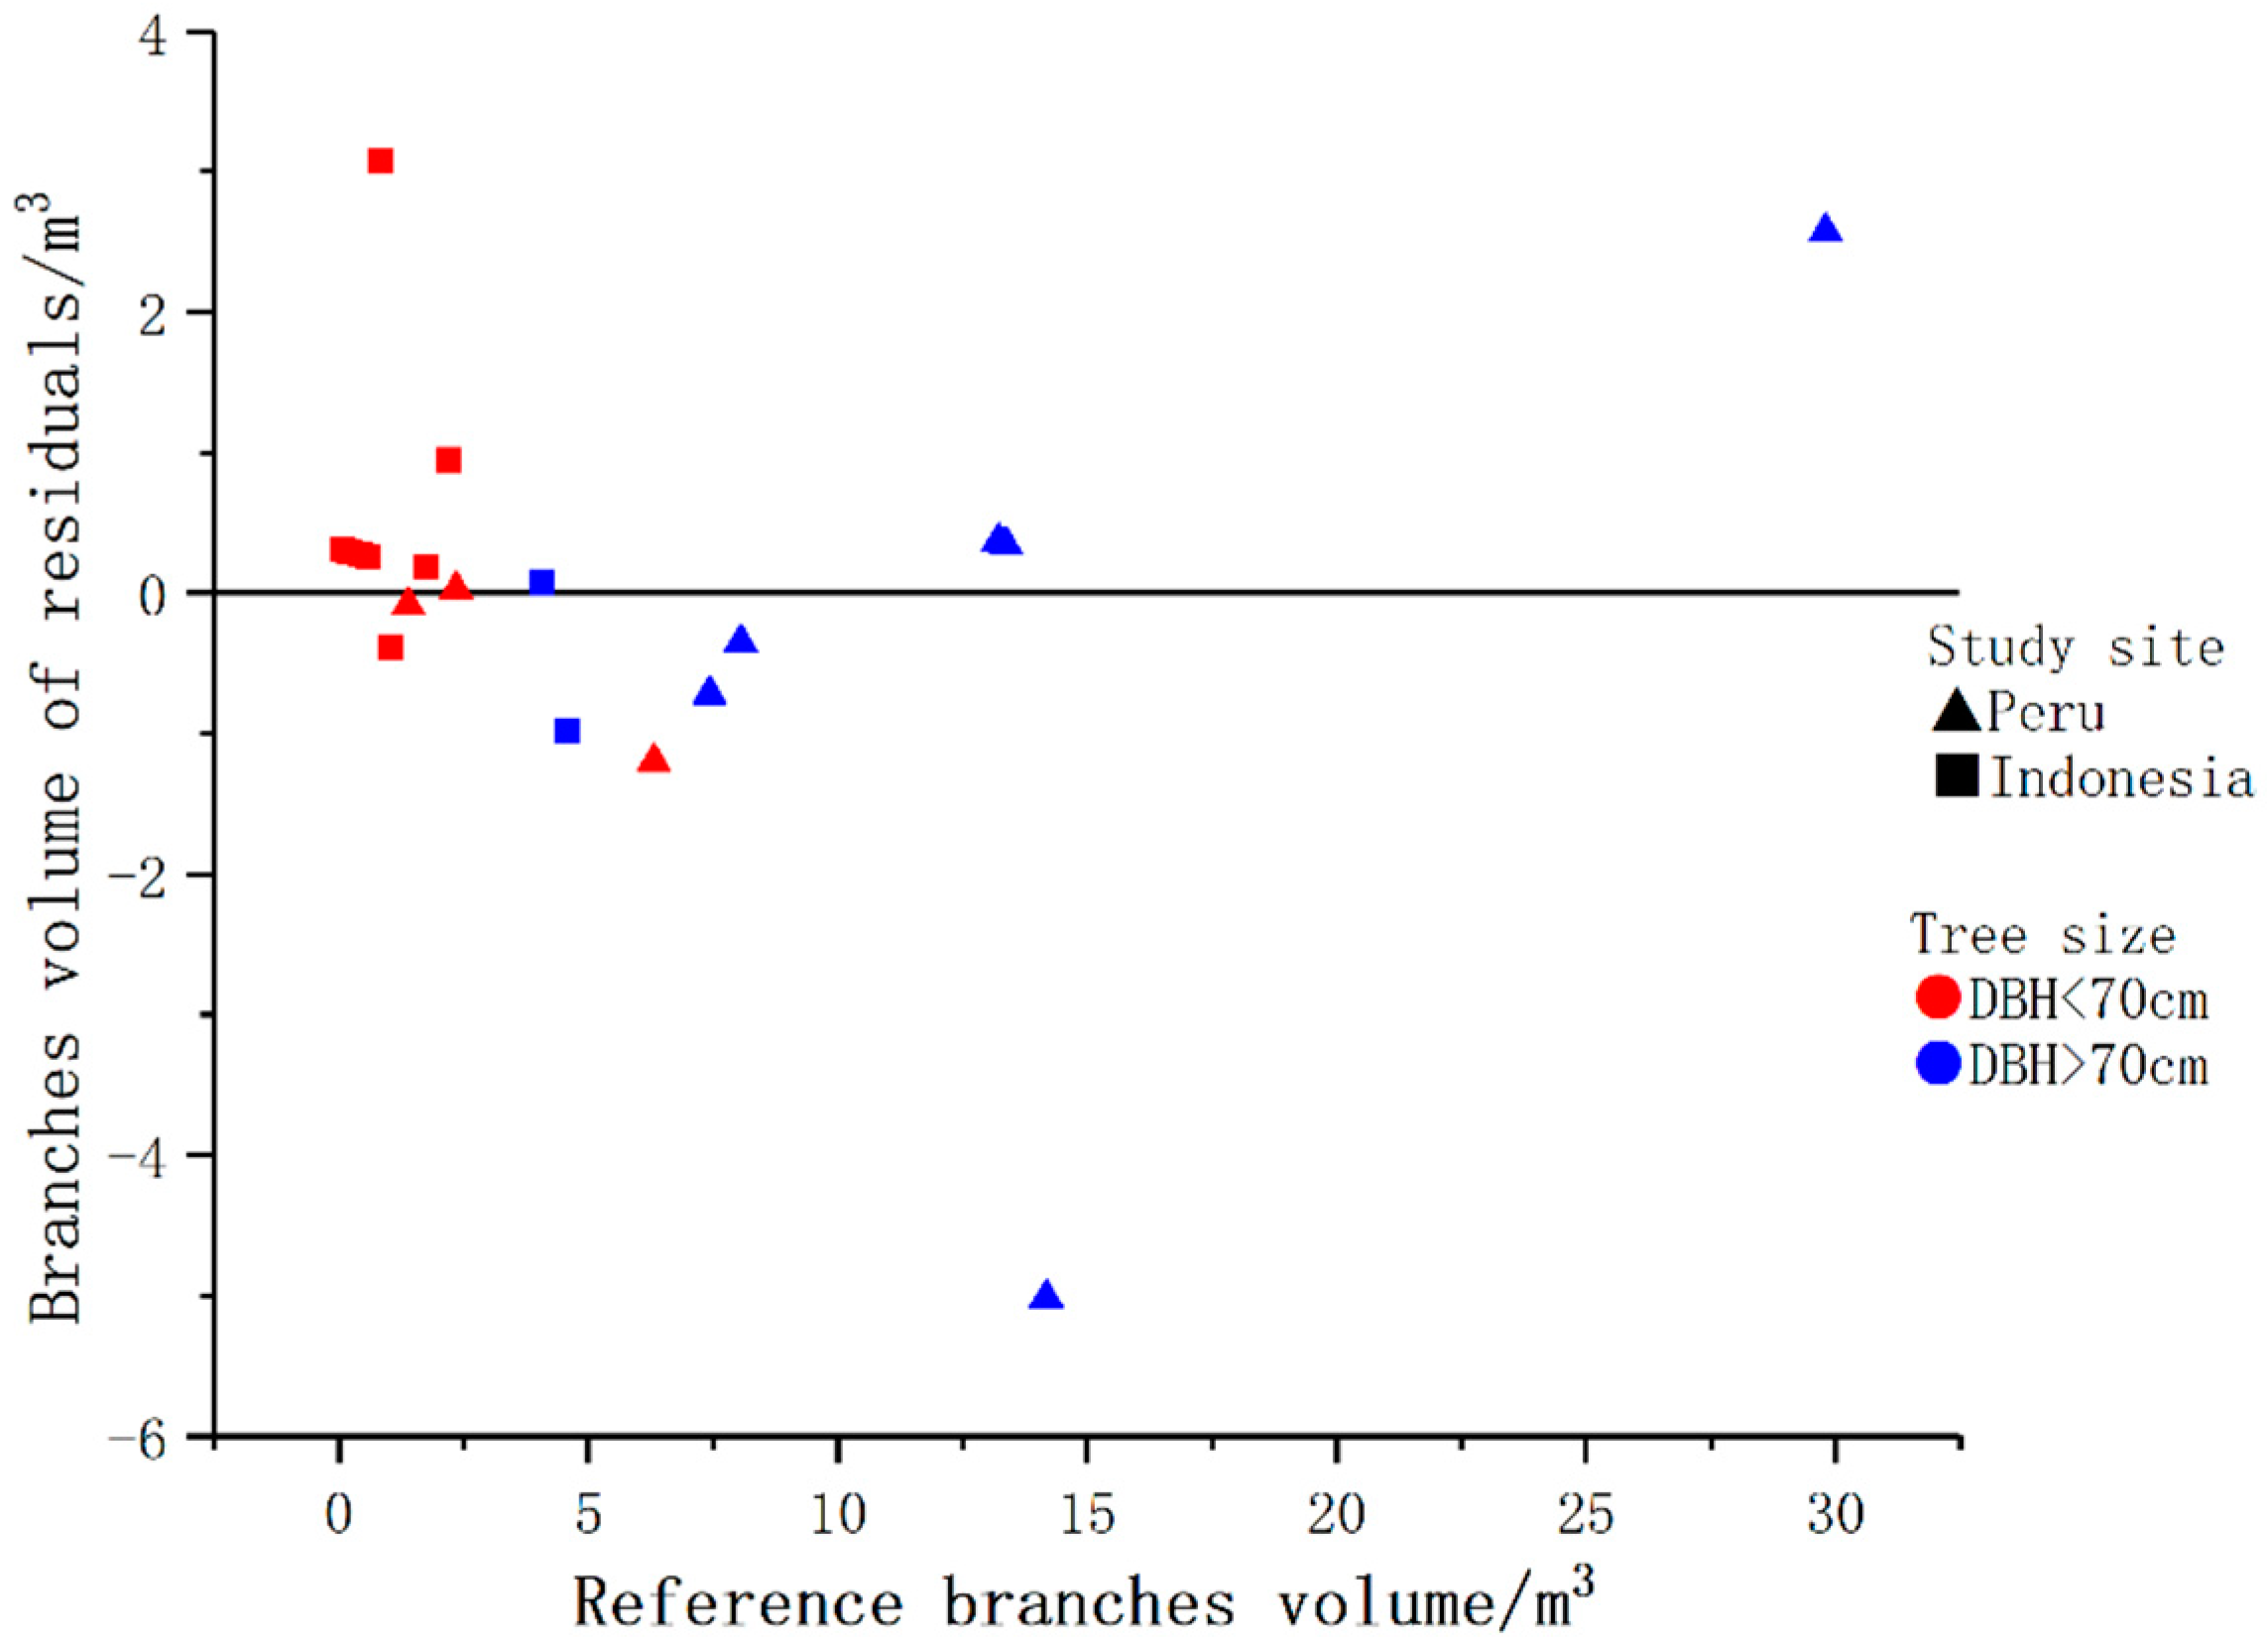
Figure 9 shows that the residual distribution of branches volume was similar to tree volume. The results of ‘small tree’ and ‘large tree’ were different. Compared with the branches of large trees, the branches of small trees modeled by AdQSM shows less uncertainty and deviation from the reference value. Most of the branch volume residuals were more evenly distributed on both sides of the y = 0 line, and most of the residuals were between −1 m3 and 1 m3, and the residual distribution range had no significant difference with the increase of the reference branch volume.
Table 7 shows the accuracy of estimating branch volume based on AdQSM. The Bias and rBias of the branch volume calculated by the least square method were 0.730 m3 and 12.38%, respectively. Among all the trees whose branch volume reference values ranged from 0.074 m3 to 29.806 m3, the trees with the absolute value of branch volume deviation of fewer than 1 m3 accounted for 63.2% in total.
3.3. Above Ground Biomass
The dry mass of 10 destructively sampled trees from Indonesia was used as a reference value for AdQSM. The reference values for tree AGB range from 0.58864 Mg to 10.56921 Mg, and the estimated values for AdQSM range from 0.59601 Mg to 9.59256 Mg. Figure 10 provides tree AGB reference values and AdQSM estimates for each tree.
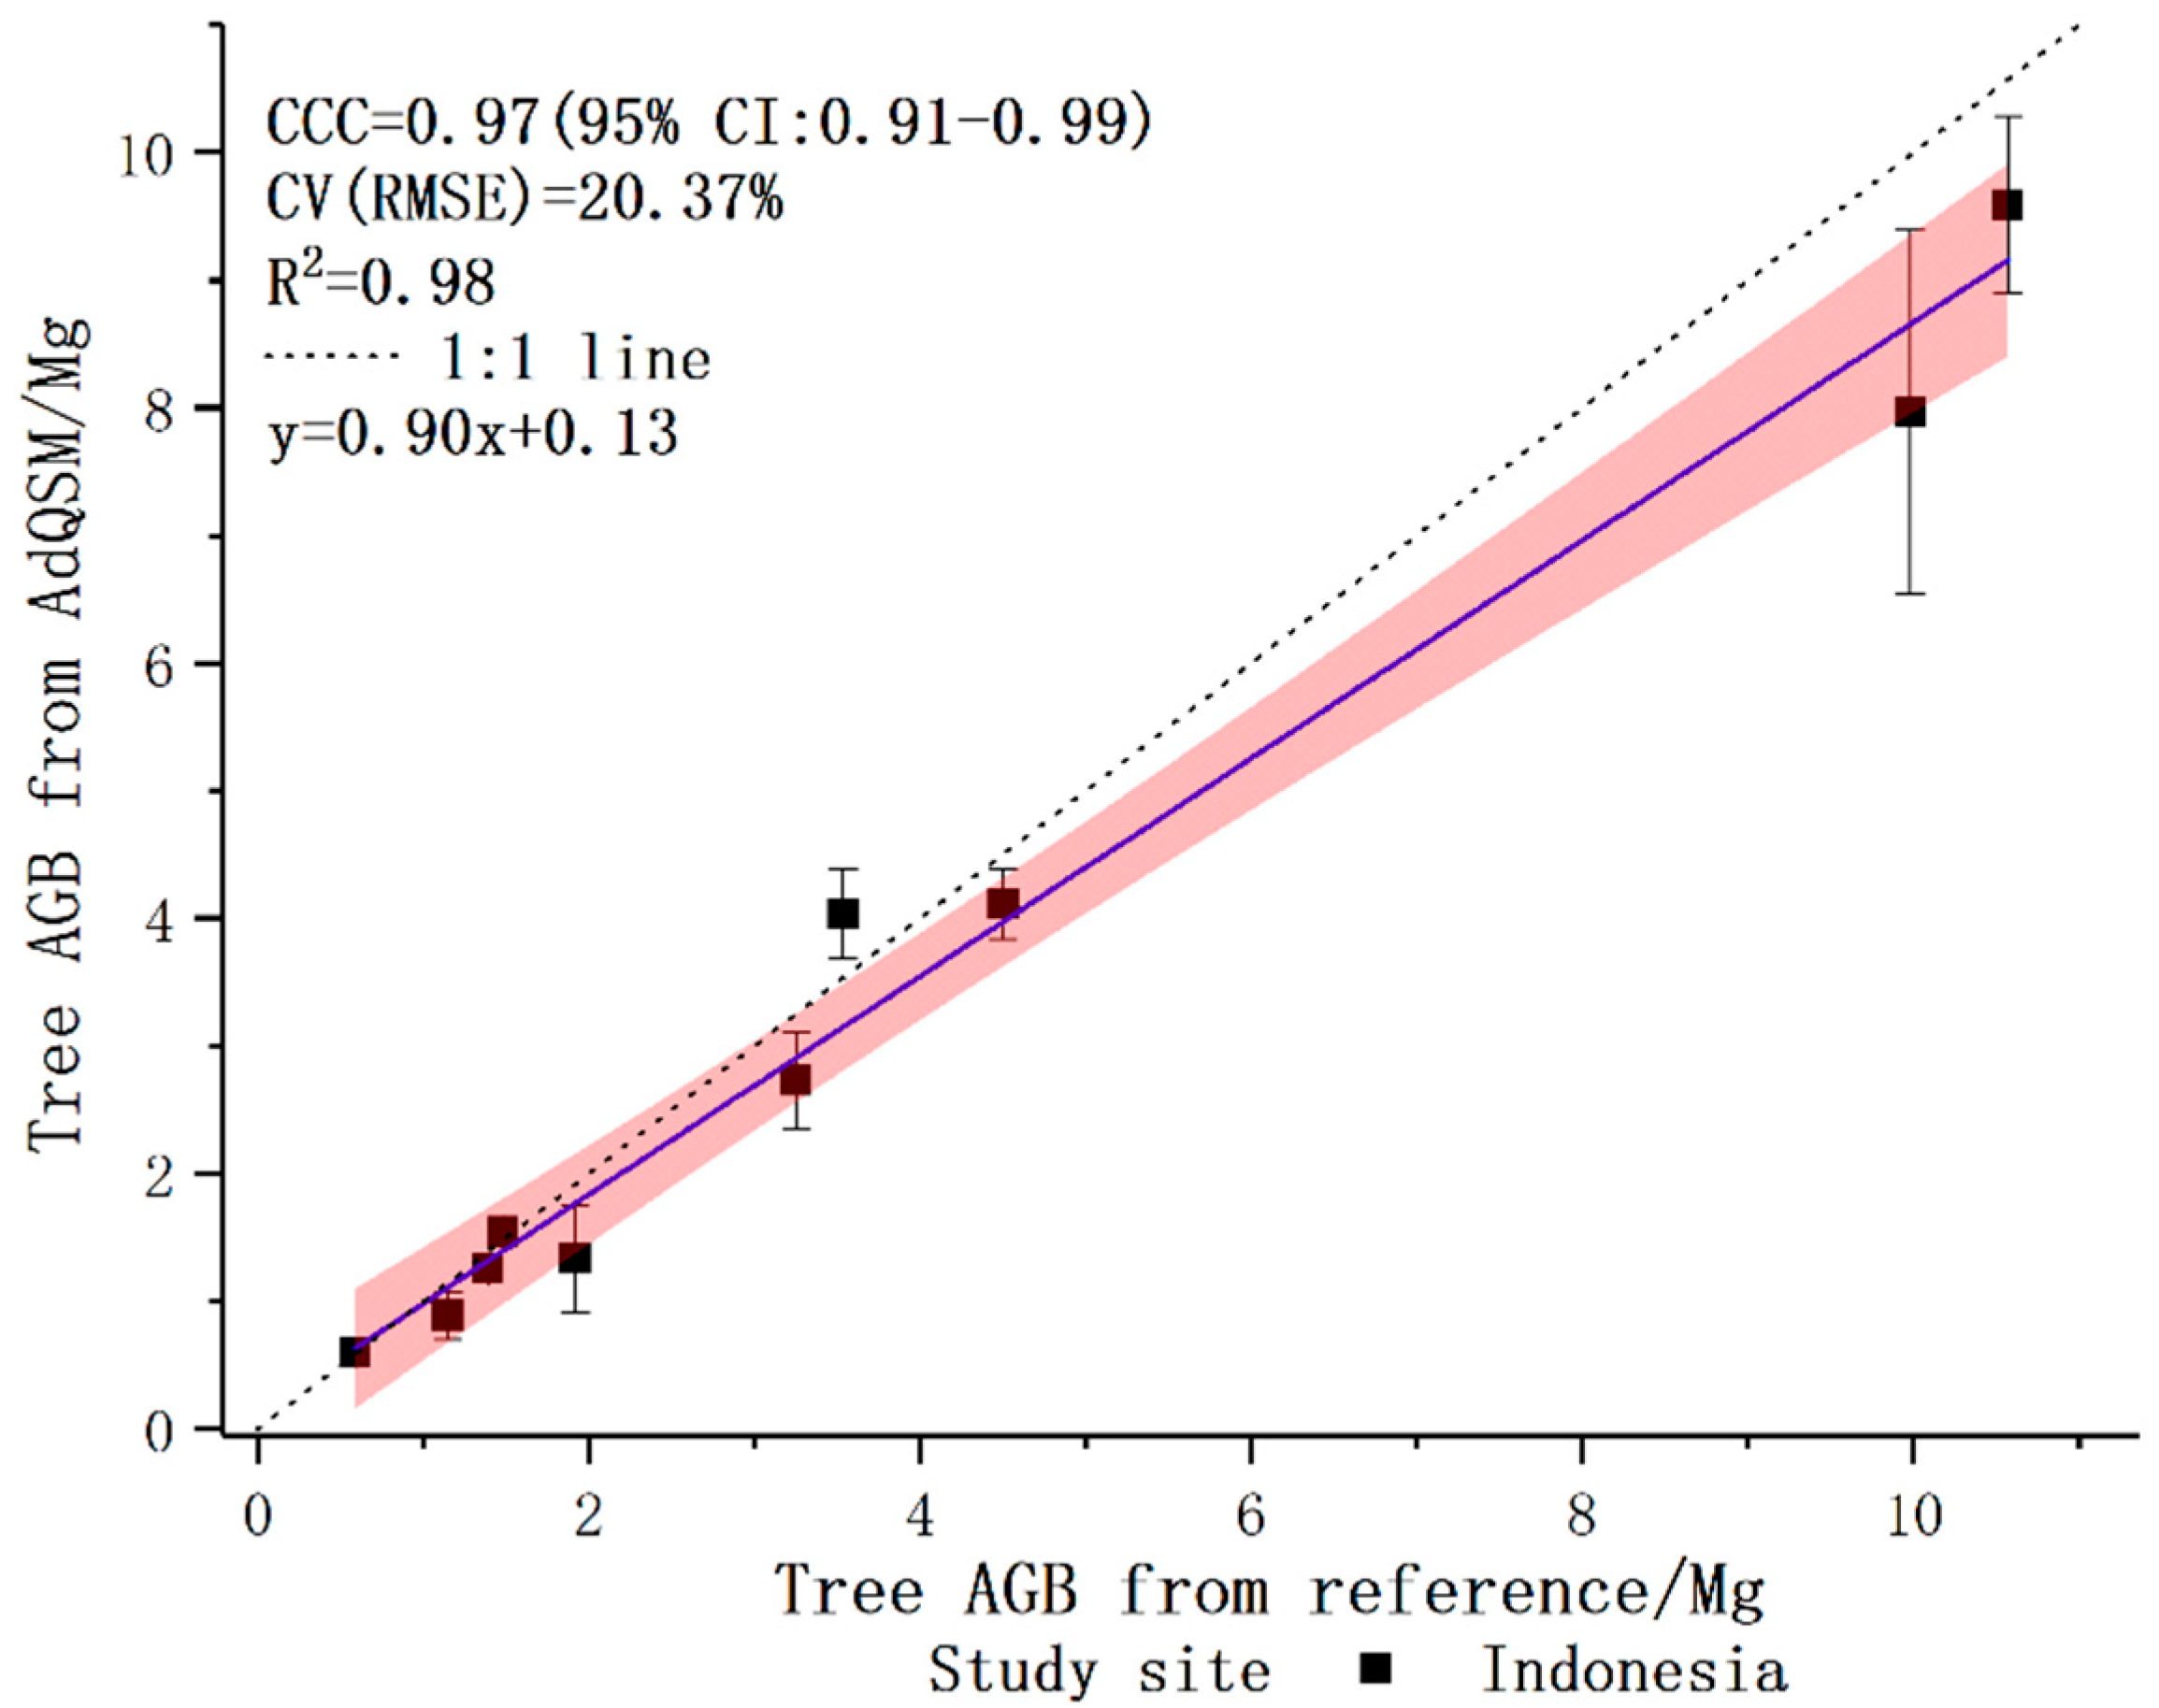
In Figure 11, the AGB of each tree in AdQSM was compared with the AGB of destructive reference measurements. The R2 of the linear fitting was 0.98, and the AGB from AdQSM was uniformly distributed on both sides of the reference value (no significant systematic deviation from the 1:1 line). Its slope was 0.90, indicating that AdQSM slightly underestimates the AGB of these trees. RMSE and CV (RMSE) respectively were 0.78146 Mg and 20.37%, according to the AGB results from AdQSM and after harvest. The AGB estimate of AdQSM was highly consistent with the reference value at the 95% confidence interval level. CCC was 0.97, LL CI was 0.91, and UI CI was 0.99. The total AGB of 10 large tropical trees from AdQSM and reference measurements was 34.03831 Mg and 38.36080 Mg, respectively. The total AGB was underestimated by 11.27% compared to the reference value.
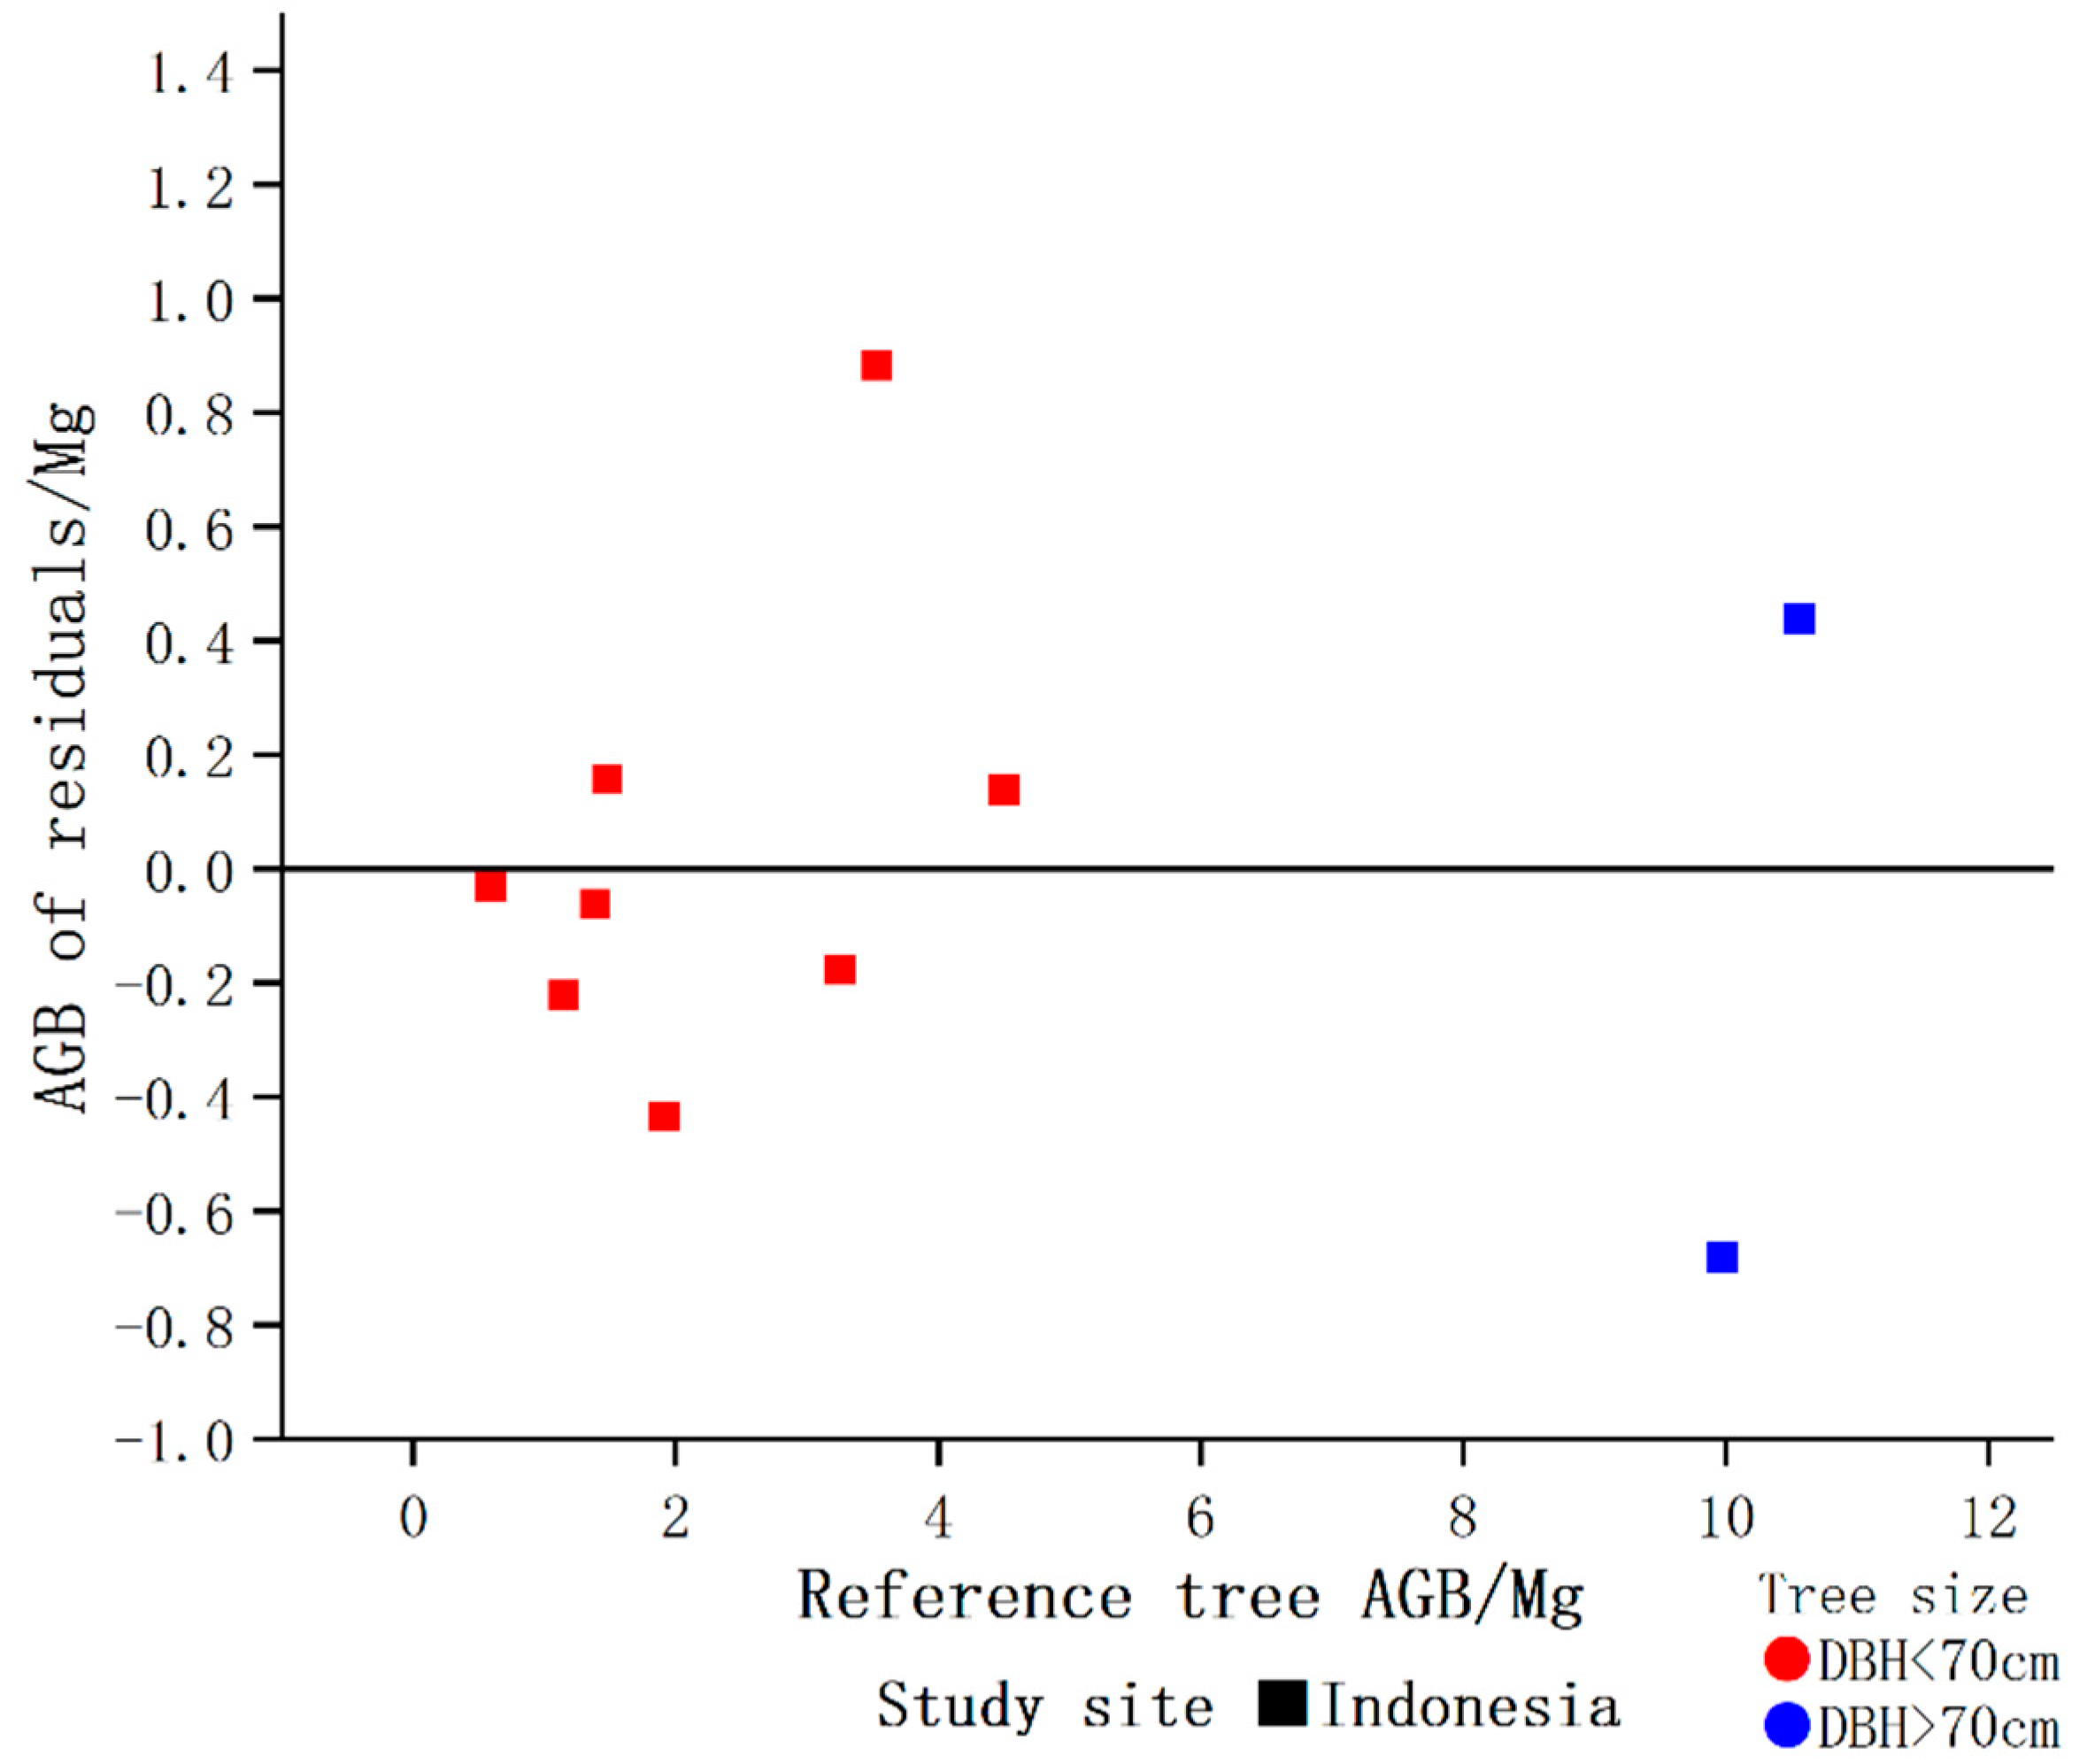
Figure 12 shows the AGB residual distribution. Most AGB residuals were more evenly distributed on both sides of the y = 0 line, and most residuals were between −0.3 Mg and 0.3 Mg. For ‘small trees’ with DBH less than 70 cm, the AdQSM model shows less uncertainty and deviation from reference values. There was no significant difference in residual value distribution range with the increase of AGB reference value.
As shown in Table 8, the accuracy of AGB is estimated based on AdQSM. The AGB Bias and rBias calculated by the least square method were 0.43225 Mg and −11.27% respectively. The AGB deviation of 60% of the sample trees was less than 0.5 Mg.
4. Discussion
4.1. Accuracy Analysis of AdQSM
The development of the QSM method for reconstructing the tree volume based on TLS point clouds is very important for estimating the tree AGB. Based on the research of Shenglan Du and Guangpeng Fan [39,42], this paper optimized and updated the original modeling methods and named the latest QSM model AdQSM. For the first time, the accuracy of AdQSM’s estimation of DBH, tree height, tree volume, branch volume, and AGB was tested concerning the geometric measurements of trees with destructive sampling. We tested AdQSM using the largest trees in each of 29 plots from three study sites (Peru, Indonesia, and Guyana). The canopy characteristics of the 29 large tropical trees are extremely complex and are all scanned in their natural environment [48]. After the TLS scan, destructive samples were taken from 29 trees. These tropical tree samples are characterized by the most challenging conditions in the 3D tree reconstruction methods [10]. The target tree is the tallest tree in each plot, with the largest canopy size and complexity. Therefore, AdQSM can be better tested with these data. The DBH estimate from AdQSM was compared with reference value after harvest, the R2 and CV (RMSE) of linear fitting respectively were 0.94 and 9.06%. When the estimated tree height from AdQSM was compared with the reference tree height after harvest, the R2 and CV (RMSE) of linear fitting were 0.95 and 5.79%. Although the 29 trees were from different ecosystems, the DBH and tree height estimated by AdQSM were well fitted to the reference values, respectively. We compared the accuracy of AdQSM and TreeQSM in modeling the volume of 29 trees. The CV-RMSE of AdQSM and TreeQSM with reference volume were 22.62% and 23.20%.
The CCCs between the volume estimates based on AdQSM and TreeQSM and the volume reference values were 0.97 and 0.96. The experimental results in Section 3.2.1 show that the accuracy of tree volume estimated by AdQSM is similar to that of TreeQSM, even slightly higher. This may be related to AdQSM’s ability to model tree geometry with high precision. AdQSM uses the minimum spanning tree (MST) algorithm to reconstruct the tree geometry. In the original publication of AdTree, the authors had compared it with TreeQSM, demonstrating the advantages of reconstructed tree geometry over TreeQSM. Although the three study sites contained different tree species, sizes, and shapes. The performance of AdQSM and TreeQSM was similar in three different study sites. AdQSM and TreeQSM differ in terms of programming language used for the implementation. While TreeQSM was implemented in MATLAB, AdQSM was developed in C++, therefore showing a performance advantage over TreeQSM. This paper only makes rough statistics on the modeling time of AdQSM. In the Win10 64-bit operating system (Intel I7-8700 processor, 3.20 GHz, and 16 G RAM), AdQSM can quickly complete single tree modeling after reading the point clouds input from the user in about 4–8 s. TreeQSM needs 1–3 min. AdQSM provides more possibilities for users to quickly model. However, TreeQSM is more complete than AdQSM in terms of user interaction, interface design, and data processing after modeling. The study of Jose Gonzalez DE Tanago provided the test data set for this paper and the results of AdQSM’s estimation of tree volume and AGB in this data set were similar to those of Jose Gonzalez de Tanago [10]. The results of Section 3.3 show that AdQSM can provide reliable and accurate AGB estimation for large tropical trees. Within the AGB reference values from the destructively sampled trees, ranging from 0.58864 Mg to 10.56921 Mg, the CCC between the estimated value of AdQSM and the reference value was 0.97, and the CV (RMSE) was 20.37%. Some studies used other QSM methods for tree AGB estimation of tropical trees [36,49], but destructive tree measurements were not used in their study. Therefore, the accuracy of tree volume or AGB estimates cannot be assessed and can only be compared with estimates provided by the allometric model. Based on the results of AdQSM’s tests on large tropical trees, it is reasonable to assume that AdQSM might be better able to model small or medium-sized trees with simpler structures.
4.2. Errors and Limitations of AdQSM
At present, the main error sources of AdQSM are divided into three parts. (1) During the modeling process, manually selecting the point clouds to fit the initial cylinder is the biggest source of error. Selecting different parts of the trunk will produce different volume values, and sometimes there may be a large volume error. We divided the point clouds used to fit the initial cylinder into three non-overlapping parts and finally calculated an initial radius to minimize the error. However, the error caused by manual selection of trunk points is still unavoidable. It is suggested to model an independent tree several times to reduce the error. In modeling, the middle or lower part of the stem and the uniform distribution of the point clouds of the trunk were selected to fit the initial cylinder. For trees in different places—such as tropical, subtropical, or temperate zones—users have some experience and knowledge to model them more accurately. In the future, we will consider further developing automatic tree modeling with preset fixed parameters in the algorithm. We will provide a (PatchDiam) parameter setting tool similar to TreeQSM, allowing users to set parameters before modeling to improve modeling accuracy. (2) AdQSM does not have a detailed buttress model but uses cylinder fitting. The reconstruction method based on cylindrical fitting cannot model and present buttresses. For some trees with buttresses, the volume estimated by the reconstruction model may be smaller than the real volume. Seven trees in Peru have buttresses, which contribute an average of 3.2% to the tree volume. Eight trees in Indonesia have buttresses, which account for an average of 8.1% of tree volume. From the statistical results of the tree volume, the error caused by the undetailed modeling of the buttresses can be considered as very low, but there is no such error for trees without buttresses. Because the point clouds of the buttresses are abrupt, a nonlinear method to model the buttresses is developed to deal with the abrupt point clouds, which can reduce such errors. Trunk curve optimization algorithms may also need to be considered. (3) Too many twigs or smaller branches modeled by AdQSM may result in a large volume of trees. Therefore, some lower-order branches or twigs can be removed to further improve the performance of AdQSM. The rate of change of a branch relative to the next branch can be considered, and the branch can be discarded when a certain threshold is exceeded. This study did not consider the biomass of leaves or fruits, as it is almost impossible to obtain the geometric and textural features of leaves or fruits from laser scanning, especially for large tropical trees. As a result, it is impossible for AdQSM to completely reconstruct the exact leaf or fruit from the point clouds. The contribution rate of leaves and fruits to the total AGB biomass estimated by AGB in this paper was only 1.1%. Further reducing these error sources and setting objective parameters is an area of future work.
4.3. Potential Applications
In general, AdQSM can be considered as a new and promising QSM model. The result of AdQSM is based on a limited sample of 29 trees in three ecosystems. Especially in the experiment of tree volume and AGB, the number of samples of destructively sampled trees was 29 and 10, respectively. Calders, Newnham et al. [37,50] harvested 65 trees in one ecosystem. Nevertheless, our results confirm that AdQSM can effectively explain the biophysical structure of individual trees, and provide forest parameters such as DBH, tree height, tree volume, branch volume, and AGB that may be independent of tree size for large tropical or other trees. When a user wants to use the QSM method to estimate tree AGBs in tropical forests, there are some challenges [13,51]. For very large and complex trees, there is a lack of reference data to verify the TLS 3D reconstruction model. This study reduces the underrepresentation of large tropical trees or rare trees. AQSM can be further used to test and calibrate new allometric growth models and to improve current and past estimates of tropical forest biomass and carbon emissions. AdQSM does not need to assume the tree structure in advance, nor does it depend on the limited tree structure parameters [6,10,20,52,53]. This is important because AdQSM can monitor not only natural gradual changes in biomass, but also sudden changes caused by storm damage, harvesting, fire, or disease. This is essential for developing effective forest management strategies. The accurate 3D trees reconstructed by AdQSM also provide opportunities for realistic expression of scenes such as urban landscape design or entertainment. Besides, in terms of tree volume and AGB estimation, the accuracy based on AdQSM can be further compared with that based on the allometric growth model. At present, AdQSM only considers biomass estimation at the tree level, and users are required to perform single tree extraction operations when estimating biomass at the plot level. The inclusion of existing knowledge in the field of tree segmentation or identification into the current research will enable AdQSM to be further applied in practical production [54,55,56]. AdQSM can also be tried to be modeled based on point clouds from multiple platforms such as backpacks, ground vehicles, UAV, or handheld devices [57]. Theoretically, the data source of AdQSM tree reconstruction can be from not only laser scanning but also photogrammetry. Comparison and analysis of existing QSM models (such as AdQSM, TreeQSM, SimpleTree, and PypeTree) will provide guidance and reference for the selection of models in academia and industry [27,43,44], and drive the research and development of QSM methods.
5. Conclusions
This paper presented a new accurate and detailed QSM method, AdQSM, for estimating AGB of large tropical trees. Destructive tree measurements were first used to test the accuracy of DBH, tree height, tree volume, and branch volume derived from AdQSM. The accuracy of AGB estimation by AdQSM was verified based on the reconstructed tree volume and wood basic density. The experimental results show that AdQSM can effectively and non-destructively estimate AGB from TLS point clouds. AdQSM can continuously monitor the growth, health, economic value, and ecological benefits of trees. AdQSM can be used not only to test the allometric equations but also to develop and test new allometric relationships. This is important because large trees are not often harvested and measured, leading to greater absolute errors as DBH increases, especially for large or valuable trees that cannot be harvested and measured.
In the future, a fully automated AdQSM optimization method needs to be developed to obtain an optimal reconstruction of an entire tree rather than focusing solely on its trunk. This automatic method can further improve the accuracy of tree volume and AGB estimation based on TLS data without cutting trees. Reducing some error sources will make AdQSM more accurate and realistic, and to be better applied in the field of tree modeling from point clouds. Next, we plan to open up a common benchmark dataset to compare AdQSM with other existing QSM models. At the same time, the advantages and disadvantages of each QSM method are analyzed to provide guidance and reference for academia and industry to choose the most suitable QSM model.
Author Contributions
Conceptualization, G.F., L.N., X.S., and F.C.; Data curation, G.F., X.S., and F.C.; Formal analysis, G.F., L.N., X.S., and F.C.; Funding acquisition, X.S. and F.C.; Investigation, G.F. and Y.D.; Methodology, G.F., L.N., X.S., and F.C.; Project administration, G.F., Y.D., X.S., and F.C.; Resources, X.S. and F.C.; Software, G.F. and L.N.; Supervision, X.S. and F.C.; Validation, G.F. and Y.D.; Visualization, G.F., L.N., and Y.D.; Writing—original draft, G.F. and Y.D.; Writing—review and editing, G.F., L.N., and Y.D. All authors have read and agreed to the published version of the manuscript.
Funding
This research was jointly supported by the Intelligent Decision-Making Technology of Artificial Forest Cultivation and Management (2017YFD0600906).
Acknowledgments
The authors are very grateful to Jose Gonzalez de Tanago and his co-authors from Wageningen University in the Netherlands for providing the precious large-scale tropical tree dataset for validation of the proposed AdQSM model. We would also like to thank the reviewers for their valuable comments and suggestions that helped to improve the manuscript.
Conflicts of Interest
The authors declare no conflict of interest.
Appendix A
This appendix shows the geometric measurement and volume estimation methods of trees. The content of this appendix comes from a research paper by Jose Gonzalez de Tanago.
Figure A1.
Tree geometry measurements. (1) Stem diameter (1a) every metre (1b) until start of first branch. For trees with buttresses (2): diameter in two orthogonal directions (2a) and for each buttress horizontal length (from the furthest point to the stem) (2b); width (mean width between the tip and the buttress intersection with the stem) (2c); and height (from the ground to the highest insertion point of the buttress into the stem) (2d). For branches (3): proximal diameter at the base of each internode and above flaring (3a), distal diameter at the tip of each internode and below flaring of the next node (3b) and branch length from the base to the tip of each internode (3c).

Volumes of tree main stem (bole) sections (each one-meter length) and branches (until tapered diameter > 10 cm) were calculated using the Smalian formula as shown in Equation (A1)
where is the area at the base of the internode (or base of each 1 m length bole section); is the area at the tip of the internode (or top of 1 m length bole section) and is the length of the internode (1m for the bole sections). Areas of stem and branches cross sections were calculated as circles with diameters from the measurements described in Figure A1. For ellipsoidal sections (central part of stumps, excluding buttresses) the two extreme diameters were averaged to calculate the section area.
The buttress volumes were calculated with a general triangular prism volume formula as shown in Equation (A2) (see buttress measurements in Figure A1)
where is the buttress horizontal length (as described in 2b in Figure A1), is the buttress width (as described in 2c), and is the buttress height (as described in 2d).
References
- Enquist, B.J.; Niklas, K.J. Global allocation rules for patterns of biomass partitioning in seed plants. Science 2002, 295, 1517–1520. [Google Scholar] [CrossRef] [PubMed] [Green Version]
- Le Toan, T.; Quegan, S.; Davidson, M.; Balzter, H.; Paillou, P.; Papathanassiou, K.; Plummer, S.; Rocca, F.; Saatchi, S.; Shugart, H.; et al. The BIOMASS mission: Mapping global forest biomass to better understand the terrestrial carbon cycle. Remote Sens. Environ. 2011, 115, 2850–2860. [Google Scholar] [CrossRef] [Green Version]
- Zhang, F.; Johnson, D.M.; Wang, J.; Yu, C. Cost, energy use and GHG emissions for forest biomass harvesting operations. Energy 2016, 114, 1053–1062. [Google Scholar] [CrossRef]
- Attiwill, P.M.; Ovington, J.D. Determination of forest biomass. For. Sci. 1968, 1, 13–15. [Google Scholar]
- Disney, M.; Vicari, M.B.; Burt, A.; Calders, K.; Lewis, S.L.; Raumonen, P.; Wilkes, P. Weighing trees with lasers: Advances, challenges and opportunities. Interface Focus 2018, 8, 20170048. [Google Scholar] [CrossRef] [Green Version]
- Momo, S.T.; Ploton, P.; Sonké, B.; Hackenberg, J.; Griffon, S.; De Coligny, F.; Kamdem, N.G.; Libalah, M.; Mofack, G.I.; Le Moguédec, G.; et al. Using terrestrial laser scanning data to estimate large tropical trees biomass and calibrate allometric models: A comparison with traditional destructive approach. Methods Ecol. Evol. 2017, 9, 905–916. [Google Scholar] [CrossRef]
- Zeng, W.; Tang, S.Z. A new general allometric biomass model. Nat. Précéd. 2011, 1. [Google Scholar] [CrossRef]
- Chen, Q.; Laurin, G.V.; Valentini, R. Uncertainty of remotely sensed aboveground biomass over an African tropical forest: Propagating errors from trees to plots to pixels. Remote Sens. Environ. 2015, 160, 134–143. [Google Scholar] [CrossRef]
- Aguilar, F.J.; Nemmaoui, A.; Peñalver, A.; Rivas, J.R.; Aguilar, M.A. Developing allometric equations for teak plantations located in the coastal region of Ecuador from terrestrial laser scanning data. Forests 2019, 10, 1050. [Google Scholar] [CrossRef] [Green Version]
- De Tanago, J.G.; Lau, A.; Bartholomeus, H.; Herold, M.; Avitabile, V.; Raumonen, P.; Martius, C.; Goodman, R.C.; Disney, M.; Manuri, S.; et al. Estimation of above-ground biomass of large tropical trees with terrestrial LiDAR. Methods Ecol. Evol. 2017, 9, 223–234. [Google Scholar] [CrossRef] [Green Version]
- Lau, A.; Bentley, L.P.; Martius, C.; Shenkin, A.; Bartholomeus, H.; Raumonen, P.; Malhi, Y.; Jackson, T.; Herold, M. Quantifying branch architecture of tropical trees using terrestrial LiDAR and 3D modelling. Trees 2018, 32, 1219–1231. [Google Scholar] [CrossRef] [Green Version]
- Segura, M.; Kanninen, M. Allometric models for tree volume and total aboveground biomass in a tropical humid forest in Costa Rica1. Biotropica 2005, 37, 2–8. [Google Scholar] [CrossRef]
- Chave, J.; Condit, R.; Aguilar, S.; Hernandez, A.; Lao, S.; Perez, R. Error propagation and scaling for tropical forest biomass estimates. Philos. Trans. R. Soc. B Biol. Sci. 2004, 359, 409–420. [Google Scholar] [CrossRef] [PubMed]
- Molto, Q.; Rossi, V.; Blanc, L. Error propagation in biomass estimation in tropical forests. Methods Ecol. Evol. 2012, 4, 175–183. [Google Scholar] [CrossRef]
- Cao, L.; Coops, N.C.; Sun, Y.; Ruan, H.; Wang, G.; Dai, J.; She, G. Estimating canopy structure and biomass in bamboo forests using airborne LiDAR data. ISPRS J. Photogramm. Remote Sens. 2019, 148, 114–129. [Google Scholar] [CrossRef]
- Hackenberg, J.; Wassenberg, M.; Spiecker, H.; Sun, D. Non destructive method for biomass prediction combining TLS derived tree volume and wood density. Forests 2015, 6, 1274–1300. [Google Scholar] [CrossRef]
- Wallace, L.O.; Hillman, S.; Reinke, K.; Hally, B. Non-destructive estimation of above-ground surface and near-surface biomass using 3D terrestrial remote sensing techniques. Methods Ecol. Evol. 2017, 8, 1607–1616. [Google Scholar] [CrossRef] [Green Version]
- Kankare, V.; Holopainen, M.; Vastaranta, M.; Puttonen, E.; Yu, X.; Hyyppä, J.; Vaaja, M.; Hyyppä, H.; Alho, P. Individual tree biomass estimation using terrestrial laser scanning. ISPRS J. Photogramm. Remote Sens. 2013, 75, 64–75. [Google Scholar] [CrossRef]
- Liang, X.; Kankare, V.; Hyyppä, J.; Wang, Y.; Kukko, A.; Haggrén, H.; Yu, X.; Kaartinen, H.; Jaakkola, A.; Guan, F.; et al. Terrestrial laser scanning in forest inventories. ISPRS J. Photogramm. Remote Sens. 2016, 115, 63–77. [Google Scholar] [CrossRef]
- Lau, A.; Calders, K.; Bartholomeus, H.; Martius, C.; Raumonen, P.; Herold, M.; Vicari, M.; Sukhdeo, H.; Singh, J.; Goodman, R.C. Tree biomass equations from terrestrial LiDAR: A case study in Guyana. Forests 2019, 10, 527. [Google Scholar] [CrossRef] [Green Version]
- Calders, K.; Burt, A.; Newnham, G.; Disney, M.; Kaasalainen, M. Reducing uncertainties in above-ground biomass estimates using terrestrial laser scanning. In Proceedings of the SilviLaser 2015, La Grande Motte, France, 28–30 September 2015. [Google Scholar]
- Nam, V.T.; Anten, N.P.R.; Van Kuijk, M. Biomass dynamics in a logged forest: The role of wood density. J. Plant Res. 2018, 131, 611–621. [Google Scholar] [CrossRef] [PubMed] [Green Version]
- Calders, K.; Origo, N.; Burt, A.; Disney, M.; Nightingale, J.; Raumonen, P.; Åkerblom, M.; Malhi, Y.; Lewis, P. Realistic forest stand reconstruction from terrestrial LiDAR for radiative transfer modelling. Remote Sens. 2018, 10, 933. [Google Scholar] [CrossRef] [Green Version]
- Saarinen, N.; Kankare, V.; Vastaranta, M.; Luoma, V.; Pyörälä, J.; Tanhuanpää, T.; Liang, X.; Kaartinen, H.; Kukko, A.; Jaakkola, A.; et al. Feasibility of terrestrial laser scanning for collecting stem volume information from single trees. ISPRS J. Photogramm. Remote Sens. 2017, 123, 140–158. [Google Scholar] [CrossRef]
- Côté, J.-F.; Widlowski, J.-L.; Fournier, R.A.; Verstraete, M.M. The structural and radiative consistency of three-dimensional tree reconstructions from terrestrial lidar. Remote Sens. Environ. 2009, 113, 1067–1081. [Google Scholar] [CrossRef]
- Raumonen, P.; Kaasalainen, M.; Åkerblom, M.; Kaasalainen, S.; Kaartinen, H.; Vastaranta, M.; Holopainen, M.; Disney, M.; Lewis, P. Fast automatic precision tree models from terrestrial laser scanner data. Remote Sens. 2013, 5, 491–520. [Google Scholar] [CrossRef] [Green Version]
- Markku, Å.; Raumonen, P.; Kaasalainen, M.; Casella, E.; Åkerblom, M. Analysis of geometric primitives in quantitative structure models of tree stems. Remote Sens. 2015, 7, 4581–4603. [Google Scholar] [CrossRef] [Green Version]
- Fang, R.; Strimbu, B. Comparison of mature douglas-firs’ crown structures developed with two quantitative structural models using TLS point clouds for neighboring trees in a natural regime stand. Remote Sens. 2019, 11, 1661. [Google Scholar] [CrossRef] [Green Version]
- Raumonen, P.; Casella, E.; Calders, K.; Murphy, S.; Åkerblom, M.; Kaasalainen, M. Massive-scale tree modelling from TLS data. ISPRS Ann. Photogramm. Remote Sens. Spat. Inf. Sci. 2015, 3, 189–196. [Google Scholar] [CrossRef] [Green Version]
- Raumonen, P.; Kaasalainen, S.; Kaasalainen, M.; Kaartinen, H. Approximation of volume and branch size distribution of trees from laser scanner data. ISPRS Int. Arch. Photogramm. Remote Sens. Spat. Inf. Sci. 2012, 3812, 79–84. [Google Scholar] [CrossRef] [Green Version]
- Stovall, A.E.L.; Vorster, A.G.; Anderson, R.; Evangelista, P.H.; Shugart, H.H. Non-destructive aboveground biomass estimation of coniferous trees using terrestrial LiDAR. Remote Sens. Environ. 2017, 200, 31–42. [Google Scholar] [CrossRef]
- Brede, B.; Calders, K.; Lau, A.; Raumonen, P.; Bartholomeus, H.M.; Herold, M.; Kooistra, L. Non-destructive tree volume estimation through quantitative structure modelling: Comparing UAV laser scanning with terrestrial LIDAR. Remote Sens. Environ. 2019, 233, 111355. [Google Scholar] [CrossRef]
- Mayamanikandan, T.; Reddy, R.S.; Jha, C. Non-destructive tree volume estimation using terrestrial lidar data in teak dominated Central Indian forests. In Proceedings of the 2019 IEEE Recent Advances in Geoscience and Remote Sensing: Technologies, Standards and Applications (TENGARSS) 2019, Kochi, Kerala, India, 17–20 October 2019; pp. 100–103. [Google Scholar]
- Guzmán, Q.J.A.; Sharp, I.; Alencastro, F.; Sanchez-Azofeifa, A. On the relationship of fractal geometry and tree–stand metrics on point clouds derived from terrestrial laser scanning. Methods Ecol. Evol. 2020. [Google Scholar] [CrossRef]
- Åkerblom, M.; Raumonen, P.; Mäkipää, R.; Kaasalainen, M. Automatic tree species recognition with quantitative structure models. Remote Sens. Environ. 2017, 191, 1–12. [Google Scholar] [CrossRef]
- Meñaca, J.G.D.; Sarmiento, A.I.L.; Bartholomeus, H.M.; Herold, M.; Raumonen, P.; Avitabile, V.; Martius, C.; Joseph, S. Quantification of tropical forest biomass with terrestrial LiDAR and 3D tree quantitative structure modelling. In Proceedings of the Living Planet Symposium 2016, Prague, Czech Republic, 9–13 May 2016. [Google Scholar]
- Calders, K.; Newnham, G.; Burt, A.; Murphy, S.; Raumonen, P.; Herold, M.; Culvenor, D.; Avitabile, V.; Disney, M.; Armston, J.D.; et al. Nondestructive estimates of above-ground biomass using terrestrial laser scanning. Methods Ecol. Evol. 2014, 6, 198–208. [Google Scholar] [CrossRef]
- Moorthy, S.M.K.; Raumonen, P.; Bulcke, J.V.D.; Calders, K.; Verbeeck, H. Terrestrial laser scanning for non-destructive estimates of liana stem biomass. For. Ecol. Manag. 2020, 456, 117751. [Google Scholar] [CrossRef]
- Du, S.; Lindenbergh, R.; LeDoux, H.; Stoter, J.; Nan, L. AdTree: Accurate, detailed, and automatic modelling of laser-scanned trees. Remote Sens. 2019, 11, 2074. [Google Scholar] [CrossRef] [Green Version]
- Hackenberg, J.; Spiecker, H.; Calders, K.; Disney, M.; Raumonen, P. SimpleTree —An efficient open source tool to build tree models from TLS clouds. Forests 2015, 6, 4245–4294. [Google Scholar] [CrossRef]
- Delagrange, S.; Jauvin, C.; Rochon, P. PypeTree: A tool for reconstructing tree perennial tissues from point clouds. Sensors 2014, 14, 4271–4289. [Google Scholar] [CrossRef] [Green Version]
- Fan, G.; Nan, L.; Chen, F.; Dong, Y.; Wang, Z.; Li, H.; Chen, D. A new quantitative approach to tree attributes estimation based on LiDAR point clouds. Remote Sens. 2020, 12, 1779. [Google Scholar] [CrossRef]
- Kankare, V.; Vastaranta, M.; Holopainen, M.; Räty, M.; Yu, X.; Hyyppä, J.; Hyyppä, H.; Alho, P.; Viitala, R. Retrieval of forest aboveground biomass and stem volume with airborne scanning LiDAR. Remote Sens. 2013, 5, 2257–2274. [Google Scholar] [CrossRef] [Green Version]
- Nogueira, E.M.; Nelson, B.W.; Fearnside, P.M. Wood density in dense forest in central Amazonia, Brazil. For. Ecol. Manag. 2005, 208, 261–286. [Google Scholar] [CrossRef]
- Berger, A.; Gschwantner, T.; McRoberts, R.E.; Schadauer, K. Effects of measurement errors on individual tree stem volume estimates for the Austrian National Forest Inventory. For. Sci. 2014, 60, 14–24. [Google Scholar] [CrossRef]
- Goodman, R.C.; Phillips, O.L.; Baker, T.R. The importance of crown dimensions to improve tropical tree biomass estimates. Ecol. Appl. 2014, 24, 680–698. [Google Scholar] [CrossRef] [Green Version]
- Chave, J.; Coomes, D.; Jansen, S.; Lewis, S.L.; Swenson, N.G.; Zanne, A.E. Towards a worldwide wood economics spectrum. Ecol. Lett. 2009, 12, 351–366. [Google Scholar] [CrossRef] [PubMed]
- Wilkes, P.; Lau, A.; Disney, M.; Calders, K.; Burt, A.; De Tanago, J.G.; Bartholomeus, H.; Brede, B.; Herold, M. Data acquisition considerations for terrestrial laser scanning of forest plots. Remote Sens. Environ. 2017, 196, 140–153. [Google Scholar] [CrossRef]
- Chave, J.; Réjou-Méchain, M.; Búrquez, A.; Chidumayo, E.; Colgan, M.S.; Delitti, W.B.; Duque, A.; Eid, T.; Fearnside, P.M.; Goodman, R.C.; et al. Improved allometric models to estimate the aboveground biomass of tropical trees. Glob. Chang. Biol. 2014, 20, 3177–3190. [Google Scholar] [CrossRef]
- Newnham, G.; Armston, J.D.; Calders, K.; Disney, M.; Lovell, J.; Schaaf, C.B.; Strahler, A.H.; Danson, F.M. Terrestrial Laser Scanning for Plot-Scale Forest Measurement. Curr. For. Rep. 2015, 1, 239–251. [Google Scholar] [CrossRef] [Green Version]
- Clark, D.B.; Kellner, J.R. Tropical forest biomass estimation and the fallacy of misplaced concreteness. J. Veg. Sci. 2012, 23, 1191–1196. [Google Scholar] [CrossRef]
- Wang, D. Unsupervised semantic and instance segmentation of forest point clouds. ISPRS J. Photogramm. Remote Sens. 2020, 165, 86–97. [Google Scholar] [CrossRef]
- Ghimire, S.; Xystrakis, F.; Koutsias, N. Using terrestrial laser scanning to measure forest inventory parameters in a Mediterranean coniferous stand of Western Greece. PFG J. Photogramm. Remote Sens. Geoinf. Sci. 2017, 85, 213–225. [Google Scholar] [CrossRef]
- Li, Y.; Guo, Q.; Su, Y.; Tao, S.; Zhao, K.; Xu, G. Retrieving the gap fraction, element clumping index, and leaf area index of individual trees using single-scan data from a terrestrial laser scanner. ISPRS J. Photogramm. Remote Sens. 2017, 130, 308–316. [Google Scholar] [CrossRef]
- Li, W.; Guo, Q.; Jakubowski, M.K.; Kelly, M. A new method for segmenting individual trees from the lidar point cloud. Photogramm. Eng. Remote Sens. 2012, 78, 75–84. [Google Scholar] [CrossRef] [Green Version]
- Lu, X.; Guo, Q.; Li, W.; Flanagan, J. A bottom-up approach to segment individual deciduous trees using leaf-off lidar point cloud data. ISPRS J. Photogramm. Remote Sens. 2014, 94, 1–12. [Google Scholar] [CrossRef]
- Ye, N.; Van Leeuwen, L.M.; Nyktas, P. Analysing the potential of UAV point cloud as input in quantitative structure modelling for assessment of woody biomass of single trees. Int. J. Appl. Earth Obs. Geoinf. 2019, 81, 47–57. [Google Scholar] [CrossRef]
Figure 1.
The modeling process of AdQSM. (a) Guyana’s Grandiflora tree point clouds (TreeID = GUY06_000); (b) manual selection of the point clouds to fit the initial cylinder; (c) the initial skeleton; (d) the final skeleton after trimming; (e) the reconstructed cylinder model; (f) the reconstructed model after RGB rendering.

Figure 2.
Comparison of DBH and tree height estimated by AdQSM with reference values. (a) DBH; (b) tree height.
Figure 2.
Comparison of DBH and tree height estimated by AdQSM with reference values. (a) DBH; (b) tree height.

Figure 3.
The residual distribution of DBH and tree height. (a) DBH; (b) tree height.

Figure 4.
Reference tree volume value and the value estimated using the AdQSM and TreeQSM.

Figure 5.
Comparison of tree volume estimated by AdQSM and TreeQSM with reference measurements. Symbols and colors indicated the value of each study site. The green and the yellow lines represent the fitted linear regression model between the estimated values of QSM and the reference value. The grey band represented the 95% confidence interval of the regression.

Figure 6.
Residual distribution of tree volume. (a) AdQSM; (b) TreeQSM.

Figure 7.
Visualization of tree branch modeling of Indonesia’s Aglaia rubiginosa tree branch (TreeID = IND08_076). (a) Original branch input point clouds; (b) Input point clouds and reconstructed branches model; (c) Reconstructed branches model; (d) Branches model rendered by RGB.
Figure 7.
Visualization of tree branch modeling of Indonesia’s Aglaia rubiginosa tree branch (TreeID = IND08_076). (a) Original branch input point clouds; (b) Input point clouds and reconstructed branches model; (c) Reconstructed branches model; (d) Branches model rendered by RGB.

Figure 8.
Comparison of branches volume estimated by AdQSM with reference measurements. Symbols and colors indicated the value of each study site. The error bar was the standard deviation of the QSM model implementation for each tree. The blue line represented the fitted linear regression model between the estimated value of AdQSM and the reference value, and the orange–red band represented the 95% confidence interval of the regression.

Figure 9.
Residual distribution of branches volume.

Figure 10.
Reference AGB value and the value estimated by the AdQSM method for each tree.

Figure 11.
Comparison of tree AGB estimated by AdQSM with reference measurements. Symbols and colors indicated the value of each study site. The error bar was the standard deviation of the QSM model implementation for each tree. The blue line represented the fitted linear regression model between the estimated value of AdQSM and the reference value, and the orange–red band represented the 95% confidence interval of the regression.

Figure 12.
Residual distribution of AGB.


Table 1.
Descriptions of the study sites.
| Study Site | Peruvian | Indonesian | Guyanese |
|---|---|---|---|
| Number of plots | 9 | 10 | 10 |
| Forest type | Lowland tropical moist terrestrial forest | Peat swamp forest | Lowland tropical moist forest |
| Region | Madre de Dios. Southwestern Amazon | Mentaya River | Vaitarna Holding’s concession |
| Lat/long | −12.27 lat −69.10 long | −2.41 lat 113.13 long | 6.04 lat −58.70 long |
| Mean elevation | 312 m | 22 m | 117 m |
| Mean yearly rainfall | 2074 mm | 2616 mm | 2195 mm |
| Mean stem density (DBH > 10 cm) | 565 stems/ha | 1314 stems/ha | 516 stems/ha |
| Mean DBH harvested trees (SD) | 90.0 cm (22.2 cm) | 58.4 cm (18.2 cm) | 73.7 cm (12.0 cm) |
Table 2.
Tree species information of the study site.
| Study Site | Peruvian | Indonesian | Guyanese |
|---|---|---|---|
| Species | Buchenavia macrophylla | Tetramerista glabra | Jupunba |
| Dacryodes peruviana | Parastemon urophyllus | Coutinhoi | |
| Couratari macrocarpa | Cratoxylon glaucum | Grandiflora | |
| Sloanea eichleri | Shorea | Falcata | |
| Pterygota amazonica | Aglaia rubiginosa | ||
| Pseudopiptadenia suaveolens | Diospyrosevena | ||
| Nectandra longifolia | Shorea teysmanniana |
Table 3.
Tree information for estimating AGB.
| TreeID | Species | Leaf (kg) | Fruit (kg) | Total Mass (Mg) | Average Basic Wood Density (g/cm3) |
|---|---|---|---|---|---|
| IND01_054 | Tetramerista glabra | 26.03993 | 0 | 1.14847 | 0.538393614 |
| IND02_067 | Tetramerista glabra | 44.87053 | 0.67993 | 1.91689 | 0.521418157 |
| IND03_088 | Tetramerista glabra | 44.74779 | 0 | 3.53473 | 0.585573601 |
| IND04_109 | Parastemon urophyllus | 3.239637 | 0 | 1.39142 | 0.755107967 |
| IND05_080 | Cratoxylon glaucum | 7.52838 | 0 | 0.58864 | 0.519649557 |
| IND07_083 | Shorea | 99.88965 | 0 | 10.56921 | 0.571111339 |
| IND08_076 | Aglaia rubiginosa | 88.95909 | 0 | 3.25224 | 0.535991173 |
| IND09_067 | Diospyrosevena | 53.78951 | 0 | 4.50203 | 0.754525263 |
| IND10_149 | Shorea teysmanniana | 0 | 0 | 1.47877 | 0.54 |
| IND11_104 | Shorea | 64.77693 | 0 | 9.97840 | 0.543427109 |
Table 4.
Parameter Pacthdiam settings in this article.
| Study Site | Peruvian | Indonesian | Guyanese |
|---|---|---|---|
| PatchDiam1 | 0.12 | 0.08 | 0.1 |
| PatchDiam2Min | 0.04 | 0.02 | 0.01 |
| PatchDiam2Max | 0.07 | 0.07 | 0.07 |
Table 5.
Comparison of DBH and tree height accuracy using the AdQSM model and destructive sampling tree measurement.
Table 5.
Comparison of DBH and tree height accuracy using the AdQSM model and destructive sampling tree measurement.
| Category | Bias | rBias (%) | RMSE | rRMSE (%) |
|---|---|---|---|---|
| DBH (cm) | −3.68 | −5.01 | 6.65 | 9.06 |
| Height (m) | 0.63 | 1.88 | 1.93 | 5.79 |
Table 6.
Accuracy comparison of tree volume obtained by AdQSM and destructive sampling trees.
| QSM Type | Bias(m3) | rBias (%) | RMSE(m3) | rRMSE (%) |
|---|---|---|---|---|
| TreeQSM | −1.135 | −9.69% | 2.719 | 23.20 |
| AdQSM | 0.818 | 6.98% | 2.651 | 22.62 |
Table 7.
Comparison of accuracy of branch volume obtained by AdQSM and destructive sampling tree.
| Category | Bias | rBias (%) | RMSE | rRMSE (%) |
|---|---|---|---|---|
| Branches volume (m3) | 0.730 | 12.38 | 2.174 | 36.86 |
Table 8.
Comparison of the accuracy of AGB obtained by AdQSM and the geometric measurement of destructively sampled trees.
Table 8.
Comparison of the accuracy of AGB obtained by AdQSM and the geometric measurement of destructively sampled trees.
| Category | Bias | rBias (%) | RMSE | rRMSE (%) |
|---|---|---|---|---|
| AGB (Mg) | −0.43225 | −11.27 | 0.78146 | 20.37 |
© 2020 by the authors. Licensee MDPI, Basel, Switzerland. This article is an open access article distributed under the terms and conditions of the Creative Commons Attribution (CC BY) license (http://creativecommons.org/licenses/by/4.0/).
Share and Cite
MDPI and ACS Style
Fan, G.; Nan, L.; Dong, Y.; Su, X.; Chen, F. AdQSM: A New Method for Estimating Above-Ground Biomass from TLS Point Clouds. Remote Sens. 2020, 12, 3089. https://0-doi-org.brum.beds.ac.uk/10.3390/rs12183089
AMA Style
Fan G, Nan L, Dong Y, Su X, Chen F. AdQSM: A New Method for Estimating Above-Ground Biomass from TLS Point Clouds. Remote Sensing. 2020; 12(18):3089. https://0-doi-org.brum.beds.ac.uk/10.3390/rs12183089
Chicago/Turabian StyleFan, Guangpeng, Liangliang Nan, Yanqi Dong, Xiaohui Su, and Feixiang Chen. 2020. "AdQSM: A New Method for Estimating Above-Ground Biomass from TLS Point Clouds" Remote Sensing 12, no. 18: 3089. https://0-doi-org.brum.beds.ac.uk/10.3390/rs12183089
Note that from the first issue of 2016, this journal uses article numbers instead of page numbers. See further details here.