Article

Specific Bamboo Forest Extraction and Long-Term Dynamics as Revealed by Landsat Time Series Stacks and Google Earth Engine

1
College of Environmental and Resource Sciences, Zhejiang University, Hangzhou 310058, China
2
Department of Biological Sciences, National University of Singapore, Singapore 117543, Singapore
*
Author to whom correspondence should be addressed.
Remote Sens. 2020, 12(18), 3095; https://0-doi-org.brum.beds.ac.uk/10.3390/rs12183095
Submission received: 8 August 2020 / Revised: 17 September 2020 / Accepted: 19 September 2020 / Published: 21 September 2020

Abstract

:
Understanding the spatiotemporal dynamics of bamboo forests is of critical importance as it characterizes the interaction between forest and agricultural ecosystems and provides essential information for sustainable ecosystem management and decision-making. Thus far, the specific dynamics of moso bamboo (Phyllostachys edulis) and other bamboo are still unknown. In this study, we used temporal information extracted from Landsat time series stacks with Google Earth Engine (GEE) to characterize the spatiotemporal dynamics of bamboo forests, including moso bamboo and other bamboo, in Lin’an County, China, from 2000 to 2019. The bamboo forests were mapped in four periods: the early 2000s (2000–2004), the late 2000s (2005–2009), the early 2010s (2010–2014), and the late 2010s (2015–2019). The overall accuracy of these maps ranged from 97% to 99%. We then analyzed the spatiotemporal dynamics of the bamboo forests at the county and subdistrict/township scales, and probed the bamboo forest gain and loss with respect to the terrain features. Our findings show that bamboo forests increased by 4% from 2000 to 2014, followed by a sharp decrease of 13% in the late 2010s. The decrease was mainly caused by the loss of other bamboo. Approximately 69% of the bamboo forest gain occurred in non-bamboo forest areas, and the rest occupied non-forest areas. Bamboo forest loss was mainly due to conversion into orchard (59%) and forest plantation (22%). Compared to bamboo forest gain, bamboo forest loss was typically observed in areas with lower elevations and steeper slopes. Our study offers spatially explicit and timely insight into bamboo forest changes at the regional scale. The derived maps can be applied to study the drivers, consequences, and future trends of bamboo forest dynamics, which will contribute to sustainable ecosystem management.

Graphical Abstract

1. Introduction

Intensive forestry practices in the 21st century have resulted in dramatic changes to the world’s forested areas, especially subtropical forests [1]. Bamboo is one of the major types of forest in subtropical and tropical regions. Because of its economic value, bamboo has a long history of being cultivated as a tree crop. According to the National Forest Inventory (NFI) in China, the total bamboo forest area increased by 110.86% (3.04 to 6.41 million ha) from 1973 to 2018 [2]. Recently, a continuous long-term expansion of bamboo forests has generally occurred in mountainous areas during the intense forestry process, influencing forest and agricultural land cover changes as well as causing considerable challenges for eco-environmental protection [3,4]. Despite the merits of bamboo forests in helping to reduce poverty [5], mitigating climate change [6], and supporting essential wildlife habitats [7], the dramatic expansion of bamboo forests has also given rise to a number of negative impacts on local communities. One of the most striking issues is that, as bamboo forest gradually spreads to neighboring communities, it will become the dominant species in the canopy or understory layer, causing biodiversity loss and forest structure damage [8,9]. Understanding the spatiotemporal dynamics of bamboo forests is of critical significance in characterizing the interactions between forest and agricultural ecosystems as well as providing pertinent information for sustainable ecosystem management for the government. It is necessary to produce multiyear maps of bamboo forests to support studies on the drivers, impacts, and consequences of the related changes at the regional and continental scales.
As indicated by the NFI of China, there are two major types of bamboo forests, i.e., moso bamboo (Phyllostachys edulis) and other bamboo. The key differences between these two types of bamboo forests lie in (1) distribution proportion: according to the 9th NFI (2014–2018) [2], the proportion of moso bamboo (73%) is approximately three times that of other bamboo (27%); (2) tree height: moso bamboo, which grows up to 20 m high, is usually of a height similar to that of the arbor layer, while other bamboo generally has a height similar to that of the shrub layer; (3) ecosystem structure and function: their individual morphologies cause them to occupy distinct ecological niches in a community.
However, the maps from the NFI and the Forest Resources Inventory (FRI) at the county level are not yet accessible by the general public and exhibit spatiotemporal inconsistencies; therefore, information on how bamboo forests have changed over the years is lacking. In addition, in the bulk of existing studies, bamboo forests have been mapped as a uniform type, without subdivision at the species level [3,10]. Consequently, the specific dynamics of moso bamboo and other bamboo remain unknown.
Satellite images and machine learning techniques offer a viable and promising solution for monitoring the long-term dynamics of forests [1,11]. A continually increasing number of land cover mappings have been conducted, including vegetation types at the tree species level [12]. In particular, spectral information from time series satellite images, which has been used in many studies to map forests [1,13] and crops [14,15], shows diverse trends in vegetation. However, at the same time, the enormous volume of collected data poses challenges for storage and analysis. Currently, the free-to-use Google Earth Engine (GEE) cloud-based platform provides capabilities for utilizing and analyzing geospatial big data [16]. Nevertheless, most studies have mapped bamboo forests using the spectral information extracted from single date imageries [10,17,18] or seasonal composites [3,19,20], which limits the ability to monitor the long-term dynamics of bamboo forests at large scales. The potential of using Landsat time series data to monitor the dynamic characteristics of moso and other bamboo forests at the regional scale in GEE is still unknown.
The overall aim of this study was to extract the spatiotemporal dynamics of subtropical bamboo forests over the past two decades using Landsat time series in the GEE platform. Specifically, we extracted temporal features based on all available Landsat images to map two types of bamboo forests (i.e., moso bamboo and other bamboo) using random forest models for four periods: the early 2000s (2000–2004), the late 2000s (2005–2009), the early 2010s (2010–2014), and the late 2010s (2015–2019). Then, we analyzed the spatiotemporal dynamics of the bamboo forests at the county and subdistrict/township spatial scales and investigated the bamboo forest gain and loss during 2000–2019 with respect to terrain features.

2. Study Area and Datasets

2.1. Study Area

Lin’an (29°56′N–30°28′N, 118°50′E–119°53′E), a county in northwestern Zhejiang Province, China, was selected as the study area (Figure 1). It covers an area of 3118.8 km2 with a population of approximately 0.54 million [21]. Lin’an is a typical mountainous area with various types of bamboo forests, including moso bamboo, Lei bamboo (Phyllostachys praecox), Gaojie bamboo (P. prominens), etc. The elevation varies from 5 to 1771 m above sea level. It has a subtropical monsoon climate with an annual temperature of 9–16 °C and an annual precipitation of 1613.9 mm.
According to the FRI for Lin’an in 2017, broadleaf, bamboo, conifer, and hickory (Carya cathayensis) plantation areas contributed approximately 31%, 21%, 20% and 16%, respectively, of the entire vegetation coverage. Other contributing vegetation included broadleaf-conifer mixed forest, shrub, and cropland. The spatial distribution of vegetation types is shown in Supplementary Figure S1.

2.2. Time Series Landsat Images

In this study, 30-m Landsat surface reflectance (SR) images (path/row: 119/039, 120/039) acquired from January 2000 to December 2019 were used. All available SR images, 1003 in total, derived from the Landsat 5 Thematic Mapper (TM), Landsat 7 Enhanced Thematic Mapper Plus (ETM+), and Landsat 8 Operational Land Imager (OLI)/Thermal Infrared Sensor (TIRS) instruments, were selected in GEE. These SR products were developed by the U.S. Geological Survey (USGS, http://earthexplorer.usgs.gov/) and were atmospherically corrected using the Landsat Ecosystem Disturbance Adaptive Processing System (LEDAPS) (Landsat 5 and 7) [22] and the Land Surface Reflectance Code (LaSRC) algorithm (Landsat 8). In addition, these images were accompanied by cloud, shadow and snow masks [23] for individual pixels, leaving the remaining clear observations.
Supplementary Figure S2 summarizes the numbers of Landsat 5/7/8 images used in this study. The distributions of these available scenes by month, by sensor and by path/row were all uneven. The pixels for some months did not have valid observations due to masks, the failure of Landsat 7, and other reasons.

2.3. Supplementary Data

The FRI relies mainly on field surveys and is updated at ten-year intervals to provide the dominant vegetation distributions in vector polygon format. The latest FRI map of Lin’an was completed in the summer of 2017. Seventeen major land cover categories are recorded, for instance, arbor, bamboo, shrub, cropland, water body, built-up land, logged land and burned area. This map also provides detailed information on the spatial distributions of various types of bamboo forests, including moso bamboo, Lei bamboo, Gaojie bamboo and so on.
We designed 10 land cover categories, which were extracted from the FRI map and are referred to as the initial classes (Table 1). The training and validation points of interest (POIs) were obtained from the detailed FRI map for 2017 and Google Earth (GE) images acquired from 2000–2020. For each period, we randomly generated 6500 POIs for different homogenous classes based on a stratified random sampling design [24]. The FRI map served as a critical reference for vegetation types. Each POI in the training and validation datasets was carefully examined by visual interpretation of the continuous high-resolution images from GE. On the whole, all the procedures aimed to ensure that the POIs were unmixed, stable and correctly classified during the four periods. Because relatively few GE images from 2000–2010 were available for our study area, POIs for the 2000s were also collected using Landsat time series images. Finally, after visually cross-checking, 3383/2470, 3400/2452, 3594/2623 and 3644/2725 training/validation POIs were collected for the four periods of 2000–2004, 2005–2009, 2010–2014 and 2015–2019, respectively, that is, approximately 58% of POIs were collected for training each period. The details of the numbers of POIs corresponding to the different initial classes are shown in Supplementary Table S1.
A 30-m digital elevation model (DEM) was obtained from the Shuttle Radar Topography Mission (SRTM) [25] in GEE. The terrain features (elevation and slope) were calculated from the DEM. In our study area, the elevation ranges from 5 to 1771 m above sea level (Figure 1), and the slope is below 80°.

3. Methods

Figure 2 presents our framework for analyzing the dynamics of two types of bamboo forests over the past 20 years. First, temporal features were extracted from monthly composites of five spectral indices. Second, the extracted temporal features were processed with a random forest classifier to map moso bamboo and other bamboo for each period. Third, we analyzed and revealed the spatiotemporal dynamic characteristics of the bamboo forests.

3.1. Temporal Feature Extraction

The temporal features of vegetation, regarded as signals of plant growth, usually have a periodic pattern and vary with species. These features can be extracted from time series spectral information.
In this study, a total of five spectral indices were calculated for individual pixels from January 2000 to December 2019 in GEE, namely, the normalized difference vegetation index (NDVI) [26], the normalized difference moisture index (NDMI) [27], the enhanced vegetation index (EVI) [28], the normalized difference water index 1 (NDWI1) [29] and the normalized difference water index 2 (NDWI2) [30]. These indices are generally used for vegetation classification, and some have been shown to be useful for bamboo mapping specifically [3,4,17]. NDVI and EVI are sensitive to vegetation greenness. NDMI has the potential to detect the vegetation canopy water content [27]. NDWI1 and NDWI2 are related to water, bare soil, and vegetation status [29,30,31]. The equations for these indices are as follows:
NDVI = N R N + R
NDMI = N S W I R 1 N + S W I R 1
EVI = 1.5 N I R R N I R + 6 R 7.5 B + 1
NDWI 1 = G N G + N
NDWI 2 = R S W I R 1 R + S W I R 1
where B, G, R, NIR, and SWIR1 are the Landsat SR values in the blue, green, red, near infrared, and short-wave infrared 1 bands, respectively.
To substantially reduce the uncertainties caused by the quantity and quality of the images or other factors, image composites were produced for five-year intervals from 2000 to 2019. The four corresponding periods are identified as the early 2000s (2000–2004), the late 2000s (2005–2009), the early 2010s (2010–2014), and the late 2010s (2015–2019). For each composite, the monthly values of the five spectral indices were calculated as the mean value of all observations within the interquartile range in the corresponding month for each pixel. When there were fewer than four valid observations for a given month, a situation referred to as an unclear month, the corresponding index was replaced by the mean value of all observations within the interquartile range for the previous and subsequent months. In some extreme cases where there were 3 consecutive unclear months, we replaced the corresponding index with the mean value of all observations within the interquartile range for the month after next and the month before last. In this way, we were able to ensure that the monthly composite values for each pixel were the best representative values for each month.

3.2. Random Forest Classification

Random forest (RF) classifiers [32] were calibrated on the training samples (Supplementary Table S1) using the extracted temporal features as the input features to create our bamboo forest maps for each of the four periods separately. An RF classifier is a highly efficient classifier for a large amount of data and is robust against imbalanced input features [33]. Conveniently, only two main parameters need to be set for RF classification: the number of classification trees and the number of selected input features to be used to split each node. To achieve a suitable balance between classification accuracy and computation time, we selected an RF model with 200 classification trees and the square root of the total number of input features for splitting after various tests of these parameters for our study area. The initial output of the RF classifier for each period was a 10-class (Table 1) land cover map, including moso bamboo and other bamboo. Then, the initial classes were reclassified into 4 classes, referred to as the reclassified classes (Table 1). We used the maps based on these reclassified classes, i.e., the bamboo forest maps, for further analysis.

3.3. Accuracy Assessment and Area Comparison

The accuracy of bamboo forest mapping was then assessed using the confusion matrix based on the validation samples for each period (Supplementary Table S1). The F1-score was calculated for the 10 initial classes as shown in Equation (6). The frequently employed kappa indices have been criticized for being misleading or flawed for map production [34], and therefore, were not used. The overall accuracy (OA), producer’s accuracy (PA), user’s accuracy (UA), allocation disagreement (AD), and quantity disagreement (QD) [34] were calculated for the 4 reclassified classes.
F 1 = 2 P A U A P A + U A
Furthermore, to evaluate the area accuracy of our classification results, we compared the areas of the two types of bamboo forests derived from our results for the late 2010s against the FRI map from 2017 at the subdistrict/township scales.

3.4. Analyzing the Spatiotemporal Dynamics of Bamboo Forests

To further analyze the dynamics of bamboo forests, we reclassified all land cover categories into non-bamboo forest, bamboo forest and non-forest. Based on the observed trends, land cover changes were divided into five types: (1) stable: the area of non-bamboo forest/bamboo forest/non-forest was unchanged, or only intra-class changes (e.g., from cropland to orchard) occurred; (2) bamboo forest gain: the area of non-bamboo forest or non-forest was changed to bamboo forest, or the area of bamboo forest was changed to non-forest and then back to bamboo forest (e.g., from other bamboo to cropland to other bamboo); (3) non-forest gain: the area of non-bamboo forest or bamboo forest was changed to non-forest, or the area of non-bamboo forest was changed to bamboo forest and then back to non-forest; (4) forest plantation: the area of bamboo forest or non-forest was changed to non-bamboo forest, or the area of non-bamboo forest was changed to bamboo forest/non-forest and then back to non-bamboo forest; and (5) unknown: areas were changed in an uncertain manner as a result of classification errors.
We also investigated the area dynamics of the bamboo forests along gradients in elevation (50 m intervals) and slope (5° intervals). Three elevation ranges were used, as follows: low (elevation ≤ 100 m), medium (100 m < elevation ≤ 300 m), and high (elevation > 300 m). The slope gradients were also divided into three classes: gentle (slope ≤ 10°), moderate (10° < slope ≤ 25°), and steep (slope > 25°).

4. Results

4.1. Accuracy Assessment and Area Comparison

The assessment results revealed that the accuracy and robustness were reasonably satisfactory for most initial classes (Supplementary Table S2). The F1-scores for moso bamboo and other bamboo were all greater than 90% in the four periods (Table 2). The major classification errors were commission errors for other bamboo and mixed forest and for moso bamboo, mixed forest, and shrub (Supplementary Table S2).
Furthermore, Table 2 also shows excellent classification performance in terms of the UA and PA for the reclassified classes in the different periods. High OAs of 97%, 99%, 98%, and 97%, low ADs of 0.02, 0.00, 0.00, and 0.02, and QDs of 0.01, 0.01, 0.02, and 0.01were achieved for the reclassified classes in the early 2000s, late 2000s, early 2010s and late 2010s, respectively. In most periods, the UAs for moso bamboo were slightly higher than the PAs, suggesting larger errors of omission than commission. By contrast, the UAs for other bamboo were lower than the PAs. These results imply that these bamboo forest maps were comparable and could satisfactorily reflect the dynamics of the bamboo forests in the study area over the past 20 years.
We compared our late 2010s bamboo forest map with the bamboo forest map obtained from the FRI for 2017 (Figure 3). The spatial distributions of the four reclassified classes in these two products were in visually satisfactory agreement (Figure 3a,b). At the subdistrict/township level, our classification results showed good agreement with the FRI, with acceptable R2 values for both moso bamboo (0.72) and other bamboo (0.68) (Figure 3d,e). Nevertheless, the slopes of 0.91 and 1.36 revealed a slight difference between these two products. Therefore, two zoom-in regions (black boxes in Figure 3a,b) were selected for analysis. The comparison showed some discrepancies between the two types of bamboo forests in the case regions. Therefore, we selected another two zoom-in views (white boxes in Figure 3g,i and Figure 3k,m) for further analysis based on GE images. Figure 3h,l and Figure 3j,n show the distributions of moso bamboo and other bamboo in the zoom-in views extracted from our map and the FRI map, respectively. For the background of the figure panels, we used the same images from GE, dated 3 November 2017 (Figure 3h,j) and 9 November 2017 (Figure 3l,n), respectively. This comparison implies that the FRI map is missing/containing some other bamboo areas in cropland areas, whereas our map contains some classification errors for moso bamboo caused by mixed pixels. These may result in some differences in area estimates between these two maps.

4.2. Bamboo Forest Map for the Late 2010s

Figure 4 presents the spatial distributions of the two types of bamboo forests (moso bamboo in red and other bamboo in yellow), non-bamboo forest, and non-forest in the late 2010s. Recently, bamboo forests were widely distributed in eastern Lin’an, such as in the BQ, THY and TMS townships. Moso bamboo was present mainly in four clusters, in northeastern, southeastern, northwestern and southwestern Lin’an. The northeastern cluster mainly covered GH and QSH. The southeastern cluster included LL, JN and BQ. The southwestern cluster mainly covered TK and QC, while the northwestern cluster mainly covered LG and CH. By contrast, other bamboo was located in almost all subdistricts/townships. Critical percentages of moso bamboo (52%) and other bamboo (59%) were concentrated at medium elevations (Figure 4c). Compared with other bamboo clusters, moso bamboo clusters were observed on relatively steep slopes (Figure 4d). Most of the bamboo forests were adjacent to rural settlements, with other bamboo being generally planted on cropland.

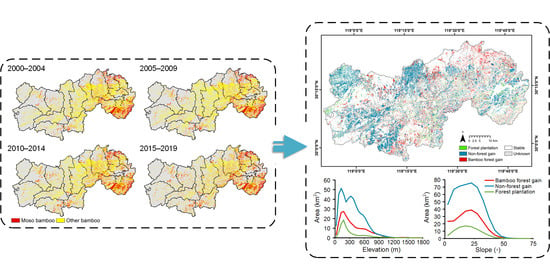
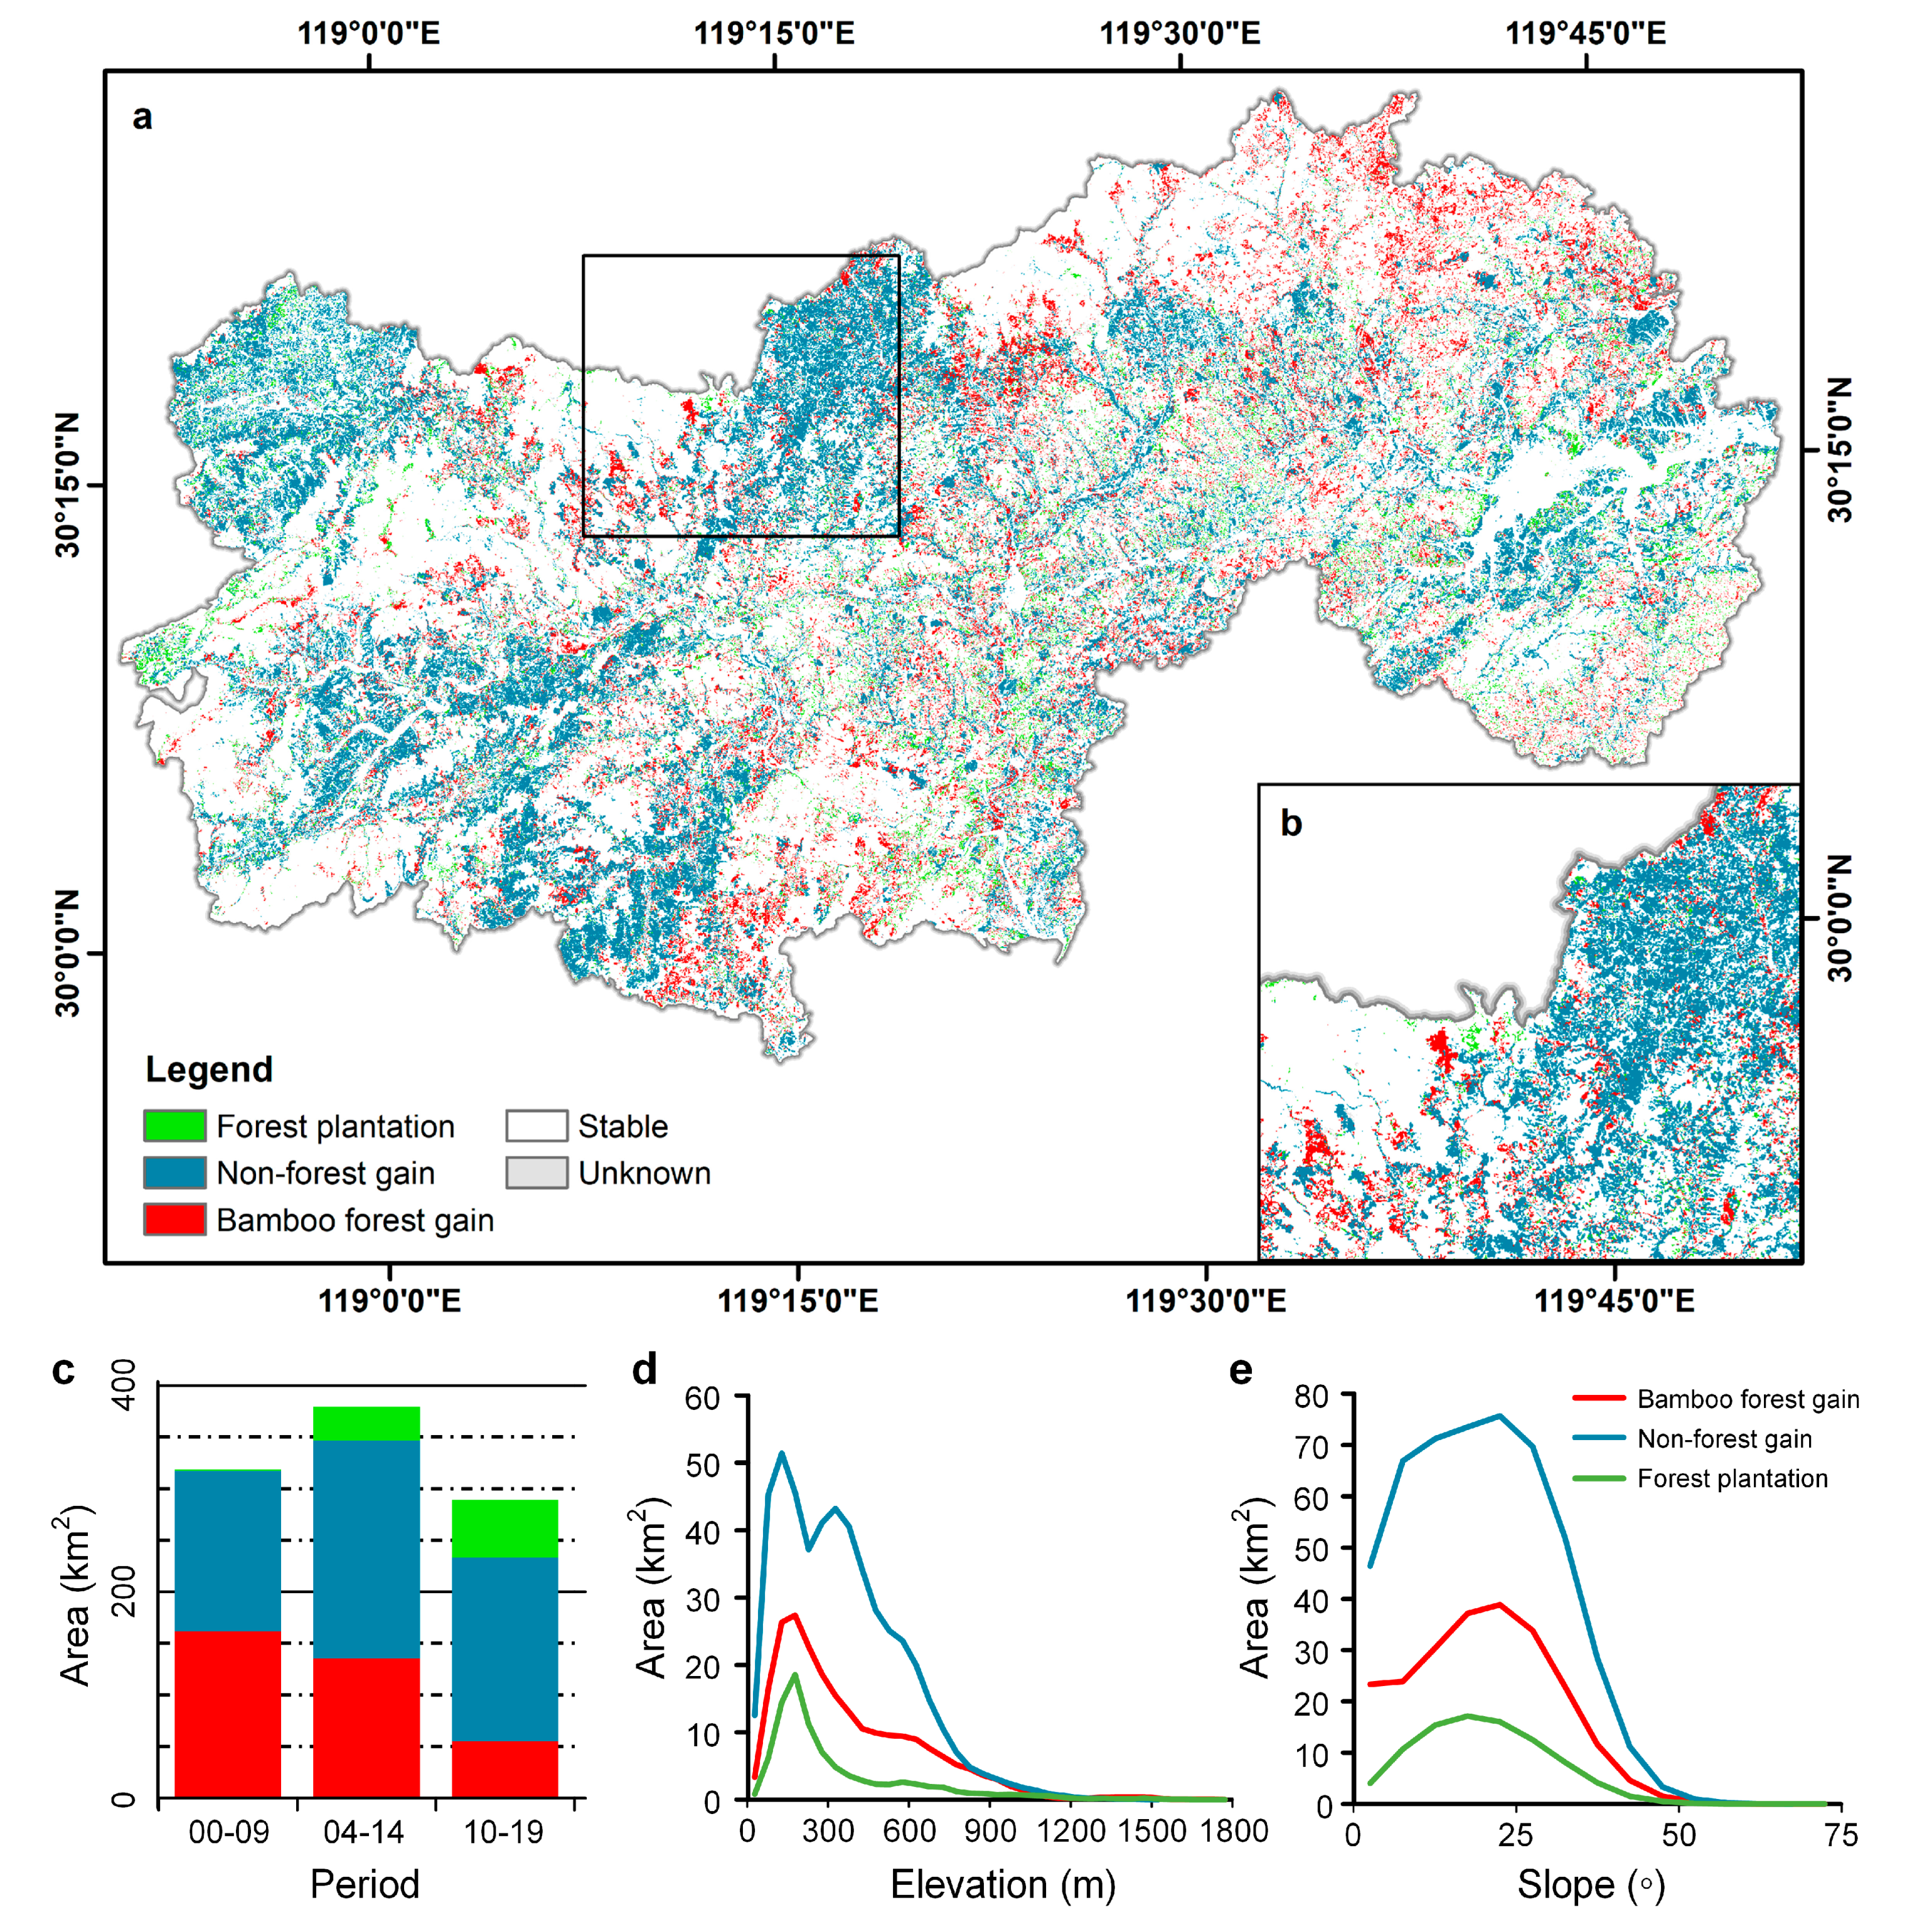
4.3. Spatiotemporal Dynamics of Bamboo Forests

Figure 5 presents the bamboo forest maps for the past two decades, each covering an interval of five years. Overall, moderate bamboo area changes were observed during the study period from 2000 to 2019 (Figure 5i). Bamboo forests increased by 4% from 2000 (845 km2) to 2014 (877 km2), followed by a sharp decrease of 13% to 763 km2 in the late 2010s. The main bamboo forest losses occurred in TMS, JN, LL and TY. An inspection of the two types of bamboo forests showed that moso bamboo increased by 22% (203 to 248 km2) from 2000 to 2019. Other bamboo increased from 642 km2 in the early 2000s to 674 km2 in the late 2000s and then decreased to 515 km2 in the late 2010s. These findings indicate that the decrease in bamboo forests was mainly caused by the loss of other bamboo. The newly planted moso bamboo widely occurred in QSH, LL, JB, and QC, while notable losses in other bamboo were observed in LL, TMS, QSH, JB, and JN.
Figure 6 provides an insight into the characteristics of the dynamics of bamboo forests in terms of the types of land cover changes occurring over the past two decades. Most areas remained unchanged, or only intra-class changes occurred (stable, 70.2%), while the least amount of area was changed to non-bamboo forest (forest plantation, 2.9%). In addition, bamboo forest gain, non-forest gain, and unknown accounted for 7.3%, 16.0%, and 3.5% of the total area, respectively. For bamboo forest gain, changes from non-bamboo forest (69%) were over twice as prevalent as changes from non-forest (31%). Note that approximately 91% of these non-forest areas were changed into areas of other bamboo. Changes from bamboo forest to non-forest and from non-bamboo forest/non-forest to bamboo forest and then back to non-forest contributed approximately 63% of the non-forest gain. Moreover, changes from bamboo forest to non-bamboo forest and from non-bamboo forest to bamboo forest and then back to non-bamboo forest accounted for approximately 79% of forest plantation. Figure 6c shows the areas of the different types of changes (bamboo forest gain, non-forest gain and forest plantation) in the different periods. There was a declining trend in the bamboo forest gain throughout the whole period.
The terrain features of the bamboo forest dynamics from 2000 to 2019 were analyzed along both elevation and slope gradients (Figure 6d,e). The results reveal that bamboo forest gain was concentrated in areas with medium elevations or moderate slopes. Specifically, the newly planted bamboo forests in non-bamboo forest areas tended to be at higher elevations and on steeper slopes than those in non-forest areas (Supplementary Figure S3). By contrast, an obvious bamboo forest loss was observed in non-bamboo forest and non-forest areas at low and medium elevations (Supplementary Figure S3a). Non-bamboo forest areas with moderate slopes and non-forest areas with gentle slopes widely experienced bamboo forest loss during 2000–2019 (Supplementary Figure S3b).

5. Discussion

Bamboo forest mapping is vital to forestry and agricultural resource management and biodiversity. The rapid forestry process of bamboo forests in China’s subtropical regions has led to frequent conversion on agriculture-forest frontiers. This study has attempted to reveal the spatiotemporal dynamic characteristics of two typical types of bamboo forests at a regional scale over the past two decades, based on a combination of Landsat time series stacks, the GEE platform and a machine learning method. The adopted methodology exhibits the potential to be repeatedly used for bamboo forest time series analyses and to be extended to the extraction of other plant species by adjusting the features input into the classifier. The generated maps clearly show that bamboo forest gain and loss, indicating intensive forestry practices, were observed in all subdistricts/townships in the study area during 2000–2019.
The dynamics of bamboo forests represent a good example of the changes in cash crops occurring in subtropical areas. In our study area, one of the core tasks of local forestry production in the early 2000s was to promote the development of both economic forests and ecological forests [35]. By 2019, the total value of the agricultural output of Lin’an had increased from 1.86 billion yuan in 2003 to 6.69 billion yuan, of which the bamboo shoot, hickory and fruit industries accounted for 33.3%, 18.6%, and 8.5%, respectively [35,36]. These observations suggest that local policy is a fundamental determinant of cash crop growth and distribution. As our results show, approximately 159 km2 of non-bamboo forest area and 50 km2 of non-forest area were changed into bamboo forest area over the past two decades. These phenomena are consistent with previous studies, which have reported a clear impact of cash crop expansion on both forestry and agricultural areas in subtropical China [3,37,38]. Bamboo forest gain and distribution mainly occurred in relatively low-elevation regions with gentle and moderate slopes (Figure 4 and Figure 6). Approximately 11% of the cropland in Lin’an experienced bamboo forest gain from 2000 to 2019. This finding indicates that some natural habitats and croplands with high soil quality were probably occupied by newly planted bamboo forests, challenging the sustainability of biodiversity conservation and grain production [39]. Moreover, a considerable proportion of bamboo forests were converted into orchard (constituting approximately 59% of bamboo forest loss) since orchard had a higher economic value than bamboo forests. Economic gain plays a key role in land conversion [38]. Remarkably, approximately 30% of bamboo forest gain was observed in non-bamboo forest areas with steep slopes. According to our results, in the late 2010s, a great number of bamboo forests (27%) and orchard (41%) were planted on steep slopes. Because few understory plants grow in these regions, such expansion of these cash crops will lead to soil erosion and landscape fragmentation [40,41]. This implies that the terrain features of cash crop areas should be considered in forest management. Although an increasing attention has been paid to ecosystem health, the increased extent of forest plantation is still not comparable to the expansion of cash crops. Our study reveals a rapid expansion of these cash crops in Lin’an during 2000–2019. Our results therefore call for a better balance between promoting the forestry production of cash crops and protecting natural resources.
In this study, only spectral indices were used in the RF classifier. Ideally, the spectral information used for classification should have spatial and temporal consistency. However, the uneven quantity and quality of Landsat images pose great challenges for land monitoring applications [42]. In this study, approximately 50% of the pixels were affected by at least one unclear month over the four periods (Supplementary Figure S4). Although SR products have shown small differences between the comparable sensor bands and indices [43], no transformation was applied to integrate the data in our study. Instead, to alleviate the uncertainties, we calculated the mean value of all observations within the interquartile range for each month. The errors in our maps can also be attributed to the limited availability of reference data. Due to the lack of available high-resolution images acquired during 2000–2010, some POIs for this time period were collected using historical Landsat images. It was difficult to select unmixed pixels for reference across the complex landscape at a 30 m spatial resolution. Nevertheless, even with these multiple sources of uncertainties, high classification accuracies were achieved in the bamboo forest maps. The results also illustrate the robustness of the classifier against some uncertainties in the composite images. At present, limited at both the spatial and temporal scales, this study has produced bamboo forest maps of Lin’an for 2000 to 2019. The Landsat SR data can serve as an improved data source for long-term monitoring, and the GEE platform offers the flexibility to collect and process related data from the 1980s to the present. Thus, maps of the long-term bamboo forest dynamics since the 1980s could be produced at large scales in the future to conduct relevant studies.

6. Conclusions

Accurate spatiotemporal distribution data for bamboo forests can be pivotal for supporting sustainable ecosystem management and biodiversity conservation. To date, long-term dynamic maps of moso and other bamboo forests at the regional scale have been unavailable, limiting our ability to understand the spatiotemporal dynamic characteristics of bamboo forests and to predict their dynamic trends. In our study, we have addressed this problem by using a pixel-based machine learning method to map these two types of bamboo forests in a subtropical area from 2000 to 2019 on the basis of 1003 Landsat 5/7/8 images and the GEE platform. The bamboo forest maps were generated for five-year intervals over the past two decades. We then analyzed the spatiotemporal dynamics of the bamboo forests at the county and subdistrict/township levels and probed the bamboo forest gain and loss along both elevation and slope gradients. In future studies, it will be necessary to trace the bamboo forest dynamics in subtropical areas back to the 1980s and to investigate the causes and consequences of the bamboo forest dynamics inferred from the derived maps.

Supplementary Materials

The following are available online at https://0-www-mdpi-com.brum.beds.ac.uk/2072-4292/12/18/3095/s1, Figure S1: Spatial distribution of vegetation types in Lin’an, which was developed from the Forest Resources Inventory (FRI) product in 2017, Figure S2: The annual numbers of Landsat surface reflectance images used in this study by (a) month, (b) sensor, and (c) path/row, Figure S3: The area dynamics of the different types of changes along elevation (a) and slope (b) gradients throughout the whole period, Figure S4: Percentages of valid observations in the four periods, Table S1: The numbers of POIs in the training and validation datasets for different periods, Table S2: Error matrices of F1-score values (%) for the initial classes in the four periods.

Author Contributions

Funding acquisition, J.D.; methodology, S.Y.; supervision, J.D. and K.W.; visualization, S.Y. and C.L.; writing—original draft, S.Y. and Q.Z.; writing—review & editing, Y.L., C.Z. and K.W. All authors have read and agreed to the published version of the manuscript.

Funding

This research was funded by the Zhejiang Provincial Natural Science Foundation of China, grant number LY18G030006; and the Ministry of Science and Technology of the People’s Republic of China, grant number 2016YFC0503404.

Conflicts of Interest

The authors declare no conflict of interest.

References

  1. Hansen, M.C.; Potapov, P.V.; Moore, R.; Hancher, M.; Turubanova, S.A.; Tyukavina, A.; Thau, D.; Stehman, S.V.; Goetz, S.J.; Loveland, T.R.; et al. High-resolution global maps of 21st-century forest cover change. Science 2013, 342, 850–853. [Google Scholar] [CrossRef] [PubMed] [Green Version]
  2. National Forestry and Grassland Administration. Forest Resources in China-The 9th National Forest Inventory; National Forestry and Grassland Administration: Beijing, China, 2019.
  3. Li, M.N.; Li, C.C.; Jiang, H.; Fang, C.Y.; Yang, J.; Zhu, Z.L.; Shi, L.; Liu, S.R.; Gong, P. Tracking bamboo dynamics in Zhejiang, China, using time-series of Landsat data from 1990 to 2014. Int. J. Remote Sens. 2016, 37, 1714–1729. [Google Scholar] [CrossRef]
  4. Zhao, Y.Y.; Feng, D.L.; Jayaraman, D.; Belay, D.; Sebrala, H.; Ngugi, J.; Maina, E.; Akombo, R.; Otuoma, J.; Mutyaba, J.; et al. Bamboo mapping of Ethiopia, Kenya and Uganda for the year 2016 using multi-temporal Landsat imagery. Int. J. Appl. Earth Obs. Geoinf. 2018, 66, 116–125. [Google Scholar] [CrossRef]
  5. Pérez, M.R.; Rodriguez, L.G.; Yang, X.; Xie, J.; Fu, M. From basic raw material goods to cultural and environmental services: The chinese bamboo sophistication path. Ecol. Soc. 2014, 19, 3. [Google Scholar] [CrossRef]
  6. Dai, W.; Fu, W.; Jiang, P.; Zhao, K.; Li, Y.; Tao, J. Spatial pattern of carbon stocks in forest ecosystems of a typical subtropical region of southeastern China. For. Ecol. Manag. 2018, 409, 288–297. [Google Scholar] [CrossRef]
  7. Linderman, M.; Liu, J.; Qi, J.; An, L.; Ouyang, Z.; Yang, J.; Tan, Y. Using artificial neural networks to map the spatial distribution of understorey bamboo from remote sensing data. Int. J. Remote Sens. 2004, 25, 1685–1700. [Google Scholar] [CrossRef]
  8. Bai, S.; Wang, Y.; Conant, R.T.; Zhou, G.; Xu, Y.; Wang, N.; Fang, F.; Chen, J. Can native clonal moso bamboo encroach on adjacent natural forest without human intervention? Sci. Rep. 2016, 6, 31504. [Google Scholar] [CrossRef] [Green Version]
  9. Lima, R.A.F.; Rother, D.C.; Muler, A.E.; Lepsch, I.F.; Rodrigues, R.R. Bamboo overabundance alters forest structure and dynamics in the Atlantic Forest hotspot. Biol. Conserv. 2012, 147, 32–39. [Google Scholar] [CrossRef]
  10. Du, H.; Mao, F.; Li, X.; Zhou, G.; Xu, X.; Han, N.; Sun, S.; Gao, G.; Cui, L.; Li, Y.; et al. Mapping global bamboo forest distribution using multisource remote sensing data. IEEE J. Sel. Top. Appl. Earth Obs. Remote Sens. 2018, 11, 1458–1471. [Google Scholar] [CrossRef]
  11. Feng, M.; Sexton, J.O.; Huang, C.Q.; Anand, A.; Channan, S.; Song, X.P.; Song, D.X.; Kim, D.H.; Noojipady, P.; Townshend, J.R. Earth science data records of global forest cover and change: Assessment of accuracy in 1990, 2000, and 2005 epochs. Remote Sens. Environ. 2016, 184, 73–85. [Google Scholar] [CrossRef] [Green Version]
  12. Fassnacht, F.E.; Latifi, H.; Stereńczak, K.; Modzelewska, A.; Lefsky, M.; Waser, L.T.; Straub, C.; Ghosh, A. Review of studies on tree species classification from remotely sensed data. Remote Sens. Environ. 2016, 186, 64–87. [Google Scholar] [CrossRef]
  13. Griffiths, P.; Kuemmerle, T.; Baumann, M.; Radeloff, V.C.; Abrudan, I.V.; Lieskovsky, J.; Munteanu, C.; Ostapowicz, K.; Hostert, P. Forest disturbances, forest recovery, and changes in forest types across the Carpathian ecoregion from 1985 to 2010 based on Landsat image composites. Remote Sens. Environ. 2014, 151, 72–88. [Google Scholar] [CrossRef]
  14. Luciano, A.C.D.; Picoli, M.C.A.; Rocha, J.V.; Franco, H.C.J.; Sanches, G.M.; Leal, M.R.L.V.; le Maire, G. Generalized space-time classifiers for monitoring sugarcane areas in Brazil. Remote Sens. Environ. 2018, 215, 438–451. [Google Scholar] [CrossRef]
  15. Zhong, L.H.; Gong, P.; Biging, G.S. Efficient corn and soybean mapping with temporal extendability: A multi-year experiment using Landsat imagery. Remote Sens. Environ. 2014, 140, 1–13. [Google Scholar] [CrossRef]
  16. Gorelick, N.; Hancher, M.; Dixon, M.; Ilyushchenko, S.; Thau, D.; Moore, R. Google Earth Engine: Planetary-scale geospatial analysis for everyone. Remote Sens. Environ. 2017, 202, 18–27. [Google Scholar] [CrossRef]
  17. Ying, W.; Jin, J.X.; Jiang, H.; Zhang, X.Y.; Lu, X.H.; Chen, X.F.; Zhang, J.M. Satellite-based detection of bamboo expansion over the past 30 years in Mount Tianmushan, China. Int. J. Remote Sens. 2016, 37, 2908–2922. [Google Scholar] [CrossRef]
  18. Han, N.; Du, H.; Zhou, G.; Sun, X.; Ge, H.; Xu, X. Object-based classification using SPOT-5 imagery for Moso bamboo forest mapping. Int. J. Remote Sens. 2014, 35, 1126–1142. [Google Scholar] [CrossRef]
  19. Zhang, M.N.; Gong, P.; Qi, S.H.; Liu, C.; Xiong, T.W. Mapping bamboo with regional phenological characteristics derived from dense Landsat time series using Google Earth Engine. Int. J. Remote Sens. 2019, 1–15. [Google Scholar] [CrossRef]
  20. Liu, C.; Xiong, T.; Gong, P.; Qi, S. Improving large-scale moso bamboo mapping based on dense Landsat time series and auxiliary data: A case study in Fujian Province, China. Remote Sens. Lett. 2017, 9, 1–10. [Google Scholar] [CrossRef]
  21. Lin’an Bureau of Statistics. Lin’an Statistical Yearbook; Lin’an Bureau of Statistics: Zhejiang, China, 2019. [Google Scholar]
  22. Schmidt, G.; Jenkerson, C.; Masek, J.; Vermote, E.; Gao, F. Landsat Ecosystem Disturbance Adaptive Processing System (LEDAPS) Algorithm Description; U.S. Geological Survey: Reston, VA, USA, 2013.
  23. Foga, S.; Scaramuzza, P.L.; Guo, S.; Zhu, Z.; Dilley, R.D.; Beckmann, T.; Schmidt, G.L.; Dwyer, J.L.; Hughes, M.J.; Laue, B. Cloud detection algorithm comparison and validation for operational Landsat data products. Remote Sens. Environ. 2017, 194, 379–390. [Google Scholar] [CrossRef] [Green Version]
  24. Olofsson, P.; Foody, G.M.; Herold, M.; Stehman, S.V.; Woodcock, C.E.; Wulder, M.A. Good practices for estimating area and assessing accuracy of land change. Remote Sens. Environ. 2014, 148, 42–57. [Google Scholar] [CrossRef]
  25. Farr, T.G.; Rosen, P.A.; Caro, E.; Crippen, R.; Duren, R.; Hensley, S.; Kobrick, M.; Paller, M.; Rodriguez, E.; Roth, L.; et al. The shuttle radar topography mission. Rev. Geophys. 2007, 45. [Google Scholar] [CrossRef] [Green Version]
  26. Rouse, J.W.; Haas, R.H.; Deering, D.W.; Schell, J.A. Monitoring the Vernal Advancement and Retrogradation (Green Wave Effect) of Natural Vegetation; NASA/GSFC: Greenbelt, MD, USA, 1974.
  27. Wilson, E.H.; Sader, S.A. Detection of forest harvest type using multiple dates of Landsat TM imagery. Remote Sens. Environ. 2002, 80, 385–396. [Google Scholar] [CrossRef]
  28. Huete, A.; Didan, K.; Miura, T.; Rodriguez, E.P.; Gao, X.; Ferreira, L.G. Overview of the radiometric and biophysical performance of the MODIS vegetation indices. Remote Sens. Environ. 2002, 83, 195–213. [Google Scholar] [CrossRef]
  29. McFeeters, S.K. The use of the normalized difference water index (NDWI) in the delineation of open water features. Int. J. Remote Sens. 1996, 17, 1425–1432. [Google Scholar] [CrossRef]
  30. Rogers, A.S.; Kearney, M.S. Reducing signature variability in unmixing coastal marsh Thematic Mapper scenes using spectral indices. Int. J. Remote Sens. 2004, 25, 2317–2335. [Google Scholar] [CrossRef]
  31. Peña-Barragán, J.M.; Ngugi, M.K.; Plant, R.E.; Six, J. Object-based crop identification using multiple vegetation indices, textural features and crop phenology. Remote Sens. Environ. 2011, 115, 1301–1316. [Google Scholar] [CrossRef]
  32. Breiman, L. Random forests. Mach. Learn. 2001, 45, 5–32. [Google Scholar] [CrossRef] [Green Version]
  33. Belgiu, M.; Dragut, L. Random forest in remote sensing: A review of applications and future directions. ISPRS J. Photogramm. Remote Sens. 2016, 114, 24–31. [Google Scholar] [CrossRef]
  34. Pontius, R.G.; Millones, M. Death to Kappa: Birth of quantity disagreement and allocation disagreement for accuracy assessment. Int. J. Remote Sens. 2011, 32, 4407–4429. [Google Scholar] [CrossRef]
  35. Lin’an Bureau of Statistics. Statistical Communiqué of Lin’an on the 2003 National Economic and Social Development; Lin’an Bureau of Statistics: Zhejiang, China, 2004. [Google Scholar]
  36. Lin’an Bureau of Statistics. Statistical Communiqué of Lin’an on the 2019 National Economic and Social Development; Lin’an Bureau of Statistics: Zhejiang, China, 2020. [Google Scholar]
  37. Li, Y.G.; Han, N.; Li, X.J.; Du, H.Q.; Mao, F.J.; Cui, L.; Liu, T.Y.; Xing, L.Q. Spatiotemporal Estimation of Bamboo Forest Aboveground Carbon Storage Based on Landsat Data in Zhejiang, China. Remote Sens. 2018, 10, 898. [Google Scholar] [CrossRef] [Green Version]
  38. Su, S.L.; Zhou, X.C.; Wan, C.; Li, Y.K.; Kong, W.H. Land use changes to cash crop plantations: Crop types, multilevel determinants and policy implications. Land Use Policy 2016, 50, 379–389. [Google Scholar] [CrossRef]
  39. Yi, Z.-F.; Wong, G.; Cannon, C.H.; Xu, J.; Beckschäfer, P.; Swetnam, R.D. Can carbon-trading schemes help to protect China’s most diverse forest ecosystems? A case study from Xishuangbanna, Yunnan. Land Use Policy 2014, 38, 646–656. [Google Scholar] [CrossRef]
  40. Godone, D.; Garbarino, M.; Sibona, E.; Garnero, G.; Godone, F. Progressive fragmentation of a traditional Mediterranean landscape by hazelnut plantations: The impact of CAP over time in the Langhe region (NW Italy). Land Use Policy 2014, 36, 259–266. [Google Scholar] [CrossRef] [Green Version]
  41. Li, G.; Cheng, Z.; Lu, D.; Lu, W.; Huang, J.; Zhi, J.; Li, S. Examining hickory plantation expansion and evaluating suitability for it using multitemporal satellite imagery and ancillary data. Appl. Geogr. 2019, 109, 102035. [Google Scholar] [CrossRef]
  42. Hansen, M.C.; Potapov, P.V.; Goetz, S.J.; Turubanova, S.; Tyukavina, A.; Krylov, A.; Kommareddy, A.; Egorov, A. Mapping tree height distributions in Sub-Saharan Africa using Landsat 7 and 8 data. Remote Sens. Environ. 2016, 185, 221–232. [Google Scholar] [CrossRef] [Green Version]
  43. Roy, D.P.; Kovalskyy, V.; Zhang, H.K.; Vermote, E.F.; Yan, L.; Kumar, S.S.; Egorov, A. Characterization of Landsat-7 to Landsat-8 reflective wavelength and normalized difference vegetation index continuity. Remote Sens. Environ. 2016, 185, 57–70. [Google Scholar] [CrossRef] [Green Version]
Figure 1. Location of the study area (Lin’an, China (a)). The coverage of the Landsat scenes (b) and the spatial distribution of the subdistricts/townships (c).
Remotesensing 12 03095 g001
Figure 2. Workflow of the analysis of bamboo forest dynamics over the past 20 years using Landsat time series stacks and Google Earth Engine.
Remotesensing 12 03095 g002
Figure 3. Comparison of the late 2010s bamboo forest map generated in this study (a) and the Forest Resources Inventory (FRI) map from 2017 (b). (cf) Area comparisons of the two maps at the subdistrict/township level. Linear fits with the intercept forced to 0. (g,i) and (k,m) show zoom-in regions of the two regions labeled 1, 2 in Figure 3a,b. (h,j) and (l,n) show zoom-in views of the regions indicated by the white boxes in (g,i) and (k,m). The background images for (h,j) and (l,n) are taken from Google Earth dated 3 November 2017 and 9 November 2017, respectively.
Remotesensing 12 03095 g003
Figure 4. (a) The bamboo forest map for the late 2010s. (b) A zoom-in view of one representative bamboo forest region, indicated by the circle in Figure 4a. (c,d) show the area distribution of bamboo forests in the late 2010s along elevation and slope gradients, respectively.
Remotesensing 12 03095 g004
Figure 5. (ad) The bamboo forest maps for the four periods. (eh) show zoom-in views corresponding to the black box in Figure 5a. (i) Bamboo forest areas in the four periods.
Remotesensing 12 03095 g005
Figure 6. (a) Pixel-based historical change map. (b) shows a zoom-in view of the region indicated by the black box in Figure 6a (the same as in Figure 5a). (c) shows the areas of different types of changes (bamboo forest gain, non-forest gain and forest plantation) in the different periods. (d,e) show the area dynamics along elevation and slope gradients throughout the whole period.
Remotesensing 12 03095 g006
Table 1. Land cover category descriptions.
Initial ClassDescriptionReclassified Class
Broadleaved forestForested land > 65% broadleaved canopy coverNon-bamboo forest
Coniferous forest Forested land > 65% coniferous canopy cover
Mixed forest Mosaic of broadleaved and coniferous forest species, with no single canopy greater than 65%
Shrub
Moso bambooPhyllostachys pubescensMoso bamboo
Other bambooBamboo forests except moso bamboo, primarily Lei bamboo (Phyllostachys praecox)Other bamboo
OrchardManaged plantation of nut or fruit trees, primarily hickory (Carya cathayensis)Non-forest
CroplandManaged plantation of crops
Water bodyLakes, water ponds and rivers
OthersBuilt-up land, logged land, burned area and so on
Table 2. Accuracy indices for the reclassified classes in the four periods. UA: user’s accuracy; PA: producer’s accuracy.
PeriodTypeF1-Score Value (%)UA (%)PA (%)
2015–2019Non-bamboo forest/9999
Moso bamboo909388
Other bamboo928994
Non-forest/9899
2010–2014Non-bamboo forest/10099
Moso bamboo919984
Other bamboo9184100
Non-forest/10099
2005–2009Non-bamboo forest/99100
Moso bamboo9896100
Other bamboo9810097
Non-forest/9998
2000–2004Non-bamboo forest/9997
Moso bamboo949693
Other bamboo969498
Non-forest/9698

