Article

MODIS and VIIRS Calibration and Characterization in Support of Producing Long-Term High-Quality Data Products

1
Sciences and Exploration Directorate, NASA Goddard Space Flight Center, Greenbelt, MD 20771, USA
2
Science Systems and Applications, Inc., 10210 Greenbelt Rd, Lanham, MD 20706, USA
*
Author to whom correspondence should be addressed.
Remote Sens. 2020, 12(19), 3167; https://0-doi-org.brum.beds.ac.uk/10.3390/rs12193167
Submission received: 26 August 2020 / Revised: 22 September 2020 / Accepted: 23 September 2020 / Published: 27 September 2020

Abstract

:
Terra and Aqua Moderate Resolution Imaging Spectroradiometer (MODIS) have successfully operated since their launches in 1999 and 2002, respectively, and generated various data products to support the Earth remote sensing disciplines and users worldwide for their research activities and applications, including studies of the Earth system, and its changes over time and geographic regions. The MODIS data have also significantly contributed to the continuity of multi-decadal satellite data records and led to major advances in the Earth remote sensing field. The long-term data records from MODIS observations have been and will continue to be extended by the Visible Infrared Imaging Radiometer Suite (VIIRS) instruments, currently operated aboard the Suomi-National Polar-Orbiting Partnership (NPP) and NOAA-20 satellites. The data quality of satellite instruments strongly depends on their calibration accuracy and stability. In order to help scientists and users gain a better understanding of MODIS and VIIRS data quality, this paper provides an overview of their on-orbit calibration methodologies, approaches, and results derived from instrument on-board calibrators and lunar observations, as well as select Earth view targets. What is also discussed is the calibration consistency between MODIS and VIIRS and its potential impact on producing multi-sensor long-term data records. As illustrated, the overall performance of both MODIS and VIIRS continues to meet their design requirements.

1. Introduction

The NASA’s Earth Observing System (EOS) Terra and Aqua Moderate Resolution Imaging Spectroradiometer (MODIS) have successfully operated for more than 20 and 18 years since their launches in December 1999 and May 2002, respectively. The MODIS instrument was developed to meet the growing demand of both the operational community and research disciplines in the remote sensing field by extending and enhancing the data records from a number of legacy Earth-observing sensors. These sensors include, but are not limited to, the NOAA’s Advanced Very High Resolution Radiometer (AVHRR), the Landsat Thematic Mapper (TM), the Nimbus 7 Coastal Zone Color Scanner (CZCS), and the NOAA’s High Resolution Infrared Radiation Sounder (HIRS). MODIS collects data in 36 spectral bands, covering wavelengths in the visible (VIS), near-infrared (NIR), short-wave infrared (SWIR), mid-wave infrared (MWIR), and long-wave infrared (LWIR) spectral regions, and at three moderate spatial resolutions [1,2,3]. In order to meet its stringent on-orbit calibration requirements, MODIS was designed with a set of advanced on-board calibrators (OBC) that can be operated to characterize sensor performance over its entire mission [4,5,6]. Operating in complementary morning (Terra) and afternoon (Aqua) orbits, MODIS observations and data products have enabled and advanced numerous research activities and applications for the studies of the Earth’s systems, including its land, oceans, atmosphere, and cryosphere, and its changes over different temporal scales and geographic regions [7,8,9,10,11].
The unprecedented amount of MODIS data, covering a wide spectral range from VIS to LWIR, have also significantly contributed to the continuity of many existing satellite data records over a multi-decadal period and led to major improvements in the Earth remote sensing methodologies and applications, which have benefited at different levels of the design and development of other Earth-observing sensors [12]. It is significant and vital that the long-term data records from MODIS observations have been, and will continue to be, extended by the Visible Infrared Imaging Radiometer Suite (VIIRS) instruments, two of which are currently operated aboard the Suomi National Polar-Orbiting Partnership (S-NPP) and NOAA-20 (N20) platforms launched in October 2011 and November 2017, respectively, and three of which will be launched on future Joint Polar Satellite System (JPSS) satellites [13]. The VIIRS was developed, designed, and built by the same instrument vendor with a strong MODIS heritage. As expected, lessons and experience learned from MODIS have greatly aided the VIIRS testing, operation, and calibration during different phases of the mission. The VIIRS Environmental Data Records (EDRs), mostly inherited from those developed for MODIS, provide operational support and scientific applications, such as disaster monitoring, weather prediction, and studies of the Earth’s environment and climate changes [13,14,15,16,17,18]. Together, MODIS and VIIRS observations will enable many key Earth remote sensing data records and studies over a multi-decadal period (2000–2040).
It has been extremely invaluable that the MODIS and VIIRS instruments are operated on platforms that carry other Earth-observing sensors. For example, the Terra spacecraft also carries the Advanced Space-borne Thermal Emission and Reflection Radiometer (ASTER), the Clouds and the Earth’s Radiant Energy System (CERES), the Multi-angle Imaging SpectroRadiometer (MISR), and the Measurements of Pollution in the Troposphere (MOPITT) [19]. In addition to VIIRS, the S-NPP spacecraft hosts the Advanced Technology Microwave Sounder (ATMS), the CERES, the Cross-track Infrared Sounder (CrIS), and the Ozone Mapping and Profiler Suite (OMPS) [13]. Concurrent and complementary measurements from sensors operated in different spectrums or at different viewing geometries have made MODIS and VIIRS data products extremely powerful and essential to further improve various scientific studies and investigations.
The data quality of a satellite instrument and its impact on various studies and applications strongly depends on the instrument’s calibration accuracy and stability. In order to ensure that the sensor design requirements could be met, both MODIS and VIIRS went through extensive pre-launch calibration and characterization using various ground-based testing equipment, measurement assemblies, and calibration targets or sources that were traceable to national or international standards. Key pre-launch calibration references and functions are transferred to their OBC so that the sensors’ performance and data quality could be monitored and maintained over their entire missions [20,21,22,23]. For MODIS, a dedicated team, the MODIS Characterization Support Team (MCST) at NASA Goddard Space Flight Center (GSFC), has been supporting the instrument calibration and characterization from pre-launch to on-orbit. The same team is also responsible for developing and maintaining the MODIS primary Level 1B (L1B) calibration algorithms, and for operating both Terra and Aqua MODIS instruments and scheduling various calibration activities. Similar teams, the VIIRS Characterization Support Team (VCST) at NASA GSFC, established based on the MODIS experience, and the NOAA VIIRS Sensor Data Records (SDR) team, provide calibration support for VIIRS instruments.
The objective of this paper is to provide an overview of MODIS and VIIRS on-orbit calibration methodologies, approaches, and results derived from the OBC and lunar observations, as well as select Earth view (EV) targets. In addition to performance assessments, this paper discusses key calibration algorithm improvements or strategy refinements made to address on-orbit changes in sensor characteristics and issues identified during MODIS and VIIRS mission operations. In the following, we provide a brief description of MODIS and VIIRS instrument background in Section 2, including key design specifications of their spectral bands, on-orbit calibration capability, and nominal operation considerations. An overview of MODIS and VIIRS reflective solar bands (RSB) and thermal emissive bands (TEB) on-orbit calibration algorithms is presented in Section 3. Section 4 demonstrates on-orbit performance of Terra and Aqua MODIS and S-NPP and N20 VIIRS instruments, including changes in their spectral band responses based on the OBC and lunar observations, and detector noise characterization. What is also discussed in Section 4 are special issues identified and addressed for individual sensors to maintain their on-orbit calibration and data quality. These include changes in MODIS RSB response versus scan-angle (RVS), crosstalk correction for MODIS SWIR bands and LWIR bands (Terra only), and large changes in S-NPP NIR and SWIR spectral regions and their associated impacts. In Section 5, we examine calibration consistency between MODIS and VIIRS and its potential impact on producing multi-sensor long-term data records. Section 6 provides a short summary. It should be pointed out that the VIIRS has a unique day/night band (DNB) and its calibration and performance are not discussed in this paper, but can be found here [24,25]. The geometric calibration and performance of the MODIS and VIIRS are not covered in this paper either. To date, the overall performance of both MODIS and VIIRS continues to meet their design requirements, enabling high quality data to be continuously generated. On-orbit changes in sensor characteristics have been monitored and addressed via calibration look-up table (LUT) updates and algorithm enhancements. Calibration issues discussed in this paper can also provide useful information for scientists and users worldwide to better understand and further improve their studies that involve the use of MODIS and VIIRS observations.

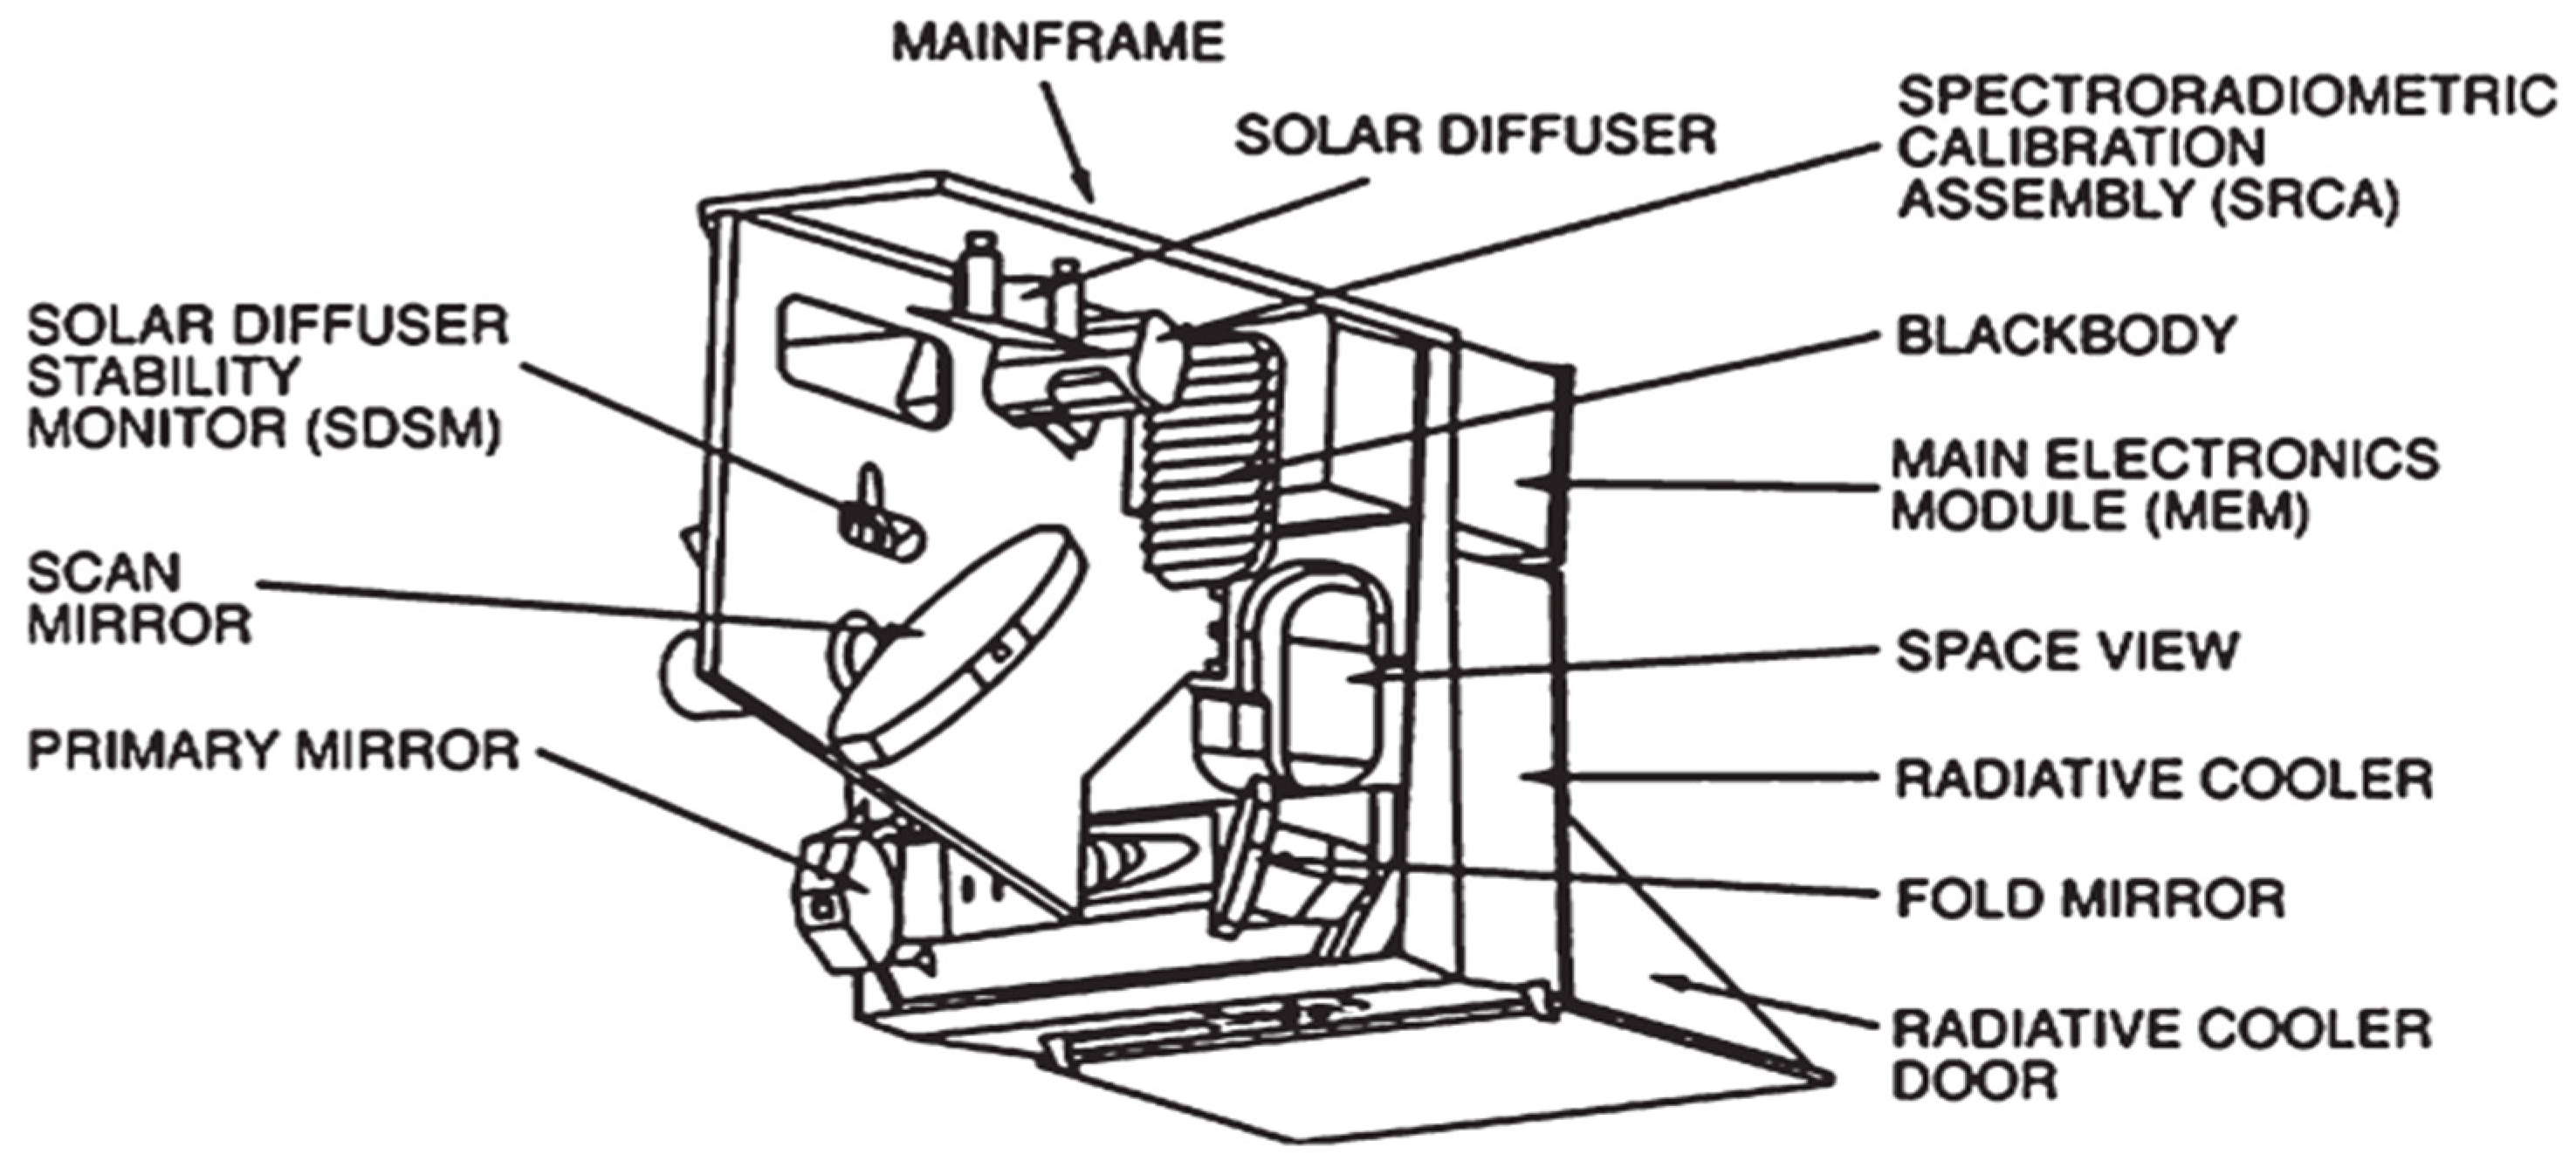
2. Instrument Background

As introduced earlier, MODIS was developed based upon a number of heritage sensors with an overall improvement in its calibration requirements and, most importantly, on-orbit calibration capability that can help monitor and maintain instrument calibration and data quality over its entire mission [3,4,5,6]. MODIS data are collected in 36 spectral bands covering wavelengths from 0.41 to 14.4 μm and at 3 nadir spatial resolutions: 250 m (bands 1–2), 500 m (bands 3–7), and 1 km (bands 8–36). It is a whiskbroom scanning radiometer using a double-sided scan mirror, making observations over a scan-angle range of ±55° relative to instrument nadir, providing a global coverage of the Earth every 1–2 days. A summary of the MODIS’s key design requirements for each spectral band is included in Table 1. The MODIS RSB include bands 1–19 and 26 and TEB include bands 20–25 and 27–36.
Figure 1 depicts the MODIS scan cavity with its key components and subsystems including the OBCs. The EV radiant flux is reflected from the scan mirror to the fold mirror and then through an off-axis telescope consisting of the primary and secondary mirrors. The 36 spectral bands, with a total of 490 detectors, are located on four focal plane assemblies (FPAs): VIS, NIR, S/MWIR, and LWIR. The S/MWIR and LWIR FPAs are temperature controlled by a radiative cooler at 83 K and the VIS and NIR FPAs are operated at sensor ambient, without temperature control. The detectors in each spectral band are aligned in the along-track direction with bands 13 and 14, each using a pair of detector arrays to operate at low and high gains via a time-delay and integration (TDI). For each 1 km data sample in bands 8–36, the detectors in the 500 m resolution bands (3–7) and 250 m resolution bands (1–2) collect two and four sub-samples, respectively. The suite of MODIS OBCs includes a solar diffuser (SD), a solar diffuser stability monitor (SDSM), a blackbody (BB), and a spectro-radiometric calibration assembly (SRCA). The sensor’s deep space view (SV) provides a background signal reference for both calibration and Earth radiance retrieval and also facilitates regular lunar observations performed via a spacecraft roll maneuver.
The MODIS SD panel, comprised of space-grade Spectralon is a near-Lambertian diffuser and it enables a reflectance-based calibration of the MODIS RSB. The SD bi-directional reflectance distribution function (BRDF) was characterized pre-launch by the instrument vendor with reference diffuser samples traceable to the National Institute of Standards and Technology (NIST). Its on-orbit changes are tracked by the SDSM. A retractable attenuation solar diffuser screen (SDS) is used to calibrate the high gain RSBs, whose responses saturate when the SD is under direct solar illumination. Nominally, a full RSB calibration consists of two sets of SD observations: one with the SDS and one without, with the solar diffuser aperture door closed at other times to prevent excessive solar exposure.
The SDSM is a ratioing radiometer with nine filtered detectors embedded in a solar integrating sphere (SIS) covering wavelengths from 0.41 to 0.94 μm. The SDSM, operated during the SD calibration, tracks the SD BRDF on-orbit degradation with alternate observations of direct sunlight and sunlight diffusely reflected from the SD panel. To match the SDSM Sun-view and SD-view responses, the SDSM Sun-view port includes a fixed attenuation screen. The time series of the SD to Sun-view ratios determine the SD degradation.
The OBC BB is a v-grooved panel with near-unity emissivity when viewed by the MODIS scan mirror. Its temperature is measured by 12 individual thermistors embedded in the substrate of the BB panel. On-orbit, the nominal settings of the BB have been 290 K for Terra MODIS and 285 K for Aqua MODIS. The BB, with its temperature measurements traceable to the NIST standard, is the calibration source for the TEB. The TEB on-orbit calibration is performed on a scan-by-scan basis by referencing to the BB. On a regular basis, the BB is cycled between the instrument ambient and 315 K, providing the ability to monitor the sensor’s non-linear calibration coefficients.
The SRCA is a unique device with built-in sources that can be configured and operated in three modes: radiometric, spectral, and spatial. The radiometric and spectral calibration capabilities only apply to the RSB, whereas the spatial calibration can be performed for both TEB and RSB. While the SRCA is designed to track radiometric performance of the RSB, the SRCA lamps have not been stable enough to provide accurate radiometry over the long time scales of the MODIS missions. As a result, the SRCA is primarily used for offline tracking of the spatial and spectral performance and the SRCA results are not currently used in any of the radiometric calibration algorithms. Interested readers can find more information on the SRCA spatial and spectral measurements from references [26,27].
The VIIRS instrument is also a whiskbroom multi-band scanning radiometer, which uses a rotating telescope assembly (RTA) in combination with a half-angle mirror (HAM) to scan over the Earth scene [15,18,24]. A summary of VIIRS spectral bands and key design requirements is provided in Table 2. There are 22 spectral bands spanning the wavelength range from 0.41 to 12.0 μm. Many of the bands have center wavelengths that are closely matched to corresponding MODIS bands. Data are taken at two nadir spatial resolutions: 375 m for the imaging “I” bands and 750 m for the moderate resolution “M” bands. The VIIRS has 14 RSB (I1-I3 and M1-M11) and 7 TEB (I4-I5 and M12-M16). It also has a unique DNB at 750 m resolution, which has an extremely large dynamic range capable of viewing the brightest of daytime scenes as well as dim nighttime scenes. The VIIRS spectral bands are located on three FPAs. The S/MWIR and LWIR FPAs are both cooled to a temperature of about 80 K using a cryocooler, and the VIS/NIR FPA is operated at sensor ambient temperature.
VIIRS has seven dual-gain bands: M1-M5, M7, and M13. For these bands, the electronics can switch between high gain (HG) and low gain (LG) modes in the on-board signal processing based on the observed signal level. This increases the dynamic range and helps facilitate the viewing of both bright and dark Earth scene targets with a single row of detectors. The LG stage of band M13 is used as a fire detection channel. The VIIRS bands use on-board pixel aggregation in the along-scan direction to reduce the impact of the pixel size growth toward the edge of scan (the bow-tie effect) in the Earth scene images. Near nadir, a 3 × 1 pixel aggregation is used and this drops to 2 × 1 and then 1 × 1 moving from nadir to edge of scan.
Figure 2 shows a schematic of the VIIRS instrument cavity including the primary OBCs and its scanning RTA and HAM system. Compared to the MODIS design of using a single rotating mirror, the VIIRS RTA design significantly reduces the effect of instrument gain degradation as a function of scan angle, or the RVS, which has been one of the major calibration challenges for MODIS VIS bands. VIIRS shares the same primary OBCs as MODIS: an SD for the RSB with an SDSM to track the on-orbit degradation of the SD, a BB for the TEB, and a space view port for a dark background reference. During data collection for the OBC views, the dual gain bands are forced to operate alternately in HG and LG stages to facilitate calibration of both gain stages.
The VIIRS SD calibration system includes a solar attenuation screen. Unlike MODIS, the VIIRS SD attenuation screen is fixed in front of the SD and there is no SD door that can be opened and closed. As a result, the VIIRS SD calibrations are only performed at one radiance level and the SD degrades more quickly on-orbit since it is exposed to solar radiation every orbit. The VIIRS SDSM has eight detectors spanning a wavelength range of 0.41 μm to 0.93 μm and has a very similar operation as the MODIS SDSM. The SDSM detectors 1–7 are designed to have a center wavelength matching that of VIIRS bands M1-M7.
As expected, the same lunar calibration strategy and applications developed for MODIS have also been applied for VIIRS, including the use of lunar observations, made through the SV port via spacecraft roll maneuvers, to track the long-term calibration stability of the RSB as well as to characterize sensor spatial performance. Unlike MODIS, the VIIRS lunar observations through the SV port are made from the same viewing geometry as the SD observations, i.e., the angle of incidence of light off of the HAM is the same for both lunar and SD measurements. This allows direct comparison of the SD and lunar time series without concerns about the influence of RVS changes. The impact of these comparisons on the calibration is discussed more in Section 3.
Like MODIS, the VIIRS TEB are calibrated scan-by-scan on-orbit using a v-grooved BB. The BB is maintained at a fixed nominal temperature of 292.5 K for both VIIRS instruments and monitored by a set of 6 well-calibrated thermistors. BB warm-up cool-down (WUCD) operations are regularly scheduled on orbit where the BB temperature is cycled from instrument ambient temperature of about 268 K up to 315 K to monitor any on-orbit changes in the non-linearity of the TEB response.
Built by the same instrument vendor, many of the lessons learned from the MODIS program greatly benefited the VIIRS design and testing. MODIS on-orbit calibration approaches and algorithms have also been adapted and applied to VIIRS.

3. Algorithm Overview

3.1. MODIS

The primary Level 1B (L1B) data product for the MODIS RSB is the top-of-atmosphere (TOA) reflectance factor, ρ E V cos ( θ E V ) , which is computed using a simple linear algorithm that can be expressed as follows [6,28]:
ρ E V cos ( θ E V ) =   m 1 d n E V * d E S 2 / R V S E V
where θ E V is the solar zenith angle of the EV pixel, m 1 is the calibration coefficient derived from the SD calibration, d E S is the Earth–Sun distance in AU at the time of the EV observation, d n E V * is the sensor response corrected for background and instrument temperature, and R V S E V is the response versus scan angle at the EV pixel view angle. The R V S E V term accounts for the instrument gain variation as a function of the angle of incidence (AOI) of light relative to the scan mirror. The L1B radiance product is computed from the reflectance factor as
L E V = ρ E V cos ( θ E V ) E s u n π d E S 2 = ( m 1 E s u n π ) ( d n E V * R V S E V )
where E s u n is the solar spectral power per steradian at 1 AU integrated over the relative spectral response (RSR) for each detector.
The calibration coefficients m 1 are determined from regular SD observations and are calculated by solving Equation (1) using the SD reflectance factor, expressed as:
m 1 =   ρ S D cos ( θ S D ) d n S D * d E S 2   τ S D S Δ S D
where ρ S D is the SD BRDF from pre-launch measurements, d n S D * is the sensor response when viewing the SD after correction for background and temperature effects, θ S D is the solar zenith angle relative to the SD, and d E S is the Earth–Sun distance in AU at the time of the SD observation. The R V S term is absent in Equation (3) since it is defined to be unity at the AOI of the SD. The Δ S D is the SD degradation factor used to correct the SD reflectance on-orbit degradation and is determined from regular SDSM observations. The screen transmission function, τ S D S , is applied to the bands that employ SD screened calibration and was derived from the yaw maneuver data. For MODIS, no pre-launch measurements were performed to characterize the τ S D S and the SD BRDF at the SDSM’s SD view angle. Instead, a series of yaw maneuvers, covering all the viewing geometries of the SD calibration, were performed on-orbit near the beginning of the missions to characterize these quantities [4].
In addition to regular SD and SDSM measurements, each MODIS instrument makes near-monthly lunar observations through its SV port. The lunar calibration coefficients can be derived using an expression similar to Equation (3) after correction of the detector response for variations due to lunar phase, lunar libration, and other view geometry effects. The lunar calibrations are extremely valuable for MODIS as they are used to monitor on-orbit changes in RSB responses at a different view angle or AOI than that of the SD [29]. MODIS is a scanning radiometer and the AOI of the Earth-reflected light relative to the scan mirror varies greatly, from 10.5° to 65.5°. The MODIS RSB RVS was characterized pre-launch and on-orbit changes are tracked by combining the regular SD and lunar measurements acquired at AOI of 50.25° and 11.25°, respectively.
As the instruments continue to operate beyond their designed lifetime, large changes in SD BRDF at short wavelengths, which could be angular and positional dependent, have made it extremely difficult to characterize the SD degradation, Δ S D , with high accuracy. While a majority of the RSB continue to use the SD-based calibration described by Equation (3), this approach has become inadequate in characterizing changes in the instrument’s response for a few short wavelength bands. As a result, EV response trends from time-invariant desert sites at the SD AOI are used to monitor the relative gain changes for these bands. Similarly, the responses from SD and lunar measurements alone are insufficient to accurately characterize the on-orbit changes in the RVS for the same short-wavelength bands. Therefore, EV response trends at multiple AOIs are used as a supplement to the solar and lunar measurements, resulting in an improved RVS characterization. This EV-based calibration approach has been implemented starting from L1B Collection 6 (C6) for both MODIS instruments [30].
The MODIS SWIR bands have a known out-of-band (OOB) response with a noticeable leak centered at 5.3 μm. The SWIR bands also have electronic crosstalk from the other bands that share the same focal plane. To isolate the combined adverse effects of the OOB leak and electronic crosstalk on the SWIR detectors, a special instrument operation to collect Earth scene RSB data during the spacecraft nighttime was designed and has been implemented since early mission of Terra MODIS, commonly referred to as a night-time-day-mode (NTDM) operation. A simple linear correction is derived based on the relationship between the response from a reference thermal band and the response of each of the SWIR bands during the NTDM collection. This correction has been implemented since early mission and updated as necessary to effectively mitigate the impacts of the OOB leak and electronic crosstalk in the calibrated L1B reflectance and radiance of the SWIR bands [31].
The MODIS TEB instrument response uses a quadratic algorithm for both the Earth radiance retrieval and BB calibration, except for band 21 which uses a linear function without offset [6,32]. For each detector and mirror side, retrieval of the Earth view radiance, L E V , is performed using
L E V = 1 R V S E V [ a 0 + b 1 d n E V + a 2 d n E V 2 ( R V S S V R V S E V ) L S M ]
with the linear term b 1 calibrated every scan. The offset term a 0 and quadratic term a 2 are taken from LUTs, which are updated as necessary on orbit. The R V S E V is a function of AOI. The Terra MODIS TEB RVS were derived using on-orbit data collected during spacecraft pitch maneuvers and Aqua MODIS TEB RVS were derived from pre-launch measurements [32,33]. L S M is the scan mirror radiance and has a small contribution to the TEB calibration due to the difference between the SV and EV RVS. The TEB calibration is based on sensor digital response ( d n B B ) to the BB view calibration radiance ( L C A L ),
L C A L = a 0 + b 1 d n B B + a 2 d n B B 2
The calibration radiance from the BB view is calculated using LUT coefficients and telemetry temperatures,
L C A L = R V S B B ε B B L B B + ( R V S S V R V S B B ) L S M + R V S B B ( 1 ε B B ) ε c a v L c a v
where ε B B and ε c a v are the emissivity of BB and cavity, respectively, L B B and L c a v are the radiance from the BB and cavity that are calculated with the Planck equation using their temperatures, and R V S B B is the RVS at BB AOI. The first term in Equation (6) is the emission from BB, the second term is the scan mirror emission term due to the difference between the BB and SV RVS, and the third term is the reflection of cavity emission through BB. Equations (5) and (6) can be used to derive the linear calibration coefficients on a scan-by-scan basis using LUT provided offset and nonlinear coefficients, and also to characterize detector nonlinear response coefficients using detector responses during BB WUCD.
Some special considerations have been applied to MODIS TEB calibration and Earth view radiance retrieval. Band 21 is a low gain MWIR band for fire detection. Due to its low digital output during nominal operation and therefore large uncertainty of its scan-by-scan calibration, b 1 coefficients are updated quarterly, if necessary, using on–board BB WUCD measurements. The b 1 coefficients, updated via LUTs, are also applied to Aqua MODIS bands 33, 35, and 36 during BB WUCD period when the BB temperatures exceed their pre-determined saturation temperatures. In addition, the electronic crosstalk between Terra bands 27 to 30 has been a major issue for L1B data and higher-level science products, especially after a spacecraft safe hold event occurred in February 2016 [34,35]. Terra bands 27 to 30 are often referred to as the PV LWIR bands since the bands use photovoltaic (PV) detectors as opposed to LWIR bands 31 to 36, which use photoconductive (PC) detectors. The PV LWIR crosstalk coefficients are derived from lunar observation and corrections have been applied to both calibration and Earth radiance retrieval. Optical leak corrections for Terra PC bands 32 to 36 have also been applied for both calibration and Earth view radiance retrieval throughout the Terra mission. Due to the decrease in the radiative cooler margin and thus the degradation of the cold focal plane assembly (CFPA) temperature control capability starting from 2006, the Aqua CFPA temperature showed increased fluctuations, though the magnitude has decreased since 2013. Because of this, a CFPA temperature dependent correction is applied to the Aqua TEB responses during BB WUCD, including the LUT b 1 coefficients for bands 33, 35, and 36, which are used when the BB temperatures exceed their saturation limits [36].

3.2. VIIRS

The VIIRS RSB L1B reflectance and radiance are defined in a similar way to the MODIS RSB, but with some additional considerations for the non-linear gain terms. The primary product for the VIIRS L1B is the radiance defined as [37,38,39]
L E V =   F ( c 0 + c 1 d n E V + c 2 d n E V 2 + c 3 d n E V 3 ) / R V S E V
where F, also known as the F-factor, is a scaling parameter to the calibration coefficients, d n E V is the background-corrected detector response for each EV pixel, and R V S E V is the HAM reflectivity at the incident angle of the EV pixel relative to its value at the angle of the SV. In contrast to the linear algorithm of MODIS, VIIRS uses a polynomial calibration algorithm that allows for up to cubic terms. The temperature-dependent coefficients c 0 , 1 , 2 , 3 in Equation (7) are derived from pre-launch measurements and are not updated on-orbit. For both VIIRS, c 0 is set to be zero for all detectors, and c 3 is set to zero except for detectors in the N20 SWIR bands M8-M11.
Like MODIS, the TOA reflectance factor can be converted from radiance, or vice versa, using Equation (2). Note that for all NASA L1B products, the delivered reflectance is the reflectance factor, ρ E V cos ( θ E V ) , but for both NOAA and NASA VIIRS SDR products, the delivered reflectance is ρ E V . The F-factor can be determined by applying Equation (7) to SD observations. The spectral radiance of the sunlit SD, L S D , can be computed by
L S D = c o s ( θ S D ) 0 Φ s u n ( λ ) τ S D S B R D F S D ( λ ) H ( λ , t ) R S R ( λ , t ) d λ 4 π d E S 2 0 R S R ( λ , t ) d λ
where θ S D is the solar zenith angle relative to the SD, τ S D S is the SD screen transmittance, B R D F S D is the pre-launch SD bidirectional reflectance distribution function along the SD-to-RTA direction, H is the SD degradation factor along the SD-to-RTA direction, and Φ s u n is the solar spectral power. The τ S D S and B R D F S D were measured pre-launch and their product has been refined with the yaw maneuver and a small portion of regular on-orbit data for both the S-NPP and N20 VIIRS instruments. The SD degradation factor (H) is determined by the SDSM and corrected using on-orbit lunar observations. Since SDSM detectors can only cover wavelengths up to 0.926 μm, different approaches are developed and applied to determine the SD degradation at wavelengths above 1.0 μm. The RSR for both VIIRS instruments was measured during pre-launch testing. The RSR for the S-NPP RSB has been modulated on-orbit due to the uneven RTA mirror reflectivity degradation across wavelengths [39,40].
VIIRS also makes near-monthly lunar observations and Equation (7) can also be used to compute the lunar F-factors [41,42,43]. The long-term trends of the lunar-derived F-factors are compared to the SD-derived F-factors to derive a correction for any inadequacy in the SD degradation measurements. As described in Section 2, VIIRS RSB do not have the same RVS concerns as MODIS because of the improved instrument design. The HAM, which is the only optical element with a reflectivity that depends on the scan angle, is located behind the RTA and shielded from direct exposure to the Earth-reflected UV light. As a result, the HAM reflectivity is not expected to change much on-orbit. The RVS for both VIIRS instruments continues to use the pre-launch values in the L1B products and studies of Earth view targets for S-NPP VIIRS indicate that the RVS continues to be stable.
Similar to MODIS (Equation (4)), the VIIRS TEB detector response uses a quadratic formula to retrieve the Earth view TOA spectral radiance, L E V . An on-board BB yields a calibration scale factor F that is applied to the scan-to-scan retrieval algorithm for each detector as [37,38,44]
L E V = 1 R V S E V [ F ( c 0 + c 1 d n E V + c 2 d n E V 2 ) ( R V S S V R V S E V ) L B G ]
where the RVS, a function of AOI, is for each band and HAM side, and the quadratic coefficients c i are characterized from pre-launch measurements. The detector’s response for each sample is given by the background-subtracted digital count d n E V . The theoretical basis of the TEB algorithm assumes the shape of the detector response curve is preserved so that it allows the same scale factor to apply to all quadratic polynomial coefficients on orbit. The calibration algorithm also considers the background contribution difference between the EV and SV path emission terms from the RTA and HAM. Instead of a scan mirror, the VIIRS rotating optics include an RTA and a HAM. The L B G in Equation (9) can be written as,
L B G = [ L H A M ( 1 ρ R T A ) L R T A ] / ρ R T A
where ρ R T A is the combined reflectance of the RTA mirrors, and L R T A and L H A M are the spectral radiance of RTA and HAM, respectively. Equation (9) can be applied to the BB path radiance to derive the F-factor on a scan by scan basis. Thus,
R V S B B ( ε B B L B B + ( 1 ε B B ) L R E ) + ( R V S B B R V S S V ) L B G = F ( c 0 + c 1 d n B B + c 2 d n B B 2 )
where ε B B is the BB emissivity. The BB path radiance includes the blackbody radiance, ε B B L B B , and the radiance reflected from the BB, ( 1 ε B B ) L R E . Since ε B B is very close to 1, the contribution from the reflected radiance is very small. In the current VIIRS algorithm, the radiance, L R E , that could reflect from the BB includes weighted thermal emissions from the RTA, the blackbody shield, and cavity.
The F factor is detector and HAM side dependent and it is updated scan-by-scan in the L1B software, except for band M13 low gain stage, which operates with a fixed F of one due to low signal at the nominal BB temperature. The coefficients c 0 , 1 , 2 in Equation (9) have not been updated since launch.

4. On-Orbit Performance

As the MODIS and VIIRS instruments continue their successful operations, their on-orbit calibration accuracy is maintained using the measurements derived from their OBCs. In this section, the performance of the MODIS and VIIRS instruments is summarized using examples from select bands supplemented with descriptions of the performance from other bands. For RSB, the on-board SD is the primary calibration target. On-orbit changes in SD reflectance properties are constantly monitored and corrected when calibration coefficients are derived from SD observations. The SD BRDF on-orbit degradation trends, as shown in Figure 3 for both MODIS and VIIRS instruments, are measured by the on-board SDSM using a ratioing approach. During the SD BRDF calibration data collection process, the SDSM detectors collect solar radiation through the SDSM screen and the SD scattered sunlight at almost the same time. The ratio of the signal strengths is a measure of the SD BRDF degradation. The degradation is normalized at the mission start.
The SD degradation data for Terra and Aqua MODIS are shown in Figure 3a,b. The rate of SD degradation is fairly similar over the first three years of the missions for Terra (2000–2003) and Aqua (2002–2005). After July 2003, the Terra MODIS SD door has been in a fixed open position with the SD screen fixed in the closed position and the Terra MODIS SD is, therefore, illuminated by solar radiation every orbit. This has led to more rapid degradation of the SD, especially at shorter wavelengths, as the most likely cause of SD degradation is expected to be the interaction of the solar UV radiation with contaminants on the SD surface. The total SD degradation of Terra MODIS is currently much larger than that of Aqua MODIS, which is exposed to the direct solar radiation only during regularly scheduled calibration events.
Figure 3c,d show the SD BRDF on-orbit degradation for S-NPP and N20 VIIRS instruments as measured along the SD-to-SDSM direction. The VIIRS SD degradation versus time curves are very smooth when operated under the same conditions, a result of high quality SD and SDSM screen transmittance functions obtained using both the yaw maneuver and a small portion of regular SDSM on-orbit data [45,46]. The SD/SDSM configuration and operation are very similar for S-NPP and N20 VIIRS and as a result the rates of SD degradation over the first two years of each mission are very similar across all wavelengths. On 24 February 2019, there was an event that impacted the S-NPP SD and perhaps the SD screen, evidenced by the discontinuity in Figure 3c.
Figure 4 shows the normalized on-orbit gain change trends for select VIS bands 8 (blue color) and 3 (black color) of Terra and Aqua MODIS. As introduced earlier, the OBC-based gain of the MODIS RSB is tracked at two different AOI using the SD (solid lines) and lunar observations (dashed lines with symbols). Although the lunar measurements are acquired on a near-monthly basis, only the trend lines with representative symbols are shown here for illustration purposes. The gains are averaged over the detectors within each band and normalized to the first on-orbit measurement. For Terra MODIS, the shortest wavelength band 8 (0.41 μm) has experienced the most gain changes of over 50%. Together the SD and lunar gain trends, with a linear approximation at other AOI, are used to monitor the on-orbit change in the RVS for the MODIS RSB. In addition, supplemental trends from pseudo-invariant desert targets are used to obtain a more accurate scan-angle dependent behavior of the gain for select RSB bands. In comparison with the VIS bands, the NIR and SWIR bands have shown relatively smaller gain change (~10%) over the mission. A similar pattern of wavelength-dependent gain degradation is also observed in the Aqua MODIS bands with most degradation of about 40% observed for band 8 (0.41 μm). The NIR and SWIR bands of Aqua MODIS have performed well with on-orbit gain changes within 6% and 3%, respectively [28].
On-orbit changes in the polarization sensitivity of the scan mirror have impacted the performance of the short-wavelength Terra MODIS RSB. Although the L1B does not include any correction for these polarization effects, a mitigation strategy is in place for the Level 2 (L2) science products. The NASA Ocean Biology Processing Group (OBPG) has derived polarization correction coefficients from a cross-calibration with SeaWIFs and Aqua MODIS over ocean targets [47]. For the land and atmospheric products, these coefficients are employed together with an additional de-trending correction to account for any residual long-term drifts [48]. The changes in the polarization sensitivity of the scan mirror also impact the RVS characterization, particularly for bands 8 and 9 of Terra MODIS that employ the use of observations from the desert targets. Recent work has incorporated the polarization correction in the derivation of gains from the desert sites for these short-wavelength bands. This process will help improve the accuracy of the L1B product and the forward predicted RVS LUTs for VIS bands [49]. It should be noted that this correction only improves the instrument gain stability and RVS prediction. Scene-dependent impacts from polarization still need to be accounted for by individual science users.
The calibration quality of the Terra SWIR bands degraded somewhat following the spacecraft safe mode anomaly in February 2016. After this event, the PV LWIR bands, including band 28, showed significantly increased electronic crosstalk. This had an impact on the SWIR bands calibration since band 28 was used as a representative sending band to correct the SWIR OOB response, a combination of optical leak at 5.3 μm and electronic crosstalk. Following extensive testing and performance assessment, a decision was made to use band 25 (less impacted by the electronic crosstalk) as the representative sending band. This change has successfully mitigated the adverse impacts and restored the performance of the Terra SWIR bands [50]. Based on the pre-launch lessons learned from Terra MODIS, Aqua MODIS has experienced minimal impacts due to electronic crosstalk on-orbit.
Figure 5 shows the on-orbit gain change (1/F normalized to mission start) trends for a few select VIS/NIR bands of S-NPP and N20 VIIRS. The lines show the daily average measured F-factors from the SD calibrations and the symbols show the results of lunar observations. For the SD trends, the data are all normalized to the value of gain (1/F) from the first full day of SD observations at the mission start. For the lunar trends, an overall scale factor is derived based on a least-squares fit of the lunar/SD ratio over the entire mission. This is the normalization factor applied to the lunar data to facilitate the clearest comparison between the SD and lunar long-term trends. The lunar calibration methodology, discussed in detail in [41], involves the use of the USGS Robotic Lunar Observatory (ROLO) model to account for the geometric variations (lunar phase angle librations) and a few residual effects associated with the lunar librations are still evident in the trending and need to be accounted for using an empirical correction. For S-NPP, the gains degrade significantly after launch in the NIR/SWIR portion of the wavelength spectrum, with the spectrally matched M7 and I2 (not shown) bands having the fastest rate of degradation. The SWIR band M8, not shown here, has experienced the largest degradation. The rapid degradation has been studied extensively and linked to the optical degradation of the RTA mirrors and that was caused by UV exposure of contaminated mirror surfaces [51]. The rate of degradation has slowed down in recent years and the RSB performance has become fairly stable. For N20 VIIRS, there has been almost no change in the RSB gains on-orbit, with all RSB showing less than 0.5% total gain change after two and a half years of on-orbit operation. Note that the SD F-factors presented in Figure 5 for both instruments are calculated using the SD degradation as seen from the RTA viewing direction, which includes corrections applied on top of the measured SD degradation from the SDSM viewing direction (shown in Figure 3) based on the long-term lunar trends.
Figure 6 shows snapshots of the wavelength dependence of the gain changes of Aqua MODIS RSB compared to S-NPP VIIRS RSB at a few times throughout each mission. The relative amount of gain change as a function of band wavelength can provide insight into the primary degradation mechanisms and what similarities and differences exist between instruments. For Aqua MODIS, the short wavelength visible bands have had the largest degradation on-orbit, with a general trend of less degradation for longer wavelengths. This behavior is understood to be related to the optical degradation of the primary scan mirror of MODIS from exposure to UV radiation. Terra MODIS has a similar pattern but with more degradation at longer wavelengths compared to Aqua MODIS. The magnitude of RVS changes for both Terra and Aqua MODIS also follows a similar wavelength dependence. Note that the gain changes plotted in Figure 6 are the total instrument gain changes, which may include changes in the detector and electronic gains or other instrument changes in addition to the optical degradation, which is likely the explanation for why some bands, notably bands 1 (0.645 μm) and 2 (0.858 μm), fall outside the general trend. For S-NPP VIIRS, the on-orbit degradation at every point in the mission has a distinct wavelength dependency that is related to the RTA mirror contamination confirmed through lab measurements of the RTA mirror witness samples [51,52]. The wavelength dependence of the gain changes fits well to a degradation model [40]. The smoothness of the gain vs. wavelength curves for S-NPP VIIRS compared to Aqua MODIS indicates that the RTA mirror degradation is dominating the gain change and that other electronic or detector changes are not playing a significant role. N20 VIIRS, which does not have the same RTA contamination problem as S-NPP VIIRS, has shown no significant on-orbit gain change of any kind at any RSB wavelength.
As presented in Section 3, the MODIS TEB calibration uses a quadratic response function for both calibration and Earth view radiance retrieval. The linear coefficients ( b 1 ) dominate the radiance calculation and are computed scan-by-scan to catch instantaneous changes in instrument response with reference to the on-board BB. The gains ( 1 / b 1 ) normalized to the mission beginning are shown in the top row of Figure 7 for selected bands. The gains shown in these figures are weekly band-averaged responses from mirror side 1 in nominal operation, while the trends for mirror side 2 are almost identical. Early in the mission for both MODIS instruments there were configuration changes that caused sudden jumps in the gain trends, which can be seen in Figure 7 for Terra MODIS multiple times before 2004 and for Aqua MODIS during 2002. The Terra safe mode event in February 2016 also impacted the gains for several TEB. Terra MODIS bands 31 and 32 gains show slight downward trends with approximately 1.5% gain change for the entire mission, while the band 20 gain shows an approximate 4% downward trend. MODIS PC bands are highly sensitive to the CFPA temperatures. The gain fluctuations in Aqua MODIS bands 31 and 32 shown in Figure 7b can be attributed to an increasing fluctuation in the CFPA temperatures due to a gradual decrease of the radiative cooler margin. In contrast, Aqua MODIS band 20 gain shows a stable trend over the mission.
Figure 7c,d show the VIIRS TEB on-orbit gain trends (inverse of the F-factor), calculated as the gain values for HAM-side A averaged over all detectors within a band. The gains of S-NPP VIIRS bands I5, M12, and M16 have changes less than 2.4%, 0.8%, and 0.4%, respectively, over the 8+ years of on-orbit operation. Band I5 shows the largest gain degradation of all TEBs. For N20 VIIRS, right after the cryo-radiator door was opened and CFPA cooled down to its nominal operating temperature on 6 January 2018, ice buildup in the optical path on the LWIR dewar caused a rapid degradation (maximum of ~1.5% in the first 2.5 months) of the gain in the LWIR bands (see bands I5 and M16 in Figure 7d). Following a mid-mission outgas operation performed on 12 March 2018, the gains in these LWIR bands returned to pre-icing levels. Since then, the gain of all N20 TEBs have been very stable. Similar to S-NPP VIIRS, band I5 has the largest gain degradation among the N20 TEBs.
Compared to the SD used for RSB calibration that degrades significantly at short wavelengths (Figure 3), the on-board BB performance has been very stable. At its nominal setting, the BB temperature drift over the entire mission is less than 30 mK for Terra MODIS and less than 5 mK for Aqua MODIS, S-NPP, and N20 VIIRS. The scan-by-scan variation of the BB temperatures is within ±25 mK for Terra MODIS and within ±15 mK for Aqua MODIS, S-NPP, and N20 VIIRS. As expected, the variations are slightly higher during BB WUCD operations.
Terra MODIS PV LWIR band crosstalk coefficients (bands 27–30) are derived from lunar observations and the correction has been applied to the Collection 6.1 (C6.1) L1B reprocessing from the mission beginning through forward processing [35]. Early in the mission, the contamination level is relatively low, and then gradually increases. The contamination impacts the L1B data and the science product. After the February 2016 safe-mode event, the contamination level for each band has increased significantly. Applying correction on both calibration and Earth view radiance retrieval has resulted in a significant improvement to the radiometric calibration accuracy, image quality, and the long-term stability. Figure 8 shows the comparison of a Terra band 27 image before (C6) and after (C6.1) the crosstalk correction. The image quality is greatly improved with removal of the striping and also resulting in an enhanced accuracy. The C6.1 correction shows a similar level of improved performance for all the PV LWIR bands 27–30. A similar need for an electronic crosstalk correction has also been identified in select detectors of Terra MODIS MWIR and Aqua MODIS MWIR and LWIR bands and will be implemented in the next version of the L1B products. Although the impacts of electronic crosstalk in these TEB are minimal compared to the Terra MODIS PV LWIR bands, a correction is expected to produce enhanced imagery in terms of reduced detector striping and therefore an improved calibrated product.
As illustrated above, extensive efforts have been made by the MCST and VCST to constantly monitor and evaluate the performance of each of the MODIS and VIIRS instruments. On-orbit changes in sensor OBC and spectral band responses are fully characterized and corrected via calibration look-up table updates and, if necessary, algorithm refinements. The calibration performance across all wavelengths is also monitored routinely using vicarious measurements of pseudo invariant ground targets as well as cross-calibration with other instruments. The MODIS and VIIRS on-orbit calibration uncertainties have also been assessed and details of these analyses can be found in a number of references [53,54,55].

5. Calibration Consistency Assessment and Future Effort

Various vicarious approaches have been used to examine sensor calibration stability and consistency. The MODIS L1B product used for calibration assessment is from Collection 6.1 produced by the NASA’s MODIS Adaptive Processing System (MODAPS). For VIIRS, the latest Version 2.0 L1B data produced by NASA Land Science Investigator-led Processing System (SIPS) are used. A number of Earth targets with suitable characteristics have been identified and used as reliable references to verify the post-launch radiometric performance of various satellite sensors [56,57,58,59]. The selection of Earth targets is generally based on the following considerations: the target surface should have high spatial uniformity, high surface reflectance, and temporally invariant surface properties. It is preferable that the site is horizontally uniform and located in desert regions, so as to have low probability of cloud-cover and precipitation, or located in polar areas to minimize the influence of aerosol and atmospheric water vapor. In recent years, simultaneous nadir overpasses (SNOs) have been used to determine the relative differences between a pair of polar-orbiting satellites [58,59,60]. This approach is based on a direct pixel level comparison and requires a proper selection and sampling of SNO measurements to minimize the effect of spatial and temporal variability in the observations. The SNO approach can provide high-quality comparison data.
For RSB inter-comparison, the primary vicarious approach is the SNO approach. Since there is no simultaneous crossover between Terra and Aqua satellites, or between S-NPP and N20 satellites, a third sensor could be used as a transfer radiometer [60,61,62,63,64]. For example, either MODIS has crossovers with both VIIRS sensors and can be used as the transfer radiometer to inter-compare the two VIIRS via a double difference approach. Similarly, either VIIRS can help facilitate the inter-comparison of the two MODIS instruments. There is an abundance of MODIS and VIIRS SNOs, with nearly one SNO event every three days. The most frequent locations of these SNOs are in the high-latitude regions. The SNO data sets collected in this study are from the MODIS and VIIRS crossovers acquired within 30 seconds. An averaged ratio of reflectance between the spectrally matching bands of MODIS and VIIRS is determined once a statistically sufficient sample size is obtained from each SNO. Since there is no restriction of SNOs on the location or surface type, results from this approach contain data from a wide variety of scene types. Figure 9 shows an example of pixel-to-pixel comparisons of reflectance between spectrally matched Aqua MODIS bands 1 and 2 and S-NPP VIIRS bands I1 and I2 from an SNO event on 8 October 2019. Using S-NPP as a transfer radiometer, trends of Terra and Aqua MODIS band 1 to VIIRS band I1 reflectance ratios are shown in Figure 10. Small data gaps in the Terra trend are due to exclusion of periods when Terra and S-NPP SNOs are at solar zenith angles larger than 80.0°. There are seasonal variations in the trends that are likely due to residual BRDF effects. On average, Terra MODIS band 1 reflectance is 1.15% lower than that of Aqua MODIS. The relative differences for other MODIS VIS/NIR bands are within 1.5% based on the SNO approach. Similarly, Aqua MODIS can be used as a transfer radiometer to enable inter-comparisons between S-NPP and N20 VIIRS.
For the TEB, the Infrared Atmospheric Sounding Interferometer (IASI) on MetOp-A or the Cross-track Infrared Sounder (CrIS) on S-NPP and N20 have been used as transfer radiometers [65,66,67,68]. In this approach, well-calibrated hyperspectral measurements from IASI and CrIS are used to intercompare the MODIS and VIIRS TEB. Figure 11 shows an example of the S-NPP and N20 VIIRS comparisons to Aqua MODIS as a function of brightness temperature (BT) at 11.0 μm using IASI as the reference. There is a slight BT-dependent trend for the BT difference and a double BT difference is used to determine the S-NPP and N20 temperature difference. Results show that N20 BT are systematically lower than S-NPP by approximately 0.10 K. Results for other VIIRS TEB show that the relative differences are generally within 0.10 K based on the SNO approach, indicating an excellent calibration consistency of both N20 and S-NPP TEB.
The other vicarious calibration approaches are based on reflectances collected over pseudo-invariant calibration sites (PICS) including the widely used Libya-4 desert site (28.5°N, 23.4°E) and the Dome C ice/snow site (75.1°S, 123.4°E) on the Antarctic Plateau [69]. The main reason that these PICS are used is because of the relatively high and nearly constant reflectance with little vegetation. Similar to the SNO approach, we choose near-nadir overpasses with view zenith angles less than 5.0° over the Libya-4 site, obtained from 16-day repeatable orbits for both MODIS and VIIRS. Since the view and solar zenith angles over the site for the two sensors can be selected from a similar angular range, a site-dependent BRDF model based on measurements from one sensor can be applied to the measurements from the other sensor. The BRDF model coefficients are derived from a cumulative data set typically spanning a three-year period to cover multiple seasonal cycles for the angular parameters. Figure 12 shows trends of S-NPP and N20 VIIRS I1 (0.65 μm) reflectance from the Libya-4 desert site, normalized with a common BRDF model derived using measurements from Aqua MODIS band 1 (0.65 μm). Comparison of the BRDF-normalized reflectances indicates that N20 is about 3.55% lower than S-NPP. It should be noted that there are additional differences in reflectance due to existing band spectral differences between N20 and S-NPP VIIRS RSB. The impact due to spectral differences varies with scene types and atmospheric conditions and needs to be corrected when evaluating the calibration difference. For other RSB, the lower systematic biases for N20 range from 3% to 7% depending on band, with the largest biases in the shortest wavelength bands M1 to M3.
For TEB, near surface temperature measurements obtained from the Dome C site and ocean buoys are used as references to track the MODIS and VIIRS calibration stability and consistency. To access the calibration consistency between the two sensors, a temperature double difference is applied to determine the relative bias [70,71,72,73]. Figure 13 shows an example of the relative bias between the S-NPP VIIRS and Aqua MODIS 11.0 μm bands at the Dome C site. Since the site is located at Antarctica, there are more frequent MODIS and VIIRS overpasses. Each data point shown in the figure is obtained by averaging weekly matchups. All near surface temperature measurements are obtained from an automatic weather station at the site with a time frequency of every 10 min. The temperatures measured at the nearest time to the sensor overpasses are used to calculate the temperature difference. Results show that no apparent drifts are observed and that the mean bias is −0.11 K, which is well within the uncertainty requirement. Since the BT retrieved by the sensors at the top of atmosphere is affected by atmosphere, there are relatively large uncertainties in the comparison result. However, with accumulation of enough samples, this approach can provide a reasonably good estimate of the overall stability and relative BT bias.
Table 3 summarizes the differences of Terra MODIS relative to Aqua MODIS determined using the four vicarious approaches for several selected bands covering the VIS, NIR, MWIR, and LWIR. The SNO approach has the shortest data period compared with other approaches but still covers the entire S-NPP VIIRS operational period from 2012 to present. Since there is a close band spectral agreement between Terra and Aqua, no spectral difference correction is applied. For the RSB, the relative differences are within 1.5% in all three relevant approaches. A large standard error for band 12, an ocean color high-gain band, is due to a limited number of SNO pixels because of saturation over land and cloudy surfaces. Results from the Dome C site also show relatively large variability due to their high solar zenith angles. Results for MODIS SWIR bands (not included in Table 3) have a relative difference within 2% between Terra and Aqua but with a high uncertainty of 2% to 4% depending on approach. Results for bands 17 to 19 are not considered due to lack of spectral overlapping with VIIRS and their high sensitivity to atmospheric water conditions.
For the TEB results in Table 3, five bands with wavelengths from 3.75 μm to 14.0 μm are selected. Results from the SNO have lower standard errors than the other two approaches. The differences for bands 20, 29, 31, and 32, which are the bands in the atmospheric window regions, are within 0.20 K in the SNO data and ocean buoy approaches. In the ocean buoy approach [73], data come from three near tropic ocean sites, which are operated and maintained by the NOAA National Data Buoy Center (NDBC). These two approaches are applied to Earth scenes with temperatures close to the typical temperature at 300 K, indicating a reasonably consistent calibration between Terra and Aqua. It should be noted that the results for Terra band 29 are obtained after the electronic crosstalk correction. Without the correction, a large upward trend of up to 2.0 K is observed [35]. For band 35, Terra has a larger positive bias relative to Aqua, which was observed for bands 33 to 36 in several early studies based on MODIS and IASI SNO data. Further investigation has found that an effective spectral shift could significantly reduce the scene temperature dependent biases [65].
Table 4 summarizes the differences between S-NPP and N20 VIIRS for select RSB and TEB from the various intercomparison approaches. The results show that N20 reflectances are systematically lower than S-NPP by 3 to 4% for most RSB and the two shortest wavelength bands M1 and M2 have the largest biases, up to 7%. Our recent study showed that reflectances from N20 VIIRS VIS to NIR bands are lower than those from S-NPP by 4% on average and more negative biases occur in the shortest wavelength bands M1 to M3 [74]. Similar results of the radiometric biases between the two instruments were also observed in a recent study by Uprety et al. [75]. There are noticeable differences between NASA Land SIPS and NOAA interface data processing segment (IDPS) L1B reflectance products for S-NPP VIIRS due to differences in the calibration methods. For RSB, the results in Table 4 are corrected for the existing differences of band RSR between the two sensors, which are derived using SCIAMACHY observations, one of ten instruments aboard the ESA’s Environmental Satellite, ENVISAT 18 [76]. SCIAMACHY has a relatively high spectral resolution (0.2 to 0.5 nm) and a wide wavelength range (240 to 1700 nm). Although the ENVISAT mission ended on May 9, 2012, it provides a decade-long global dataset from August 2002 up to April 2012. The SCIAMACHY data collected in 2004 is used, based on the Level-1B data product (SCI_NL_1P, version 7.03) and surface type information from Terra MODIS co-location data (desert, SNO and Dome C). For the SNO data, since they are collected from varying scene-types, an averaged SCIAMACHY profile using overpasses over multiple scene types is used to derive the RSR correction.
For the TEB in Table 4, comparisons of the differences of N20 relative to S-NPP indicate a small negative bias of about −0.10 K in the SNO approaches, which is well within the radiometric accuracy specification. Results from the other two approaches (Dome C and ocean buoy) also show negative biases but with much larger uncertainties due to the limitations of these approaches.
Table 5 shows the differences of N20 VIIRS relative to Aqua MODIS. Results indicate that N20 RSB are consistently lower than Aqua by about 1.0% to 3.0% for most bands and the two shortest wavelength bands M1 and M2 have the largest biases. Similar to the results shown in Table 4, the differences are corrected for the RSR impact. Results also show that differences among the three approaches could be up to 2.0%. A similar level of agreement among various vicarious approaches has been reported previously for the visible to near-infrared spectral region [77,78]. It is expected that errors due to existing residual BRDF impacts on the comparison data could be up to 1%, plus an additional 0.5% errors due to not having a real time RSR correction. For TEB, the results in Table 5 indicate an excellent agreement of 0.11 K or less between N20 VIIRS and Aqua MODIS based on the SNO approach. Our earlier results based on the SNO approach between S-NPP VIIRS and Aqua MODIS also showed an excellent agreement over a wide range of scene temperatures [67,68]. Based on previous results as well as the VIIRS comparisons shown in Table 4, this is an expected agreement between N20 VIIRS and Aqua MODIS TEB.
Realizing the existing RSB calibration biases among N20 and S-NPP VIIRS and Terra and Aqua MODIS, future efforts can be focused on the following areas. A further investigation of calibration data from pre-launch to initial on-orbit transition, particularly for the N20 and S-NPP VIIRS, may help explain some of the large bias between the two sensors. This is based on the fact that the RSB calibration is referenced to the pre-launch calibration results of the on-board SD BRDF. Errors in the calculation of the SD on-orbit degradation should not cause the systematic biases across a wide wavelength range since the degradation occurs mainly in the blue wavelength region.
As demonstrated in this paper, generating high quality consistent long-term data records from multiple Earth observing sensors, even of the same type, remains a major challenge, requiring dedicated calibration and characterization efforts to not only monitor changes in each sensor’s characteristics but also address the calibration differences among individual sensors as these sensors are often calibrated independently, especially in the reflective solar spectral region.

6. Summary

Both MODIS and VIIRS instrument operations, calibration algorithms, and key on-orbit performance metrics have been reviewed in this paper, with a focus on their similarities and differences. Although the two MODIS instruments and S-NPP VIIRS have operated beyond their design life and experienced noticeable changes in their spectral band responses, they continue to facilitate the production of high-quality scientific products thanks to continual calibration updates and algorithm improvements to address issues identified during on-orbit operations. The N20 VIIRS, in its third year of operation, has shown excellent on-orbit performance with little changes in its spectral band responses. The calibration stability and consistency between the two MODIS, two VIIRS, and MODIS and VIIRS instruments are also assessed in this paper using different approaches, such as ground measurements, SNO with a third sensor, or model simulated values. Overall, an excellent agreement between the four instruments has been observed in the case of the TEB across a wide range of scene types and brightness temperatures. For the RSB, disagreements greater than the respective uncertainties of the instruments are observed between the two VIIRS sensors. As demonstrated in this paper, the continuity of the data records between multiple Earth observing instruments is an outstanding challenge toward the development of the long-term climate data records, which requires dedicated efforts to monitor and correct on-orbit changes in sensor characteristics. Together with future JPSS VIIRS instruments, the MODIS and VIIRS data records are expected to extend over four decades (2000–2040) and become more valuable in support of studies of the Earth’s environment and climate change.

Author Contributions

Conceptualization, X.X.; Data curation, K.C., N.L., Y.L. and A.W.; Formal analysis, A.A., Y.L. and A.W.; Investigation, N.L., J.S. and K.T.; Methodology, X.X., A.A., T.C., K.C., N.L., J.S. and K.T.; Writing—original draft, X.X.; Writing—review & editing, A.A. and K.T. All authors have read and agreed to the published version of the manuscript.

Funding

This work received no external funding.

Acknowledgments

The authors would like to thank contributions made by the instrument vendor throughout MODIS and VIIRS missions, the Terra and Aqua MODIS Project, and the JPSS program. The efforts of the MODIS Characterization Support Team and VIIRS Characterization support team are also acknowledged.

Conflicts of Interest

The authors declare no conflict of interest.

Abbreviations

MODISModerate Resolution Imaging Spectroradiometer
VIIRSVisible Infrared Imaging Radiometer Suite
S-NPPSuomi National Polar-orbiting Partnership
MCSTMODIS Characterization Support Team
VCSTVIIRS Characterization Support Team
JPSSJoint Polar Satellite System
SNOSimultaneous Nadir Overpass
BRDFBidirectional Reflectance Distribution Function
RSBReflective solar bands
TEBThermal emissive bands
VISVisible
NIRNear-infrared
FPAFocal Plane Assembly
LWIRLong-wave infrared
SMIRShort and mid-wave infrared

References

  1. Salomonson, V.; Barnes, W.L.; Maymon, P.W.; Montgomery, H.E.; Ostrow, H. MODIS: Advanced facility instrument for studies of the Earth as a system. IEEE Trans. Geosci. Rem. Sens. 1989, 27, 145–153. [Google Scholar] [CrossRef]
  2. Barnes, W.L.; Salomonson, V.V. MODIS: A global image spectroradiometer for the Earth Observing System. Crit. Rev. Opt. Sci. Technol. 1993, CR47, 285–307. [Google Scholar]
  3. Barnes, W.; Xiong, X.; Guenther, B.; Salomonson, V.V. Development, Characterization, and Performance of the EOS MODIS Sensors. Proc. SPIE 2003, 5151, 337–345. [Google Scholar]
  4. Xiong, X.; Chiang, K.; Esposito, J.; Guenther, B.; Barnes, W.L. MODIS On-orbit Calibration and Characterization. Metrologia 2003, 40, 89–92. [Google Scholar] [CrossRef]
  5. Barnes, W.L.; Xiong, X.; Salomonson, V.V. MODIS Instrument Status and Operational Activities. Proc. SPIE 2004, 5542, 14–23. [Google Scholar]
  6. Xiong, X.; Wenny, B.N.; Barnes, W.L. Overview of NASA Earth Observing Systems Terra and Aqua Moderate Resolution Imaging Spectroradiometer Instrument Calibration Algorithms and On-orbit Performance. J. Appl. Remote Sens. 2009, 3, 032501. [Google Scholar]
  7. Parkinson, C. Aqua: An Earth-Observing Satellite Mission to Examine Water and Other Climate Variables. IEEE Trans. Geosci. Remote Sens. 2003, 41, 173–183. [Google Scholar] [CrossRef]
  8. King, M.; Menzel, P.; Kaufman, Y.; Tanre, D.; Gao, B.; Platnick, S.; Ackerman, S.; Remer, L.; Pincus, R.; Hubanks, P. Cloud and Aerosol Properties, Precipitable Water, and Profiles of Temperature and Water Vapor from MODIS. IEEE Trans. Geosci. Remote Sens. 2003, 41, 442–458. [Google Scholar] [CrossRef] [Green Version]
  9. Justice, C.; Vermote, E.; Townshend, J.; Defries, R.; Roy, D.; Hall, D.; Salomonson, V.; Privette, J.; Riggs, G.; Strahler, A.; et al. The Moderate Resolution Imaging Spectroradiometer (MODIS): Land Remote Sensing for Global Change Research. IEEE Trans. Geosci. Remote Sens. 1998, 36, 1228–1249. [Google Scholar] [CrossRef] [Green Version]
  10. Esaias, E.; Abbott, M.; Barton, I.; Brown, O.; Campbell, J.; Carder, K.; Clark, D.; Evans, R.; Hoge, F.; Gordon, H.; et al. An Overview of MODIS Capabilities for Ocean Science Observations. IEEE Trans. Geosci. Remote Sens. 1998, 36, 1250–1265. [Google Scholar] [CrossRef] [Green Version]
  11. Xiong, X.; King, M.; Salomonson, V.; Barnes, W.; Wenny, B.; Angal, A.; Wu, A.; Madhavan, S.; Link, D. Moderate Resolution Imaging Spectroradiometer on Terra and Aqua Missions. In Optical Payloads for Space Missions; Qian, S., Ed.; John Wiley & Sons, Ltd.: Hoboken, NJ, USA, 2015. [Google Scholar]
  12. Xiong, X.; Butler, J.; Cao, C.; Wu, X. Optical Sensors—VIS/NIR/SWIR. In Comprehensive Remote Sensing Optical Sensors-VIS/NIR/SWIR, 2018 ed.; Liang, S., Ed.; Elsevier: Oxford, UK, 2018; Volume 1, pp. 353–375. [Google Scholar]
  13. Goldberg, M.D.; Cikanek, H.; Zhou, L.; Price, J. The Joint Polar Satellite System. In Comprehensive Remote Sensing Optical Sensors-VIS/NIR/SWIR, 2018 ed.; Liang, S., Ed.; Elsevier: Oxford, UK, 2018; Volume 1, pp. 91–118. [Google Scholar]
  14. Ardanuy, P.; Schueler, C.F.; Miller, S.W.; Kealy, P.S.; Cota, S.A.; Haas, J.K.; Welsch, C. NPOESS VIIRS Design Process. Proc. SPIE 2002, 4483, 22–34. [Google Scholar]
  15. Schueler, C.F.; Clement, E.; Ardanuy, P.; Welsh, C.; DeLuccia, F.; Swenson, H. NPOESS VIIRS sensor design overview. Proc. SPIE 2002, 4483, 11–23. [Google Scholar]
  16. Lee, T.; Miller, S.; Schueler, C.; Miller, S. NASA MODIS previews NPOESS VIIRS capabilities. Weather Forecast. 2006, 21, 649–655. [Google Scholar] [CrossRef]
  17. Zhou, L.; Divakarla, M.; Liu, X.; Layns, A.; Goldberg, M. An Overview of the Science Performances and Calibration/Validation of Joint Polar Satellite System Operational Products. Remote Sens. 2019, 11, 698. [Google Scholar] [CrossRef] [Green Version]
  18. Cao, C.; Deluccia, F.; Xiong, X.; Wolfe, R.; Weng, F. Early On-Orbit Performance of the Visible Infrared Imaging Radiometer Suite Onboard the Suomi National Polar-Orbiting Partnership (S-NPP) Satellite. IEEE Trans. Geosci. Remote Sens. 2014, 52, 1142–1156. [Google Scholar] [CrossRef] [Green Version]
  19. King, M.D.; Platnick, S. The Earth Observing System (EOS). In Comprehensive Remote Sensing Optical Sensors-VIS/NIR/SWIR, 2018 ed.; Liang, S., Ed.; Elsevier: Oxford, UK, 2018; Volume 1, pp. 7–26. [Google Scholar]
  20. Barnes, W.L.; Pagano, T.S.; Salomonson, V.V. Prelaunch characteristics of the Moderate Resolution Imaging Spectroradiometer (MODIS) on EOS-AM1. IEEE Trans. Geosci. Rem. Sens. 1998, 36, 4, 1088–1100. [Google Scholar] [CrossRef] [Green Version]
  21. Datla, R.U.; Rice, J.P.; Lykke, K.R.; Johnson, B.C.; Butler, J.J.; Xiong, X. Best Practice Guidelines for Pre-Launch Characterization and Calibration of Instruments for Passive Optical Remote Sensing. J. Res. Natl. Inst. Stand. Technol. 2009, 116, 621–646. [Google Scholar] [CrossRef]
  22. Oudrari, H.; Mcintire, J.; Xiong, X.; Butler, J.; Lee, S.; Lei, N.; Schwarting, T.; Sun, J. Prelaunch Radiometric Characterization and Calibration of the SNPP VIIRS Sensor. IEEE Trans. Geosci. Remote Sens. 2015, 53, 2195–2210. [Google Scholar] [CrossRef]
  23. Oudrari, H.; McIntire, J.; Xiong, X.; Butler, J.; Ji, Q.; Schwarting, T.; Lee, S.; Efremova, B. JPSS-1 VIIRS Pre-Launch Radiometric Performance. Remote Sens. 2016, 8, 41. [Google Scholar] [CrossRef] [Green Version]
  24. Chen, H.; Xiong, X.; Sun, C.; Chen, X.; Chaing, K. Suomi-NPP VIIRS day-night band on-orbit calibration and performance. J. Appl. Remote Sens. 2017, 11, 036019. [Google Scholar] [CrossRef]
  25. Chen, H.; Xiong, X.; Link, D.; Sun, C.; Chiang, K. NOAA-20 Visible Infrared Imaging Radiometer Suite day-night band on-orbit calibration and performance. J. Appl. Rem. Sens. 2020, 14, 034516. [Google Scholar] [CrossRef]
  26. Xiong, X.; Che, N.; Barnes, W.L. Terra MODIS On-orbit Spatial Characterization and Performance. IEEE Trans. Geosci. Remote Sens. 2005, 43, 355–365. [Google Scholar] [CrossRef]
  27. Xiong, X.; Che, N.; Barnes, W.L. Terra MODIS On-orbit Spectral Characterization and Performance. IEEE Trans. Geosci. Remote Sens. 2006, 44, 2198–2206. [Google Scholar] [CrossRef]
  28. Xiong, X.; Angal, A.; Twedt, K.; Chen, H.; Link, D.; Geng, X.; Aldoretta, E.; Mu, Q. MODIS Reflective Solar Bands On-Orbit Calibration and Performance. IEEE Trans. Geosci. Remote Sens. 2019, 57, 6355–6371. [Google Scholar] [CrossRef]
  29. Sun, J.; Xiong, X.; Barnes, W.; Guenther, B. MODIS Reflective Solar Bands On-orbit Lunar Calibration. IEEE Trans. Geosci. Remote Sens. 2007, 45, 2383–2393. [Google Scholar] [CrossRef]
  30. Sun, J.; Xiong, X.; Angal, A.; Chen, H.; Wu, A.; Geng, X. Time-Dependent Response Versus Scan Angle for MODIS Reflective Solar Bands. IEEE TGRS 2014, 52, 3159–3174. [Google Scholar] [CrossRef] [Green Version]
  31. Xiong, X.; Chiang, K.-F.; Adimi, F.; Li, W.; Yatagai, H.; Barnes, W.L. MODIS correction algorithm for out-of-band response in the short-wave IR bands. Proc. SPIE 2004, 5234, 605–614. [Google Scholar]
  32. Xiong, X.; Wu, A.; Wenny, B.N.; Madhavan, S.; Wang, Z.; Li, Y.; Chen, N.; Barnes, W.; Salomonson, V. Terra and Aqua MODIS Thermal Emissive Bands On-Orbit Calibration and Performance. IEEE Trans. Geosci. Remote Sens. 2015, 53, 5709–5721. [Google Scholar] [CrossRef]
  33. Xiong, X.; Wu, A.; Guenther, B.; Barnes, W.L. On-orbit Monitoring of MODIS Thermal Emissive Bands Response Versus Scan Angle. Proc. SPIE 2007, 6744, 67441I. [Google Scholar]
  34. Sun, J.; Xiong, X.; Madhavan, S.; Wenny, B.N. Terra MODIS Band 27 Electronic Crosstalk Effect and Its Removal. IEEE Transa. Geosci. Remote Sens. 2014, 52, 1551–1561. [Google Scholar] [CrossRef] [Green Version]
  35. Wilson, T.; Wu, A.; Shrestha, A.; Geng, X.; Wang, Z.; Moeller, C.; Frey, R.; Xiong, X. Development and Implementation of an Electronic Crosstalk Correction for Bands 27-30 in Terra MODIS Collection 6. Remote Sens. 2017, 9, 569. [Google Scholar] [CrossRef] [Green Version]
  36. Wang, Z.; Xiong, X.; Wu, A.; Chang, T. Update on the status of Aqua MODIS cold focal plane assembly temperature fluctuation. Proc. SPIE 2017, 10402, 104021R. [Google Scholar]
  37. NASA. VIIRS.1 NASA Goddard Space Flight Center, Joint Polar Satellite System (JPSS) VIIRS Radiometric Calibration Algorithm Theoretical Basis Document (ATBD); NASA: Washington, DC, USA, 2013. [Google Scholar]
  38. Xiong, X.; Butler, J.; Chiang, K.; Efremova, B.; Fulbright, J.; Lei, N.; McIntire, J.; Oudrari, H.; Sun, J.; Wang, Z.; et al. VIIRS on-orbit calibration methodologies and performance. J. Geophys. Res. 2014, 119, 5065–5078. [Google Scholar] [CrossRef]
  39. Lei, N.; Wang, Z.; Xiong, X. On-orbit Radiometric Calibration of Suomi NPP VIIRS Reflective Solar Bands through Observations of a Sunlit Solar Diffuser Panel. IEEE Trans. Geosci. Remote Sens. 2015, 53, 5983–5990. [Google Scholar] [CrossRef]
  40. Lei, N.; Xiong, X.; Guenther, B. Modeling the Detector Radiometric Gains of the Suomi NPP VIIRS Reflective Solar Bands. IEEE Trans. Geosci. Remote Sens. 2015, 53, 1565–1573. [Google Scholar] [CrossRef]
  41. Xiong, X.; Sun, J.; Fulbright, J.; Wang, Z.; Butler, J. Lunar Calibration and Performance for S-NPP VIIRS Reflective Solar Bands. IEEE Trans. Geosci. Remote Sens. 2016, 54, 1052–1061. [Google Scholar] [CrossRef]
  42. Sun, J.; Wang, M. Visible Infrared Imaging Radiometer Suite solar diffuser calibration and its challenges using a solar diffuser stability monitor. Appl. Opt. 2014, 53, 8571–8584. [Google Scholar] [CrossRef] [PubMed]
  43. Eplee, R.; Turpie, K.; Meister, G.; Patt, F.; Franz, B.; Bailey, S. On-orbit calibration of the Suomi National Polar-Orbiting Partnership Visible Infrared Imaging Radiometer Suite for ocean color applications. Appl. Opt. 2015, 54, 1984–2006. [Google Scholar] [CrossRef]
  44. Efremova, B.; Mcintire, J.; Moyer, D.; Wu, A.; Xiong, X. S-NPP VIIRS thermal emissive bands on-orbit calibration and performance. J. Geophys. Res. 2014, 119, 10859–10875. [Google Scholar] [CrossRef] [Green Version]
  45. Lei, N.; Xiong, X. Products of the SNPP VIIRS SD Screen Transmittance and the SD BRDFs from Both Yaw Maneuver and Regular On-orbit Data. IEEE Trans. Geosci. Remote Sens. 2017, 55, 1975–1987. [Google Scholar] [CrossRef]
  46. Lei, N.; Xiong, X. Determination of the NOAA-20 VIIRS screen transmittance functions with both the yaw maneuver and regular on-orbit calibration data. Appl. Opt. 2020, 59, 2992–3001. [Google Scholar] [CrossRef]
  47. Kwiatkowska, E.; Franz, B.; Meister, G.; McClain, C.; Xiong, X. Cross calibration of ocean color bands from the Moderate Resolution Imaging Spectroradiometer on the Terra platform. Appl. Opt. 2008, 47, 6796–6810. [Google Scholar] [CrossRef] [PubMed]
  48. Lyapustin, A.; Wang, Y.; Xiong, X.; Meister, G.; Platnick, S.; Levy, R.; Franz, B.; Korkin, S.; Hilkder, T.; Tucker, J.; et al. Science impact of MODIS C5 calibration degradation and C6+ improvements. Atmos. Meas. Tech. Discuss. 2014, 7, 7281–7319. [Google Scholar] [CrossRef] [Green Version]
  49. Angal, A.; Geng, X.; Xiong, X.; Twedt, K.; Wu, A.; Link, D.; Aldoretta, E. On-orbit calibration of Terra MODIS VIS bands using polarization-corrected desert observations. IEEE Trans. Geosci. Remote Sens. 2020, 58, 5428–5439. [Google Scholar] [CrossRef]
  50. Xiong, X.; Angal, A.; Li, Y. Improvements in the on-orbit calibration of the Terra MODIS short-wave infrared spectral bands. Proc. SPIE 2018, 10781, 107811C. [Google Scholar]
  51. Barrie, J.; Fuqua, P.; Meshishnek, M.; Ciofalo, M.; Chu, C.; Chaney, J.; Moision, R.; Graziani, L. Root cause determination of on-orbit degradation of the VIIRS rotating telescope assembly. Proc. SPIE 2012, 8510, 851009. [Google Scholar]
  52. Iona, G.; Butler, J.; Guenther, B.; Graziani, L.; Johnson, E.; Kennedy, B.; Kent, C.; Lambeck, R.; Waluschka, E.; Xiong, X. VIIRS on-orbit optical anomaly: Investigation, analysis, root cause determination and lessons learned. Proc. SPIE 2012, 8510, 85101C. [Google Scholar]
  53. Xiong, X.; Angal, A.; Barnes, W.L.; Chen, H.; Chiang, V.; Geng, X.; Li, Y.; Twedt, K.; Wang, Z.; Wilson, T.; et al. Updates of Moderate Resolution Imaging Spectroradiometer on-orbit calibration uncertainty assessments. J. Appl. Remote Sens. 2018, 12, 034001. [Google Scholar] [CrossRef]
  54. Lei, N.; Twedt, K.; McIntire, J.; Xiong, X. SNPP VIIRS RSB Earth View Reflectance Uncertainty. In Proceedings of the IEEE 2017 International Geoscience Remote Sensing Symposium, Fort Worth, TX, USA, 23–28 July 2017; pp. 5916–5919. [Google Scholar]
  55. Chiang, K.; McIntire, J.; Xiong, X. VIIRS Thermal Emissive Bands L1B Calibration Uncertainty. In Proceedings of the IEEE 2017 International Geoscience & Remote Sensing Symposium, Fort Worth, TX, USA, 23–28 July 2017; pp. 4197–4200. [Google Scholar]
  56. Rao, C.R.N.; Chen, J. Inter-satellite calibration linkages for the visible and near-infrared channels of the Advanced Very High Resolution Radiometer on the NOAA-7,-9, and-11 spacecraft. Int. J. Remote Sens. 1995, 16, 1931–1942. [Google Scholar]
  57. Abdou, B.A.; Bruegge, C.J.; Helmlinger, M.C.; Conel, J.E.; Pilorz, S.H.; Ledeboer, W.; Gaitley, B.; Thome, K. Vicarious calibration experiment in support of the Multi-angle Imaging SpectroRadiometer. IEEE Trans. Geosci. Remote Sens. 2002, 40, 1500–1511. [Google Scholar] [CrossRef]
  58. Biggar, S.F.; Thome, K.J.; Wisniewski, W. Vicarious radiometric calibration of EO-1 sensors by reference to high-reflectance ground targets. IEEE Trans. Geosci. Remote Sens. 2003, 41, 1174–1179. [Google Scholar] [CrossRef] [Green Version]
  59. Thome, K.; Biggar, S.; Choi, H. Vicarious calibration of Terra ASTER, MISR, and MODIS. In Proceedings SPIE Earth Observing Systems IX; International Society for Optics and Photonics: Bellingham, WA, USA, 2004; Volume 5542, pp. 290–299. [Google Scholar]
  60. Cao, C.; Weinreb, M.; Xu, H. Predicting simultaneous nadir overpasses among polar-orbiting meteorological satellites for intersatellite calibration of radiometers. J. Atmos. Ocean. Technol. 2004, 21, 537–542. [Google Scholar] [CrossRef]
  61. Wu, A.; Xiong, X.; Cao, C. Terra and Aqua MODIS inter-comparison of three reflective solar bands using AVHRR onboard the NOAAKLM satellites. Int. J. Remote Sens. 2008, 29, 1997–2010. [Google Scholar] [CrossRef]
  62. Doelling, D.R.; Haney, C.O.; Scarino, B.R.; Gopalan, A.; Bhatt, R. Improvements to the geostationary visible imager ray-matching calibration algorithm for CERES Edition 4. J. Atmos. Oceanic Technol. 2016, 33, 2679–2698. [Google Scholar] [CrossRef]
  63. Uprety, S.; Cao, C.; Xiong, X.; Blonski, S.; Wu, A.; Shao, X. Radiometric intercomparison between Suomi-NPP VIIRS and aqua MODIS reflective solar bands using simultaneous nadir overpass in the low latitudes. J. Atmos. Ocean. Technol. 2013, 30, 2720–2736. [Google Scholar] [CrossRef]
  64. Heidinger, A.K.; Cao, C.; Sullivan, J. Using Moderate Resolution Imaging Spectrometer (MODIS) to calibrate advanced very high resolution radiometer reflectance channels. J. Geophys. Res. 2002, 107, 4702. [Google Scholar] [CrossRef] [Green Version]
  65. Tobin, D.C.; Revercomb, H.; Moeller, C.; Pagano, T. Use of atmospheric infrared sounder high–spectral resolution spectra to assess the calibration of Moderate resolution Imaging Spectroradiometer on EOS Aqua. J. Geophys. Res. 2006, 111, D09S05. [Google Scholar] [CrossRef]
  66. Veglio, P.; Tobin, D.C.; Dutcher, S.; Quinn, G.; Moeller, C. Long-term assessment of Aqua MODIS radiance observation using comparisons with AIRS and IASI. J. Geophys. Res. Atmos. 2016, 121, 8460–8471. [Google Scholar] [CrossRef]
  67. Efremova, B.; Wu, A.; Xiong, X. Relative spectral response corrected calibration inter-comparison of S-NPP VIIRS and Aqua MODIS thermal emissive bands. Proc. SPIE 2014, 9218, 92180G. [Google Scholar]
  68. Li, Y.; Wu, A.; Xiong, X. Inter-comparison of S-NPP VIIRS and Aqua MODIS thermal emissive bands using hyperspectral infrared sounder measurements as a transfer reference. Remote Sens. 2016, 8, 72. [Google Scholar] [CrossRef] [Green Version]
  69. Xiong, X.; Wu, A.; Wenny, B.; Choi, T.; Angal, A. Progress and lessons from MODIS calibration intercomparison using ground test sites. Can. J. Remote Sens. 2010, 36, 540–552. [Google Scholar] [CrossRef]
  70. Wenny, B.; Xiong, X. Using a Cold Earth Surface Target to Characterize Long-term Stability of the MODIS Thermal Emissive Bands. IEEE Geosci. Remote Sens. Lett. 2008, 5, 162–165. [Google Scholar] [CrossRef]
  71. Xiong, X.; Wu, A.; Wenny, B. Using Dome C for moderate resolution imaging spectroradiometer calibration stability and consistency. J. Appl. Remote Sens. 2009, 3, 033520. [Google Scholar]
  72. Madhavan, S.; Brinkmann, J.; Wenny, B.N.; Wu, A.; Xiong, X. Evaluation of VIIRS and MODIS thermal emissive band calibration stability using ground target. Remote Sens. 2016, 8, 158. [Google Scholar] [CrossRef] [Green Version]
  73. Diaz, C.P.; Xiong, X.; Wu, A. MODIS thermal emissive bands calibration stability using in-situ ocean targets and remotely-sensed SST retrievals provided by the group for high resolution sea surface temperature. In Proceedings SPIE 11014, Ocean Sensing and Monitoring XI; International Society for Optics and Photonics: Bellingham, WA, USA, 2019; Volume 110140, p. 110140. [Google Scholar]
  74. Wu, A.; Chiang, K.; Lei, N.; Xiong, X. Evaluation of NOAA-20 VIIRS reflective solar bands calibration performance using vicarious approaches. In Proceedings of SPIE, Sensors, Systems, and Next-Generation Satellites XXIII; International Society for Optics and Photonics: Bellingham, WA, USA, 2019; Volume 11151, p. 1115125. [Google Scholar]
  75. Uprety, S.; Cao, C.; Shao, X. Radiometric consistency between GOES-16 ABI and VIIRS on Suomi NPP and NOAA-20. J. Appl. Remote Sens. 2020, 14, 032407. [Google Scholar] [CrossRef]
  76. Gottwald, M.; Bovensmann, H. SCIAMACHY-Exploring the Changing Earth’s Atmosphere; Springer: Dordrecht, The Netherlands; Heidelberg, Germany; London, UK; New York, NY, USA, 2011; ISBN 978-90-481-9895-5. [Google Scholar]
  77. Wu, A.; Xiong, X.; Doelling, D.; Morstad, D.; Angal, A.; Bhatt, R. Characterization of Terra and Aqua MODIS VIS, NIR, and SWIR Spectral Bands’ Calibration Stability. IEEE Trans. Geosci. Remote Sens. 2012, 51, 4330–4338. [Google Scholar] [CrossRef]
  78. Doelling, D.R.; Wu, A.; Xiong, X.; Scarino, B.R.; Bhatt, R.; Haney, C.O.; Morstad, D.; Gopalan, A. The Radiometric Stability and Scaling of Collection 6 Terra-and Aqua-MODIS VIS, NIR, and SWIR Spectral Bands. IEEE Trans. Geosci. Remote Sens. 2015, 53, 4520–4535. [Google Scholar] [CrossRef]
Figure 1. MODIS scan cavity with on-board calibrators [4].
Remotesensing 12 03167 g001
Figure 2. VIIRS scan cavity with on-board calibrators [23].
Remotesensing 12 03167 g002
Figure 3. SD degradation as observed by select solar diffuser stability monitor (SDSM) detectors for Terra MODIS (a), Aqua MODIS (b), S-NPP VIIRS (c), and N20 VIIRS (d) instruments. D1 (0.41 μm), D4 (0.55 μm), and D7 (0.86 μm).
Remotesensing 12 03167 g003
Figure 4. Terra (a) and Aqua (b) MODIS SD and Lunar on-orbit gain change trends (mirror side 1) for visible (VIS) bands 8 and 3 (dashed lines with symbols: moon; solid lines: SD). B3 (black color): 0.46 μm, B8 (blue color): 0.41 μm.
Remotesensing 12 03167 g004
Figure 5. S-NPP (a) and N20 (b) VIIRS SD and lunar on-orbit gain change trends for select VIS and near-infrared (NIR) bands (symbols: moon; solid lines: SD). M1: 0.41 μm, M3: 0.49 μm, M5: 0.67 μm, M7: 0.86 μm.
Remotesensing 12 03167 g005
Figure 6. On-orbit gain change as a function of wavelength at a few select years during the missions for (a) Aqua MODIS and (b) S-NPP VIIRS.
Remotesensing 12 03167 g006
Figure 7. On-orbit gain change trends for select TEB for (a) Terra MODIS, (b) Aqua MODIS, (c) S-NPP VIIRS, and (d) N20 VIIRS.
Remotesensing 12 03167 g007
Figure 8. Comparison of Terra band 27 images before (C6) and after the crosstalk correction (C6.1). The image is of Hurricane Dorian on 5 September 2019.
Remotesensing 12 03167 g008
Figure 9. Example of a simultaneous nadir overpass (SNO) (8 October 2019) pixel-to-pixel comparison of reflectance between Aqua MODIS band 1 and S-NPP VIIRS band I1 at 0.65 μm (left) and band 2 and I2 at 0.86 μm (right).
Remotesensing 12 03167 g009
Figure 10. Trends of Terra (black) and Aqua (red) MODIS band 1 to S-NPP VIIRS band I1 reflectance ratios.
Remotesensing 12 03167 g010
Figure 11. Comparison of S-NPP (green) and N20 (blue) VIIRS brightness temperature (BT) difference as a function of BT for I5 (11.4 μm) using Infrared Atmospheric Sounding Interferometer (IASI) as a transfer radiometer. Results of S-NPP and N20 are referenced to Aqua MODIS band 31 and corrected for the RSR differences using IASI from their SNOs.
Remotesensing 12 03167 g011
Figure 12. Trends of S-NPP (green) and N20 (blue) VIIRS reflectance normalized with MODIS-based BRDF for band I1 (0.65 μm), obtained from 16-day repeatable nadir overpasses over the Libya-4 desert site.
Remotesensing 12 03167 g012
Figure 13. Relative bias in BT of S-NPP VIIRS M15 relative to Aqua MODIS band 31 determined from the double difference method using near surface temperature measurements at the Dome C site.
Remotesensing 12 03167 g013
Table 1. Spectral characteristics (in μm), typical radiance (in W/m2/μm/Sr) and temperature (in K), signal to noise ratio (SNR) and noise equivalent temperature difference (NEdT; in K), and primary use of each Moderate Resolution Imaging Spectroradiometer (MODIS) band. The SNR (for reflective solar bands, RSB) and NEdT (for thermal emissive bands, TEB) are given for pre-launch (PL) measurements and three on-orbit time periods.
BandCenter WavelengthBandwidthLtyp or TtypSNR/NEdT Spec.Terra SNR/NEdTAqua SNR/NEdTPrimary Purpose
PL200220112020PL200220112020
10.6450.0521.8128172192203190182197211227Land/cloud/aerosol boundaries
20.8580.03524.7201418489515490446509552567
30.4690.0235.3243309317216195316321287285Land/cloud/aerosol properties
40.5550.0229228310322272214308324322326
51.240.025.474114938681149151145145
61.640.0247.3275393383374368132452446488
72.130.051110701039893141154154156
80.4120.01544.98809069877126919771121749728Ocean color, phytoplankton, biogeochemistry
90.4430.0141.9838114814429788601391153812621233
100.4880.0132.180210991525130911581307156014301419
110.5310.0127.975411541686161314401282172616951683
120.5510.0121750983140011979521185152814791489
130.6670.019.591010651346138013601210144214991522
140.6780.018.7108712531485138012081207157115851600
150.7480.0110.25867561451148814261078156616091618
160.8690.0156.2516712121412591243944143614651481
170.9050.0310167359348329291251368374375Atmospheric water vapor
180.9360.013.6579290939288919294
190.940.0515250465508487445381509515514
261.3750.036150213250242224224280280280Cirrus clouds
203.750.183000.050.020.030.030.030.020.020.020.02Surface/cloud temperature
213.960.063350.2 0.170.160.16 0.200.210.19
223.960.063000.070.030.030.030.030.020.020.020.02
234.050.063000.070.020.020.020.030.020.020.020.02
244.470.072500.250.120.130.130.130.140.110.110.11Atmospheric temperature
254.520.072750.250.060.050.050.050.050.040.040.04
276.720.362400.250.110.090.100.170.100.100.100.10Water vapor
287.330.32500.250.050.060.060.070.050.050.050.05
298.550.33000.050.020.020.030.030.020.020.020.02Cloud properties
309.730.32500.250.100.100.110.150.070.090.090.10Ozone
3111.030.53000.050.030.030.030.030.030.020.020.02Surface/cloud temperature
3212.020.53000.050.030.040.040.040.010.030.030.03
3313.340.32600.250.140.130.130.140.080.080.080.08Cloud top altitude
3413.640.32500.250.200.200.200.210.120.120.120.12
3513.940.32400.250.330.230.230.240.140.150.150.15
3614.240.32200.350.440.430.440.450.220.230.230.23
Table 2. Spectral characteristics (in μm), typical radiance (in W/m2/μm/Sr) and temperature (in K), signal to noise ratio (SNR) and noise equivalent temperature difference (NEdT; in K), and primary purposes of each Visible Infrared Imaging Radiometer Suite (VIIRS) band. The SNR (for RSB) and NEdT (for TEB) are given for pre-launch (PL) measurements and three on-orbit time periods. For band M11, the typical radiance and SNR specifications were changed between Suomi National Polar-Orbiting Partnership (S-NPP) and NOAA-20 (N20); the N20 numbers are given in parentheses.
BandCenter WavelengthBandwidthLtyp or TtypSNR/NEdT Spec.SNPP SNR/NEdTN20 SNR/NEdTPrimary Purpose
PL201220162020PL201820192020
I10.640.0822119241208197193227224224224Imaging bands
I20.8650.03925150304255206189287281282282
I31.610.067.36172150135129190178178179
I43.740.382702.50.4100.4080.4050.4070.4200.4020.3930.396
I511.451.92101.50.4200.3840.3970.4020.4100.4210.4230.424
M1 HG0.4120.0244.9352617580568558636637641635Ocean Color, Aerosols
M1 LG155316109210369989851066109711101092
M2 HG0.4450.01840380622575570567573560562562
M2 LG14640911181037102310349869919981004
M3 HG0.4880.0232416690628620616706675677677
M3 LG12341411119859669681063102210531038
M4 HG0.5550.0221362581538529527559538540540
M4 LG90315963836838833844833839832
M5 HG0.6720.0210242367323293297380386386386
M5 LG68360828688629616751761764761
M60.7460.0159.6199415355319304428416416416
M7 HG0.8650.0396.4215520444355327549524527526
M7 LG33.4340846600457412760702710711
M81.240.025.474273224175159335322322323Cloud Particle Size, Cirrus, Snow Fractions
M91.3780.015683253225190177325297297298
M101.610.067.3342714585526506765657659665
M112.250.050.12 (1)10 (90)25212120216198199199
M123.70.182700.3960.1300.1280.1170.1170.1200.0980.1000.099SST, Cloud Top properties
M13 HG4.050.1553000.1070.0440.0420.0400.0400.0430.0400.0390.039
M13 LG3800.423
M148.550.32700.0910.0610.0530.0550.0550.0500.0470.0470.047
M1510.76313000.070.0300.0290.0270.0270.0260.0240.0240.024
M1612.0130.953000.0720.0380.0280.0290.0290.0430.0310.0310.031
Table 3. Terra and Aqua MODIS RSB and TEB comparison. Results are provided in percentage difference (Terra–Aqua)/Aqua (%) for RSB and in Kelvin (K) (Terra–Aqua) for TEB. Values in parentheses are the standard error. Those marked n/a are either not applicable or are excluded due to saturation.
MethodPeriodB1B2B4B8B9B12B20B29B31B32B35
SNO2012–2020(−)1.2
(1.3)
(−)0.8
(1.4)
(−)0.8
(1.1)
0.5
(1.6)
1.0
(1.7)
(−)1.3
(3.2)
0.11
(1.24)
(−)0.03
(0.20)
0.10
(0.15)
0.11
(0.17)
0.20
(0.19)
Desert2002–2020(−)1.2
(1.0)
0.3
(1.1)
(−)0.3
(1.2)
(−)0.2
(1.9)
(−)0.5
(1.7)
n/an/an/an/an/an/a
Dome C2002–2019(−)0.8
(2.6)
0.6
(2.6)
(−)0.1
(2.7)
n/an/an/a0.96
(4.37)
0.24
(2.52)
0.21
(2.53)
0.26
(2.52)
(–)0.14
(2.55)
Ocean2010–2019n/an/an/an/an/an/a0.23
(2.24)
(–)0.02
(2.33)
(–)0.03
(2.49)
0.04
(2.48)
1.71
(0.81)
Table 4. N20 and S-NPP VIIRS RSB and TEB comparison. Results are provided in percentage difference (S-NPP(–)N20)/S-NPP (%) for RSB and in Kelvin (K) (N20(–)S-NPP) for TEB. Values in parentheses are the standard error. Those marked n/a are either not applicable or are excluded due to saturation.
MethodPeriodM1M2M4M7I1I2M13M14M15M16I5
SNO2018–20206.3
(1.8)
5.2
(1.6)
3.4
(1.6)
3.5
(1.8)
3.8
(1.6)
3.6
(1.8)
0.12
(0.22)
n/a0.02
(0.20)
0.10
(0.15)
0.10
(0.16)
Desert2018–20207.0
(1.3)
6.1
(1.2)
3.7
(1.2)
2.8
(0.9)
3.7
(1.1)
3.1
(1.1)
n/an/an/an/an/a
Dome C2018–20196.7
(1.4)
4.7
(1.4)
5.2
(2.9)
2.9
(2.9)
3.8
(2.7)
3.3
(3.0)
(−)0.15
(1.96)
0.23
(2.09)
0.70
(2.17)
0.64
(2.19)
n/a
Ocean2018–2020n/an/an/an/an/an/a0.01
(4.72)
0.60
(5.46)
0.11
(6.04)
(−)0.07
(6.41)
n/a
Table 5. N20 VIIRS and Aqua MODIS reflective solar band (RSB) and TEB comparison. Results are provided in percentage difference (Aqua(−)N20)/Aqua (%) for RSB and (Aqua(−)N20) Kelvin (K) for TEB. Values in parentheses are the standard error. Those marked n/a are not applicable.
MethodPeriodM1
B8
M2
B9
M4
B4
M7
B2
I1
B1
I2
B2
M13
B22
M13
B23
M15
B31
M16
B32
SNO2018–20202.1
(1.6)
5.0
(1.5)
3.2
(1.5)
2.8
(1.7)
3.0
(1.5)
2.7
(1.7)
0.09
(0.52)
0.11
(0.51)
0.11
(0.22)
0.07
(0.23)
Desert2018–20204.2
(1.1)
5.3
(0.8)
2.4
(0.8)
0.6
(0.5)
3.6
(0.7)
0.9
(0.8)
n/an/an/an/a
Dome C2018–20203.9
(1.0)
n/a2.6
(1.8)
1.0
(2.2)
2.9
(1.8)
1.3
(2.2)
(−)0.95
(2.75)
1.24
(1.59)
(−)0.13
(1.60)
(−)0.24
(1.59)

