Article

Precise Orbit Determination of the China Seismo-Electromagnetic Satellite (CSES) Using Onboard GPS and BDS Observations

1
Key Laboratory of Earthquake Geodesy, Institute of Seismology, China Earthquake Administration, Wuhan 430071, China
2
First Institute of Oceanography, Ministry of Natural Resources, Qingdao 266061, China
3
GNSS Research Center, Wuhan University, Wuhan 430079, China
*
Author to whom correspondence should be addressed.
Remote Sens. 2020, 12(19), 3234; https://0-doi-org.brum.beds.ac.uk/10.3390/rs12193234
Submission received: 4 August 2020 / Revised: 17 September 2020 / Accepted: 29 September 2020 / Published: 4 October 2020

Abstract

:
The Global Navigation Satellite System (GNSS) occultation receiver onboard the China Seismo-Electromagnetic Satellite (CSES) can provide dual-frequency observations for both GPS and BDS-2 satellites. In this study, the data quality and orbit determination performance of the CSES are assessed. Severe data loss of about 30% is observed in GPS P2/L2 data, resulting in only 11% of epochs possessing six to eight useful GPS satellites. Due to fewer channels being allocated for BDS signals, less than 5% of epochs have more than three useful BDS satellites. Precise orbit determination (POD) of CSES is firstly carried out using GPS data. The results indicate that the orbit overlap differences improved from 3.65 cm to 2.8 cm in 3D root mean square (RMS) by antenna phase center correction. CSES orbits are then derived from the BDS only, and combined GPS and BDS data. BDS-based POD indicates that adding BDS geostationary Earth orbit (GEO) satellites could dramatically degrade the orbit accuracy. When excluding BDS GEO satellites, the orbit overlap differences of BDS-based and combined POD are 23.68 cm and 2.73 cm in 3D, respectively, while the differences compared with GPS-based POD are 14.83 cm and 1.05 cm, respectively. The results suggest that the obtained orbit can satisfy centimeter-level requirements. Given that large GPS tracking losses occurred and few channels are allocated for BDS signals, it is expected that POD performance can be further improved by increasing the number of dual-frequency observations.

Graphical Abstract

1. Introduction

The China Seismo-Electromagnetic Satellite (CSES), also known as ZhangHeng-1, was launched on 2 February 2018. It is currently located in a 507 km sun-synchronous orbit with a nominal lifetime of 5 years. This satellite is China’s first spaceborne platform dedicated to geophysical field measurement and earthquake monitoring by detecting electromagnetic variations in space [1]. The CSES focuses on the modelling of the global geomagnetic field, ionosphere and gravity field. As part of the CSES scientific application, ionospheric research and neutral atmospheric inversion require orbit accuracy at centimeter-level. On the other hand, China plans to carry out more low Earth orbit (LEO) scientific missions on a geophysical field for monitoring earthquakes, sensing the atmosphere or determining the Earth’s gravity field. Among them, the inversion of the Earth’s gravity field also requires an orbit accuracy at centimeter-level.
There are eight scientific payloads carried on the CSES (Figure 1): a high-precision magnetometer (HPM) to measure the magnetic field [2]; a high energetic particle package (HEPP) and a high energetic particle detector (HEPD) to measure the energetic electron and proton spectrum [3]; an electric field detector (EFD) [4] and a search coil magnetometer (SCM) [5] to measure the electromagnetic waves; a plasma analyzer package (PAP) and a Langmuir probe (LAP) to measure the in situ plasma parameters [6]; a Global Navigation Satellite System (GNSS) occultation receiver (GOR) [7] and a tri-band beacon [8] to measure the electron density profiles. The GNSS occultation receiver can track both GPS and BDS-2 signals and can record dual-frequency code and carrier phase observations, which can be used for precise orbit determination (POD) and onboard navigation. These valuable GPS and BDS observations can provide opportunities for evaluating the onboard data quality as well as the POD performances using these data. The relevant conclusions are also referable for follow-up LEO scientific missions.
In the early 1990s, the TOPEX/POSEIDON [9] was the first low Earth orbit (LEO) satellite equipped with a dual-frequency GPS receiver, which could track up to six GPS satellites. Using onboard GPS data, the orbit accuracy obtained in the radial component was within 4 cm, which is significantly better than the expected accuracy of 13 cm. Following the successful application of GPS-based POD on the TOPEX/POSEIDON satellite and the breakthrough of highly dynamic satellite-borne receiver technology, numerous other LEO satellites/spacecrafts with high position accuracy requirements have used onboard GPS techniques for POD purposes. TheBlackJack receiver of Jet Propulsion Laboratory (JPL) could track as many as 16 GPS satellites [10]. It was applied successfully on GRACE satellites [11,12] and could reach centimeter-level POD accuracy, thus meeting the requirements of gravity recovery research missions.
The above overview indicates a great application potential of onboard GNSS technology based on other systems, such as BDS. In the early stages, GNSS receivers onboard LEO satellites could not track BDS signals. Liu et al. [13] simulated the onboard receiver of BDS-2 observations to evaluate the influence of BDS on POD of LEO satellites. The resultant POD accuracy was 30 cm in 3D root mean square (RMS). In recent years, China has begun to launch LEO satellites that can track BDS signals. Li et al. [14] performed POD for the Chinese meteorological satellite Fengyun-3C based on GPS and BDS data. The results showed an orbit consistency with GPS data of approximately 2.73 cm in 3D. Both BDS-only and combined GPS and BDS results indicated that including BDS geostationary Earth orbit (GEO) satellites could significantly degrade accuracy. For combined POD, for instance, orbit consistency improved from around 3.4 cm to 2.73 cm in 3D when BDS GEO satellites were excluded, reaching an accuracy comparable to the GPS-only solution. Xiong et al. [15] also analyzed the POD results of the Fengyun-3C and found an orbit consistency of 3.8 cm with GPS data and 22 cm with BDS data. Further analysis showed that the orbit accuracy could improve to 3.45 cm for combined POD using Helmert variance component estimation [16].
In this study, we analyze the POD of the CSES based on GPS and BDS data. In the following sections, the CSES platform is introduced and the quality of onboard GPS and BDS data is assessed. Antenna phase center correction is then conducted based on GPS data to improve POD performance. Subsequently, CSES orbits are derived via GPS-based, BDS-based, as well as combined GPS and BDS-based POD. POD performance is evaluated using orbit consistency considerations, in the form of residual analysis and orbit overlap comparisons. Furthermore, the estimated orbits obtained via GPS-based POD are used as a reference to evaluate the accuracy of BDS-based POD and combined POD. Finally, the conclusions of the study are provided.

2. Materials and Methods

2.1. CSES Platform Description

The CSES structure is composed of a hexahedron and three solar panels. The satellite body-fixed (SBF) frame (Figure 1) is defined as follows: the origin is the center of mass, the +Z axis is opposite to the satellite radial direction, the +X axis points to the velocity direction of the satellite and the Y-axis is perpendicular to the Z-axis and the X-axis, completing the right-hand coordinate system. The solar panels are located on the +Y side of the satellite with an offset angle of 12° and rotate around the Y-axis [17]. The total mass of the satellite is 719 kg, including 42 kg of fuel. The CSES carries a GNSS occultation receiver for POD and onboard navigation purposes.
The GNSS occultation sounder instrument onboard the CSES can track the dual-frequency signals of both GPS and BDS satellites. Four antennas, i.e., the positioning antenna and three sets of occultation antennas, were installed on this instrument. The GNSS receiver allocates eight channels to receive GPS signals and six for BDS signals coming from the positioning antenna. It should be noted that when the occultation antennas can receive more than five satellite signals, at least two BDS channels for the positioning antenna are allocated to receive signals from the occultation antenna. This implies that only four BDS channels are normally available for positioning, which could degrade the performance of BDS-based POD. The phase center offset (PCO), i.e., the deviation between the positioning antenna and the center of the satellite mass in the SBF coordinate system, is measured as (−6.1, 118.4, −932.67) mm for L1 frequency signal and (−6.1, 118.4, −927.67) mm for L2 frequency signal.

2.2. Data Collection and Quality Analysis

To generate an orbit solution for the CSES, one-month onboard GPS and BDS data from day of year (DOY) 201 to 231, 2018, were collected. The data were recorded at 1-s sampling rate, including GPS L1/L2 frequency and BDS B1/B2 frequency data.
Figure 2 displays sky-plots of Signal to Noise Ratio (SNR) variation with elevation and azimuth in the antenna reference frame (ARF). It is evident that in all cases, the SNR becomes weaker at lower elevations. For GPS, the SNR is higher for L1 than for L2 frequencies. Further tracking losses in L2 data can be observed when the elevation drops below 20°. Unlike the GPS case, the SNR of BDS B1 is lower than that of B2, which may be due to the different signal modulation method and transmission power of B1 and B2. The horizontal distribution of BDS B1 and B2 is similar. Figure 3 shows the number of GPS and BDS observations on DOY 202, 2018. Note that there are no observations for G04 during the study period. It can be seen that there are approximately 30% fewer GPS P2/L2 observations than GPS CA/L1 observations. This is mainly due to the lower transmitting power of L2, which leads to a weaker signal more prone to losses, especially at low elevations (Figure 2). For BDS, the number of B1 and B2 observations is comparable. In general, the conclusions drawn from Figure 3 are consistent with those in Figure 2.
Dual-frequency ionosphere-free linear combinations of GPS and BDS data are used for POD of the CSES. Due to tracking losses at one frequency, there are more tracked observations than dual-frequency observations. Furthermore, short arcs and epochs with large residuals will be excluded from the orbit solution. Therefore, there are less useful observations than dual-frequency observations. Figure 4 shows the average percentage of all tracked (blue), dual-frequency (red) and useful (yellow) GPS and BDS satellites per epoch during the experiment. The largest number of tracked GPS satellites is seven, however, it is reduced to five for dual-frequency satellites and four for useful satellites. Only 11% of epochs possess from six to eight useful satellites. The statistics of BDS are quite different from that of GPS; the composition of dual-frequency data is similar to that of tracking data, which is consistent with Figure 2. As for the useful satellites, about 27% of epochs have zero satellites and less than 5% of epochs have more than three satellites. Compared to the Fengyun-3C satellite, the average number of useful GPS and BDS satellites tracked by the CSES is approximately two fewer per epoch [14,18].
The revisit period for the CSES is five days [17]. The useful number of GPS and BDS satellites along the CSES ground tracks of the five-day arc from DOY 202 to DOY 206, 2018 are shown in Figure 5. It is obvious that the number of useful GPS satellites is evenly distributed across the globe. However, the observed useful BDS satellites are mainly distributed in the Eastern Hemisphere, while most of the Western Hemisphere has only zero to two satellites available. This is because the BDS-2 constellation is mainly distributed in the Asia–Pacific Ocean region. Only few epochs have six usable satellites, reaching the maximum number of BDS channels allocated for positioning antenna, because in most cases, at least two of the channels receiving BDS signals are allocated for occultation antennas.

2.3. POD Strategy

The Positioning and Navigation Data Analyst (PANDA) software [19] developed by the GNSS Research Centre of Wuhan University was adapted for this study. High-precision GPS and BDS orbit and clock products are required for CSES POD. The final GPS orbits of the International GNSS Service (IGS) are adopted. Since the CSES POD has a 30-s sampling rate, 30 s clock products were adopted in this study to avoid the precision loss caused by interpolation. A GPS-assisted two-step POD method was used to generate the BDS orbit and 30 s clock products using PANDA software. There are about 110 stations of the IGS Multi-GNSS Experiment (MGEX) that were used for BDS orbit determination. Among all MGEX (Multi-GNSS Experiment) Analysis Centers, only GFZ (GeoForschungsZentrum, Potsdam, German) has 30 s clock products of all BDS satellite types. Thus, the BDS products calculated by us using PANDA and those provided by GFZ are adopted separately to analyze their respective impacts on POD of the CSES.
The precision orbit and 30 s clock products of GPS and BDS used for POD were obtained as explained above. Existing research shows that orbit comparisons in 3D RMS of different analysis centers are approximately 0.1–0.2 m for BDS Medium Earth Orbit (MEO) satellites, 0.2–0.3 m for BDS Inclined Geosynchronous Satellite Orbit (IGSO) satellites, and several meters for BDS GEO satellites [20]. Table 1 gives the orbit differences of BDS orbits calculated by PANDA and provided by GFZ during the study period. It shows that the 3D orbit differences reach several meters for BDS GEO satellites but are within 0.2 m for BDS IGSO and MEO satellites.
In the POD data processing, some issues on the dynamic model and the observation model need to be considered. The Earth gravity model of Earth EIGEN-6C [21] was used. The EIGEN-6C model includes a static part and a temporal part. The box-wing model [22] is used to calculate the solar radiation pressure (SRP) on the satellite. The SRP of the satellite’s solar panels are not considered yet as a detailed rotation model of these is not available. Another important issue is the type and estimation interval of piecewise dynamics parameters (atmospheric drag coefficients and empirical accelerations) used to compensate for dynamic errors. These parameters are often estimated empirically for each orbit revolution, as the mismodelled or un-modelled forces acting on satellites usually vary according to the orbital period. In this study, the drag coefficients were estimated every four cycles, i.e., every 360 min. The piecewise periodic empirical accelerations in the along-track, cross-track and radial direction were estimated every 90 min for both GPS-based POD and combined GPS and BDS POD. For the BDS-only solution, because of the small number and uneven distribution (Figure 5) of observations, the 1CPR empirical accelerations were estimated every 360 min to ensure sufficient observations for each set of parameters.
The antenna phase center offsets (PCOs) and antenna phase center variations (PCVs) for GPS satellites were corrected with IGS values. For BDS satellites, the PCOs were corrected with IGS MGEX, while the PCVs were not considered. As for the CSES, the PCO was first corrected using the ground calibration values provided in the section of CSES platform description. The Z component of the PCO was then estimated based on the GPS-only solution. The corresponding phase residuals are modelled as a PCV map. The estimated PCO Z component and PCV map were further applied in BDS-based POD and combined POD. The detailed POD strategy is given in Table 2.
Based on previous experiences with LEO POD [14,28], a 30-h arc length was used for CSES POD, i.e., from 21:00 of the first day to 3:00 of the third day. The middle 24 h arc (from 24:00 of the first day to 24:00 of the second day) was used as a precision orbit product. Figure 6 shows the percentage of lost epochs for each arc, which can be considered an indicator of data loss. For GPS observations, the data loss rate is consistently less than 5% except for a 9.8% loss on DOY 201. By contrast, the BDS data loss percentage reaches up to 25% for most of the arcs. The high BDS data loss rate will affect the accuracy of BDS-only POD for the CSES.

3. Results

In this section, PCO estimation and PCV modelling are carried out based on GPS observations. PCO and PCV corrections are then applied for GPS-based, BDS-based and combined POD. Orbit consistency is used to evaluate POD performance, including residual analysis and orbit overlap comparison. Further, the estimated orbits of GPS-based POD are used as a reference to evaluate the orbit accuracy of BDS-based and combined POD.

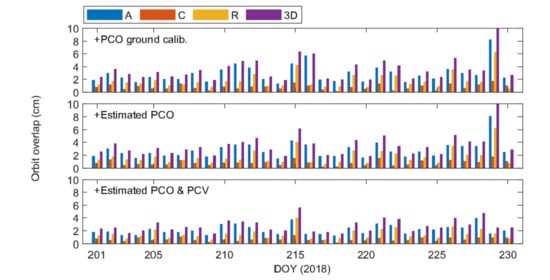
3.1. Antenna Phase Center Modelling Based on GPS Data

Phase center correction of the positioning antenna is important for GNSS-based POD of LEO satellites. Empirical PCOs of the CSES GNSS positioning antenna are provided prior to launch, while the PCVs are not provided. Moreover, PCO calibration before launch cannot reflect the actual space environment. Therefore, PCOs and PCVs need to be modelled further. Due to the high precision of GPS orbits, GPS data were adopted for antenna phase center correction research in this study. The aforementioned corrections were then also applied in BDS-based and combined POD.
Choi [29] demonstrated on the Jason-1 satellite that the X and Y components of PCO cannot be separated from the along-track and cross-track empirical parameters. The Z component of PCO, however, can be determined when there is no empirical constant radial acceleration. Thus, only the Z component of PCO was estimated in the current study. Figure 7 shows the estimated values of each orbit arc during the one-month study period. It can be seen that the estimated Z component value fluctuates from −10 mm to 0 mm with a linear slope. The average value of Z component estimation is −3.4 mm and the standard deviation is 2.2 mm. The trend of the results will be more reliable and accurate if the data series covers one year.
The phase residuals can be used to measure the consistency between the calculated orbit and the tracking data. During POD calculation, some of the unmodelled errors will be absorbed by the parameters to be estimated, while the remaining errors will be contained in the residuals. Thus, the post-fit residual provides an indication of model accuracy. In reduced dynamic orbit determination, the phase residuals exhibit significant variations with azimuth and elevation [12]. PCV is the difference between the instantaneous phase center and the average phase center of the antenna and is related to the azimuth and elevation. Based on the premise that PCV errors can be absorbed by the phase residuals, PCV modelling was performed on a 5° × 2° grid in azimuth and elevation using the residuals of the ionospheric-free combination of GPS-based POD. The 1-month residuals were adopted.
Figure 8 displays the phase residuals of CSES POD solutions obtained using PCO ground calibration-only (Figure 8a), estimated PCO (Figure 8b) and the estimated PCO and PCV map (Figure 8c). The azimuth-elevation diagram of the PCV map is also plotted (Figure 8d). Due to the small estimated value of the Z PCO component, the residual distribution of solutions with (Figure 8b) and without (Figure 8a) estimated PCO is almost the same, and the residual varies significantly with elevation. With PCV corrections, the residuals are nearly uniformly distributed. Table 3 gives the residual RMS of the above solutions. For the PCO ground calibration case, the residual RMS is 5.63 mm. After PCO and PCV correction, the residuals improved significantly to 4.11 mm.
The orbit quality of the above solutions is also assessed. Because there are no external measurements for the CSES, only orbit consistency can be evaluated. Thus, orbit overlap differences are used as a performance metric. Specifically, the 6-h orbit overlap differences between two consecutive orbit solutions are assessed. Because of the edge effect, the central 5-h overlap differences are also used as a metric. Figure 9 demonstrates the specific evaluation method.
Table 3 summarizes the RMS of the orbit overlap differences. When only PCO ground calibration was used, the 3D RMS is 3.65 cm. The solution improved slightly where the PCO was estimated. Adding PCV correction led to a significant improvement, with 3D RMS values of 2.80 cm. The statistics of the central 5-h orbit overlap differences are also summarized in Table 3. Due to the reduction in edge effect, the 3D RMS value of 1.86 cm was obtained for the solution with both PCO and PCV corrections. Figure 10 shows the daily RMS of the full 6-h orbit overlap differences. After PCV correction, the orbit overlap differences of each arc were improved. In the following section, the PCO and PCV corrections estimated in this section will be applied.

3.2. POD Results Based on BDS Data

This section discusses the BDS-based POD. Although about 27% of epochs have zero useful BDS satellites and less than 5% of epochs have more than useful three BDS satellites (Figure 4), it is interesting to access the performance of BDS-only POD under this stringent situation. In view of the uneven distribution of the BDS-2 constellation, the correlation between orbit accuracy and geographical distribution is worth studying. In addition, considering that the orbit differences between BDS GEO satellites calculated by PANDA and provided by GFZ reach several meters, both of these two products are adopted to analyze their impact on CSES POD. In turn, the performance of GEO satellite orbits of these two products can be accessed. As seen in Table 1, the BDS GEO orbit differences between PANDA and GFZ reach several meters. To analyze the impact of GEO satellites on CSES POD, the same a priori information is used for BDS GEO, IGSO and MEO in BDS-only POD. To avoid contamination of the POD by low-precision GEO satellites, we will analyze the BDS-based orbit determination for two cases, i.e., with GEO satellites and without GEO satellites.
Low-precision GEO satellites cause a large RMS on the post-fit residuals of CSES POD. Hence, the total residual RMS of all satellites is unable to reflect the model errors for each satellite type (GEO/IGSO/MEO) effectively. Therefore, observation residuals were considered for each satellite type, for both of the two cases mentioned above (with and without GEO satellites). Figure 11 plots the daily residuals and Table 4 summaries the RMS statistics. Evidently, the residuals of BDS IGSO and MEO satellites are considerably deteriorated by the addition of BDS GEO satellites. When GEO satellites are excluded (red dotted line), the residuals of BDS IGSO/MEO satellites obtained using GFZ and PANDA products are comparable and are stable within 5 mm for each POD arc. The results indicate that the observations of BDS IGSO and MEO satellites can be accurately modelled. However, when GEO satellites are included (blue dotted line), the residuals of all types of satellites are much larger and fluctuate more for each POD when GFZ BDS products are used than when PANDA ones are. The average RMS of GEO satellites is approximately 33.7 mm when using GFZ products and reduces to 17.8 mm when using PANDA products. This suggests that the orbit accuracy of GFZ GEO satellites is lower and less stable than that of PANDA. It may be due to the different SRP model and satellite attitude adopted by PANDA and GFZ for BDS GEO satellites, resulting in orbit comparison reaching several meters (Table 1).
The CSES orbit accuracy calculated using PANDA and GFZ BDS products is also considered. Orbit overlap difference and orbit comparison with GPS-derived orbits are adopted as assessment instruments. To check for systematic differences between GPS-based and BDS-based POD, we used the Helmert transformation. Table 5 summaries the statistical values. After the Helmert transformation, the differences between GPS-based and BDS-based POD improved, suggesting that systematic differences existed. Thus, the differences with Helmert transformation are used for further analysis.
When GEO satellites are included, the orbit overlap differences are much larger for results obtained using GFZ products than PANDA products (i.e., the 3D RMS changes from 83.91 to 45.43 cm), so do the orbit differences with respect to the GPS-based POD (i.e., the 3D RMS changes from 55.07 to 31.75 cm). When GEO satellites are excluded, both the orbit overlap differences and the orbit differences, with respect to the GPS-based POD, are comparable for both BDS products. These results are consistent with the residual analysis.
For POD based on PANDA products, excluding GEO satellites led to an improvement in both average orbit overlap difference (from 45.43 cm to 23.68 cm 3D RMS) and in the comparison to GPS-based POD (from 31.75 cm to 14.83 cm RMS), showing significant improvements in all three directions. The RMS values of the central 5-h orbit overlap differences are summarized in Table 5. It is notable that the edge effect is less obvious than in GPS-based POD because of the low precision of BDS orbits. Given the uneven distribution of the BDS-2 constellation, we checked whether there are geographical correlations for BDS-only POD. Because POD is significantly contaminated by BDS GEO satellites, the solution without GEO is discussed. Figure 12 shows the 3D orbit differences between BDS-based POD (obtained using PANDA products) and GPS-based POD along the CSES satellite ground tracks from DOY 202 to DOY 206, 2018. The differences in the Asia Pacific region are smaller, which can be explained by the larger number of useful satellites in this region (see bottom panel of Figure 5). To quantify the geographic correlations, the average 3D orbit differences of the Eastern and the Western Hemispheres were calculated, which are 9.11 cm and 11.05 cm, respectively. Due to the larger number of useful satellites in the Asia Pacific region, the orbit accuracy of the Eastern Hemisphere is better than that of the Western Hemisphere. It should be noted that the statistical results are better than the values in Table 5. This is because the whole 30-h arc is accessed in Table 5, while only the middle 24-h arc is accessed in Figure 12, which is less affected by the edge effect.

3.3. POD Results Based on Combined GPS and BDS Data

From the previous discussion, it is clear that the introduction of BDS GEO satellites can lead to a significant decrease in the orbit accuracy of BDS-based POD. Therefore, BDS GEO satellites are excluded in this section. Moreover, BDS IGSO/MEO products calculated by PANDA are adopted for the results discussed. As shown previously in Table 1, for BDS IGSO/MEO satellites, the orbit difference between PANDA and GFZ is 10.2 cm and 6.9 cm in 1D RMS, respectively. The GPS orbit accuracy of IGS is within 2.5 cm in 1D RMS [30]. Thus, to optimize the observations, the relative prior weight of GPS, BDS IGSO and BDS MEO was set to 1/0.25/0.36 according to the orbit accuracy of GPS and BDS. Table 6 shows the residuals of the combined POD. The residuals of BDS IGSO/MEO results are larger than the residuals of the BDS-only POD, due to the weaker constraint of BDS observations in the combined POD.
Orbit overlap difference and orbit comparison with the GPS-derived orbits were used to evaluate orbit quality (Figure 13). The statistics are summarized in Table 6. Due to the introduction of BDS IGSO and MEO, the orbit overlap difference is slightly improved, with values of 2.15 cm, 0.63 cm, 1.46 cm in the along-track, cross-track and radial directions and of 2.73 cm in 3D. The overlap difference of the central 5 h is smaller than that of the full 6 h orbit overlaps due to edge effects.
In the orbit differences between combined POD and GPS-based POD, a large discrepancy can be observed on DOY 201. This may be due to the 9.8% GPS data loss shown in Figure 6, which includes data gaps from 13:56 to 15:30, from 18:40 to 19:10 and from 20:15 to 20:50 on DOY 201, resulting in an exceptionally inaccurate estimation of the piecewise dynamic parameters during this period. In general, the 3D RMS of orbit differences with respect to GPS-based POD is within 1 cm.

4. Discussion

For the PCO/PCV corrections, it should be noted that the BDS-2 frequencies are different from GPS, and the signal modulation method is different, which may lead to different antenna phase center corrections. Thus, the GPS-derived PCO/PCV may not be perfect for BDS-2. However, we can ignore its impact regarding current decimeter-level CSES orbit precision derived by BDS-2 and millimeter-level phase center difference. BDS-3 functions on a completely different frequency plan than BDS-2. BDS-3 B1C overlaps with GPS L1, and BDS-3 B2a coincides with GPS L5. In this case, the GPS-derived PCO/PCV may be more suitable for BDS-3 signals, but this needs further verification due to the different signal modulation methods.
In general, the CSES orbit consistency can reach up to 3 cm in 3D RMS, which can satisfy centimeter-level requirements of the scientific application. Although BDS-3 B1C overlaps with the GPS L1 frequency, and BDS-3 B2a coincides with GPS L5, the GOR onboard CSES is not capable of collecting the B1 and B2 signals from BDS-3 satellites due to different signal modulation method. For the BDS-only POD of the CSES, further improvements can be achieved if more channels are allocated for BDS-2 signals. Alternatively, it could also be enhanced through better observation models—for instance, by improving the BDS orbits or fixing ambiguity parameters. On the other hand, with the completion of the globally distributed BDS-3 constellation, the BDS-only POD performance of the LEO satellite that can track BDS-3 signals is very promising in the future.

5. Conclusions

This paper discussed the CSES POD based on GPS and BDS observations. First, the onboard data availability of both GPS and BDS was analyzed, then antenna phase center correction was conducted based on GPS data. Subsequently, CSES orbits derived from GPS data, BDS data, and combined GPS and BDS data were evaluated. As there are no external measurements, post-fit residuals and orbit overlap differences were used to evaluate the orbit consistency. Furthermore, orbits derived from GPS data were used as a reference to evaluate the orbit accuracy of BDS-based and combined POD.
The results of data quality showed that due to the lower transmitting power of GPS L2, more tracking losses are observed in L2 data when the elevation drops below 20°, resulting in about 30% fewer P2/L2 observations than CA/L1 observations. Regarding the dual-frequency available satellites, about 76.1% of epochs possess four to eight GPS satellites. Meanwhile, for BDS, only 3.8% of epochs have more than three satellites and about 27% of epochs have no useful satellites. This is mainly because there are fewer channels allocated for BDS signals and fewer BDS satellites can be observed.
The antenna phase center correction results show that PCO estimation can only marginally improve orbit consistency. After additional PCV correction, however, a considerable improvement is observed, with orbit overlap differences for GPS-based POD improving from 3.65 cm to 2.8 cm in 3D RMS. The results of the BDS-based POD show that orbit consistency significantly deteriorates with the inclusion of BDS GEO satellites. When BDS GEO satellites are excluded, the orbit overlap difference of BDS-based POD is 23.68 cm in 3D, and is 2.73 cm for combined POD, which is slightly better than that of GPS-based POD.

Author Contributions

Methodology, Y.Q., Y.L. (Yang Liu); formal analysis, Y.Q.; writing—original draft preparation, Y.Q.; writing—review and editing, Y.L. (Yang Liu), X.D., Y.L. (Yidong Lou), S.G.; supervision, Y.L. (Yidong Lou); funding acquisition, J.L. All authors have read and agreed to the published version of the manuscript.

Funding

This research was funded by the National Key R&D Program of China (Grant No. 2018YFC1503502) and the National Nature Science Foundation of China (No: 41704026).

Conflicts of Interest

The authors declare no conflict of interest.

References

  1. Shen, X.; Zong, Q.G.; Zhang, X. Introduction to special section on the China Seismo-Electromagnetic Satellite and initial results. Earth Planet. Phys. 2018, 2, 439–443. [Google Scholar] [CrossRef]
  2. Cheng, B.; Zhou, B.; Magnes, W.; Lammegger, R.; Pollinger, A. High precision magnetometer for geomagnetic exploration onboard of the China Seismo-Electromagnetic Satellite. Sci. China Technol. Sci. 2018, 61, 659–668. [Google Scholar] [CrossRef]
  3. Ambrosi, G.; Bartocci, S.; Basara, L.; Battiston, R.; Burger, W.J.; Carfora, L.; Castellini, G.; Cipollone, P.; Conti, L.; Contin, A.; et al. The HEPD particle detector of the CSES satellite mission for investigating seismo-associated perturbations of the Van Allen belts. Sci. China Technol. Sci. 2018, 61, 643–652. [Google Scholar] [CrossRef]
  4. Huang, J.; Lei, J.; Li, S.; Zeren, Z.; Li, C.; Zhu, X.; Yu, W. The Electric Field Detector (EFD) onboard the ZH-1 satellite and first observational results. Earth Planet. Phys. 2018, 2, 469–478. [Google Scholar] [CrossRef]
  5. Cao, J.B.; Zeng, L.; Zhan, F.; Wang, Z.G.; Wang, Y.; Chen, Y.; Meng, Q.C.; Ji, Z.Q.; Wang, P.F.; Liu, Z.W.; et al. The electromagnetic wave experiment for CSES mission: Search coil magnetometer. Sci. China Technol. Sci. 2018, 61, 653–658. [Google Scholar] [CrossRef]
  6. Liu, C.; Guan, Y.; Zheng, X.; Zhang, A.; Piero, D.; Sun, Y. The technology of space plasma in-situ measurement on the China Seismo-Electromagnetic Satellite. Sci. China Technol. Sci. 2019, 62, 829–838. [Google Scholar] [CrossRef]
  7. Cheng, Y.; Lin, J.; Shen, X.; Wan, X.; Li, X.; Wang, W. Analysis of GNSS radio occultation data from satellite ZH-01. Earth Planet. Phys. 2018, 2, 499–504. [Google Scholar] [CrossRef]
  8. Chen, L.; Ou, M.; Yuan, Y.; Sun, F.; Yu, X.; Zhen, W. Preliminary observation results of the Coherent Beacon System onboard the China Seismo-Electromagnetic Satellite-1. Earth Planet. Phys. 2018, 2, 505–514. [Google Scholar] [CrossRef]
  9. Tapley, B.D.; Ries, J.C.; Davis, G.W.; Eanes, R.J.; Schutz, B.E.; Shum, C.K.; Watkins, M.M.; Marshall, J.A.; Nerem, R.S.; Putney, B.H.; et al. Precision orbit determination for TOPEX/POSEIDON. J. Geophys. Res. Ocean. 1994, 10, 239–247. [Google Scholar] [CrossRef]
  10. Montenbruck, O.; Kroes, R. In-flight performance analysis of the CHAMP BlackJack GPS Receiver. GPS Solut. 2003, 7, 74–86. [Google Scholar] [CrossRef]
  11. Bertiger, W.; Bar-Sever, Y.; Bettadpur, S.; Dunn, C.; Haines, B.; Kruizinga, G.; Kuang, D.; Nandi, S.; Romans, L.; Watkins, M.; et al. GRACE: Millimeters and Microns in Orbit. Jet Propuls. Lab. 2020. Available online: http://hdl.handle.net/2014/10373 (accessed on 24 September 2002).
  12. Jäggi, A.; Hugentobler, U.; Bock, H.; Beutler, G. Precise orbit determination for GRACE using undifferenced or doubly differenced GPS data. Adv. Space Res. 2007, 39, 1612–1619. [Google Scholar] [CrossRef]
  13. Liu, J.; Gu, D.; Ju, B.; Yao, J.; Duan, X.; Yi, D. Basic performance of BeiDou-2 navigation satellite system used in LEO satellites precise orbit determination. Chin. J. Aeronaut. 2014, 27, 1251–1258. [Google Scholar] [CrossRef] [Green Version]
  14. Li, M.; Li, W.; Shi, C.; Jiang, K.; Guo, X.; Dai, X.; Meng, X.; Yang, Z.; Yang, G.; Liao, M. Precise orbit determination of the Fengyun-3C satellite using onboard GPS and BDS observations. J. Geod. 2017, 91, 1313–1327. [Google Scholar] [CrossRef] [Green Version]
  15. Xiong, C.; Lu, C.; Zhu, J.; Ding, H. Orbit determination using real tracking data from FY3C-GNOS. Adv. Space Res. 2017, 60, 543–556. [Google Scholar] [CrossRef]
  16. Tiberius, C.; Kenselaar, F. Variance component estimation and precise GPS positioning: Case study. J. Surv. Eng. 2003, 129, 11–18. [Google Scholar] [CrossRef]
  17. Shen, X.; Zhang, X.; Yuan, S.; Wang, L.; Cao, J.; Huang, J.; Zhu, X.; Piergiorgio, P.; Dai, J. The state-of-the-art of the China Seismo-Electromagnetic Satellite mission. Sci. China Technol. Sci. 2018, 61, 634–642. [Google Scholar] [CrossRef]
  18. Zhao, Q.; Wang, C.; Guo, J.; Yang, G.; Liao, M.; Ma, H.; Liu, J. Enhanced orbit determination for BeiDou satellites with FengYun-3C onboard GNSS data. GPS Solut. 2017, 21, 1179–1190. [Google Scholar] [CrossRef] [Green Version]
  19. Liu, J.; Ge, M. PANDA software and its preliminary result of positioning and orbit determination. Wuhan Univ. J. Nat. Sci. 2003, 8, 603–609. [Google Scholar]
  20. Guo, J.; Xu, X.; Zhao, Q.; Liu, J. Precise orbit determination for quad-constellation satellites at Wuhan University: Strategy, result validation, and comparison. J. Geod. 2017, 90, 143–159. [Google Scholar] [CrossRef]
  21. Förste, C.; Bruinsma, S.L.; Shako, R.; Marty, J.C.; Flechtner, F.; Abrikosov, O.; Dahle, C.; Lemoine, J.M.; Neumayer, K.H.; Biancale, R.; et al. EIGEN-6—A New Combined Global Gravity Field Model Including GOCE Data from the Collaboration of GFZ-Potsdam and GRGS-Toulouse; EGU2011-3242-2, EGU General Assembly; General Assembly European Geosciences Union: Vienna, Austria, 2011; Volume 13. [Google Scholar]
  22. Marshall, J.; Luthcke, S. Modeling radiation forces acting on TOPEX/Poseidon for precision orbit determination. J. Spacecr. Rocket. 1994, 31, 99–105. [Google Scholar] [CrossRef] [Green Version]
  23. Standish, E.M. JPL Planetary and Lunar Ephemerides, DE405/LE405; JPL Interoffice Memorandum 312.F-98-048; Jet Propulsion Laboratory: Pasadena, CA, USA, 1998. [Google Scholar]
  24. Petit, G.; Luzum, B. IERS Conventions 2010, Technical Report; IERS Convention Center: Paris, France, 2010. [Google Scholar]
  25. Lyard, F.; Lefevre, F.; Letellier, T.; Francis, O. Modelling the global ocean tides: Modern insights from FES2004. Ocean Dyn. 2006, 56, 394–415. [Google Scholar] [CrossRef]
  26. Berger, C.; Biancale, R.; Ill, M.; Barlier, F. Improvement of the empirical thermospheric model DTM: DTM94–a comparative review of various temporal variations and prospects in space geodesy applications. J. Geod. 1998, 72, 161–178. [Google Scholar] [CrossRef]
  27. Gambis, D. Monitoring Earth orientation using space-geodetic techniques: State-of-the-art and prospective. J. Geod. 2004, 78, 295–303. [Google Scholar] [CrossRef]
  28. Kang, Z.; Tapley, B.; Bettadpur, S.; Ries, J.; Nagel, P.; Pastor, R. Precise orbit determination for the GRACE mission using only GPS data. J. Geod. 2006, 80, 322–331. [Google Scholar] [CrossRef]
  29. Choi, K.R. Jason-1 Precision Orbit Determination Using GPS Combined with SLR and DORIS Tracking Data. Ph.D. Thesis, The University of Texas at Austin, Austin, TX, USA, 2003. [Google Scholar]
  30. Dow, J.; Neilan, R.; Rizos, C. The international GNSS service in a changing landscape of global navigation satellite systems. J. Geod. 2009, 83, 191–198. [Google Scholar] [CrossRef]
Figure 1. China Seismo-Electromagnetic Satellite (CSES) platform.
Remotesensing 12 03234 g001
Figure 2. Sky-plots of Signal to Noise Ratio (SNR) (unit: dB-Hz) of GPS and BDS observations on date of year (DOY) 202, 2018. The (a1) and (a2) panels show the SNR of GPS L1 (S1) and L2 (S2); the (b1) and (b2) panels show the SNR of BDS B1 (S1) and B2 (S2).
Remotesensing 12 03234 g002
Figure 3. Number of GPS and BDS observations on DOY 202, 2018. The left panel shows the number of GPS C/A, P2, L1 and L2 observations. The right panel shows BDS B1 code, B2 code, B1 carrier and B2 carrier phase observations.
Remotesensing 12 03234 g003
Figure 4. Average percentage of all tracked, dual-frequency and useful satellites per epoch of one-month data for GPS (top panel) and BDS (bottom panel). Blue bars represent the percentage of all tracked satellites; red bars indicate the percentage of satellites that have been tracked for dual-frequency data; yellow bars represent the percentage of useful satellites.
Remotesensing 12 03234 g004
Figure 5. The useful number of GPS (top panel) and BDS (bottom panel) satellites per epoch along the CSES satellite ground tracks from DOY 202 to 206, 2018.
Remotesensing 12 03234 g005
Figure 6. CSES’ onboard GPS (blue) and BDS (red) data loss percentage for each POD arc from DOY 201 to DOY 231, 2018. The X-axis represents the first day of one POD arc.
Remotesensing 12 03234 g006
Figure 7. Estimated Z component phase center offset (PCO) for CSES’ onboard positioning antenna in the antenna reference frame (ARF).
Remotesensing 12 03234 g007
Figure 8. Ionosphere-free carrier phase residuals (cm) for DOY 201 to 231, 2018 and azimuth-elevation diagram of the 5° × 2° phase center variation (PCV) map (cm) for the CSES positioning antenna. Figure (a) shows the residuals of the POD solution with PCO ground calibration only; figure (b) shows the residuals of the POD solution with estimated PCO; figure (c) shows the residuals of the POD solution with estimated PCO and PCV map; figure (d) shows the PCV map.
Remotesensing 12 03234 g008
Figure 9. Orbit overlap of CSES POD.
Remotesensing 12 03234 g009
Figure 10. Root mean square (RMS) of full 6-h orbit overlap differences in the along-track, cross-track, radial directions and in 3D for GPS-only solutions. The top, middle and bottom panels show the results obtained with only PCO ground calibration, with PCO estimation, and with both estimated PCO and PCV map, respectively.
Remotesensing 12 03234 g010
Figure 11. Post-fit residual RMS of BDS carrier phase of each POD arc. The left panels show the residuals based on PANDA BDS products; the right panels show the residuals based on GFZ BDS products. In both plots, the blue dots represent the approach with GEO satellites and the red line is the approach without GEO satellites.
Remotesensing 12 03234 g011
Figure 12. 3D orbit difference (cm) between BDS-based POD (without BDS GEOs) and GPS-based POD along CSES satellite ground tracks from DOY 202 to DOY 206, 2018. BDS products are calculated using PANDA.
Remotesensing 12 03234 g012
Figure 13. Orbit overlap differences for combined POD (top panel) and orbit differences between combined POD and GPS-based POD (bottom panel).
Remotesensing 12 03234 g013
Table 1. Orbit differences of BDS orbits calculated by the Positioning and Navigation Data Analyst (PANDA) and provided by GeoForschungsZentrum (GFZ).
Sat. TypeA (cm)C (cm)R (cm)3D (cm)
GEO175.4311.127.2378.5
IGSO7.215.04.617.7
MEO8.77.52.812.1
Table 2. Precise orbit determination (POD) strategy for CSES.
ItemContents
Reference frameJ2000.0
Gravity modelEIGEN-6C. Static part of EIGEN-6C up to degree and order 120; temporal part of EIGEN-6C up to degree and order 50 [21]
N-bodyJPL DE405 [23]
Solid earth tideIERS Conventions 2010 [24]
Pole tideIERS Conventions 2010 [24]
Ocean tideFES2004 [25]
Solar radiation PressureBox-wing
AttitudeNominal
Atmospheric dragDTM94 [26]. Piecewise constant drag coefficients estimated
Empirical forcesPiecewise periodical terms in along-track, cross-track and radial direction (a priori sigma 10 nm/s2)
Basic observablesUn-differenced BDS B1/B2 and GPS L1/L2 ionosphere-free linear combination of code (a priori sigma 10 m) and phase (a priori sigma 1 cm)
GPS orbits and clocksIGS final products
BDS orbits and clocksRecomputed products/GFZ products
Sampling rate30 s
GPS antenna phase centerPCOs and PCVs from IGS
BDS antenna phase centerOnly PCO from IGS MGEX
CSES PCOCorrected using default values, estimated Z component based on GPS-only POD
CSES PCVPCV map modeling based on the phase residuals of GPS-only POD
Earth rotation parametersIERS C04 [27]
Relativistic effectsIERS Conventions 2010 [24]
AmbiguitiesFloat value for each ambiguity pass
Receiver clockOne per epoch as process noise
Drag coefficientOne per 360 min for both GPS and BDS
Empirical accelerationsGPS: One per 90 min for GPS
BDS: One per 360 min for BDS
Cutoff elevation10°
Table 3. Phase residuals and orbit overlap differences of GPS-only solutions in the along-track, cross-track, radial direction and 3D.
SolutionsResiduals (mm)Full 6-h Overlap (cm)Central 5-h Overlap (cm)
ACR3DACR3D
+PCO ground calib.5.632.940.851.833.651.930.630.922.28
+Estimated PCO5.612.860.871.813.561.810.660.902.17
+Estimated PCO&PCV4.112.180.721.502.801.510.520.811.86
Table 4. RMS statistics of phase residuals of BDS-based POD.
PANDA (mm)GFZ (mm)
With GEOsW/o GEOsWith GEOsW/o GEOs
GEO17.8/33.7/
IGSO9.73.014.83.2
MEO8.93.216.33.5
Table 5. Statistics of orbit overlap differences of BDS-based POD as well as orbit differences between BDS-based POD and GPS-based POD in the along-track, cross-track, radial direction and 3D.
GNSS ProductsMethodsWith GEOs (cm)Without GEOs (cm)
ACR3DACR3D
PANDAFull 6-h overlap37.4918.7614.5645.4319.808.028.2523.68
Central 5-h overlap31.7217.1513.5039.5417.777.47.8921.50
Comparison w/o Helmert trans.31.6214.1212.5837.2414.505.256.0616.75
Comparison with Helmert trans.25.6014.7310.9031.7512.565.105.7814.83
GFZFull 6-h overlap69.1435.226.683.9121.628.788.9525.83
Central 5-h overlap63.1632.5724.7677.219.318.078.5623.39
Comparison w/o Helmert trans.51.4631.7619.7864.1115.275.556.3517.68
Comparison with Helmert trans.44.1426.4018.4855.0713.255.506.1015.72
Table 6. Statistics of phase residuals, orbit overlap RMS of combined POD as well as orbit difference RMS between combined POD and GPS-based POD in the along-track, cross-track, radial direction and 3D.
Residuals (mm)Full 6-h Overlap (cm)Central 5-h Overlap (cm)Orbit Comparison (cm)
GPSBDS IGSOBDS MEOACR3DACR3DACR3D
4.28.98.22.150.631.462.731.480.440.781.760.920.300.321.05

