A Relative Radiation Normalization Method of ISS Nighttime Light Images Based on Pseudo Invariant Features

 , , , and
Abstract
:
1. Introduction
2. Materials and Methods
2.1. Study Areas and the NTL Images
2.1.1. The ISS NTL Images
2.1.2. The DMSP/OLS Time-Series NTL Remote Sensing Data
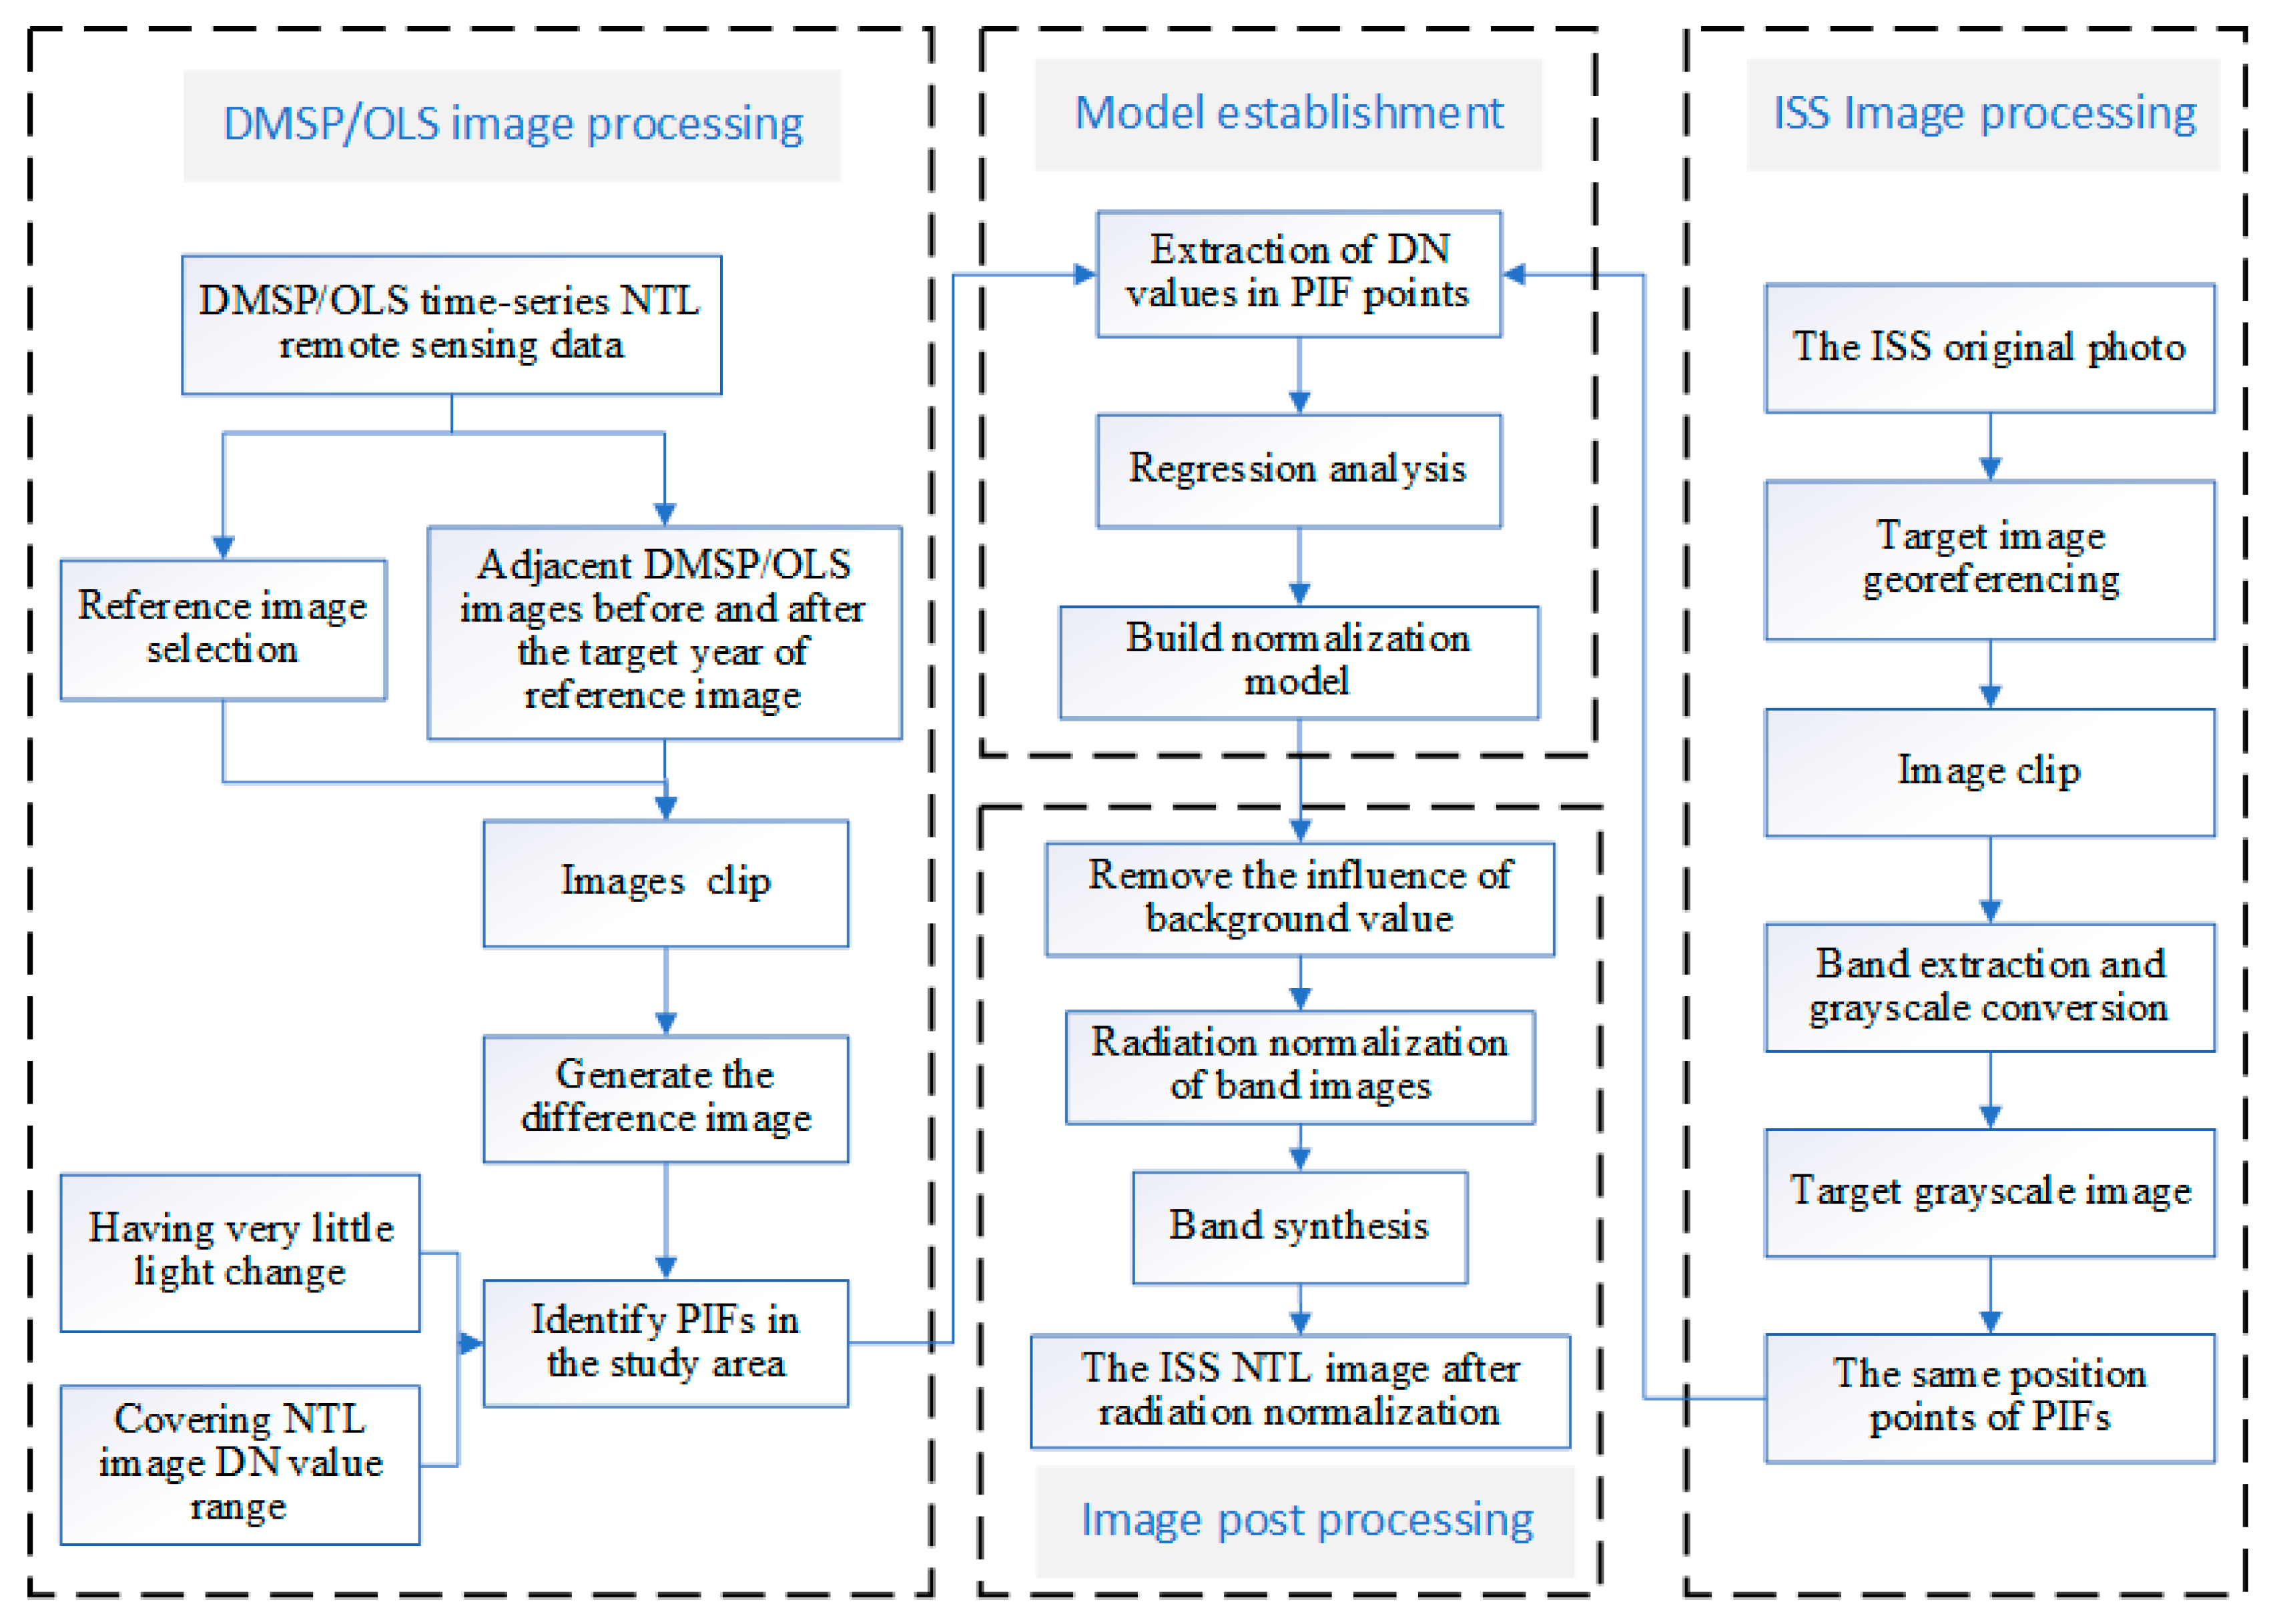
2.2. The Nighttime Light Image Processing
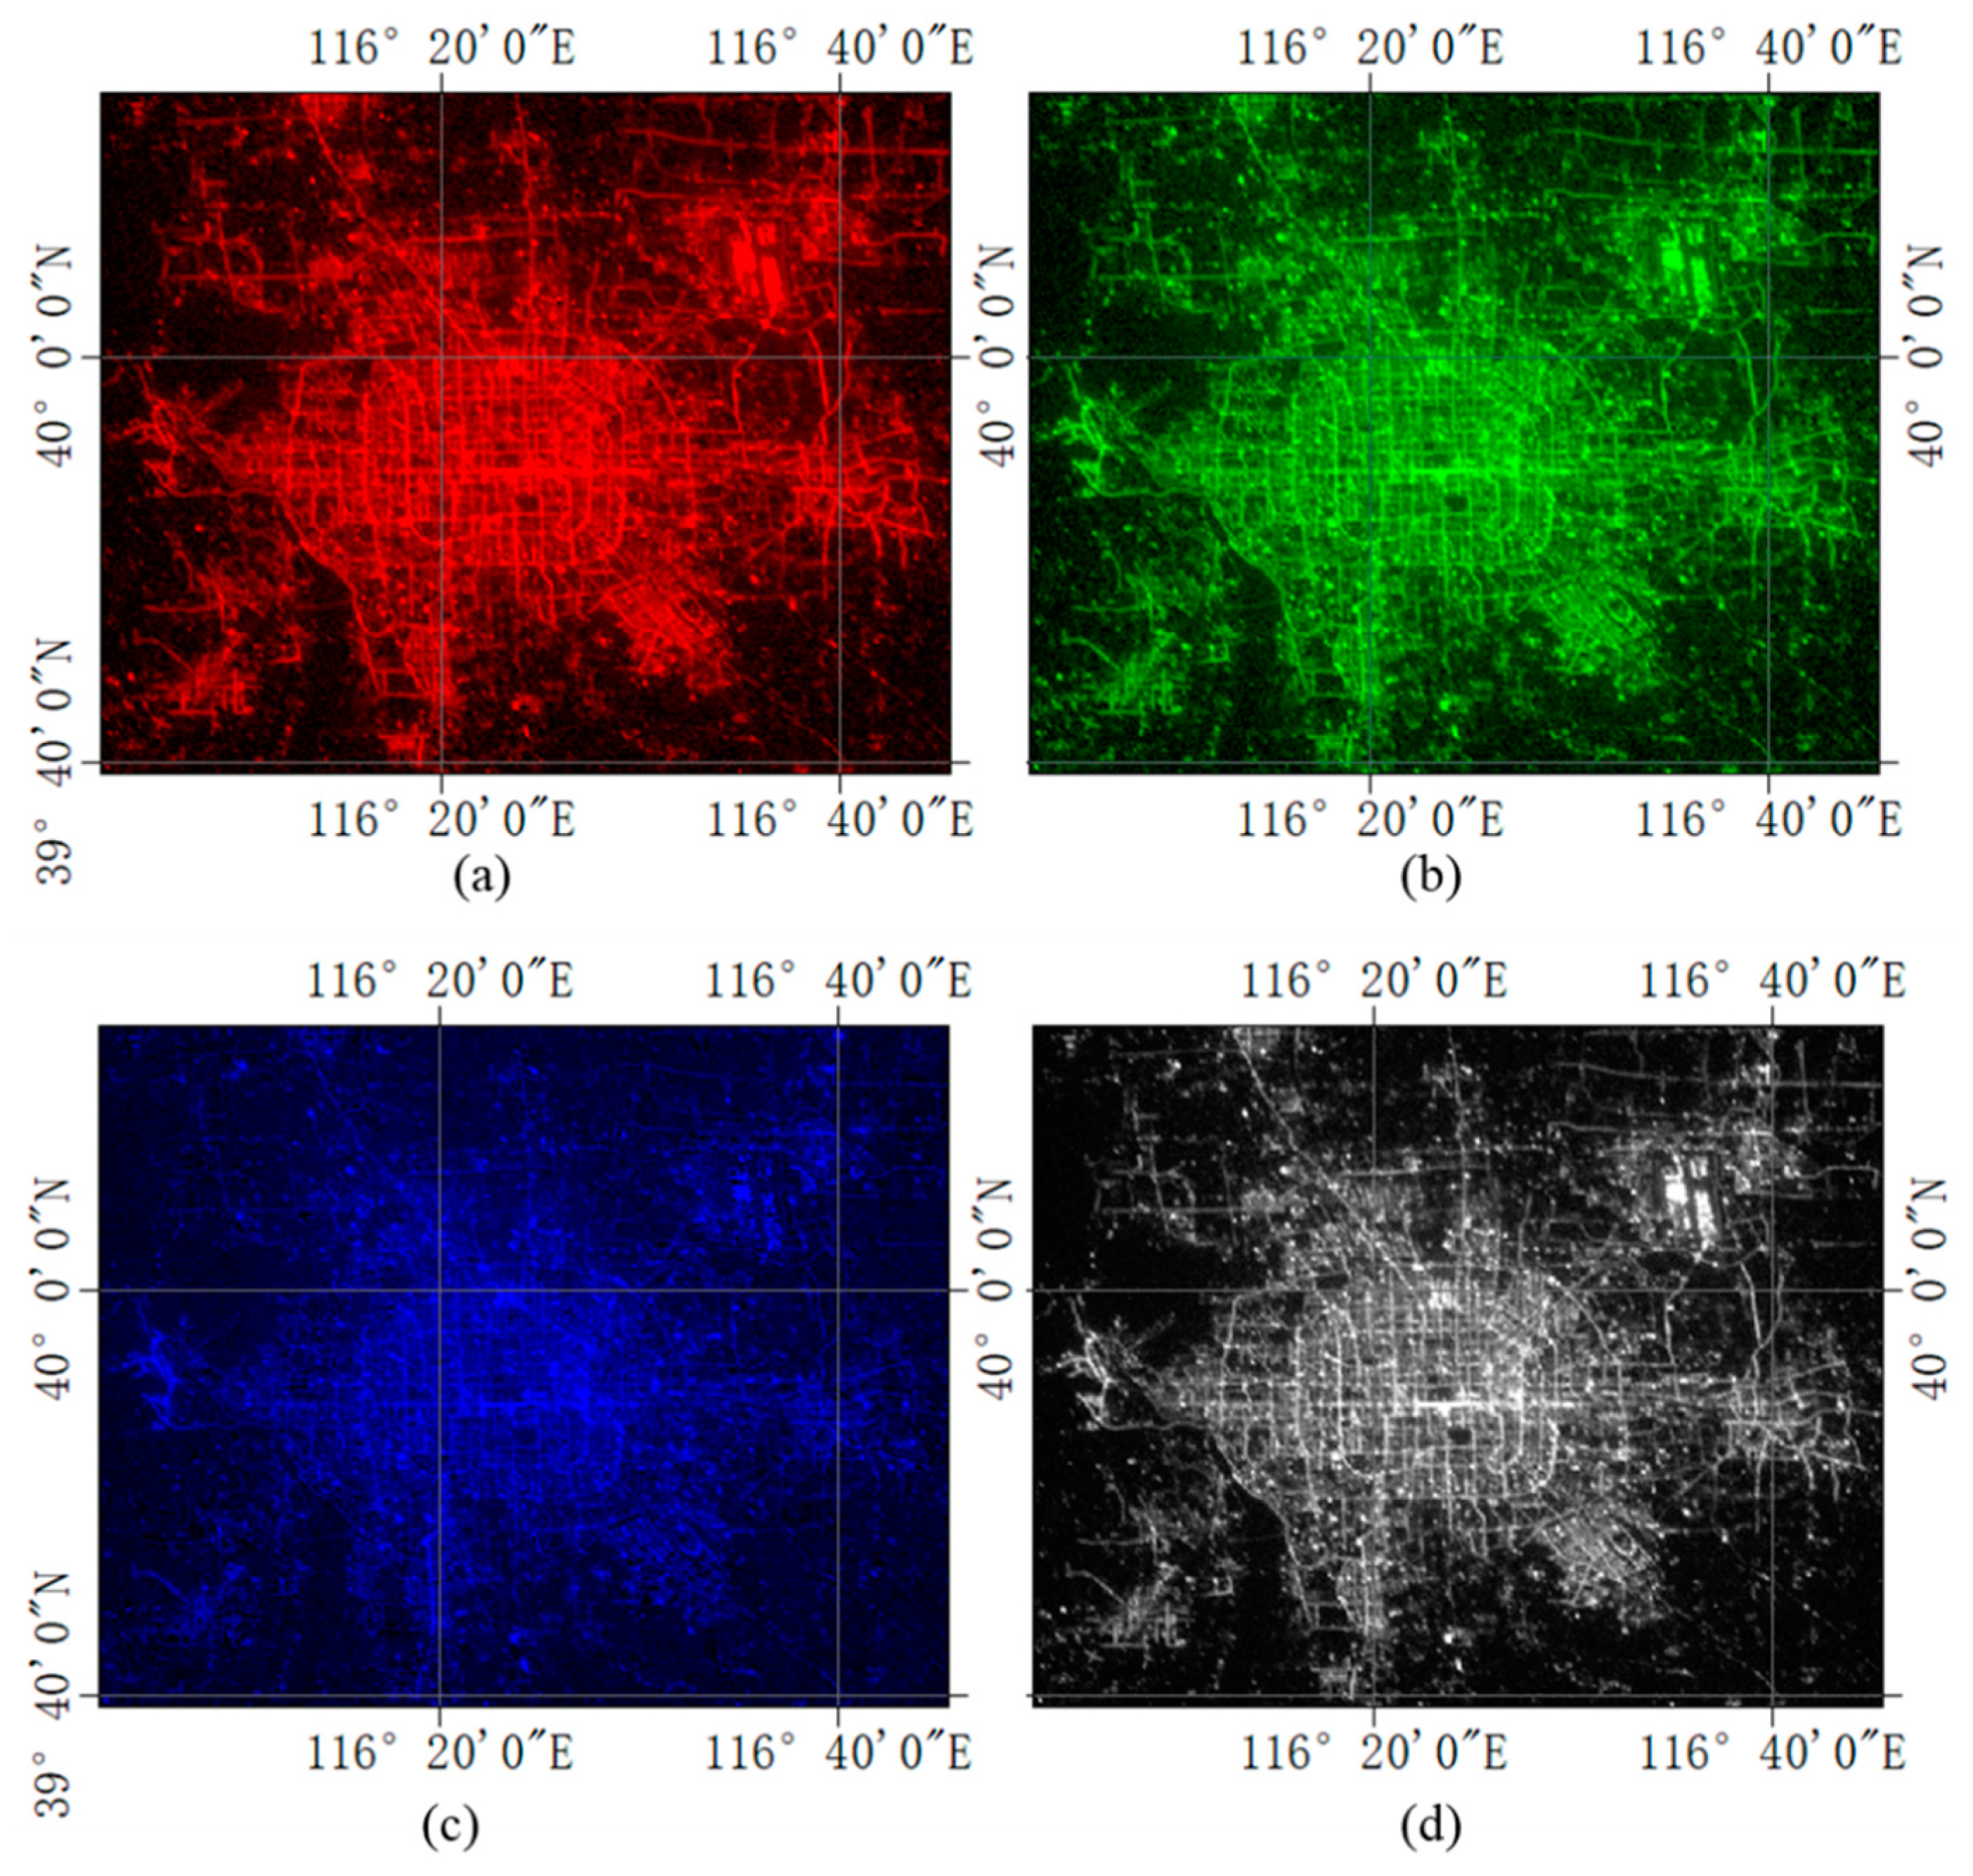
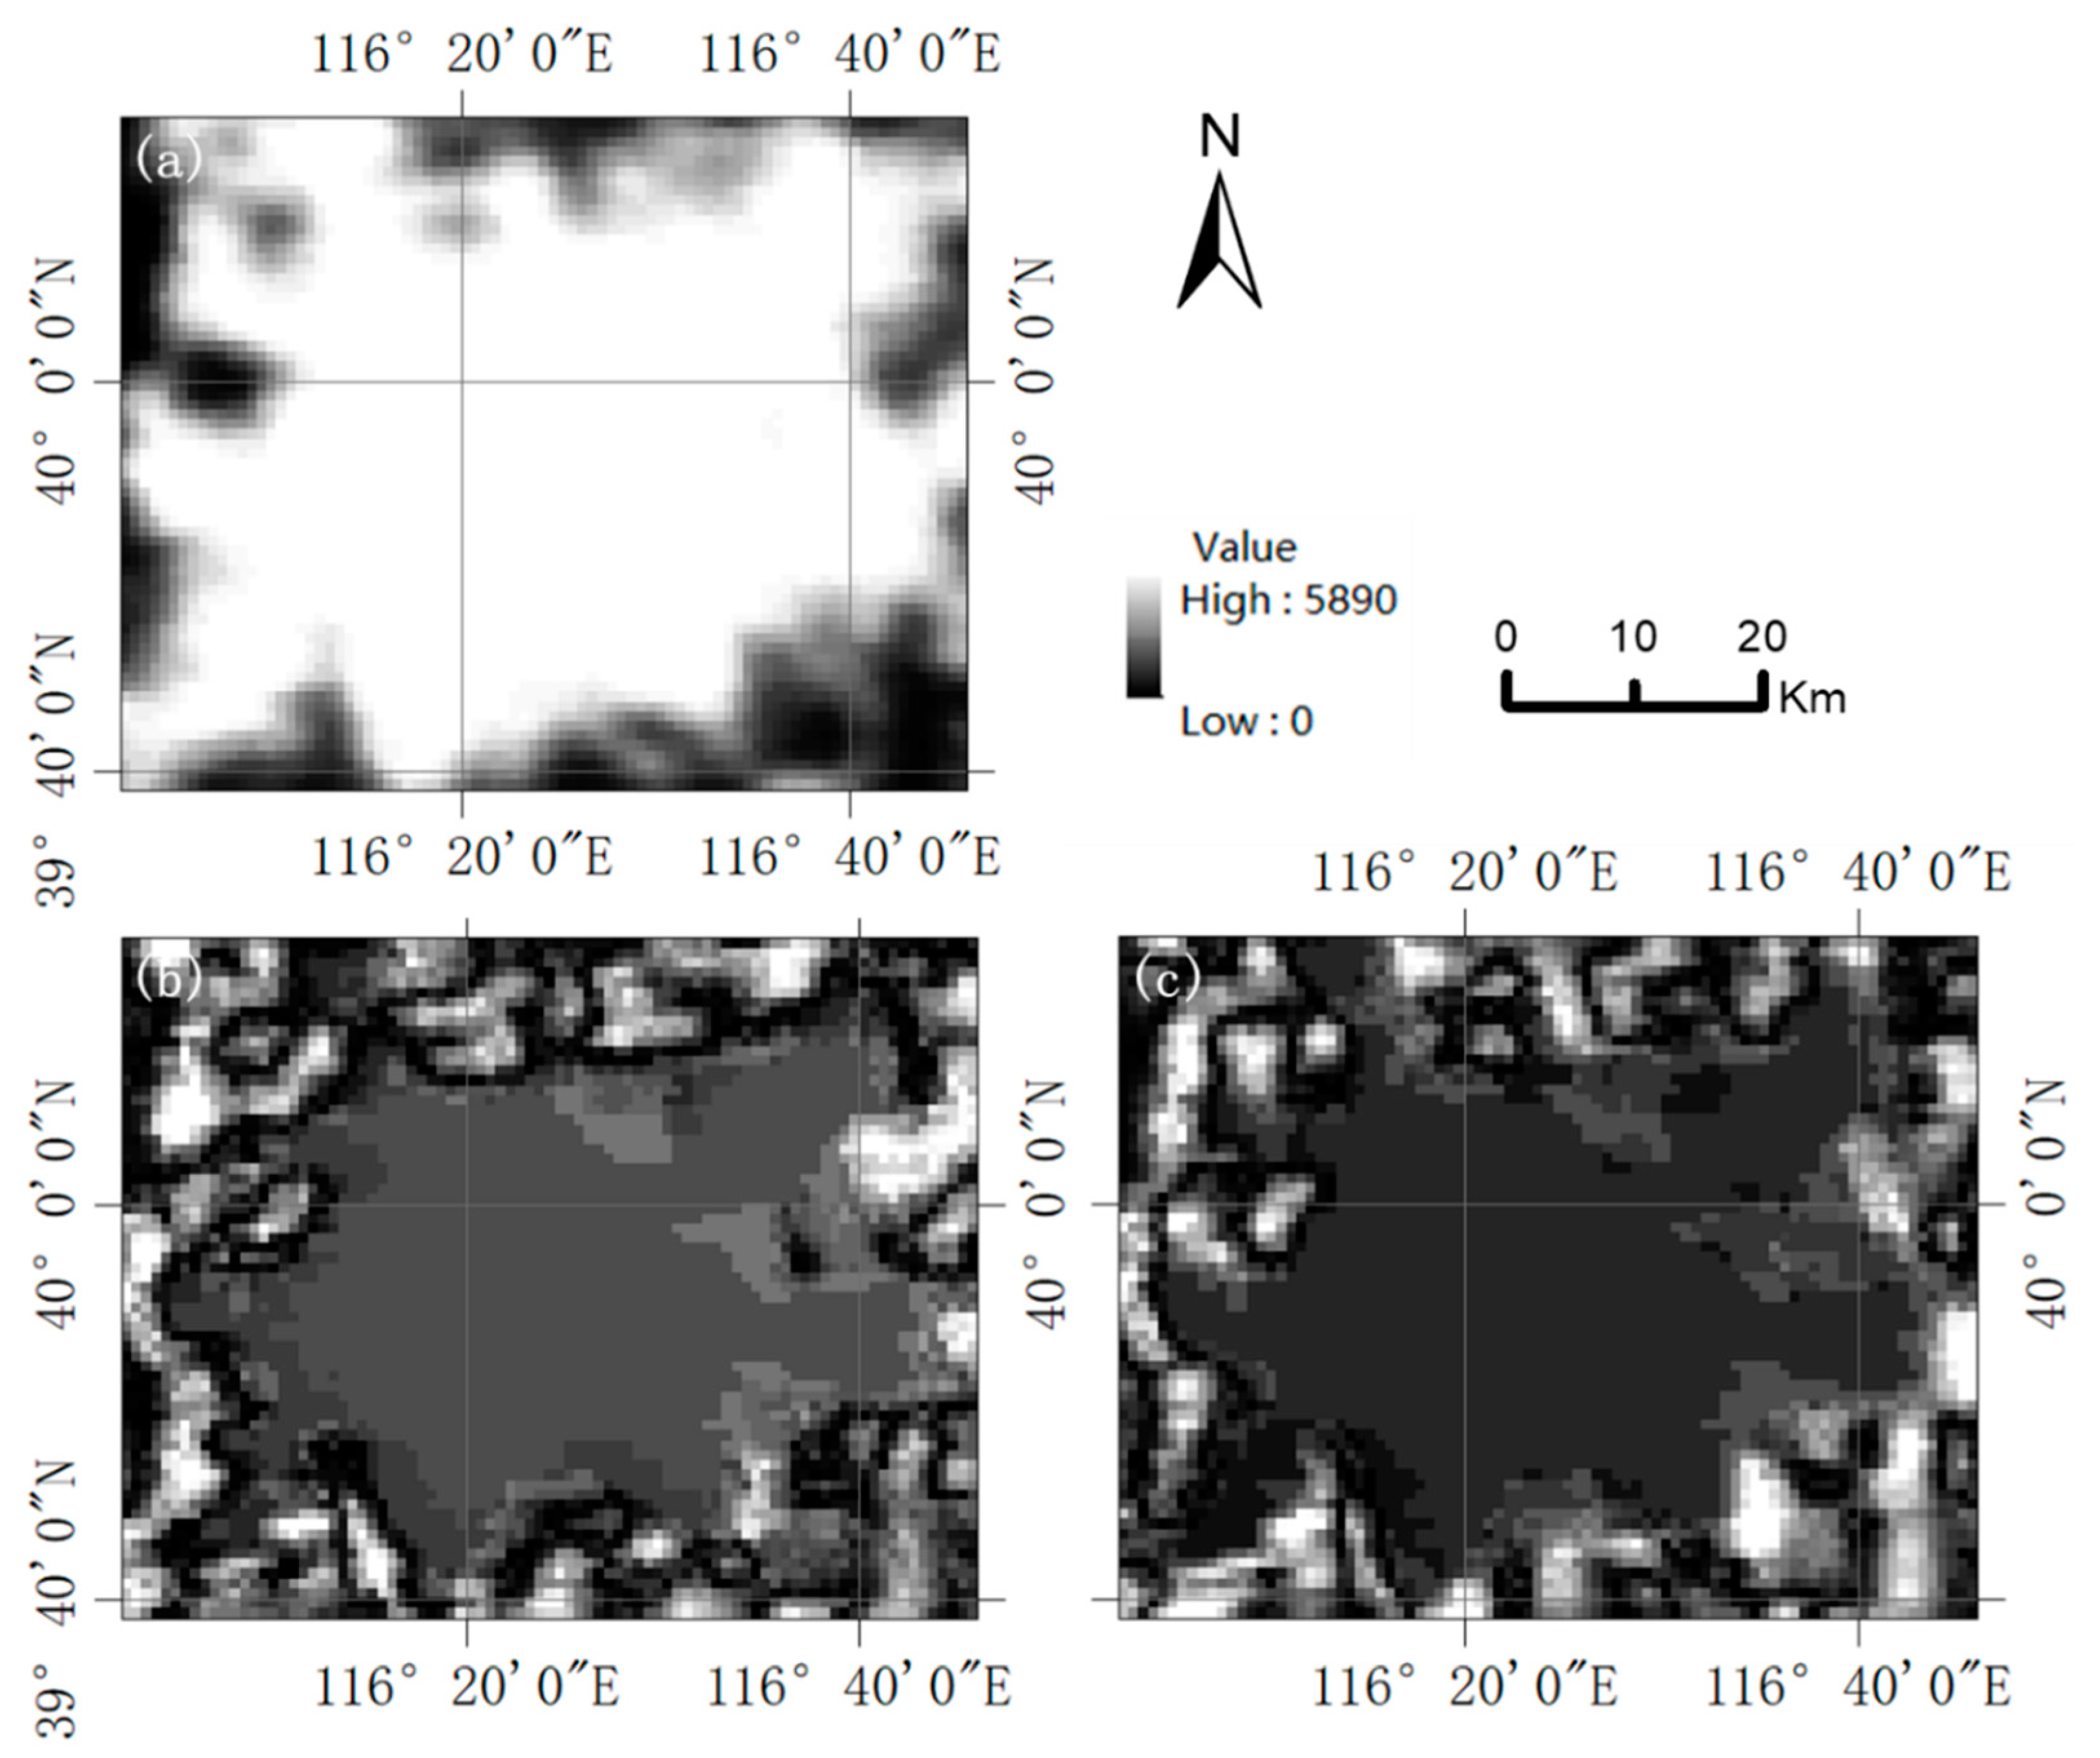
2.2.1. NTL Image Preprocessing
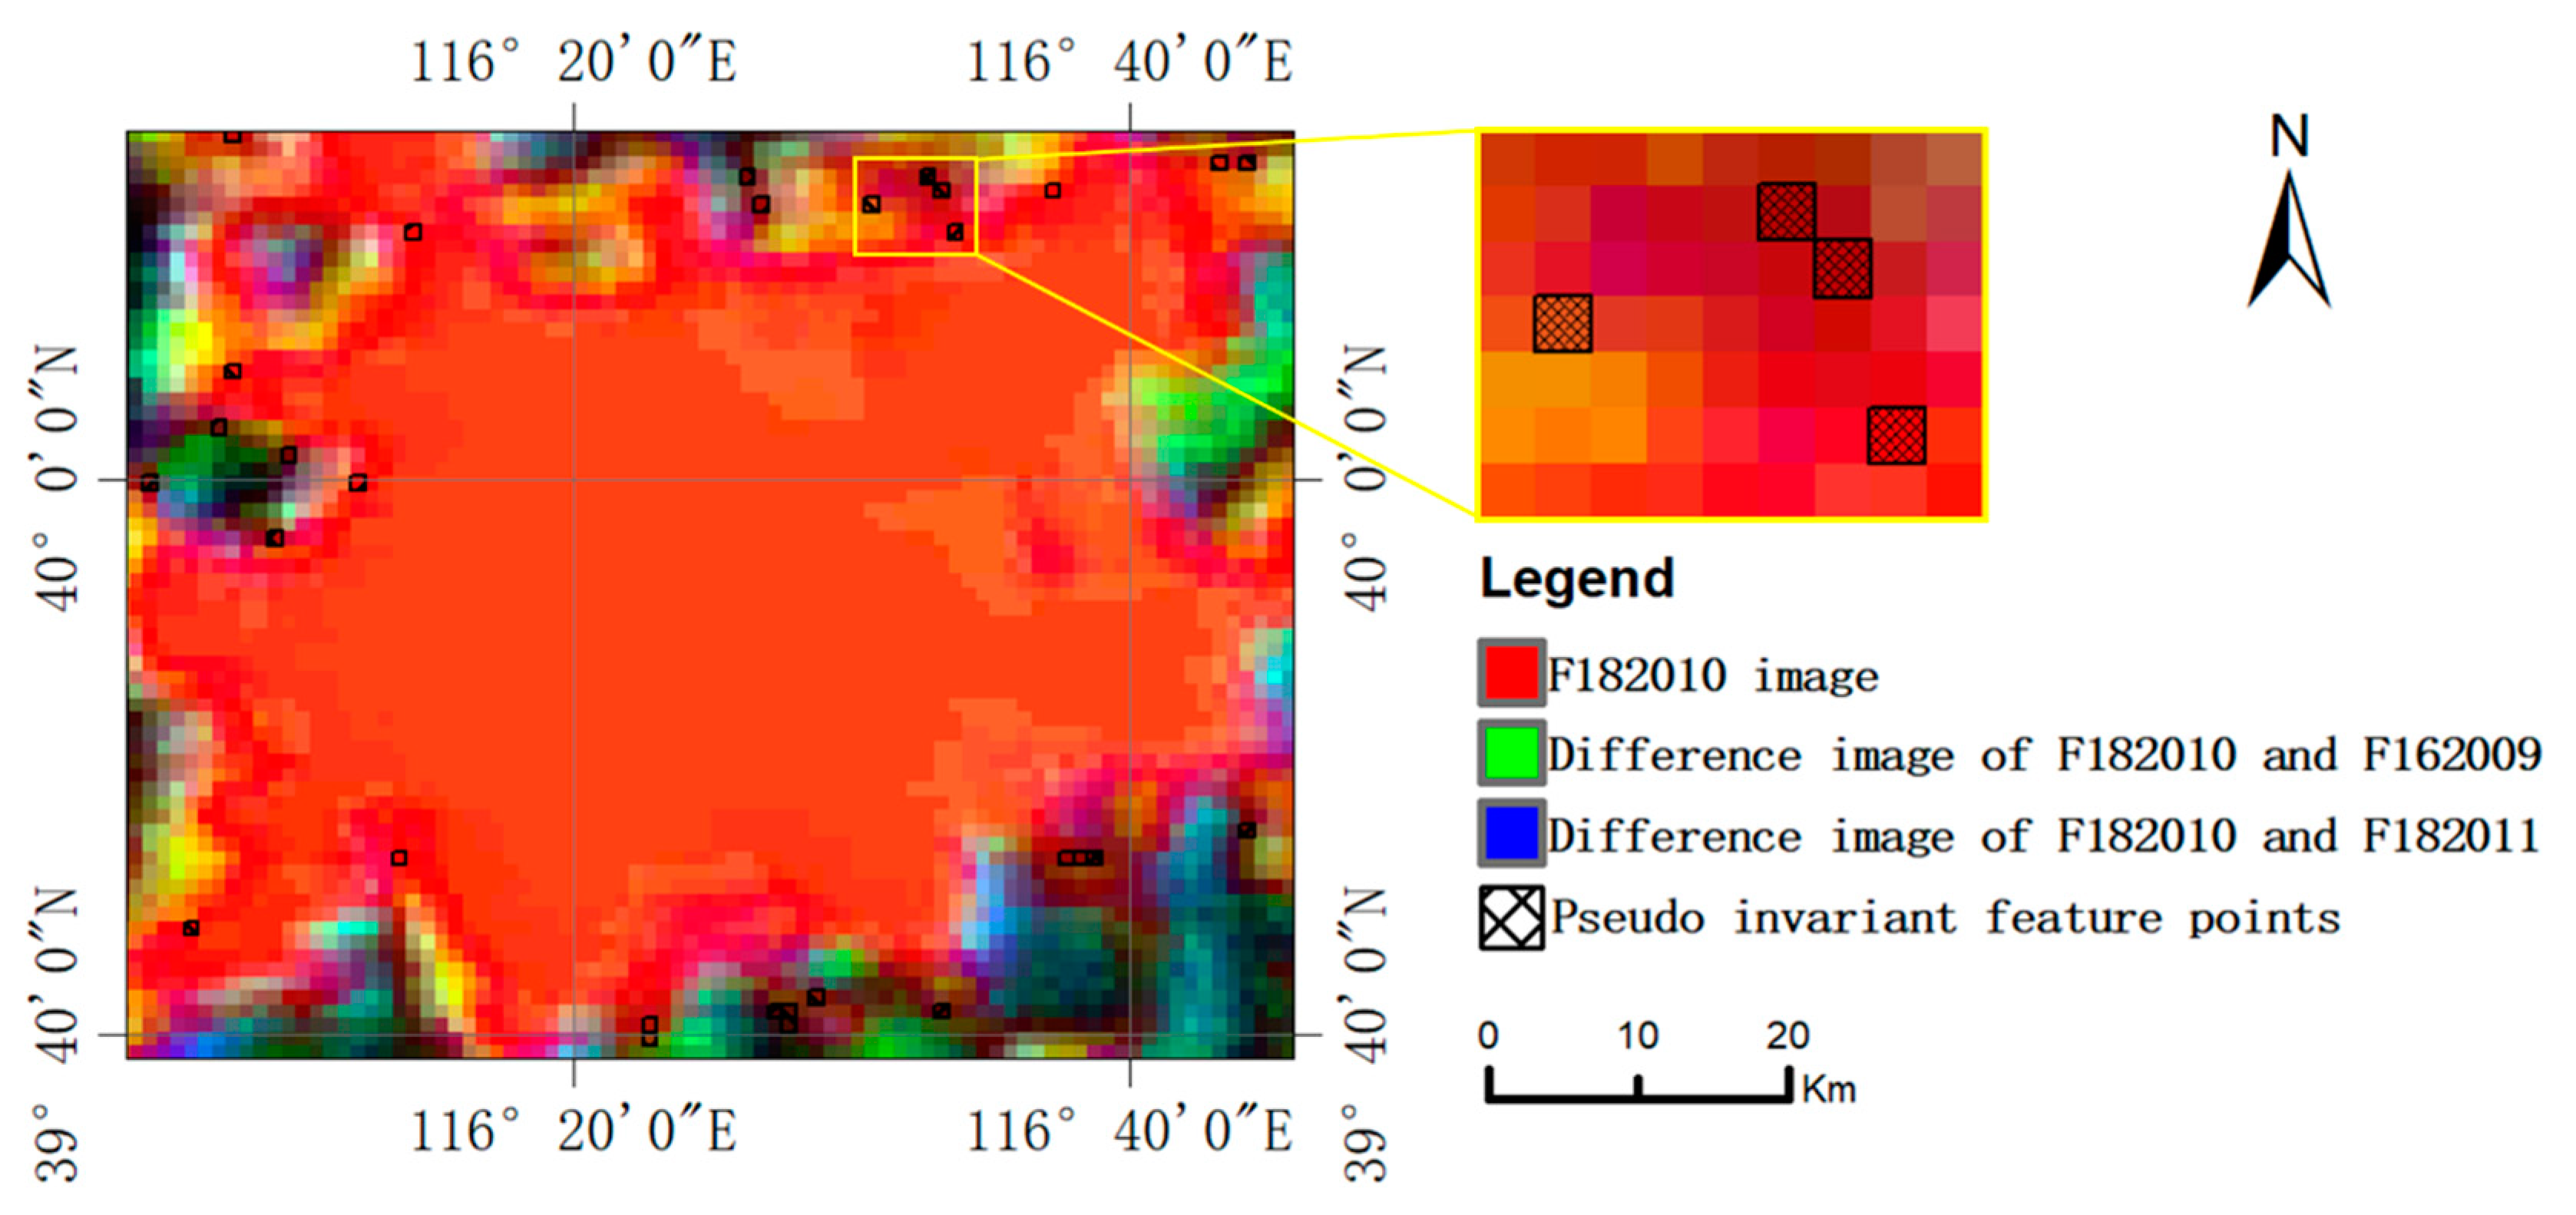
2.2.2. Building the Radiation Normalization Model: Pseudo Invariant Feature and Regression Method
2.2.3. Image Post Processing
2.2.4. Test and Verification Methods
3. Results
3.1. Analysis of Linear Regression Results
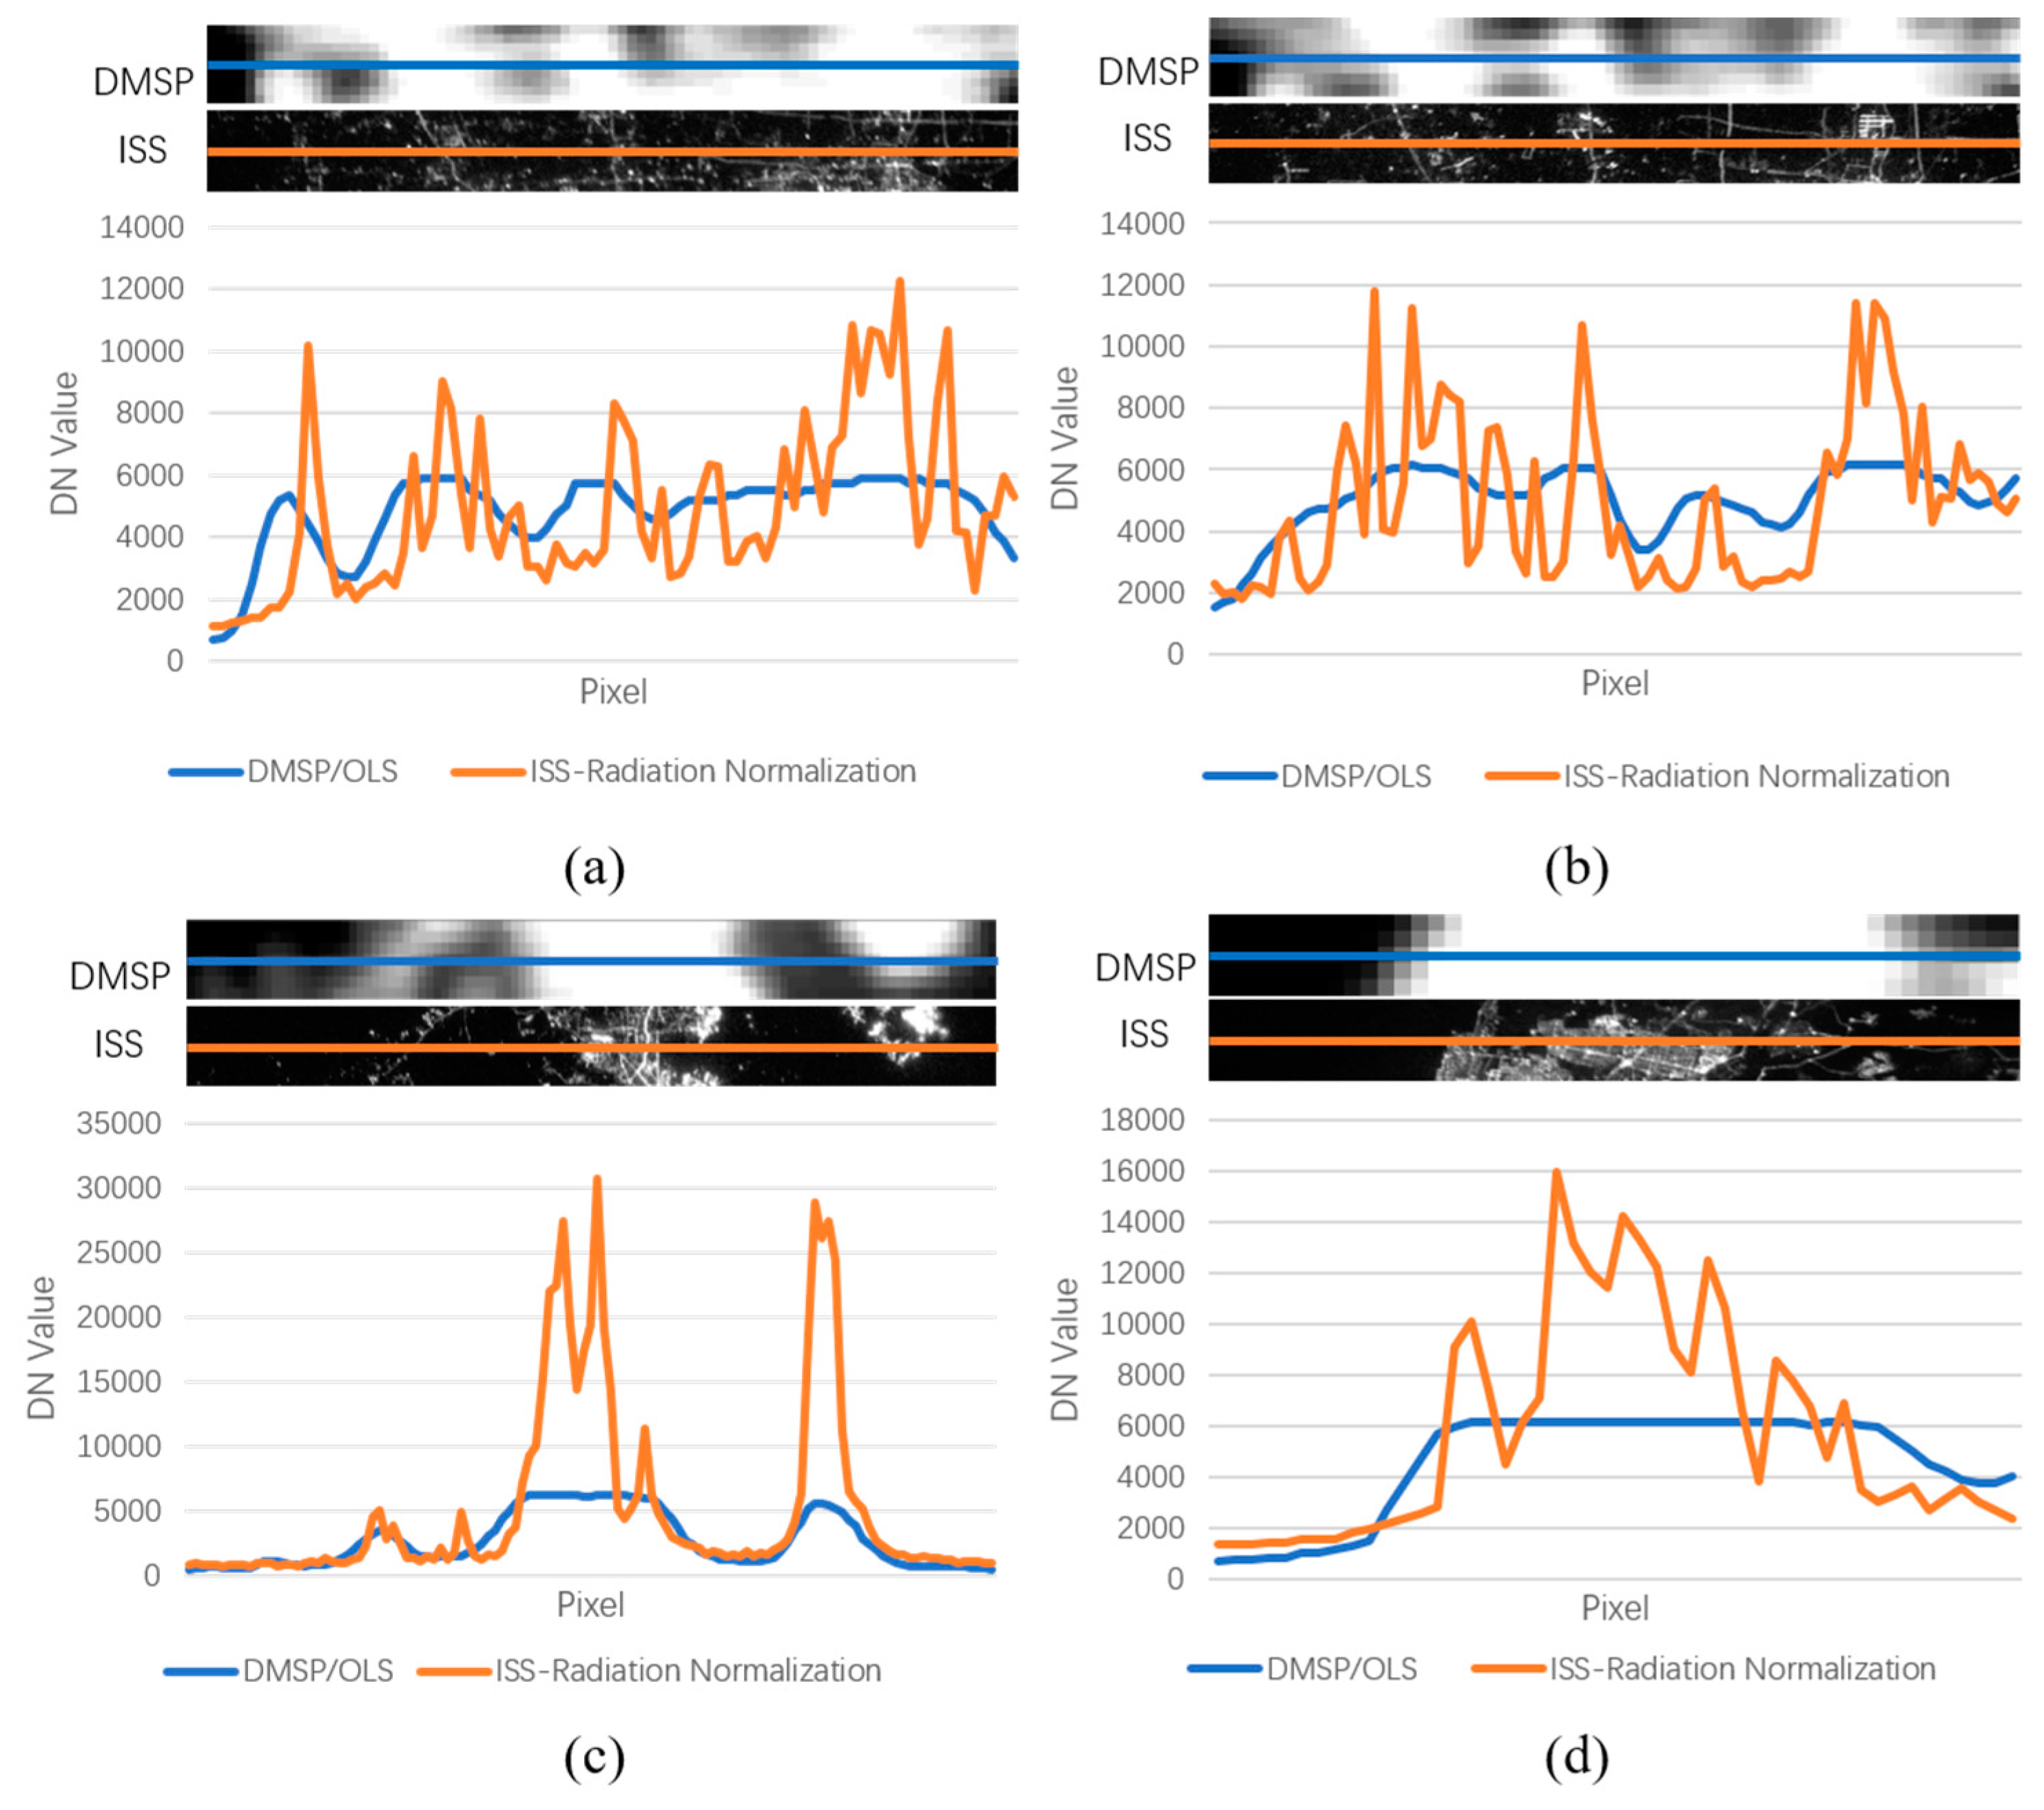
3.2. Visual Effect of Radiation Normalization Results
3.3. Quantitative Analysis of Radiation Normalization Results
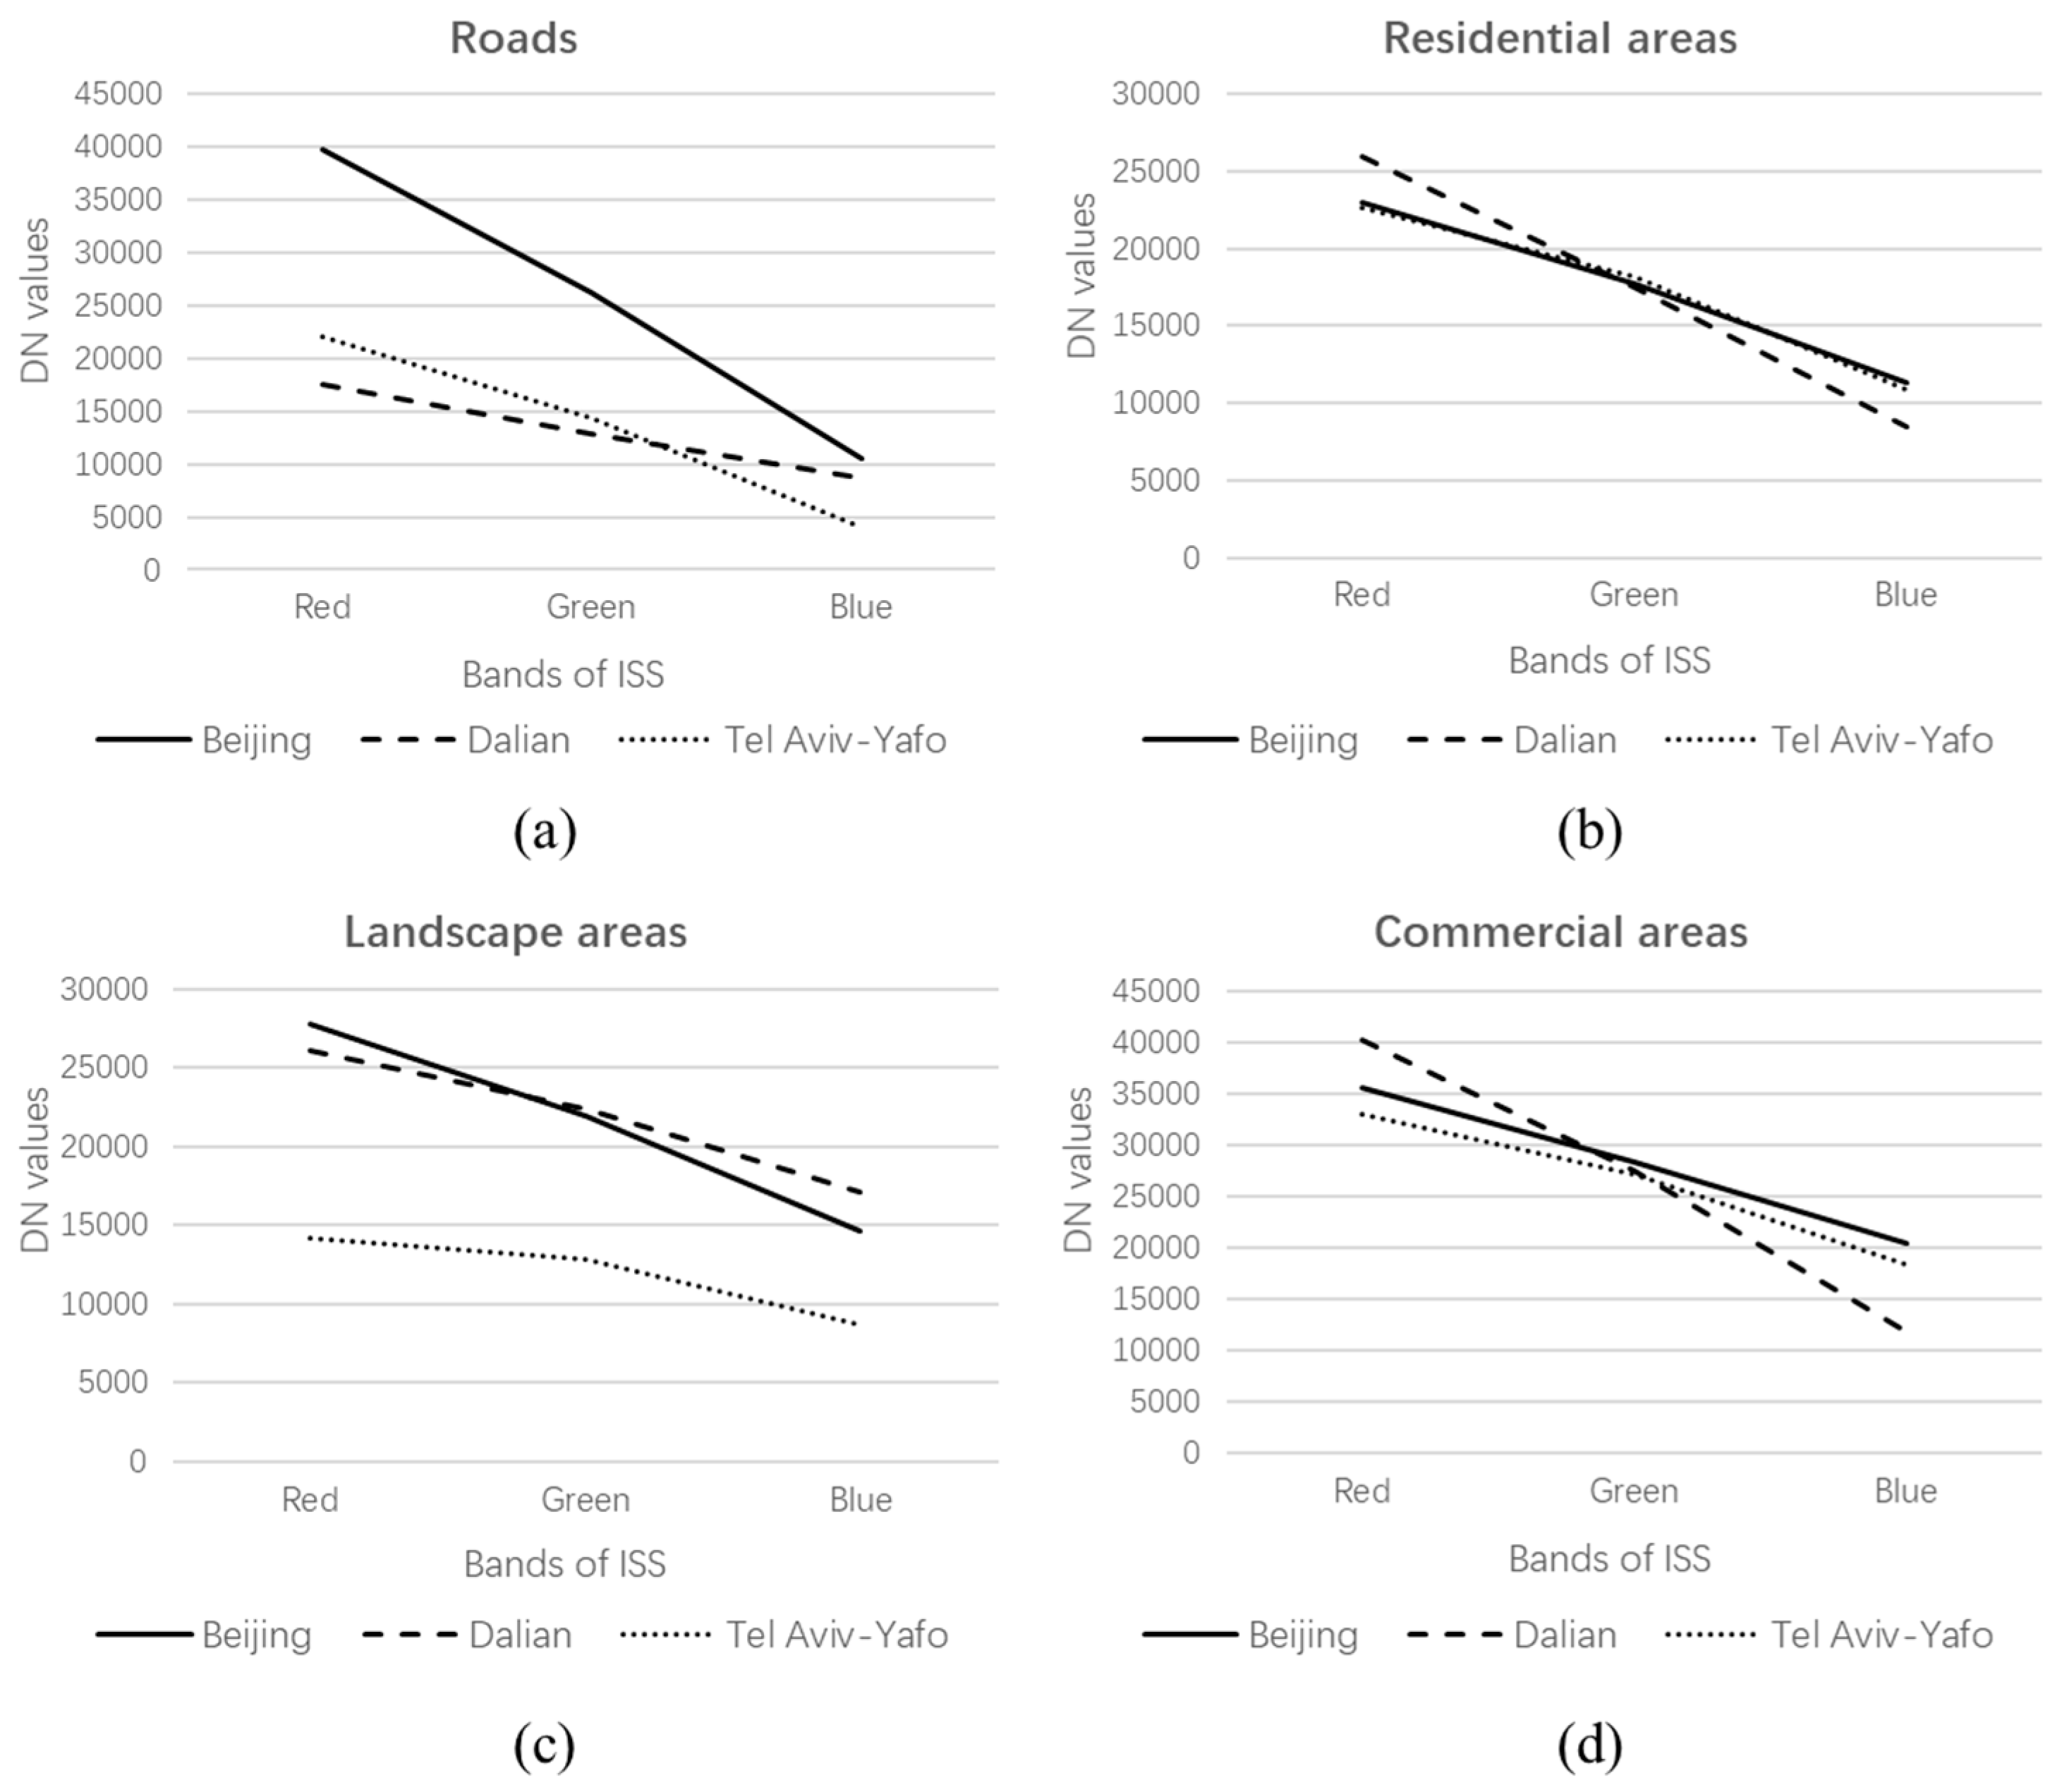
3.4. Comparison of Nighttime Lighting in Typical Public Space Lighting Areas between Different Cities
4. Discussion
- The DMSP/OLS images are calibrated images, and ISS RGB NTL imagery attempts to reproduce the sensitivity of the human eye with logarithmic response, which has the loss of linearity, and both data have tilt angle problem. Thus, they bring uncertainty to the relative radiation normalization of ISS NTL images.
- The spatial resolution difference between ISS and DMSP/OLS NTL images is large, which also affects the accuracy of relative radiation normalization.
- The DMSP/OLS images have pixel saturation, whereas ISS images have almost none, and this method uses artificial recognition of pseudo-invariant feature points, and the selection of data points has certain subjectivity.
- There must be some residual flux stemming from the fact that the gray conversion formula doesn’t perfectly match the DMSP-OLS sensitivity curve, which will introduce uncertainty to the relative radiation normalization.
- VIIRS/DNB time series NTL data is the successor of DMSP/OLS, and its spatial and temporal resolution are better than that of DMSP/OLS. Thus, it can be considered for the relative radiation correction of ISS NTL images after 2013.
- The ISS NTL photos are essentially instantaneous images, whereas the cloud-free composite images may be composed of individual frames taken over longer timescales of days to years, which will reduce the accuracy of relative radiation normalization.
5. Conclusions
Author Contributions
Funding
Acknowledgments
Conflicts of Interest
References
- Li, D.; Li, X. An Overview on Data Mining of Nighttime Light Remote Sensing. Acta Geod. Cartogr. Sin. 2015, 44, 591–601. [Google Scholar]
- Levin, N.; Kyba, C.C.; Zhang, Q.; De Miguel, A.S.; Román, M.O.; Li, X.; Portnov, B.A.; Molthan, A.L.; Jechow, A.; Miller, S.D.; et al. Remote sensing of night lights: A review and an outlook for the future. Remote Sens. Environ. 2020, 237, 111443. [Google Scholar] [CrossRef]
- Elvidge, C.D.; Baugh, K.E.; Kihn, E.A.; Kroehl, H.W.; Davis, E.R.; Davis, C.W. Relation between satellite observed visible-near infrared emissions, population, economic activity and electric power consumption. Int. J. Remote Sens. 1997, 18, 1373–1379. [Google Scholar] [CrossRef]
- Forbes, D.J. Multi-scale analysis of the relationship between economic statistics and DMSP-OLS night light images. GIScience Remote Sens. 2013, 50, 483–499. [Google Scholar] [CrossRef]
- Li, X.; Xu, H.; Chen, X.; Li, C. Potential of NPP-VIIRS Nighttime Light Imagery for Modeling the Regional Economy of China. Remote Sens. 2013, 5, 3057–3081. [Google Scholar] [CrossRef] [Green Version]
- De Miguel, A.S.; Zamorano, J.; Gómez, C.J.; Pascual, S. European street lighting power consumption estimation using DMSP/OLS images. In Proceedings of the ALAN Conference, Berlin, Germany, 28–30 October 2013. [Google Scholar]
- Small, C.; Pozzi, F.; Elvidge, C. Spatial analysis of global urban extent from DMSP-OLS night lights. Remote Sens. Environ. 2005, 96, 277–291. [Google Scholar] [CrossRef]
- Elvidge, C.D.; Baugh, K.; Zhizhin, M.; Hsu, F.C.; Ghosh, T. VIIRS night-time lights. Int. J. Remote Sens. 2017, 38, 5860–5879. [Google Scholar] [CrossRef]
- Schirmer, A.; Gallemore, C.; Liu, T.; Magle, S.; Dinello, E.; Ahmed, H.; Gilday, T. Mapping behaviorally relevant light pollution levels to improve urban habitat planning. Sci. Rep. 2019, 9, 1–13. [Google Scholar] [CrossRef]
- Cao, C.; Shao, X.; Uprety, S. Detecting Light Outages After Severe Storms Using the S-NPP/VIIRS Day/Night Band Radiances. IEEE Geosci. Remote Sens. Lett. 2013, 10, 1582–1586. [Google Scholar] [CrossRef]
- Li, X.; Li, D. Can night-time light images play a role in evaluating the Syrian Crisis? Int. J. Remote Sens. 2014, 35, 6648–6661. [Google Scholar] [CrossRef]
- Jiang, W.; He, G.; Long, T.; Wang, C.; Ni, Y.; Ma, R. Assessing Light Pollution in China Based on Nighttime Light Imagery. Remote Sens. 2017, 9, 135. [Google Scholar] [CrossRef] [Green Version]
- Jiang, W.; He, G.; Leng, W.; Long, T.; Wang, G.; Liu, H.; Peng, Y.; Yin, R.; Guo, H. Characterizing Light Pollution Trends across Protected Areas in China Using Nighttime Light Remote Sensing Data. ISPRS Int. J. Geo-Inf. 2018, 7, 243. [Google Scholar] [CrossRef] [Green Version]
- Jiang, W.; He, G.; Long, T.; Guo, H.; Yin, R.; Leng, W.; Liu, H.; Wang, G. Potentiality of Using Luojia 1-01 Nighttime Light Imagery to Investigate Artificial Light Pollution. Sensors 2018, 18, 2900. [Google Scholar] [CrossRef] [PubMed] [Green Version]
- Kloog, I.; Haim, A.; Stevens, R.G.; Barchana, M.; Portnov, B.A. Light at Night Co-distributes with Incident Breast but not Lung Cancer in the Female Population of Israel. Chronobiol. Int. 2008, 25, 65–81. [Google Scholar] [CrossRef] [PubMed]
- Waluda, C.M.; Yamashiro, C.; Elvidge, C.D.; Hobson, V.R.; Rodhouse, P.G. Quantifying light-fishing for Dosidicus gigas in the Eastern Pacific using satellite remote sensing. Remote Sens. Environ. 2004, 91, 129–133. [Google Scholar] [CrossRef]
- Waluda, C.M.; Griffiths, H.J.; Rodhouse, P.G. Remotely sensed spatial dynamics of the Illex argentinus fishery, Southwest Atlantic. Fish. Res. 2008, 91, 196–202. [Google Scholar] [CrossRef]
- Kiyofuji, H.; Saitoh, S. Use of nighttime visible images to detect Japanese common squid Todarodes pacificus fishing areas and potential migration routes in the Sea of Japan. Mar. Ecol. Prog. Ser. 2004, 276, 173–186. [Google Scholar] [CrossRef]
- Bauer, S.E.; Wagner, S.; Burch, J.B.; Bayakly, R.; Vena, J.E. A case-referent study: Light at night and breast cancer risk in Georgia. Int. J. Health Geogr. 2013, 12, 23. [Google Scholar] [CrossRef] [Green Version]
- Bharti, N.; Tatem, A.J.; Ferrari, M.J.; Grais, R.F.; Djibo, A.; Grenfell, B.T. Explaining Seasonal Fluctuations of Measles in Niger Using Nighttime Lights Imagery. Science 2011, 334, 1424–1427. [Google Scholar] [CrossRef] [Green Version]
- Cheng, B.; Chen, Z.; Yu, B.; Li, Q.; Wang, C.; Li, B.; Wu, B.; Li, Y.; Wu, J. Automated Extraction of Street Lights from JL1-3B Nighttime Light Data and Assessment of Their Solar Energy Potential. IEEE J. Sel. Top. Appl. Earth Obs. Remote Sens. 2020, 13, 675–684. [Google Scholar] [CrossRef]
- Wang, K.; Weng, Q.; Huang, L.; Wang, K.; Deng, J.; Jiang, R.; Ye, Z.; Gan, M. A new source of multi-spectral high spatial resolution night-time light imagery—JL1-3B. Remote Sens. Environ. 2018, 215, 300–312. [Google Scholar] [CrossRef]
- Elvidge, C.D.; Ziskin, D.; Baugh, K.E.; Tuttle, B.T.; Ghosh, T.; Pack, D.W.; Erwin, E.H.; Zhizhin, M. A Fifteen Year Record of Global Natural Gas Flaring Derived from Satellite Data. Energies 2009, 2, 595–622. [Google Scholar] [CrossRef]
- De Miguel, A.S.; Castaño, J.G.; Zamorano, J.; Pascual, S.; Angeles, M.; Cayuela, L.; Martinez, G.M.; Challupner, P.; Kyba, C.C.M. Atlas of astronaut photos of Earth at night. Astron. Geophys. 2014, 55, 4. [Google Scholar] [CrossRef] [Green Version]
- De Miguel, A.S. Variación Espacial, Temporal y Espectral de la Contaminación Lumínica y sus Fuentes: Metodología y Resultados. Ph.D. Thesis, Familia Sánchez de Miguel, Universidad Complutense de Madrid, Madrid, Spain, 2015. [Google Scholar]
- de Miguel, A.S.; Zamorano, J.; Pascual, S.; López Cayuela, M.; Ocaña, F.; Challupner, P.; Gómez Castaño, J.; Fernández-Renau, A.; Gómez, J.A.; de Miguel, E. ISS Nocturnal Images as a Scientific Tool Against Light Pollution: Flux Calibration and Colors. In Highlights of Spanish A Strophysics VII; Springer: Berlin, Germany, 2013; Volume 1, pp. 916–919. [Google Scholar]
- De Miguel, A.S.; Kyba, C.C.M.; Aubé, M.; Zamorano, J.; Cardiel, N.; Tapia, C.; Bennie, J.; Gaston, K.J. Colour remote sensing of the impact of artificial light at night (I): The potential of the International Space Station and other DSLR-based platforms. Remote Sens. Environ. 2019, 224, 92–103. [Google Scholar] [CrossRef]
- Rybnikova, N.A.; Portnov, B.A. Population-level study links short-wavelength nighttime illumination with breast cancer incidence in a major metropolitan area. Chronobiol. Int. 2018, 35, 1198–1208. [Google Scholar] [CrossRef]
- Garcia-Saenz, A.; De Miguel, A.S.; Espinosa, A.; Valentin, A.; Aragonés, N.; Llorca, J.; Amiano, P.; Sánchez, V.M.; Guevara, M.; Capelo, R.; et al. Evaluating the Association between Artificial Light-at-Night Exposure and Breast and Prostate Cancer Risk in Spain (MCC-Spain Study). Environ. Health Perspect. 2018, 126, 047011. [Google Scholar] [CrossRef]
- Pauwels, J.; Le Viol, I.; Azam, C.; Valet, N.; Julien, J.-F.; Bas, Y.; LeMarchand, C.; De Miguel, A.S.; Kerbiriou, C. Accounting for artificial light impact on bat activity for a biodiversity-friendly urban planning. Landsc. Urban Plan. 2019, 183, 12–25. [Google Scholar] [CrossRef]
- Levin, N.; Duke, Y. High spatial resolution night-time light images for demographic and socio-economic studies. Remote Sens. Environ. 2012, 119, 1–10. [Google Scholar] [CrossRef]
- Kotarba, A.Z.; Aleksandrowicz, S. Impervious surface detection with nighttime photography from the International Space Station. Remote Sens. Environ. 2016, 176, 295–307. [Google Scholar] [CrossRef]
- Kuffer, M.; Pfeffer, K.; Sliuzas, R.; Taubenböck, H.; Baud, I.; Van Maarseveen, M.F.A.M. Capturing the Urban Divide in Nighttime Light Images from the International Space Station. IEEE J. Sel. Top. Appl. Earth Obs. Remote Sens. 2018, 11, 2578–2586. [Google Scholar] [CrossRef]
- Wicht, M.; Kuffer, M. The continuous built-up area extracted from ISS night-time lights to compare the amount of urban green areas across European cities. Eur. J. Remote Sens. 2019, 52, 58–73. [Google Scholar] [CrossRef]
- Mazor, T.; Levin, N.; Possingham, H.P.; Levy, Y.; Rocchini, D.; Richardson, A.J.; Kark, S. Can satellite-based night lights be used for conservation? The case of nesting sea turtles in the Mediterranean. Biol. Conserv. 2013, 159, 63–72. [Google Scholar] [CrossRef] [Green Version]
- Zhuo, L.; Zheng, J.; Zhang, X.; Li, J.; Liu, L. An improved method of night-time light saturation reduction based on EVI. Int. J. Remote Sens. 2015, 36, 4114–4130. [Google Scholar] [CrossRef]
- Wu, J.; He, S.; Peng, J.; Li, W.; Zhong, X. Intercalibration of DMSP-OLS night-time light data by the invariant region method. Int. J. Remote Sens. 2013, 34, 7356–7368. [Google Scholar] [CrossRef]
- Li, X.; Chen, X.; Zhao, Y.; Xu, J.; Chen, F.; Li, H. Automatic intercalibration of night-time light imagery using robust regression. Remote Sens. Lett. 2013, 4, 45–54. [Google Scholar] [CrossRef]
- Zhang, Q.; Pandey, B.; Seto, K.C. A Robust Method to Generate a Consistent Time Series from DMSP/OLS Nighttime Light Data. IEEE Trans. Geosci. Remote Sens. 2016, 54, 5821–5831. [Google Scholar] [CrossRef]
- Hsu, F.-C.; Baugh, K.E.; Ghosh, T.; Zhizhin, M.; Elvidge, C.D. DMSP-OLS Radiance Calibrated Nighttime Lights Time Series with Intercalibration. Remote Sens. 2015, 7, 1855–1876. [Google Scholar] [CrossRef] [Green Version]
- Shao, X.; Cao, C.Y.; Zhang, B.; Qiu, S.; Elvidge, C.D.; Von, H.M. Radiometric calibration of DMSP-OLS Sensor using VIIRS Day/Night Band. In Proceedings of the SPIE 9264, Earth Observing Missions and Sensors: Development, Implementation, and Characterization III 2014, Beijing, China, 19 November 2014. [Google Scholar]
- Chand, T.R.K.; Badarinath, K.; Elvidge, C.D.; Tuttle, B.T. Spatial characterization of electrical power consumption patterns over India using temporal DMSP-OLS night-time satellite data. Int. J. Remote Sens. 2009, 30, 647–661. [Google Scholar] [CrossRef]
- Lyytimäki, J.; Tapio, P.; Assmuth, T. Unawareness in environmental protection: The case of light pollution from traffic. Land Use Policy 2012, 29, 598–604. [Google Scholar] [CrossRef]
- Amaral, S.; Câmara, G.; Monteiro, A.M.V.; Quintanilha, J.A.; Elvidge, C.D. Estimating population and energy consumption in Brazilian Amazonia using DMSP night-time satellite data. Comput. Environ. Urban Syst. 2005, 29, 179–195. [Google Scholar] [CrossRef]
- Deng, Y.; Liu, S.; Cai, J.; Lu, X.; Nielsen, C.P. Spatial pattern and its evolution of Chinese provincial population: Methods and empirical study. J. Geogr. Sci. 2015, 25, 1507–1520. [Google Scholar] [CrossRef] [Green Version]
- Qi, Y.; Yang, Y.; Jin, F. China’s economic development stage and its spatio-temporal evolution: A prefectural-level analysis. J. Geogr. Sci. 2013, 23, 297–314. [Google Scholar] [CrossRef]
- Schott, J.R.; Salvaggio, C.; Volchok, W.J. Radiometric scene normalization using pseudoinvariant features. Remote Sens. Environ. 1988, 26, 1–16. [Google Scholar] [CrossRef]
- Caselles, V.; García, M.J.L. An alternative simple approach to estimate atmospheric correction in multitemporal studies. Int. J. Remote Sens. 1989, 10, 1127–1134. [Google Scholar] [CrossRef]
- Hall, F.; Strebel, D.; Nickeson, J.; Goetz, S.J. Radiometric rectification: Toward a common radiometric response among multidate, multisensor images. Remote Sens. Environ. 1991, 35, 11–27. [Google Scholar] [CrossRef]
- Zhou, J.; Peng, F. A method of selective image graying. Comput. Eng. 2006, 32, 198–200. [Google Scholar]
- Grundland, M.; Dodgson, N.A. Decolorize: Fast, contrast enhancing, color to grayscale conversion. Pattern Recognit. 2007, 40, 2891–2896. [Google Scholar] [CrossRef] [Green Version]
- Elvidge, C.D.; Yuan, D.; Weerackoon, R.D.; Lunetta, R.S. Relative Radiometric Normalization of Landsat Multispectral Scanner (Mss) Data Using an Automatic Scattergram-Controlled Regression. Photogramm. Eng. Remote Sens. 1995, 61, 1255–1260. [Google Scholar]
- Canty, M.J.; Nielsen, A.A.; Schmidt, M. Automatic radiometric normalization of multitemporal satellite imagery. Remote Sens. Environ. 2004, 91, 441–451. [Google Scholar] [CrossRef] [Green Version]
- Canty, M.J.; Nielsen, A.A. Automatic radiometric normalization of multitemporal satellite imagery with the iteratively re-weighted MAD transformation. Remote Sens. Environ. 2008, 112, 1025–1036. [Google Scholar] [CrossRef] [Green Version]
- Zhang, L.; Yang, L.; Lin, H.; Liao, M. Automatic relative radiometric normalization using iteratively weighted least square regression. Int. J. Remote Sens. 2008, 29, 459–470. [Google Scholar] [CrossRef]
- Liang, L.; Bian, J.H.; Li, A.N.; Feng, W.L.; Lei, G.B.; Zhang, Z.J.; Zuo, J.Q. Consistent intercalibration of nighttime light data between DMSP/OLS and NPP/VIIRS in the China–Pakistan Economic Corridor. J. Remote Sens. 2020, 24, 149–160. [Google Scholar]
- Wei, Y.; Liu, H.; Song, W.; Yu, B.; Xiu, C. Normalization of time series DMSP-OLS nighttime light images for urban growth analysis with Pseudo Invariant Features. Landsc. Urban Plan. 2014, 128, 1–13. [Google Scholar] [CrossRef]


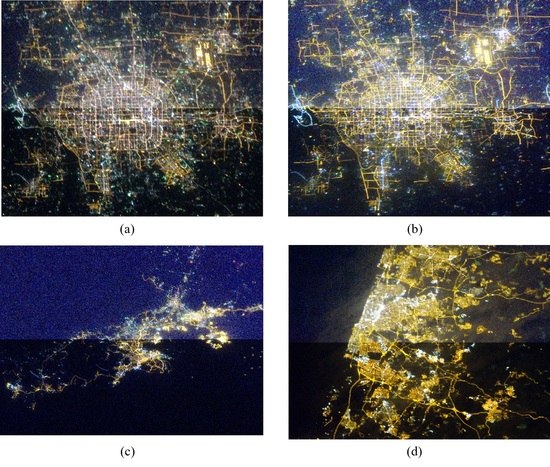
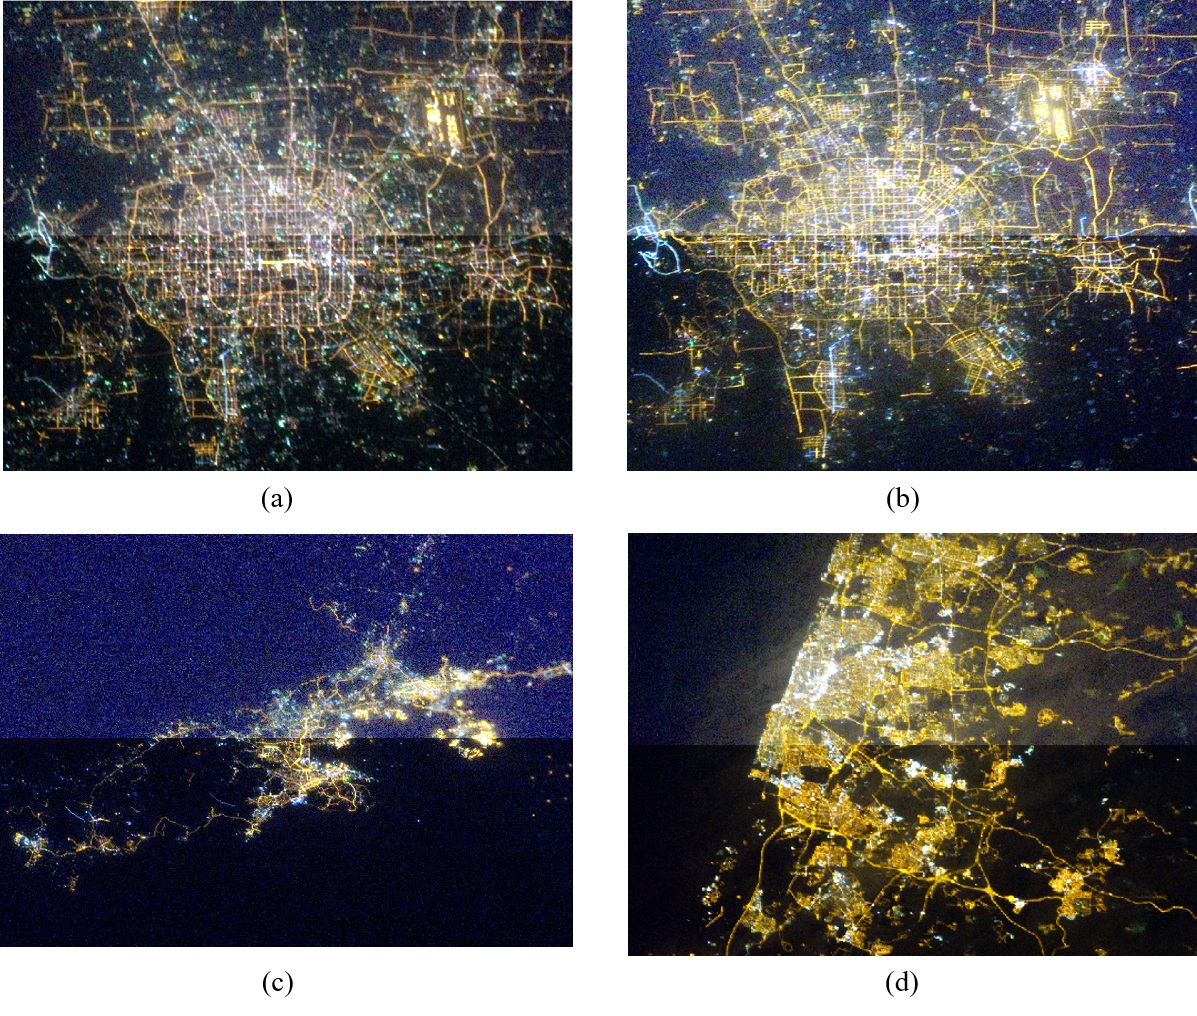
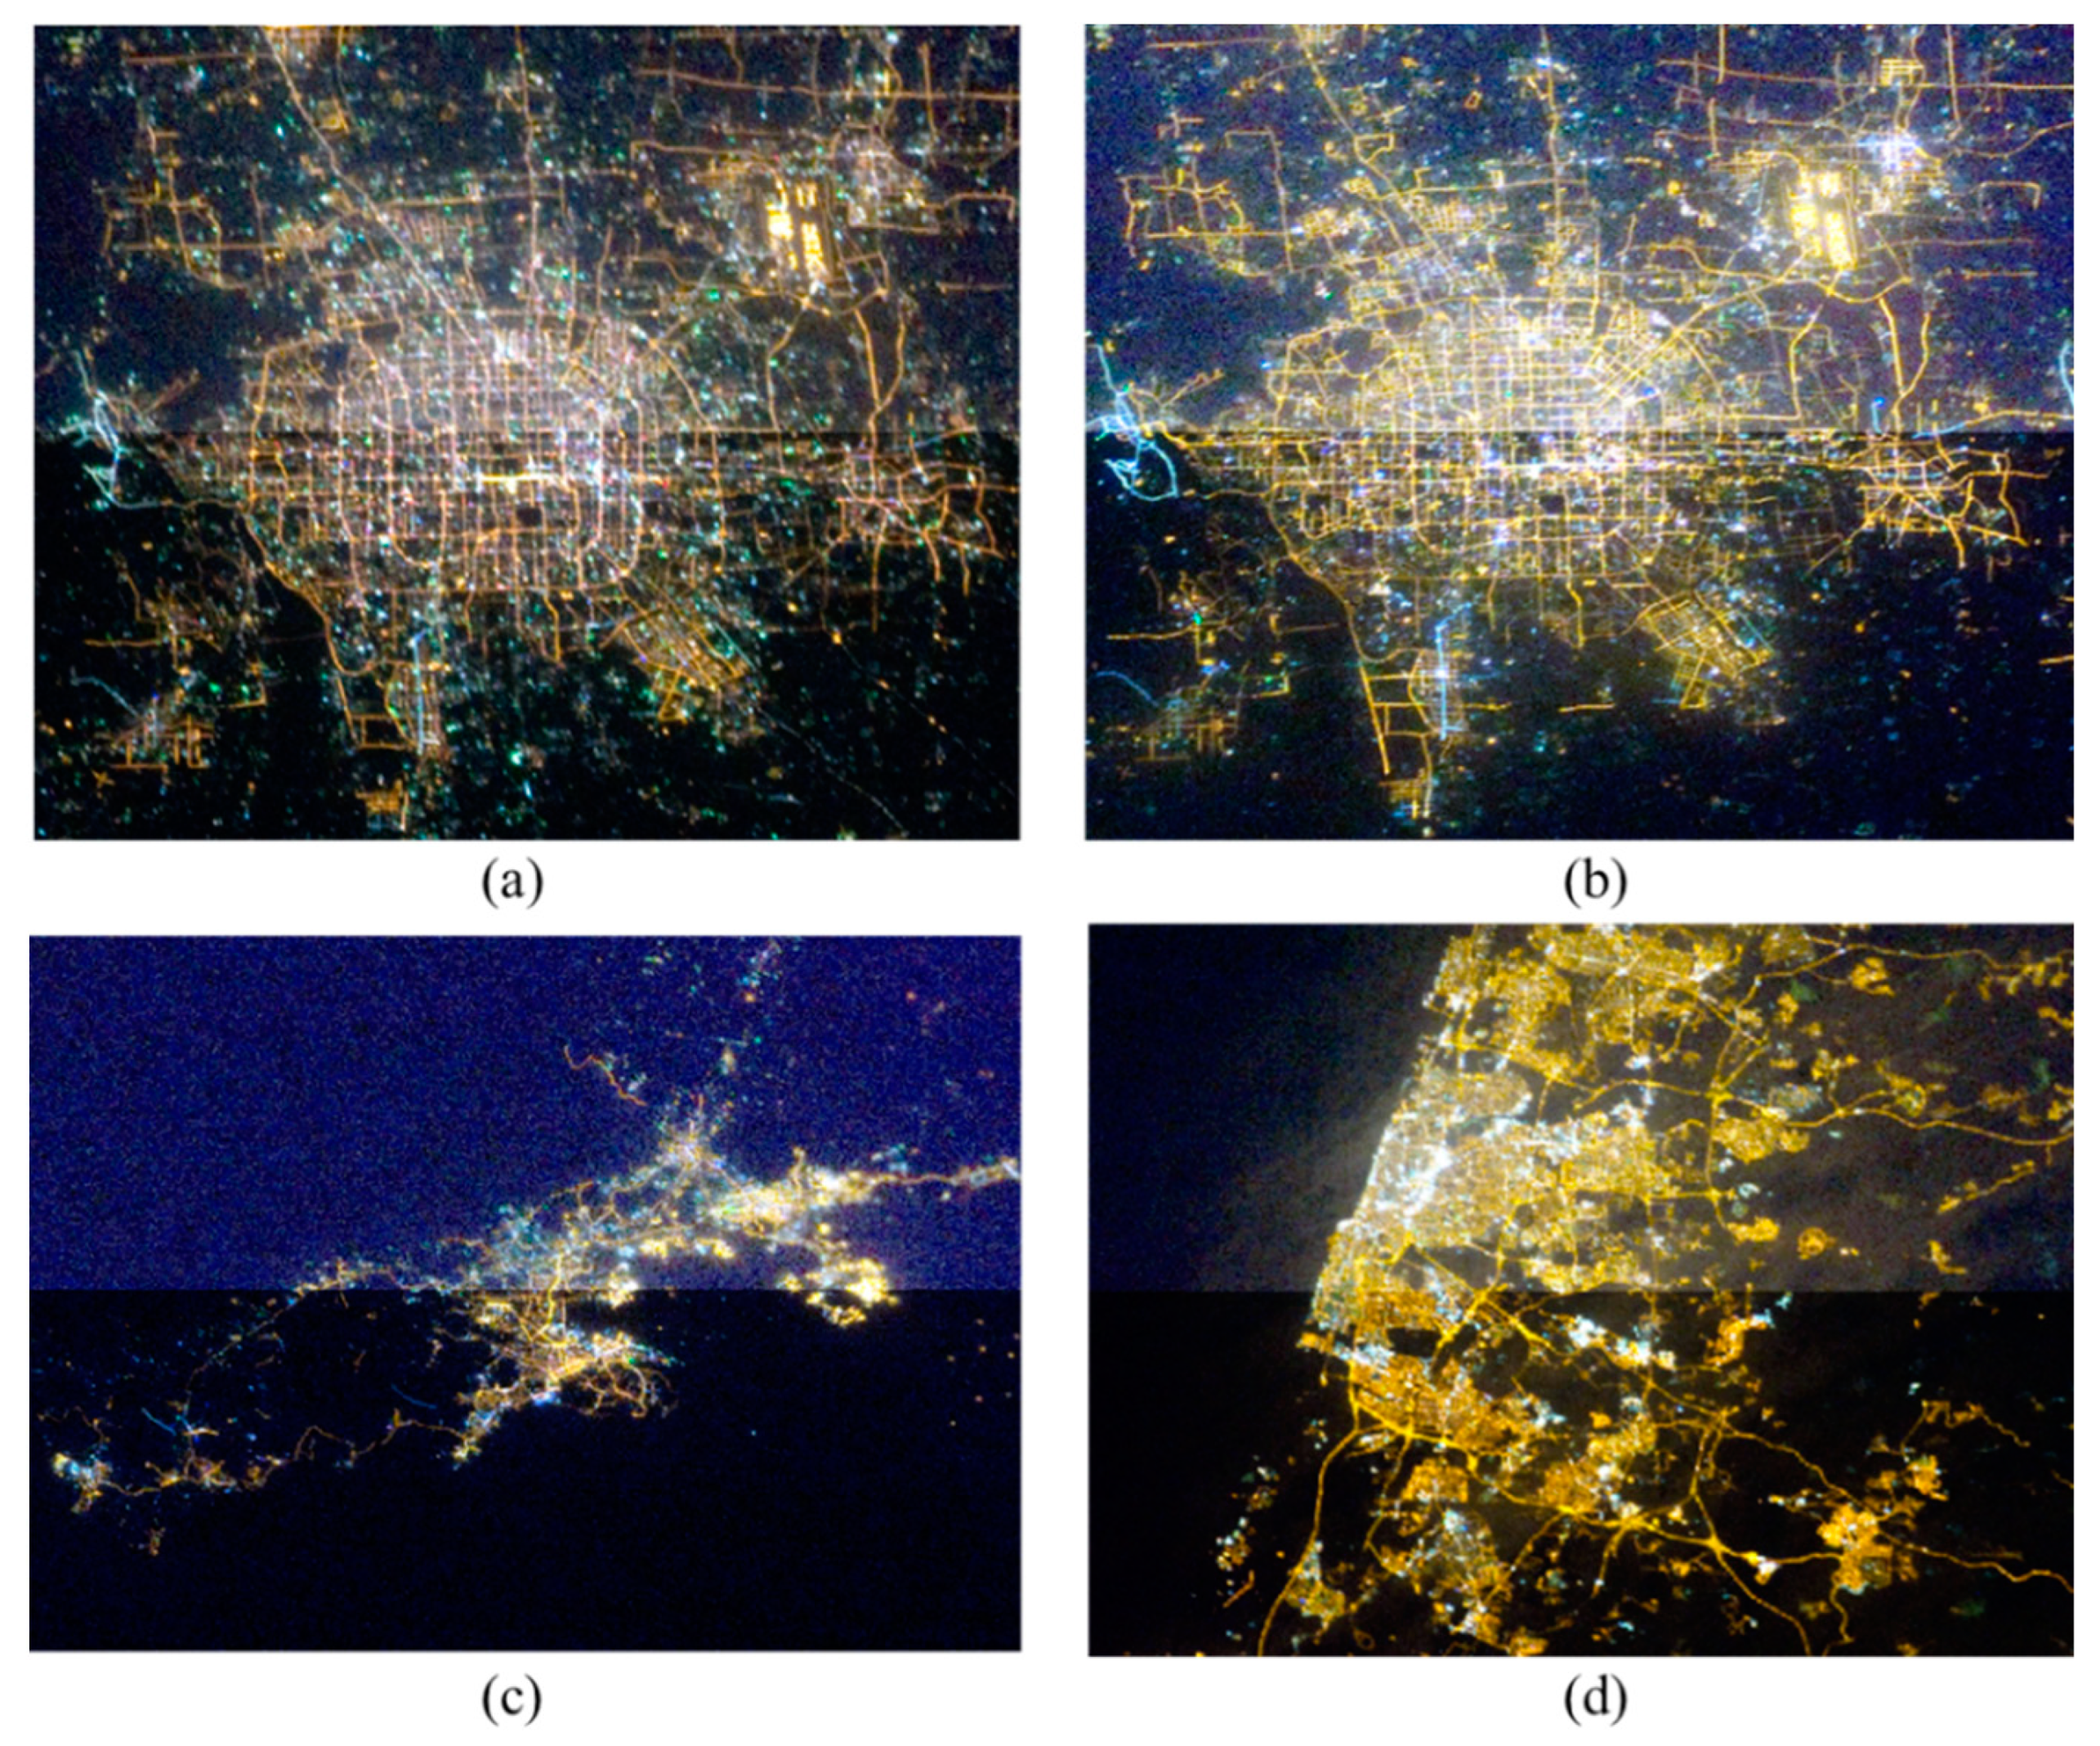
| Image Attribute | Image-1 | Image-2 | Image-3 | Image-4 |
|---|---|---|---|---|
| Photo ID | ISS026-E-10155 | ISS026-E-24048 | ISS026-E-24057 | ISS026-E-28917 |
| Image Area | Beijing-Tianjin | Beijing | Dalian | Tel Aviv-Yafo |
| Date &Time (GMT) | 2010.12.14 14:34:43 | 2011.02.01 19:08:29 | 2011.02.01 19:09:05 | 2011.02.22 23:24:47 |
| Photo Center Point | 39.4° N, 116.8° E | 40.0° N, 116.5° E | 48.9° N, 121.6° E | 30.6° N, 35.2° E |
| Focal Length | 180 mm | 80 mm | 145 mm | 200 mm |
| Camera Tilt | High Oblique | 27 degrees | 43 degrees | 26 degrees |
| Spacecraft Altitude | 343 km | 348 km | 348 km | 350 km |
| Image Pixels | 4256 × 2913 | 4256 × 2913 | 4256 × 2913 | 4256 × 2913 |
| Image Coverage | ≈45,000 km2 | ≈30,000 km2 | ≈19,000 km2 | ≈5000 km2 |
| Spatial Resolution | ≈60 m | ≈50 m | ≈40 m | ≈20 m |
| Images |  |  |  |  |
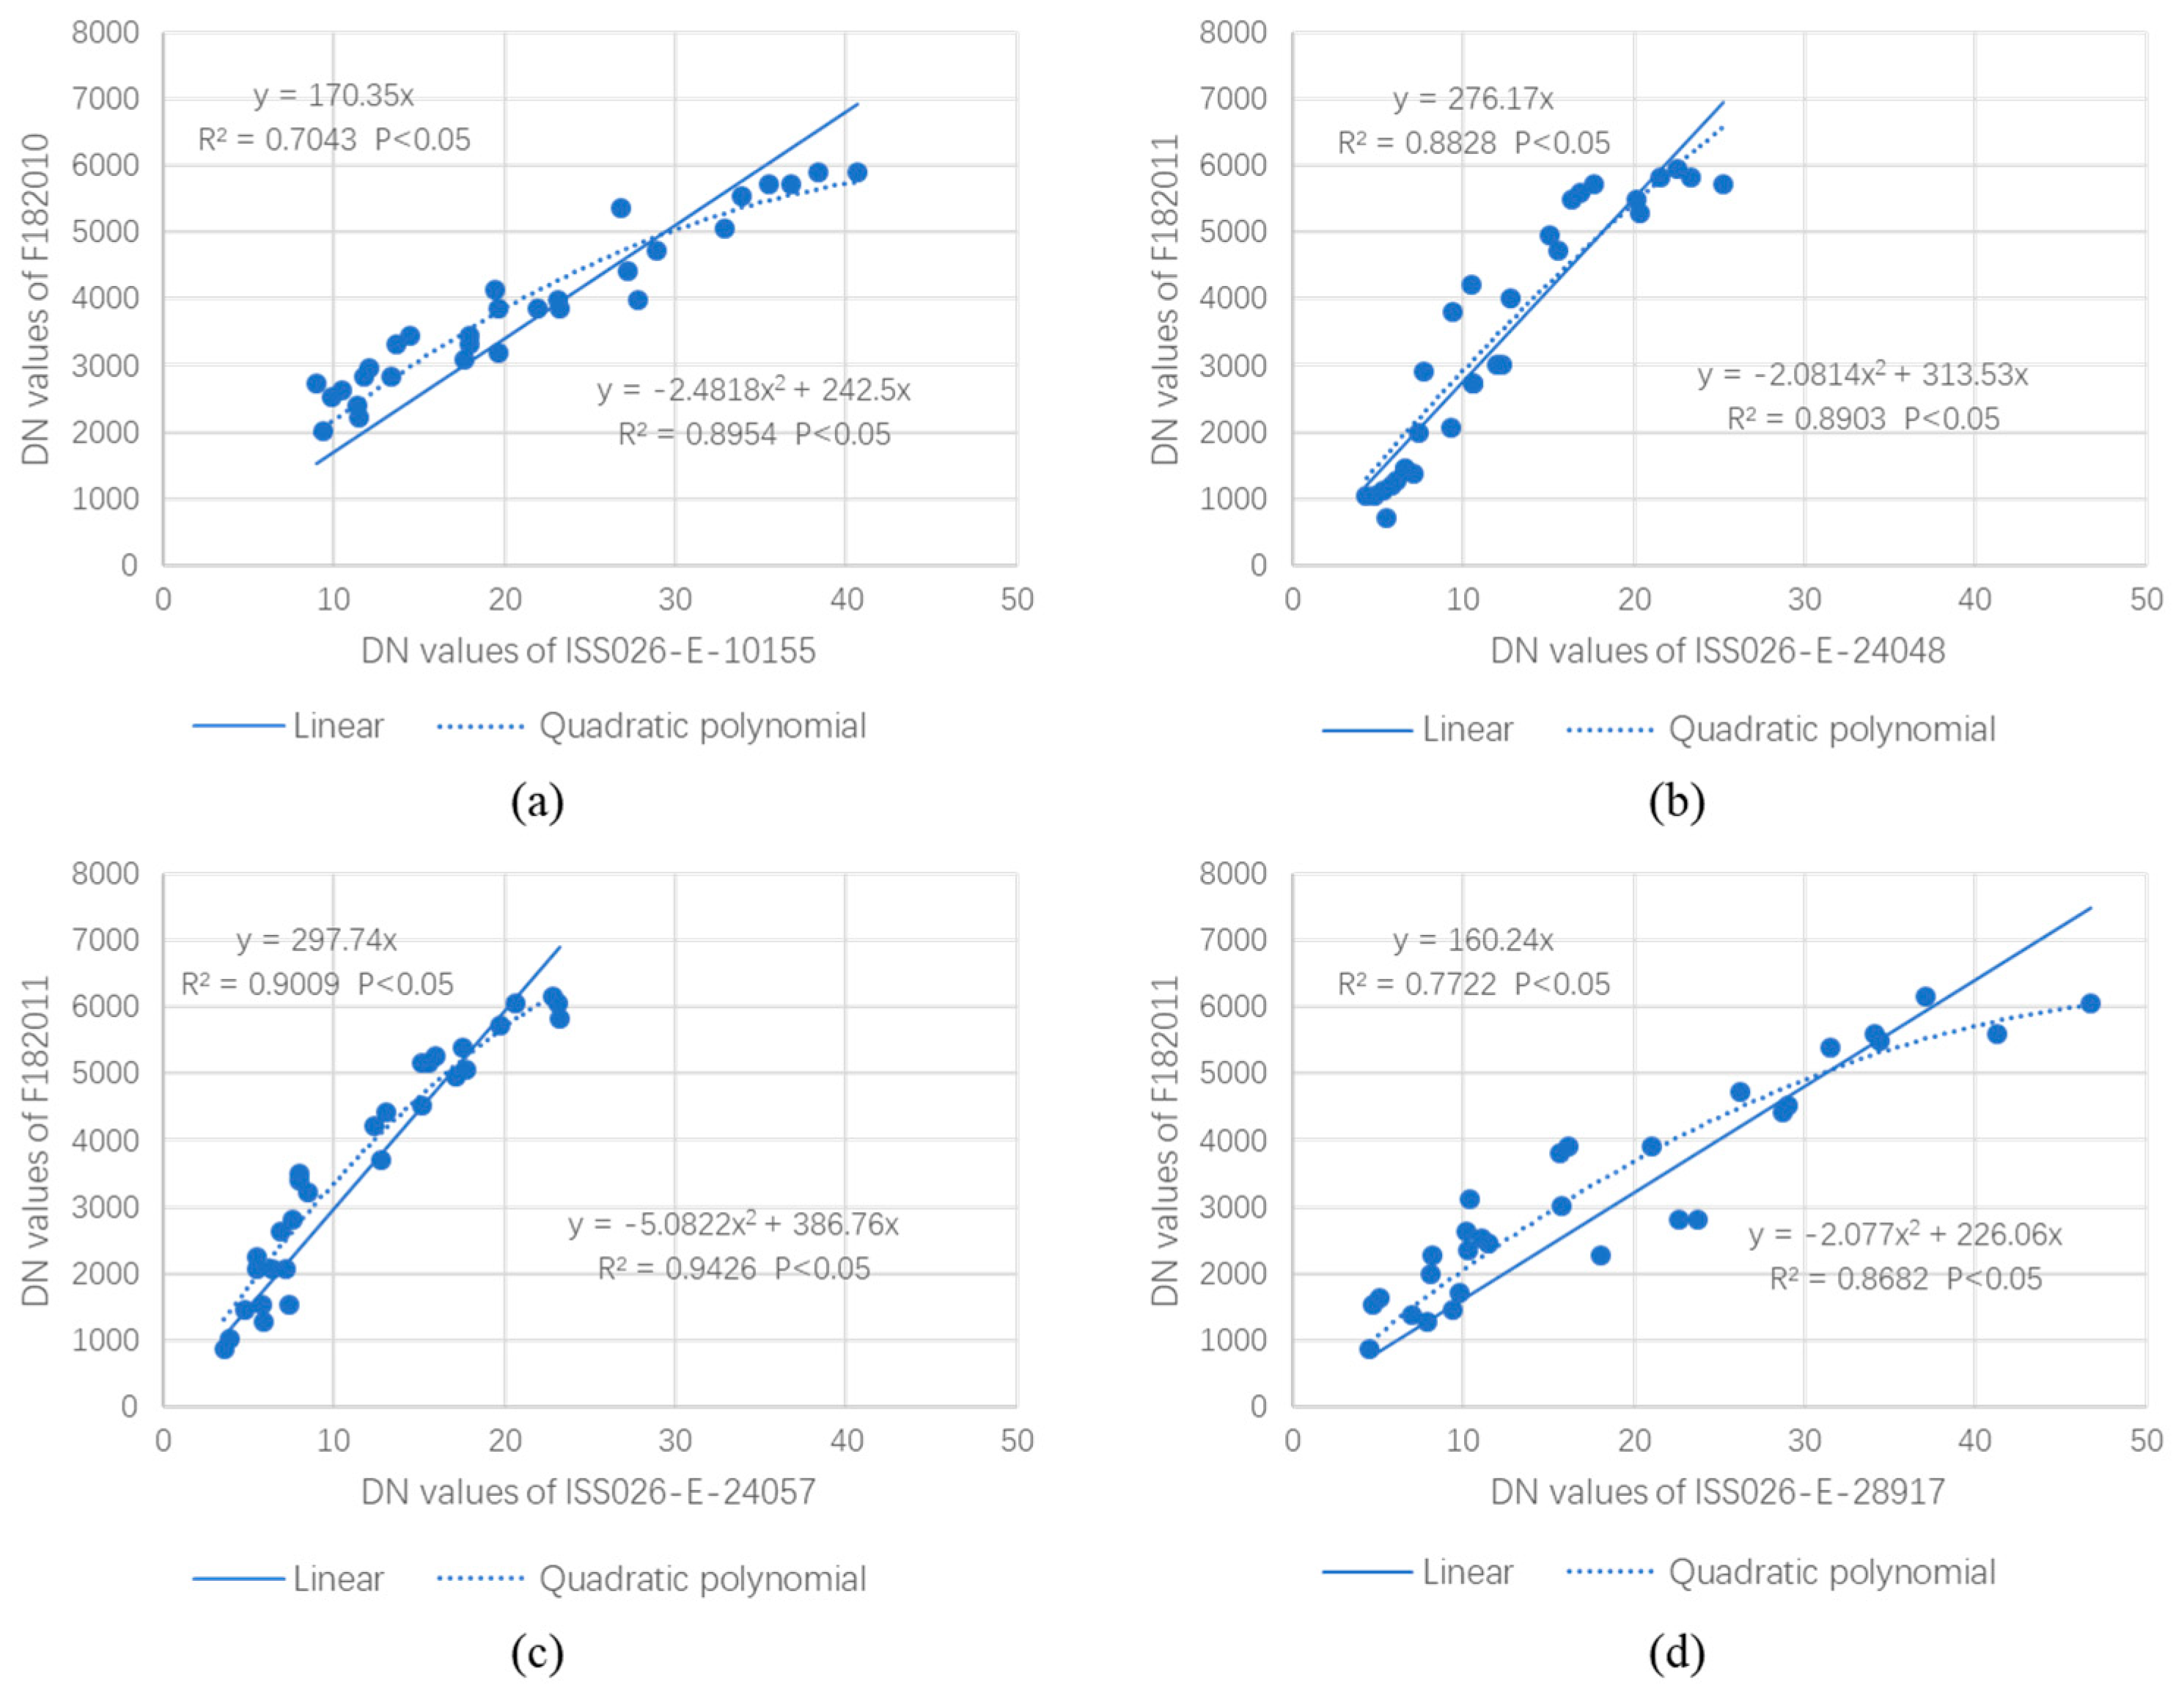
| Target Image | Reference Image | a 1 | R2 | RMSE | |
|---|---|---|---|---|---|
| b 1 | c 1 | ||||
| ISS026-E-10155 | F182010 | 170.3500 | 0.7043 | 631.7638 | |
| −2.4818 | 242.5000 | 0.8954 | 375.7838 | ||
| ISS026-E-24048 | F182011 | 276.1700 | 0.8828 | 629.6123 | |
| −2.0814 | 313.5300 | 0.8903 | 609.0904 | ||
| ISS026-E-24057 | F182011 | 297.7400 | 0.9009 | 535.5537 | |
| −5.0822 | 386.7600 | 0.9426 | 416.7660 | ||
| ISS026-E-28917 | F182011 | 160.2400 | 0.7722 | 749.2941 | |
| −2.0770 | 226.0600 | 0.8682 | 569.9038 | ||
| Study Area & Time | DMSP/OLS Image | Before Radiation Normalization 1 | After Radiation Normalization | ||||||
|---|---|---|---|---|---|---|---|---|---|
| Gray | Red | Green | Blue | Gray | Red | Green | Blue | ||
| Beijing in 2010 | 5140.80 | 71.39 | 78.90 | 70.55 | 56.03 | 12161.30 | 13440.73 | 12017.90 | 9544.06 |
| Beijing in 2011 | 5402.96 | 49.97 | 61.41 | 47.49 | 26.67 | 13799.28 | 16958.69 | 13116.31 | 7365.56 |
| Dalian in 2011 | 3970.84 | 32.98 | 39.92 | 31.59 | 21.94 | 9819.08 | 11886.41 | 9404.56 | 6531.31 |
| Tel Aviv-Yafo in 2011 | 4858.11 | 71.38 | 93.45 | 68.61 | 27.81 | 11438.68 | 14974.28 | 10994.42 | 4456.26 |
Publisher’s Note: MDPI stays neutral with regard to jurisdictional claims in published maps and institutional affiliations. |
© 2020 by the authors. Licensee MDPI, Basel, Switzerland. This article is an open access article distributed under the terms and conditions of the Creative Commons Attribution (CC BY) license (http://creativecommons.org/licenses/by/4.0/).
Share and Cite
Wei, S.; Jiao, W.; Long, T.; Liu, H.; Bi, L.; Jiang, W.; Portnov, B.A.; Liu, M. A Relative Radiation Normalization Method of ISS Nighttime Light Images Based on Pseudo Invariant Features. Remote Sens. 2020, 12, 3349. https://0-doi-org.brum.beds.ac.uk/10.3390/rs12203349
Wei S, Jiao W, Long T, Liu H, Bi L, Jiang W, Portnov BA, Liu M. A Relative Radiation Normalization Method of ISS Nighttime Light Images Based on Pseudo Invariant Features. Remote Sensing. 2020; 12(20):3349. https://0-doi-org.brum.beds.ac.uk/10.3390/rs12203349
Chicago/Turabian StyleWei, Shengrong, Weili Jiao, Tengfei Long, Huichan Liu, Lu Bi, Wei Jiang, Boris A. Portnov, and Ming Liu. 2020. "A Relative Radiation Normalization Method of ISS Nighttime Light Images Based on Pseudo Invariant Features" Remote Sensing 12, no. 20: 3349. https://0-doi-org.brum.beds.ac.uk/10.3390/rs12203349