Radar Satellite Image Time Series Analysis for High-Resolution Mapping of Man-Made Forest Change in Chongming Eco-Island


Radar Remote Sensing Group, School of Transportation, Nantong University, Nantong 226019, China
*
Author to whom correspondence should be addressed.
Remote Sens. 2020, 12(20), 3438; https://0-doi-org.brum.beds.ac.uk/10.3390/rs12203438
Submission received: 7 August 2020
/
Revised: 5 October 2020
/
Accepted: 16 October 2020
/
Published: 19 October 2020
(This article belongs to the Special Issue Remote Sensing for Land Cover and Vegetation Mapping)
Abstract
:Forests are important oxygen sources and carbon sinks. They provide a series of ecosystem services that are crucial to eco-island sustainability, such as the protection of soils, conservation of biodiversity, and development of the eco-tourism, etc. Interestingly, Chongming eco-island is located in the borderlands between fresh- and saltwater environments, where the Yangtze River meets the East China Sea. Most forests in Chongming island are therefore man-made and very vulnerable to the ecological environment mixing of freshwater streams and rivers with salty ocean tides, and are affected by climate and human activity. Estimating and monitoring forest change within an estuary is required for the sustainable management of forest resources and forest-based eco-tourism. Most optical satellites are unsuitable for continuous forest mapping due to cloud cover and their relatively low spatial and temporal resolution. Here, using Sentinel-1 satellite carrying an imaging C-band synthetic aperture radar, radar vegetation index was derived to detect the forest dynamics on the island. Furthermore we quantified forest area change in three well known and the most strictly protected and representative areas, namely Dongping National Forest Park, Dongtan National Wetland Park, and Xisha National Wetland Park, in the Chongming eco-island over the past five years at 10-metre resolution. We recorded the early and mid summers when the forest canopies grew to the peak in the study areas. The planted forest in Dongping National Forest Park grew an area of 7.38 hectares from 2015 to 2019, and disappeared from an area of almost 2.59 hectares in 2018. The man-made forest of Xisha National Wetland Park increased at an area of almost 20.19 hectares over the past five years. The forest in Dongtan National Wetland Park increased to an area of almost 2.12 hectares in the period of 2015–2017 and 2018–2019. However, from 2017 to 2018, the area of planted forests in Dongtan National Wetland Park decreased by 1.35 hectares. This study shows man-made forest change can be measured and that evidence can be collected to show how the forest is altered by human activities, and informs forest management decision-making for Chongming eco-island.
1. Introduction
In recent years, forest bathing [1] is becoming more and more popular. Therefore forest-based eco-tourism has been developing to promote the sustainability of the island around the world [2]. Beside the benefits of eco-tourism, forests participate in regulating climate, protecting soil, and conserving biodiversity [3]. Located at the north of Shanghai, Chongming island is the largest alluvial island in China and has a large swath of un-parceled land. As one of the least industrialized and populated areas, Chongiming island is the only place in the Shanghai metropolitan region for the development of one of the biggest eco-islands and perfect tourist destinations in the world [4]. Thus, the Shanghai government and Chongming local government have issued the Chongming eco-island master plan since 2005 [4], to develop forest and wetland parks for eco-tourism.
In 2006, forests covered approximately 17.0 % of the land surface of Chongming island [5,6]. The Chongming local government has continuously planted trees and afforested, and therefore the forest coverage rate reached 27.4% by the end of 2019 [7]. According to the general land-use plan of Chongming district, Chongming’s forest coverage rate will reach 30 % by the end of 2020, and will reach 35% by 2035 [7]. These large-scale man-made forests require a large labor force to participate in the conservation and use of advanced forest management methods [8,9,10,11,12], thereby promoting employment, increasing forest-based eco-tourism income, and achieving the sustainable development of Chongming island [13,14].
Unfortunately, the ecological environment of Chongimng island is vulnerable. Chongming island is located in the borderlands between fresh- and saltwater environments, where the Yangtze River meets the East China Sea. Hence, the ecological environment of Chongming is mixed from freshwater streams and rivers with salty ocean tides, and is also affected by climate and human activity [15,16,17]. These natural and anthropic driven factors pose a huge challenge for managing and ensuring the sustainability of the forest on Chongming island [18,19,20].
To this end, estimating and monitoring forest change within Chongming island is required for the sustainable management of forest resources and forest-based eco-tourism as timely as possible. Optical satellites can be used for estimating forest canopy. In [21], multispectral images collected from the GeoEye satellite were applied to identify, segment, and map canopy palms in the Amazon forest. Unfortunately, optical satellite sensors are affected by cloud cover and moisture. Clouds reduce and even mask the spatial and radiometric correction of satellite images and also decrease the useful area on each image, making it difficult to monitor forest changes. Therefore, Sanchez et al. performed a comparative study to determine the most suitable cloud detection algorithm for the Amazon rainforest on Sentinel-2 images [22]. In [23], some Landsat satellite cloud free images acquired during the dry season for detecting landscape pattern changes in Chongming island.
For collecting cloud-free data, active satellite-based techniques [24] such as space-borne synthetic aperture radar(SAR) [25] and global navigation satellite system (GNSS) [26], have been developed for the retrieval of forest biomass. Thanks to Copernicus Sentinel program coordinated by the European Space Agency (ESA), high quality SAR radar and optical sensors data are free, full, and open access [27]. Recently, Hansen et al. [28] applied a support vector machine (SVM) classifier on Sentinel-1 SAR data to extract six partially forested areas in Alaska, Colombia, Finland, Florida, Indonesia, and the UK. In another study, a Sentinel-1 SAR-based detection method was developed to map water cover in wetlands by using the WEKA k-means clustering algorithm, producing a good connection between the Sentinel-1 C-SAR, Landsat 8, and Sentinel-2 results [29]. Tricht et al. [30] developed a random forest-based crop mapping approach and tested on 12-day Sentinel-1 backscatter mosaics and 10-daily Sentinel-2 smoothed mosaics over Belgium during the growing season in 2017. Agapiou successfully used Sentinel-1 SAR and Sentinel-2 data for estimating the proportion of vegetation cover [31]. Heckel et al. [32] demonstrated the potential of joint radar/optical imagery for predicting forest cover in temperate dense mixed forests in Germany and open savanna woody vegetation and forest plantations in South Africa. Hirschmugl et al. [33] also combined a dense time series of optical (Sentinel-2 and Landsat 8) and Sentinel-1 SAR data for forest disturbance mapping at test sites in Peru and Gabon. In the work by Niculescu et al., a random forest-based method was used to Sentinel-1 SAR data, the Sentinel-2 optical data, Pleiades, and in situ observations for discrimination and mapping of reed against submerged aquatic vegetation, emergent macrophytes, some floating broad-leaved plants communities, and floating vegetation of delta lakes [34]. Mahdianpari et al. [35] developed both pixel-based and object-based random forest (RF) classifications implemented on the Google Earth Engine platform, and used multi-year summer Sentinel-1 SAR and optical Sentinel-2 data composites to study the spatial distribution of five wetland and three non-wetland classes on the island of Newfoundland. Based on combined Landsat 8 OLI, ALOS-1 PALSAR, Sentinel-1, and LiDAR-derived topographic metrics, LaRocque et al. [36] specifically mapped wetland for southern New Brunswick, Canada, pointing towards future potential for the synergistic use of radar and optical satellite imagery. Musthafa et al. [37] used L-band ALOS/PALSAR and ALOS-2/PALSAR-2 fully polarimetric data to explore the dynamics of homogeneous and heterogeneous forest compartments having single and multiple species composition, respectively. In the study by Akhtar et al. [38], Pleiades high-resolution passive optical and ALOS PALSAR satellite imagery were applied for aboveground biomass estimation in the subtropical mountainous Chir Pine (Pinus roxburghii) forest in Murree Forest Division, Punjab, Pakistan.
The goal of this study is to develop an approach to quantify detailed snapshots of current man-made forest change in the Chongming eco-island using Sentinel-1 SAR data for continuous mapping and monitoring. This will provide insight into forest change dynamics and concurrently capture the impacts of human activity on Chongming forest resource distribution. However, the consistent mapping on a relatively small local scale on Chongming island with short-duration growth events of forest canopies over multiple years is not a trivial challenge. To address these challenges, techniques for dual-polarization data information extraction are explored on cloud computing platforms. The proposed techniques will have a better understanding of forest change and view it through different representations.
2. Materials and Methods
2.1. Study Sites
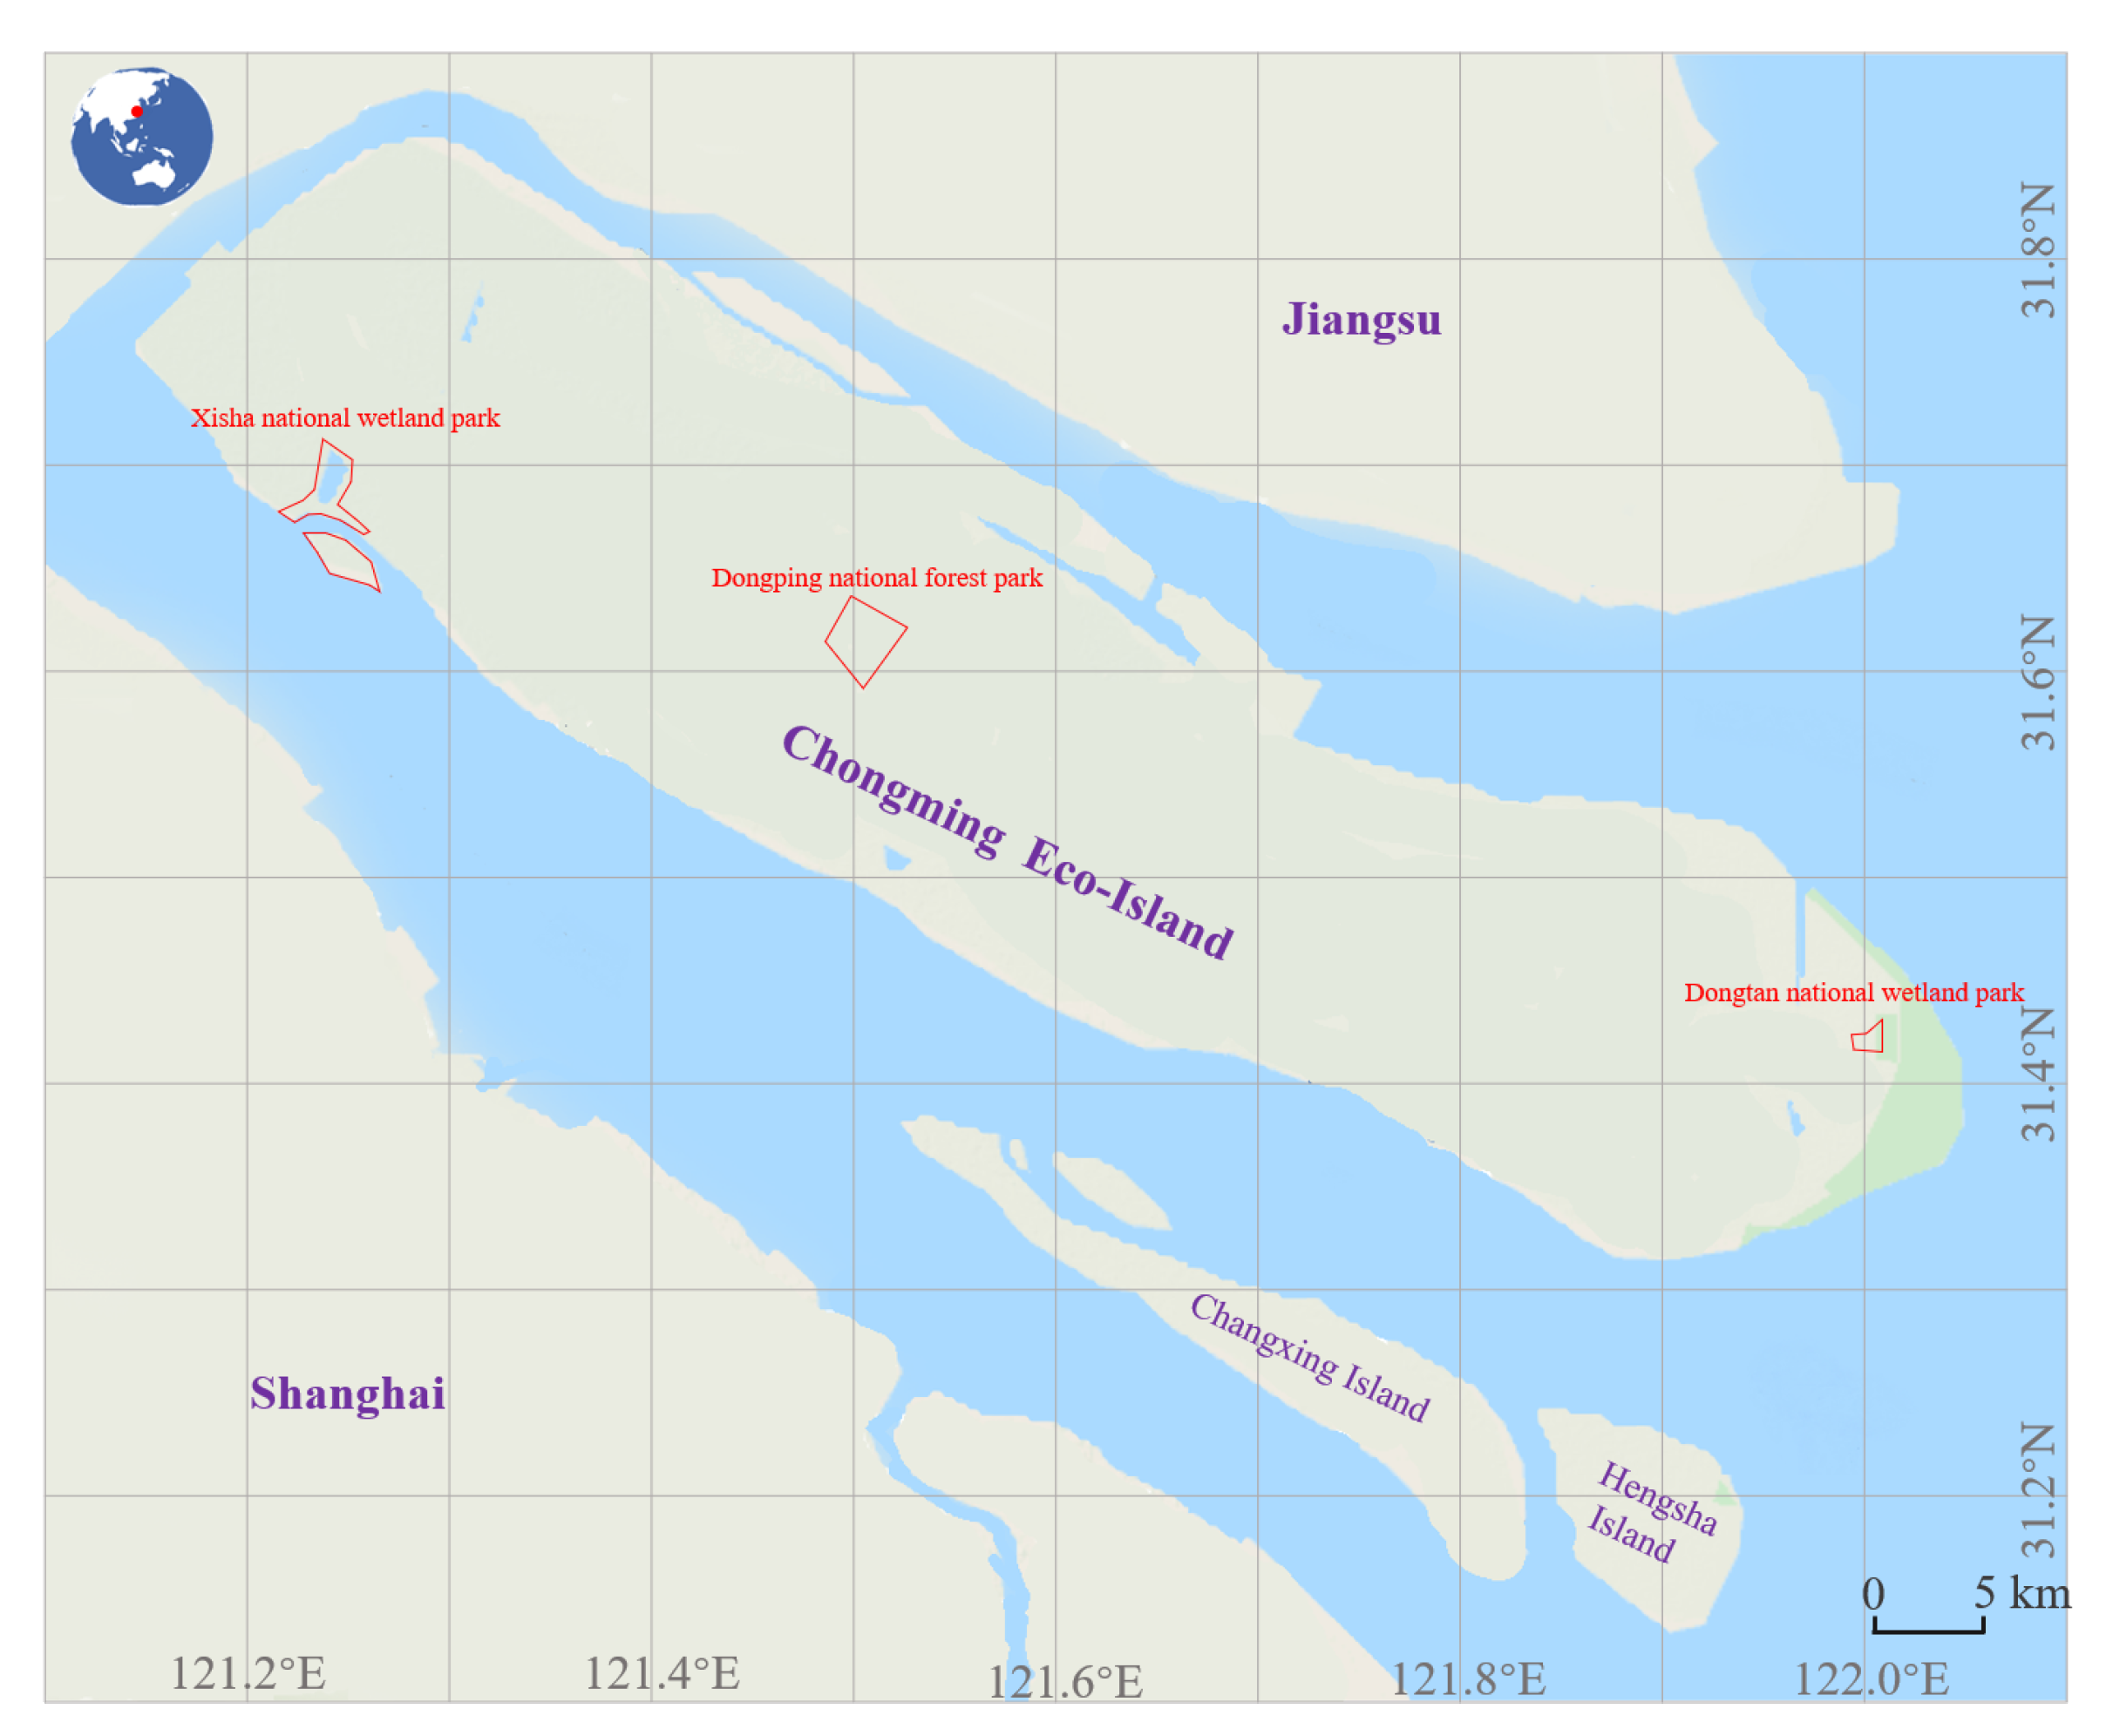
As shown in Figure 1, Chongming island is one of the largest estuarine islands around the world, located at the mouth of the Yangtze River and the maritime boundary of the China East Sea. Chongming island is formed by the dynamic processes of sediment deposition and erosion. Due to the vulnerable ecosystem of estuarine island, most forests in Chongming island are man-made. Table 1 reports the number of trees planted and the area afforested in the period of 2015–2018.
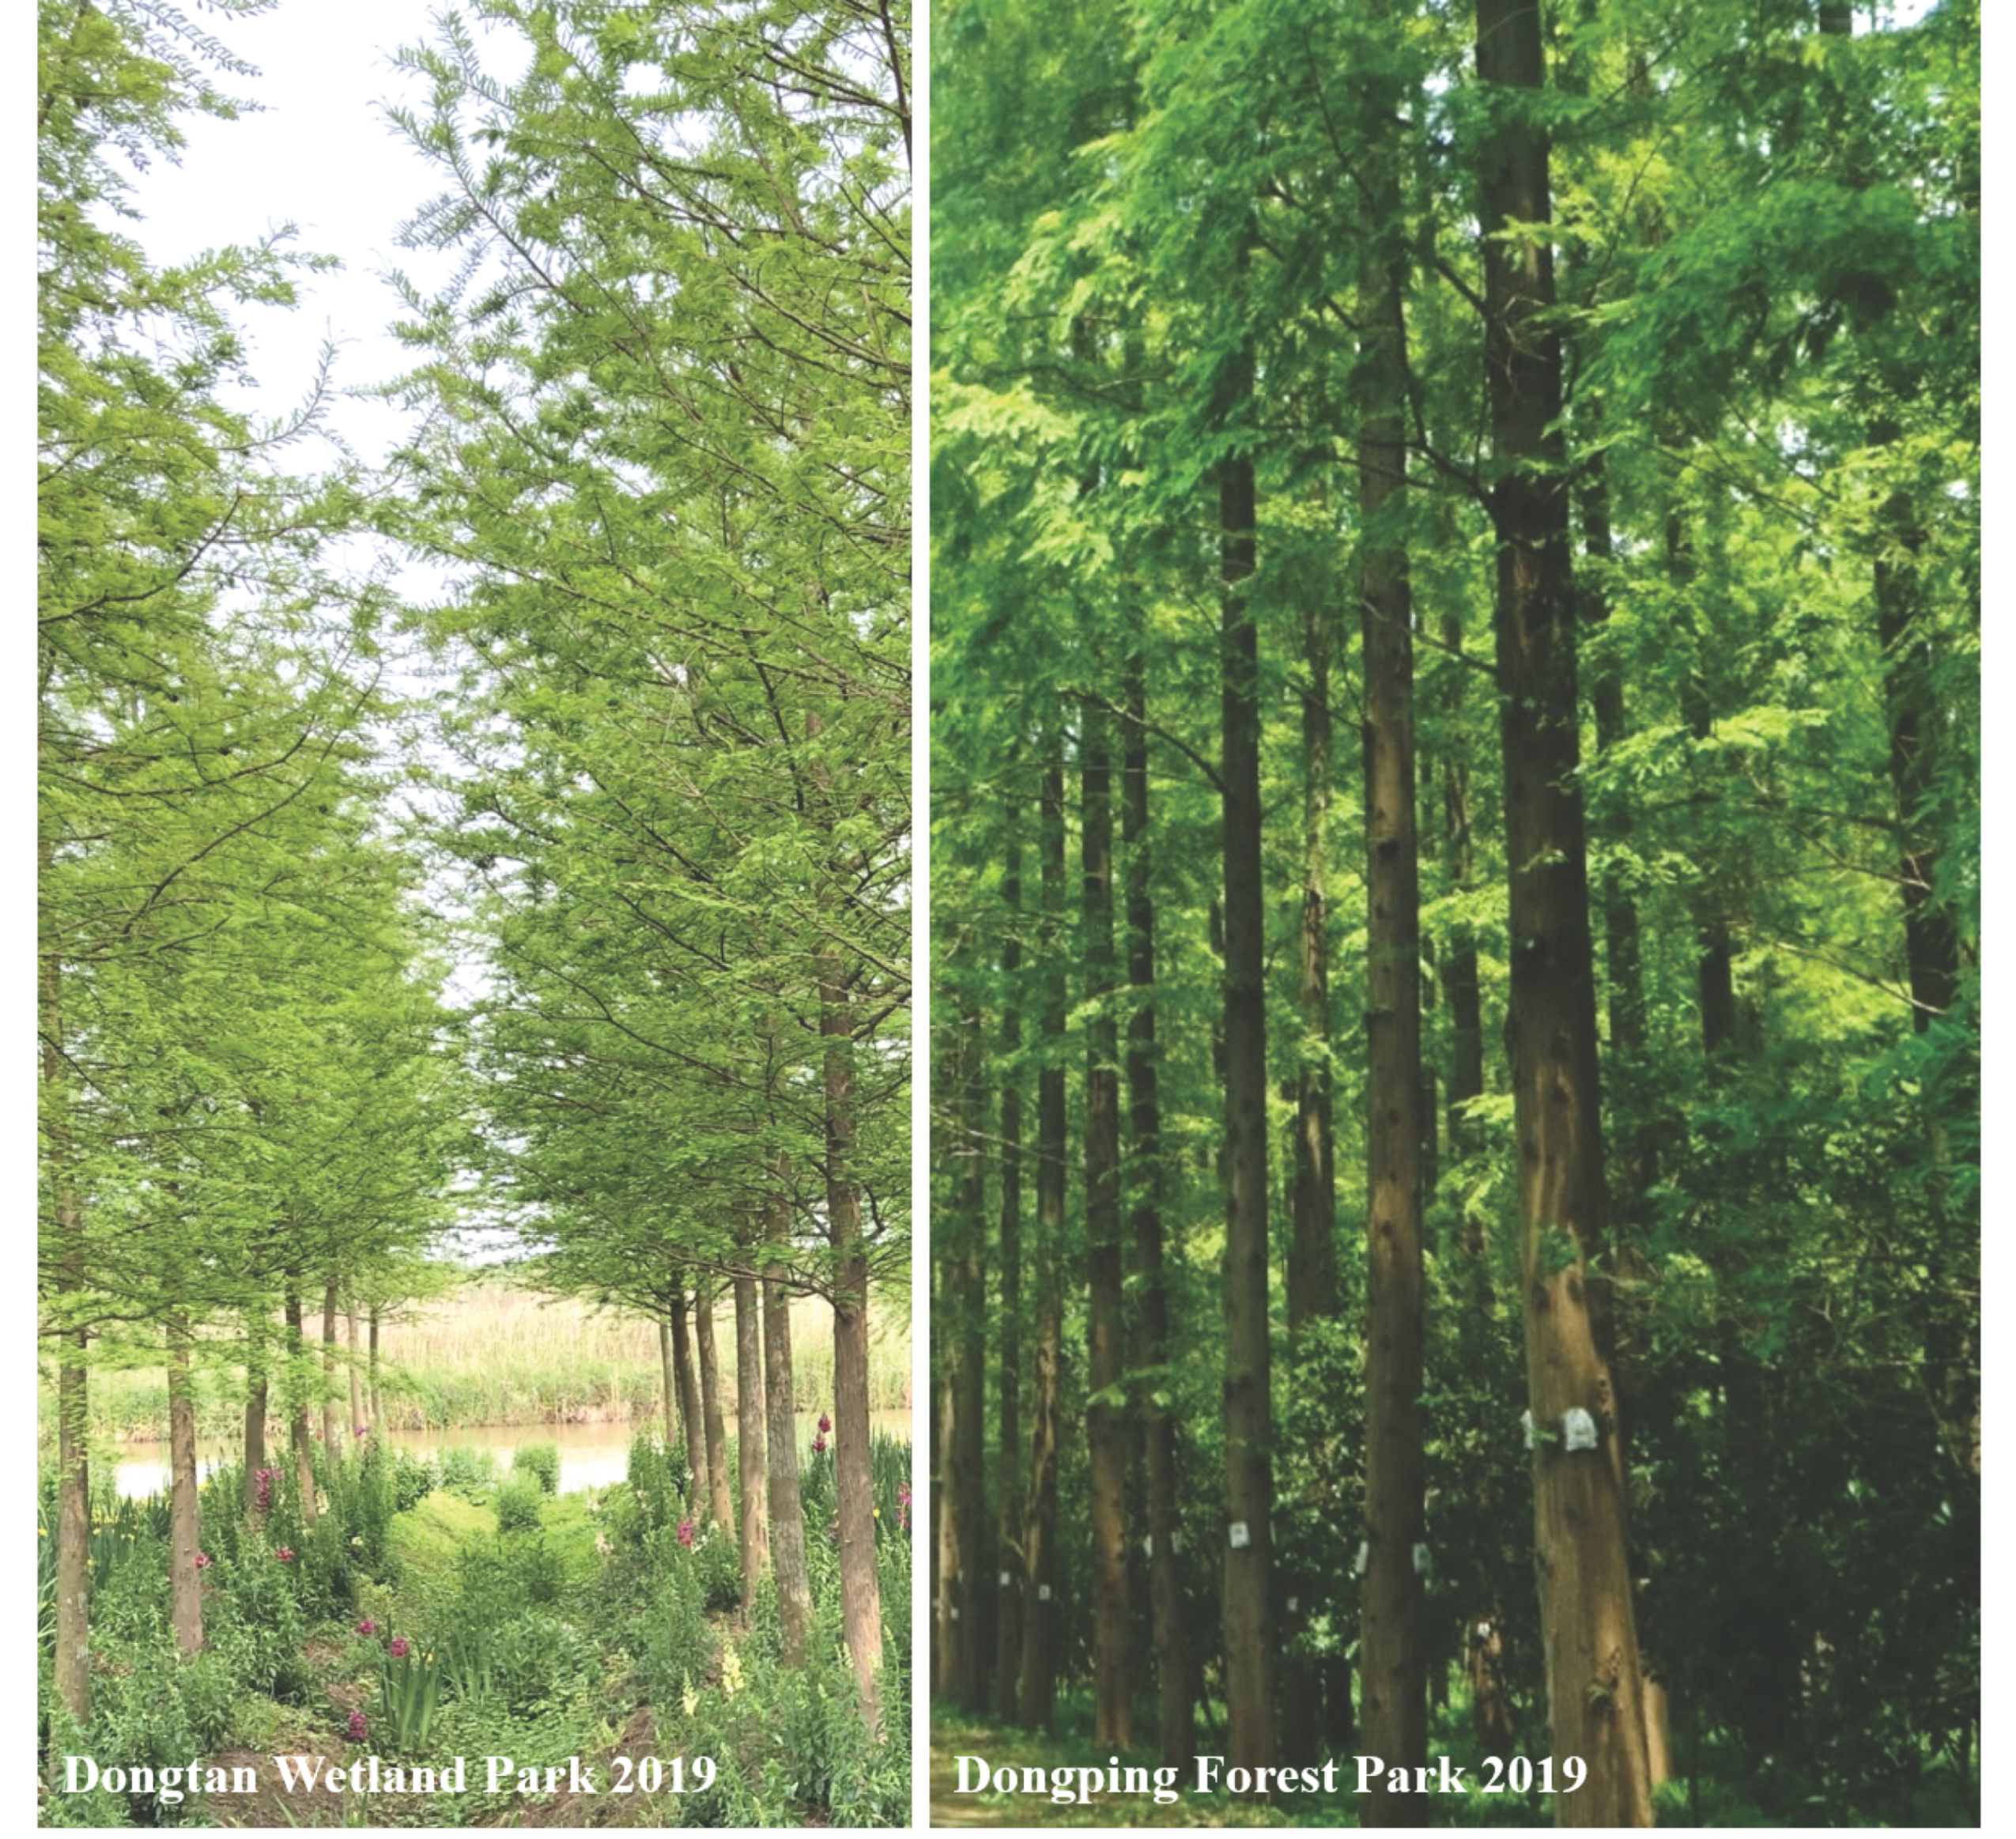
Through continuous reforestation, the forest coverage of Chongming island has reached 26% since 2018 [39]. Due to fast-growing features, adaptation for a diversity of environments, and its beautiful canon-like crown, metasequoias are the first choice for landscape-based plantations and street trees in Chongimng island (see Figure 2).
Here, the radar vegetation index (RVI) is retrieved to coarsely detect the forest dynamics on the island, using dual-polarization SAR data of Sentinel-1. Furthermore, we will finely quantify the forest change for the three most strictly protected forest-based eco-tourism areas, namely Dongtan National Wetland Park, Xisha National Wetland Park, and Dongping National Forest Park, in the Chongming eco-island over the past 5 years at a 10-metre resolution. These three parks are the most representative region of forest cover in the island. The Dongtan National Wetland Park site is located at the extreme eastern tip of the island. The area of this park is nearly 150 hectares. It is estimated that 112 species of migrating birds from Asia pacific regions have made a stop at this park. This park has planted 186 types of wetland trees and plants [39,40,41,42]. The site in Xisha National Wetland Park, located on the south-west of Chongming island, has planted trees with an area of 300 hectares [7]. The Dongping National Forest Park established from Dongping forest farm in 1959, covers an area of 355 hectares. It is the biggest forest park in the island and is the largest man-made forest in Eastern China [7].
2.2. Dataset
Table 2 summarizes the details of the dataset used in this study. Sentinel-1 SAR data was used to derive RVI and estimate forest change in the study area. We cross-compared the RVI with the normalized difference vegetation index (NDVI) and enhanced vegetation index (EVI) calculated by using Sentinel-2 and Landsat 8 data. The Sentinel-2 data was used to compute the NDVI. And the Landsat 8 NDVI products (Landsat 8 Tier 1 8-Day EVI composite) and the EVI products (Landsat 8 Tier 1 8-Day NDVI composite) were applied for correlation analysis with the RVI. The radiometric resolution of the Sentinel data is 10 m and 30 m for both the EVI and NDVI products of Landsat 8.
2.3. Forest Change Detection Using Sentinel-1 SAR Data
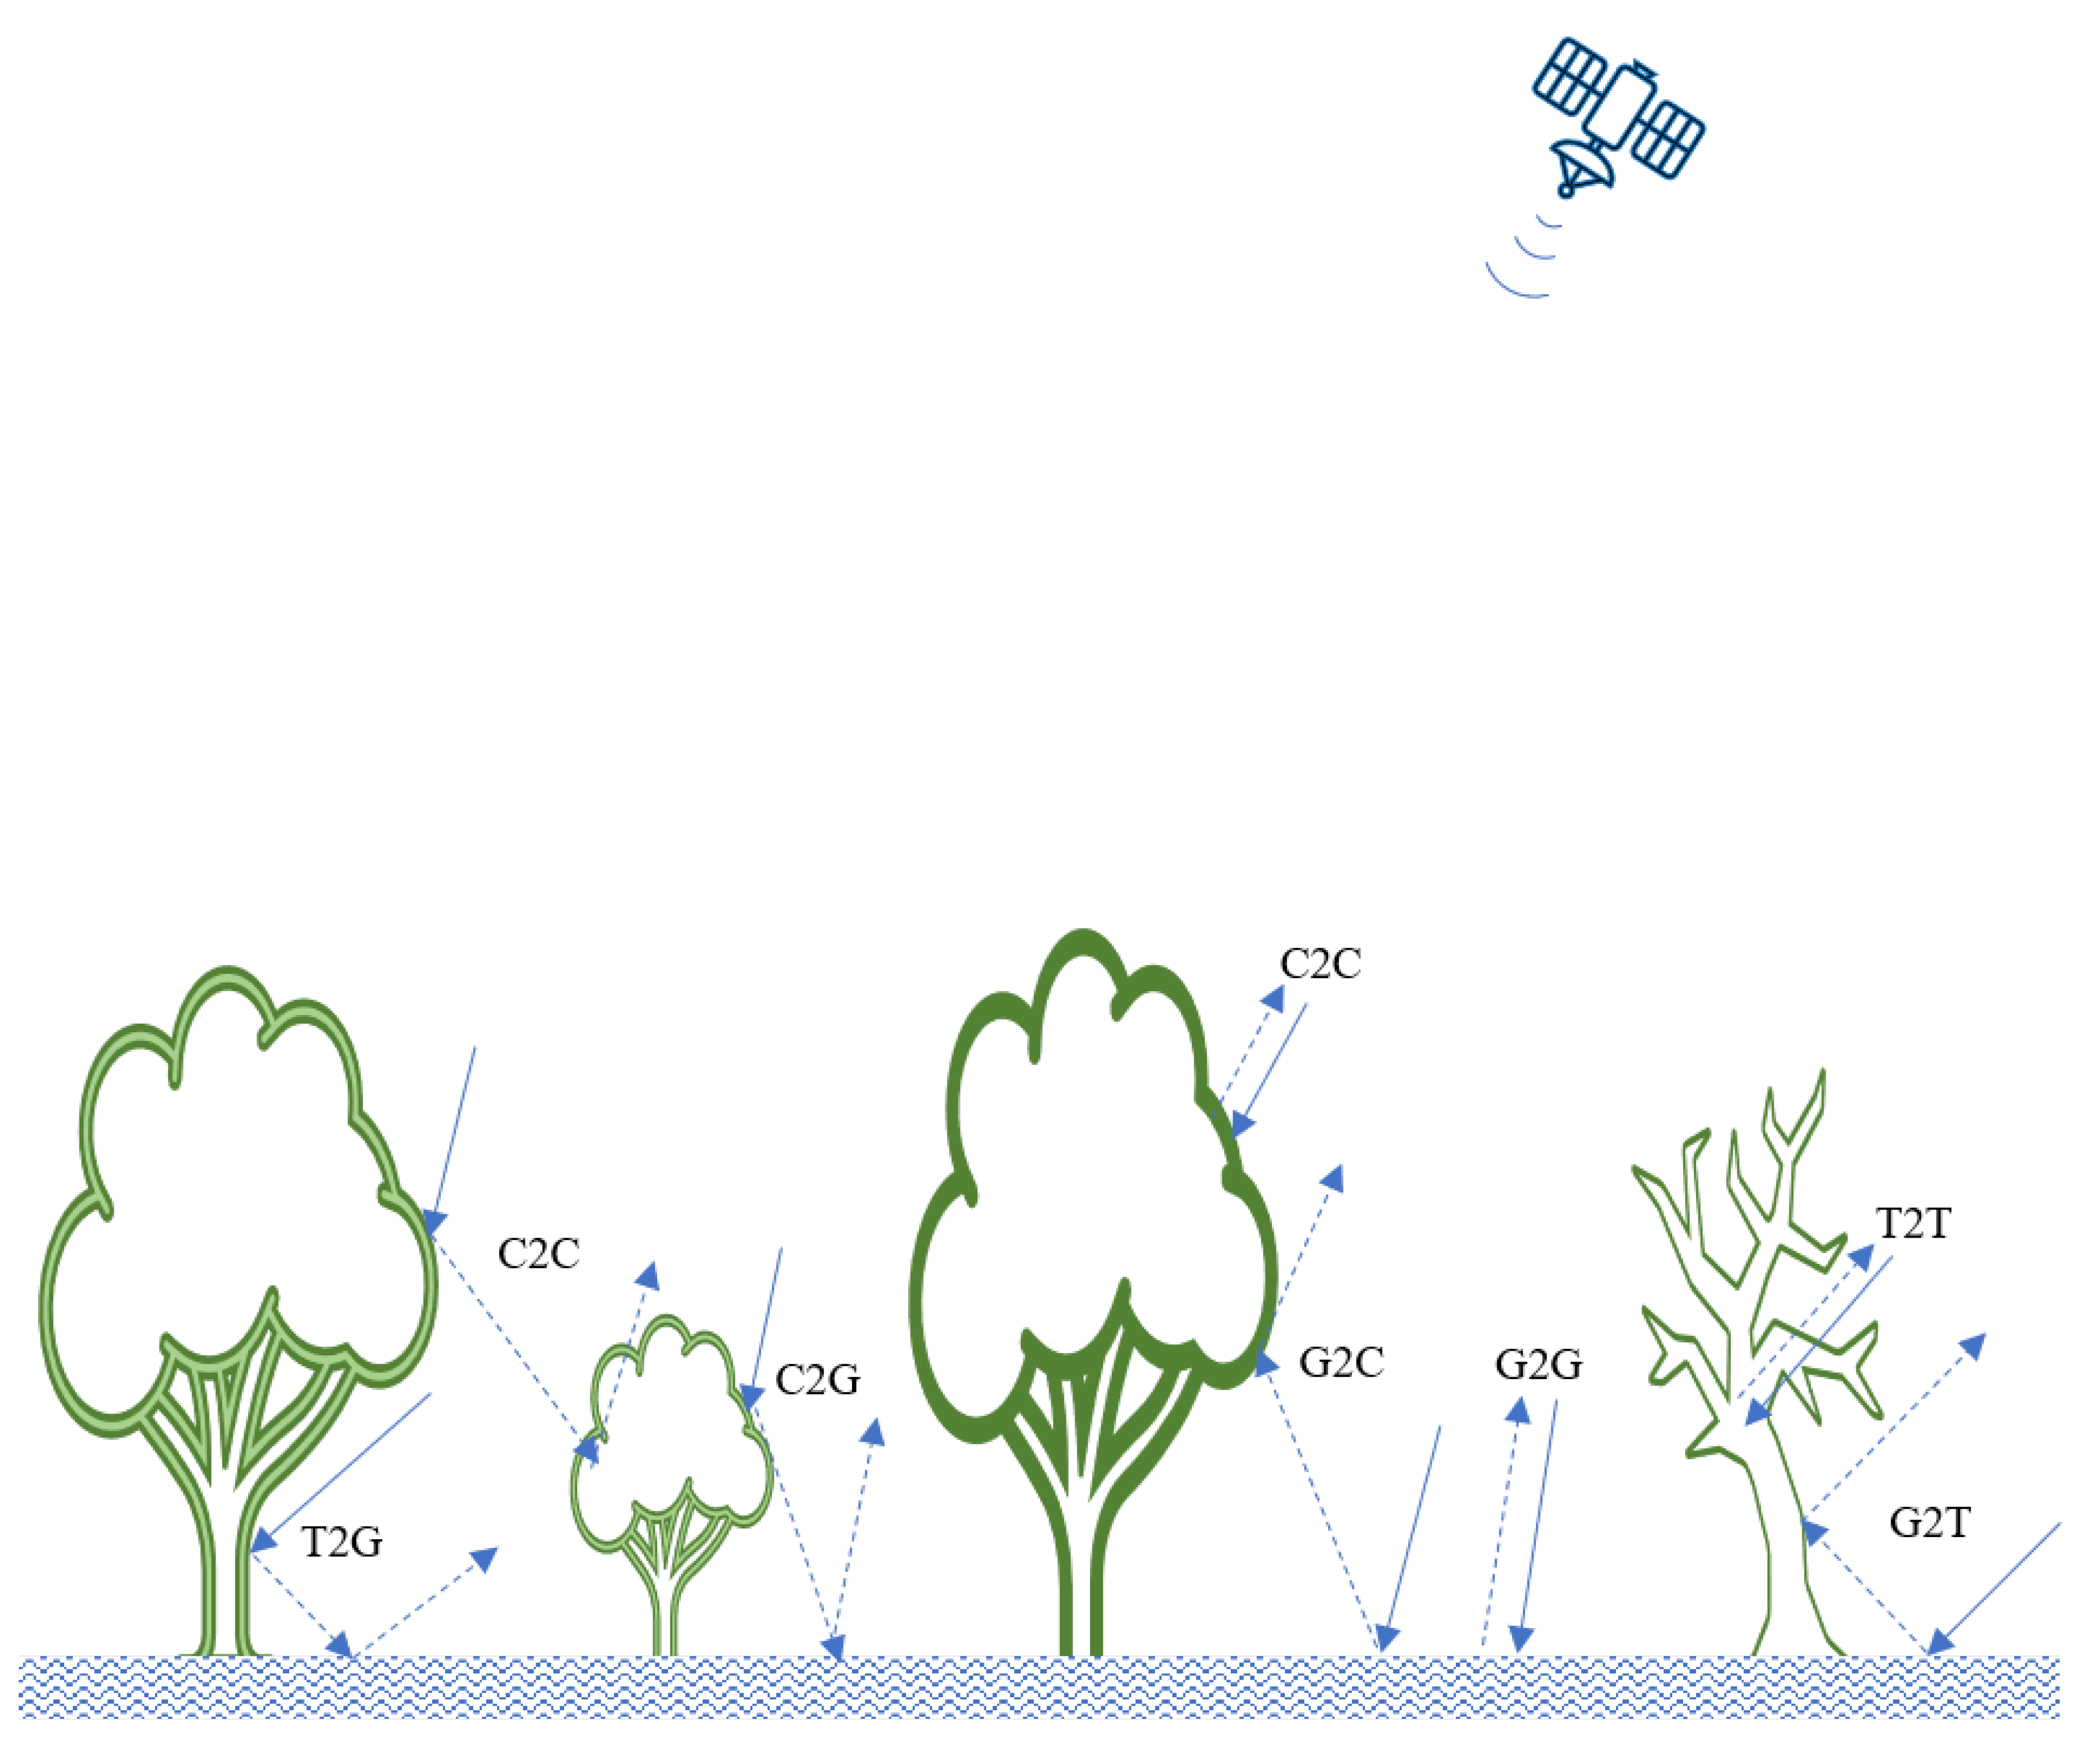
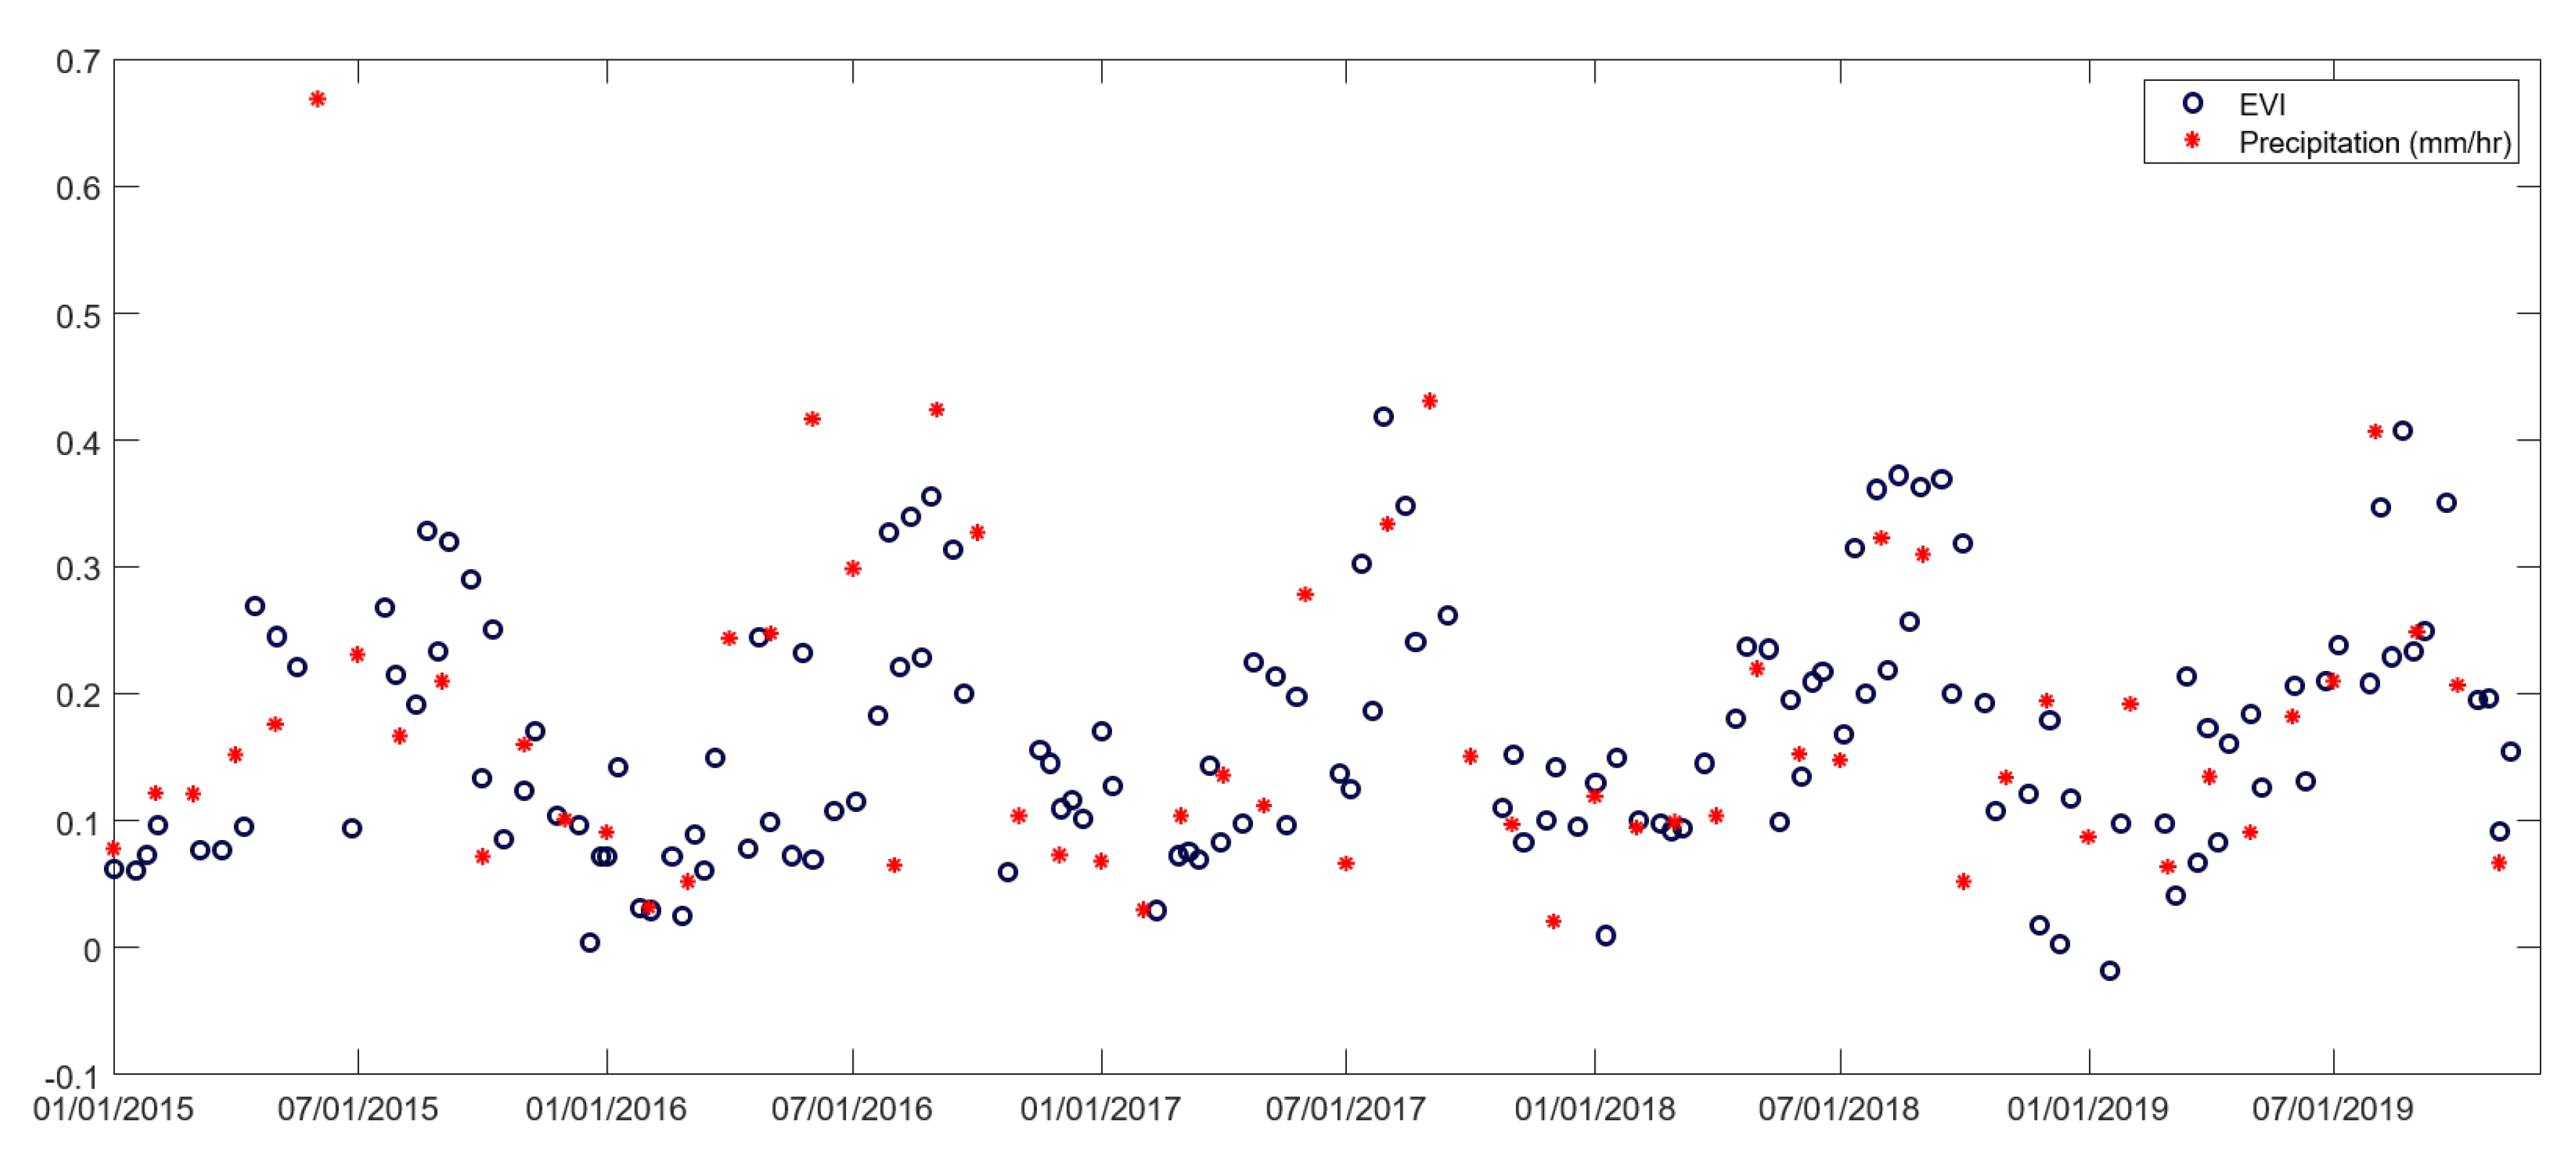
Figure 3 shows the principal sources of radar backscattering in forests. In Chongming island, the majority of trees are deciduous. These trees have periods of leaf fall in the dry season, drop their needles and leaves at each early to mid winter stage. In the winter and early spring, direct scattering form ground and tree trucks, with ground to trunk and trunk to ground being dominant backscattering sources in forests. Figure 4 plots the rainfall rate and vegetation index for Chongming island during the period of 2015–2019. On average, foliage of deciduous trees regrow at each mid spring, and the peak is usually mid- to late summer, as the days get longer and precipitation begins to increase (see Figure 4). During the growing season, canopy volume scattering, canopy to ground and ground to canopy scattering become strong. The canopy volume scattering reaches its strongest level at the peak growth of foliage. At this stage, the forests of Chongming island grow luxuriantly and produce the most oxygen for forest bathing to support eco-tourism in this eco-island.
In this study, we chose the radar observation time when the leaves are densely growing and the leaves are close to saturation, that is, June 21 to August 20 each year. First, Sentinel-1 time series SAR data were used to calculate the RVI [44] for monitoring the level of forest growth. RVI is a function of the radar incidence angle since the radar penetration length through the forest canopy will increase as the incidence angle increases. However most of the existing analysis focuses on a single incidence angle. The RVI is given by:
where is the cross-polarized backscattering cross section power and and are the co-polarized backscattering cross sections power.
Unfortunately, HH co-polarization and HV cross-polarization data in Chongming island are not available. Sentinel-1 SAR did not use horizontal polarization to collect data over the Chongming island in the past five years. It is known that both HV and VH cross-polarization band are the best polarization for forest identification and forest biophysical estimation. The main sources of backscatter are HV and VH band in the forest. Due to the volume scattering of forest, these two bands are close in value. It means that we can use VH cross-polarization data instead of HV data in the calculation of Equation (1). The backscatter of HH band is larger or less than that of VV co-polarized depending on the different scattering responses. Therefore, the Equation (1) can be modified as:
After providing a preliminary description of vegetation change by RVI, we derive one technique of image rationing to finely calculate forest change at the regions of interest, using the linear regression model. As mentioned above, VH cross-polarization data is the best polarization for estimating forest biophysical. Therefore, VH band data are selected for forest change detection. Denote the time series VH cross-polarization data as , where is i-th observed time, and are the coordinates of the observed data, the simple ratio image is:
This rationing method is simple, but the ratio image does not consistently show the forest change, due to a variety of factors such as precipitation conditions, incident angle, and radar calibration. To reduce the effects from differences in precipitation conditions or a different incident angle, the linear regression model is used to identify the relationship between and . Assuming that is a linear function of . We thus have an estimate of using least squares method as:
The parameters a and b in the Equation (4) can be estimated by minimizing the sum of squared error between and . This can be formulated as:
After partial derivatives of the sum of squared error in Equation (5) with respect to the parameters, the slope a and y-intercept b can be obtained. The ratio image can be defined as:
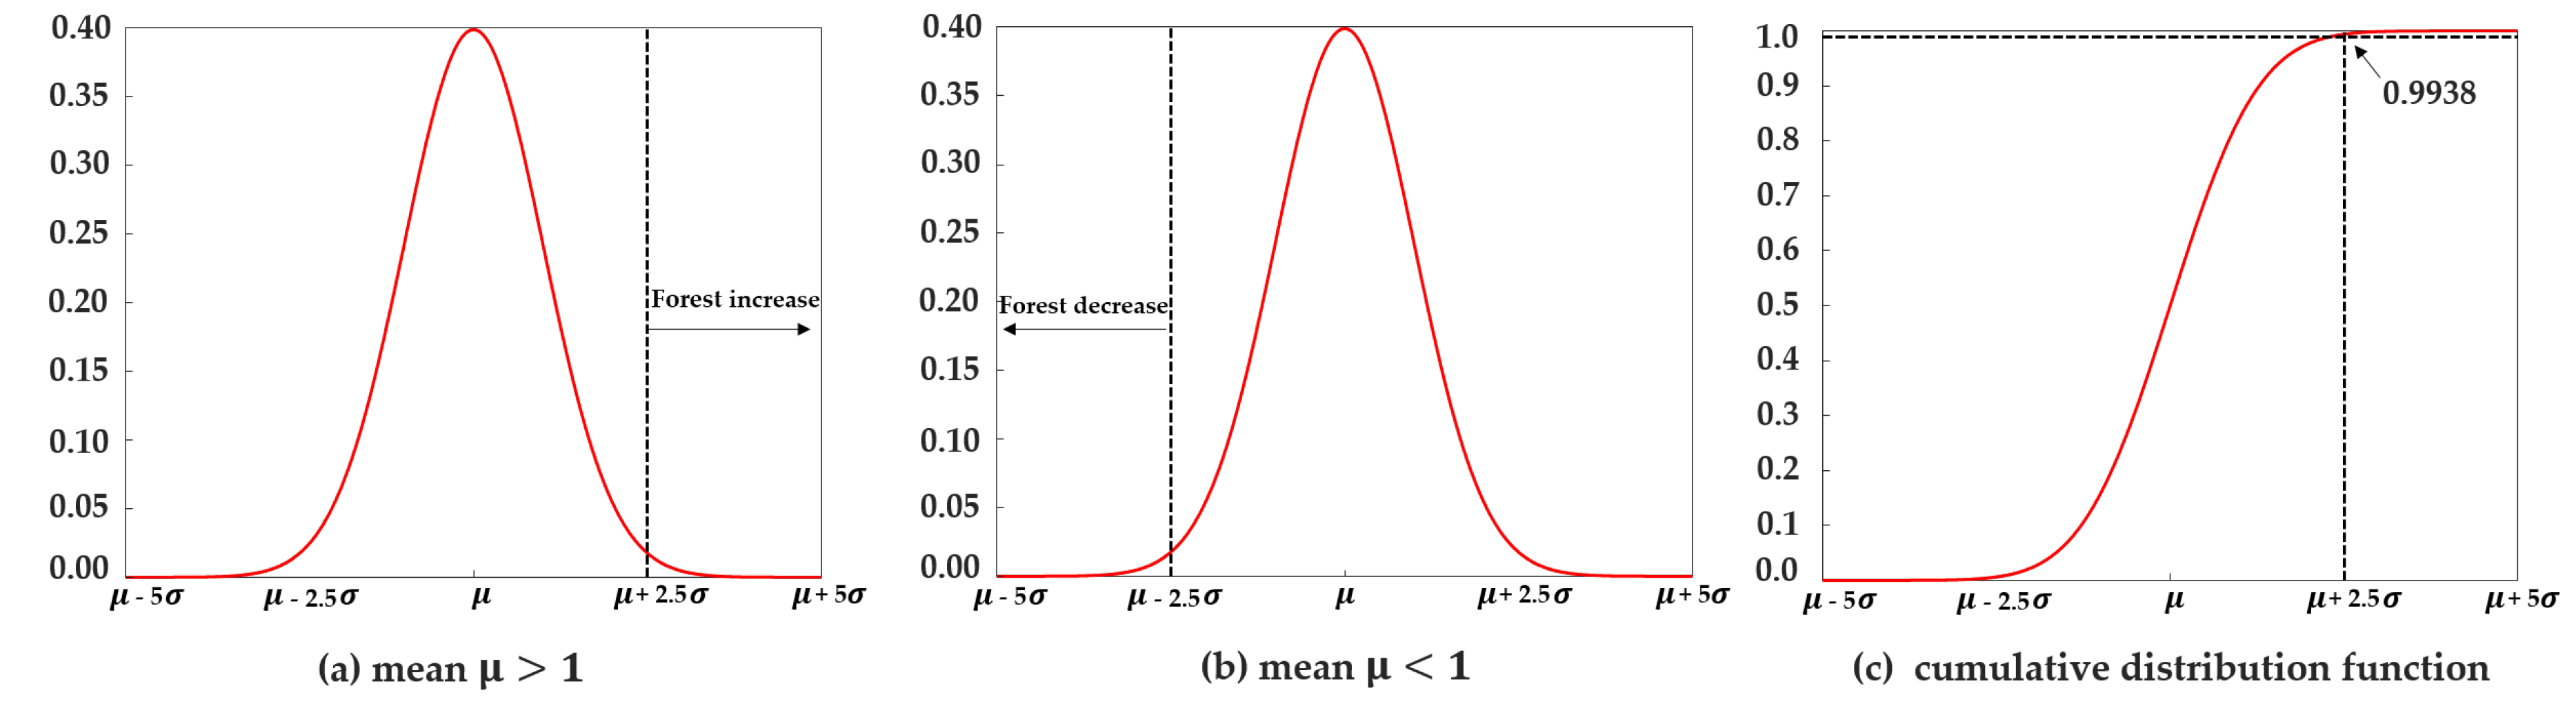
The areas of forest change are detected by applying the threshold technique to the ratio image. As optimal threshold techniques are very time-consuming, we define one type of absolute threshold for this study. As shown in Figure 5, the threshold is defined as:
where the parameters mean and standard deviation , which are calculated from the distribution of the ratio image. This threshold produces a very high confidence level of 99.38% (see Figure 5c). A subtraction is performed for the rationing operation when the time series images are in logarithmic scale, producing negative or positive mean . A positive mean value in logarithmic scale indicates an increase in forest area, and vice versa.
2.4. Data Processing Using GEE
Google Earth Engine (GEE) was used to produce the forest change mapping in Chongming island. GEE is an advanced platform for scientific analysis and visualization of geospatial information [47]. In the first step of this proposal (see Figure 6), GEE had already removed low intensity noise and invalid data on scene edges and additive thermal noise, computed backscatter intensity using sensor calibration parameters, and converted data from ground range geometry [48].
The second step was to average the SAR data collections collected from June 21 to August 20 for each year. During these acquisition times, the canopies are densely growing and the leaves are close to saturation [49]. However, these acquisition times are in the wet season. It often rains and will affect the SAR scattering (see Figure 4). Through the averaging operation, the influence of precipitation on SAR scattering will be greatly reduced.
SAR images are affected by the speckle noise [50,51] which is mainly due to the relative phase of individual scatters within a resolution cell [52]. Therefore, the next step is to filter the temporal speckle noise from the time series data, using the refined Lee filter [53].
Next, the RVI was calculated to indicate the forest growth level of Chongming island. The final step is to calculate the area of forest change using Equations (3)–(6) for the three strictly protected forest areas.
Reproducible codes are available online at https://code.earthengine.google.com/?accept_repo=users/MarsXu/CodeofRS. It is worth mentioning that you need to firstly register GEE to use them, if you have not done so before. We wrote the process code modules of the data processing in the dataProcessing folder. The major processing modules are refined Lee filter, histogram statistics and printout, forest change detection, linear regression fitting of SAR data, linear correlation analysis between radar vegetation index, and Landsat 8 and Sentinel 2 vegetation index, etc. The details of four program code files in the main directory and their corresponding results are shown in Table 3.
2.5. Cross-Comparison between Radar Vegetation Index and Optical Vegetation Index
Cross-comparisons were conducted by using Sentinel-2 (NDVI) and Landsat 8 (NDVI and EVI) data in GEE. The NDVI of Sentinel-2 has a resolution of 10 m, while Landsat data has a spatial resolution of 30 m. The reference data were selected from the image collections by filtering the same acquisition times as SAR. In order to better study the correlation between RVI and Landsat 8 vegetation index, we randomly collected 1000 samples from three forest areas for analysis. Linear regression was performed to compare the RVI with NDVI and EVI over the regions of interest.
The NDVI is a simple graphical indicator used to evaluate whether the observable target contains living green vegetation [54]. The NDVI is computed using the following equation:
where NIR and Red are the spectral reflectance observations acquired in the near-infrared and red bands, respectively.
The EVI is an improved vegetation index used to enhance the vegetation signal with enhanced sensitivity in high biomass regions and improved vegetation monitoring through a de-coupling of the canopy background signal and a reduction in atmosphere influences [55]. In Landsat 8, EVI is calculated in the following equation:
where Blue is the spectral reflectance observations acquired in the blue region.
3. Results
3.1. Yearly Radar Vegetation Index Distribution
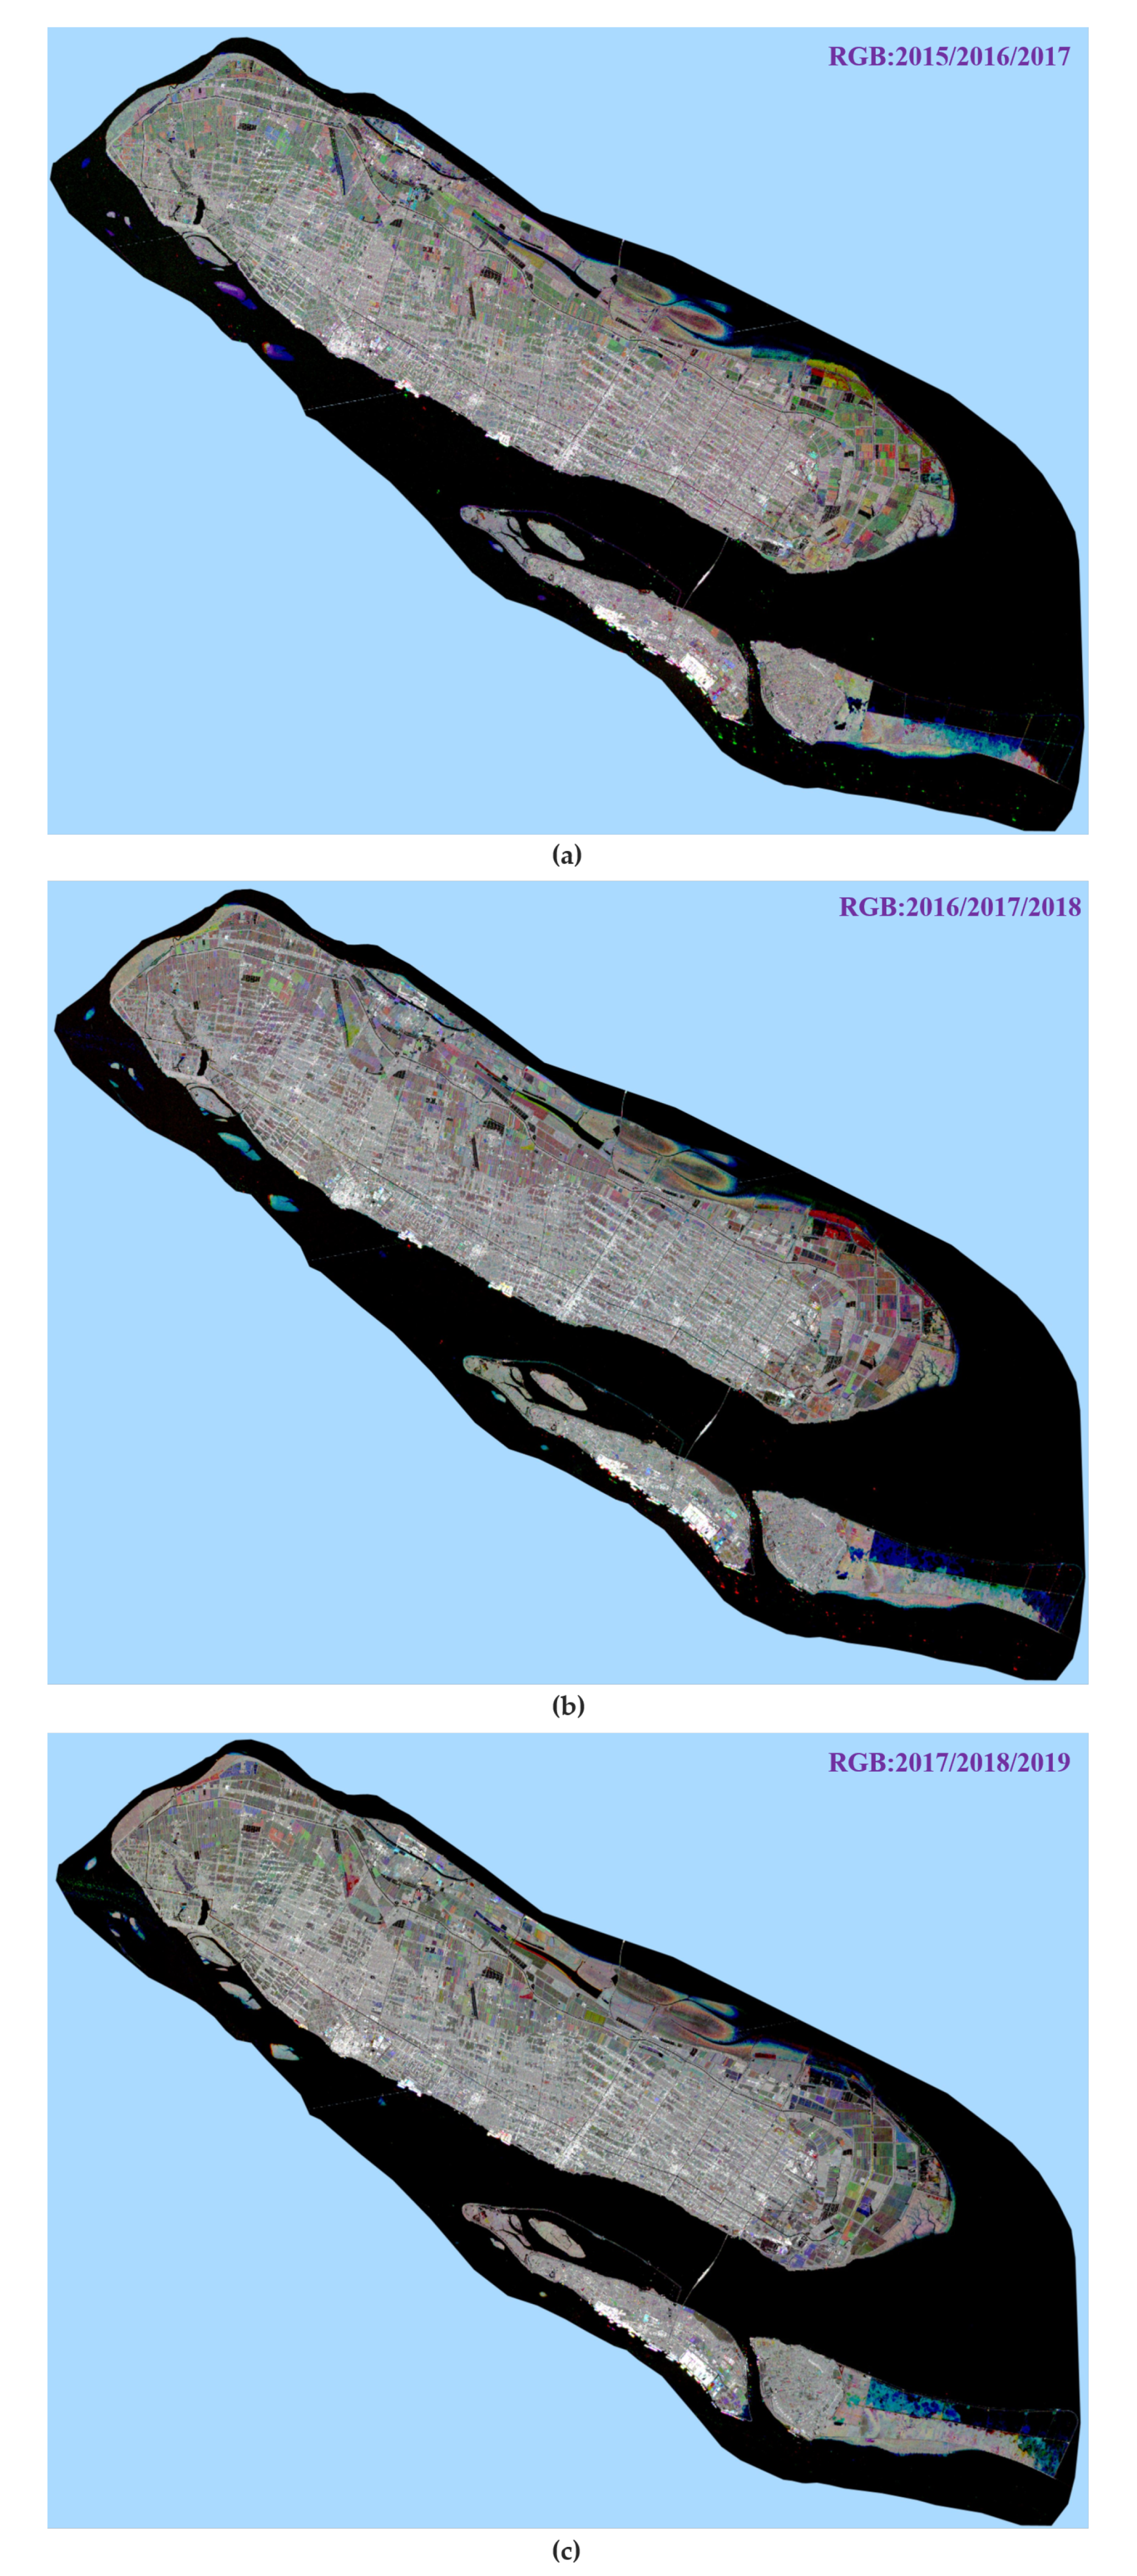
First, radar surface reflectance change is illustrated in Figure 7 in RGB composites over Chongming island. The colored areas in the picture represent changes in the ground surface in different years. It can be seen from the figure that part of the farmland changes greatly in summer each year. This is because during this time, wheat was harvested and rice was planted in the agro-ecological zone. In addition, some changes along the Yangtze River on Chongming island are also obvious. These changes along the river are caused by the annual river rush and water level changes.
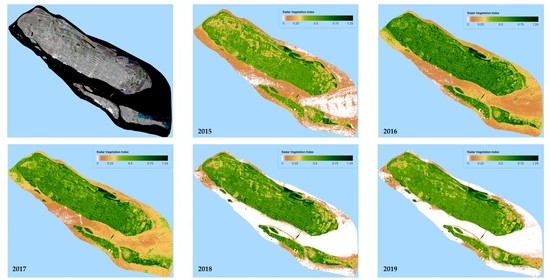
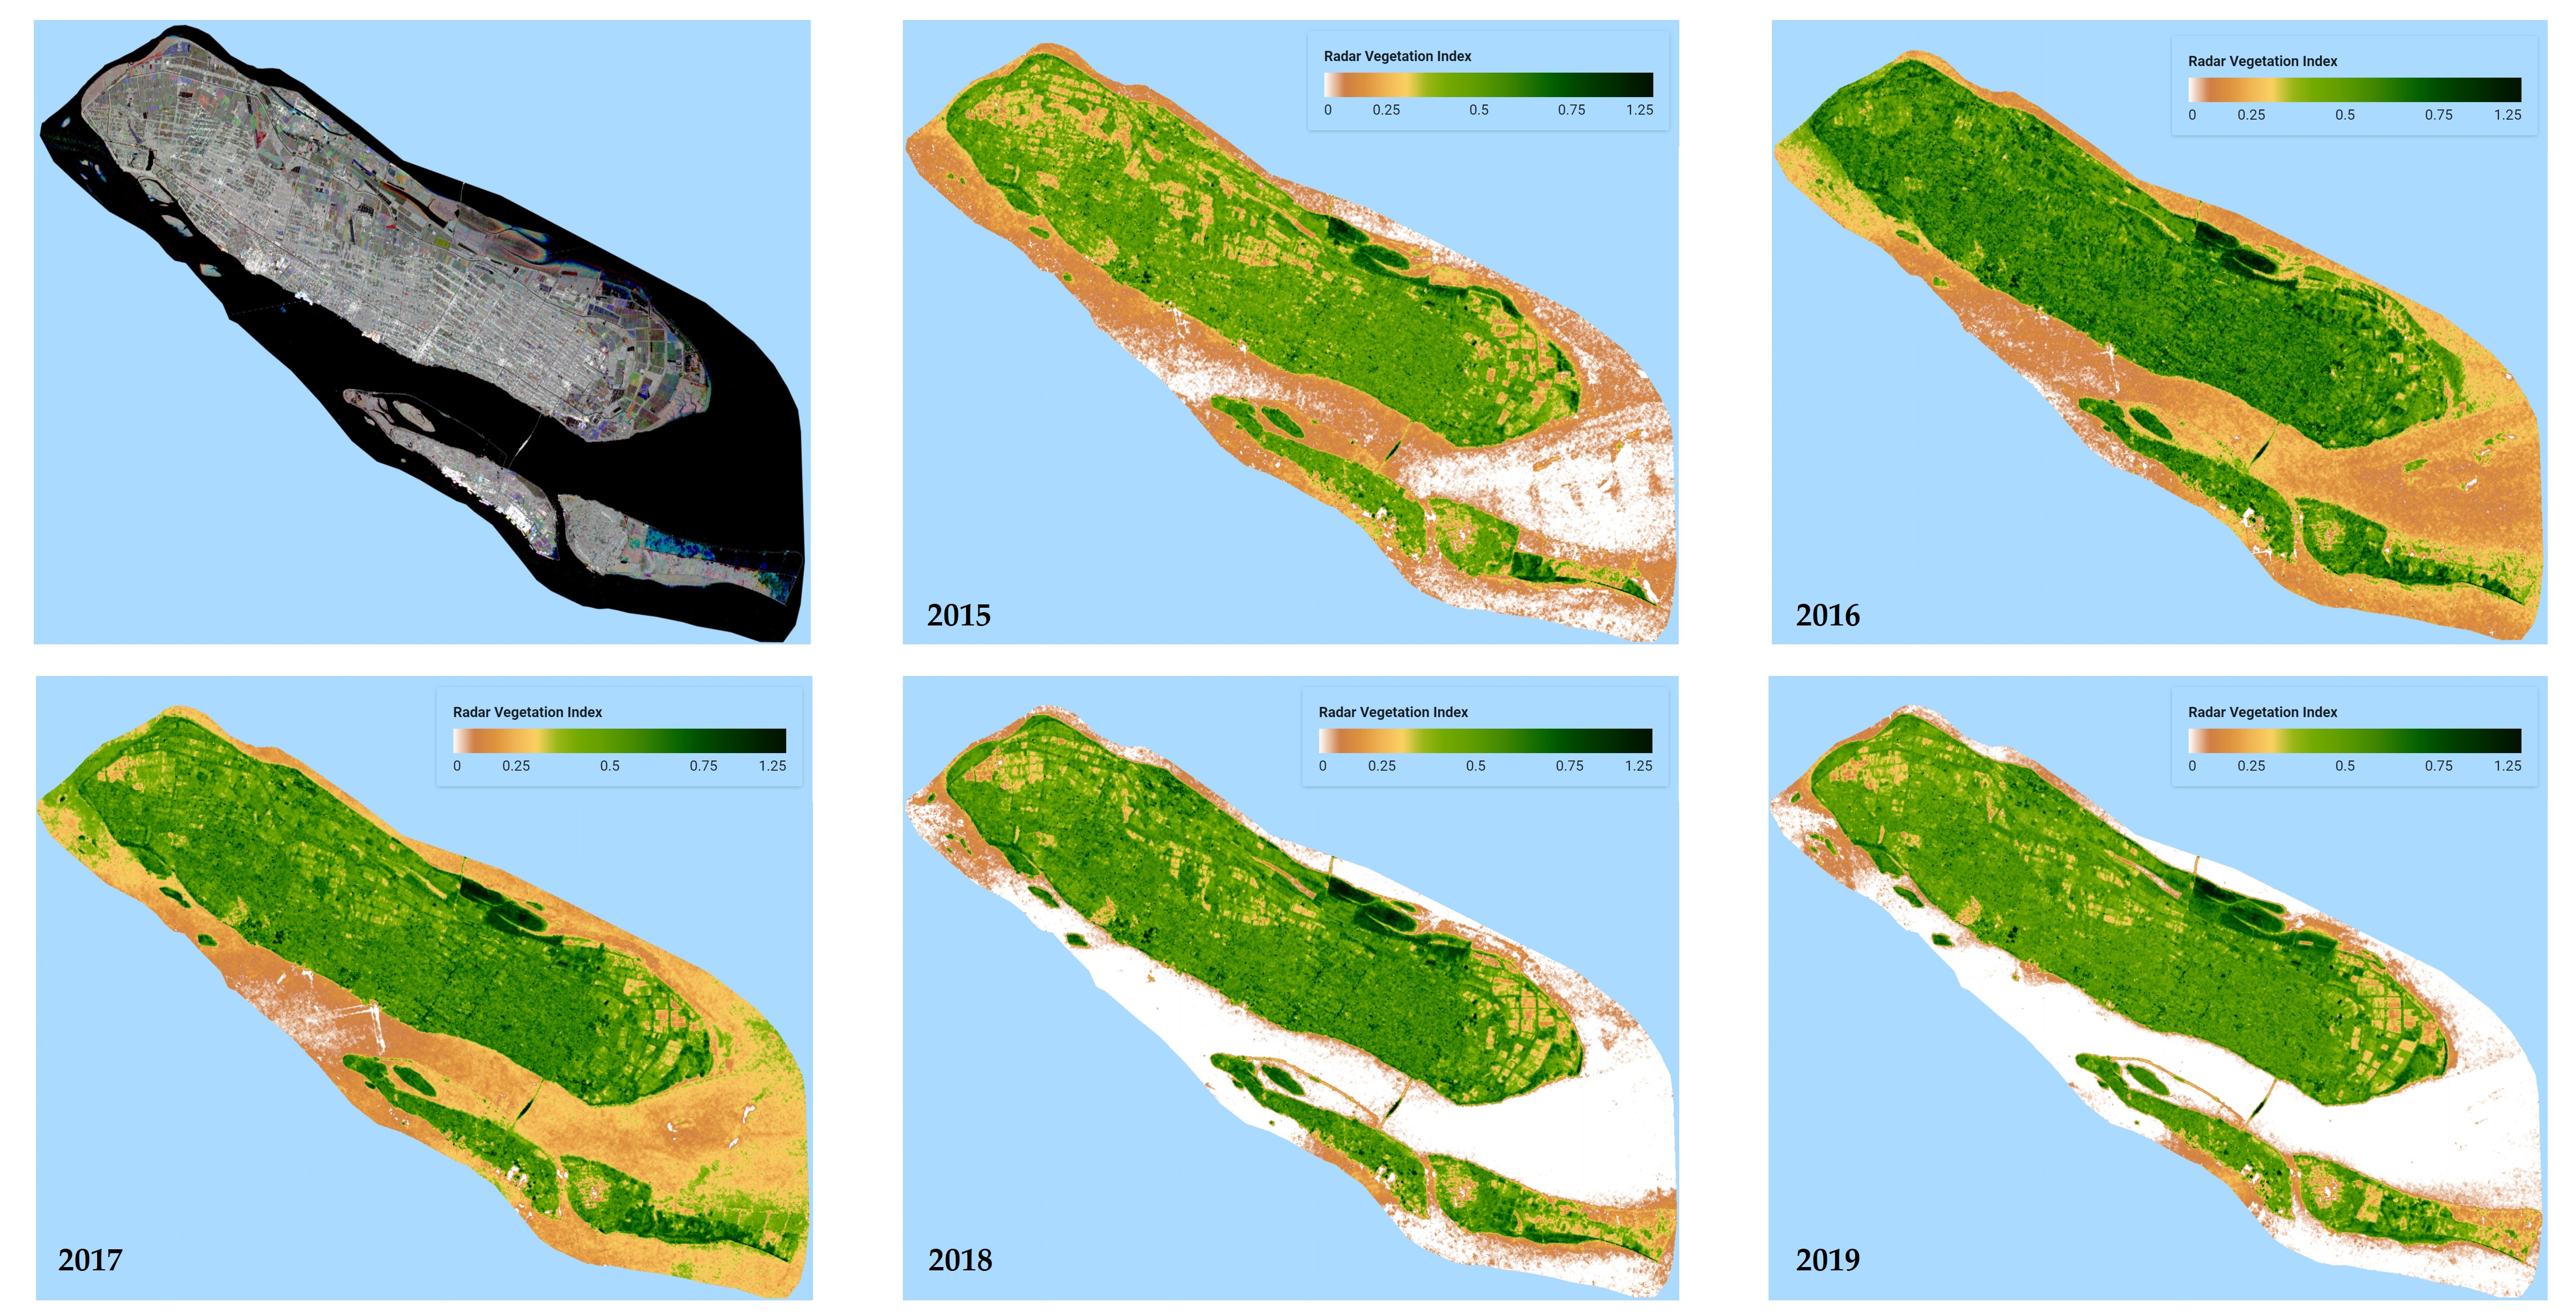
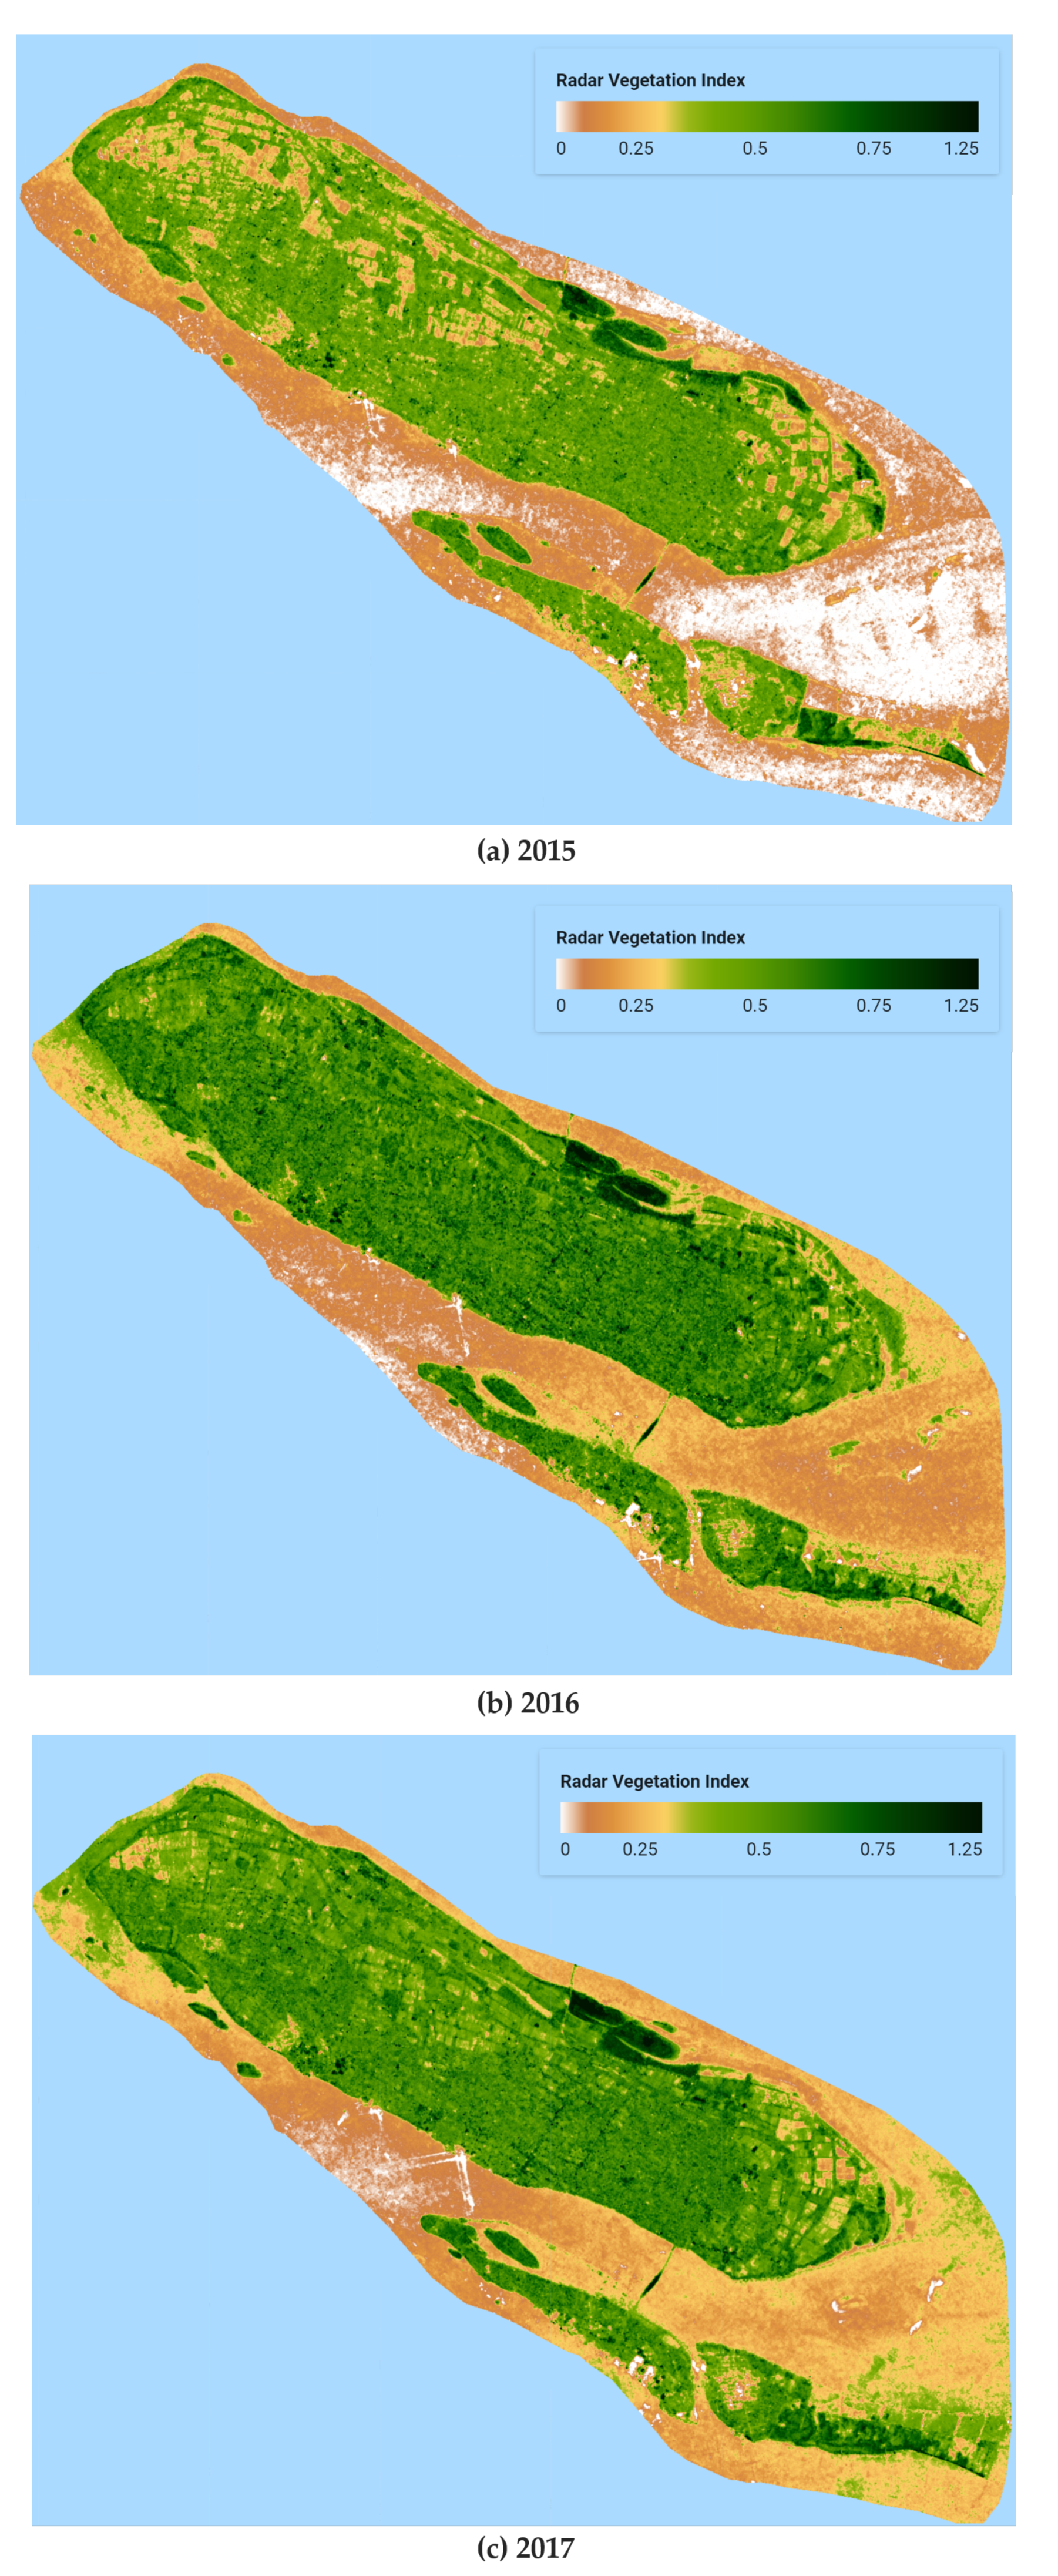
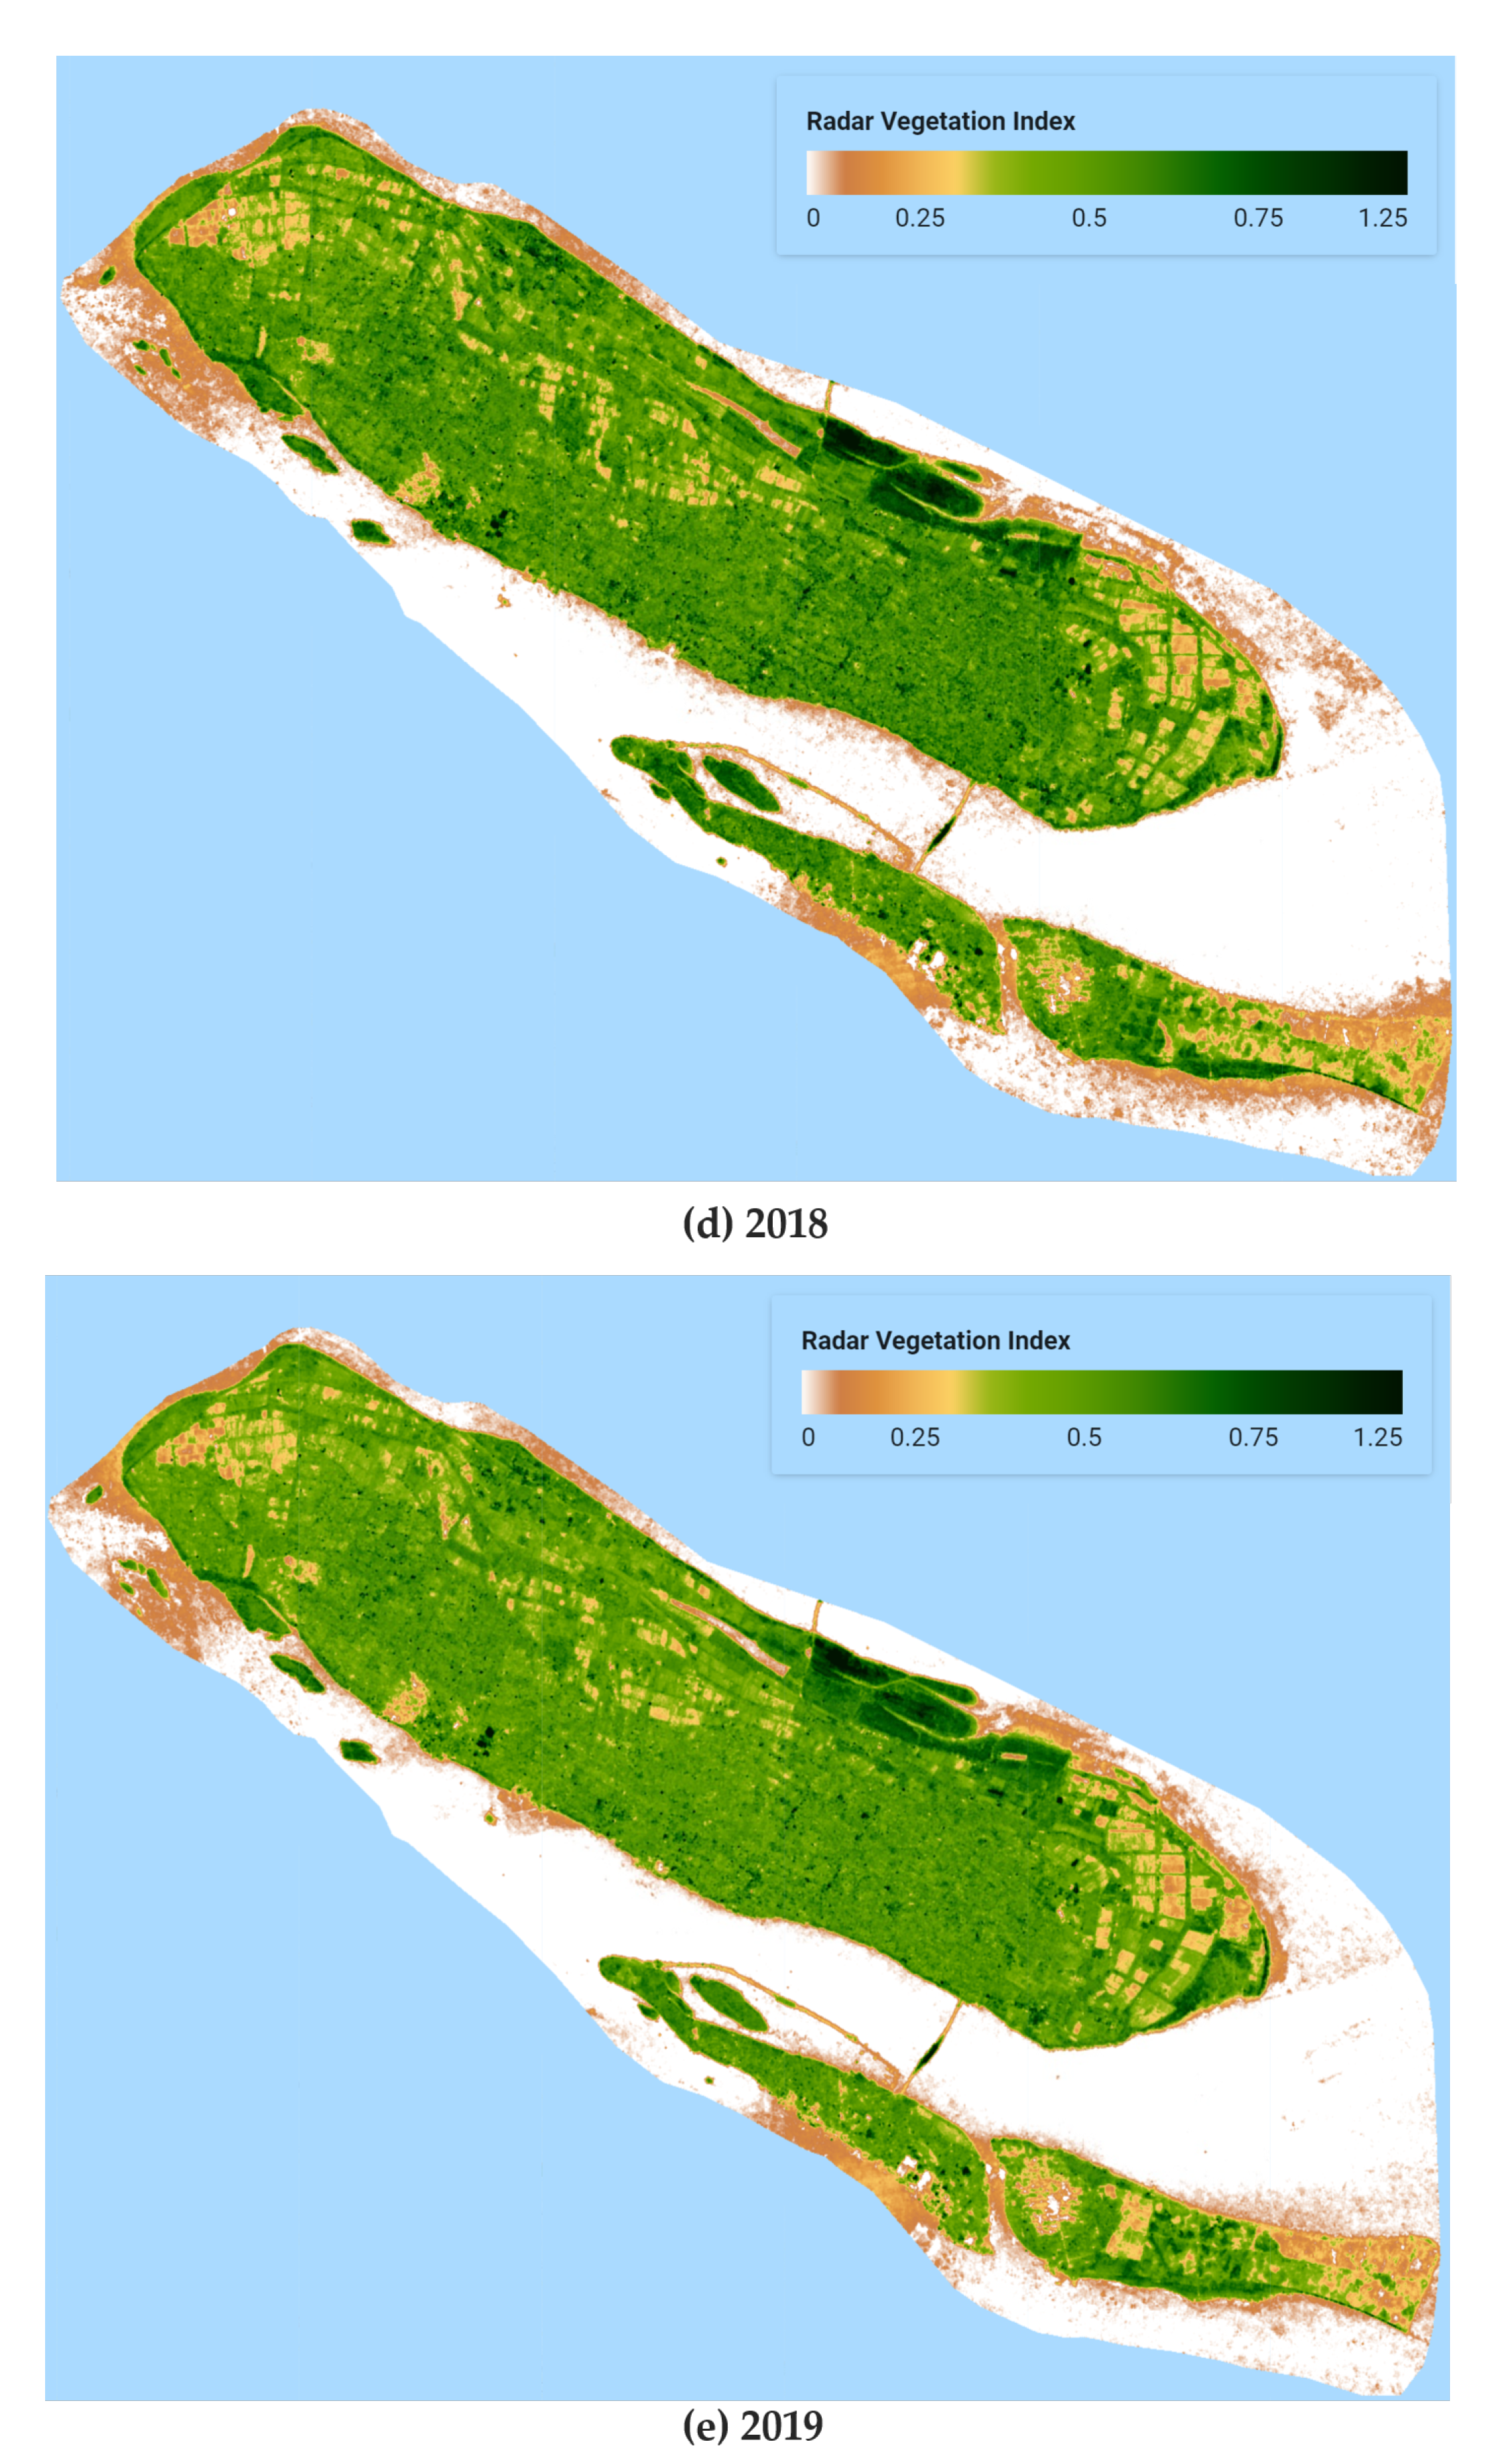
It is challenging to derive radar vegetation index without full polarization data. Figure 8 shows an approximate RVI using Sentinel-1 SAR dual-polarization data for the Chongming island from 2015 to 2019. The greater the RVI value means, the denser the composition of the surface vegetation in the area. The minimum yearly averaged RVI occurred in 2015. The peaks in 2016 are prominent compared with those of the other years. According to Shanghai Forestry Bureau, Shanghai successively invested 20 million USD in large-scale afforestation to adjust, replant, and build forests on Chongming island from 2016 to 2018 [56]. Therefore, starting from 2016, the overall forest area of Chongming island has increased. The RVI plots from 2016 also confirms the general trend of forest changes in Chongming island.
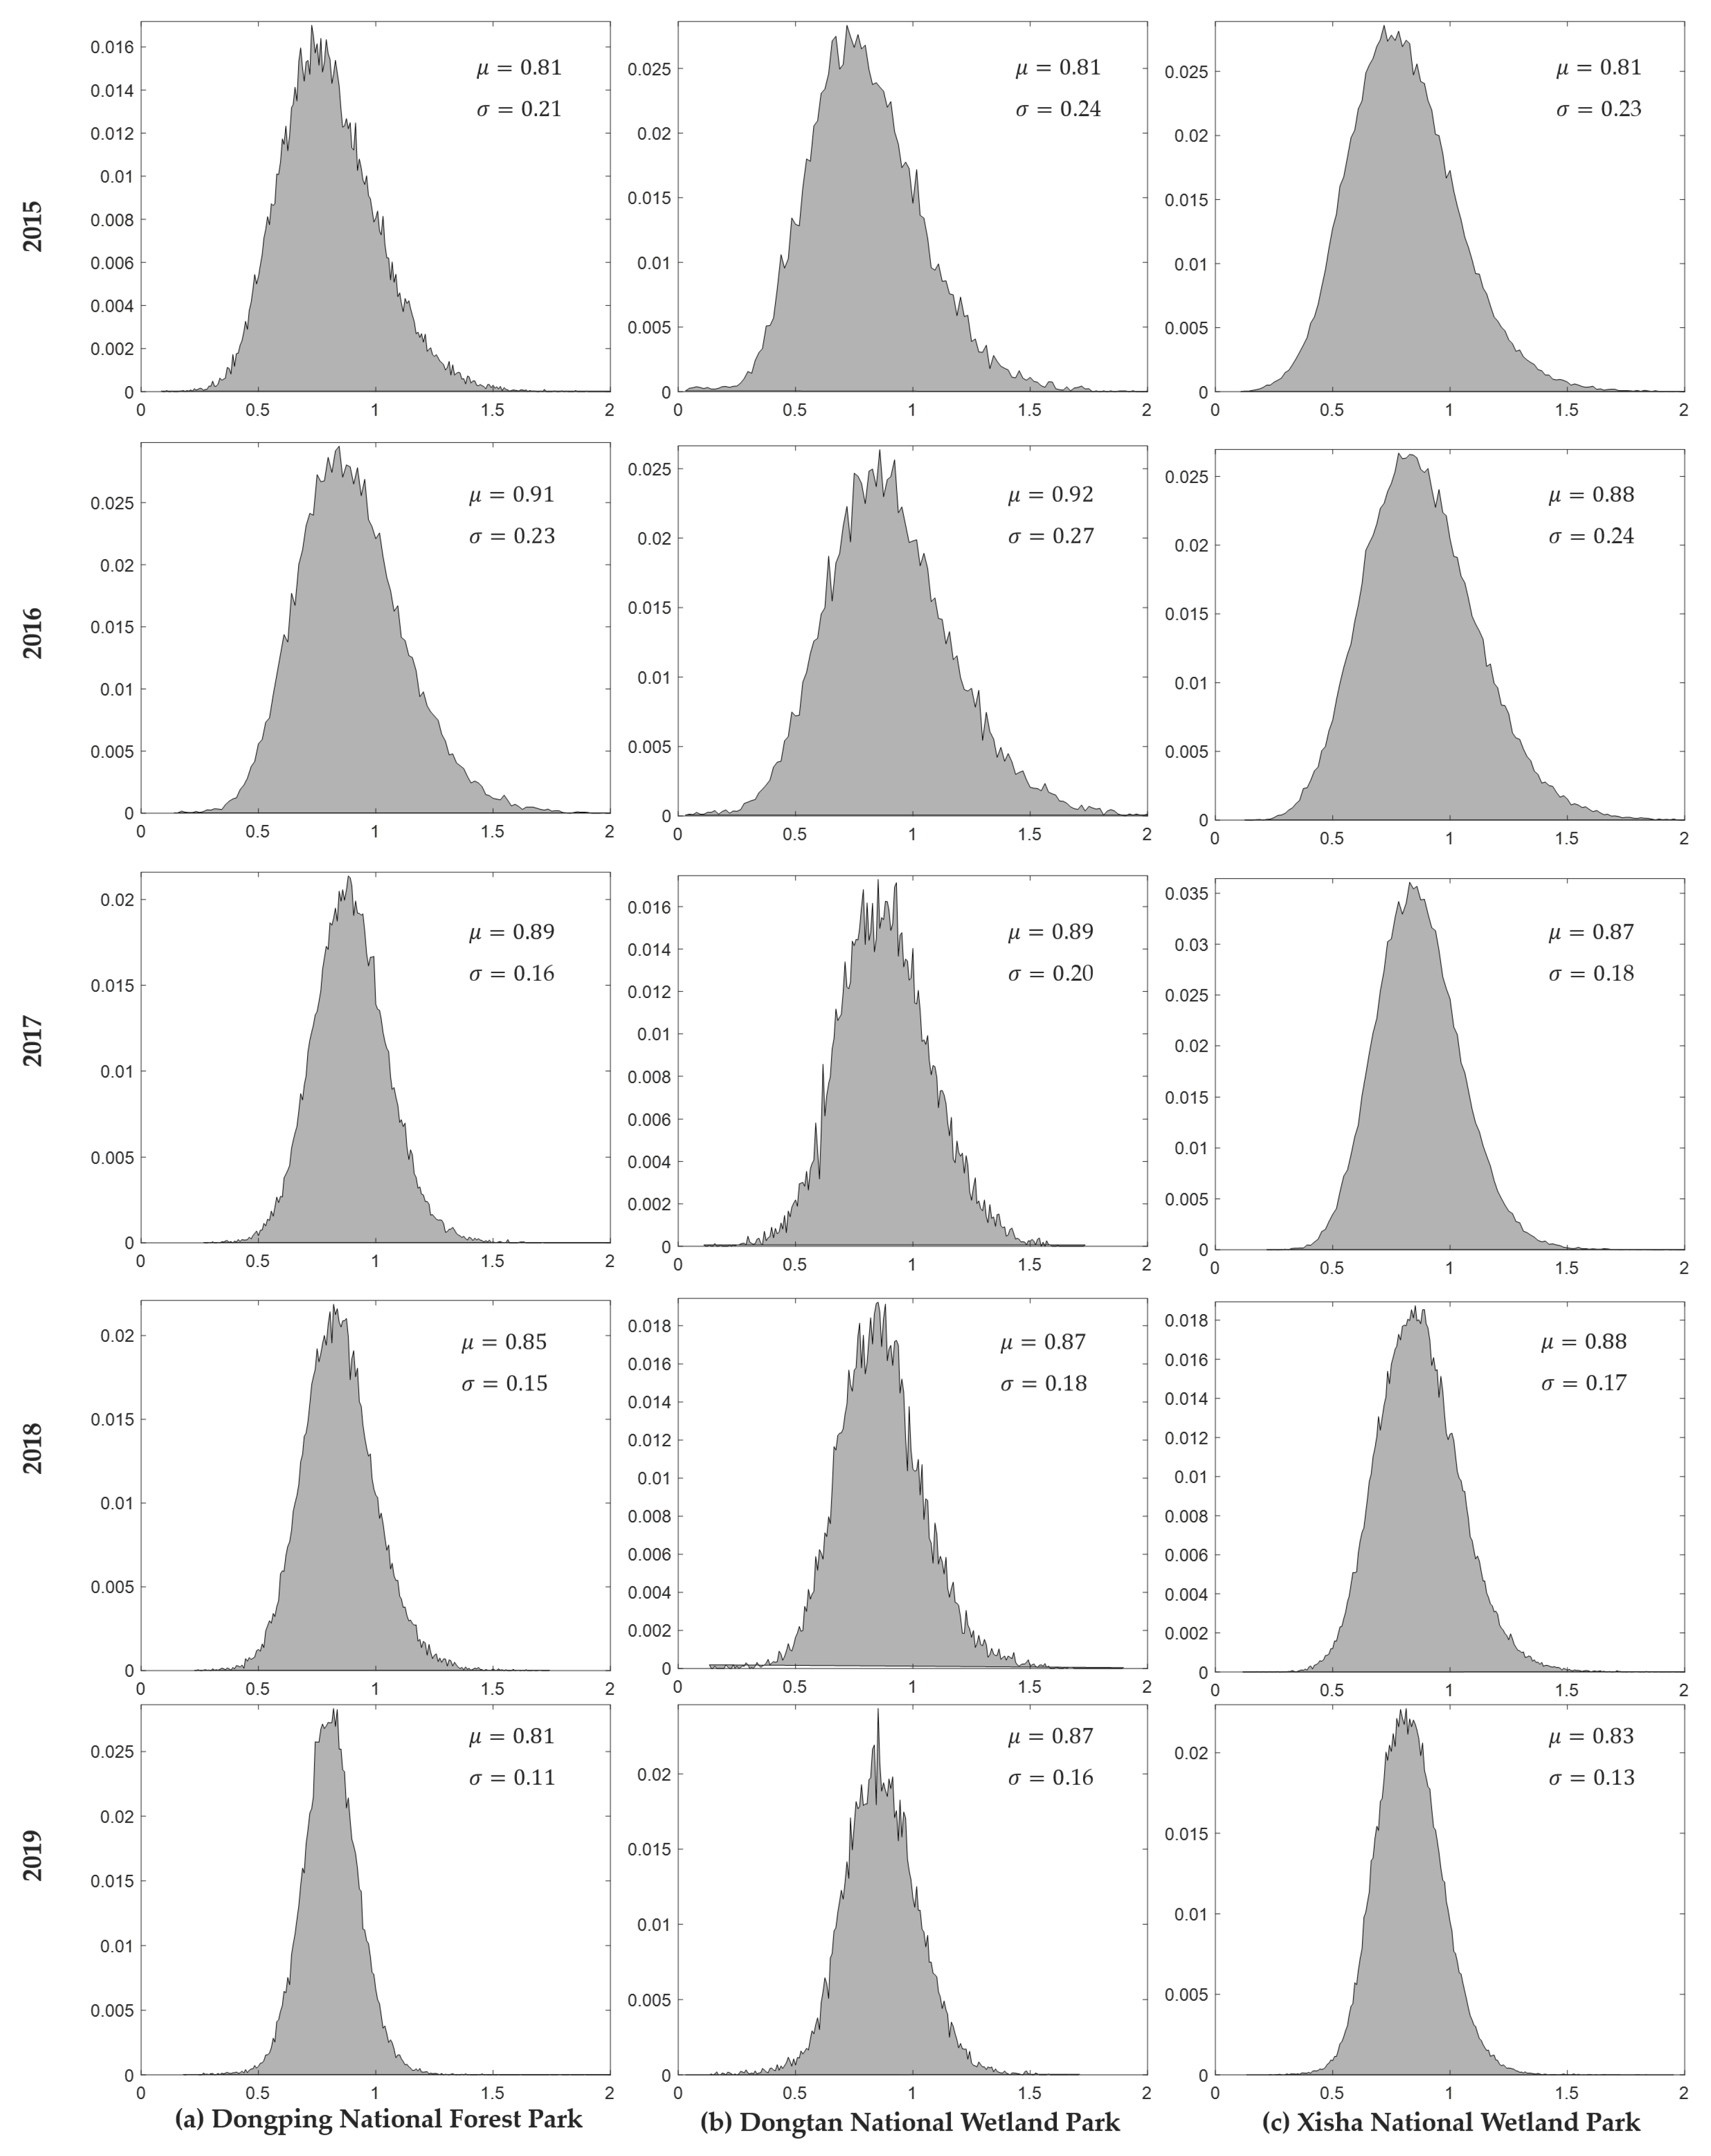
To better understand the RVI distributions over three well-known and strictly protected forest sites, Figure 9 shows the histograms of the RVIs for Dongping National Forest Park, Dongtan National Wetland Park, and Xisha National Wetland Park, respectively. As a general observation, the distributions of RVI of these three study sites have temporal variations. It can be seen that the RVI distributions are close to the Gaussian distribution, but the mean and standard deviation are different in the different years. The RVI value of the forest is i a mainly distributed range from 0.4 to 1.5. The statistical parameters of RVI are the average results of spatio-temporal statistics, so they have a good indication of forest cover. A large average RVI indicates that the forest area has increased or the forests were denser, and vice versa may indicate that the forest vegetation has decreased.
3.2. Yearly Forest Change Cover
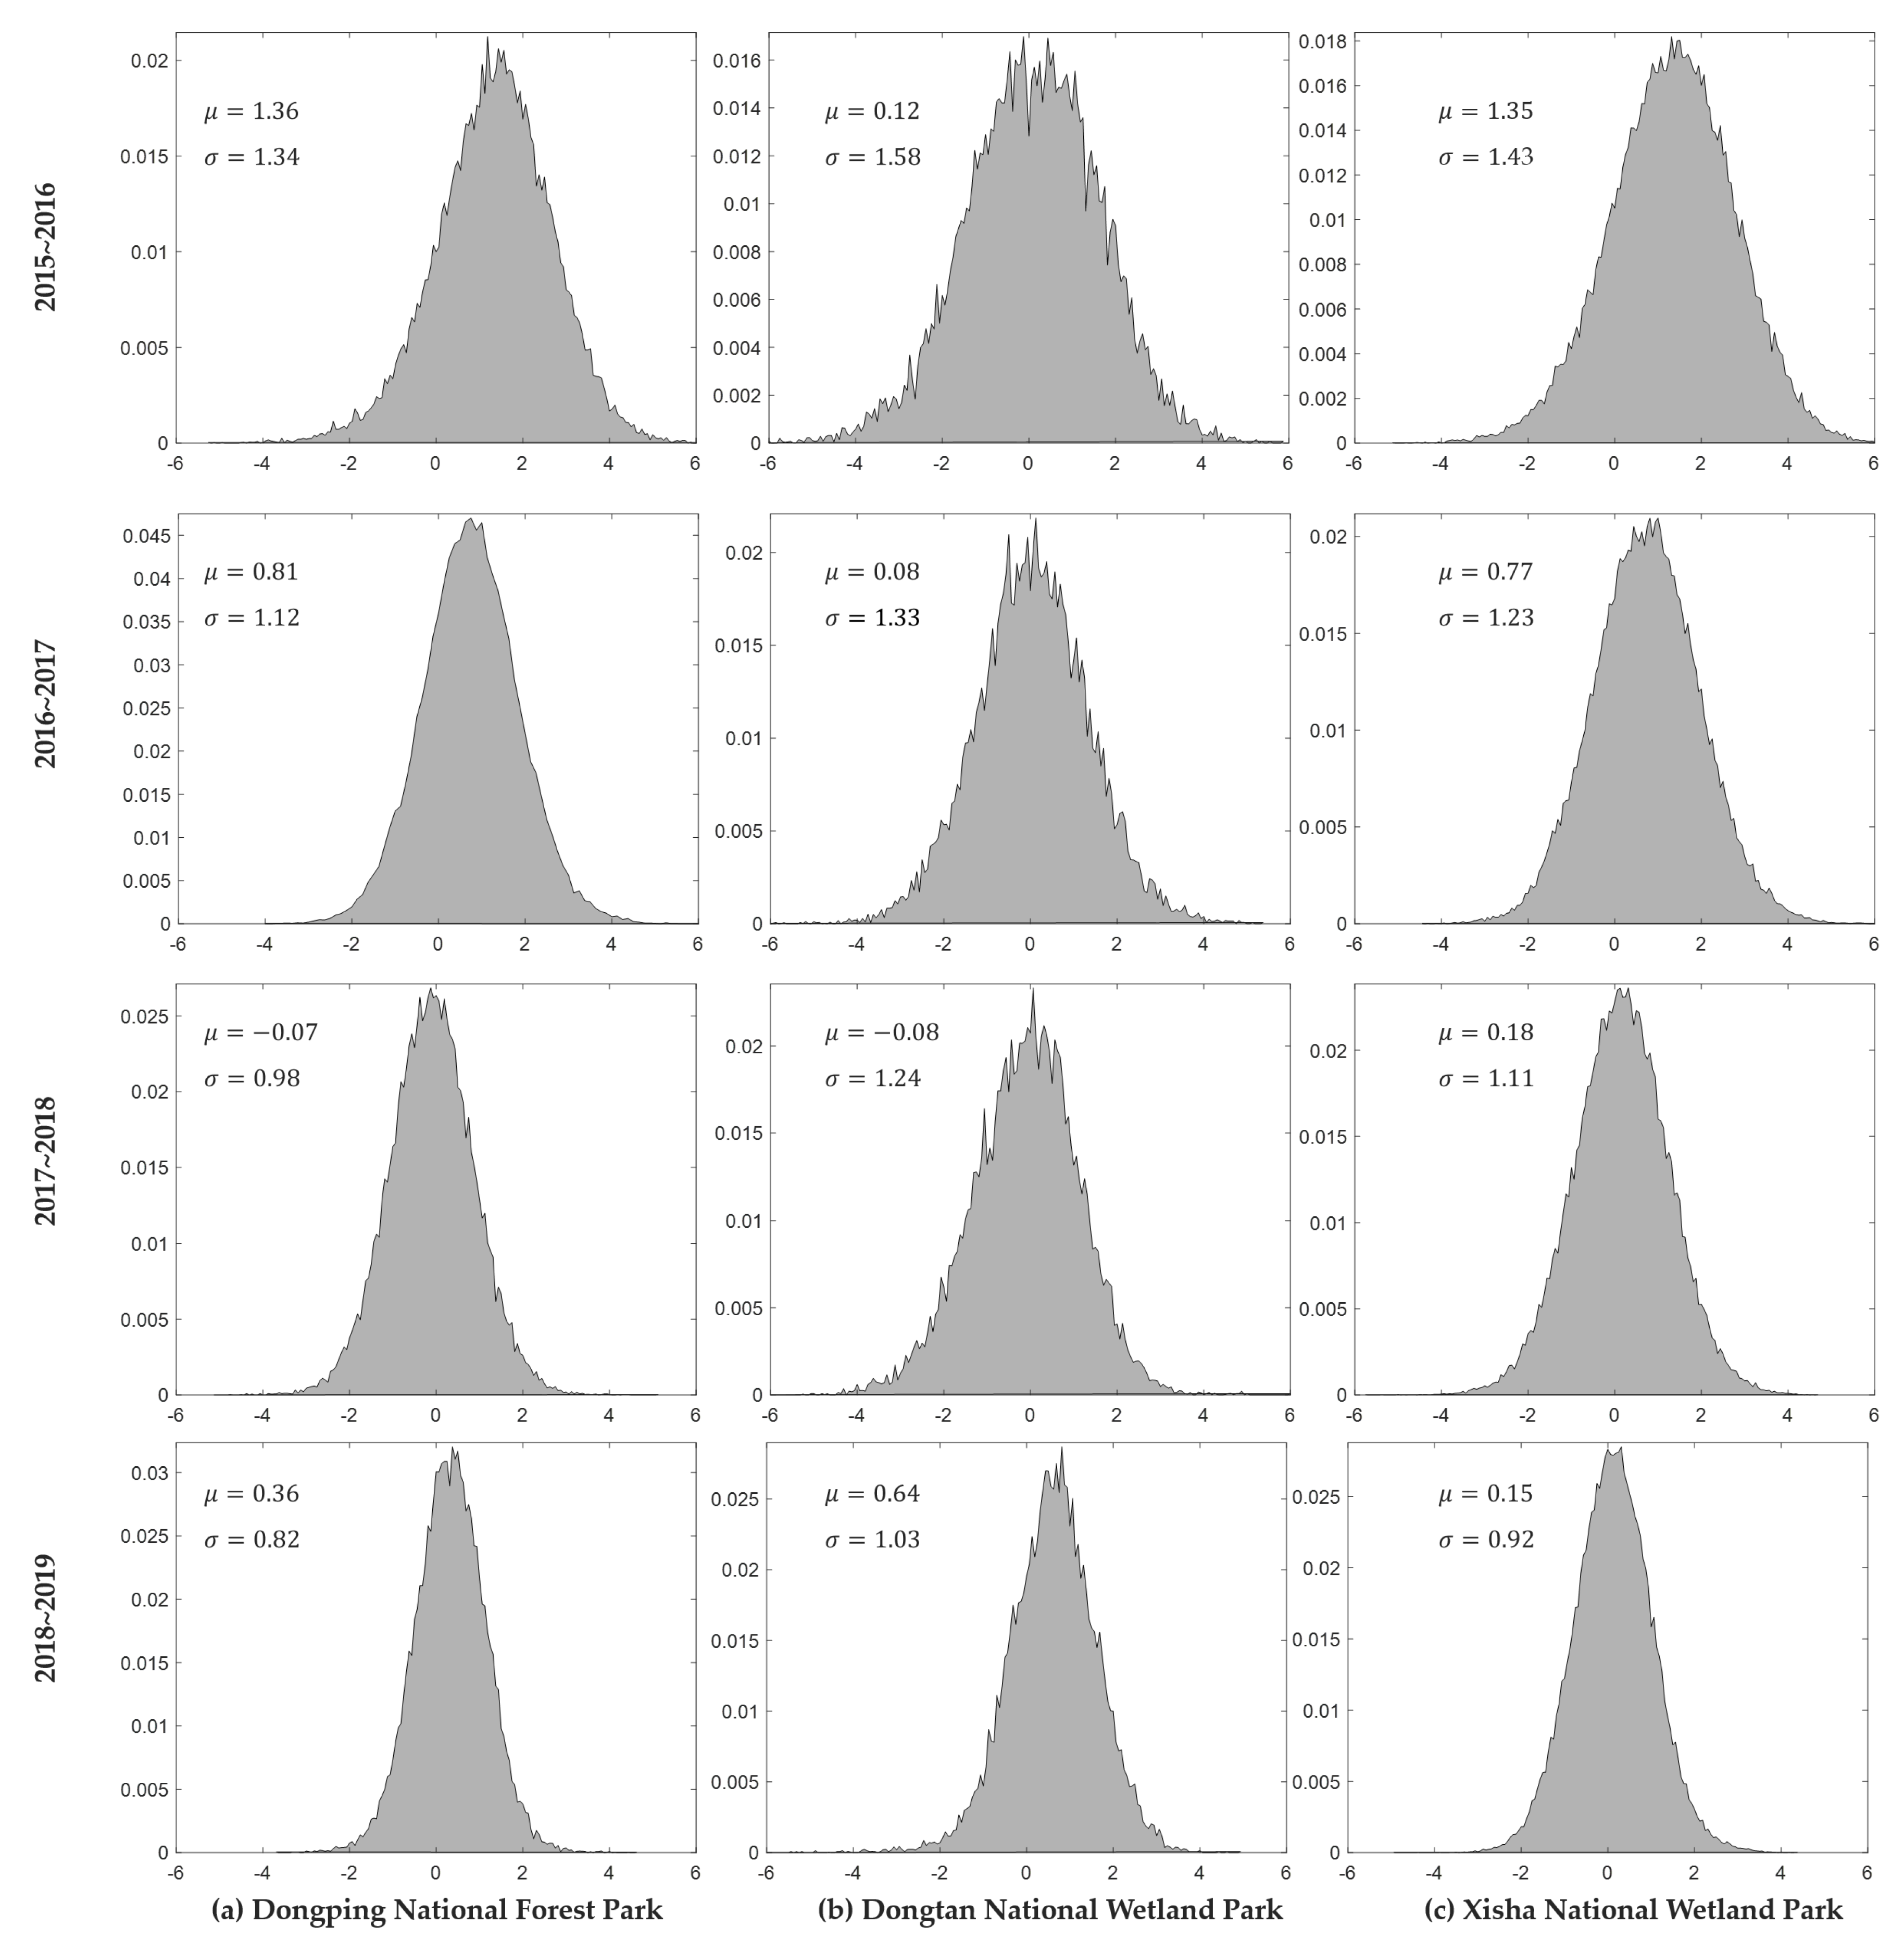
Next, we demonstrate yearly forest change cover in the study areas using the proposed approach. Figure 10 depicts the distributions of the ratio images with statistics using VH band from 2015 to 2019. It is important to note that the time series SAR data were in a logarithmic scale to produce forest change cover. So subtraction was performed for image rationing, and the mean of the ratio images could be negative or positive. A positive mean value indicates an increase in forest area, and vice versa.
For these three research sites, from 2015 to 2019, the majority of average values of the ratio image are positive. It means that the forest area increased in these regions and is consistent with the statistics of RVI. However, from 2017 to 2018, the mean values of the ratio image in Dongping National Forest Park and Dongtan national wetland are negative. In theory, a larger absolute value of the mean of the ratio images means one larger probability of forest change. Since the absolute threshold is used, that is, when the mean is positive, it is set to the threshold as , and when the mean is negative, the threshold is computed as , so robust forest changes can be obtained. As addressed in Section 2.2, this threshold provides a high confidence level of 99.38% for forest change detection.
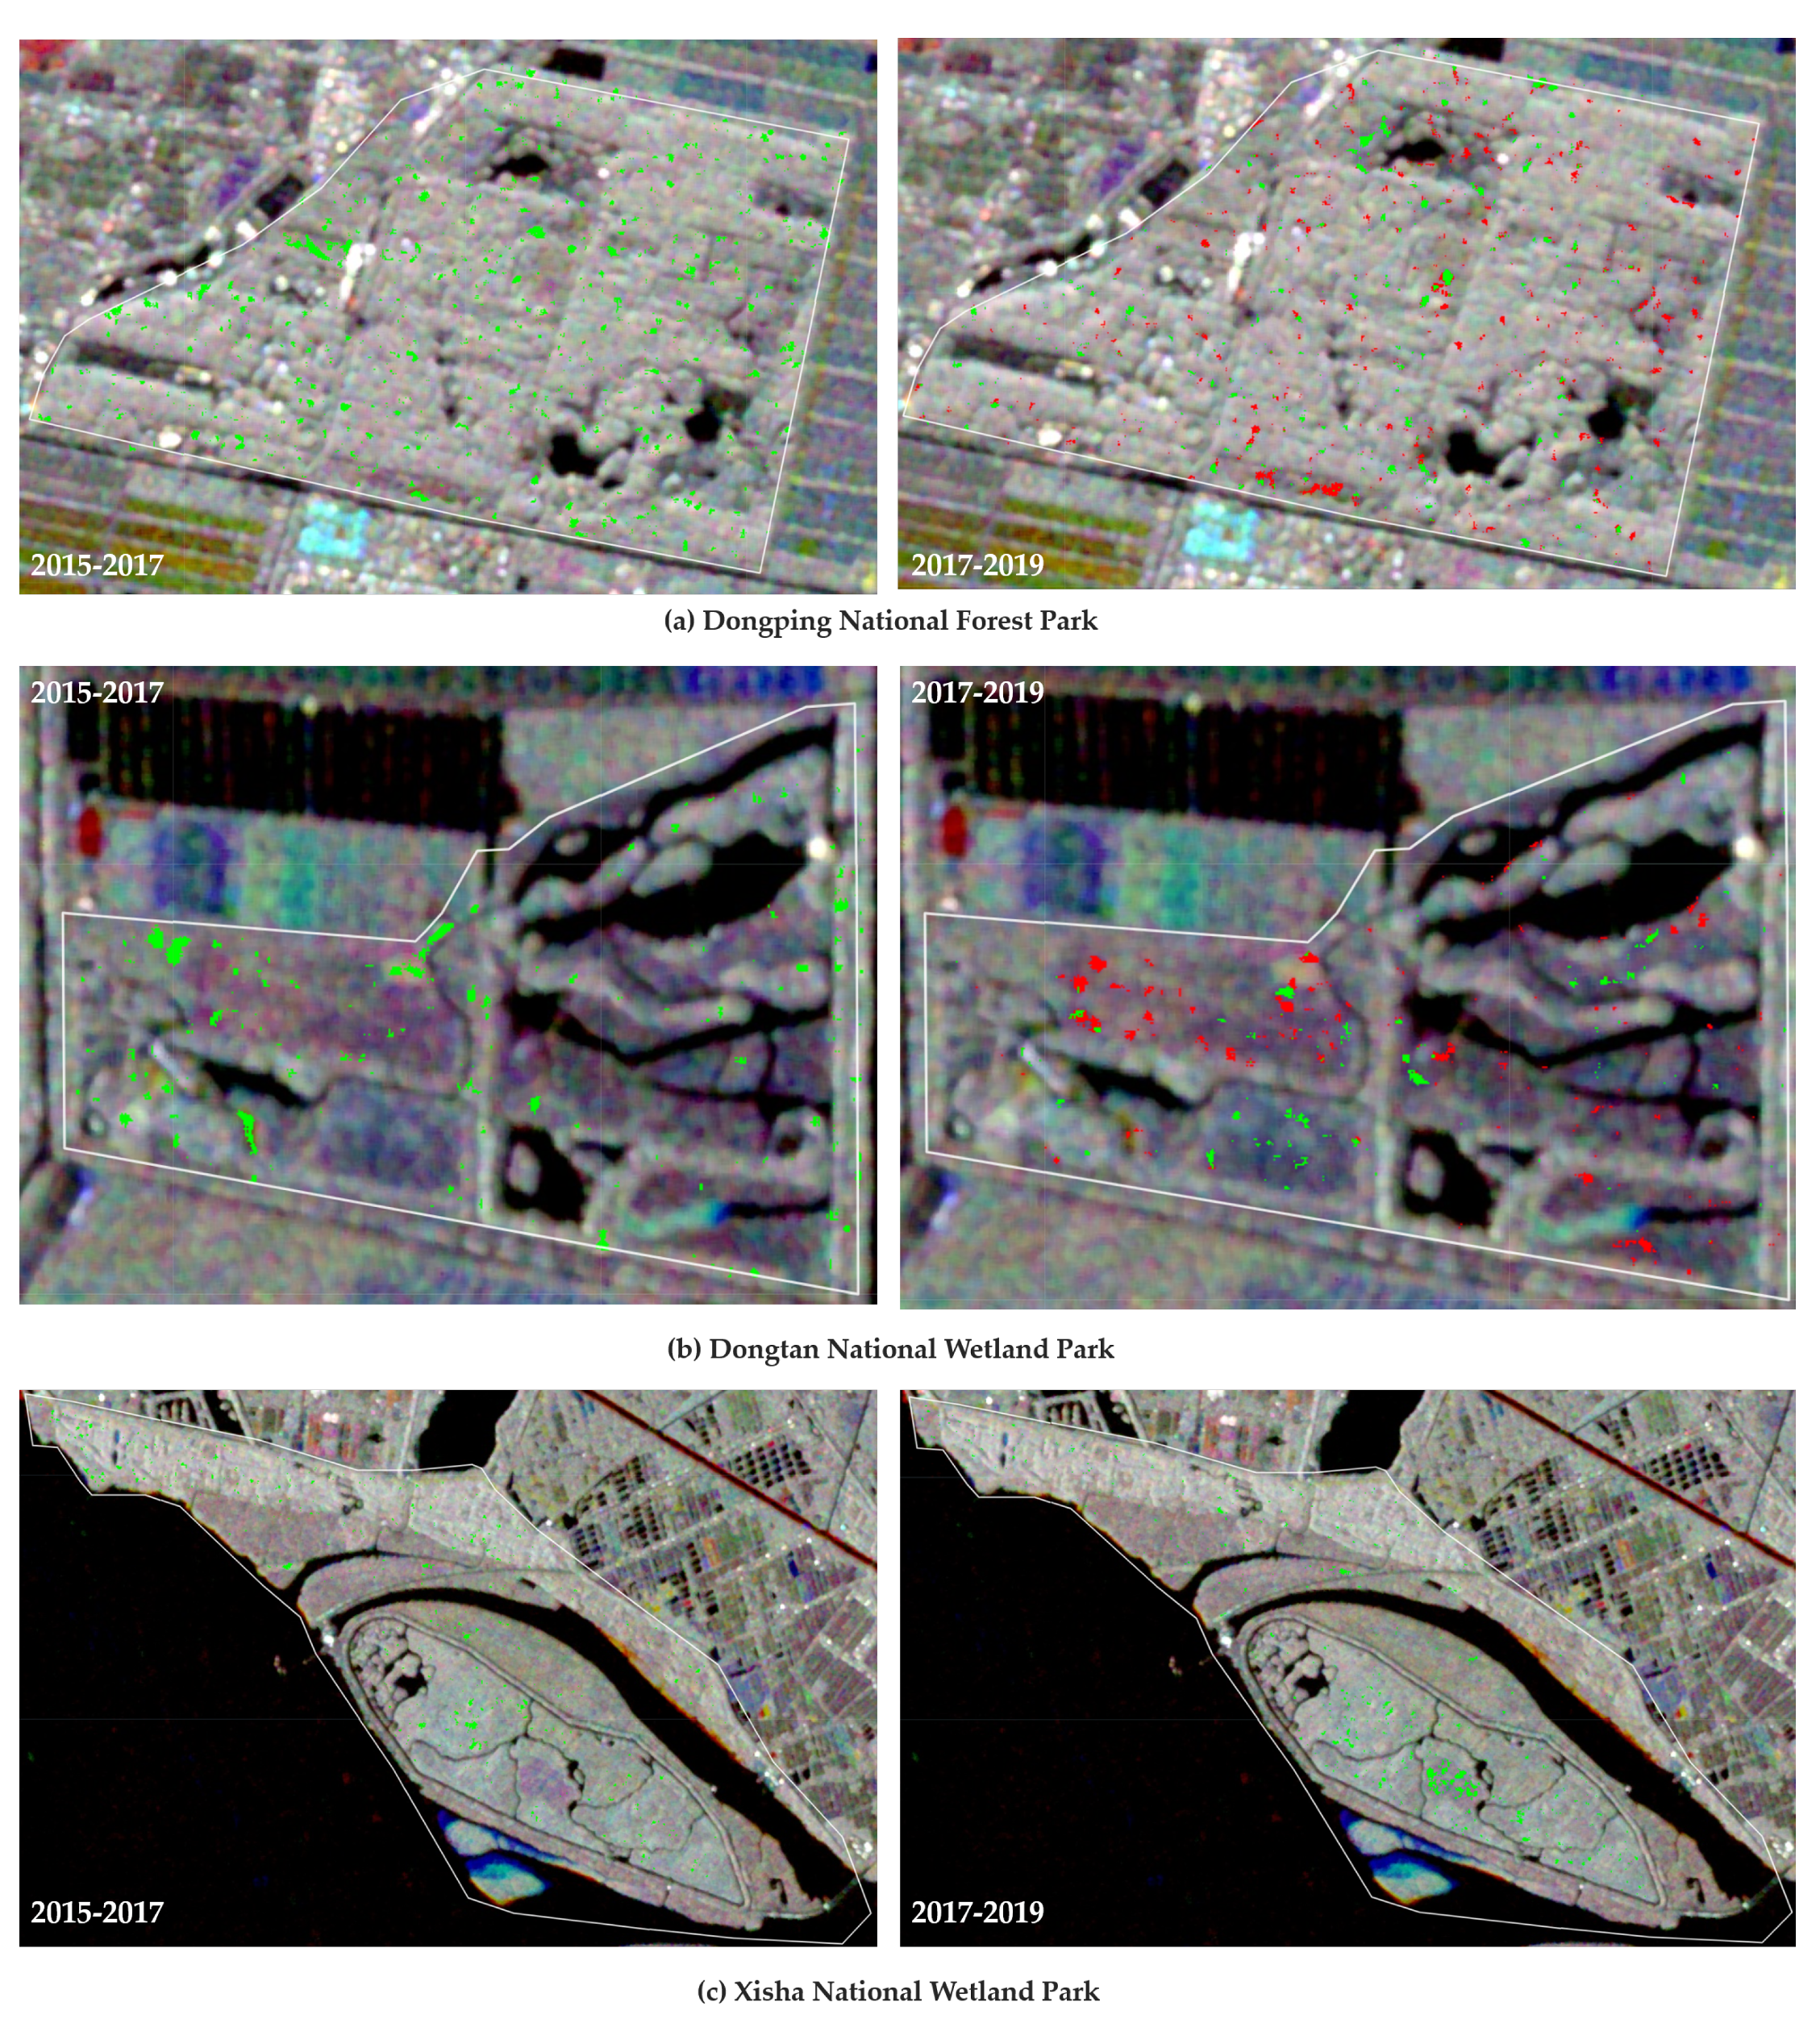
After applying the threshold, the forest change was evaluated. Figure 11 demonstrates forest change cover maps on the study areas in the last five years. These plots show forest change dynamics for three different study areas in the past five years. As seen from the increased forest coverage map, the increased forests in Dongping National Forest Park and Xisha National Wetland Park are randomly distributed, and are replanted in the processing of artificial afforestation by Shanghai Forest Bureau. In contrast, the increased forest in Dongtan wetland park is one of the tree planting plans. In addition, it can be seen that the area where the forest decreased by a small part fell in the area where the forest area increased. This means that there are a small number of unviable trees after afforestation. Xisha National Wetland Park is affected by the river. Between 2018 and 2019, the forests along the river in this area had been greatly reduced.
Table 4 presents the detailed areas of forest change. The planted forest in Dongping National Forest Park grew an area of 7.38 hectares from 2015 to 2019, and disappeared from an area of almost 2.59 hectares in 2018. The man-made forest of Xisha National Wetland Park increased at an area of almost 20.19 hectares over the past five years. The forest in Dongtan National Wetland Park increased to an area of almost 2.12 hectares in the period of 2015–2017 and 2018–2019. However, from 2017 to 2018, the area of planted forests in Dongtan National Wetland Park decreased by 1.35 hectares. Although the local government of Chongming has been planting trees [57], the forest area of Dongping National Forest Park and Dontan National Wetland Park decreased by 2.59 hectares and 1.35 hectares, respectively, from 2017 to 2018.
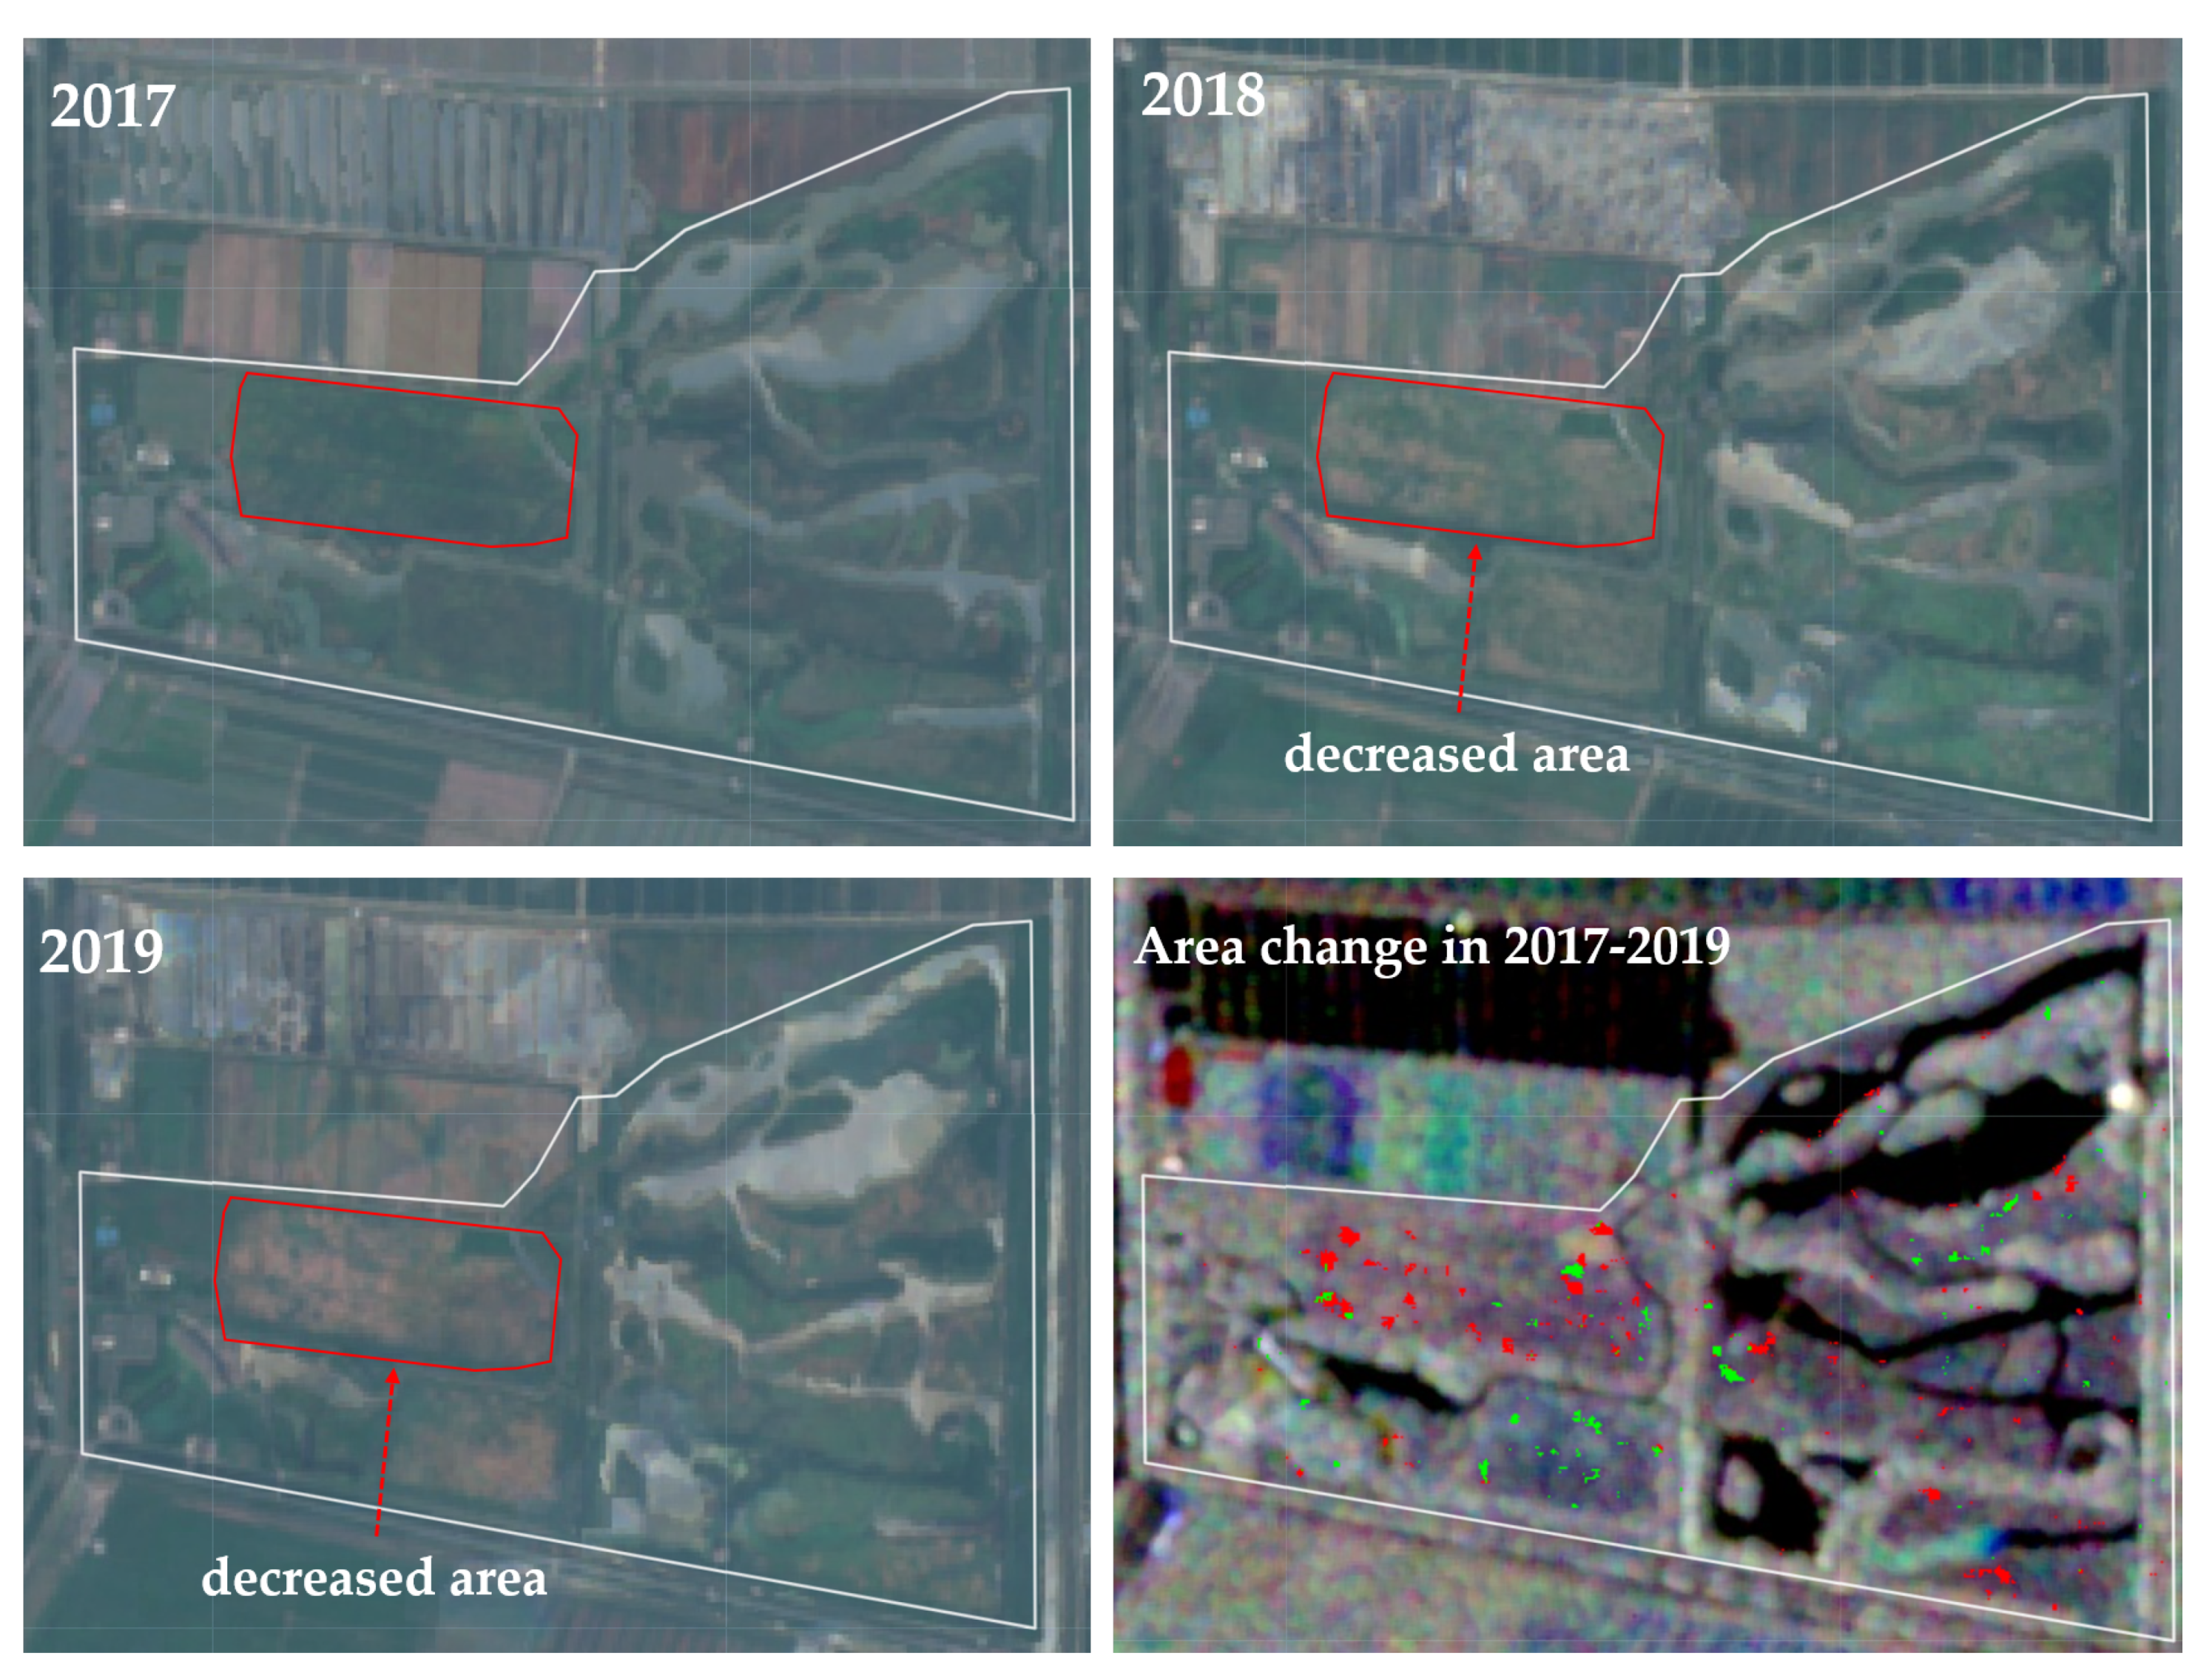
Next, we naturally have to answer the credibility of these areas of forest change. We selected the best quality images with the lowest cloud content in Sentinel-2 data for subjective evaluation with the forest change mapping. As shown in Figure 12, although the areas with red polygons have much less vegetation from 2017 to 2018, our proposed method applies the threshold processing with a confidence level of 99.38% to successfully detect only part of the forest that had changed drastically. Therefore, our proposed method is valuable for the management and sustainable development of the tourist forest on Chongming island.
3.3. Cross-Comparison of Radar Vegetation Index
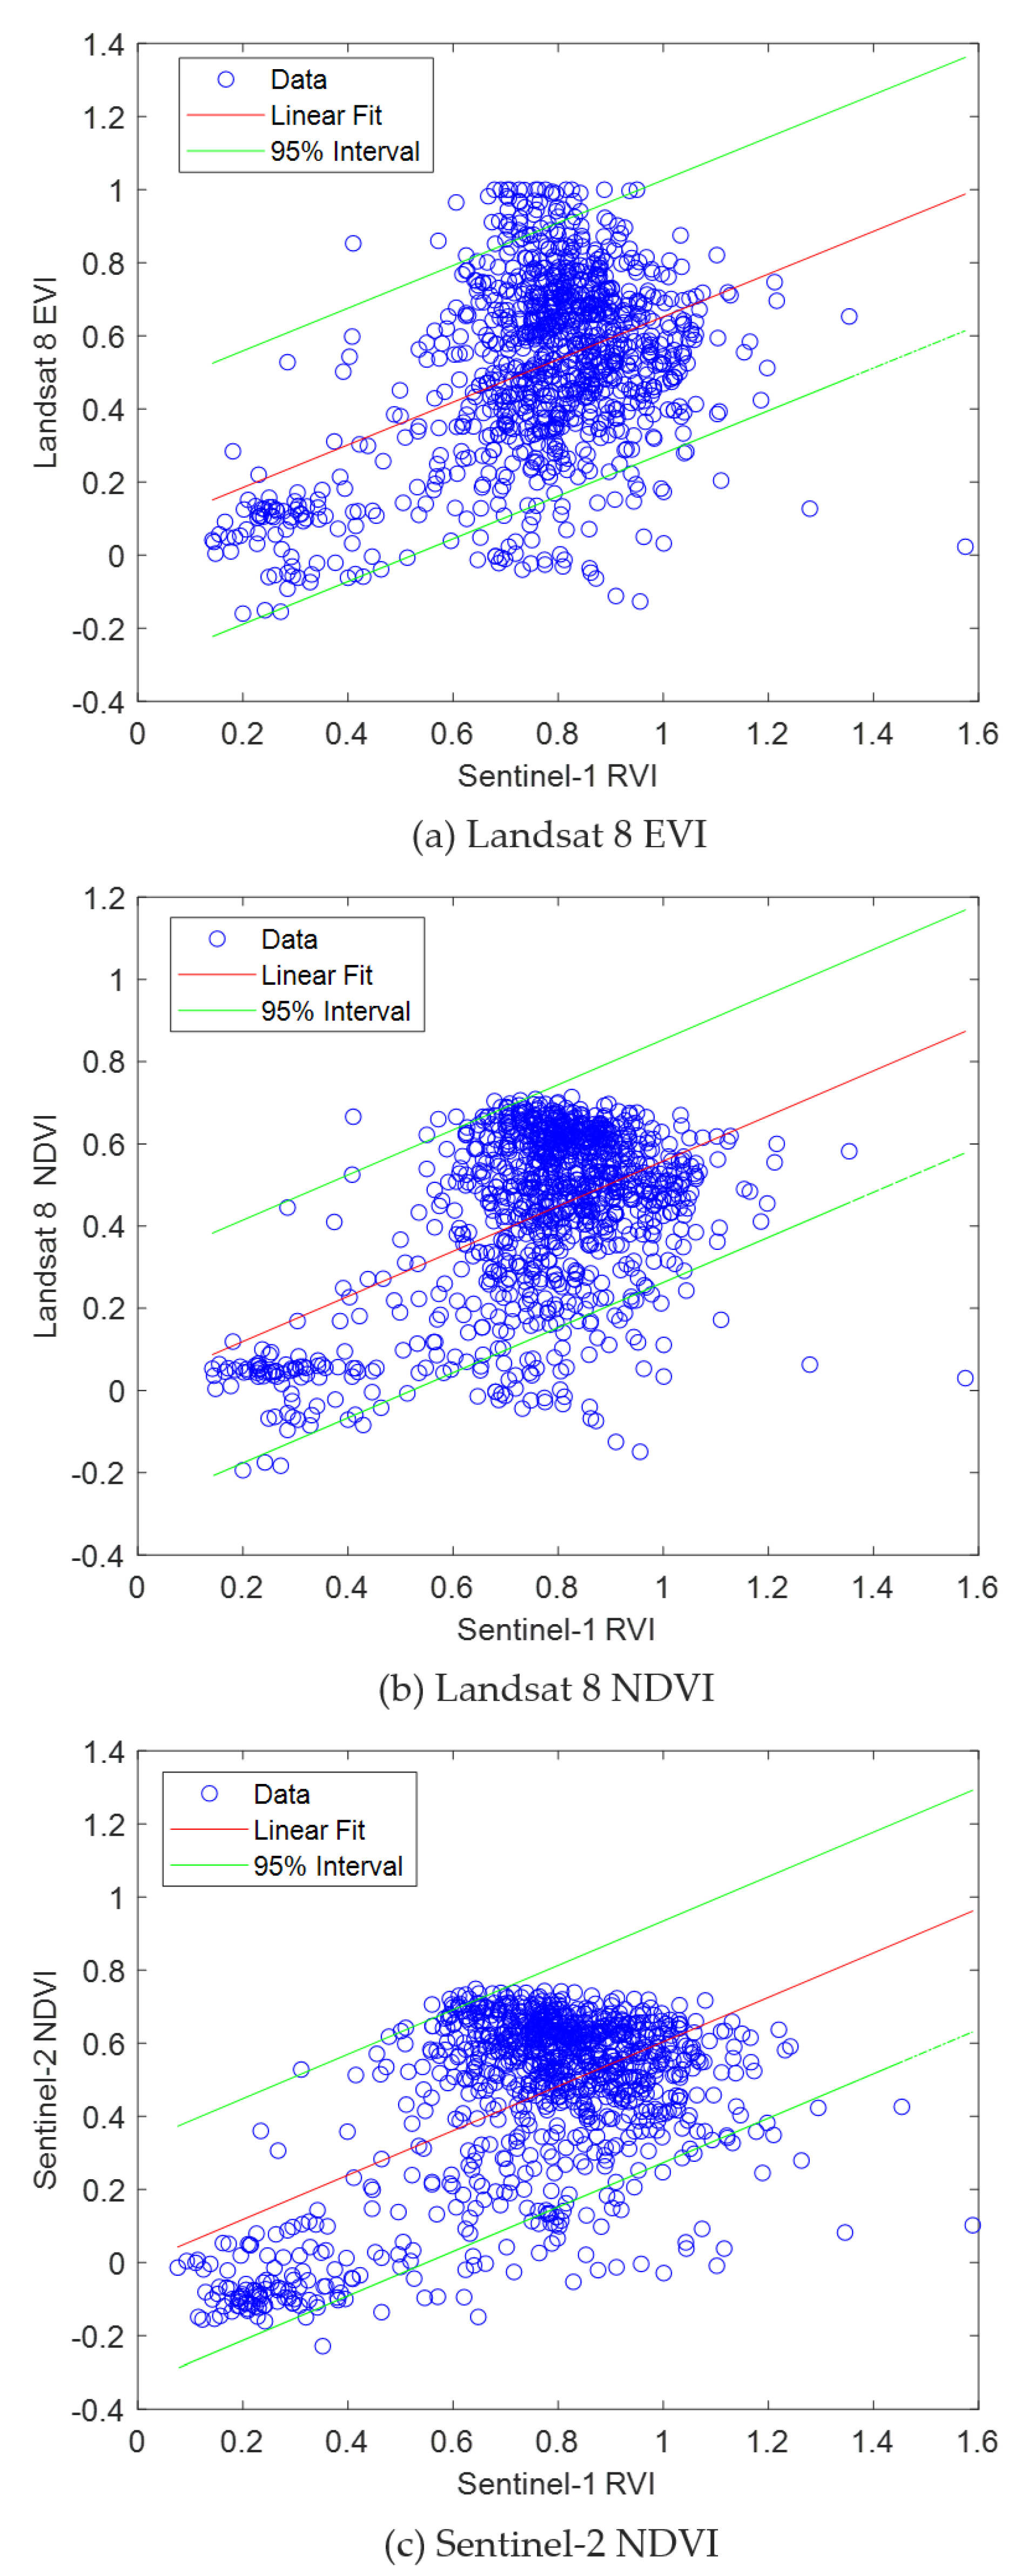
We use the available EVI and NDVI images for cross-comparison of the radar vegetation index. Figure 13 plots results of linear regressions in 2019. The results show that the connections with optical vegetation index are some good relevance. Pearson’s correlation coefficients were above 0.17 in Table 5.
Several methods have been conducted to improve the correlation. First, a median value was taken for the optical images during the study period to further reduce cloud effects on the NDVI and the EVI and then, in the correlation analysis with Landsat 8, the spatial resolution of the RVI was down-sampled to the same 30 m.
4. Discussion
This study results reflect forest change driven by both climate and human activity in Chongming island. The Shanghai government has established its ambition to build Chongming island into a world-class ecological island. From 2016 to 2018, large-scale afforestation began on Chongming island [39,40,41,42]. For existing forest parks, the method of local adjustment and replanting of forests has been adopted to increase forest coverage [56,57]. Our research results are consistent with that the implementation of local government policies has increased the forest area, and the erosion of the river under the special ecological environment of the Yangtze River estuary has led to the reduction of forests.
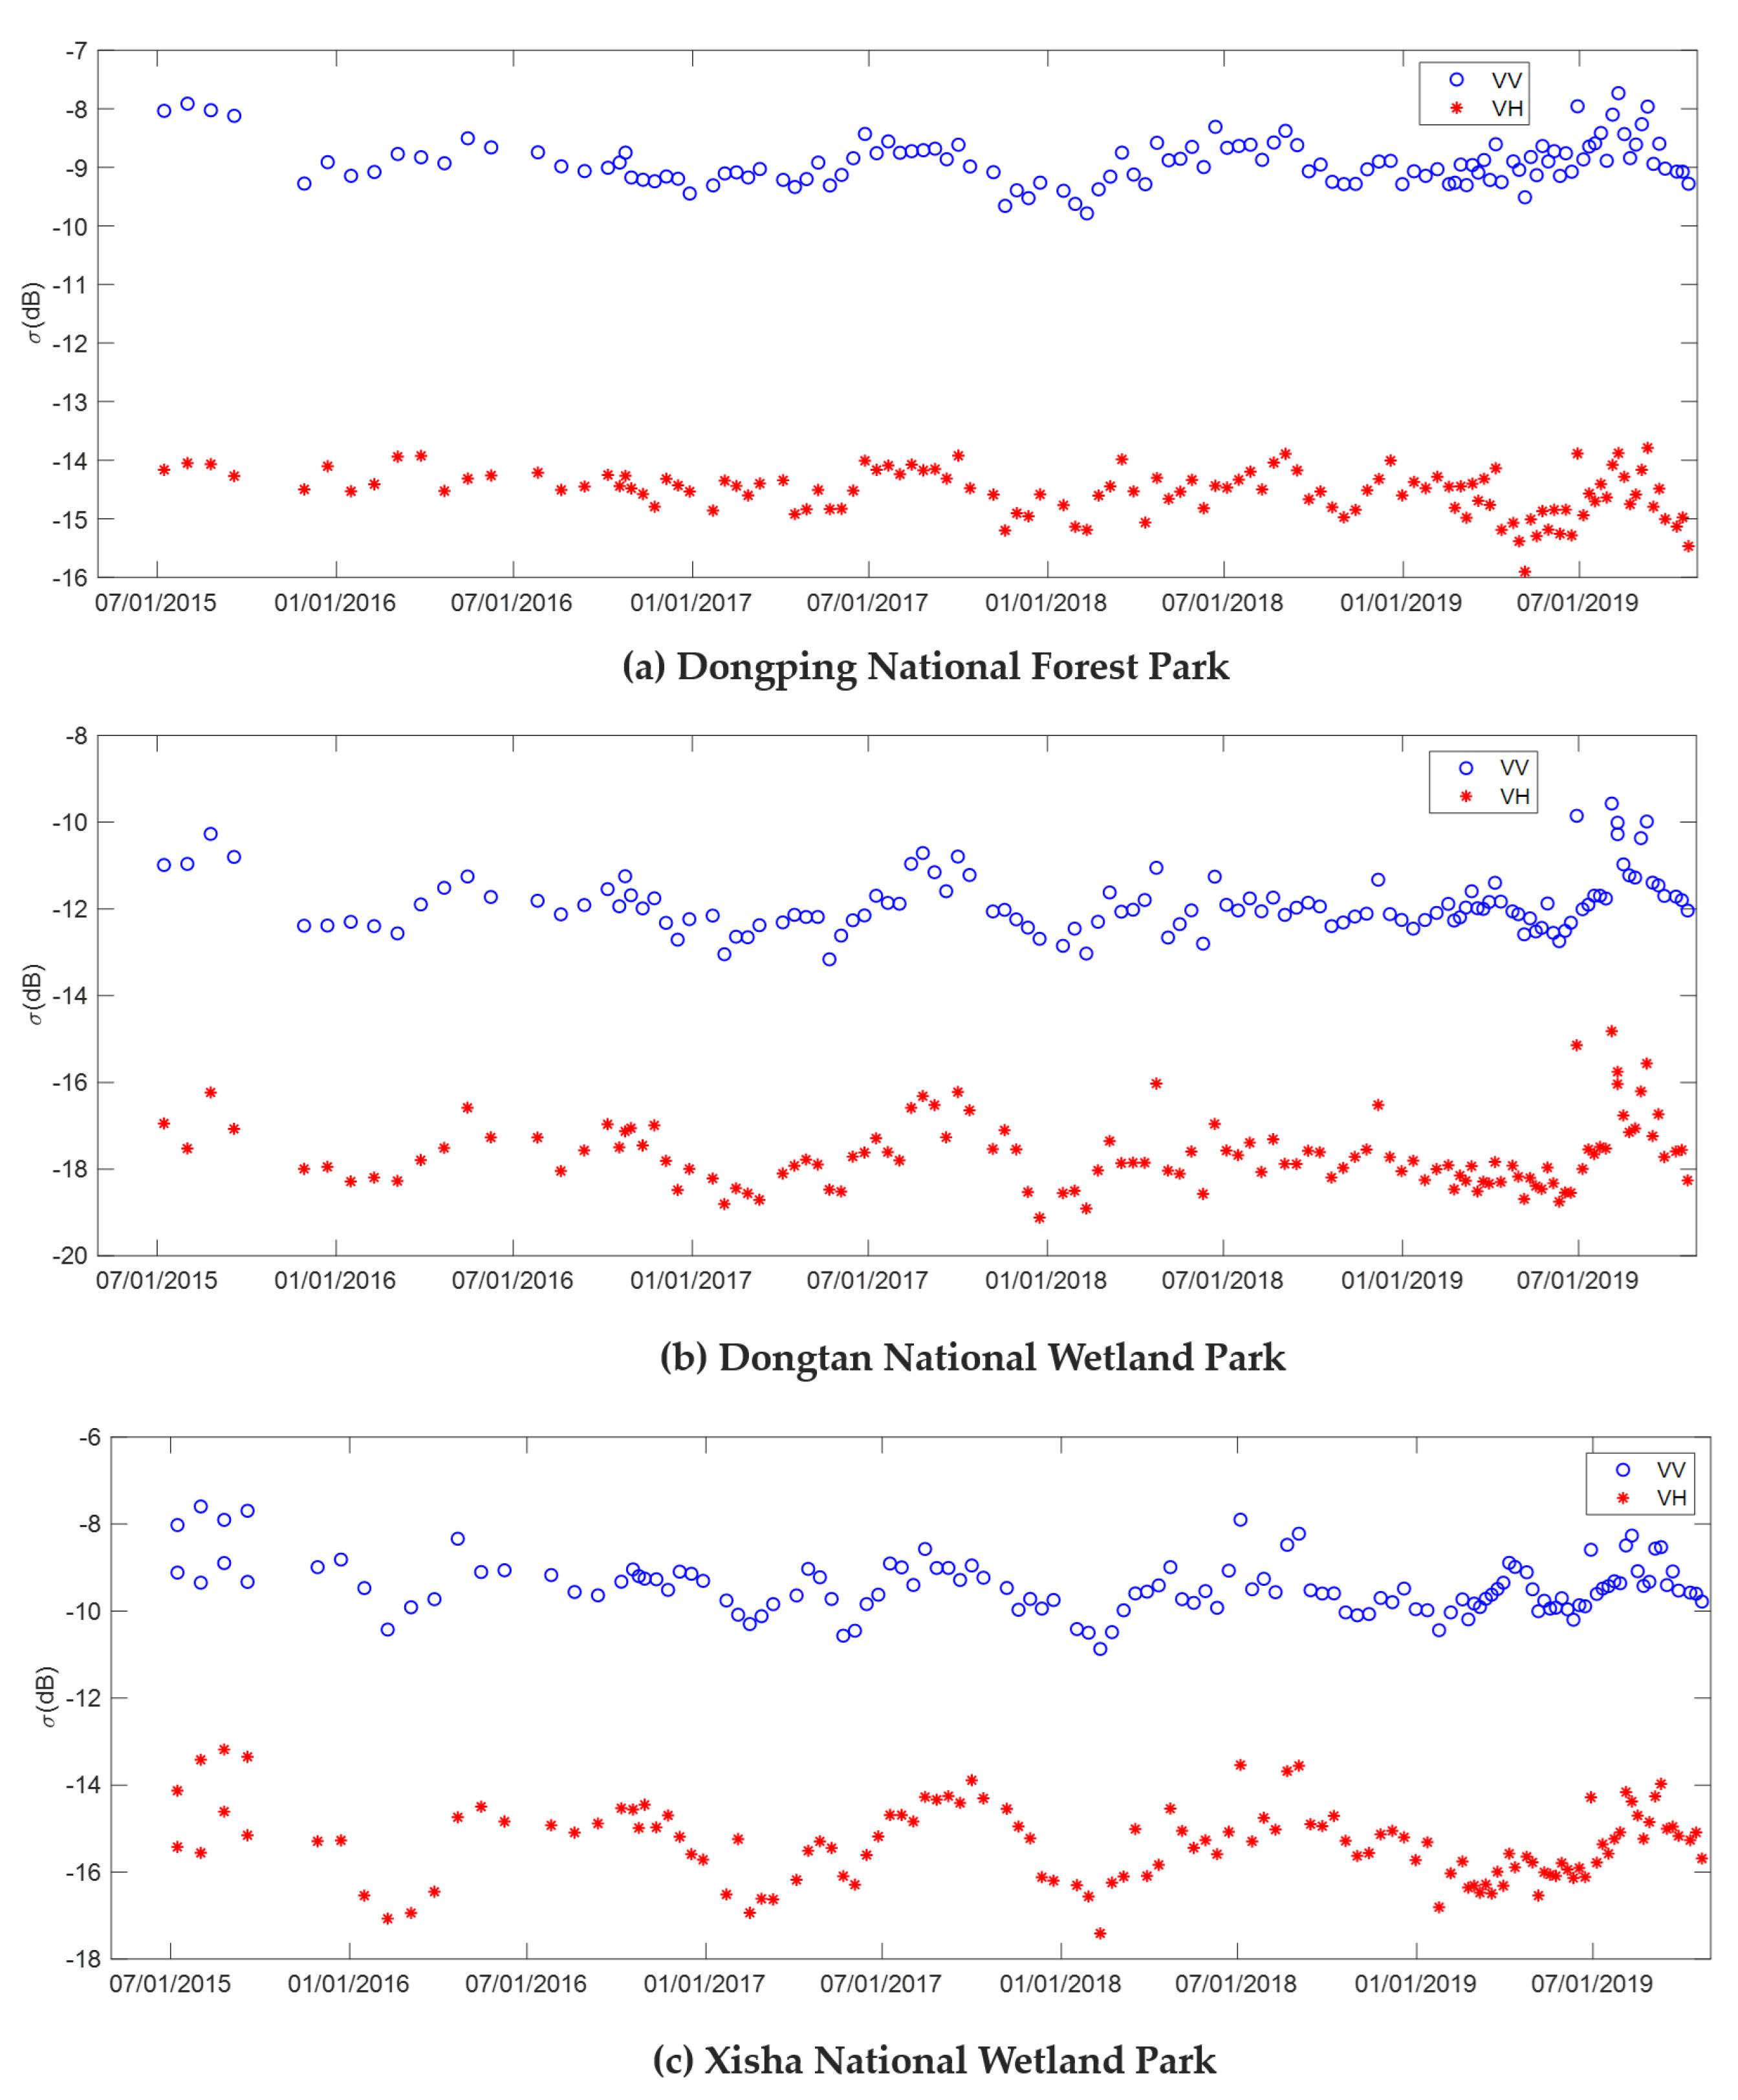
The potential use of Sentinel-1 SAR time series data can derive radar vegetation index for estuary such as Chongming island. Statistics of RVI distributions was helpful for indicating forest change. The exception is the averaged RVI in 2015, due to that fewer data was available in 2015. To illustrate this, all the available VV and VH data were plotted in Figure 14. In the wet season, it is very challenging to retrieve the RVI, although SAR is a cloud-free system. Precipitation will affect the radar scattering on forest [43,58]. Therefore, increasing the number of observations can produce a more reliable average, thereby reducing the impact of precipitation conditions.
Linear regression results showed relatively good correlations between the RVI and optical vegetation index. The accuracy of the RVI can be improved by using full polarization data. The existing studies find that the main sources backscatter are the HV and VH cross-polarization band in the forest [43]. However, the power of VV polarization data was larger than that of volume scattering component VH band in the forest regions, as plotted in Figure 12. Hence, one of our future study will focus on the use of full polarization data to improve the accuracy of the RVI.
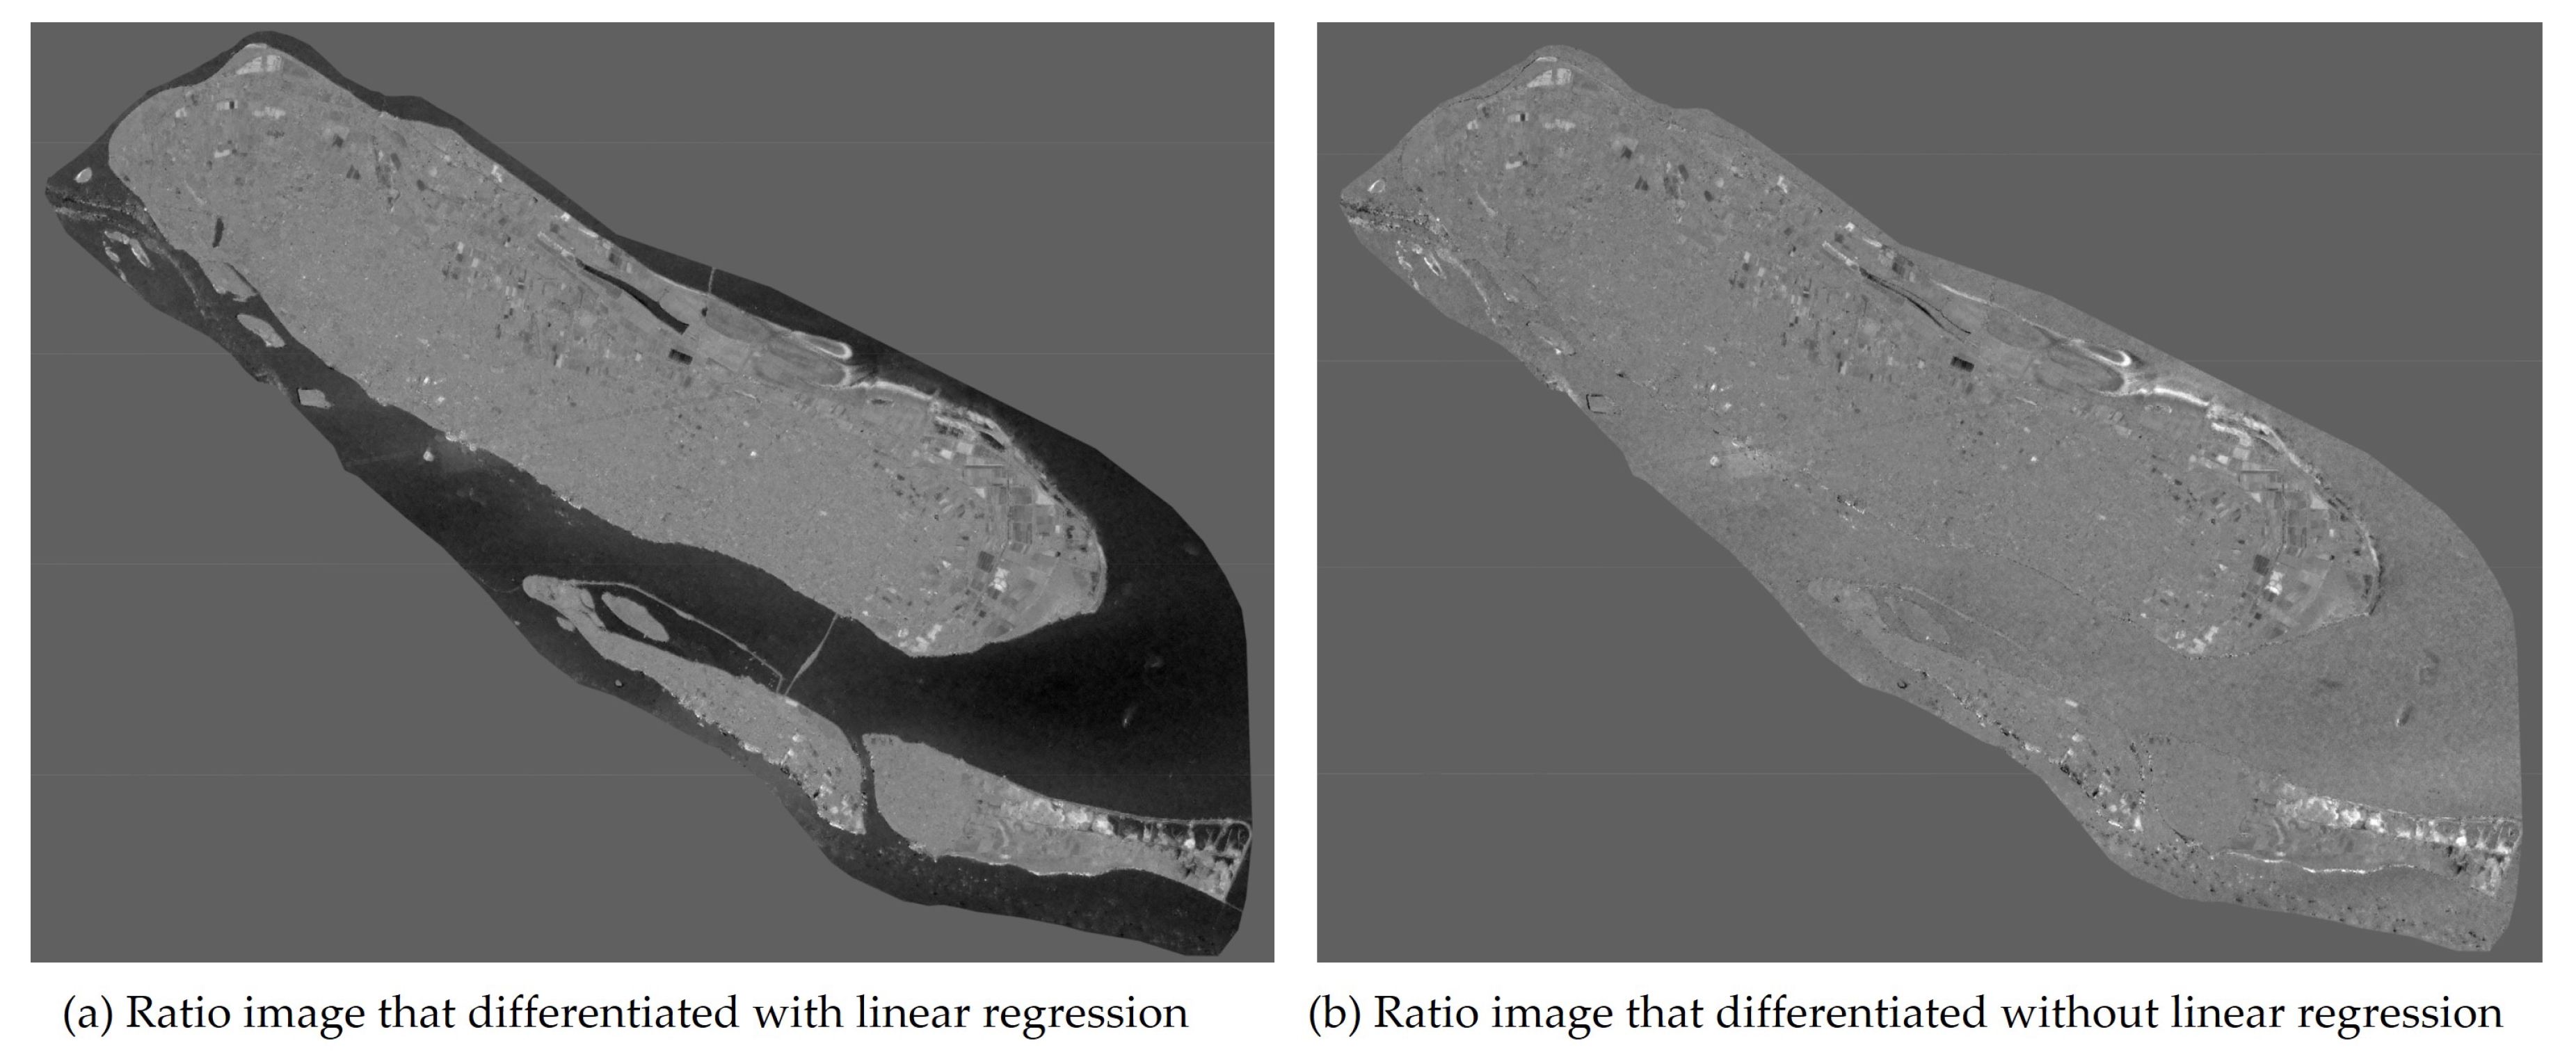
Our study used image regression to reduce the effect of seasonal rainfall on radar forest scattering, and performed the rationing method to quantify the forest change in Chongming eco-island. As demonstrated in Figure 15, there are perturbations in the water regions in the ratio image without linear regression. It is also indirectly verified that the negative effects of precipitation can be suppressed to some extent by the proposed approach.
Since the threshold is important for mapping the change area, various automatic threshold calculation approaches have been proposed. Otsu’s classic thresholding method involves exhaustive search for the threshold that minimizes a weighted sum of variances of the change and background classes [59]. Similar to Otsu’s method, another classic Kapur’s method [60] searches a gray-level picture threshold using the entropy of the histogram. Both Otsu’s and Kapur’s method perform a relatively good performance if the histogram has bimodal distribution and a sharp valley between two peaks. However, if the ratio images are Guassian distributed there will be an incorrect threshold computed by using these adaptive methods [61]. In this study, an absolute threshold technique was used to map the forest change. It is not adaptive but simple and effective for mapping the forest change. According to Figure 9, the ratio images are almost Gaussian distributed. This threshold provides a high confidence level of 99.38% to determine the forest change.
Another issue is the speckle effect on forest change detection. Radar volume scattering increases the number of scatters, comparing with surface scattering. We have conducted some despeckling experiments using a morphological mean filter that is provided in the GEE platform. Although this filtering method can smooth the speckle noise, it leads to the loss of image texture information, which in turn affects the sensitivity of RVI and forest change detection.
There are some limitations of this study. On-site measurements or historical ground truth data are not available for validating the area forest change in relative small wetland or forest parks in Chongming eco-island. From this perspective, our study can provide the evidence of forest change in Chongming eco-island, and inform forest management decision making.
5. Conclusions
Monitoring the change of man-made forests is essential for the sustainable management of forest-based eco-tourism on ecological islands. In this study, we developed an effective method for quantifying forest change on a local scale in the Chongming eco-island, using Sentinel-1 SAR.
An approximate version of radar vegetation index, retrieved by Sentinel-1 SAR data, could indicate the forest growth level of Chongming island. There were good connections between Sentinel-1 radar vegetation index and optical vegetation index.
Although SAR is independent of cloud, the observed errors could be introduced by volume scattering in the precipitation conditions [58], different incident angles, and radar calibration for forest change detection. Image regression method was applied to reduce observed errors for better image rationing operation. The proposed absolute threshold provided a high confidence level of 99.38% for mapping the forest change. In general, the statistical data of the ratio images indicated the level of forest change, which also matched the statistical parameters of the annual radar vegetation index. The results of forest area change in Chongming island were consistent with the facts. These facts were the implementation of Shanghai government policies that increased the forest area from 2016 to 2018 [39,40,41,42], and the erosion of the river under the special ecological environment of the Yangtze River estuary, which led to the reduction of forests.
There are some limitations of this study for quantifying forest change on Chongming island using Sentinel-1 data, as highlighted by dual polarization data for the derivation of radar vegetation index and lack of on-site measurements ground truth data for validation.
Future work should involve using quad polarization data, such as RADARSAT-2 data in a fully polarimetric mode, to improve the accuracy of radar vegetation index. Due to that, this initial study was not comprehensive enough to fully investigate correlations between radar vegetation index and Landsat 8 vegetation index over Chongming eco-island. In addition, in situ observations data should also be collected to further improve the evaluation of forest change area estimation.
Author Contributions
Conceptualization, Z.X. and Y.W.; methodology, Z.X.; writing and revisions, Z.X. and Y.W. All authors have read and agreed to the published version of the manuscript.
Funding
This research was funded by the National Natural Science Foundation of China grant number 61801247 and 42005100, and the Natural Science Foundation of Jiangsu Province of China grant number BK20180945.
Acknowledgments
The authors wish to extend our profound gratitude to the editors of Remote Sensing, for inviting us to submit this research article. The authors also sincerely appreciate that the ESA provided free and full open-access Sentinel data, USGS for Landsat 8 data, and Google company provided the Google Earth Engine. Z.H. Xu would like to thank his father Yuming Xu for helping him take care of his new little prince baby and cooking for him during this research. Finally, we greatly appreciate all six anonymous reviewers and the academic editor as anonymous co-authors for their invaluable, detailed, and informative suggestions and comments, which significantly contributed to the quality of this article.
Conflicts of Interest
The authors declare no conflict of interest.
Abbreviations
The following abbreviations are used in this manuscript:
| RGB | Red Green Blue |
| SAR | Synthetic Aperture Radar |
| RVI | Radar Vegetation Index |
| EVI | Enhanced Vegetation Index |
| NDVI | Normalized Difference Vegetation Index |
| GEE | Google Earth Engine |
References
- Yau, K.K.Y.; Loke, A.Y. Effects of forest bathing on pre-hypertensive and hypertensive adults: A review of the literature. Environ. Health Prev. Med. 2020, 25, 1–17. [Google Scholar] [CrossRef] [PubMed]
- Mansour, S.; Al-Awhadi, T.; Al-Hatrushi, S. Geospatial based multi-criteria analysis for ecotourism land suitability using GIS & AHP: A case study of Masirah Island, Oman. J. Ecotourism 2020, 19, 148–167. [Google Scholar]
- Ceccherini, G.; Duveiller, G.; Grassi, G.; Lemoine, G.; Avitabile, V.; Pilli, R.; Cescatti, A. Abrupt increase in harvested forest area over Europe after 2015. Nature 2020, 583, 72–77. [Google Scholar] [CrossRef] [PubMed]
- Chang, I.C.C.; Sheppard, E. China’s eco-cities as variegated urban sustainability: Dongtan eco-city and Chongming eco-island. J. Urban Technol. 2013, 20, 57–75. [Google Scholar] [CrossRef]
- Government of Chongming District. Chongming Eco-Island Construction Outline (2010–2020)—Overall Strategy for Chongming Eco-Island Construction. 2010. Available online: http://www.shcm.gov.cn/cmmh_web/html/eng_cmzf/Eng_cmzf_cmzf_fzjh/2010-12-21/Detail_1454578.htm (accessed on 30 July 2020).
- Government of Chongming District. Chongming Eco-Island Construction Outline (2010–2020): Actions of Chongming Eco-Island Construction. 2010. Available online: http://www.shcm.gov.cn/cmmh_web/html/eng_cmzf/Eng_cmzf_cmzf_fzjh/2010-12-21/Detail_1454580.htm (accessed on 30 July 2020).
- Government of Chongming District. Master Plan and General Land-Use Plan of Chonging District, Shanghai, 2017–2035. 2017. Available online: http://www.shcm.gov.cn/cmmh_web/HTML/shcm/SHCM_ZJCM_PLANN/List/mobile/index.html (accessed on 30 July 2020).
- Carle, J.; Holmgren, P. Definitions related to planted forests. In Proceedings of the UNFF Intercessional Expert Meeting on the Role of Planted Forests in Sustainable Forest Management, Wellington, New Zealand, 25–27 March 2003; pp. 329–343. [Google Scholar]
- Caporale, F.; Mateo-Martín, J.; Usman, M.F.; Smith-Hall, C. Plant-Based Sustainable Development—The Expansion and Anatomy of the Medicinal Plant Secondary Processing Sector in Nepal. Sustainability 2020, 12, 5575. [Google Scholar] [CrossRef]
- Marogel-Popa, T.; Marcu, M.V.; Borz, S.A. Postural Risk in Manual Planting Operations of Poplar: Two Options Compared. Sustainability 2020, 12, 5531. [Google Scholar] [CrossRef]
- Ghosh, S.; Ali, S.; Bandopadhyaya, P. Sustainable biodiversity in natural V/s man-made forest of West Bengal: An assessment. Excell. Int. J. Educ. Res. 2014, 2, 759–768. [Google Scholar]
- Sheng, R.; Lin, T. Evolutionary Assessment of the Ecological Governance under the Metropolitan Background: Evidence from Chongming Eco-Island, Shanghai, China. Sustainability 2019, 11, 5327. [Google Scholar] [CrossRef] [Green Version]
- Katzir, R. Chongming Island ecological conservation project. J. Geogr. Reg. Plan. 2008, 1, 001–003. [Google Scholar]
- Ma, X.; De Jong, M.; Den Hartog, H. Assessing the implementation of the Chongming Eco Island policy: What a broad planning evaluation framework tells more than technocratic indicator systems. J. Clean. Prod. 2018, 172, 872–886. [Google Scholar] [CrossRef]
- Wu, S.; Chen, R.; Meadows, M.E. Evolution of an Estuarine Island in the Anthropocene: Complex Dynamics of Chongming Island, Shanghai, PR China. Sustainability 2019, 11, 6921. [Google Scholar] [CrossRef] [Green Version]
- Sun, B.; Ma, X.; de Jong, M.; Bao, X. Assessment on Island Ecological Vulnerability to Urbanization: A Tale of Chongming Island, China. Sustainability 2019, 11, 2536. [Google Scholar] [CrossRef] [Green Version]
- Li, X.; Zhou, Y.; Zhang, L.; Kuang, R. Shoreline change of Chongming Dongtan and response to river sediment load: A remote sensing assessment. J. Hydrol. 2014, 511, 432–442. [Google Scholar] [CrossRef]
- Shen, G.; Ibrahim, A.N.; Wang, Z.; Ma, C.; Gong, J. Spatial–temporal land-use/land-cover dynamics and their impacts on surface temperature in Chongming Island of Shanghai, China. Int. J. Remote Sens. 2015, 36, 4037–4053. [Google Scholar] [CrossRef]
- He, Y.; Wang, P.; Sheng, H.; Wang, D.; Huang, M.; Cao, C. Sustainability of riparian zones for non-point source pollution control in Chongming Island: Status, challenges, and perspectives. J. Clean. Prod. 2020, 244, 118804. [Google Scholar] [CrossRef]
- Xue, R.; Wang, S.; Li, D.; Zou, Z.; Chan, K.L.; Valks, P.; Saiz-Lopez, A.; Zhou, B. Spatio-temporal variations in NO2 and SO2 over Shanghai and Chongming Eco-Island measured by Ozone Monitoring Instrument (OMI) during 2008–2017. J. Clean. Prod. 2020, 258, 120563. [Google Scholar] [CrossRef]
- Wagner, F.H.; Dalagnol, R.; Tagle Casapia, X.; Streher, A.S.; Phillips, O.L.; Gloor, E.; Aragão, L.E. Regional mapping and spatial distribution analysis of canopy palms in an amazon forest using deep learning and VHR images. Remote Sens. 2020, 12, 2225. [Google Scholar] [CrossRef]
- Sanchez, A.H.; Picoli, M.C.A.; Camara, G.; Andrade, P.R.; Chaves, M.E.D.; Lechler, S.; Soares, A.R.; Marujo, R.F.; Simões, R.E.O.; Ferreira, K.R.; et al. Comparison of Cloud Cover Detection Algorithms on Sentinel–2 Images of the Amazon Tropical Forest. Remote Sens. 2020, 12, 1284. [Google Scholar] [CrossRef] [Green Version]
- Shen, G.; Ibrahim Abdoul, N.; Zhu, Y.; Wang, Z.; Gong, J. Remote sensing of urban growth and landscape pattern changes in response to the expansion of Chongming Island in Shanghai, China. Geocarto Int. 2017, 32, 488–502. [Google Scholar] [CrossRef]
- Podest, E.; McDonald, K.C.; Kimball, J.S. Multisensor microwave sensitivity to freeze/thaw dynamics across a complex boreal landscape. IEEE Trans. Geosci. Remote Sens. 2014, 52, 6818–6828. [Google Scholar] [CrossRef]
- Avtar, R.; Suzuki, R.; Sawada, H. Natural forest biomass estimation based on plantation information using PALSAR data. PLoS ONE 2014, 9, e86121. [Google Scholar] [CrossRef]
- Rodriguez-Alvarez, N.; Podest, E.; Jensen, K.; McDonald, K.C. Classifying inundation in a tropical wetlands complex with GNSS-R. Remote Sens. 2019, 11, 1053. [Google Scholar] [CrossRef] [Green Version]
- Torres, R.; Snoeij, P.; Geudtner, D.; Bibby, D.; Davidson, M.; Attema, E.; Potin, P.; Rommen, B.; Floury, N.; Brown, M.; et al. GMES Sentinel-1 mission. Remote Sens. Environ. 2012, 120, 9–24. [Google Scholar] [CrossRef]
- Hansen, J.N.; Mitchard, E.T.; King, S. Assessing Forest/Non-Forest Separability Using Sentinel-1 C-Band Synthetic Aperture Radar. Remote Sens. 2020, 12, 1899. [Google Scholar] [CrossRef]
- Gulácsi, A.; Kovács, F. Sentinel-1-Imagery-Based High-Resolution Water Cover Detection on Wetlands, Aided by Google Earth Engine. Remote Sens. 2020, 12, 1614. [Google Scholar] [CrossRef]
- Van Tricht, K.; Gobin, A.; Gilliams, S.; Piccard, I. Synergistic use of radar Sentinel-1 and optical Sentinel-2 imagery for crop mapping: A case study for Belgium. Remote Sens. 2018, 10, 1642. [Google Scholar] [CrossRef] [Green Version]
- Agapiou, A. Estimating Proportion of Vegetation Cover at the Vicinity of Archaeological Sites Using Sentinel-1 and-2 Data, Supplemented by Crowdsourced OpenStreetMap Geodata. Appl. Sci. 2020, 10, 4764. [Google Scholar] [CrossRef]
- Heckel, K.; Urban, M.; Schratz, P.; Mahecha, M.D.; Schmullius, C. Predicting Forest Cover in Distinct Ecosystems: The Potential of Multi-Source Sentinel-1 and-2 Data Fusion. Remote Sens. 2020, 12, 302. [Google Scholar] [CrossRef] [Green Version]
- Hirschmugl, M.; Deutscher, J.; Sobe, C.; Bouvet, A.; Mermoz, S.; Schardt, M. Use of SAR and Optical Time Series for Tropical Forest Disturbance Mapping. Remote Sens. 2020, 12, 727. [Google Scholar] [CrossRef] [Green Version]
- Niculescu, S.; Boissonnat, J.B.; Lardeux, C.; Roberts, D.; Hanganu, J.; Billey, A.; Constantinescu, A.; Doroftei, M. Synergy of High-Resolution Radar and Optical Images Satellite for Identification and Mapping of Wetland Macrophytes on the Danube Delta. Remote Sens. 2020, 12, 2188. [Google Scholar] [CrossRef]
- Mahdianpari, M.; Salehi, B.; Mohammadimanesh, F.; Homayouni, S.; Gill, E. The first wetland inventory map of newfoundland at a spatial resolution of 10 m using sentinel-1 and sentinel-2 data on the google earth engine cloud computing platform. Remote Sens. 2019, 11, 43. [Google Scholar] [CrossRef] [Green Version]
- LaRocque, A.; Phiri, C.; Leblon, B.; Pirotti, F.; Connor, K.; Hanson, A. Wetland Mapping with Landsat 8 OLI, Sentinel-1, ALOS-1 PALSAR, and LiDAR Data in Southern New Brunswick, Canada. Remote Sens. 2020, 12, 2095. [Google Scholar] [CrossRef]
- Musthafa, M.; Khati, U.; Singh, G. Sensitivity of PolSAR decomposition to forest disturbance and regrowth dynamics in a managed forest. Adv. Space Res. 2020, 66, 1863–1875. [Google Scholar] [CrossRef]
- Akhtar, A.M.; Qazi, W.A.; Ahmad, S.R.; Gilani, H.; Mahmood, S.A.; Rasool, A. Integration of high-resolution optical and SAR satellite remote sensing datasets for aboveground biomass estimation in subtropical pine forest, Pakistan. Environ. Monit. Assess. 2020, 192, 1–17. [Google Scholar] [CrossRef]
- Chongming Statistical Bureau. Chongming Statistical Yearbook 2018. 2019. Available online: https://www.yearbookchina.com/navibooklist-n3020020216-1.html (accessed on 30 July 2020).
- Chongming Statistical Bureau. Chongming Statistical Yearbook 2015. 2016. Available online: https://www.yearbookchina.com/navibooklist-n3018111127-1.html (accessed on 30 July 2020).
- Chongming Statistical Bureau. Chongming Statistical Yearbook 2016. 2017. Available online: https://www.yearbookchina.com/navibooklist-n3018111126-1.html (accessed on 30 July 2020).
- Chongming Statistical Bureau. Chongming Statistical Yearbook 2017. 2018. Available online: https://www.yearbookchina.com/navibooklist-n3018111125-1.html (accessed on 30 July 2020).
- Ulaby, F.; Long, D. Microwave Radar and Radiometric Remote Sensing; Artech House: Boston, MA, USA, 2015. [Google Scholar]
- Kim, Y.; van Zyl, J.J. A time-series approach to estimate soil moisture using polarimetric radar data. IEEE Trans. Geosci. Remote Sens. 2009, 47, 2519–2527. [Google Scholar]
- Adler, R.F.; Huffman, G.J.; Chang, A.; Ferraro, R.; Xie, P.P.; Janowiak, J.; Rudolf, B.; Schneider, U.; Curtis, S.; Bolvin, D.; et al. The version-2 global precipitation climatology project (GPCP) monthly precipitation analysis (1979–present). J. Hydrometeorol. 2003, 4, 1147–1167. [Google Scholar] [CrossRef]
- Huffman, G.J.; Bolvin, D.T.; Braithwaite, D.; Hsu, K.; Joyce, R.; Xie, P.; Yoo, S.H. NASA global precipitation measurement (GPM) integrated multi-satellite retrievals for GPM (IMERG). Algorithm Theor. Basis Doc. (ATBD) Version 2015, 4, 26. [Google Scholar]
- Gorelick, N.; Hancher, M.; Dixon, M.; Ilyushchenko, S.; Thau, D.; Moore, R. Google Earth Engine: Planetary-scale geospatial analysis for everyone. Remote Sens. Environ. 2017, 202, 18–27. [Google Scholar] [CrossRef]
- Google. Google Earth Engine Sentinel-1 Algorithms. Available online: https://developers.google.com/earth-engine/sentinel1 (accessed on 30 July 2020).
- Cruz, A.F.; Almeida, G.M.d.; Wadt, P.G.S.; Pires, M.d.C.; Ramos, M.L.G. Seasonal Variation of Plant Mineral Nutrition in Fruit Trees. Braz. Arch. Biol. Technol. 2019, 62, e19180340. [Google Scholar] [CrossRef]
- Xu, Z.; Li, H.C.; Shi, Q.; Wang, H.; Wei, M.; Shi, J.; Shao, Y. Effect Analysis and Spectral Weighting Optimization of Sidelobe Reduction on SAR Image Understanding. IEEE J. Sel. Top. Appl. Earth Obs. Remote Sens. 2019, 12, 3434–3444. [Google Scholar] [CrossRef]
- Canty, M.J.; Nielsen, A.A.; Skriver, H.; Conradsen, K. Wishart-based adaptive temporal filtering of polarimetric SAR imagery. Remote Sens. 2020, 12, 2454. [Google Scholar] [CrossRef]
- Xu, Z.; Shi, Q.; Chen, Y.; Feng, W.; Shao, Y.; Sun, L.; Huang, X. Non-stationary speckle reduction in high resolution SAR images. Digit. Signal Process. 2018, 73, 72–82. [Google Scholar] [CrossRef]
- Lee, J.S.; Wen, J.H.; Ainsworth, T.L.; Chen, K.S.; Chen, A.J. Improved sigma filter for speckle filtering of SAR imagery. IEEE Trans. Geosci. Remote Sens. 2009, 47, 202–213. [Google Scholar]
- Chander, G.; Markham, B.L.; Helder, D.L. Summary of current radiometric calibration coefficients for Landsat MSS, TM, ETM+, and EO-1 ALI sensors. Remote Sens. Environ. 2009, 113, 893–903. [Google Scholar] [CrossRef]
- Huete, A.; Didan, K.; Miura, T.; Rodriguez, E.P.; Gao, X.; Ferreira, L.G. Overview of the radiometric and biophysical performance of the MODIS vegetation indices. Remote Sens. Environ. 2002, 83, 195–213. [Google Scholar] [CrossRef]
- Shanghai Forestry Bureau. 2016–2018 Shanghai Ecological Corridor Construction Project Implementation Management Measures; Shanghai Landscaping and City Appearance Administrative Bureau: Shanghai, China, 2016. Available online: http://lhsr.sh.gov.cn/lh1/20200616/08d3a777e6bf4d4898ac4b8b397ae902.html (accessed on 30 July 2020).
- Shanghai Municipal Agricultural Rural Committee. Chongming Plans to Add 70,000 Acres of Forest Land within Five Years to Create an Ecological Corridor of “One Town, One Tree” So That the People Can Share the Achievements of Ecological Island Construction; Shanghai Municipal Agricultural Rural Committee: Shanghai, China, 2016; Available online: http://obridge.eastday.com/shjs/node5/node34/u1ai100034.html (accessed on 30 July 2020).
- Molijn, R.A.; Iannini, L.; López Dekker, P.; Magalhães, P.S.; Hanssen, R.F. Vegetation characterization through the use of precipitation-affected SAR signals. Remote Sens. 2018, 10, 1647. [Google Scholar] [CrossRef] [Green Version]
- Otsu, N. A threshold selection method from gray-level histograms. IEEE Trans. Syst. Man Cybern. 1979, 9, 62–66. [Google Scholar] [CrossRef] [Green Version]
- Kapur, J.N.; Sahoo, P.K.; Wong, A.K. A new method for gray-level picture thresholding using the entropy of the histogram. Comput. Vis. Graph. Image Process. 1985, 29, 273–285. [Google Scholar] [CrossRef]
- Kittler, J.; Illingworth, J. On threshold selection using clustering criteria. IEEE Trans. Syst. Man Cybern. 1985, SMC-15, 652–655. [Google Scholar] [CrossRef]
Figure 1.
This figure shows Chongming eco-island and all three strictly protected forest-based eco-tourism areas that were chosen for quantifying forest change in the island. The detailed locations used for quantitative research are labeled with red polygons, namely Dongtan National Wetland Park, Xisha National Wetland Park, and Dongping National Forest Park.

Figure 2.
Metasequoias planted in wetland and forest park in Chongming island.

Figure 3.
Radar principal backscattering responses in forests [43]: (1) Scattering from trunk to ground (T2G) and from ground to trunk (G2T); (2) scattering from canopy to ground (C2G) and from ground to canopy (G2C); (3) canopy volume scattering (C2C); (4) direct scattering from ground (G2G); and (5) direct scattering from tree trunks (T2T).

Figure 4.
Temporal variations of rainfall rate and vegetation index for Chongming island in the period of 2015–2019. Here, enhanced vegetation index (EVI) is used for the vegetation cover data derived from Landsat 8. The precipitation data are sourced from Tropical Rainfall Measuring Mission (TRMM) 3B43 rainfall products [45,46].

Figure 5.
This figure shows the definition of the threshold in the distribution of a ratio image for detecting forest change.
Figure 5.
This figure shows the definition of the threshold in the distribution of a ratio image for detecting forest change.

Figure 6.
Flowchart of the forest change mapping steps applied to Sentinel-1 synthetic aperture radar (SAR) data.The data pre-processing step had been conducted by Google. The other steps were performed in the Google Earth Engine (GEE) platform. Reproducible code information for this work has been provided in the Supplementary Materials.

Figure 7.
VH multi-temporal surface reflectance composites for Chongming island. RGB:2015/2016/ 2017 denotes the combinations of VH image bands from 2015 to 2017. Specifically, 2015, 2016, and 2017 represent the channels of R, G, and B, respectively.
Figure 7.
VH multi-temporal surface reflectance composites for Chongming island. RGB:2015/2016/ 2017 denotes the combinations of VH image bands from 2015 to 2017. Specifically, 2015, 2016, and 2017 represent the channels of R, G, and B, respectively.

Figure 8.
This figure shows radar vegetation index retrieved by Sentinel-1 SAR data for indicating the forest growth level of Chongming island from 2015 to 2019.
Figure 8.
This figure shows radar vegetation index retrieved by Sentinel-1 SAR data for indicating the forest growth level of Chongming island from 2015 to 2019.


Figure 9.
This figure shows the distribution of the radar vegetation index (RVI) on the different study sites with statistical parameters. These sites are well known and strictly protected forest areas. The different distributions in the same study region indicate forest area change.
Figure 9.
This figure shows the distribution of the radar vegetation index (RVI) on the different study sites with statistical parameters. These sites are well known and strictly protected forest areas. The different distributions in the same study region indicate forest area change.

Figure 10.
This figure shows the distributions of the ratio images with statistical parameters using VH band from 2015 to 2019. As the time series SAR images are in logarithmic scale, subtraction was performed for image rationing, producing negative or positive mean . A positive mean value can used to indicate an increase in forest area, and vice versa. 2015∼2016 denotes that the image rationing are performed on the two images collected from 2015 and 2016, respectively.

Figure 11.
This figure shows the area of the forest change over three strictly portered forest regions from 2015 to 2019. The three famous forest parks are highlighted with polygonal white edges. Regions in the green mask indicate the increase of forest area. Regions in the red mask indicate the decrease of forest area.

Figure 12.
One of the subjective evaluations of the credibility of the fine forest change methods proposed in this paper. Optical images collected by Sentinel 2 have the same spatial resolution with SAR data.
Figure 12.
One of the subjective evaluations of the credibility of the fine forest change methods proposed in this paper. Optical images collected by Sentinel 2 have the same spatial resolution with SAR data.

Figure 13.
Linear regression lines with red color between radar vegetation index calculated from SAR and the vegetation index (reference) data in 2019. The spaces between the two green lines are the 95% prediction interval.
Figure 13.
Linear regression lines with red color between radar vegetation index calculated from SAR and the vegetation index (reference) data in 2019. The spaces between the two green lines are the 95% prediction interval.

Figure 14.
Available VV and VH data from 2015 to 2019 for Chongming island.

Figure 15.
Comparisons of ratio image.


Table 1.
Forest change of Chongming island from 2015–2018. These data are sourced from the Chongming Statistical Yearbook published by the Chongming Statistical Bureau [39,40,41,42]. It is worth noting that at the time of this paper’s completion, the Chongming Statistics Bureau had not yet released the 2019 data.
| Year | ||||
|---|---|---|---|---|
| 2015 | 2016 | 2017 | 2018 | |
| Area afforested (ha) | 490 | 1382 | 1278 | 2712 |
| Number of trees planted | 156,000 | 170,200 | 158,600 | 816,900 |
| Bamboo forest area (ha) | 953 | 893 | 824 | 885 |
Table 2.
Details of images used in this study.
| Year | Image Acquisition | ||
|---|---|---|---|
| Sentinel 1 | Sentinel 2 | Landsat 8 | |
| 2015 | 8 July, 1 August. | 8 August. | 26 June, 4 July, 12 July, 20 July, 28 July, 5 August, 13 August. |
| 2016 | 26 July, 19 August. | 23 June, 30 June, 3 July, 10 July, 13 July, 20 July, 23 July, 30 July, 2 August, 9 August, 12 August, 19 August. | 25 June, 3 July, 11 July, 19 July, 27 July, 4 August, 12 August. |
| 2017 | 27 June, 9 July, 21 July, 2 August, 14 August. | 25 June, 28 June, 30 June, 3 July, 5 July, 10 July, 13 July,18 July, 20 July, 23 July, 25 July, 28 July, 30 July, 2 August,4 August, 7 August, 9 August, 12 August, 14 August, 17 August. | 26 June, 7 July, 12 July, 20 July, 28 July, 5 August, 13 August. |
| 2018 | 22 June, 4 July, 16 July, 28 July, 9 August. | 23 June, 25 June, 28 June, 30 June, 3 July, 5 July, 10 July, 13 July, 18 July, 20 July, 23 July, 25 July, 28 July, 30 July, 2 August, 4 August, 7 August, 9 August, 12 August, 14 August, 17 August, 19 August. | 26 June, 4 July, 12 July, 20 July, 28 July, 5 August, 13 August. |
| 2019 | 23 June, 29 June, 5 July, 11 July, 17 July, 23 July, 29 July, 4 August, 10 August, 16 August. | 23 June, 25 June, 28 June, 30 June, 3 July, 5 July, 10 July, 13 July, 18 July, 20 July, 23 July, 25 July, 28 July, 30 July, 2 August, 4 August, 7 August, 9 August, 12 August, 14 August, 17 August, 19 August. | 26 June, 4 July, 12 July, 20 July, 28 July, 5 August, 13 August. |
Table 3.
Reproducible code.
| Code | Corresponding Results |
|---|---|
| 1. ChongmingIslandS2Landsat8 | Table 2; Figure 12. |
| 2. ChongmingIslandRainfallandEVI | Figure 4. |
| 3. ChongmingIslandRVI | Table 2; Figure 7, Figure 8 and Figure 9. |
| 4. ChongmingIslandForestChange | Table 4 and Table 5; Figure 10, Figure 11, Figure 12 and Figure 13 and Figure 15. |
Table 4.
Forest area change in the three strictly protected forest sites. + and − denote the increase and decrease of the forest area, respectively.
Table 4.
Forest area change in the three strictly protected forest sites. + and − denote the increase and decrease of the forest area, respectively.
| Year | Dongping National Forest Park | Dongtan National Wetland Park | Xisha National Wetland Park |
|---|---|---|---|
| 2015–2016 | +1.68 ha | +0.58 ha | +3.43 ha |
| 2016–2017 | +3.13 ha | +1.06 ha | +5.54 ha |
| 2017–2018 | −2.59 ha | −1.35 ha | +4.95 ha |
| 2018–2019 | +2.57 ha | +0.48 ha | +6.27 ha |
Table 5.
Pearson’s linear correlation coefficient for the linear regressions. Sentinel 2 observed the Chongming island only once during the period of 21 June to 20 August 2015 (see Table 2) and the corresponding image contained most of the clouds, therefore the correlation coefficient cannot be determined.
| Year | 2015 | 2016 | 2017 | 2018 | 2019 |
|---|---|---|---|---|---|
| Landsat 8 EVI | 0.2925 | 0.2966 | 0.3223 | 0.3989 | 0.4414 |
| Landsat 8 NDVI | 0.3178 | 0.1778 | 0.3720 | 0.4422 | 0.5049 |
| Sentinel-2 NDVI | NULL | 0.2032 | 0.3215 | 0.5216 | 0.5694 |
Publisher’s Note: MDPI stays neutral with regard to jurisdictional claims in published maps and institutional affiliations. |
© 2020 by the authors. Licensee MDPI, Basel, Switzerland. This article is an open access article distributed under the terms and conditions of the Creative Commons Attribution (CC BY) license (http://creativecommons.org/licenses/by/4.0/).
Share and Cite
MDPI and ACS Style
Xu, Z.; Wang, Y. Radar Satellite Image Time Series Analysis for High-Resolution Mapping of Man-Made Forest Change in Chongming Eco-Island. Remote Sens. 2020, 12, 3438. https://0-doi-org.brum.beds.ac.uk/10.3390/rs12203438
AMA Style
Xu Z, Wang Y. Radar Satellite Image Time Series Analysis for High-Resolution Mapping of Man-Made Forest Change in Chongming Eco-Island. Remote Sensing. 2020; 12(20):3438. https://0-doi-org.brum.beds.ac.uk/10.3390/rs12203438
Chicago/Turabian StyleXu, Zhihuo, and Yuexia Wang. 2020. "Radar Satellite Image Time Series Analysis for High-Resolution Mapping of Man-Made Forest Change in Chongming Eco-Island" Remote Sensing 12, no. 20: 3438. https://0-doi-org.brum.beds.ac.uk/10.3390/rs12203438
Note that from the first issue of 2016, this journal uses article numbers instead of page numbers. See further details here.