UAV-Based LiDAR for High-Throughput Determination of Plant Height and Above-Ground Biomass of the Bioenergy Grass Arundo donax

 ,
,  , and
, and
Abstract
: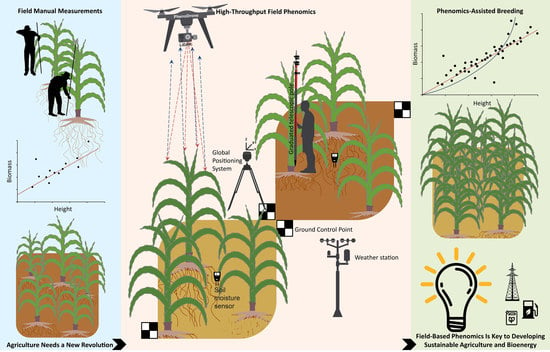
1. Introduction
2. Materials and Methods
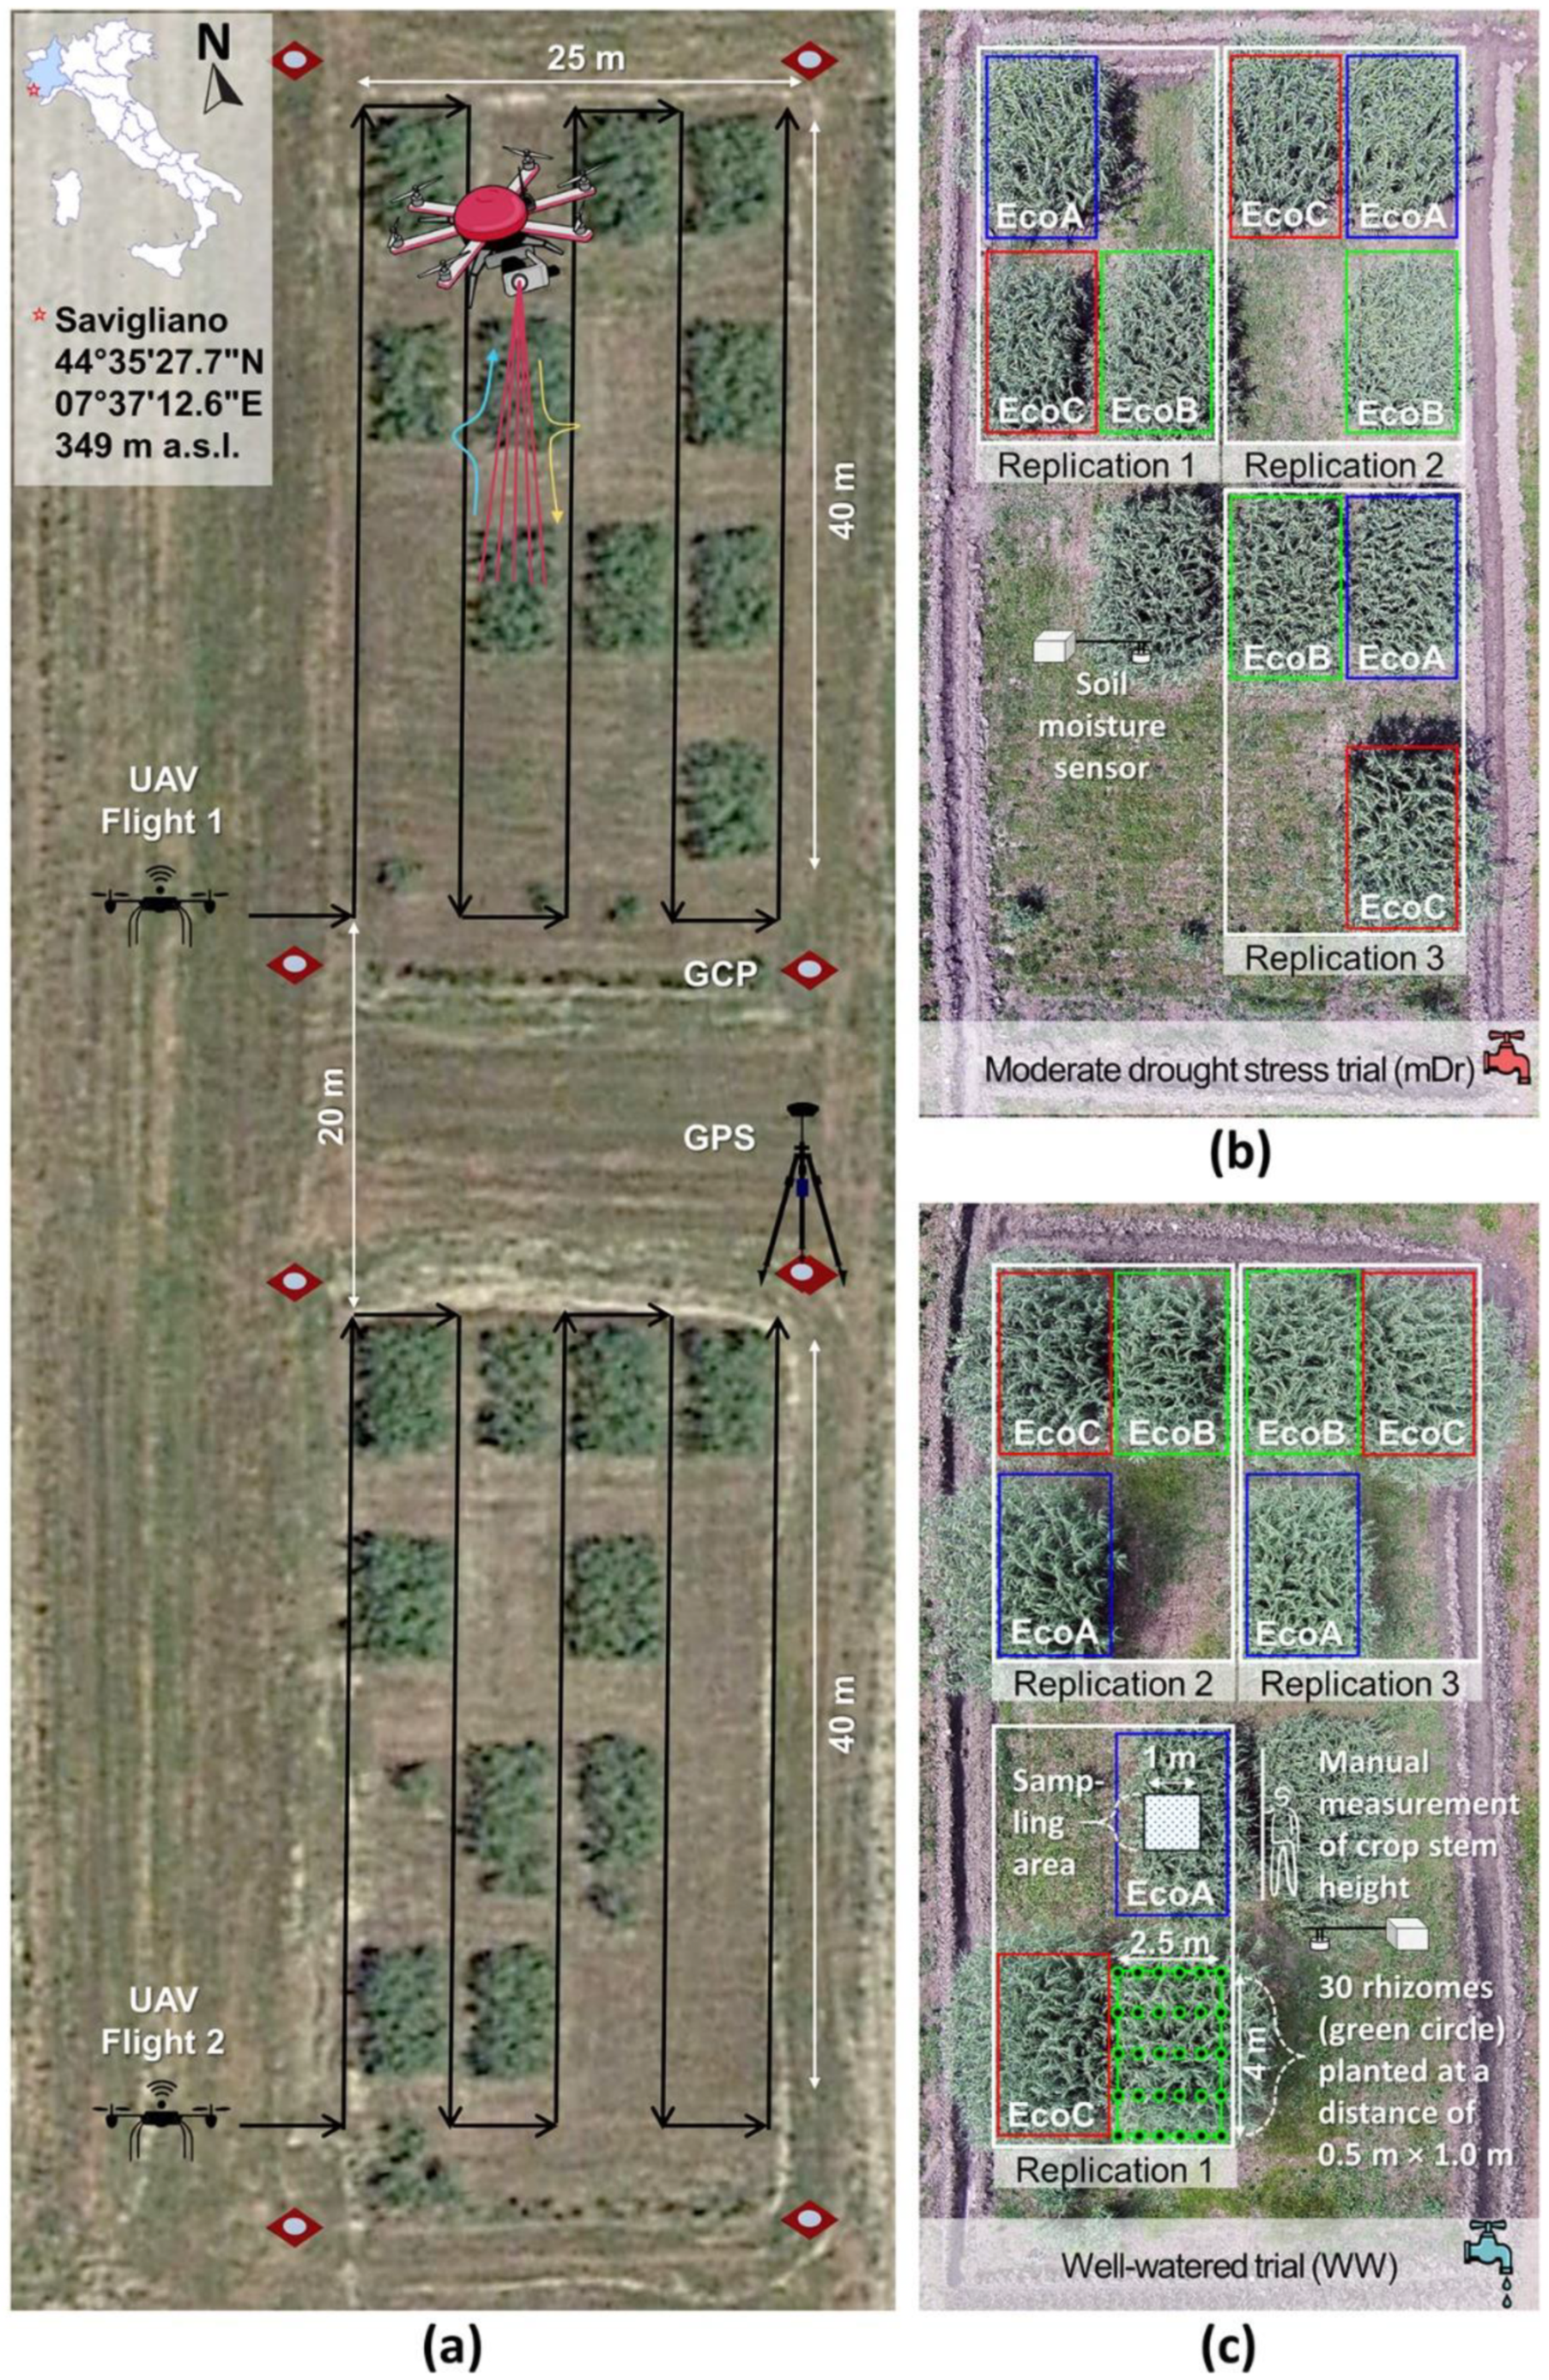
2.1. Experimental Setup
Plant Material and Experimental Design
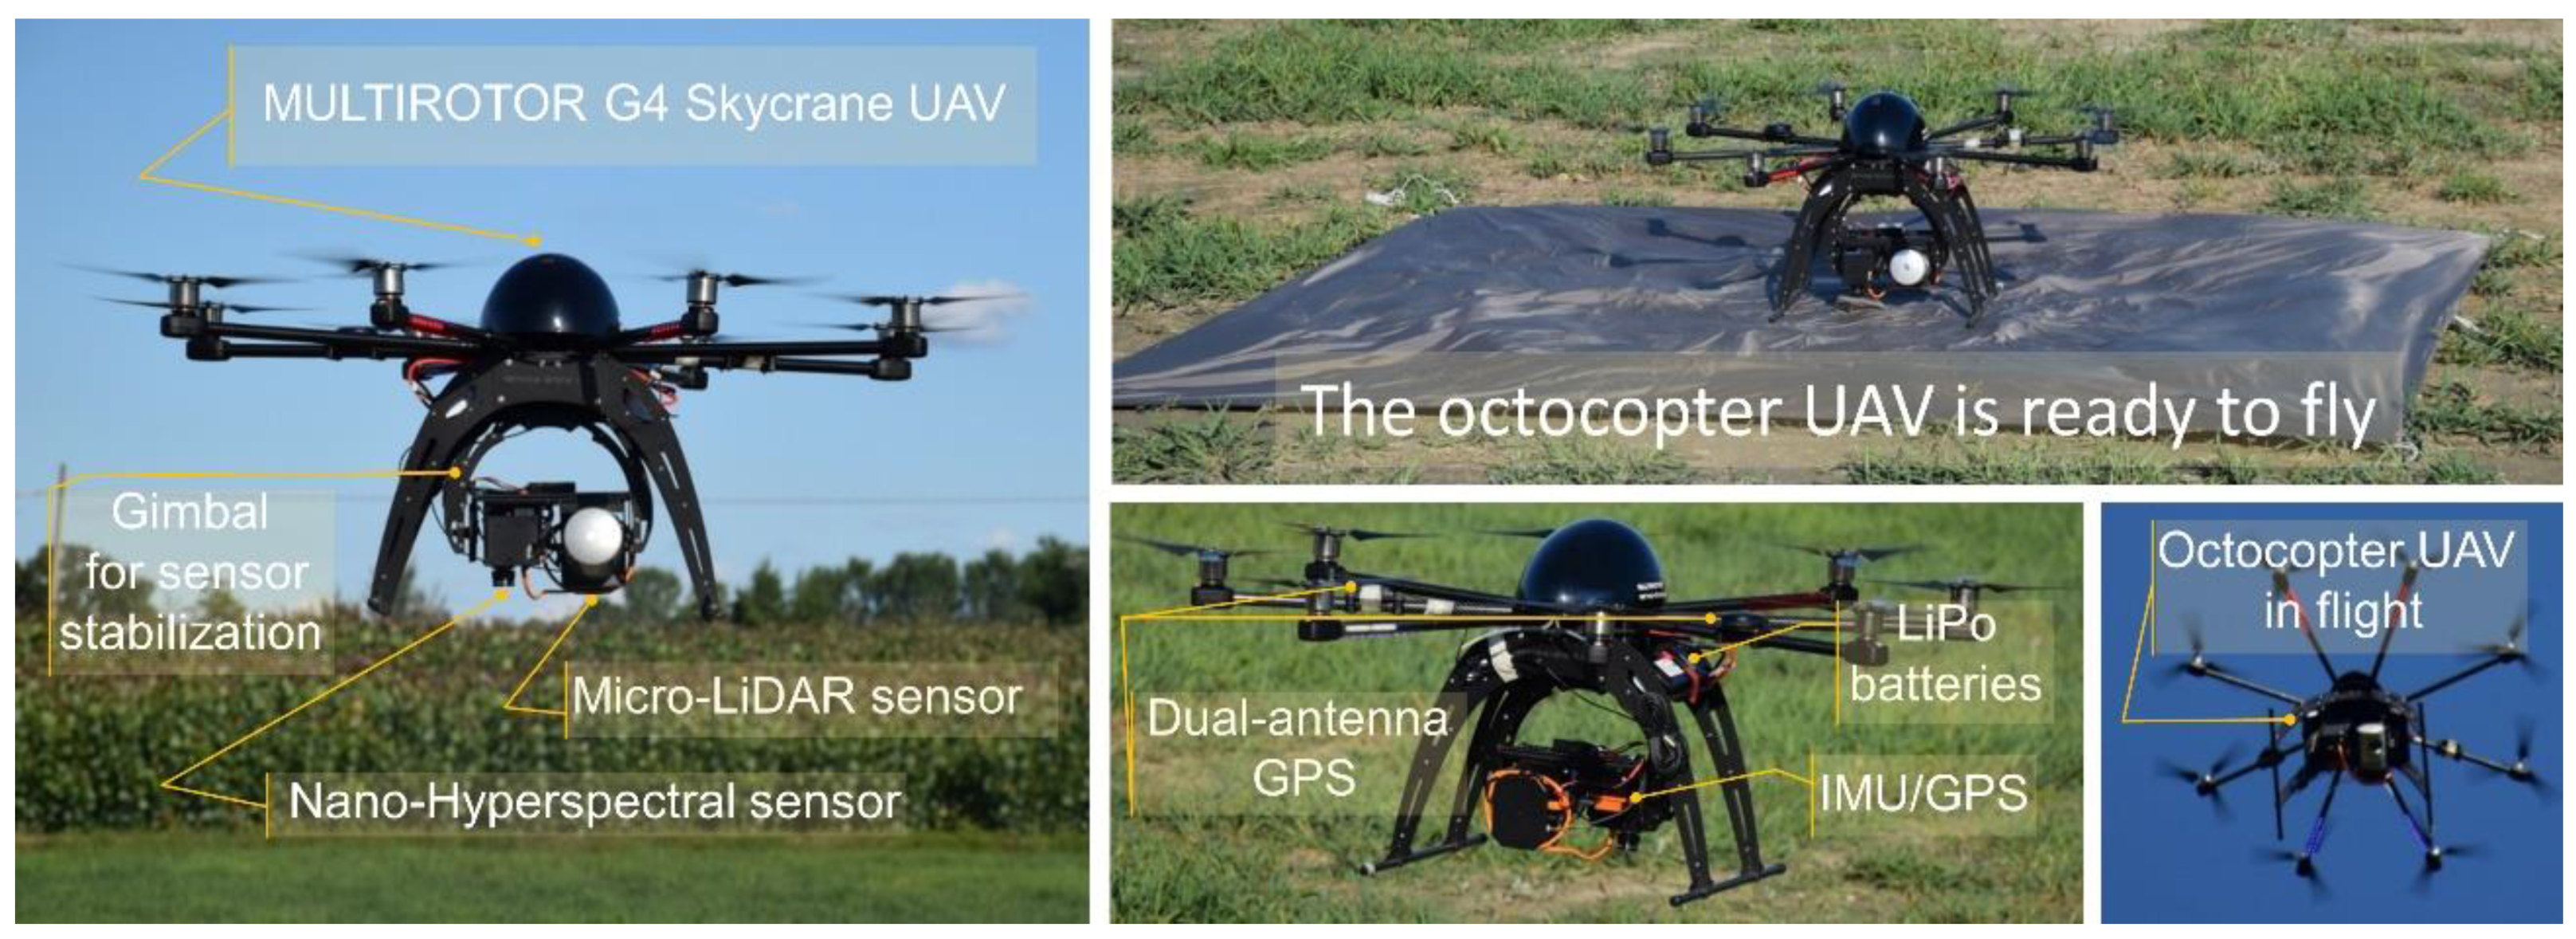
2.2. UAV Phenotyping Platform
2.3. Data Acquisition
2.3.1. UAV-LiDAR Campaign
2.3.2. Plant Height and Biomass Ground Truthing
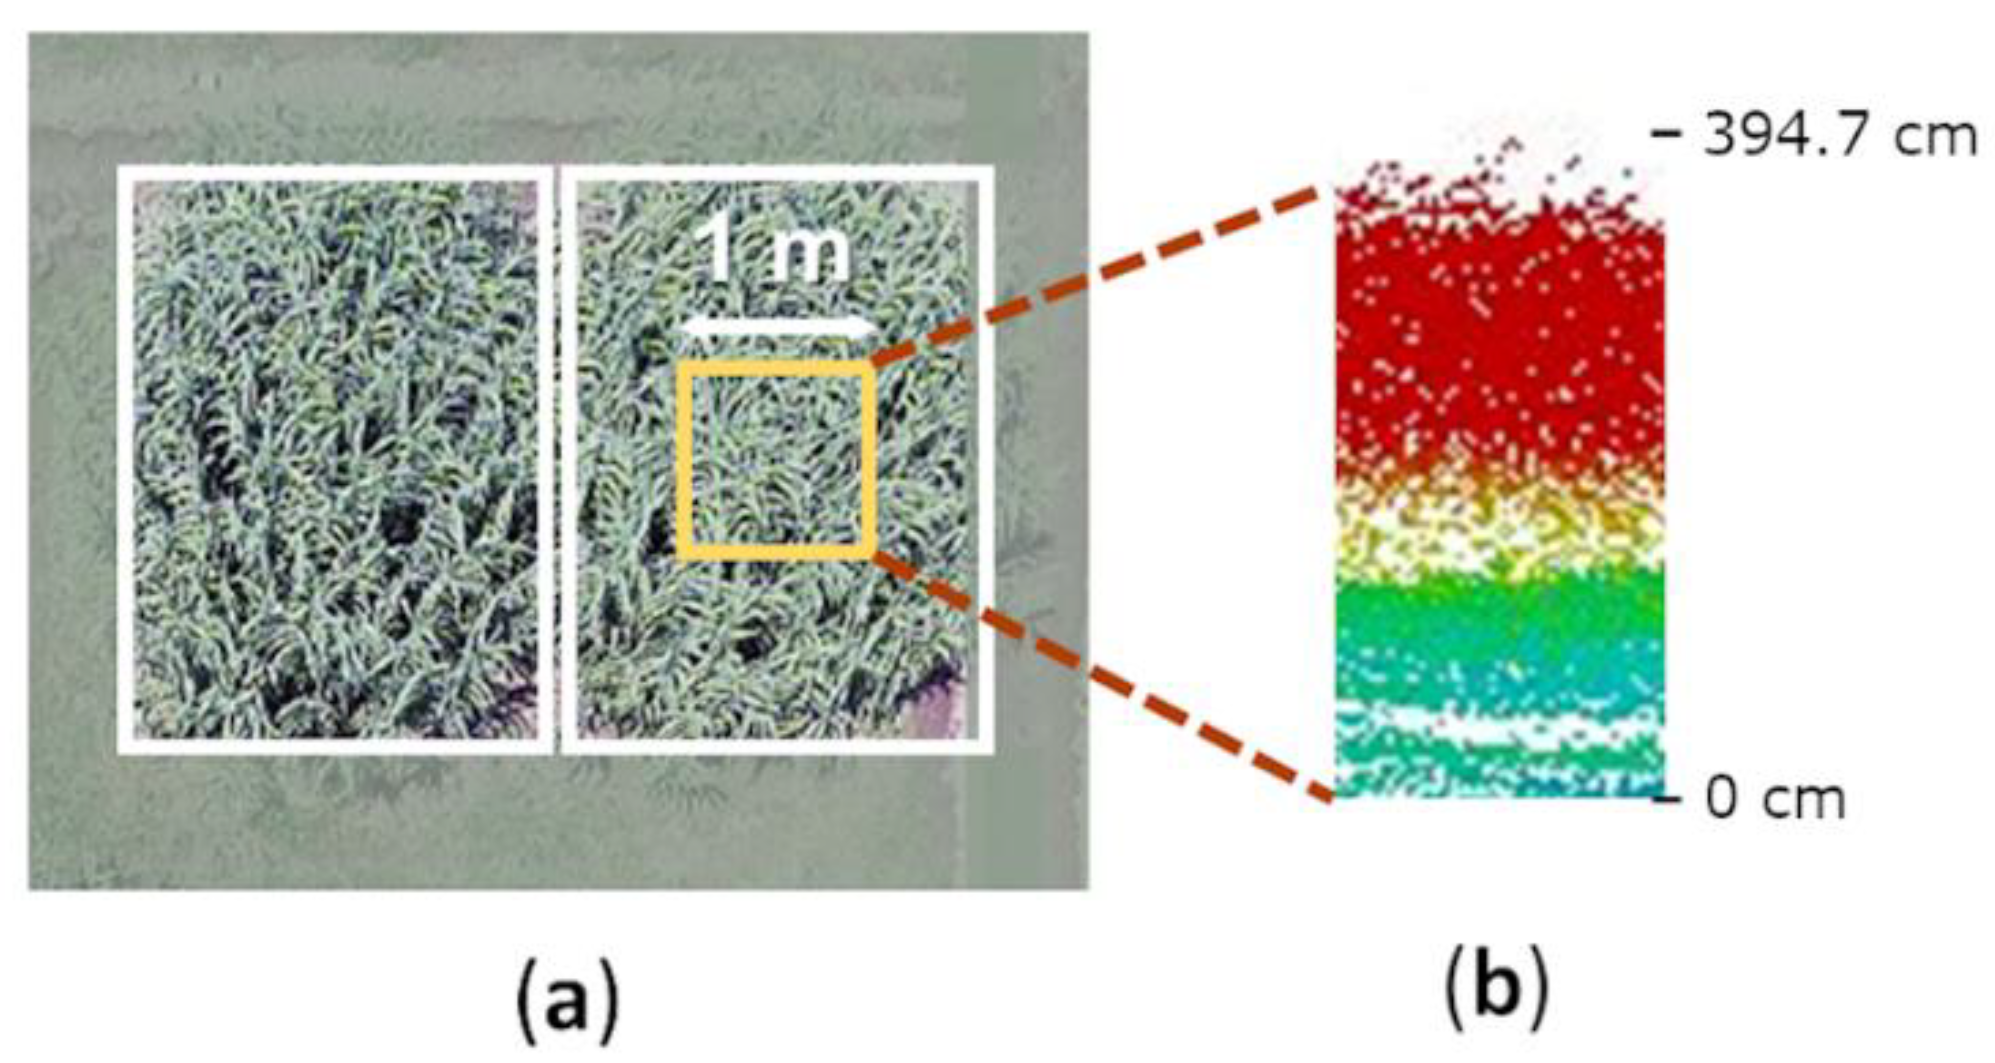
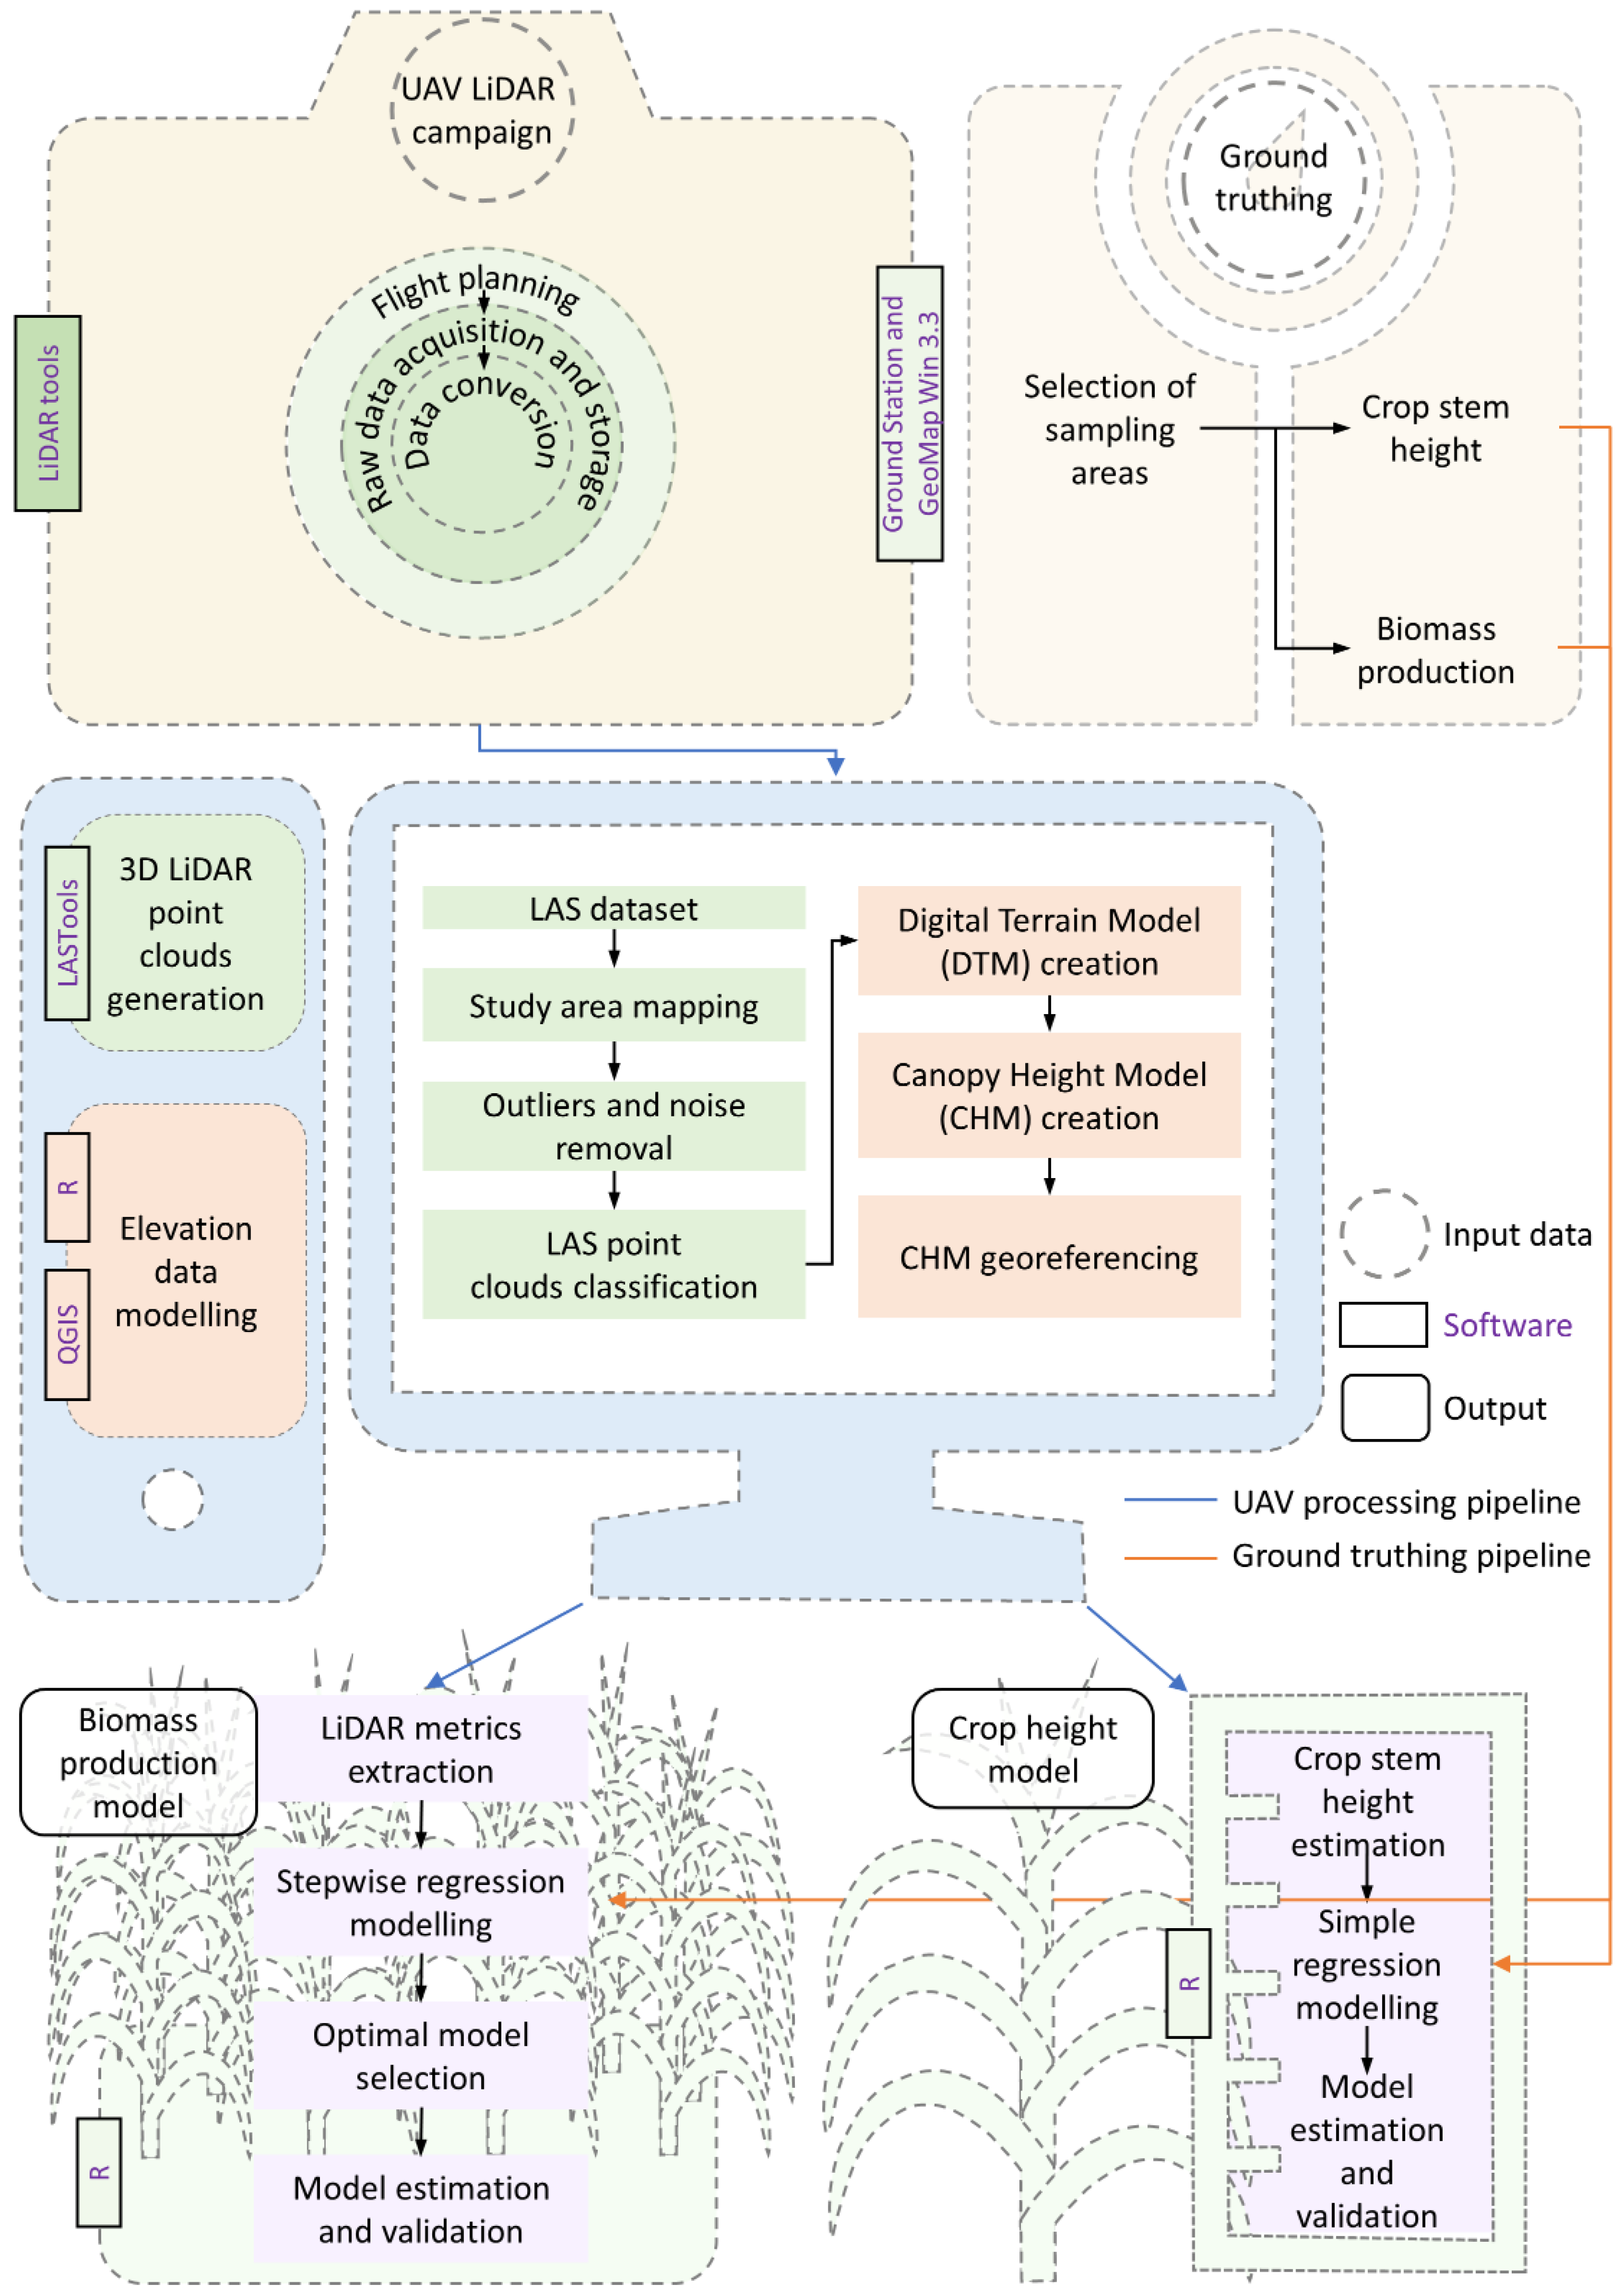
2.4. Data Processing and CHM
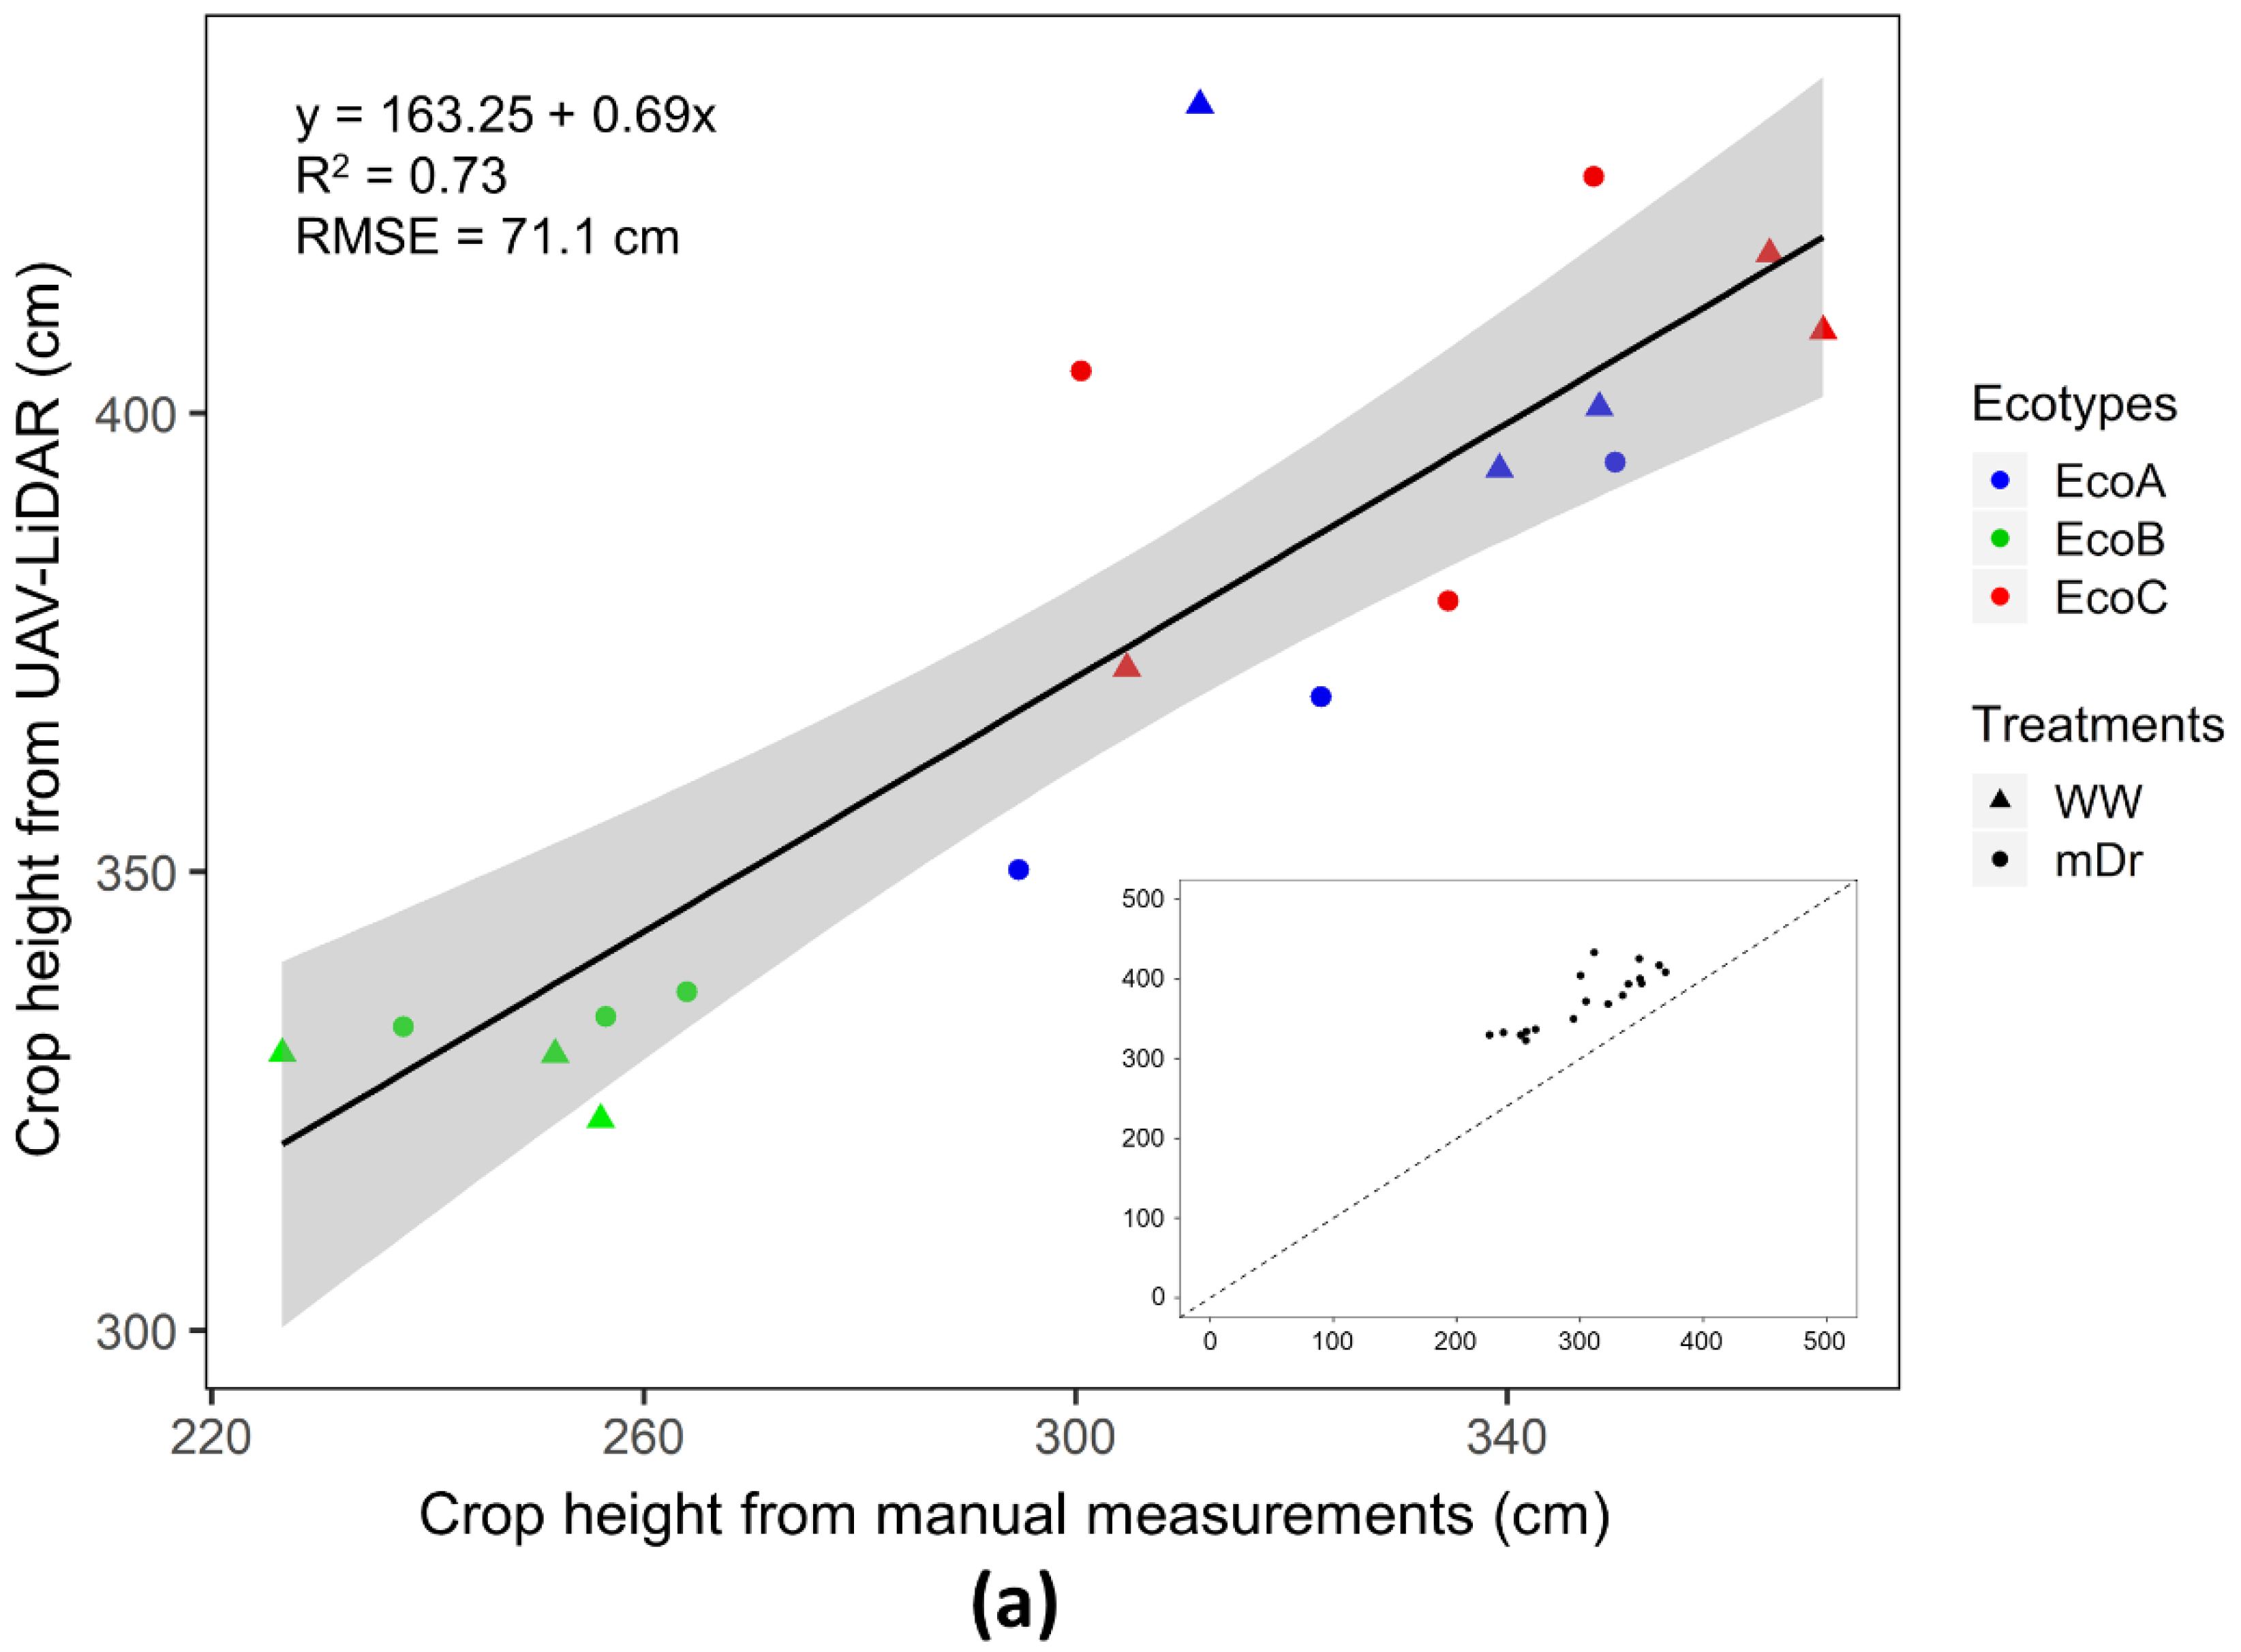
2.5. CHM Validation and AGB Estimation
3. Results
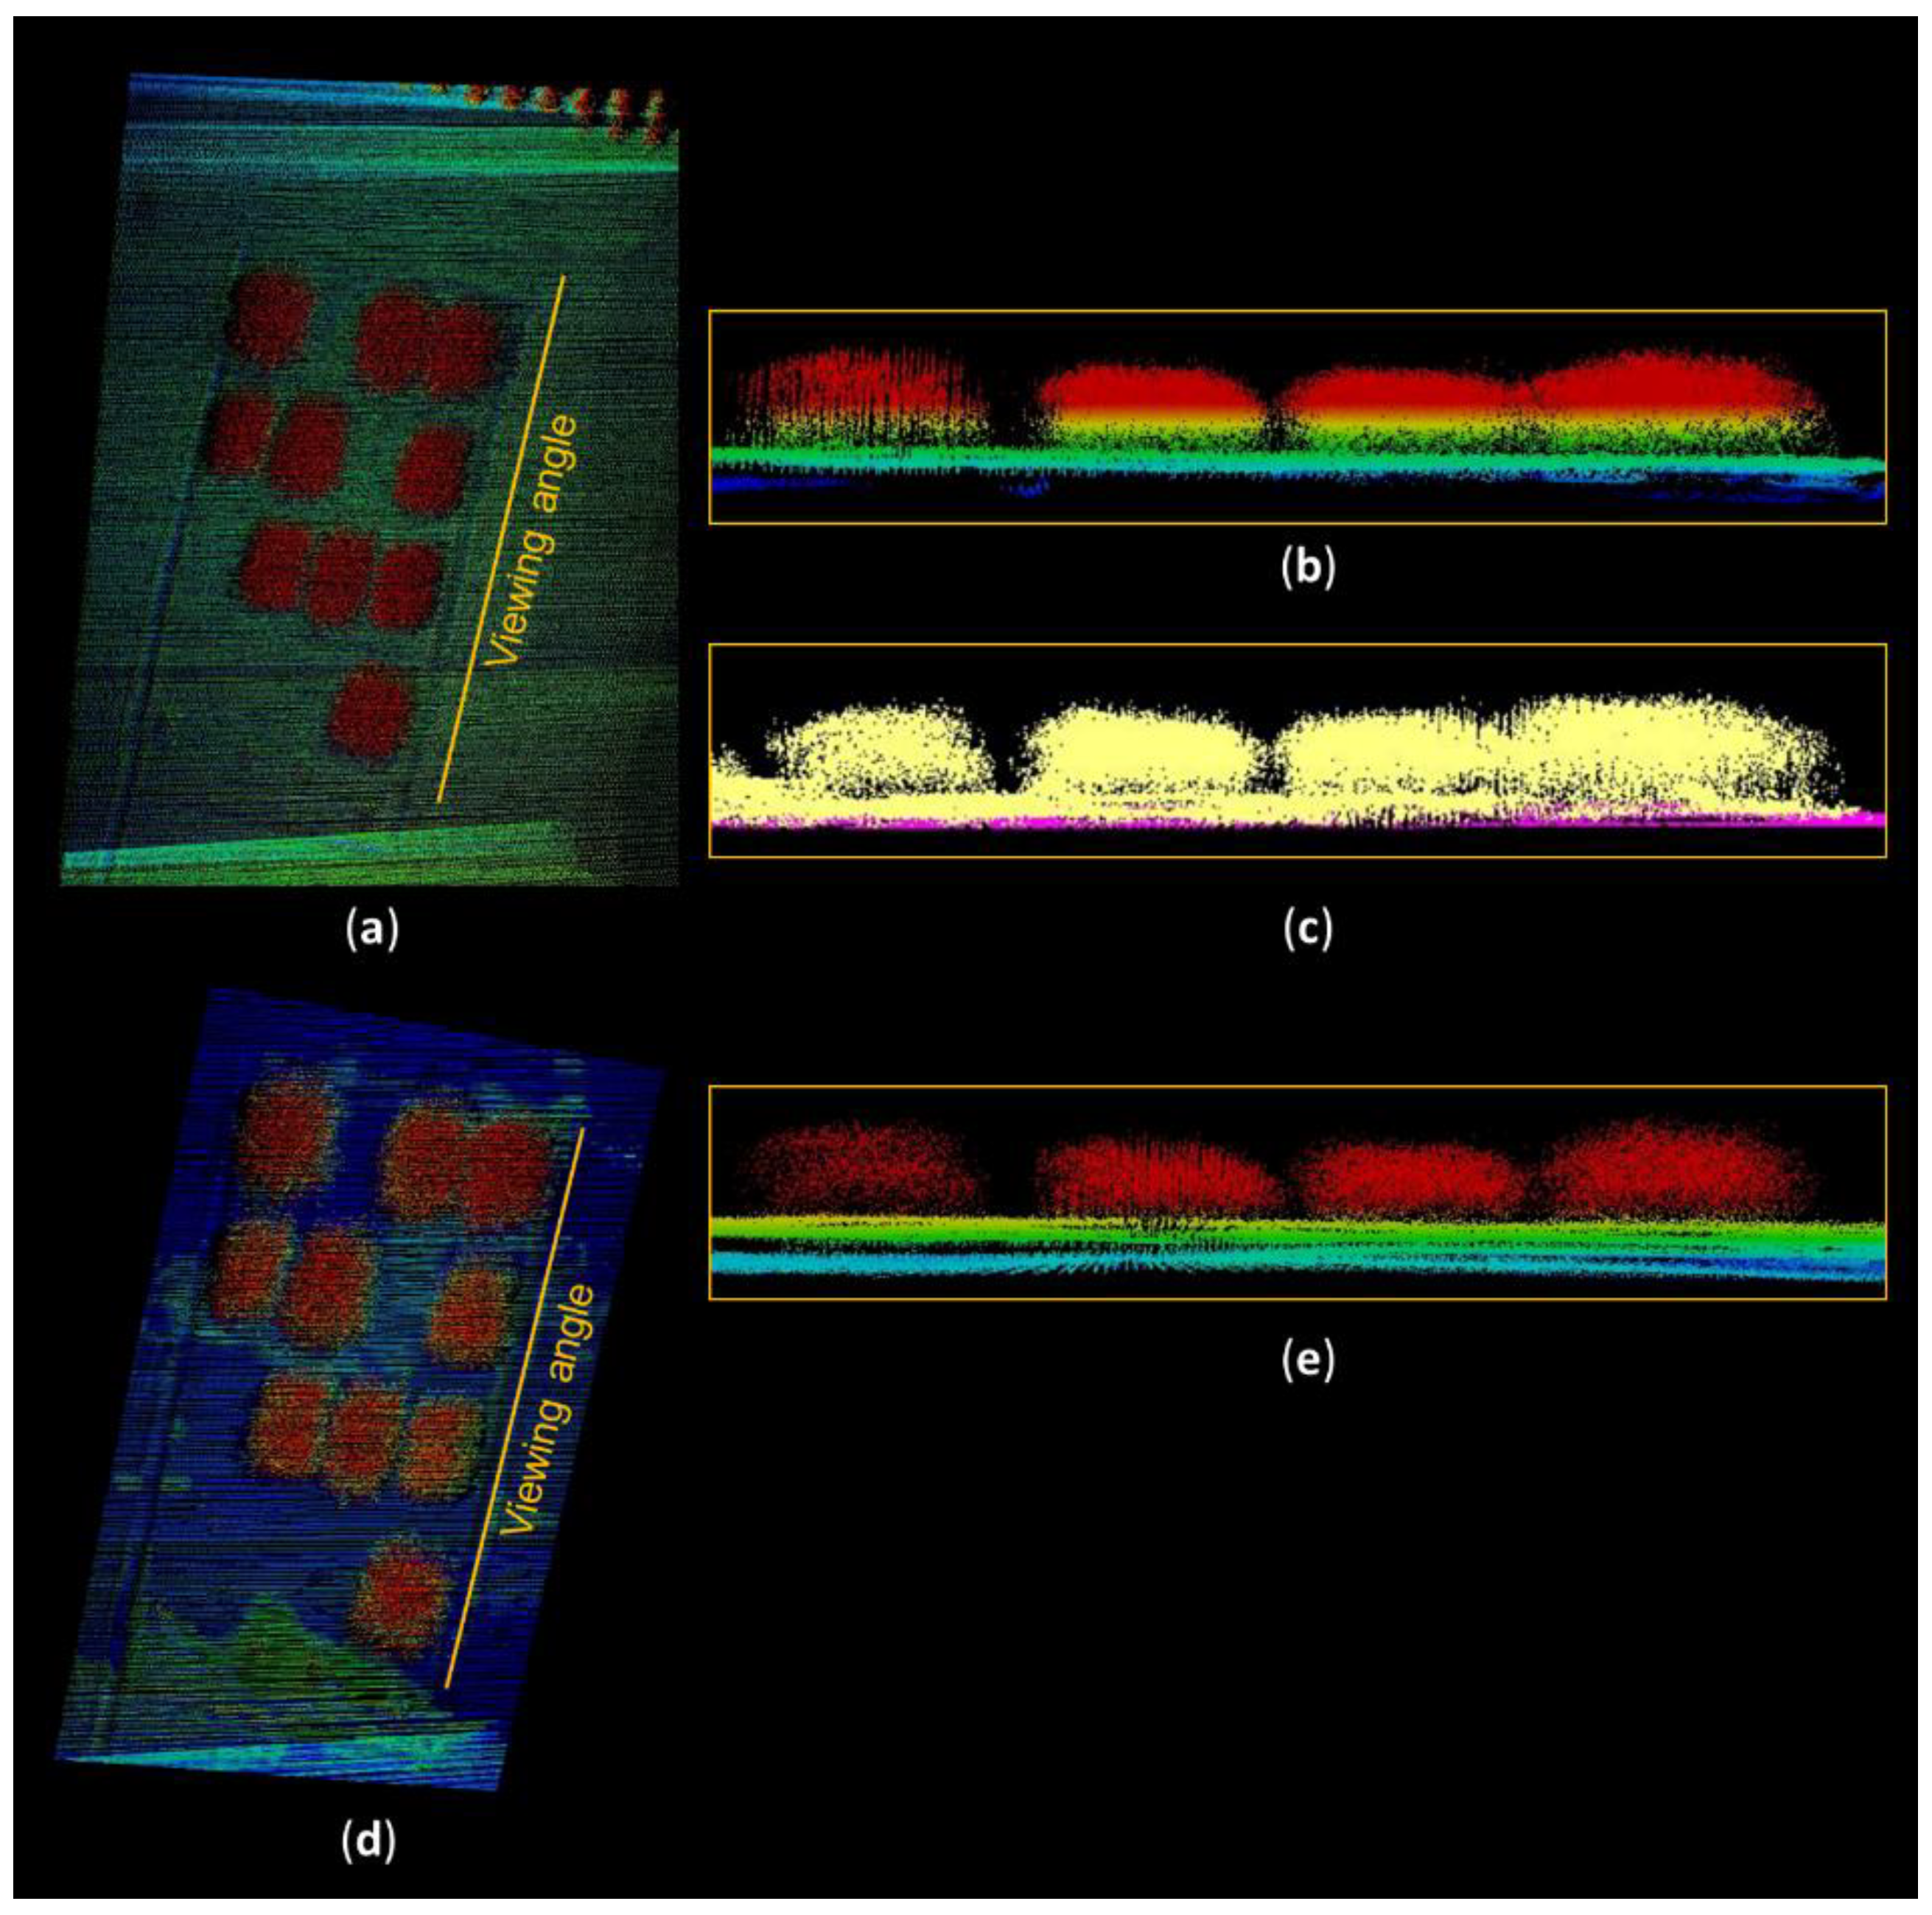
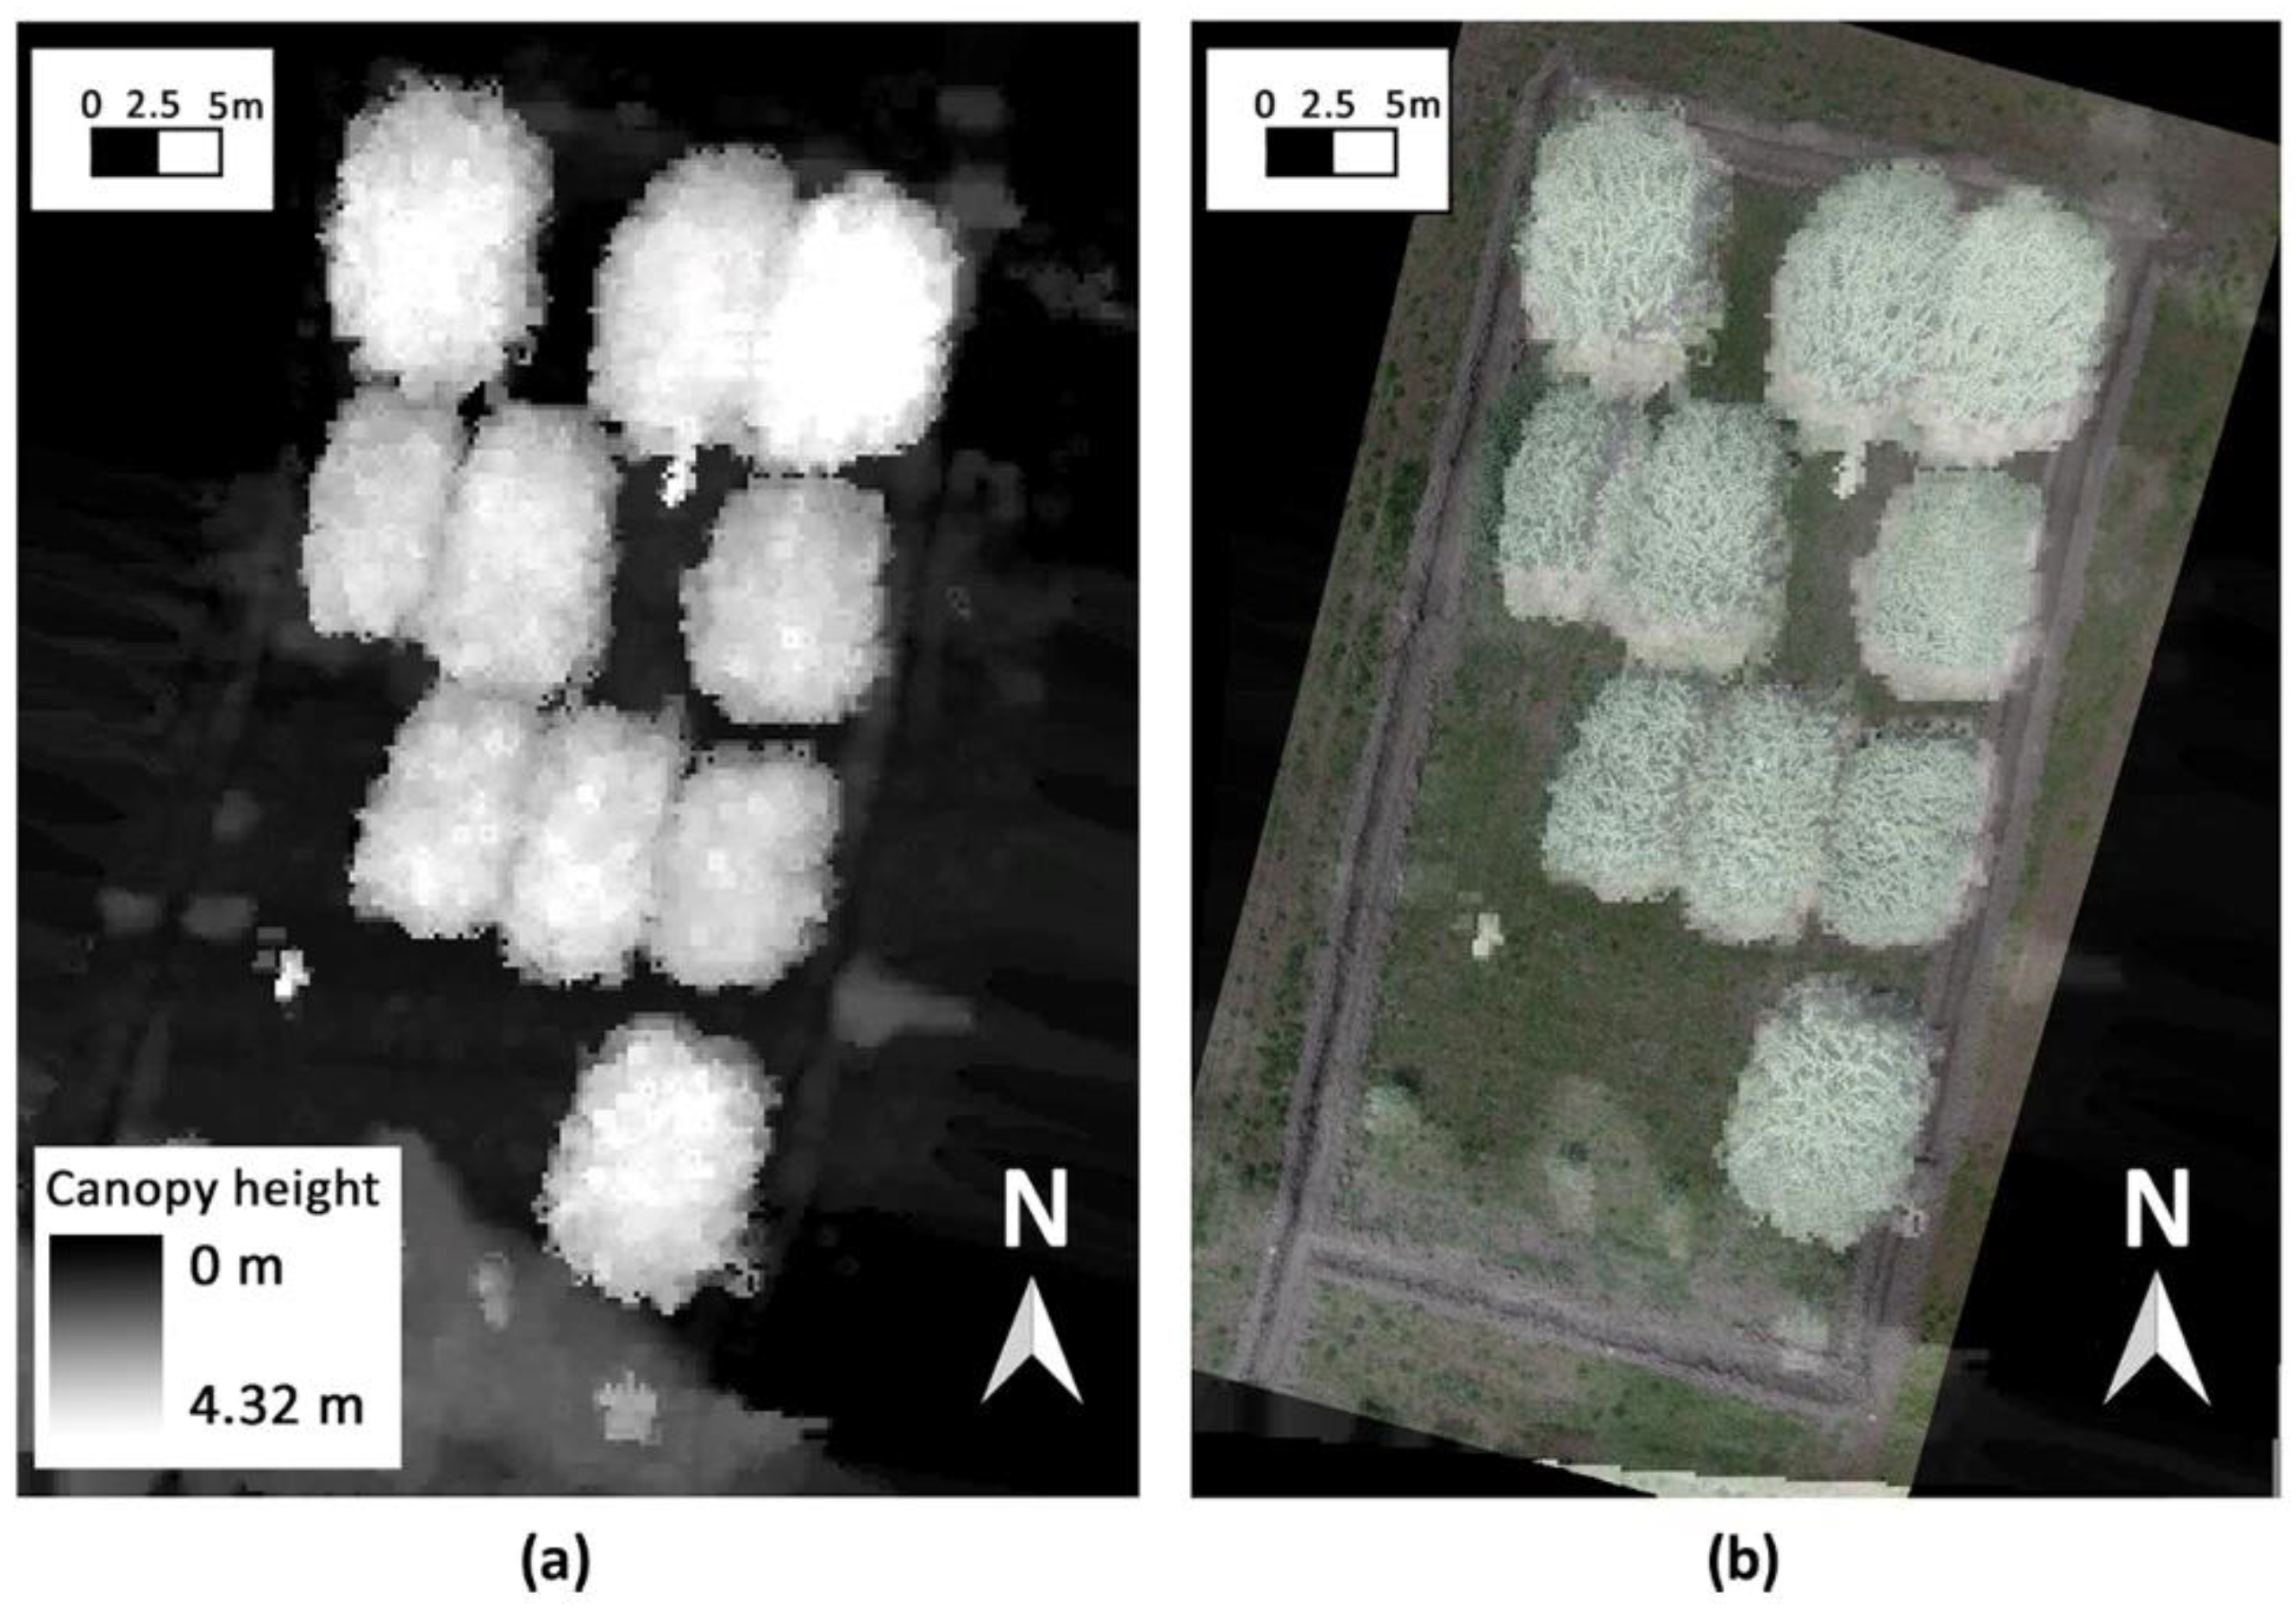
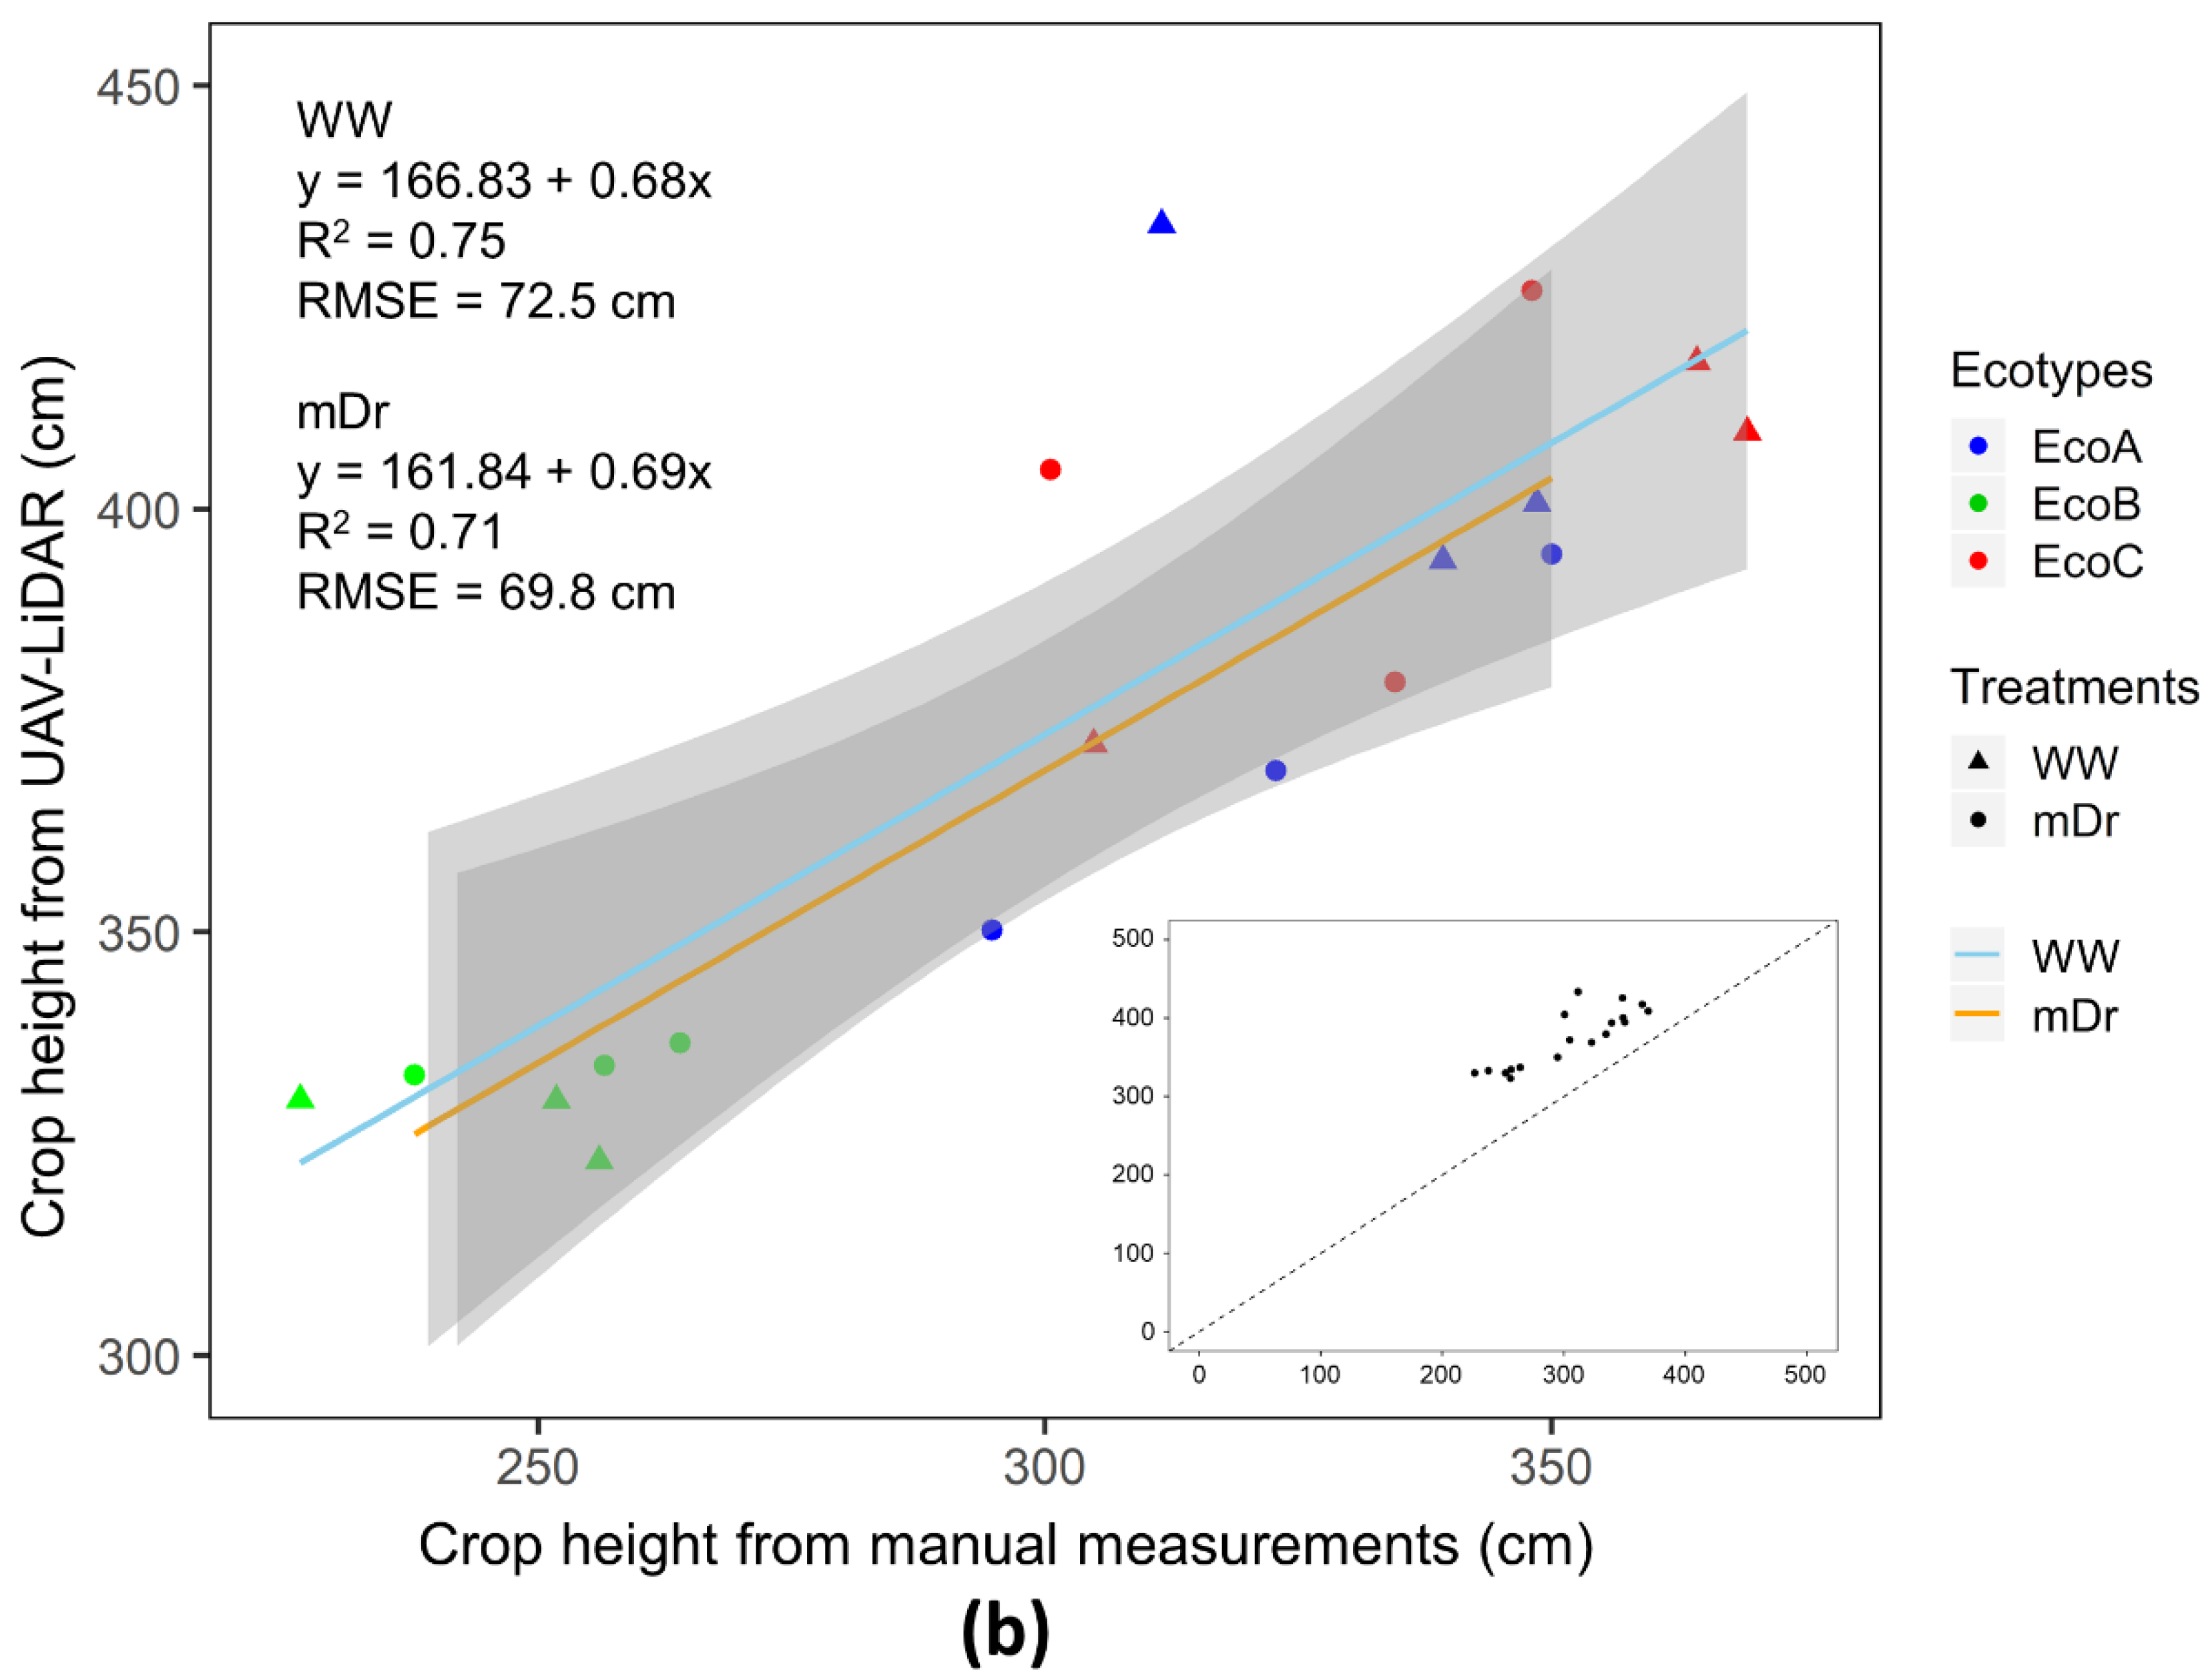
3.1. LiDAR CHM
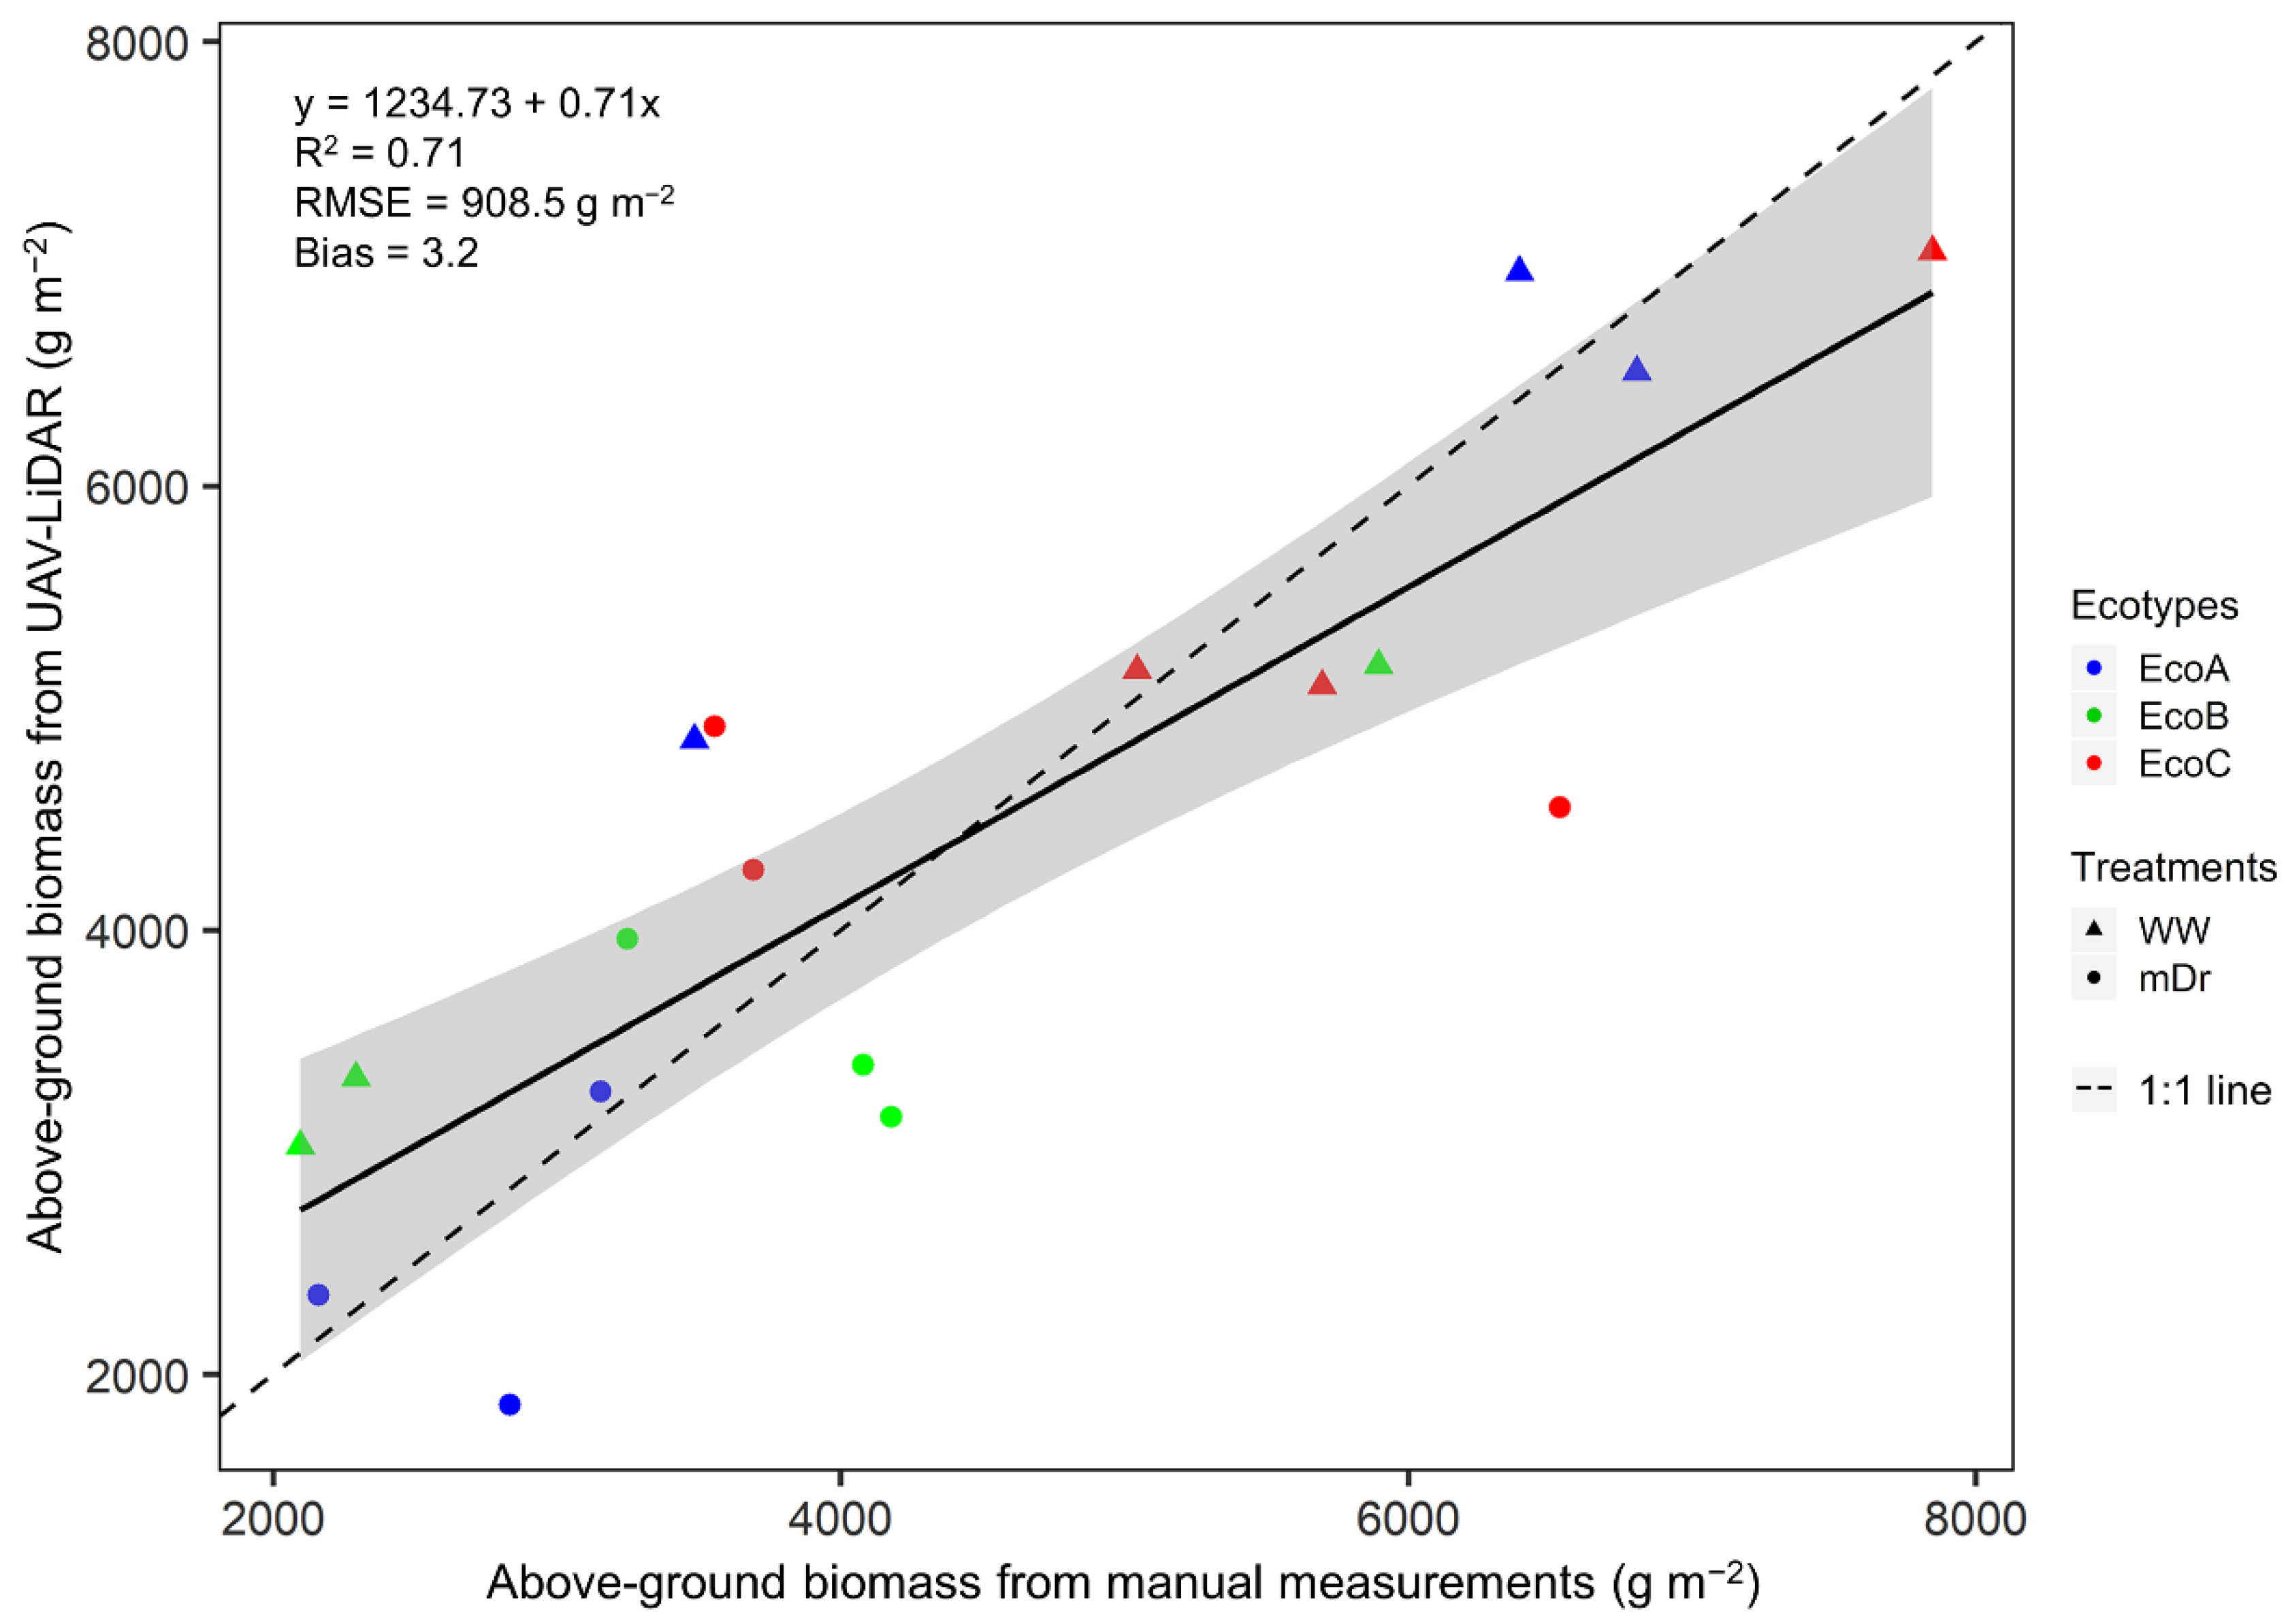
3.2. AGB Estimates Derived from 3D LiDAR Point Clouds
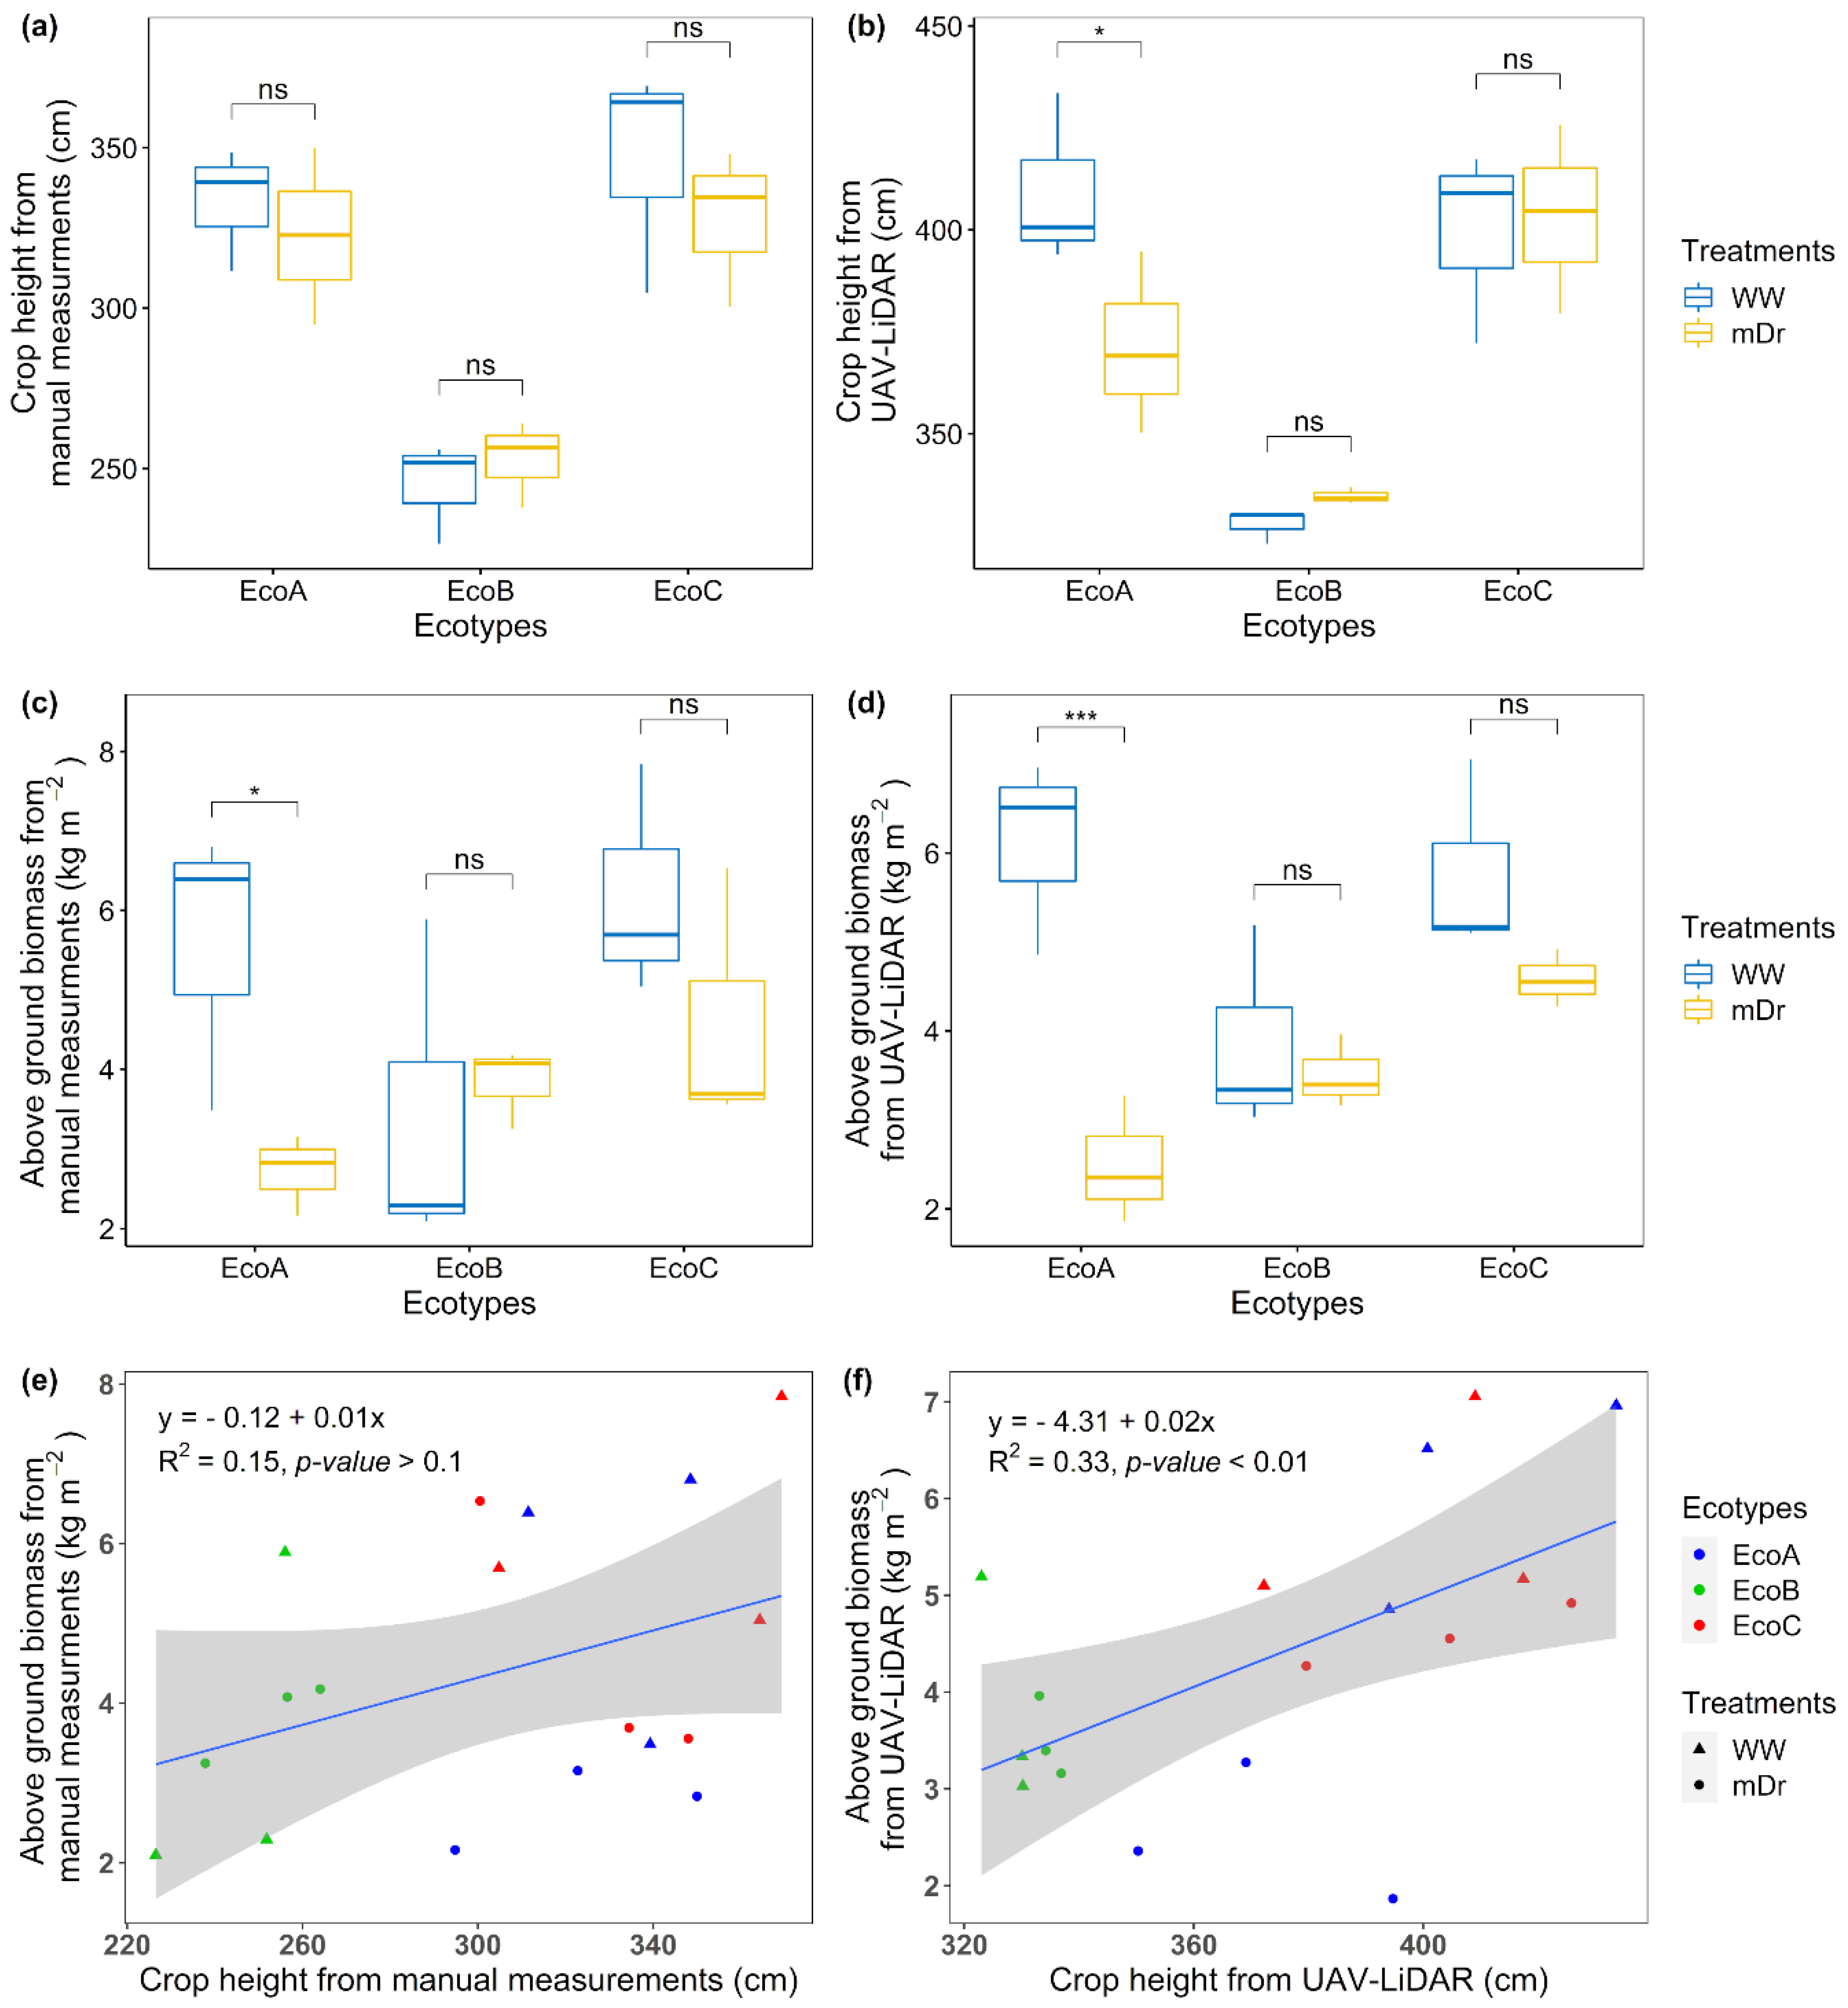
3.3. Heights and Biomass of Three A. donax Crop Ecotypes under Natural Moderate Drought
4. Discussion
4.1. Crop Height Estimation
4.2. AGB Estimation
4.3. Comparison of Ecotypes
4.4. Implications
5. Conclusions
Supplementary Materials
Author Contributions
Funding
Acknowledgments
Conflicts of Interest
References
- Yang, G.; Liu, J.; Zhao, C.; Li, Z.; Huang, Y.; Yu, H.; Xu, B.; Yang, X.; Zhu, D.; Zhang, X.; et al. Unmanned aerial vehicle remote sensing for field-based crop phenotyping: Current status and perspectives. Front. Plant Sci. 2017, 8, 1111. [Google Scholar] [CrossRef]
- Harfouche, A.L.; Jacobson, D.A.; Kainer, D.; Romero, J.C.; Harfouche, A.H.; Scarascia Mugnozza, G.; Moshelion, M.; Tuskan, G.A.; Keurentjes, J.J.B.; Altman, A. Accelerating climate resilient plant breeding by applying next-generation artificial intelligence. Trends Biotechnol. 2019, 37, 1217–1235. [Google Scholar] [CrossRef]
- Ludovisi, R.; Tauro, F.; Salvati, R.; Khoury, S.; Mugnozza, G.S.; Harfouche, A. UAV-based thermal imaging for high-throughput field phenotyping of black poplar response to drought. Front. Plant Sci. 2017, 8, 1681. [Google Scholar] [CrossRef]
- Virlet, N.; Sabermanesh, K.; Sadeghi-Tehran, P.; Hawkesford, M.J. Field scanalyzer: An automated robotic field phenotyping platform for detailed crop monitoring. Funct. Plant Biol. 2017, 44, 153. [Google Scholar] [CrossRef] [Green Version]
- Tardieu, F.; Cabrera-Bosquet, L.; Pridmore, T.; Bennett, M. Plant phenomics, from sensors to knowledge. Curr. Biol. 2017, 27, 770–783. [Google Scholar] [CrossRef]
- Tilly, N.; Aasen, H.; Bareth, G. Fusion of plant height and vegetation indices for the estimation of barley biomass. Remote Sens. 2015, 7, 11449–11480. [Google Scholar] [CrossRef] [Green Version]
- Madec, S.; Baret, F.; De Solan, B.; Thomas, S.; Dutartre, D.; Jezequel, S.; Hemmerlé, M.; Colombeau, G.; Comar, A. High-throughput phenotyping of plant height: Comparing unmanned aerial vehicles and ground LiDAR estimates. Front. Plant Sci. 2017, 8, 2002. [Google Scholar] [CrossRef] [Green Version]
- Su, Y.; Wu, F.; Ao, Z.; Jin, S.; Qin, F.; Liu, B.; Pang, S.; Liu, L.; Guo, Q. Evaluating maize phenotype dynamics under drought stress using terrestrial LiDAR. Plant Methods 2019, 15, 11. [Google Scholar] [CrossRef] [Green Version]
- Kerby, T.A.; Plant, R.E.; Johnson-Hake, S.; Horrocks, R.D. Environmental and cultivar effects on height-to-node ratio and growth rate in Acala cotton. J. Prod. Agric. 2013, 11, 427. [Google Scholar] [CrossRef]
- Hollaus, M.; Wagner, W.; Eberhöfer, C.; Karel, W. Accuracy of large-scale canopy heights derived from LiDAR data under operational constraints in a complex alpine environment. ISPRS J. Photogramm. Remote Sens. 2006, 60, 323–338. [Google Scholar] [CrossRef]
- Dalla Corte, A.P.; Rex, F.E.; De Almeida, D.R.A.; Sanquetta, C.R.; Silva, C.A.; Moura, M.M.; Wilkinson, B.; Zambrano, A.M.A.; Neto, E.M.D.C.; Veras, H.F.P.; et al. Measuring individual tree diameter and height using GatorEye high-density UAV-LiDAR in an integrated crop-livestock-forest system. Remote Sens. 2020, 12, 863. [Google Scholar] [CrossRef] [Green Version]
- Picos, J.; Bastos, G.; Míguez, D.; Alonso, L.; Armesto, J. Individual tree detection in a Eucalyptus plantation using unmanned aerial vehicle (UAV)-LiDAR. Remote Sens. 2020, 12, 885. [Google Scholar] [CrossRef] [Green Version]
- Zhu, W.; Sun, Z.; Peng, J.; Huang, Y.; Li, J.; Zhang, J.; Yang, B.; Liao, X. Estimating maize above-ground biomass using 3D point clouds of multi-source unmanned aerial vehicle data at multi-spatial scales. Remote Sens. 2019, 11, 2678. [Google Scholar] [CrossRef] [Green Version]
- Ten Harkel, J.; Bartholomeus, H.; Kooistra, L. Biomass and crop height estimation of different crops using UAV-based LiDAR. Remote Sens. 2020, 12, 17. [Google Scholar] [CrossRef] [Green Version]
- Zhang, L.; Grift, T.E. A LiDAR-based crop height measurement system for Miscanthus giganteus. Comput. Electron. Agric. 2012, 85, 70–76. [Google Scholar] [CrossRef]
- Coomes, D.A.; Dalponte, M.; Jucker, T.; Asner, G.P.; Banin, L.F.; Burslem, D.F.R.P.; Lewis, S.L.; Nilus, R.; Phillips, O.L.; Phua, M.H.; et al. Area-based vs tree-centric approaches to mapping forest carbon in Southeast Asian forests from airborne laser scanning data. Remote Sens. Environ. 2017, 194, 77–88. [Google Scholar] [CrossRef] [Green Version]
- Laurent, A.; Pelzer, E.; Loyce, C.; Makowski, D. Ranking yields of energy crops: A meta-analysis using direct and indirect comparisons. Renew. Sustain. Energy Rev. 2015, 46, 41–50. [Google Scholar] [CrossRef]
- Evangelistella, C.; Valentini, A.; Ludovisi, R.; Firrincieli, A.; Fabbrini, F.; Scalabrin, S.; Cattonaro, F.; Morgante, M.; Mugnozza, G.S.; Keurentjes, J.J.B.; et al. De novo assembly, functional annotation, and analysis of the giant reed (Arundo donax L.) leaf transcriptome provide tools for the development of a biofuel feedstock. Biotechnol. Biofuels 2017, 10, 138. [Google Scholar] [CrossRef] [Green Version]
- Cano-Ruiz, J.; Ruiz Galea, M.; Amorós, M.C.; Alonso, J.; Mauri, P.V.; Lobo, M.C. Assessing Arundo donax L. in vitro-tolerance for phytoremediation purposes. Chemosphere 2020, 252, 126576. [Google Scholar] [CrossRef]
- Sánchez, E.; Scordia, D.; Lino, G.; Arias, C.; Cosentino, S.L.; Nogués, S. Salinity and water stress effects on biomass production in different Arundo donax L. clones. Bioenergy Res. 2015, 8, 1461–1479. [Google Scholar] [CrossRef] [Green Version]
- Pompeiano, A.; Remorini, D.; Vita, F.; Guglielminetti, L.; Miele, S.; Morini, S. Growth and physiological response of Arundo donax L. to controlled drought stress and recovery. Plant Biosyst. 2017, 151, 906–914. [Google Scholar] [CrossRef]
- Fabbrini, F.; Ludovisi, R.; Alasia, O.; Flexas, J.; Douthe, C.; Ribas Carbó, M.; Robson, P.; Taylor, G.; Scarascia-Mugnozza, G.; Keurentjes, J.J.B.; et al. Characterization of phenology, physiology, morphology and biomass traits across a broad Euro-Mediterranean ecotypic panel of the lignocellulosic feedstock Arundo donax. GCB Bioenergy 2019, 11, 152–170. [Google Scholar] [CrossRef]
- Isenburg, M. LAStools. Available online: http://lastools.org/ (accessed on 17 May 2020).
- Roussel, J.-R.; Auty, D. LidR: Airborne LiDAR Data Manipulation and Visualization for Forestry Applications. Available online: https://cran.r-project.org/web/packages/lidR/index.html (accessed on 17 May 2020).
- Lumley, T. Leaps: Regression Subset Selection Version 3.1. Available online: https://rdrr.io/cran/leaps/ (accessed on 17 May 2020).
- Hamner, B.; Frasco, M.; LeDell, E. Metrics: Evaluation Metrics for Machine Learning Version 0.1.4. Available online: https://rdrr.io/cran/Metrics/ (accessed on 17 May 2020).
- Qin, H.; Wang, C.; Xi, X.; Tian, J.; Zhou, G. Estimation of coniferous forest aboveground biomass with aggregated airborne small-footprint LiDAR full-waveforms. Opt. Express 2017, 25, A851. [Google Scholar] [CrossRef]
- Zhang, Z.; Cao, L.; She, G. Estimating forest structural parameters using canopy metrics derived from airborne LiDAR data in subtropical forests. Remote Sens. 2017, 9, 940. [Google Scholar] [CrossRef] [Green Version]
- Wan-Mohd-Jaafar, W.S.; Woodhouse, I.; Silva, C.A.; Omar, H.; Hudak, A. Modelling individual tree aboveground biomass using discrete return LiDAR in lowland dipterocarp forest of Malaysia. J. Trop. For. Sci. 2017, 29, 465–484. [Google Scholar] [CrossRef]
- Abdi, H. The Bonferonni and Šidák Corrections for Multiple Comparisons; Salkind, N.J., Ed.; SAGE Publications Inc.: Los Angeles, CA, USA, 2007; ISBN 9781412916110. [Google Scholar]
- Shao, G.; Shao, G.; Gallion, J.; Saunders, M.R.; Frankenberger, J.R.; Fei, S. Improving LiDAR-based aboveground biomass estimation of temperate hardwood forests with varying site productivity. Remote Sens. Environ. 2018, 204, 872–882. [Google Scholar] [CrossRef]
- Nunes, M.; Ewers, R.; Turner, E.; Coomes, D. Mapping aboveground carbon in oil palm plantations using LiDAR: A comparison of tree-centric versus area-based approaches. Remote Sens. 2017, 9, 816. [Google Scholar] [CrossRef] [Green Version]
- Knapp, N.; Fischer, R.; Huth, A. Linking LiDAR and forest modeling to assess biomass estimation across scales and disturbance states. Remote Sens. Environ. 2018, 205, 199–209. [Google Scholar] [CrossRef]
- Wang, C.; Nie, S.; Xi, X.; Luo, S.; Sun, X. Estimating the biomass of Maize with hyperspectral and LiDAR data. Remote Sens. 2016, 9, 11. [Google Scholar] [CrossRef] [Green Version]
- Walter, J.D.C.; Edwards, J.; McDonald, G.; Kuchel, H. Estimating biomass and canopy height with LiDAR for field crop breeding. Front. Plant Sci. 2019, 10, 1145. [Google Scholar] [CrossRef]
- Kirchgessner, N.; Liebisch, F.; Yu, K.; Pfeifer, J.; Friedli, M.; Hund, A.; Walter, A. The ETH field phenotyping platform FIP: A cable-suspended multi-sensor system. Funct. Plant Biol. 2017, 44, 168. [Google Scholar] [CrossRef] [PubMed]
- Thapa, S.; Zhu, F.; Walia, H.; Yu, H.; Ge, Y. A novel LiDAR-based instrument for high-throughput, 3D measurement of morphological traits in maize and sorghum. Sensors 2018, 18, 1187. [Google Scholar] [CrossRef] [Green Version]
- Donoghue, D.N.M.; Watt, P.J.; Cox, N.J.; Wilson, J. Remote sensing of species mixtures in conifer plantations using LiDAR height and intensity data. Remote Sens. Environ. 2007, 110, 509–522. [Google Scholar] [CrossRef]
- Jimenez-Berni, J.A.; Deery, D.M.; Rozas-Larraondo, P.; Condon, A.G.; Rebetzke, G.J.; James, R.A.; Bovill, W.D.; Furbank, R.T.; Sirault, X.R.R. High throughput determination of plant height, ground cover, and above-ground biomass in Wheat with LiDAR. Front. Plant Sci. 2018, 9, 237. [Google Scholar] [CrossRef] [Green Version]
- Bendig, J.; Yu, K.; Aasen, H.; Bolten, A.; Bennertz, S.; Broscheit, J.; Gnyp, M.L.; Bareth, G. Combining UAV-based plant height from crop surface models, visible, and near infrared vegetation indices for biomass monitoring in barley. Int. J. Appl. Earth Obs. Geoinf. 2015, 39, 79–87. [Google Scholar] [CrossRef]
- Cosentino, S.L.; Scordia, D.; Sanzone, E.; Testa, G.; Copani, V. Response of giant reed (Arundo donax L.) to nitrogen fertilization and soil water availability in semi-arid Mediterranean environment. Eur. J. Agron. 2014, 60, 22–32. [Google Scholar] [CrossRef]
- Haworth, M.; Marino, G.; Riggi, E.; Avola, G.; Brunetti, C.; Scordia, D.; Testa, G.; Gomes, M.T.G.; Loreto, F.; Cosentino, S.L.; et al. The effect of summer drought on the yield of Arundo donax is reduced by the retention of photosynthetic capacity and leaf growth later in the growing season. Ann. Bot. 2019, 124, 567–579. [Google Scholar] [CrossRef]
- Acharya, M.; Burner, D.M.; Ashworth, A.J.; Fritschi, F.B.; Adams, T.C. Growth rates of giant miscanthus (Miscanthus × giganteus) and giant reed (Arundo donax) in a low-input system in Arkansas, USA. Am. J. Plant Sci. 2018, 9, 2371–2384. [Google Scholar] [CrossRef] [Green Version]
- Corno, L.; Pilu, R.; Adani, F. Arundo donax L.: A non-food crop for bioenergy and bio-compound production. Biotechnol. Adv. 2014, 32, 1535–1549. [Google Scholar] [CrossRef]
- Waliman, M.; Zakhor, A. Height estimation of biomass sorghum in the field using LiDAR. In Proceedings of the IS and T International Symposium on Electronic Imaging Science and Technology, San Francisco, CA, USA, 13–17 January 2019; Society for Imaging Science and Technology: Springfield, VA, USA, 2019; Volume 2019, pp. 137–138. [Google Scholar]
- Ahrar, M.; Doneva, D.; Tattini, M.; Brunetti, C.; Gori, A.; Rodeghiero, M.; Wohlfahrt, G.; Biasiolo, F.; Varotto, C.; Loreto, F.; et al. Phenotypic differences determine drought stress responses in ecotypes of Arundo donax adapted to different environments. Exp. Bot. 2017, 68, 2439–2451. [Google Scholar] [CrossRef]
- Andreu-Rodríguez, J.; Pérez-Espinosa, A.; Pérez-Murcia, M.D.; Moral, R.; Agulló, E.; Ferrández-Villena, M.; Ferrández-García, M.T.; Bustamante, M.A. Near infrared reflectance spectroscopy (NIRS) for the assessment of biomass production and C sequestration by Arundo donax L. in salt-affected environments. Agric. Water Manag. 2017, 183, 94–100. [Google Scholar] [CrossRef]


| LiDAR CHM Metric | Definition | Unit |
|---|---|---|
| Hcount | Number of points identified as stem heights | Number |
| Hsum | Sum of stem height values | cm |
| Hmean | Mean of stem height values | cm |
| Hmedian | Median of stem height values | cm |
| Hstdev | Standard deviation of stem height values | cm |
| Hmax | Maximum of stem height values | cm |
| Hmin | Minimum of stem height values | cm |
| Hrange | Range (Hmax−Hmin) of stem height values | cm |
| Hmajority | Stem height with most occurrences | cm |
| Hminority | Stem height with least occurrences | cm |
| Hvariety | The count of unique stem height values | Number |
| 1 LiDAR Metric | Model | R2 | 2p-Value | 3 RMSE (g m−2) |
|---|---|---|---|---|
| Hcount | 4 AGB = 8549.6 − 222.2 × Hcount | 0.32 | 0.013 * | 1402.8 |
| Hsum | AGB= 7936.2 − 50.6 × Hsum | 0.20 | 0.059 | 1527.8 |
| Hmean | AGB = −4326.5 + 2310.5 × Hmean | 0.22 | 0.045 * | 1504.6 |
| Hmedian | AGB = −4360.8 + 2314.9 × Hmedian | 0.23 | 0.040 * | 1494.7 |
| Hstdev | AGB = 1527 + 25569.3 × Hstdev | 0.22 | 0.049 * | 1511.8 |
| Hmax | AGB = −5087.7 + 2397.8 × Hmax | 0.28 | 0.023 * | 1449.1 |
| Hmin | AGB = −2116 + 1844 × Hmin | 0.15 | 0.116 | 1581.8 |
| Hrange | AGB = 2032.0 + 5541.4 × Hrange | 0.21 | 0.053 | 1517.7 |
| Hmajority | AGB = −2797.8 + 1887.9 × Hmajority | 0.16 | 0.090 | 1561.0 |
| Hminority | AGB = −2116.0 + 1844.0 × Hminority | 0.15 | 0.116 | 1581.0 |
| Hvariety | AGB = 8491.6 − 302.7 × Hvariety | 0.34 | 0.010 * | 1386.6 |
Publisher’s Note: MDPI stays neutral with regard to jurisdictional claims in published maps and institutional affiliations. |
© 2020 by the authors. Licensee MDPI, Basel, Switzerland. This article is an open access article distributed under the terms and conditions of the Creative Commons Attribution (CC BY) license (http://creativecommons.org/licenses/by/4.0/).
Share and Cite
Maesano, M.; Khoury, S.; Nakhle, F.; Firrincieli, A.; Gay, A.; Tauro, F.; Harfouche, A. UAV-Based LiDAR for High-Throughput Determination of Plant Height and Above-Ground Biomass of the Bioenergy Grass Arundo donax. Remote Sens. 2020, 12, 3464. https://0-doi-org.brum.beds.ac.uk/10.3390/rs12203464
Maesano M, Khoury S, Nakhle F, Firrincieli A, Gay A, Tauro F, Harfouche A. UAV-Based LiDAR for High-Throughput Determination of Plant Height and Above-Ground Biomass of the Bioenergy Grass Arundo donax. Remote Sensing. 2020; 12(20):3464. https://0-doi-org.brum.beds.ac.uk/10.3390/rs12203464
Chicago/Turabian StyleMaesano, Mauro, Sacha Khoury, Farid Nakhle, Andrea Firrincieli, Alan Gay, Flavia Tauro, and Antoine Harfouche. 2020. "UAV-Based LiDAR for High-Throughput Determination of Plant Height and Above-Ground Biomass of the Bioenergy Grass Arundo donax" Remote Sensing 12, no. 20: 3464. https://0-doi-org.brum.beds.ac.uk/10.3390/rs12203464