Detection of Defoliation Injury in Peanut with Hyperspectral Proximal Remote Sensing


1
School of Agricultural and Veterinarian Sciences, São Paulo State University (UNESP), Rod. Prof. Paulo Donato Castellane, km 5, 14884-900 Jaboticabal, SP, Brazil
2
Department of Land Resources and Environmental Sciences, Montana State University, Bozeman, MT 59717, USA
*
Author to whom correspondence should be addressed.
Remote Sens. 2020, 12(22), 3828; https://0-doi-org.brum.beds.ac.uk/10.3390/rs12223828
Submission received: 17 October 2020
/
Revised: 8 November 2020
/
Accepted: 19 November 2020
/
Published: 21 November 2020
(This article belongs to the Special Issue Precision Agriculture Using Hyperspectral Images)
Abstract
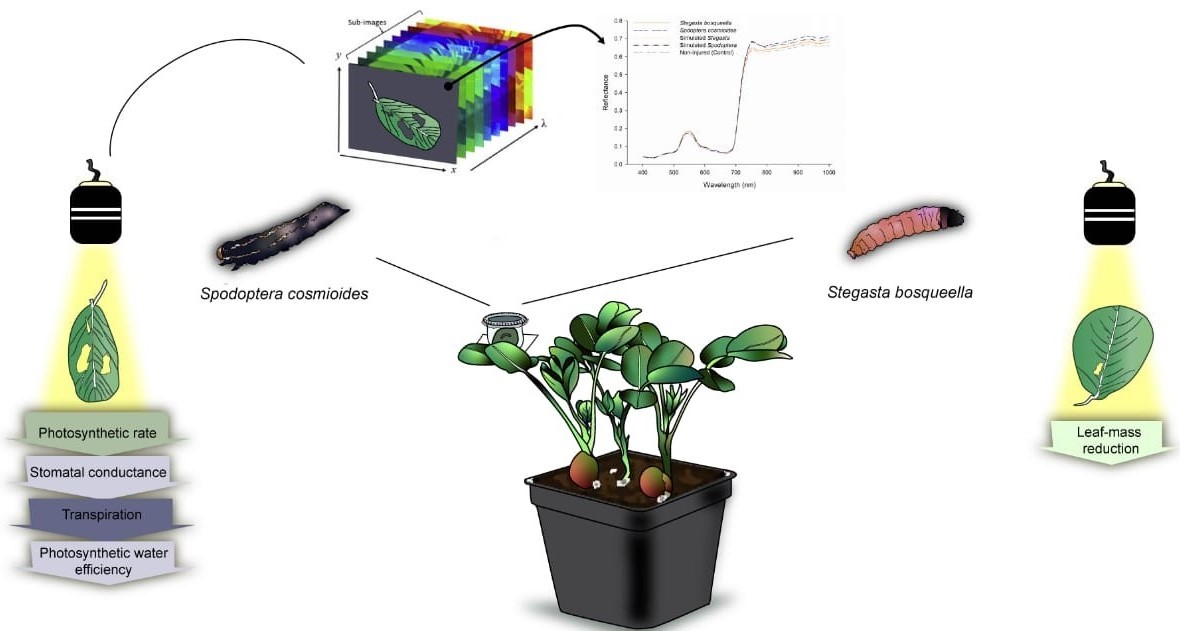
:Remote sensing can be applied to optimize efficiency in pest detection, as an insect sampling tool. This efficiency can result in more precise recommendations for decision making in pest management. Pest detection with remote sensing is often feasible because plant biotic stress caused by herbivory triggers a defensive physiological response in plants, which generally results in changes to leaf reflectance. Therefore, the key objective of this study was to use hyperspectral proximal remote sensing and gas exchange parameters to characterize peanut leaf responses to herbivory by Stegasta bosqueella (Lepidoptera: Gelechiidae) and Spodoptera cosmioides (Lepidoptera: Noctuidae), two major pests in South American peanut (Arachis hypogaea) production. The experiment was conducted in a randomized complete block design with a 2 × 3 factorial scheme (two lepidopterous species and 3 categories of injury). The injury treatments were: (1) natural infestation by third instars of S. bosqueella, (2) natural infestation by third instars of S. cosmioides, and (3) simulation of injury with scissors to mimic larval injury. We verified that peanut leaf reflectance is different between herbivory by the two larval species, but similar among real and simulated defoliation. Similarly, we observed differences in photosynthetic rate, stomatal conductance, transpiration, and photosynthetic water use efficiency only between species but not between real and simulated larval defoliation. Our results provide information that is essential for the development of sampling and economic thresholds of S. bosqueella and S. cosmioides on the peanut.

1. Introduction
Producing more food without increasing the area of production is one of the great challenges for agriculture in the coming decades. By 2050, the demand for food may increase by 70% to support the world population [1]. To meet this demand, productivity will need to be increased, guided mainly by technological innovations in production factors such as the more efficient use of inputs [1]. The search for techniques to increase production is urgent, in particular those involved with minimizing damage associated with biotic (e.g., insect pests, pathogens, weeds) and abiotic factors (e.g., relative humidity, temperature, precipitation) [2,3].
Precision agriculture strategies (e.g., the integration of different sensors, information, and management systems) can promote the efficient use of inputs and assist in decision making. Consequently, precision strategies may reduce environmental and economic impacts on production systems [4,5]. Advanced remote sensing tools may enhance the adoption of Integrated Pest Management (IPM) programs [5,6,7]. The progress in sensor technology, such as multi-spectral and hyperspectral, can provide high resolution data and offers new opportunities of remote sensing application in different crop systems. Thus, because remote sensing techniques are of extreme importance to attain sustainability in agriculture, this strategy has been inspected around the world in automating or supplementing IPM programs [6,7]. In IPM, decision making about pests is often based on a population survey of pests, which then makes it possible to verify whether there is a need for management, and also to prioritize the types of pests to be managed [8,9]. Remote sensing, as an insect sampling tool, can also optimize efficiency in pest detection, with precise recommendations for decision making in pest management [10,11,12,13,14].
Pest detection with remote sensing is feasible because plant biotic stress caused by herbivory, for example, triggers a defensive physiological response in plants, which generally results in changes to leaf reflectance [7,15]. Additionally, biochemical changes during plant growth, such as concentration of chlorophyll and water, affect the amount of electromagnetic radiation that is reflected, absorbed, or transmitted by plants [16,17]. Therefore, because insect defoliation it is a common form of herbivory, and it can alter the plant gas exchange parameters by removing photosynthetic tissue, understanding how herbivory influences key photosynthetic processes such as water-vapor transfer, respiration, and water-use efficiency is critical because these processes determine plant growth, development, and fitness [18,19]. Furthermore, herbivory can represent short-and long-term consequences for plants and the magnitude of these consequences will varies depending on the type, timing, and intensity of the injury as well as plant tissues injured [18]. Thus, investigating how plants responds to multiple species injury is essential.
The physiological mechanisms underlying peanut (Arachis hypogaea) responses to arthropod injury are poorly understood [20,21]. Furthermore, pest sampling in peanut crops is still carried out manually, making it extremely labor-intensive and costly [20,22,23], leading to low adoption rates by producers which affects the sustainability of the peanut industry.
Therefore, in light of the worldwide importance of peanut (e.g., improving soil properties through atmospheric nitrogen fixation, and a functional food with high nutritional components) [24], the key objective of this study was to characterize peanut leaf responses to herbivory by Stegasta bosqueella (Lepidoptera: Gelechiidae) and Spodoptera cosmioides (Lepidoptera: Noctuidae), two of the major pests in South American peanut production [25,26,27]. These larvae can occur in high abundance and caution is needed because they can cause intense defoliation with direct effect on plant development. In addition to defoliation, S. bosqueella can also feed directly on peanut buds affecting their growth and, therefore, peanut production. To accomplish this objective, we analyzed hyperspectral proximal remote sensing data for injured peanut leaves and collected information about leaf gas exchange response to real and simulated larval-induced herbivory. Since high spectral resolution require advanced methods of data analysis [7] our study focused on the application of advanced machine learning algorithms such as Random Forest Classification and The Classification Tree analysis to complies with these demands. Understanding how herbivory by different organisms affects plant physiology is essential for grouping species in sampling programs that cause similar injuries (e.g., injury guilds), and to establish recommendations for the management of each species [18]. Because this is the first study to characterize the effect of S. bosqueella and S. cosmioides on peanut plant reflectance and gas exchange, and it is well established that plant responses to insect injury are highly influenced by the intensity of injury, the type of injury, and environmental factors [28,29,30], our study was conducted in a greenhouse, where abiotic conditions can be readily monitored and controlled, allowing for a more accurate characterization of the effects of herbivory.
2. Materials and Methods
2.1. Experimental Design
The experiment was conducted in a randomized complete block design with a 2 × 3 factorial scheme (two lepidopterous species and 3 categories of injury [insect-related injury, simulated injury and control]). The injury treatments were: (1) Natural infestation by third instars of S. bosqueella, (2) Simulation of injury with scissors to mimic S. bosqueella larval injury, (3) Natural infestation by third instars of S. cosmioides, (4) Simulation of injury with scissors to mimic S. cosmioides injury, and (5) Non-Injured (control). Third instars were used because they cause representative and sufficient injuries that allow for measurement and evaluation (unpublished data). Each treatment consisted of ten 5-L pots (replicates) containing a peanut plant 30 days after emergence (DAE).
2.2. Test Plants and Insects
Studies were carried out with peanut cultivar IAC 503, which is a major peanut cultivar currently used in Brazil. IAC 503 belongs to the runner vegetative group with a “high oleic” characteristic [31]. For the experiments, peanut plants were grown in individual 5-L pots containing a mixture of soil, sand, and cattle manure in a 1:2:1 proportion. Initially, 5 seeds were placed in each pot, and seedlings were thinned after plant emergence, so that each pot contained only a single plant. The peanut plants were kept in an air-conditioned greenhouse facility (3.50 × 6.35 m in diameter, 25 ± 10 °C, RH 70 ± 10%, and natural light) at São Paulo State University, São Paulo, Brazil. Plants were irrigated daily using the same amount of water per plant.
In Brazil, both S. bosqueella and S. cosmioides prefer to feed on young peanut leaves, therefore, for insect colony establishment, planting was carried out weekly to ensure continuous availability of peanut leaflets. The S. bosqueella population (approximately 150 adults) was collected in a commercial peanut field located in Jaboticabal, São Paulo, Brazil, brought to the laboratory and kept in acrylic cages (30 × 30 × 30 cm) under controlled temperature conditions (12H:12D photoperiod, 25 ± 2 °C, and 60 ± 10% RH), according to Boiça Jr. et al. [32]. Therefore, the cultivar IAC 503 leaflets were used as feeding and oviposition substrates. The initial S. cosmioides colony (approximately 200 specimens) was provided by the Insect Biology Laboratory of the Superior School of Agriculture “Luiz de Queiroz”, São Paulo University, Piracicaba, state of São Paulo, Brazil and it was kept in the same controlled temperature conditions as S. bosqueella. Also. similar to S. bosqueella, IAC 503 leaflets were used as feeding and oviposition substrates. For our study, the F2 generation was used.
2.3. Injury Treatments
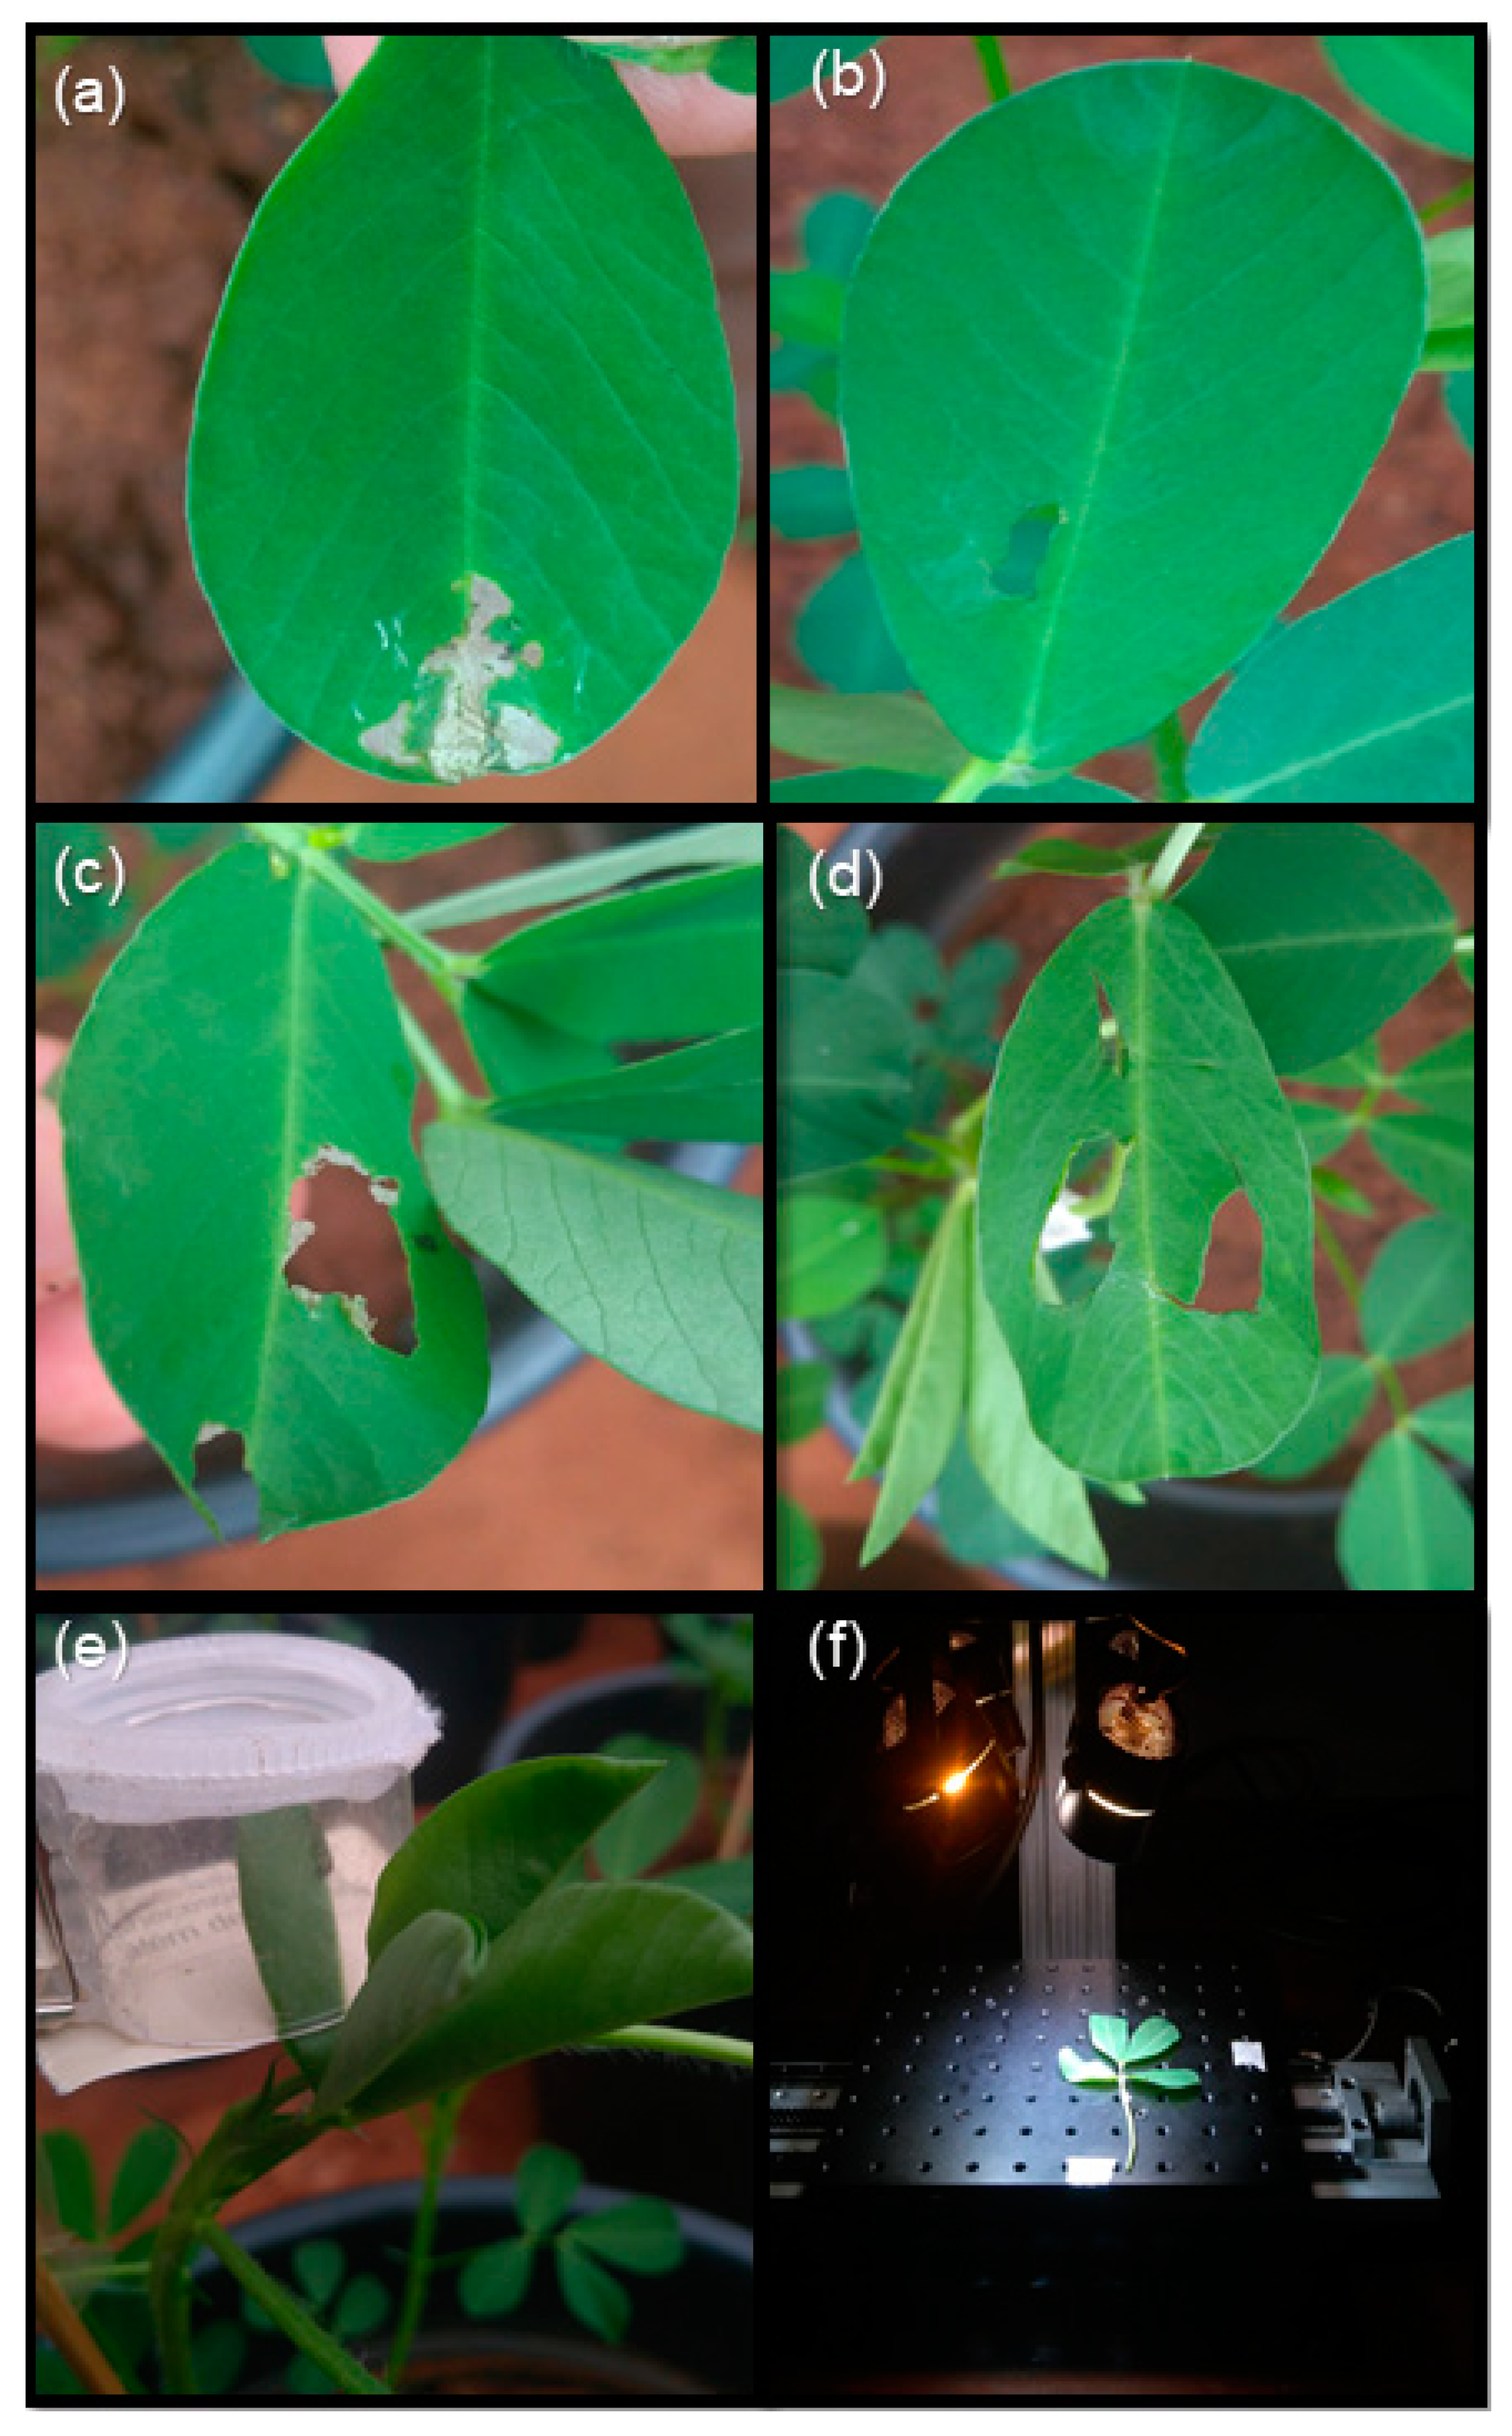
Natural defoliation was performed 30 DAE based on the methodology of Delaney et al. [33]. Leaf cages composed of transparent plastic cylinders (6 cm in height × 4 cm in diameter) were used to restrict larvae to a single freshly opened leaflet and each cage was sealed with cardboard (5 × 5 cm in diameter) (Figure 1e). The same leaf position was adopted for all treatments. All larvae were removed after 24 h, while primary-leaf photosynthetic measurements were recorded 24 and 48 h after herbivores were introduced. The simulated herbivory (Figure 1b,d) was carried out by removing part of the peanut leaflet corresponding to the injury observed in the natural defoliation caused by the larvae. This simulated larval defoliation was performed after the removal of leaf cages with the aid of scissors in the same position as the injury caused by both S. bosqueella and S. cosmioides (Figure 1a,c). In addition, control plants were used for all treatments. All treatments received leaf cages to control for any cage-effects on the experiments.
2.4. Gas Exchange Measurements
Gas exchange parameters were collected 24 h and 48 h after herbivore infestation. The following parameters were measured: intercellular CO2 concentrat ion (Ci) (μmol CO2 mol−1), assimilation/respiration (A) (μmol CO2 m−2 s−1), stomatal conductance (GS) (mmol H2O m−2 s−1), transpiration (E) (mmol H2O m−2 s−1), leaf to air vapor pressure deficit (VPD) (kPa), photosynthetic water use efficiency (WUE) (mmol CO2 mol−1 H2O), and leaf temperature (TLEAF) (°C) through the CIRAS-3 Portable Photosynthesis System (PP Systems®, Amesbury, MA, USA). The CO2 reference concentration and light intensity inside the leaf chambers were kept constant at 1500 μmol m−2 s−1 and 400 μmol CO2 mol−1, respectively.
2.5. Hyperspectral Remote Sensing
Hyperspectral remote sensing data were acquired from peanut plants (n = 50 leaflets) 72 h after treatment infestation. The plants were transferred to a climate-controlled room without artificial lighting (to ensure only camera lighting), where the hyperspectral imaging was performed using a benchtop system. Ambient climate conditions were 22–25 °C and 50–60% relative humidity. The acquisition of hyperspectral remote sensing data was performed from 8:00–11:00 a.m. using a hyperspectral camera (PIKA L, Resonon Inc., Bozeman, MT, USA) which acquires reflectance data in the 400–1000 nm spectral range. This camera has a 3.7 nm spectral resolution (Full Width Half Maximum-FWHM) and 281 spectral channels. The calibration surface used as a white reference was made of polyethylene plastic (Type 822, Spectronon Pro, Resonon, Bozeman, MT, USA). The software Spectronon Pro™ was used for camera control, data acquisition, and data processing.
We carefully dissected the portion of the plant where the injury occurred (Figure 1f), and hyperspectral imaging was completed within 1–2 min. For this, with the aid of Spectronon Pro™ software, we manually collected the average reflectance by drawing a rectangle (Length 1 cm × Width 0.8) and mining the data only in the area on interested, thus ensuring greater homogeneity of data and the extraction of spectral responses. Thus, only the specific herbivory-injured leaflet information was evaluated per plant and used for data analysis.
2.6. Data Analysis
For hyperspectral remote sensing data, univariate feature selection based on ANOVA F-value scores was used to create a variable importance plot to highlight the spectral regions useful in distinguishing between injured and non-injured (control) leaves. For this analysis, we used the “sklearn.feature_selection_Select KBest” library in Scikit-learn: Machine Learning in Pythonv3.6. [34].
To test for treatment effects on peanut leaf reflectance, we used the near-infrared (NIR) spectral range (777.42–1000 nm) because it exhibited separation in sample reference spectra (Figure 2) and is sensitive to variation in plant stressors (Figure 3). For this, we performed comparative contrast analysis between groups using an F test (p < 0.05) (PROC MIXED) [35].
To evaluate the accuracy of prediction in discerning S. bosqueella, S. cosmioides, and uninfested leaves, a Random Forest Classification was performed using the Scikit-learn: Machine Learning in Pythonv3.6. [34]. Random Forest is one of the more successful ensemble methods for pattern detection in a dataset as it conducts a random selection of all possible explanatory variables (here, hyperspectral bands) at each split [36]. Due to the lack of experimental replicates in our study, the desire to reduce noise, and to respect the principles of parsimony and the Hughes Phenomenon [6,37], we used principal component analysis (PCA) along with Random Forest classification as a dimension reduction tool for all spectral bands (n = 150) collected from the hyperspectral data. The main purpose in using PCA was to summarize all spectral dimensions (features) into three principal components, without losing information. The Random Forest Classification parameters were selected by a standard 5-StratifiedKFold cross-validation with GridSearchCV from Sklearn.model_selection library using Pythonv3.6. To evaluate the model robustness, we estimated the overall accuracy and the Kappa statistic from our Random Forest Classification model, using 70% of the data for training and 30% for validation [38].
To evaluate the effect of different larval species and herbivory-injury methods in peanut leaf gas exchange, we applied the multiple comparison Tukey test (p-value < 0.05) (PROC MIXED) [35]. Similar to the hyperspectral analysis, we applied comparative contrast analysis between groups with an F test (p < 0.05), using the gas exchange parameters as explanatory variables to represent the variation between classes (injury categories). Aiming to understand the peanut leaf gas exchange response to larval-induced herbivory, we developed a classification tree model with only injured and non-injured data as the response variable. We used the Sklearn.tree library to create the classification tree and a standard 5-StratifiedKFold cross-validation with GridSearchCV to define the maximum depth of the tree, the minimum number of samples required to split an internal node and the function to measure the quality of a split. The classification tree analysis, a non-parametric statistical modeling technique, is widely used to identify a set of characteristics (here, gas exchange variables) that best distinguish individuals based on a categorical outcome variable (here, larval-induced-herbivory) [39]. Therefore, we adopted the photosynthetic parameters assimilation/respiration (A-photosynthetic rate), stomatal conductance (GS), transpiration (E), and photosynthetic water use efficiency (WUE) as explanatory (predictor) variables.
3. Results
3.1. Hyperspectral Images
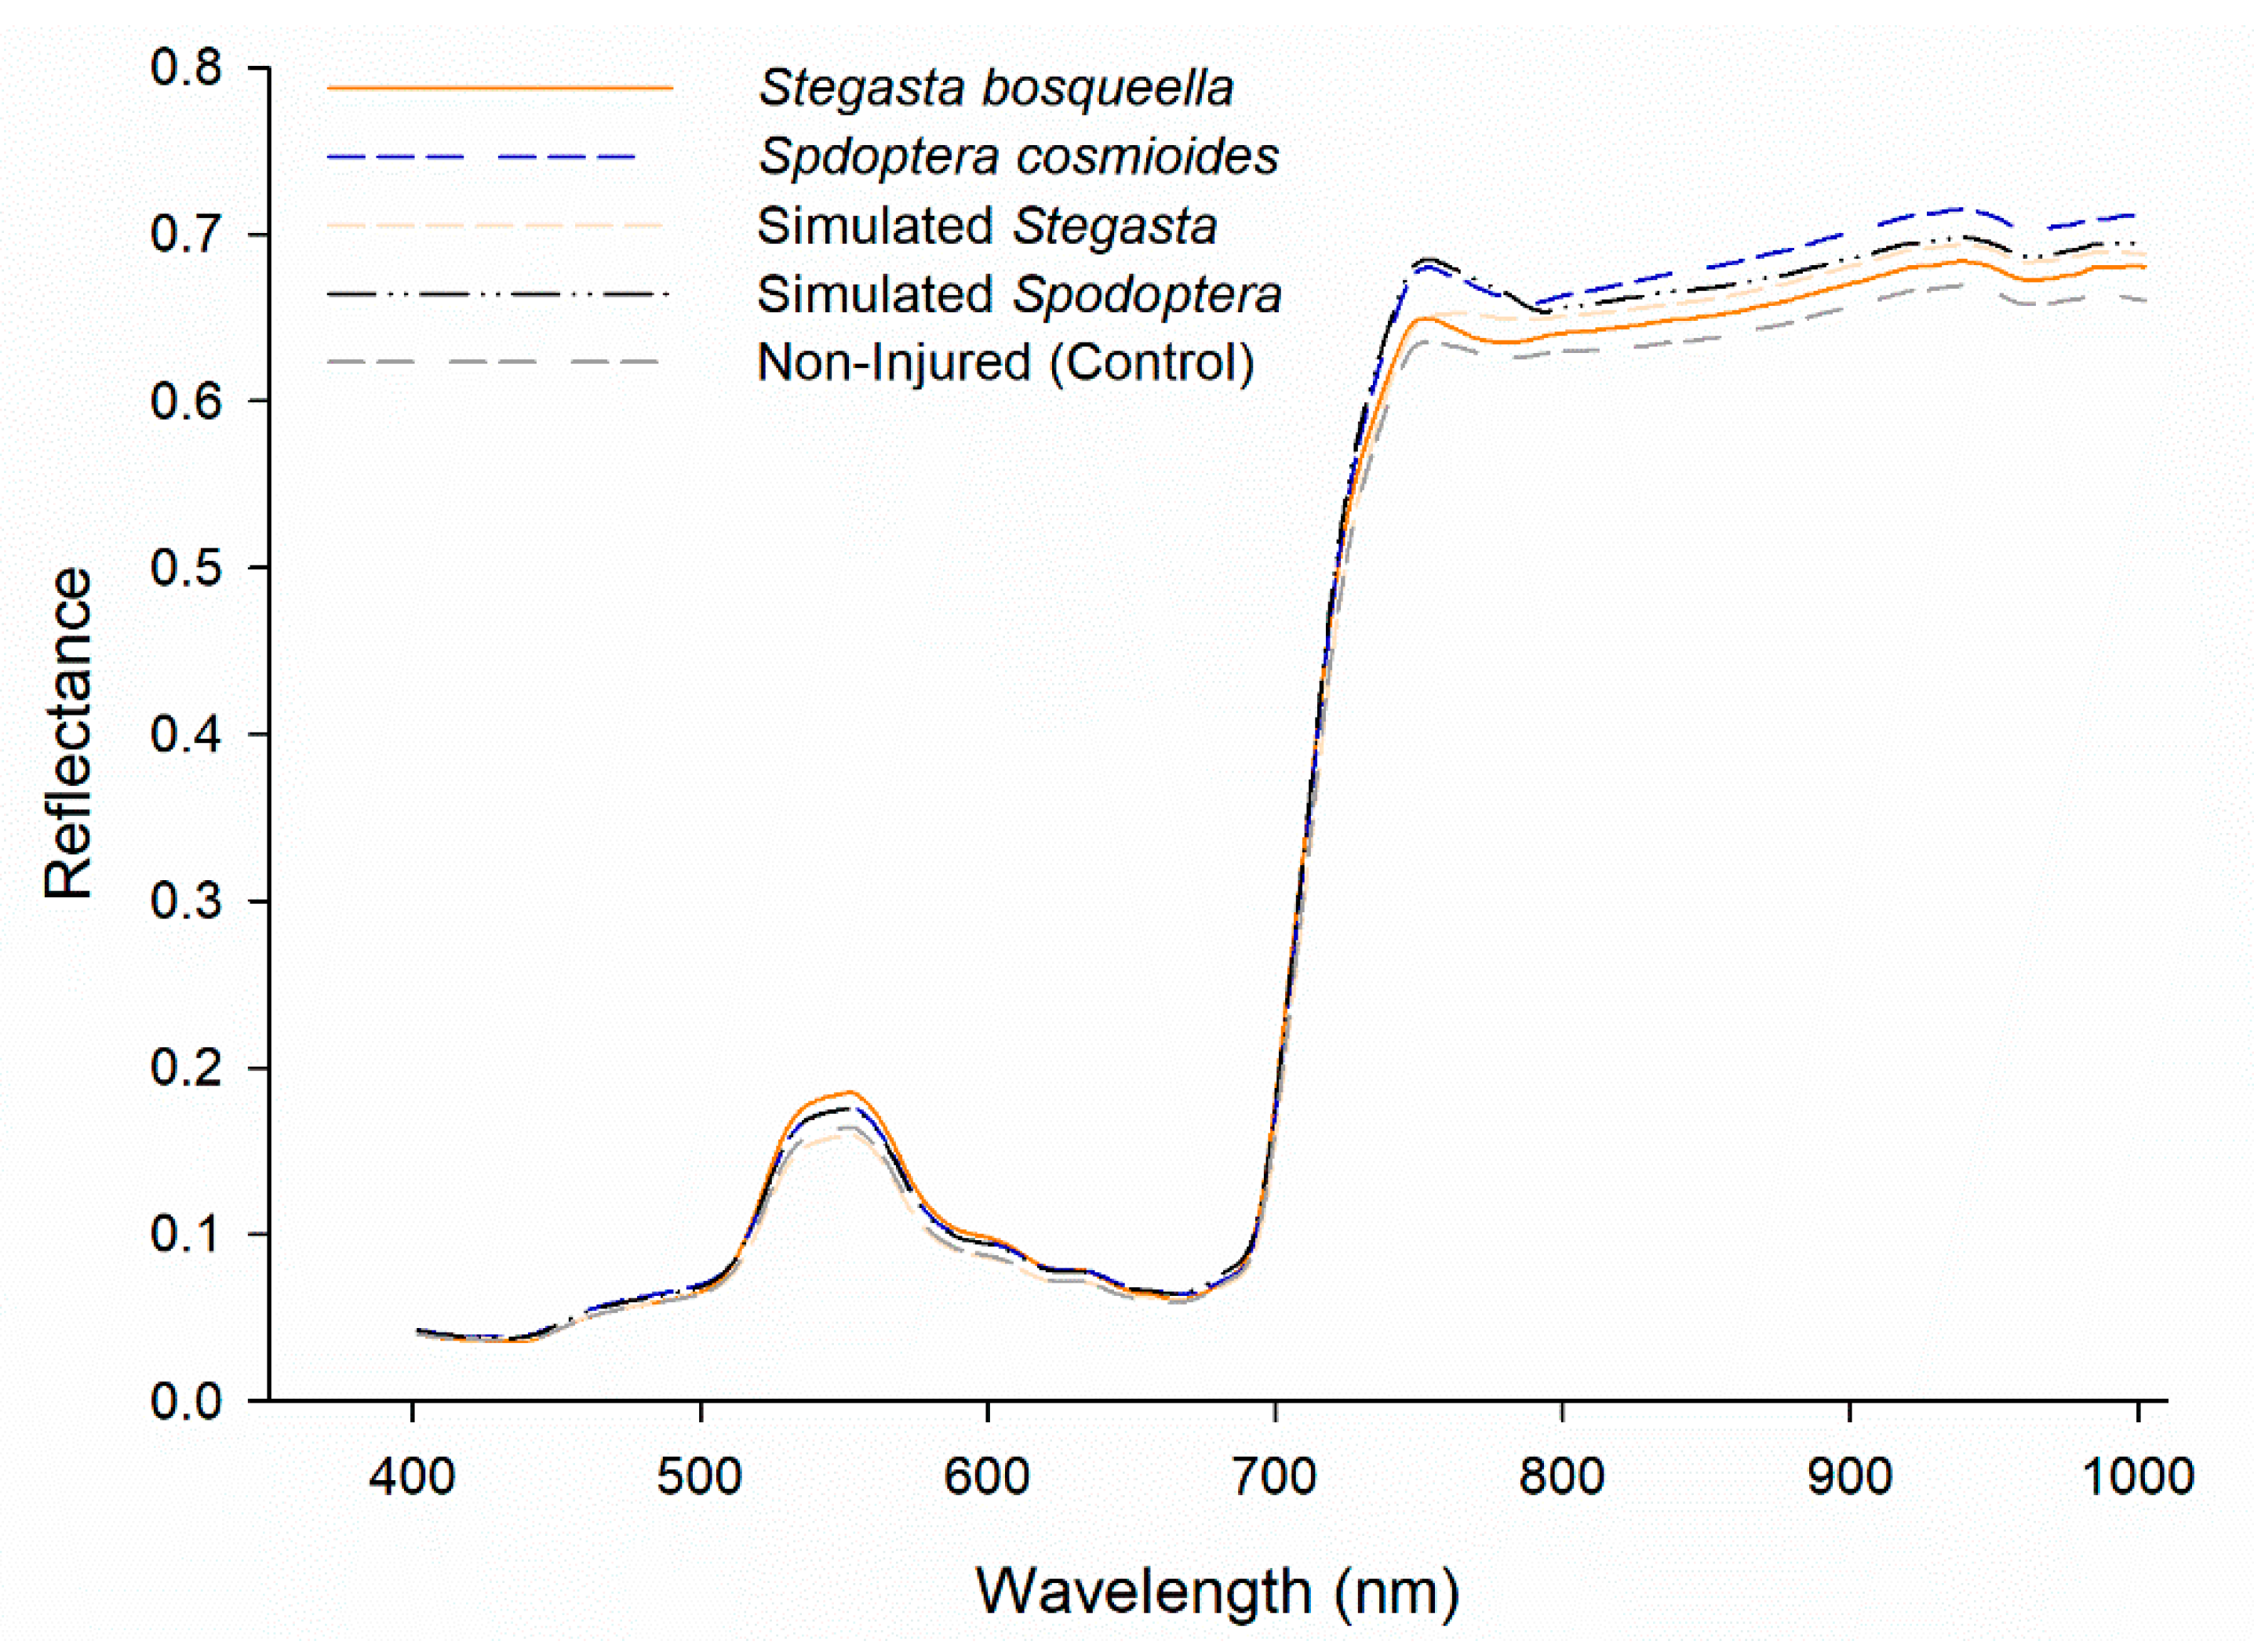
We verified that the average reference spectral signature for the different treatment groups illustrated the spectral regions that were crucial in their distinction and classification with low standard deviation (Figure 2, Figure S1). The reflectance profiles for each of the treatment groups appeared to be similar in the visible wavelengths, although spectral deviations occurred above 700 nm in the near-infrared (NIR) region. The spectral profile for control leaves exhibited the lowest values between 777.42–1000 nm, in contrast to an increase in reflectance in the stressed treatment classes. We also observed that the stressed classes based on the actual injury corresponding to each larval species exhibited different spectral responses in the NIR region. However, the simulated injury appeared to be similar to the injury made by the real larvae. Furthermore, the variable importance plot based on ANOVA F-values scores confirmed that the 777.42–1000 nm portion of the spectrum was crucial for spectral distinction among treatment groups (Figure 3).
However, because one of our main goals was to determine if leaf reflectance was different among larval species and injury categories, we performed contrast analysis with the 700–1000 nm spectral reflectance data. The contrast analysis showed that there was a difference between species’ reflectance in the NIR region (777.42–1000 nm) (F5, 3354 = 167.46, p = < 0.0001). However, there was no difference in peanut leaf reflectance between simulated or real injury (F5, 3354 = 0.55, p = 0.4566). Conversely, peanut leaf reflectance changed when we compared injured vs non-injured leaves (F5, 3354 = 356.40, p = < 0.0001) (Figure 2).
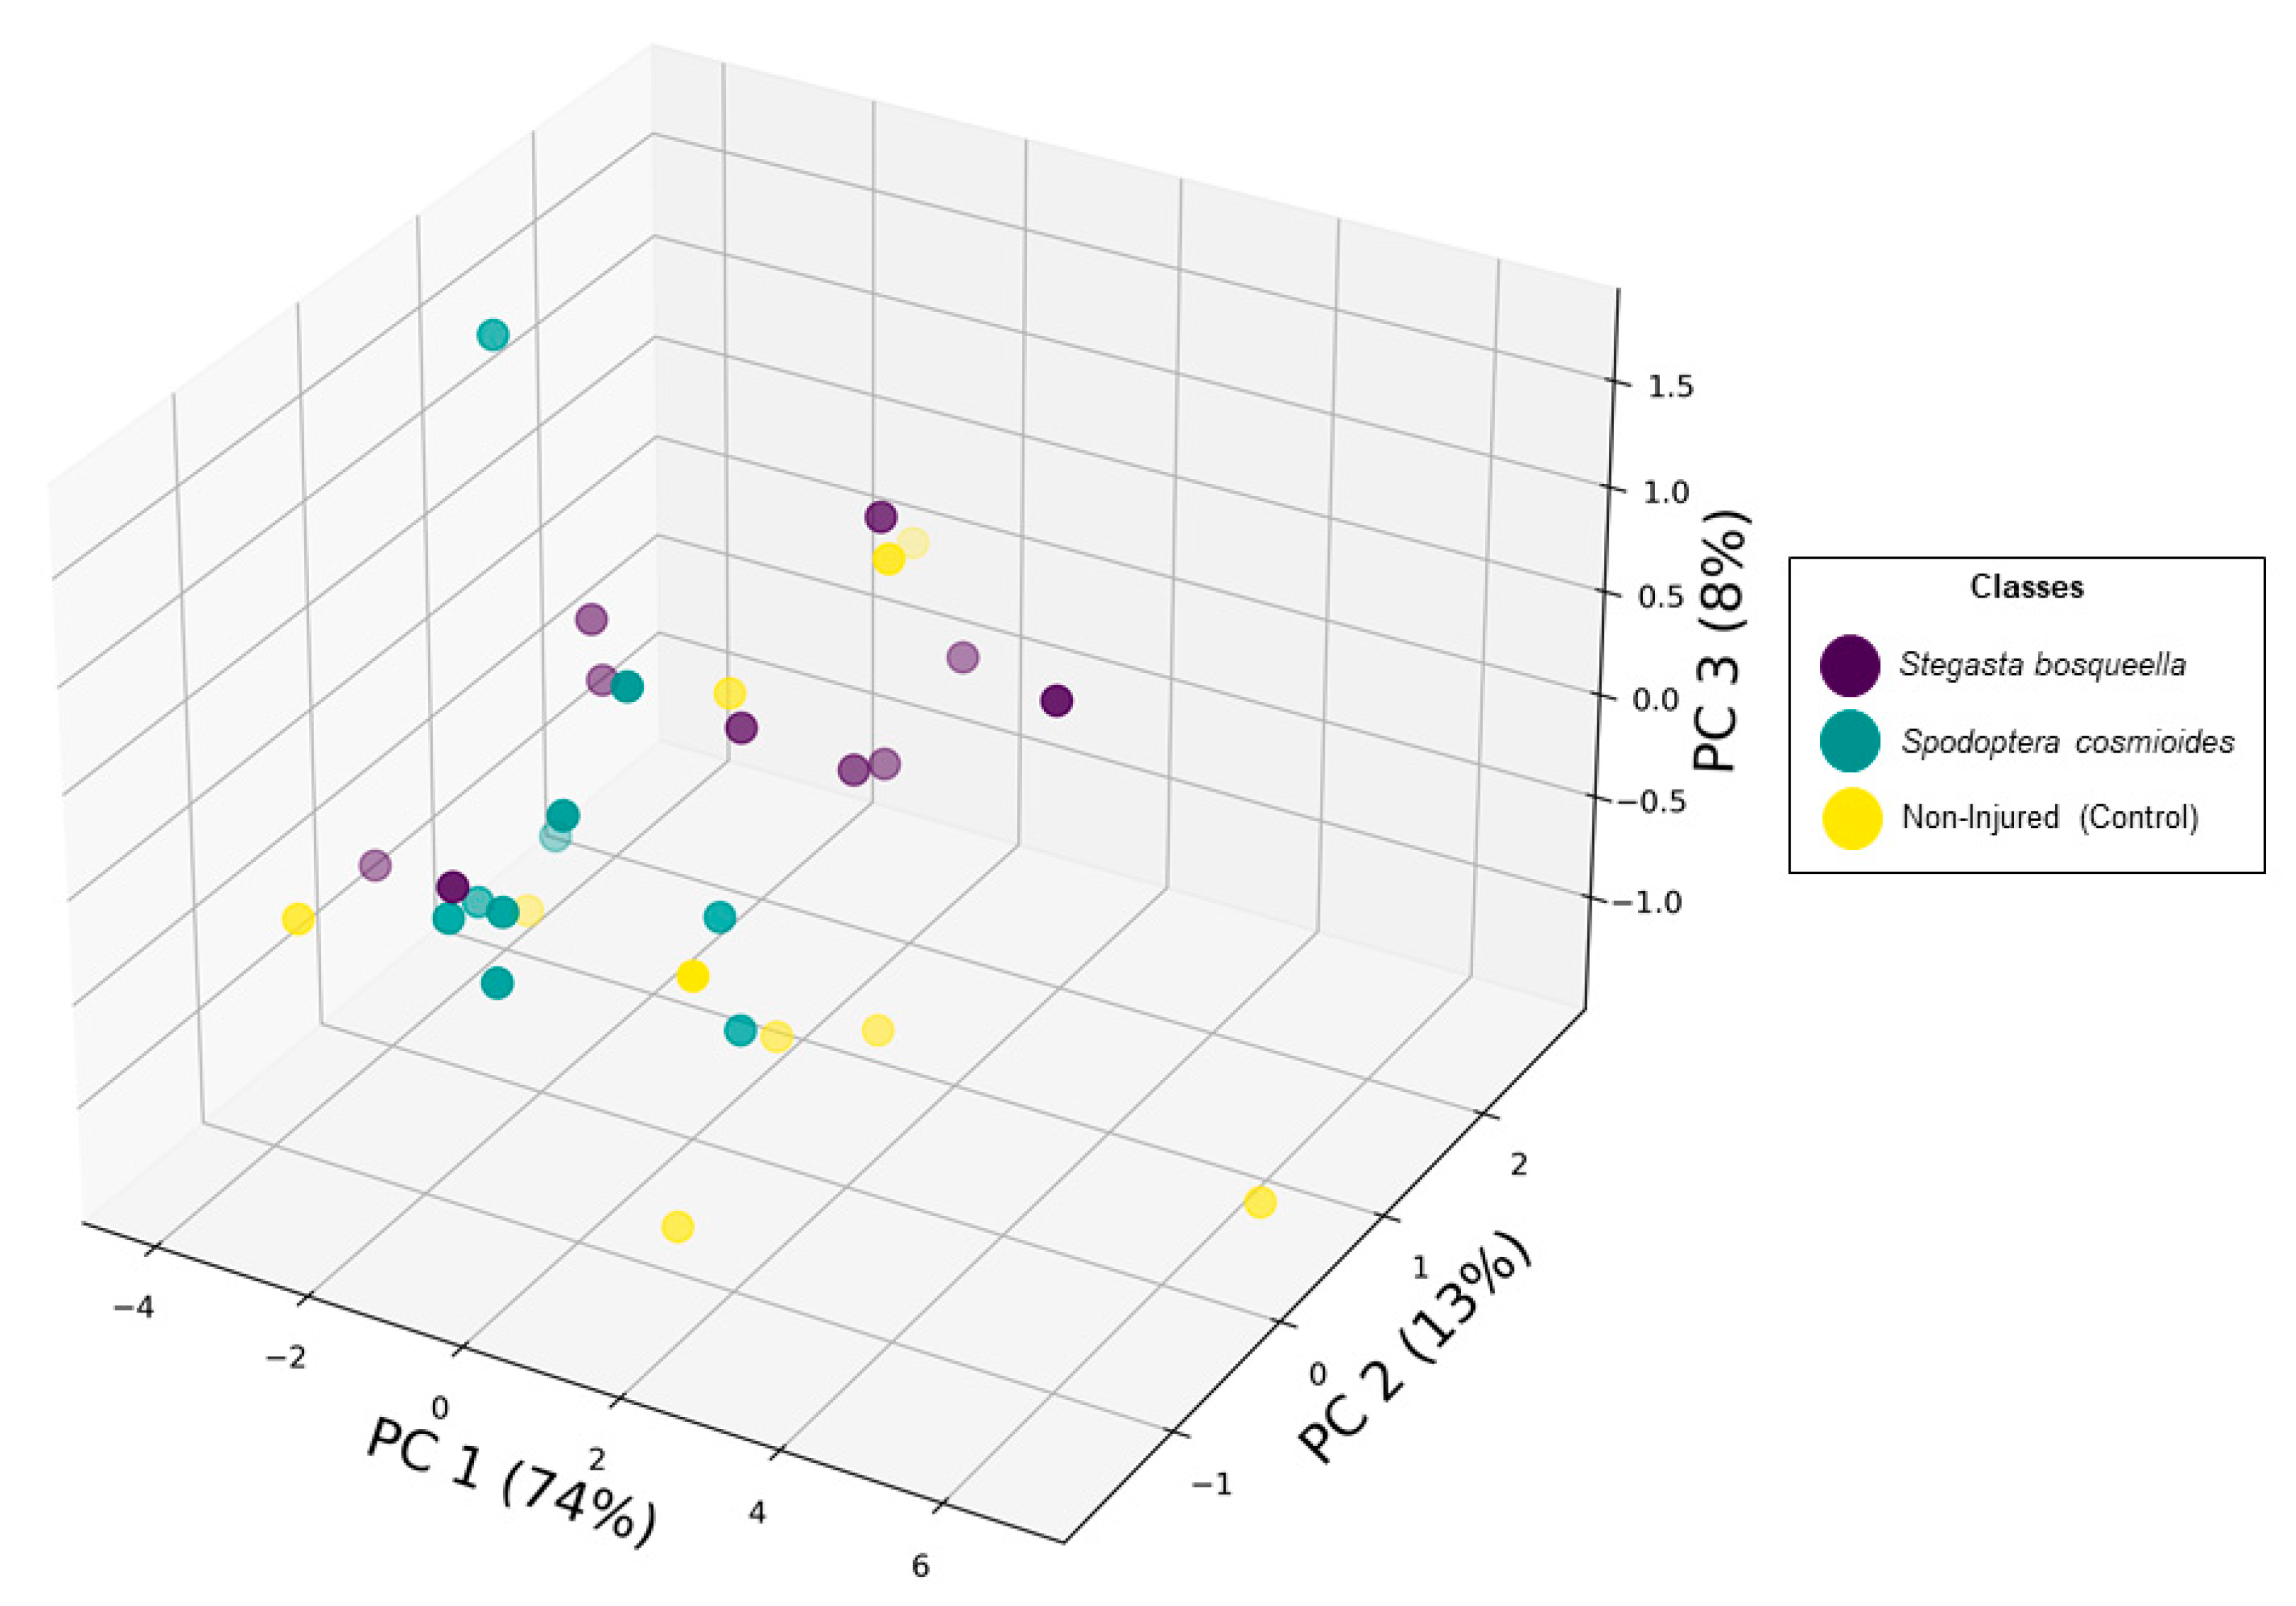
Our second goal was to build a Random Forest model to discern S. bosqueella, S. cosmioides, and uninfested leaves. Therefore, we performed PCA to condense the multidimensional spectral data into a three-dimensional environment (Figure 4). Principal components 1, 2, and 3 explained most of the variation in the data (95.52%), with PC1 responsible for 74% of the explained variance (Figure 4). For the Random Forest Classification model, using 70% of the dataset as training data and 30% as validation data, larval injury was classified with an overall accuracy of 92% and a Kappa statistic of 0.83 (Table 1). These results indicate that based on the 9 samples used for validation, our model correctly classified 8 of them.
3.2. Gas Exchange Responses to Herbivory Measurements
Neither injury treatment significantly affected peanut leaf electrical conductivity in the primary-leaf photosynthetic measurements recorded 24 h after infestation (Table 2). Also, 24 h after the infestation, the contrast analysis showed no difference in injury caused by S. bosqueella and S. cosmioides and between real herbivory and simulated leaf injury gas exchange responses parameters (Table 2).
The treatment effects on peanut leaf gas exchange were only observed 48 h after the infestation (Table 3). Herbivory by S. bosqueella caused a low impact on peanut gas exchange and the photosynthetic rates were similar to the control. In contrast, injury by S. cosmioides reduced the photosynthetic rate by 3.97 μmol CO2 m−2 s−1 compared to non-injured leaves. The contrast results showed differences in photosynthetic rate, stomatal conductance, transpiration, and photosynthetic water use efficiency only between species (Table 3). Similar to the hyperspectral image analysis, we verified that real and simulated injuries presented similar effects on peanut leaf gas exchange.
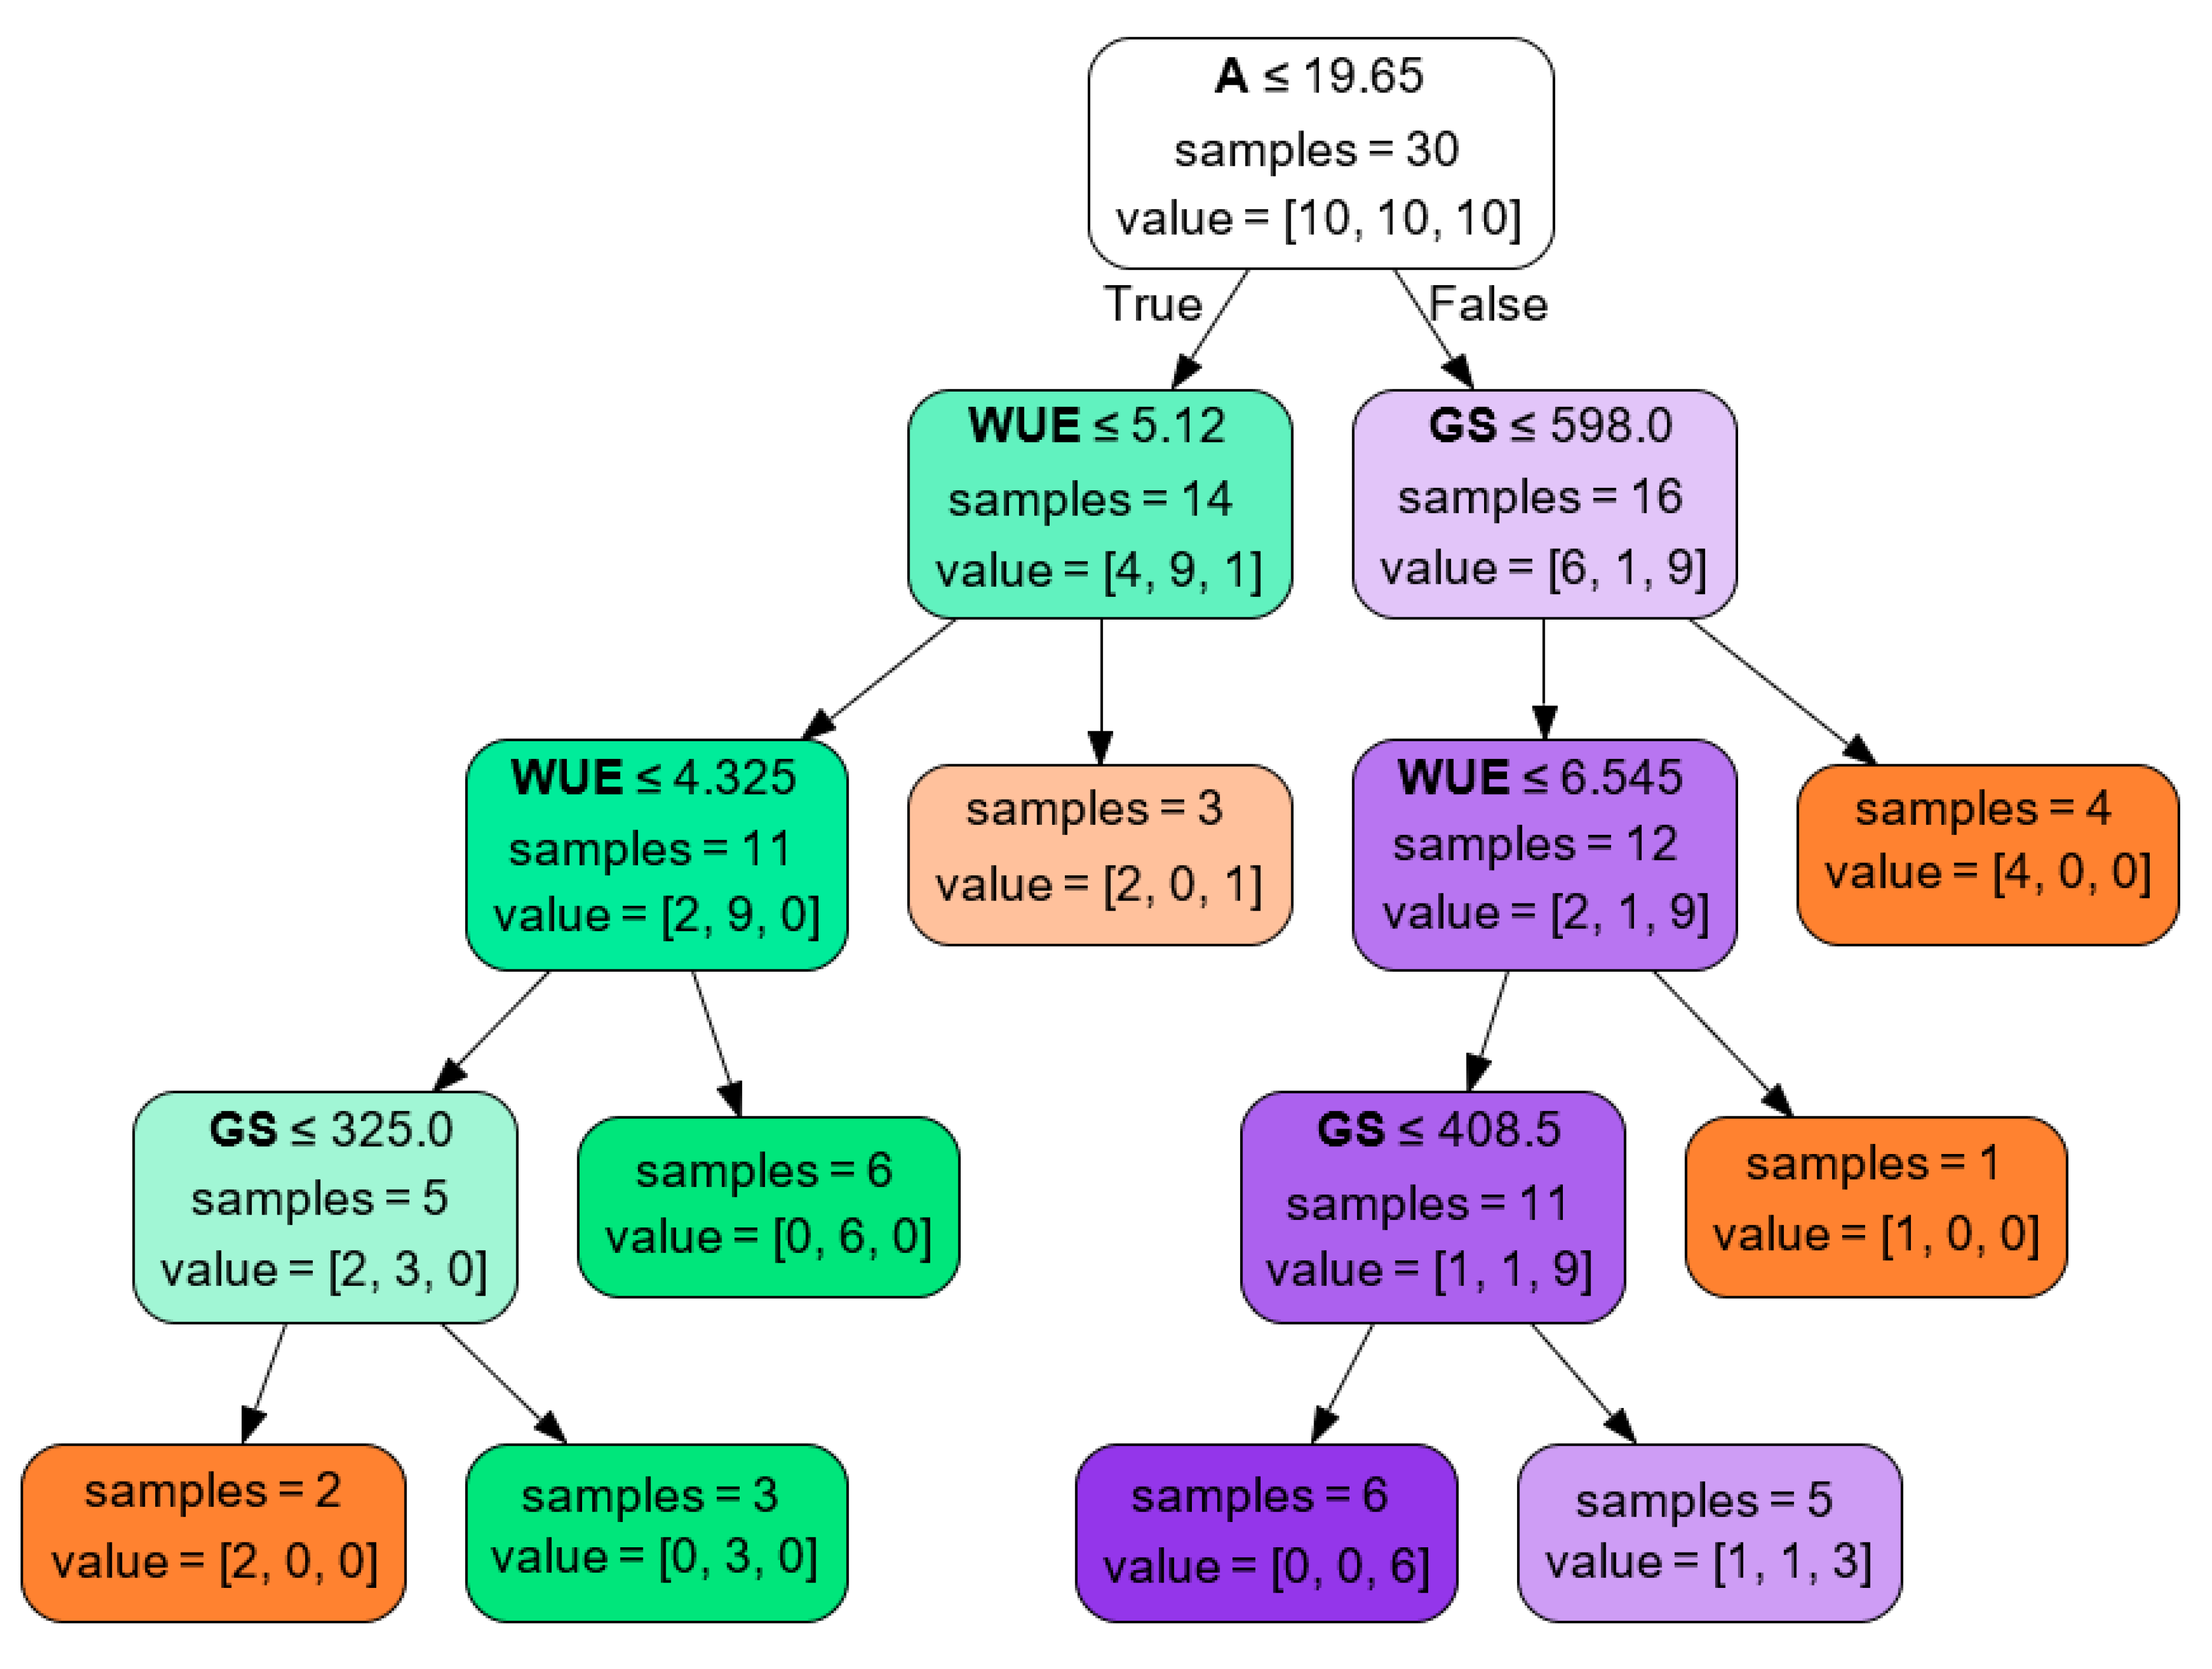
The classification tree showed that injury by S. bosqueella presented high stomatal conductance and similar photosynthetic rate and water use efficiency when compared to non-injured leaflets (Figure 5). Alternatively, when infested with S. cosmiodes, peanut leaflets showed decreased photosynthetic rate and water-use efficiencies and high stomatal conductance compared to S. bosqueella and the control.
4. Discussion
The main purpose of this study was to characterize relationships between peanut leaf defoliation and leaf reflectance and gas exchange parameters, focusing on two major South American peanut defoliators, S. bosqueella and S. cosmioides. We demonstrated that peanut leaf reflectance is different between herbivory by the two larval species, but similar among real and simulated defoliation. Similar results were obtained based on peanut leaf gas exchange, in which differences were noted 48 h after injury. Based on these results, the potential of using changes in leaf reflectance simultaneously with gas exchange parameters as indicators of biotic stress in the peanut is of particular interest to the study of plant-insect interactions and for incorporating remote sensing into peanut IPM programs.
We identified certain spectral regions that were especially sensitive to variation in plant stressors. Stress can be defined as “a departure from optimal physiological conditions” [40,41] and in our study, we observed that stressed leaves presented high reflectance in both the visible and NIR portions of the electromagnetic spectrum compared to non-stressed leaves. Generally, plant stress results in an increase in reflectance in the visible portion of the spectrum (400–700 nm) due to a decrease in chlorophyll a and b absorption; the opposite generally occurs in the NIR portion of the spectrum (750–2500 nm), with a decrease in reflectance driven by changes in the internal leaf structure [15,42]. The increase in NIR reflectance we observed in stressed peanut leaves could be related to variations in water content due to the infestation, which leads to a degeneration of the internal leaf structure at the cellular level [43,44]. Also, NIR reflectance is affected primarily by the leaf structure and is strongly associated with photosynthetic performance [45].
In this context, low photosynthetic rates (A) and changes in water use efficiency (WUE) observed in leaves injured by S. cosmioides may explain the high reflectance in the NIR portion of the spectrum and could be a useful indicator of photosynthetic potential. These results suggest that the leaf internal structure and leaf pigments are important to the classification of the peanut leaflets infested by the most important defoliator larvae that occur in South American peanut crops.
Similarly, ANOVA F-values analysis suggested that the NIR spectral data can be used to detect stress between S. bosqueella, S. cosmioides, and non-infested leaves. The importance of the NIR portion of the spectrum in characterizing biotic stress caused by defoliators was reported by Huang et al. [46] in rice leaves injured by Cnaphalocrocis medinalis (Lepidoptera: Crambidae) and Sudbrink et al. [47] in cotton (Gossypium hirsutum) injured by Spodoptera exigua and Trichoplusia ni (Lepidoptera: Noctuidae). Our finding is an important one because a wide variety of vegetation indices combine reflectance data in the NIR region to detect biotic stress, including, for example, the Normalized Difference Vegetation Index (NDVI) and the Green Normalized Difference Vegetation Index (GNDVI) [48].
Random Forest classification models of leaf reflectance provided a high accuracy of detection for S. bosqueella and S. cosmioides infestations. Also, the Kappa statistic values were greater than 0.80, representing a good agreement between the reference and predicted data [49]. Random Forest Classification models have been successfully applied to a wide range of hyperspectral data analyses [50,51,52,53,54,55]. It is important to emphasize that in our study we controlled for the effects of environmental factors and reflectance measurements were obtained from plant leaves and not plant canopies. With this in mind, in-field remote sensing presents additional challenges, including the leaf angle to the sensor and leaf location in the canopy with respect to shadowing, as well as other environmental variables that could affect radiometric resolution and consequently classification accuracy [12,50,56,57]. Also, due to recent advances in spatial classification algorithms, additional studies must evaluate spatial image classification for pest detection in peanut.
Similar to what has been observed in other studies [30,58,59,60,61,62,63,64,65], we did not observe significant effects on either the assimilation/respiration (photosynthetic rate) or in stomatal conductance, intercellular CO2 concentration, and transpiration at 24 h after defoliation by leaf-mass consumers. Differences in gas exchange of peanut leaves were only observed 48 h after infestation in the S. cosmioides injury treatment.
Therefore, in contrast to S. cosmioides, our results suggest that the principal effect of S. bosqueella larval-induced herbivory in peanut leaflets seems to be a leaf-mass reduction, not reduction of photosynthetic capacity of remaining leaf tissue. However, the injury by S. bosqueella is visually different. Rather than gross leaf-mass consumption like S. cosmioides, S. bosqueella leaves a layer of interveinal tissue, referred to as “windowpane injury” (Figure 1a). In addition, S. bosqueella feeds on meristematic tissues (buds), which can reduce plant development and alter plant architecture [20,66].
According to Higley et al. [39] and Peterson [18], insect herbivores can be grouped into categories known as injury guilds based on plant response, such as population or stand reduction, leaf-mass reduction, leaf photosynthetic-rate reduction, leaf senescence alteration, light reduction, assimilate removal, water-balance disruption, seed or fruit destruction, architecture modification, and phenological disruption. From an agronomic and pest management perspective, injury guilds can be used to develop multiple-species economic injury levels (EILs), as well contribute to accurate pest sampling programs [8,18,67,68]. However, results from this study suggest that injury from S. bosqueella and S. cosmioides most likely cannot be placed in the same injury guild for peanut cultivars that belongs to the runner vegetative group.
Because peanut leaves respond similarly to both real and simulated injury, both spectrally and physiologically, it is possible to use simulated injury to evaluate leaf-mass consumption from S. cosmioides. This is important because simulating insect defoliation offers distinct advantages in evaluating plant primary physiology, growth, and yield [69]. Importantly, however, our data here are restricted to only a particular developmental stage (i.e., flowering). In addition, because our experiment was conducted in controlled conditions, other studies will need to assess if environmental factors could have an influence on peanut plant spectral and biotic responses in field conditions.
We determined that remote sensing can be used to differentiate injured and non-injured leaves. That is an important step to use remote sensing in peanut sampling programs. However, for decision making, more information is needed (e.g., inferences about the presence of insects which are the target of control measures). Consequently, new studies should address this to improve remote sensing-based sampling programs in the peanut.
5. Conclusions
Our results reported here support the hypothesis that remote sensing in the NIR (777.42–1000 nm) portion of the spectrum can be used for classification of S. bosqueella and S. cosmioides injury. Also, we verified that S. bosqueella and S. cosmioides should be considered separately in sampling programs, and studies with simulated injury can be used to evaluate defoliator-induced stress in peanut. This information will contribute to incorporating remote sensing as an instrument to leverage the adoption of IPM programs for the peanut.
Supplementary Materials
The following are available online at https://0-www-mdpi-com.brum.beds.ac.uk/2072-4292/12/22/3828/s1, Figure S1: Average reference spectral reflectance for each of the five treatment groups.
Author Contributions
Conceptualization, J.P. and O.F.; methodology J.P., D.R. and O.F.; validation, J.P., S.P. and R.P.; formal analysis, J.P. and S.P.; investigation, J.P. and O.F.; resources, R.D. and O.F.; data curation, J.P.; writing—original draft preparation, J.P., S.P., R.P. and O.F.; writing—review and editing, J.P., S.P., R.P. and O.F.; visualization, J.P.; supervision, S.P., R.P. and O.F.; project administration, O.F.; funding acquisition, D.R. and O.F. All authors have read and agreed to the published version of the manuscript.
Funding
This research was funded by Coordenação de Aperfeiçoamento de Pessoal de Nível Superior–Brasil (CAPES), grant number 001.
Acknowledgments
We would like to thank the Agroindustrial Cooperative (Coplana), Brazil for technical assistance; Insect Biology Laboratory and Integrated Pest Management Laboratory of the Superior School of Agriculture “Luiz de Queiroz”, São Paulo University, Piracicaba, Brazil for the initial S. cosmioides colony and equipment support; Besides, we would like to sincerely thank the Department of Land Resources & Environmental Sciences and Montana State University for providing university facilities to help the study development.
Conflicts of Interest
The authors declare no conflict of interest.
References
- FAO—Food and Agricultural Organization of the United Nations. Global agriculture towards. In Expert Forum-How Feed World 2050; FAO—Food and Agricultural Organization of the United Nations: Rome, Italy, 2009; Volume 12, pp. 1–4. [Google Scholar]
- EMBRAPA— Brazilian Agricultural Research Corporation. Vision 2014–2034 The Future of Technological Development in Brazilian Agriculture; Embrapa: Brasilia, Brazil, 2014; pp. 1–194. [Google Scholar]
- Deutsch, C.A.; Tewksbury, J.J.; Tigchelaar, M.; Battisti, D.S.; Merrill, S.C.; Huey, R.B.; Naylor, R.L. Increase in crop losses to insect pests in a warming climate. Science 2018, 361, 916–919. [Google Scholar] [CrossRef] [PubMed] [Green Version]
- Gebbers, R.; Adamchuk, V.I. Precision Agriculture and Food Security. Science 2010, 327, 828–831. [Google Scholar] [CrossRef] [PubMed]
- Liu, H.; Lee, S.-H.; Chahl, J.S. A review of recent sensing technologies to detect invertebrates on crops. Precis. Agric. 2017, 18, 635–666. [Google Scholar] [CrossRef]
- Nansen, C.; Elliott, N.E. Remote Sensing and Reflectance Profiling in Entomology. Annu. Rev. Entomol. 2016, 61, 139–158. [Google Scholar] [CrossRef] [PubMed] [Green Version]
- Behmann, J.; Mahlein, A.-K.; Rumpf, T.; Römer, C.; Plümer, L. A review of advanced machine learning methods for the detection of biotic stress in precision crop protection. Precis. Agric. 2015, 16, 239–260. [Google Scholar] [CrossRef]
- Pedigo, L.P.; Rice, M.E. Entomology and Pest Management: Sixth Edition; Waveland Press, Inc.: Long Grove, IL, USA, 2014; pp. 255–286. [Google Scholar]
- Pedigo, L.P.; Hutchins, S.H.; Higley, L.G. Economic Injury Levels in Theory and Practice. Annu. Rev. Entomol. 1986, 31, 341–368. [Google Scholar] [CrossRef]
- Liu, Z.-Y.; Qi, J.-G.; Wang, N.-N.; Zhu, Z.-R.; Luo, J.; Liu, L.-J.; Tang, J.; Cheng, J.-A. Hyperspectral discrimination of foliar biotic damages in rice using principal component analysis and probabilistic neural network. Precis. Agric. 2018, 19, 973–991. [Google Scholar] [CrossRef]
- El-Ghany, N.M.A.; El-Aziz, S.E.A.; Marei, S.S. A review: Application of remote sensing as a promising strategy for insect pests and diseases management. Environ. Sci. Pollut. Res. 2020, 27, 33503–33515. [Google Scholar] [CrossRef]
- Hunt, E.R.; Rondon, S.I. Detection of potato beetle damage using remote sensing from small unmanned aircraft systems. J. Appl. Remote. Sens. 2017, 11, 11. [Google Scholar] [CrossRef] [Green Version]
- Hatfield, P.; Pinter, P. Remote sensing for crop protection. Crop. Prot. 1993, 12, 403–413. [Google Scholar] [CrossRef]
- Hatfield, J.L.; Gitelson, A.A.; Schepers, J.S.; Walthall, C.L. Application of Spectral Remote Sensing for Agronomic Decisions. Agron. J. 2008, 100, S-117. [Google Scholar] [CrossRef] [Green Version]
- Prabhakar, M.; Prasad, Y.G.; Rao, M.N. Remote Sensing of Biotic Stress in Crop Plants and Its Applications for Pest Management. In Crop Stress and its Management: Perspectives and Strategies; Springer: Berlin/Heidelberg, Germany, 2011; pp. 517–545. [Google Scholar]
- Lillesand, T.; Kiefer, R.W.; Chipman, J. Remote Sensing and Image Interpretation; John Wiley and Sons: Hoboken, NJ, USA, 2015. [Google Scholar]
- Carter, G.A.; Miller, R.L. Early detection of plant stress by digital imaging within narrow stress-sensitive wavebands. Remote Sens. Environ. 1994, 50, 295–302. [Google Scholar] [CrossRef]
- Peterson, R.K.D. Photosynthesis, yield loss, and injury guilds. In Biotic Stress and Yield Loss; CRC Press: Boca Raton, FL, USA, 2001; pp. 83–97. [Google Scholar]
- Schwachtje, J.; Baldwin, I.T. Why Does Herbivore Attack Reconfigure Primary Metabolism? Plant Physiol. 2008, 146, 845–851. [Google Scholar] [CrossRef] [PubMed] [Green Version]
- Pinto, J.R.L.; Boiça, A.L.; Fernandes, O.A. Biology, Ecology, and Management of Rednecked Peanutworm (Lepidoptera: Gelechiidae). J. Integr. Pest Manag. 2020, 11, 9. [Google Scholar] [CrossRef]
- War, A.R.; Paulraj, M.G.; War, M.Y.; Ignacimuthu, S. Differential defensive response of groundnut germplasms to Helicoverpa armigera (Hubner) (Lepidoptera: Noctuidae). J. Plant Interact. 2012, 7, 45–55. [Google Scholar] [CrossRef]
- Abbott, C.C.; Sarver, J.M.; Gore, J.; Cook, D.; Catchot, A.; Henn, R.A.; Krutz, L.J. Establishing Defoliation Thresholds for Insect Pest of Peanut in Mississippi. Peanut Sci. 2019, 46, 1–7. [Google Scholar] [CrossRef]
- Almeida, R.P. Technical Recommendations for Peanut Pest Insect Management; Embrapa Algodão: Campina Grande, Brazil, 2015; pp. 1–15. [Google Scholar]
- Akram, N.A.; Shafiq, F.; Ashraf, M. Peanut (Arachis hypogaea L.): A Prospective Legume Crop to Offer Multiple Health Benefits Under Changing Climate. Compr. Rev. Food Sci. Food Saf. 2018, 17, 1325–1338. [Google Scholar] [CrossRef] [Green Version]
- De Campos, A.P.; Boiça, A.L.; Jesus, F.G.; Godoy, I.J. Evaluation of peanut cultivars for Spodoptera frugiperda resistance. Bragantia 2011, 70, 349–355. [Google Scholar] [CrossRef] [Green Version]
- Junior, A.L.B.; Ferrarezi, R.; Rodrigues, N.E.L.; De Souza, B.H.S.; Bottega, D.B.; Da Silva, A.G. Resistance of peanut cultivars of upright and creeping habits to Spodoptera cosmioides in laboratory. Rev. Agro@mbiente On-Line 2013, 7, 80–88. [Google Scholar] [CrossRef]
- Pinto, J.R.L.; Fernandes, O.A. Parasitism capacity of Telenomus remus and Trichogramma pretiosum on eggs of moth pests of peanut. Bull. Insectol. 2020, 73, 71–78. [Google Scholar]
- Peterson, R.K.D.; Danielson, S.D.; Higley, L.G. Photosynthetic Responses of Alfalfa to Actual and Simulated Alfalfa Weevil (Coleoptera: Curculionidae) Injury. Environ. Entomol. 1992, 21, 501–507. [Google Scholar] [CrossRef]
- Macedo, T.B.; Peterson, R.K.D.; Weaver, D.K.; Morrill, W.L. Wheat Stem Sawfly, Cephus cinctus Norton, Impact on Wheat Primary Metabolism: An Ecophysiological Approach. Environ. Entomol. 2005, 34, 719–726. [Google Scholar] [CrossRef] [Green Version]
- Macedo, T.B.; Peterson, R.K.D.; Dausz, C.L.; Weaver, D.K. Photosynthetic responses of wheat, Triticum aestivum L., to defoliation patterns on individual leaves. Environ. Entomol. 2007, 36, 602–608. [Google Scholar] [CrossRef] [Green Version]
- Godoy, I.J.; Moraes, A.R.A.; Santos, J.F.; Michelotto, M.D.; Bolonhezi, D.; Freitas, R.S.; Cavichioli, J.C.; Carvalho, C.R.L.C.; Martins, A.L.M. High Oleic Peanut Cultivars: An Innovation for the Brazilian Producer and Consumer Market. Available online: http://oagronomico.iac.sp.gov.br/?p=1148 (accessed on 11 October 2020).
- Boiça Junior, A.L.; Ribeiro, Z.A.; Campos, A.P.; Chagas Filho, N.R. Breeding technique and biological parameters of Stegasta bosquella in peanut. Rev. Caatinga 2011, 24, 192–196. [Google Scholar]
- Delaney, K.J.; Haile, F.J.; Peterson, R.K.D.; Higley, L.G. Impairment of Leaf Photosynthesis After Insect Herbivory or Mechanical Injury on Common Milkweed, Asclepias syriaca. Environ. Entomol. 2008, 37, 1332–1343. [Google Scholar] [CrossRef]
- Pedregosa, F.; Varoquaux, G.; Gramfort, A.; Michel, V.; Thirion, B.; Grisel, O.; Blondel, M.; Prettenhofer, P.; Weiss, R.; Dubourg, V.; et al. Scikit-learn: Machine Learning in Python Gaël Varoquaux Bertrand Thirion Vincent Dubourg Alexandre Passos Pedregosa, Varoquaux, Gramfort et al. Matthieu Perrot. J. Mach. Learn. Res. 2011, 12, 2825–2830. [Google Scholar]
- SAS Institute Inc. SAS/IML® 14.1 User’s Guide; SAS Institute Inc.: Cary, NC, USA, 2015; pp. 1–524. [Google Scholar]
- Breiman, L. Random Forests. Mach. Learn. 2001, 45, 5–32. [Google Scholar] [CrossRef] [Green Version]
- Hawkins, D.M. The problem of overfitting. J. Chem. Inf. Comput. Sci. 2004, 44, 1–12. [Google Scholar] [CrossRef]
- Adelabu, S.; Mutanga, O.; Adam, E. Testing the reliability and stability of the internal accuracy assessment of random forest for classifying tree defoliation levels using different validation methods. Geocarto Int. 2015, 30, 810–821. [Google Scholar] [CrossRef]
- James, G.; Witten, D.; Hastie, T.; Tibshirani, R. An Introduction to Statistical Learning with Applications in R.; Springer: New York, NY, USA, 2013; pp. 303–332. [Google Scholar]
- Higley, L.G.; Browde, J.A.; Higley, P.M. Moving Towards New Understandings of Biotic Stress and Stress Interactions. In Humic Substances and Chemical Contaminants; Wiley: Hoboken, NJ, USA, 2015; pp. 749–754. [Google Scholar]
- Peterson, R.K.D.; Higley, L.G. Illuminating the black box: The relationship between injury and yield. In Biotic Stress and Yield Loss; CRC Press: Boca Raton, FL, USA, 2001; pp. 1–12. [Google Scholar]
- Carter, G.A.; Knapp, A.K. Leaf optical properties in higher plants: Linking spectral characteristics to stress and chlorophyll concentration. Am. J. Bot. 2001, 88, 677–684. [Google Scholar] [CrossRef] [Green Version]
- Liu, Y.; Zhang, C.; Chen, K.; Kovacs, J.M.; Flores-Verdugo, F.; De Santiago, F.J.F. Spectral response to varying levels of leaf pigments collected from a degraded mangrove forest. J. Appl. Remote Sens. 2012, 6, 63501. [Google Scholar] [CrossRef] [Green Version]
- Abdullah, H.; Darvishzadeh, R.; Wang, T.; Groen, T.A.; Heurich, M. European spruce bark beetle (Ips typographus, L.) green attack affects foliar reflectance and biochemical properties. Int. J. Appl. Earth Obs. Geoinf. 2018, 64, 199–209. [Google Scholar] [CrossRef] [Green Version]
- Slaton, M.R.; Hunt, E.R.; Smith, W.K. Estimating near-infrared leaf reflectance from leaf structural characteristics. Am. J. Bot. 2001, 88, 278–284. [Google Scholar] [CrossRef] [PubMed]
- Huang, J.; Liao, H.; Zhu, Y.; Sun, J.; Sun, Q.; Liu, X.-D. Hyperspectral detection of rice damaged by rice leaf folder (Cnaphalocrocis medinalis). Comput. Electron. Agric. 2012, 82, 100–107. [Google Scholar] [CrossRef]
- Sudbrink, D.L.; Harris, F.A.; Robbins, J.T.; English, P.J.; Willers, J.L. Evaluation of Remote Sensing to Identify Variability in Cotton Plant Growth and Correlation with Larval Densities of Beet Armyworm and Cabbage Looper (Lepidoptera: Noctuidae). Fla. Entomol. 2003, 86, 290–294. [Google Scholar] [CrossRef]
- Xue, J.; Su, B. Significant Remote Sensing Vegetation Indices: A Review of Developments and Applications. J. Sens. 2017, 2017, 1–17. [Google Scholar] [CrossRef] [Green Version]
- Landis, J.R.; Koch, G.G. The Measurement of Observer Agreement for Categorical Data. Biometrics 1977, 33, 159–174. [Google Scholar] [CrossRef] [Green Version]
- Fletcher, R.S.; Reddy, K.N. Random forest and leaf multispectral reflectance data to differentiate three soybean varieties from two pigweeds. Comput. Electron. Agric. 2016, 128, 199–206. [Google Scholar] [CrossRef]
- Bellante, G.; Powell, S.L.; Lawrence, R.L.; Repasky, K.S.; Dougher, T. Hyperspectral Detection of a Subsurface CO2 Leak in the Presence of Water Stressed Vegetation. PLoS ONE 2014, 9, e108299. [Google Scholar] [CrossRef]
- Vitrack-Tamam, S.; Holtzman, L.; Dagan, R.; Levi, S.; Tadmor, Y.; Azizi, T.; Rabinovitz, O.; Naor, A.; Liran, O. Random Forest Algorithm Improves Detection of Physiological Activity Embedded within Reflectance Spectra Using Stomatal Conductance as a Test Case. Remote Sens. 2020, 12, 2213. [Google Scholar] [CrossRef]
- Belgiu, M.; Drăguţ, L. Random forest in remote sensing: A review of applications and future directions. ISPRS J. Photogramm. Remote Sens. 2016, 114, 24–31. [Google Scholar] [CrossRef]
- Du, P.; Samat, A.; Waske, B.; Liu, S.; Li, Z. Random Forest and Rotation Forest for fully polarized SAR image classification using polarimetric and spatial features. ISPRS J. Photogramm. Remote Sens. 2015, 105, 38–53. [Google Scholar] [CrossRef]
- Rodriguez-Galiano, V.; Ghimire, B.; Rogan, J.; Chicaolmo, M.; Rigol-Sanchez, J. An assessment of the effectiveness of a random forest classifier for land-cover classification. ISPRS J. Photogramm. Remote Sens. 2012, 67, 93–104. [Google Scholar] [CrossRef]
- Campbell, J.B.; Wynne, R.H. Introduction to Remote Sensing Fifth Edition; The Guilford Press: New York, NY, USA, 2011; pp. 31–57. [Google Scholar]
- Yang, G.; Liu, J.; Zhao, C.; Li, Z.; Huang, Y.; Yu, H.; Xu, B.; Yang, X.; Zhu, D.; Zhang, X.; et al. Unmanned Aerial Vehicle Remote Sensing for Field-Based Crop Phenotyping: Current Status and Perspectives. Front. Plant Sci. 2017, 8, 1111. [Google Scholar] [CrossRef] [PubMed]
- Hall, F.R.; Ferree, D.C. Effects of Insect Injury Simulation on Photosynthesis of Apple Leaves. J. Econ. Entomol. 1976, 69, 245–248. [Google Scholar] [CrossRef]
- Welter, S.C. Responses of Tomato to Simulated and Real Herbivory by Tobacco Hornworm (Lepidoptera: Sphingidae). Environ. Entomol. 1991, 20, 1537–1541. [Google Scholar] [CrossRef]
- Higley, L.G. New Understandings of Soybean Defoliation and their Implication for Pest Management. In Pest Management in Soybean; Copping, L.G., Green, M.B., Rees, R.T., Eds.; Elsevier: London, UK, 1992; pp. 56–68. [Google Scholar]
- Peterson, R.K.D.; Higley, L.G.; Spomer, S.M. Injury by Hyalaphora cecropia (Lepidoptera: Saturniidae) and Photosynthetic Responses of Apple and Crabapple. Environ. Entomol. 1996, 25, 416–422. [Google Scholar] [CrossRef]
- Peterson, R.K.D.; Shannon, C.L.; Lenssen, A.W. Photosynthetic Responses of Legume Species to Leaf-Mass Consumption Injury. Environ. Entomol. 2004, 33, 450–456. [Google Scholar] [CrossRef] [Green Version]
- Davidson, J.L.; Milthorpe, F.L. The Effect of Defoliation on the Carbon Balance in Dactylis glomerata. Ann. Bot. 1966, 30, 185–198. [Google Scholar] [CrossRef]
- Poston, F.L.; Pedigo, L.P.; Pearce, R.B.; Hammond, R.B. Effects of Artificial and Insect Defoliation on Soybean Net Photosynthesis. J. Econ. Entomol. 1976, 69, 109–112. [Google Scholar] [CrossRef]
- Burkness, E.C.; Hutchison, W.D.; Higley, L.G. Photosynthesis Response of ‘Carolina’ Cucumber to Simulated and Actual Striped Cucumber Beetle (Coleoptera: Chrysomeli-Dae) Defoliation. Insect Sci. 1999, 6, 29–38. [Google Scholar] [CrossRef]
- Wall, R.G.; Berberet, R.C. Reduction in Leaf Area of Spanish Peanuts by the Rednecked Peanutworm. J. Econ. Entomol. 1979, 72, 671–673. [Google Scholar] [CrossRef]
- Higley, L.G.; Pedigo, L.P. Economic Thresholds for Integrated Pest Management; University of Nebraska Press: Lincoln, NE, USA, 1996; pp. 1–327. [Google Scholar]
- Hutchins, S.H.; Higley, L.G.; Pedigo, L.P. Injury Equivalency as a Basis for Developing Multiple-Species Economic Injury Levels. J. Econ. Entomol. 1988, 81, 1–8. [Google Scholar] [CrossRef]
- Baldwin, I.T. Herbivory simulations in ecological research. Trends Ecol. Evol. 1990, 5, 91–93. [Google Scholar] [CrossRef]
Figure 1.
(a) Stegasta bosqueella larval herbivory, (b) Stegasta bosqueella simulated defoliation, (c) Spodoptera cosmioides larval herbivory, (d) Spodoptera cosmioides simulated defoliation (e) Larvae restricted to a single freshly opened leaflet, and (f) hyperspectral image collection.
Figure 1.
(a) Stegasta bosqueella larval herbivory, (b) Stegasta bosqueella simulated defoliation, (c) Spodoptera cosmioides larval herbivory, (d) Spodoptera cosmioides simulated defoliation (e) Larvae restricted to a single freshly opened leaflet, and (f) hyperspectral image collection.

Figure 2.
Average reference spectral reflectance for each of the five treatment groups.

Figure 3.
Variable importance plot based on ANOVA F-values scores.

Figure 4.
Principal component analysis representation of spectral reflectance data deriving from larvae stressed and non-injured peanut leaves.
Figure 4.
Principal component analysis representation of spectral reflectance data deriving from larvae stressed and non-injured peanut leaves.

Figure 5.
Classification tree for Stegasta bosqueella (orange), Spodoptera cosmioides (green), and non-injured (purple) leaf injury based on gas exchange parameters. A-assimilation/respiration (μmol CO2 m−2 s−1); GS-stomatal conductance (mmol H2O m−2 s−1); WUE-photosynthetic water use efficiency (mmol CO2 mol−1 H2O).


Table 1.
Confusion matrix for Random Forest Classification model.
| Treatments | Predicted Class | |||||
|---|---|---|---|---|---|---|
| Stegasta bosqueella | Spodoptera cosmioides | Non-Injured (Control) | Classification Overall | User Accuracy | Overall Accuracy | |
| Stegasta bosqueella | 3 | 0 | 0 | 3 | 100% | 92% |
| Spodoptera cosmioides | 0 | 2 | 1 | 3 | 75% | |
| Non-Injured | 0 | 0 | 3 | 3 | 100% | |
| Truth Overall | 3 | 2 | 4 | 9 | ||
| Kappa Statistic | 0.83 | |||||
Table 2.
The mean (±SE) effect of treatments on gas exchange parameter performance and treatment contrast for 24 h after injury.
Table 2.
The mean (±SE) effect of treatments on gas exchange parameter performance and treatment contrast for 24 h after injury.
| 24 h after Infestation | |||||||
|---|---|---|---|---|---|---|---|
| Treatments | 1 A (μmol CO2 m−2 s−1) | 2 Ci (μmol CO2 mol−1) | 3 E (mmol H2O m−2 s−1) | 4 GS (mmol H2O m−2 s−1) | 5 Tleaf (°C) | 6 VPD (kPa) | 7 WUE (mmol CO2 mol−1 H2O) |
| Stegasta bosqueella | 21.06 ± 2.67 a | 843.50 ± 15.06 a | 4.63 ± 0.33 a | 494.80 ± 76.17 a | 25.85 ± 0.22 a | 1.20 ± 0.09 a | 4.43 ± 0.40 a |
| Spodoptera cosmioides | 19.25 ± 1.53 a | 846.40 ± 10.12 a | 4.53 ± 0.27 a | 427.20 ± 54.21 a | 26.02 ± 0.18 a | 1.27 ± 0.07 a | 4.22 ± 0.17 a |
| Simulated Stegasta bosqueella | 19.46 ± 2.11 a | 860.90 ± 8.45 a | 5.03 ± 0.43 a | 611.30 ± 92.76 a | 25.88 ± 0.19 a | 1.14 ± 0.11 a | 3.89 ± 0.25 a |
| Simulated Spodoptera cosmioides | 18.67 ± 1.76 a | 852.70 ± 18.24 a | 4.57 ± 0.26 a | 459.80 ± 57.47 a | 25.79 ± 0.18 a | 1.20 ± 0.07 a | 4.11 ± 0.37 a |
| Non-Injured (Control) | 22.45 ± 2.25 a | 850.60 ± 14.04 a | 5.10 ± 0.31 a | 618.10 ± 88.52 a | 25.82 ± 0.30 a | 1.12 ± 0.11 a | 4.35 ± 0.27 a |
| A (μmol CO2 m−2 s−1) | Ci (μmol CO2 mol−1) | E (mmol H2O m−2 s−1) | GS (mmol H2O m−2 s−1) | Tleaf (°C) | VPD (kPa) | WUE (mmol CO2 mol−1 H2O) | |
| Contrast | p value | p value | p value | p value | p value | p value | p value |
| Stegasta bosqueella × Spodoptera cosmioides | 0.5405 | 0.8424 | 0.8291 | 0.5059 | 0.5886 | 0.6380 | 0.6418 |
| Contrast | A | Ci | E | GS | Tleaf | VPD | WUE |
| p value | p value | p value | p value | p value | p value | p value | |
| Real Injury × Simulated Injury | 0.6019 | 0.2547 | 0.5091 | 0.3016 | 0.6526 | 0.4804 | 0.3043 |
Means (±SE) followed by the same letter within each column do not differ by the Tukey test (p > 0.05). 1 A-assimilation/respiration; 2 Ci-intercellular CO2 concentration; 3 E-transpiration; 4 GS-stomatal conductance; 5 Tleaf-leaf temperature; 6 VPD-leaf to air vapor pressure deficit; 7 WUE-photosynthetic water use efficiency.
Table 3.
The mean (±SE) effect of treatments on gas exchange parameters performance and treatments contrast for 48 h after injury. Bold values parameters indicate significant differences.
Table 3.
The mean (±SE) effect of treatments on gas exchange parameters performance and treatments contrast for 48 h after injury. Bold values parameters indicate significant differences.
| 48 h after Infestation | |||||||
|---|---|---|---|---|---|---|---|
| Treatments | 1 A (μmol CO2 m−2 s−1) | 2 Ci (μmol CO2 mol−1) | 3 E (mmol H2O m−2 s−1) | 4 GS (mmol H2O m−2 s−1) | 5 Tleaf (°C) | 6 VPD (kPa) | 7 WUE (mmol CO2 mol−1 H2O) |
| Stegasta bosqueella | 24.07 ± 1.35 a | 546.60 ± 16.52 a | 4.53 ± 0.17 a | 405.30 ± 33.78 a | 25.74 ± 0.09 a | 1.27 ± 0.05 a | 5.30 ± 0.22 a |
| Spodoptera cosmioides | 16.57 ± 1.05 b | 563.70 ± 22.71 a | 3.70 ± 0.28 a | 279.80 ± 34.92 a | 25.98 ± 0.11 a | 1.48 ± 0.07 a | 4.53 ± 0.12 a |
| Simulated Stegasta bosqueella | 20.68 ± 1.34 ab | 545.90 ± 18.16 a | 3.99 ± 0.30 a | 322.50 ± 52.98 a | 26.23 ± 0.20 a | 1.49 ± 0.10 a | 5.30 ± 0.27 a |
| Simulated Spodoptera cosmioides | 19.37 ± 2.22 ab | 567.20 ± 16.12 a | 3.84 ± 0.34 a | 308.80 ± 52.07 a | 26.01 ± 0.13 a | 1.48 ± 0.09 a | 4.97 ± 0.31 a |
| Non-Injured (Control) | 20.54 ± 1.86 ab | 542.20 ± 15.12 a | 4.22 ± 0.39 a | 383.90± 66.64 a | 26.04 ± 0.09 a | 1.39 ± 0.10 a | 4.95 ± 0.29 a |
| A (μmol CO2 m−2 s−1) | Ci (μmol CO2 mol−1) | E (mmol H2O m−2 s−1) | GS (mmol H2O m−2 s−1) | Tleaf (°C) | VPD (kPa) | WUE (mmol CO2 mol−1 H2O) | |
| Contrast | p value | p value | p value | p value | p value | p value | p value |
| Stegasta bosqueella × Spodoptera cosmioides | 0.0024 | 0.2956 | 0.0363 | 0.0495 | 0.1835 | 0.0504 | 0.0277 |
| Contrast | A | Ci | E | GS | Tleaf | VPD | WUE |
| p value | p value | p value | p value | p value | p value | p value | |
| Real Injury × Simulated Injury | 0.8570 | 0.9029 | 0.4487 | 0.5416 | 0.0449 | 0.1455 | 0.3582 |
Means (±SE) followed by the same letter within each column do not differ by the Tukey test (p > 0.05). 1 A-assimilation/respiration; 2 Ci-intercellular CO2 concentration; 3 E-transpiration; 4 GS-stomatal conductance; 5 Tleaf-leaf temperature; 6 VPD-leaf to air vapor pressure deficit; 7 WUE-photosynthetic water use efficiency.
Publisher’s Note: MDPI stays neutral with regard to jurisdictional claims in published maps and institutional affiliations. |
© 2020 by the authors. Licensee MDPI, Basel, Switzerland. This article is an open access article distributed under the terms and conditions of the Creative Commons Attribution (CC BY) license (http://creativecommons.org/licenses/by/4.0/).
Share and Cite
MDPI and ACS Style
Pinto, J.; Powell, S.; Peterson, R.; Rosalen, D.; Fernandes, O. Detection of Defoliation Injury in Peanut with Hyperspectral Proximal Remote Sensing. Remote Sens. 2020, 12, 3828. https://0-doi-org.brum.beds.ac.uk/10.3390/rs12223828
AMA Style
Pinto J, Powell S, Peterson R, Rosalen D, Fernandes O. Detection of Defoliation Injury in Peanut with Hyperspectral Proximal Remote Sensing. Remote Sensing. 2020; 12(22):3828. https://0-doi-org.brum.beds.ac.uk/10.3390/rs12223828
Chicago/Turabian StylePinto, José, Scott Powell, Robert Peterson, David Rosalen, and Odair Fernandes. 2020. "Detection of Defoliation Injury in Peanut with Hyperspectral Proximal Remote Sensing" Remote Sensing 12, no. 22: 3828. https://0-doi-org.brum.beds.ac.uk/10.3390/rs12223828
Note that from the first issue of 2016, this journal uses article numbers instead of page numbers. See further details here.