A Framework for Unsupervised Wildfire Damage Assessment Using VHR Satellite Images with PlanetScope Data


1
Department of Civil and Environmental Engineering, Seoul National University, 1 Gwanak-ro, Gwanak-gu, Seoul 08826, Korea
2
School of Convergence & Fusion System Engineering, Kyungpook National University, Sangju 37224, Korea
*
Author to whom correspondence should be addressed.
Remote Sens. 2020, 12(22), 3835; https://0-doi-org.brum.beds.ac.uk/10.3390/rs12223835
Submission received: 20 October 2020
/
Revised: 6 November 2020
/
Accepted: 20 November 2020
/
Published: 22 November 2020
Abstract
:The application of remote sensing techniques for disaster management often requires rapid damage assessment to support decision-making for post-treatment activities. As the on-demand acquisition of pre-event very high-resolution (VHR) images is typically limited, PlanetScope (PS) offers daily images of global coverage, thereby providing favorable opportunities to obtain high-resolution pre-event images. In this study, we propose an unsupervised change detection framework that uses post-fire VHR images with pre-fire PS data to facilitate the assessment of wildfire damage. To minimize the time and cost of human intervention, the entire process was executed in an unsupervised manner from image selection to change detection. First, to select clear pre-fire PS images, a blur kernel was adopted for the blind and automatic evaluation of local image quality. Subsequently, pseudo-training data were automatically generated from contextual features regardless of the statistical distribution of the data, whereas spectral and textural features were employed in the change detection procedure to fully exploit the properties of different features. The proposed method was validated in a case study of the 2019 Gangwon wildfire in South Korea, using post-fire GeoEye-1 (GE-1) and pre-fire PS images. The experimental results verified the effectiveness of the proposed change detection method, achieving an overall accuracy of over 99% with low false alarm rate (FAR), which is comparable to the accuracy level of the supervised approach. The proposed unsupervised framework accomplished efficient wildfire damage assessment without any prior information by utilizing the multiple features from multi-sensor bi-temporal images.
1. Introduction
Remote sensing techniques have been utilized to monitor ground surfaces in a broad range of fields, including disaster management. To perform rapid assessment of disaster damage, the acquisition of post-event very high resolution (VHR) images has been actively cooperated through cross-national programs such as the International Charter “Space and Major Disasters”’ initiative [1,2]. However, in most cases, the acquisition of pre-event satellite images is limited by the lack of availability of VHR images. The pre-event high-resolution images enable multi-temporal image analysis, which is known to improve the performance of land-cover mapping and change detection [3,4,5]. Obtaining VHR images from multiple sensors can increase the likelihood of acquiring adequate pre- and post-disaster images. Although the use of multi-temporal and multi-sensor images requires careful consideration to minimize the errors caused by differences in imaging conditions, such as sensors, orbit configurations, and atmospheric effects [6]; a well-defined pre-processing sequence could effectively alleviate the radiometric and geometric differences between the images [7,8]. Another set of crucial factors for the successful multi-temporal image analysis is the interval of acquisition time and the period in which change occurs, which affects the separability of the classes [9]. In principle, for rapid and reliable change detection, the acquisition dates of the two images should be as close as possible; otherwise, unwanted changes could be included in the results, such as phenological or anthropic changes [10].
Damage assessment studies on wildfire sites have focused on using Landsat imagery, monitoring the spectral responses from vegetation at 30 m resolution with short-wave infrared (SWIR) bands [11,12,13]. In addition, a combination of Landsat and Sentinel images was also studied based on the high data interoperability between the sensors [14,15]. Recently, with the increased distribution of VHR images, several studies intended to delineate the spatial details of the burned areas with VHR satellite images [8,16,17]. However, most of the bi-temporal images for these studies (WorldView-2 and GeoEye-1) were captured at a minimum interval of 1 year and used to detect long-term wildfire-induced changes. In other cases, two post-fire images were employed to estimate the forest recovery at wildfire sites. As mentioned above, the limitations of pre-disaster VHR image acquisition make it difficult to detect fine-scaled short-term changes.
Since PlanetScope (PS) images with 3 m resolution have become available on a daily basis [18], it could provide high-resolution pre-disaster information, showing significant potential for use in disaster management [19,20,21]. Thus, the integration of VHR and PS images can minimize other possible changes and enables the focus on targeted changes caused by wildfire. Close acquisition dates between multi-temporal images naturally reduce the need for highly elaborate image processing and are expected to produce reliable and accurate change detection results, even without SWIR bands, which are not available in most VHR images. Even though the availability of a massive PS database increases the chance of accurate image analysis, the selection of appropriate images through manual visual interpretation is a time-consuming task and delays overall damage assessment procedures. Image metadata provide image quality information for the entire scene; however, the image still needs to be assessed on local image quality and availability within the region of interest (ROI).
The study site is Gangneung–East Sea region and Goseong–Sokcho region, located in Gangwon province, South Korea, in which the severe large wildfires occurred in 2019. As one of the largest wildfires in national wildfire history, several researchers have performed wildfire damage assessment on the 2019 Gangwon wildfire [22,23,24]. To exploit the advantages of remote sensing images in disaster management, images from various platforms were included such as high-resolution satellite images and unmanned aerial vehicle (UAV) images. Won et al. [22] detected the changes in burned area and burn severity via analyzing satellite images from the Korea multi-purpose satellite-2 and -3 (KOMPSAT-2 and -3). In addition, considering the lack of SWIR bands in PS images, Kim et al. [23] performed histogram matching to integrate the spectral information of the burn index from Sentinel-2 to vegetation index from PS. Shin et al. [24] analyzed the forest burn severity of the Gangneung–East Sea region using UAV images with a spatial resolution of 31 cm. Although the aforementioned researchers produced the wildfire damage assessment results in high spatial resolution, these methods require manually generated samples to properly train the classifiers.
Previous unsupervised change detection approaches have included either the automatic generation of training data with high probabilities of no change or change or intermediate change detection results. In the case of the former, pseudo-training data were produced by thresholding specific features [25], e.g., spectral change vector, whereas in the case of the latter, multiple pixel-based change detection results were fused from three different algorithms into single object-based change detection results [26]. In the paper published by Wu et al. [27], superpixel-based change detection was performed using training data that were determined by voting from five binary classification results, each derived from spectral, textural, and contextual features. In both change detection approaches, thresholds are required to separate the region of change from the unchanged region; however, most of the widely used thresholding methods assume a specific data distribution, such as Gaussian distribution [28]. Therefore, statistical thresholding can limit the wide application of a change detection method, depending on the variations in data distribution.
To minimize human intervention, we proposed a framework for unsupervised wildfire damage assessment using VHR images with PS data. In the proposed framework, we substituted manual image selection to automatic image quality assessment using blur kernel estimation [29,30]. Moreover, a proposed change detection method was devised to generate pseudo-training data using thresholds with absolute numerical values, such that it could be implemented in other scenes regardless of the statistical distribution of the image data. This study is based on the scenario that rapid disaster damage assessment is required with the aid of available satellite images from different sensors. On the basis of this assumption, we proposed a fully unsupervised framework from image selection to change detection, specifically focusing on wildfire damage assessment.
The contribution of this study is that the proposed framework for wildfire damage assessment performs the overall process from image selection to change detection in an unsupervised manner without any prior information on data distribution. The only given information is an ROI, which is defined during the acquisition of the post-fire VHR satellite images. Furthermore, the simple structure of the proposed method extends the applicability of the method to other sites or other multi-sensor image combinations. Hence, the proposed unsupervised framework minimizes user intervention and enables the rapid implementation of the method while achieving high change detection accuracy.
The remainder of this paper is organized as follows. Section 2 illustrates the method used to assess the local image quality of PS images and to classify the scene using pseudo-training data. Section 3 presents the experimental results from the 2019 Gangwon wildfire in South Korea. In Section 4, the analysis of pseudo-training data was performed to evaluate the influence of sample data generation on the change detection accuracy. Finally, Section 5 outlines the conclusions of the study.
2. Methodology
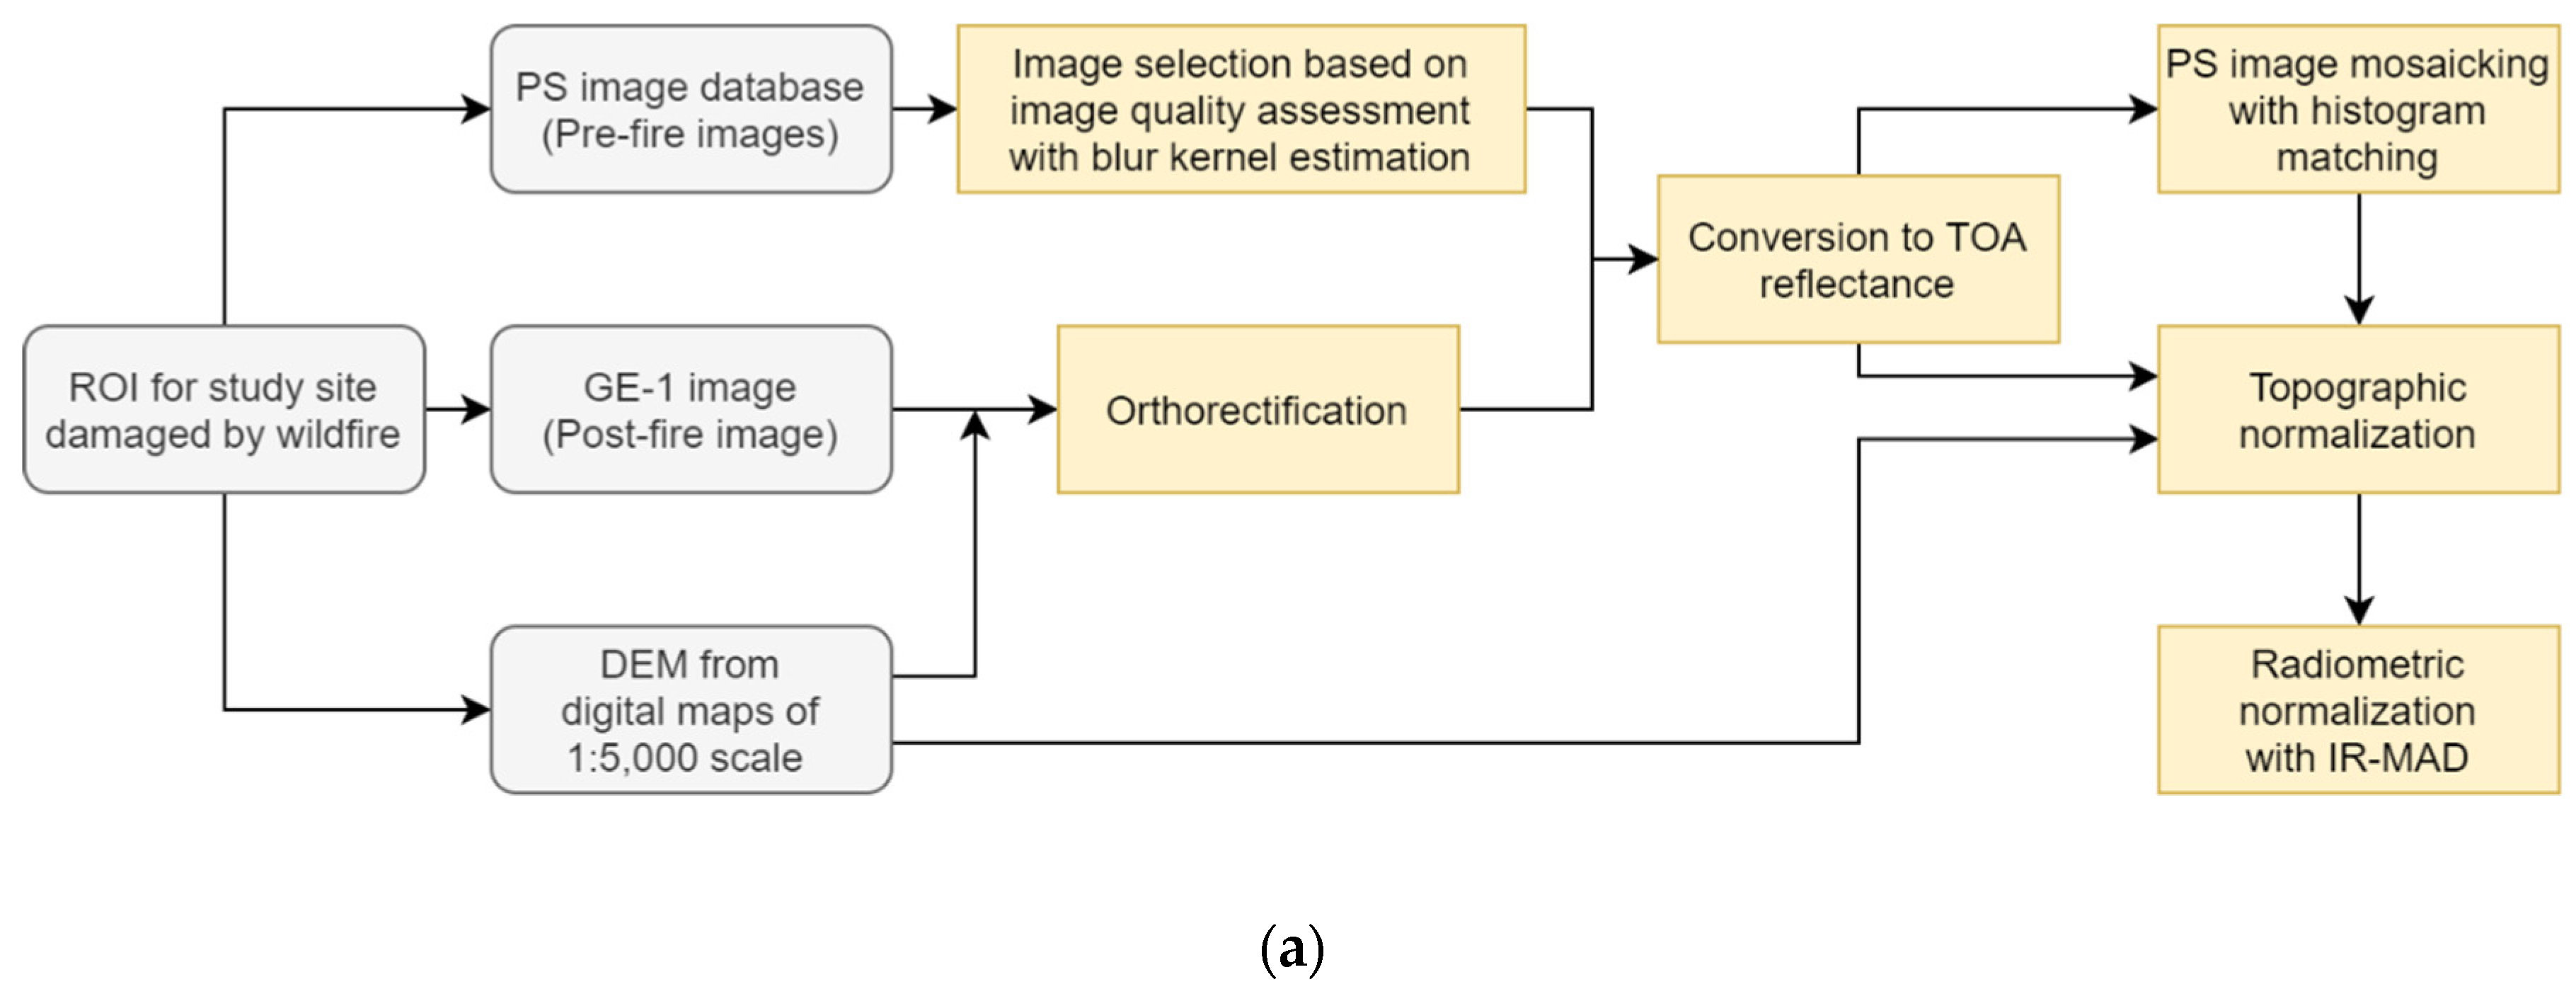
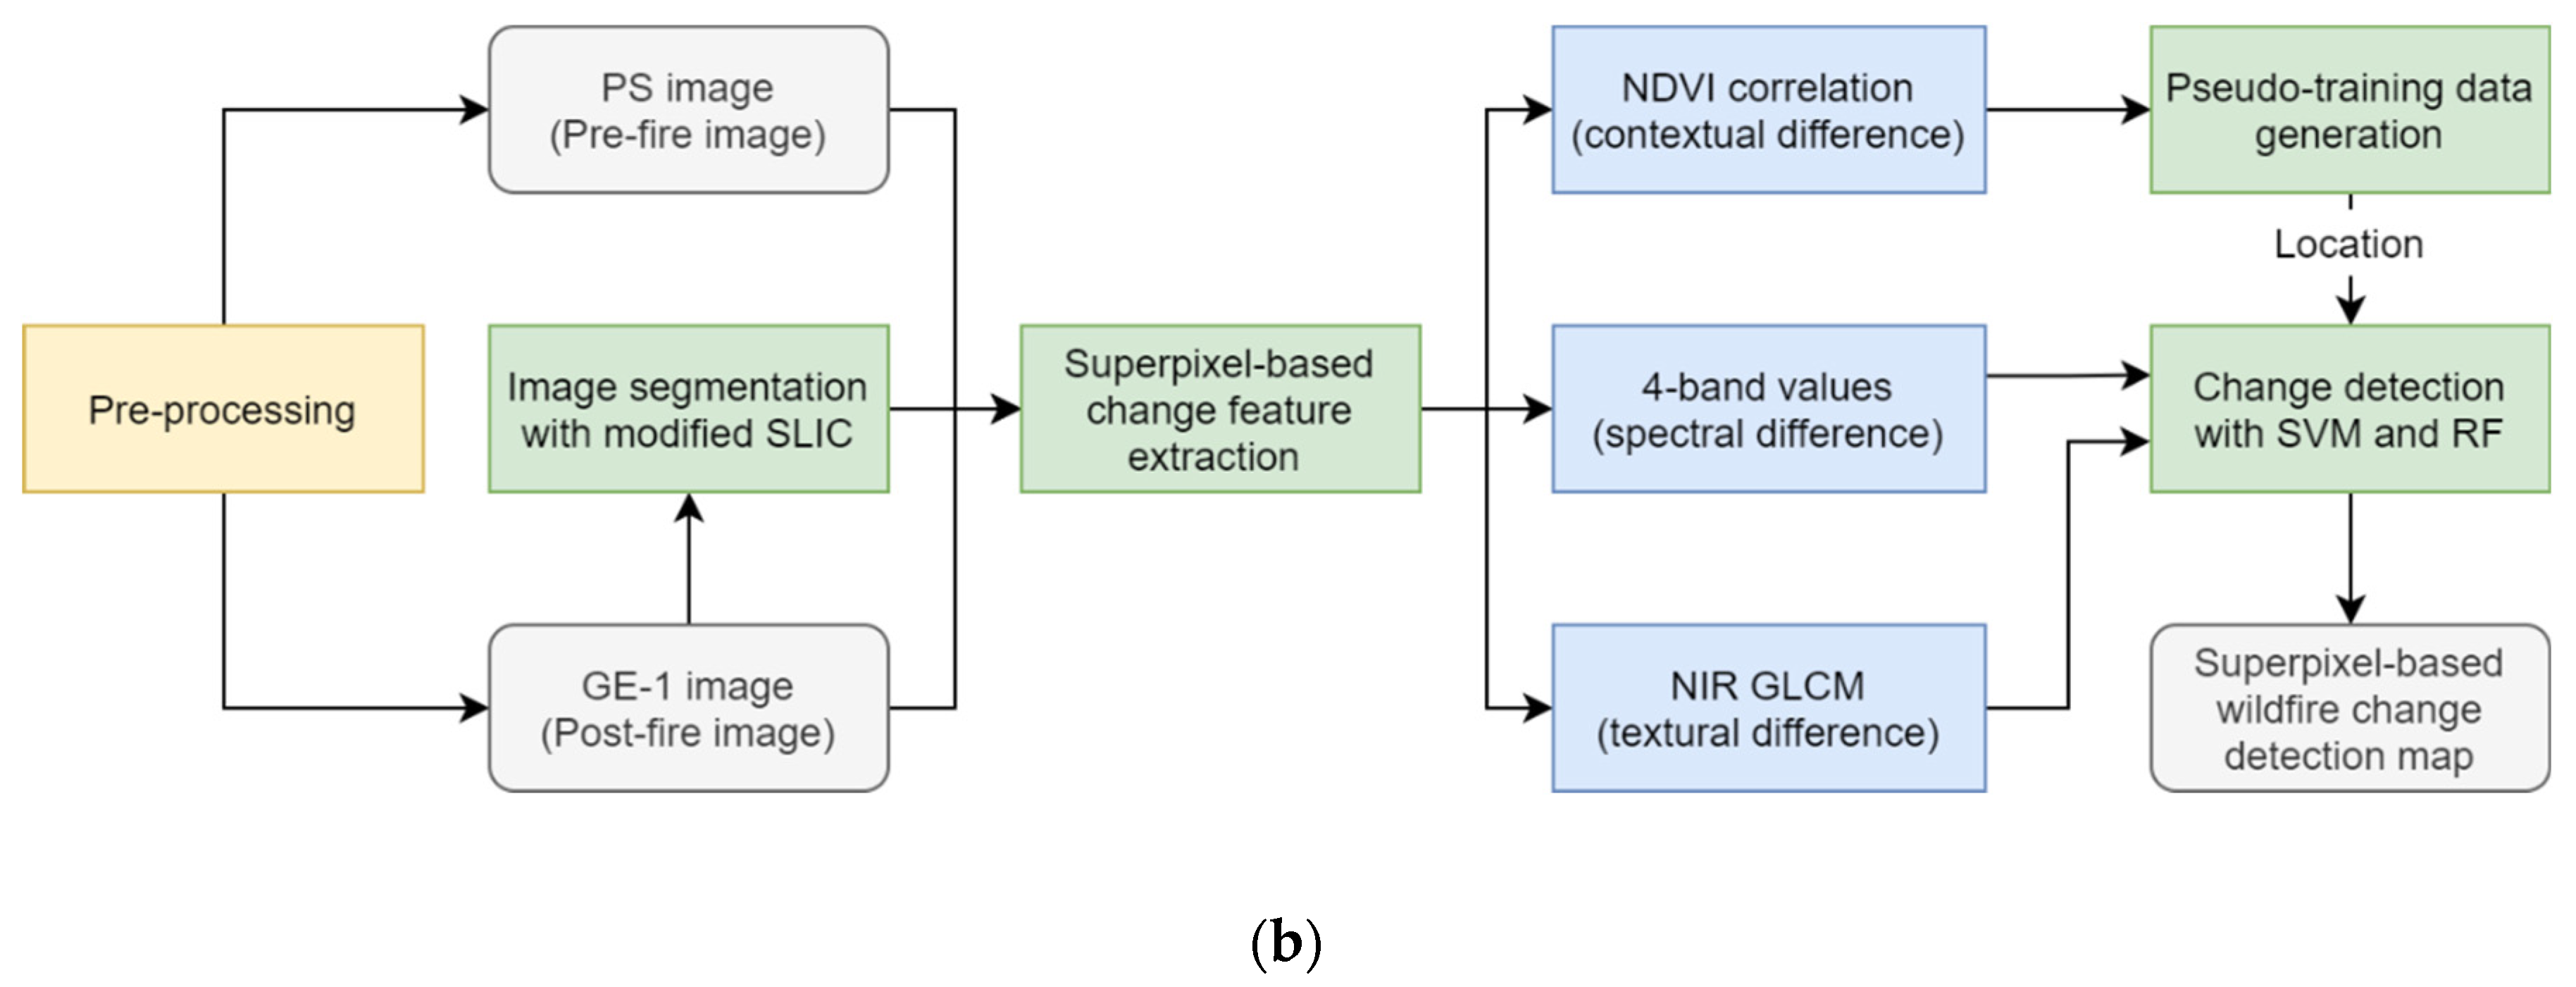
The overall process of the proposed framework is shown in Figure 1. First, PS image selection was performed based on the image quality assessment using blur kernel estimation to join the pre-fire PS images with post-fire GeoEye-1 (GE-1) images. Then, the differences in multi-sensor bi-temporal images were reduced through a series of pre-processing procedures, including orthorectification, reflectance conversion, image mosaicking, topographic normalization, and relative radiometric normalization, depending on the processing level of each image (Figure 1a). In the next step, using the image segmentation results from the post-fire GE-1 images, superpixel-based change features were calculated and employed to detect wildfire-induced damage with minimum user intervention. The following sub-sections provide a detailed explanation of each step.
2.1. Data Description
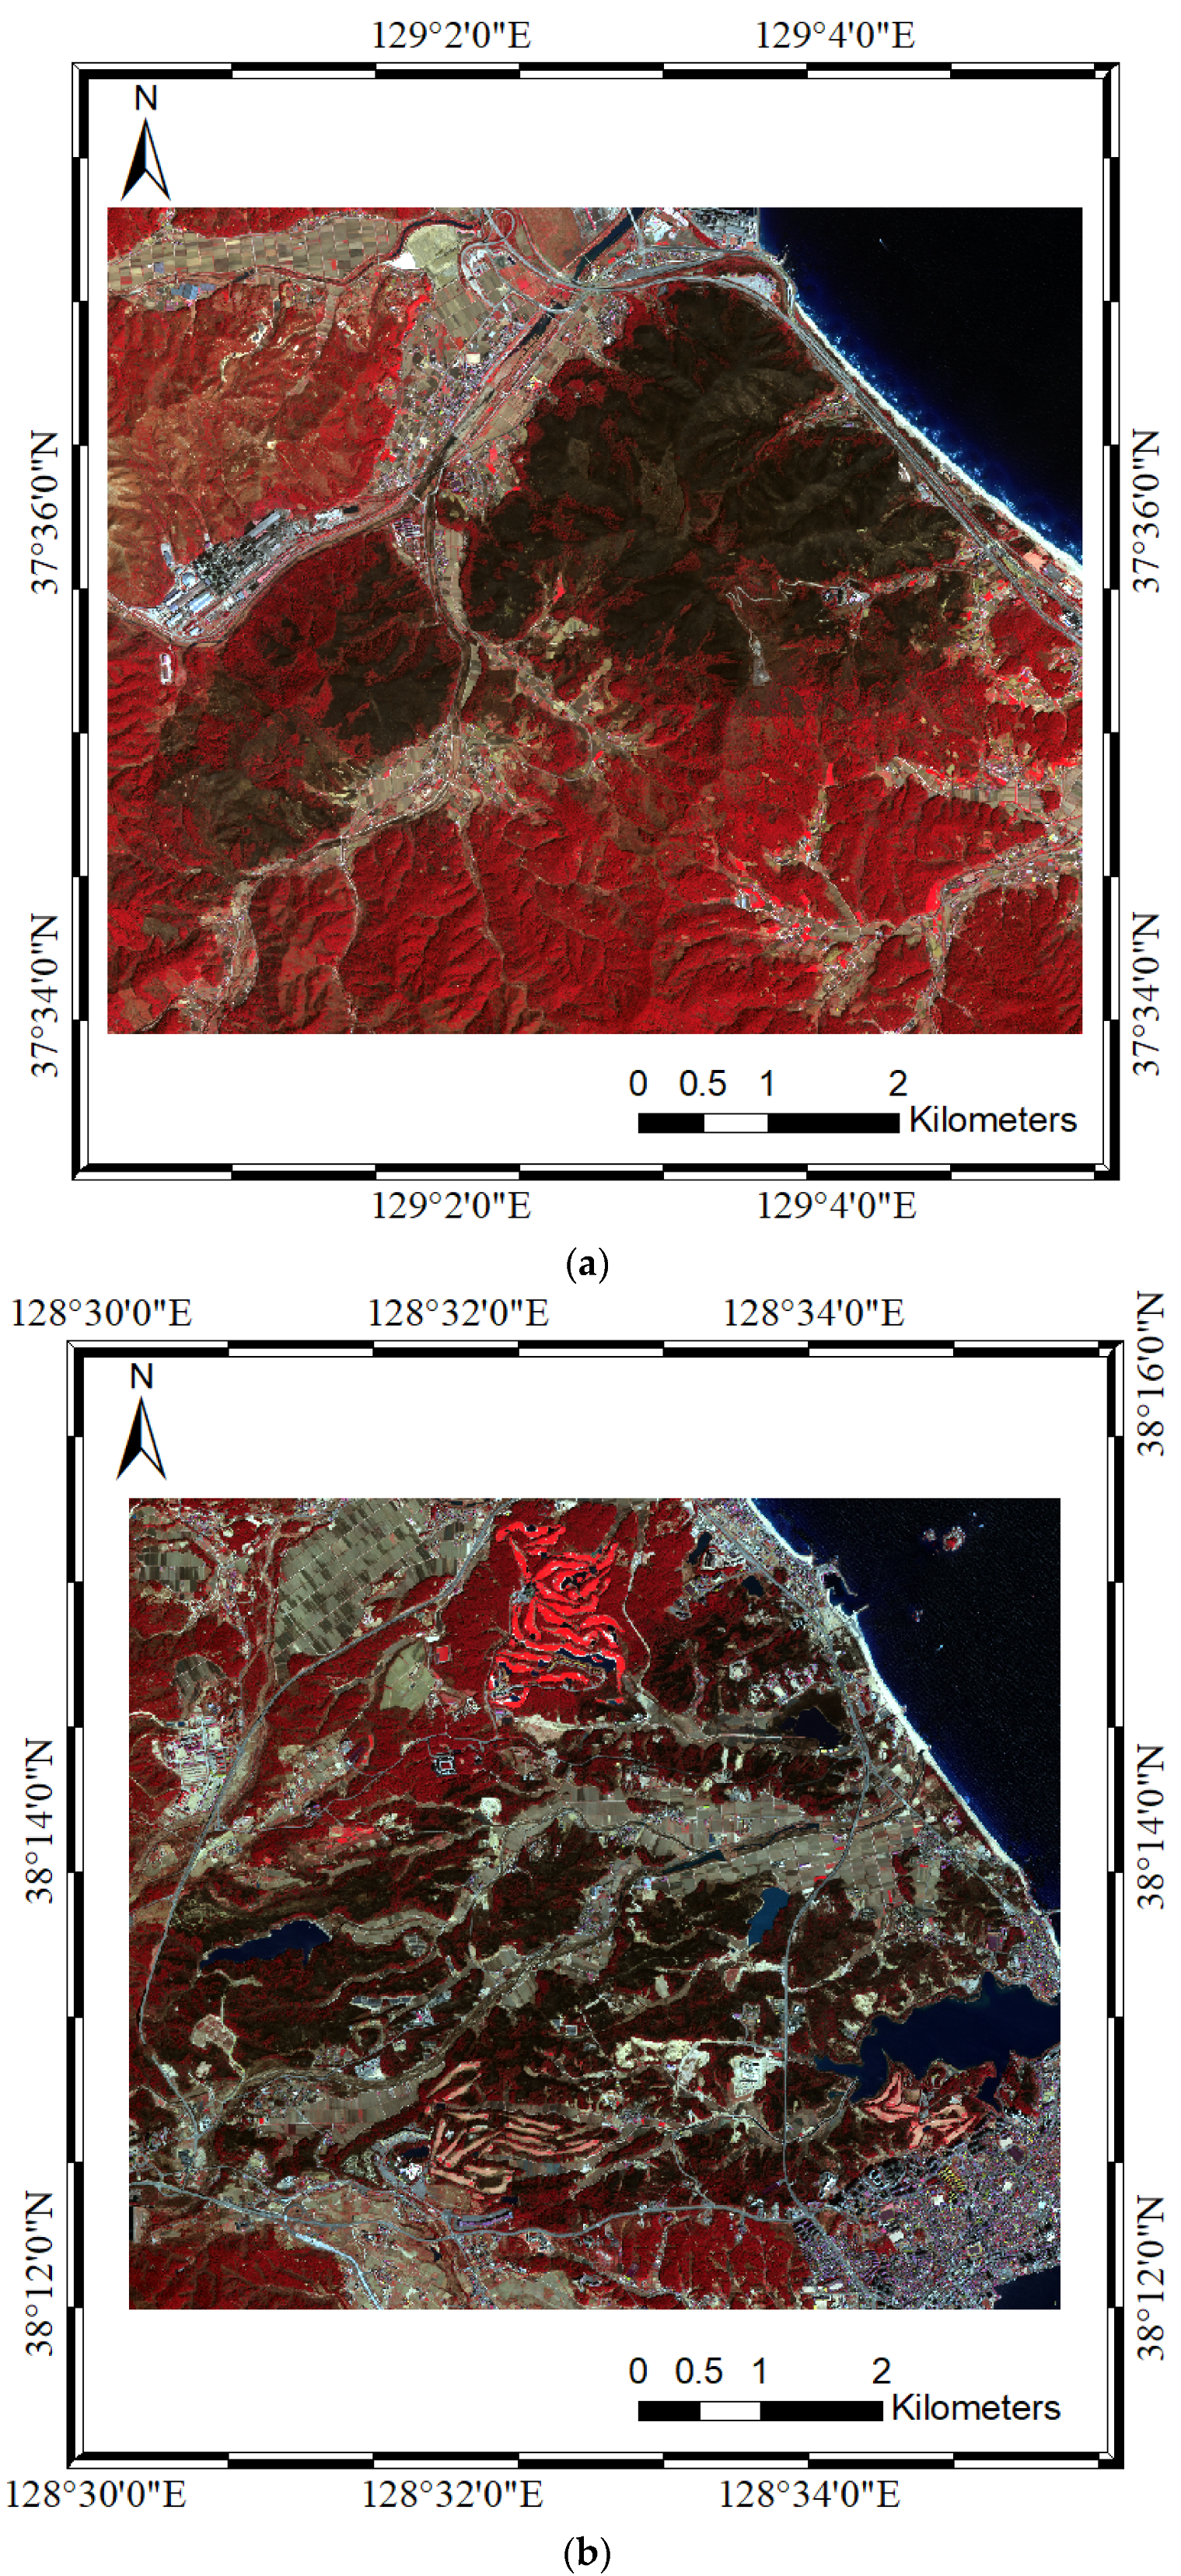
The study site is located in Gangwon province, South Korea, which suffered severe wildfires on April 4–5, 2019. In this area, two wildfires broke out simultaneously on April 4, one in the Gangneung–East Sea region and the other in the Goseong–Sokcho region. The main causes of the wildfires are presumed to be dry air from low precipitation and predominant pine stands with volatile pine resin. The forest areas damaged by the fires were reported as 1260 and 1227 ha for the two sites, respectively, by a field survey [31]. According to the criteria provided by the Korea Forest Service [32], which defined the scale of wildfires with burned areas larger than 100 ha as “large” (from large/medium/small), the 2019 Gangwon wildfire was recorded as one of the most severe large wildfire events in the nation’s history. The reason for employing both wildfire sites is to show the applicability of the proposed framework by providing an illustration of how the wildfire-induced damage could be assessed for two different wildfire sites.
Figure 2 shows the GE-1 VHR satellite images captured on 7 April 2019 after the full containment of the wildfire. Since GE-1 offers detailed spatial information of the burned area at 2.0 m spatial resolution for four multispectral (MS) bands, GE-1 was used as post-fire images to estimate the damage on vegetation (Table 1). Meanwhile, PS images were utilized to obtain the pre-fire spectral responses from the ground with 3.0 m spatial resolution. With the high temporal resolution of 1 day, PS increased the chance of bi-temporal image analysis, which is known to improve change detection performance. However, it requires a significant amount of labor to select appropriate pre-fire PS images from the massive PS database. Thus, pre-fire PS images were collected for ROI, and local image quality of the PS images were assessed based on the method presented in Section 2.2. To analyze the proper threshold for the image quality metric, 25 and 37 images were acquired before and after the wildfire events from the Gangneung–East Sea region and Goseong–Sokcho region, respectively. Then, 21 and 16 images were respectively selected for the study sites based on the provided image metadata. As the image metadata represent the quality of the entire scene, they were used as the minimum criteria to satisfy the positional and radiometric accuracy: (1) “TRUE” for ground control; (2) cloud coverage lower than 10%; and (3) “standard” for quality category, which was determined by considering the sun altitude, off-nadir view angle, and percentage of saturated pixels [18]. Additionally, some PS images were also excluded when the coverage area within the ROI was too small to create image patches of the given size. All the PS images tested were obtained from the Planet Education and Research program [33].
2.2. Image Quality Assessment for PS Image Selection
As mentioned above, the following steps were performed in an unsupervised manner, minimizing user intervention. To select adequate PS images for disaster damage assessment, individual images were evaluated to detect clouds, haze, and smoke from the fire within the image. Furthermore, we expected to discern the other factors that may degenerate the clarity of the images by means of an image quality assessment step.
Blur kernel estimation with L0-regularized intensity and gradient prior was initially devised for text image deblurring [29,30]; however, this method also showed its effectiveness on natural images through the implementation of adaptive threshold initialization. Anger et al. [34] applied this method to assess the sharpness of PS images and analyzed the influence of orthorectification on image quality. With numerous datasets from various locations, the previous study validated the fact that image quality of satellite images can be evaluated with the blur kernel.
The principal idea of this blur kernel estimation is the incorporation of the gradient and intensity prior in L0-regularization form [29]:
where σ is the weight for the intensity prior and Pt(x) is the number of nonzero values in image x. The prior is used as a regularization term for image deblurring as
where x and y are the latent image and blurred image, respectively, and k refers to the blur kernel. P(x) is the L0-regularized intensity and gradient prior, and λ and γ are the weights for P(x) and the L2-regularized term on blur kernel k. To derive the solution for image x and kernel k, the above problem is divided into two sub-problems regarding x and k, respectively. Then, the algorithm iterates the blur kernel k and latent image x alternately through the following equations:
As a by-product of blind deblurring, the blur kernel is advantageous in its fully blind and automatic approach, which in agreement with the goal of this framework. The estimated blur kernel can be used as a measure for image quality and enables the comparison of images, regardless of image content. As previous studies on text and natural images [29,30] and on PS images [34] focused on image processing on an image-by-image basis, a single blur kernel was calculated for each image for the entire scene. However, considering the purpose of this study, the PS image selection step of our framework was formulated to examine the availability of PS images in the ROI. In addition, the micro-satellite constellation of PS contains an intrinsic inconsistency in the image quality between images [35,36] and, likewise, within a single image. For this reason, local image quality assessment was performed by splitting the images into patches and measuring the blur kernel for each image patch. The metric for image quality was named the sharpness score (S) in [34], defined in the L2-norm of the blur kernel,
which ranges from 0 to 1 by normalization of the kernel. The size of S represents the sharpness of the image—the larger the S value, the clearer the image. In this study, we assume that image patches with S values under a certain threshold contain image quality degradation factors, including atmospheric elements and other radiometric defects. In Section 3.1, the threshold was determined based on the distribution analysis on S, and evaluation was performed to validate the discrimination ability of the proposed local image quality assessment method. From the number of low-quality image patches per image, PS images were sorted depending on their usability. Then, image conditions such as image coverage and acquisition time were considered to determine the images with the nearest acquisition time before the outbreak of the event within the ROI.
2.3. Image Pre-Processing
For multi-sensor image applications, image pre-processing is very important in reducing the differences in images from multiple sources with different sensors and orbit configurations [37]. Pre-processing includes orthorectification, image mosaicking, reflectance conversion, topographic normalization, and relative radiometric calibration (Figure 1a). In this study, GE-1 and PS images were adjusted through certain geometric and radiometric calibrations, depending on the processing level. First, for GE-1, the images were orthorectified using rational polynomial coefficients (RPCs) with a 2.0 m high-resolution digital elevation model (DEM). DEMs for the two study sites were derived from a digital topographic map on a scale of 1:5000, which was provided by the Geospatial Information Hub of Korea, National Geographic Information Institute (http://map.ngii.go.kr). Subsequently, the orthorectified GE-1 images were projected onto the Universal Transverse Mercator coordinate system (UTM, Zone 52 North) with the World Geodetic System 1984 (WGS84). Considering the scale of change targeted for detection, the panchromatic band of GE-1 was not employed in the proposed framework because the spatial resolution of MS bands (2.0 m) was sufficient to delineate the spatial details of the burned area. Since PS Level-3B Analytic products are geometrically corrected with fine DEM and distributed in UTM projection with WGS84 datum [18], no additional geometric calibration was performed for PS images. After orthorectification, VHR satellite images from GE-1 and PS showed subtle misalignment, despite the absence of a co-registration step.
With respect to radiometric calibration, the orthorectified images were converted to at-sensor reflectance using the conversion coefficients from the image metadata. As PS images were acquired in continuous strips, image mosaicking was performed with edge feathering and histogram matching to cover the entire area of the ROI. In addition, PS images were resampled to 2 m spatial resolution to match with the spatial resolution of the corresponding GE-1 data. The reason for the resampling of the PS images is to preserve fine-scaled spatial information from the higher resolution of GE-1 images through the bi-temporal image analysis. Then, both GE-1 and PS images went through topographic normalization to eliminate the radiometric distortions caused by the imaging conditions of the given sensor and roughness of the ground surface. Terrain normalization techniques can typically be classified as Lambertian and non-Lambertian approaches, depending on the assumed surface reflectance characteristics [38]. Based on a model that relates the reflectance value to the imaging conditions, topographic normalization calibrates the brightness differences from the surface curvature [39,40,41]. In doing so, the above-mentioned high-resolution DEM was also employed to produce accurate topographic normalization results as a DEM with a lower resolution may serve as a source of error. In particular, when it comes to a forest in mountainous regions, in-depth consideration is necessary for the determination of an appropriate technique for terrain normalization. Thus, our previous study [42] determined the optimal technique for each band for wildfire sites consisting of heterogeneous land-cover types. The experimental results concluded that the empirical rotation model [41] and C-correction model [39] could be applied effectively for the RGB and near-infrared (NIR) bands, respectively. Using the optimal topographic normalization method for each band, the radiometric influence of imaging and illumination conditions was offset by linear regression with pixels within the individual image before the inter-sensor radiometric calibration was performed. Finally, PS images were radiometrically normalized with the iteratively re-weighting multivariate alteration detection (IR-MAD) method [43] with respect to GE-1 images to reduce the radiometric differences between the two images and produce more consistent bi-temporal spectral responses, even without absolute atmospheric corrections [44].
2.4. Unsupervised Object-Based Change Detection
In the unsupervised object-based image analysis procedure, change detection was preceded by image segmentation and pseudo-training data generation. First, post-fire GE-1 images were over-segmented to reduce image complexity and preserve the spatial detail of the VHR satellite images. The simple linear iterative clustering (SLIC) technique is well known for producing uniform superpixels while maintaining high adherence to edges [45]. Along with the generic images for computer vision applications, SLIC showed satisfactory performance in the segmentation of VHR satellite images in a rapid manner, with fewer input parameters than widely used multiresolution segmentation methods [46]. RGB images serve as input for SLIC with the expected superpixel size from the desired number of superpixels per image. SLIC performs image segmentation through local clustering with color and spatial information by projecting the RGB colors into the CIELAB color space, which was devised to represent human visual perception. However, discrimination of the burned area from the surrounding vegetation can be difficult depending on the phenological response from plants. Thus, false-color composite images with NIR, red, and green bands were used as input images to perform SLIC rather than the original RGB images. Such replacement in SLIC input images could improve the image segmentation results by visual enhancement with the proper band combinations. Despite the simplicity and efficiency of SLIC, the segmentation results may include some mixed superpixels, owing to enforced connectivity by a post-processing step after local clustering [45]. To overcome the limitations of SLIC, several variants of the SLIC were proposed for high-resolution remote sensing images, e.g., the integration of textural information within the clustering process [47] and the purification of mixed superpixels through color quantization [48]. In this study, a modified SLIC [49] method was employed, which introduced the sigma filter to update the cluster centers and contained additional constraints based on luminance similarity to treat disjoint pixels. While this method constrained the homogeneity within a superpixel, the number of resulting superpixels outnumbered the desired number of superpixels because of the superpixels with small number of pixels. Since too small superpixels make the calculation of superpixel-based features difficult, we set the minimum size of a single superpixel and assigned the label of the neighboring superpixel that showed the highest similarity in luminance. The revised method produced superpixels with reinforced interior homogeneity and reduced the number of clusters to a value close to the desired number of superpixels. In the following step, the image segmentation results from the post-fire GE-1 images were applied to the corresponding pre-fire PS images, and bi-temporal object-based features were calculated for each superpixel.
For image analysis on VHR remote sensing images, the integration of different types of features, such as textural [50,51] and contextual [52] features, is known to improve the performance of the classifier. Previous studies [25,27] on unsupervised change detection have demonstrated the influence of integrating multiple features, as the performance of classification [27] with spectral, textural, and contextual features outperformed the case [25] when only spectral features were employed as an input for classification. Likewise, our work focused on the integration of spectral, textural, and contextual information within the unsupervised change detection framework. Thus, the proposed change detection workflow is composed of two stages: (1) pseudo-training data generation and (2) change detection. However, unlike the aforementioned related studies, input features for the two stages should be independent of each other to fully utilize the different properties. Otherwise, the results could be biased toward particular features.
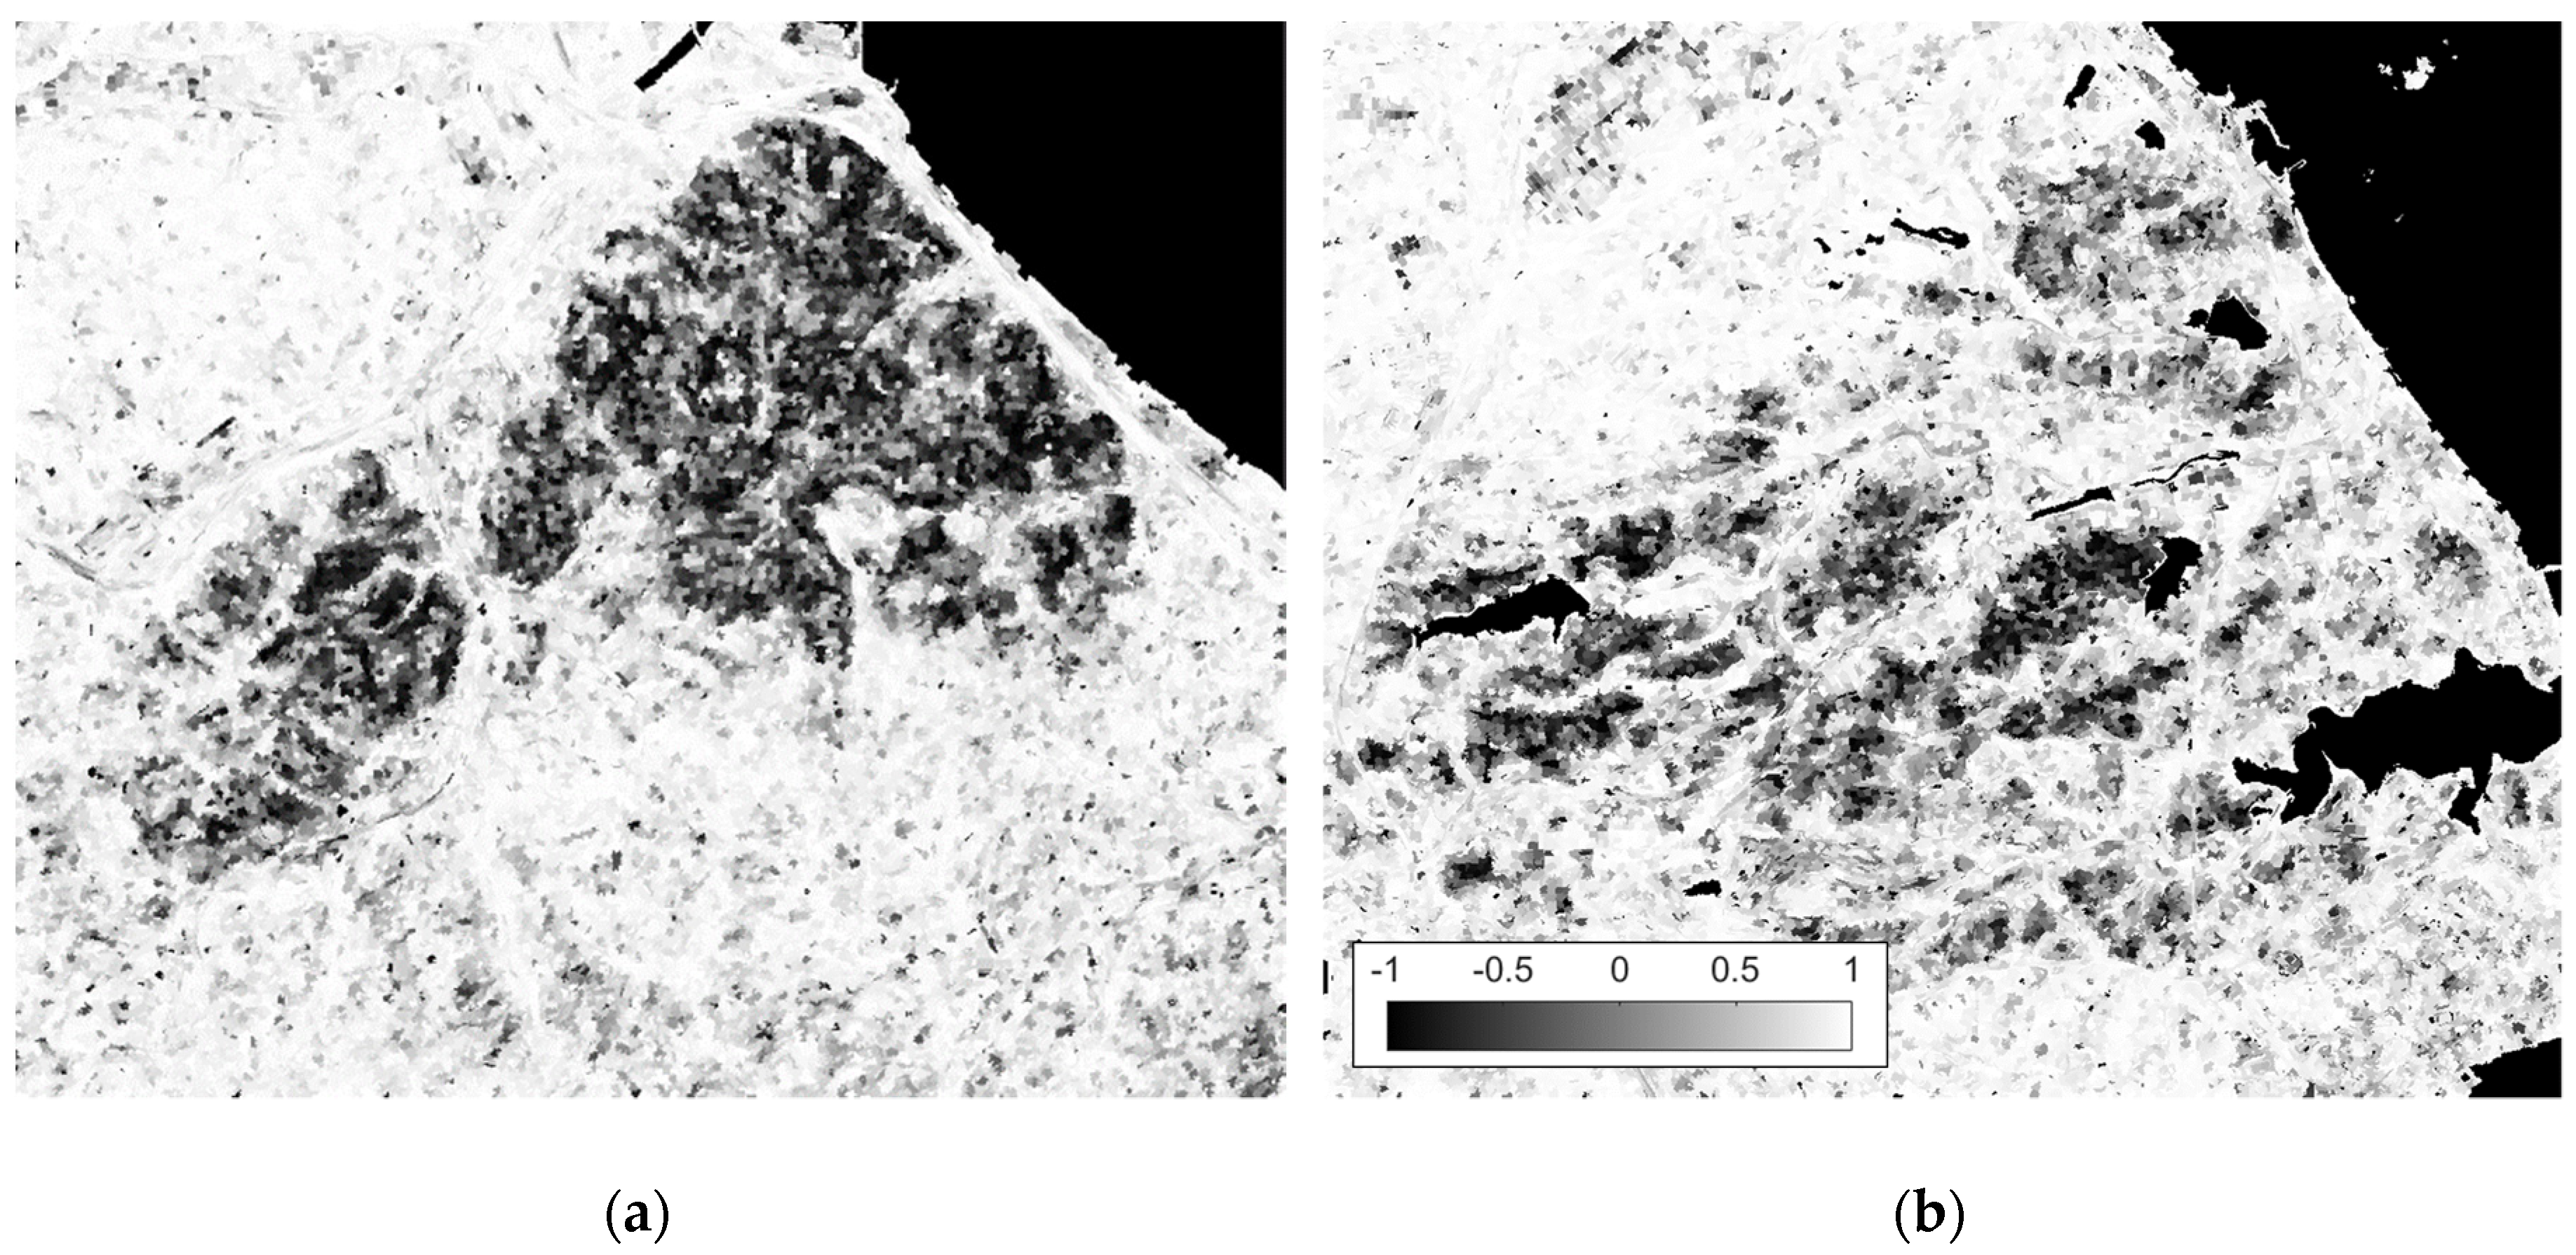
Pseudo-training data used for change detection should effectively represent the possibility of change but should be acquired without site-specific or scene-specific procedures. Accordingly, we employed bi-temporal superpixel-level contextual information, which is defined as the correlation between the pre-fire and post-fire normalized difference vegetation index (NDVI), to distinguish the spatial information (location) of change [27]:
where μ is the mean of NDVI values for a given superpixel i and xi is the mean of NDVI values from the superpixels neighboring superpixel i. Parameter m refers to the number of neighboring superpixels with i, and the subscripts t1 and t2 represent the values from the pre-fire PS and post-fire GE-1 images, respectively. The value of r denotes the bi-temporal correlation of NDVI, showing values ranging from −1 to 1. Since correlation r is the value representing the degree of consistency in bi-temporal vegetation responses, simple thresholding can be applied to distinguish the burned area from the unburned area by the predefined values. To train the binary classifier, the pseudo-training data were labeled as “changed” and “unchanged”, while the others were left as “undefined”. Superpixels with negative r values were sampled as “changed”, and superpixels with r values greater than 0.95 were selected as “unchanged” to distinguish the superpixels with high probabilities of no change and change, regardless of land cover type.
Using the spatial information of pseudo-training data, change detection was performed using support vector machine (SVM) and random forest (RF) algorithms. SVM was originally designed for binary classification and is still widely used, owing to its robustness in distribution and dimension of data with high generalizability [53]. In some cases [54], SVM even showed better performance in remote sensing image classification than deep learning techniques, such as sparse auto-encoders. RF is also a widely applied machine learning algorithm that has demonstrated improvement in classification accuracy through the combination of predictions from individually trained decision trees [55]. As the input data for the SVM and RF algorithms, spectral and textural features were calculated for the previously labeled superpixels. These bi-temporal features were computed in the form of normalized differences, because the change features are known to be more suitable for change detection than simply stacking the bi-temporal features [51]. Specifically, the normalized differences of the mean band values of four spectral bands and eight textural statistics from the gray-level co-occurrence matrix (GLCM) of the NIR band were calculated for each superpixel. Thus, four spectral and eight textural features were assigned to a single superpixel. GLCM was selected to represent the texture of the ground surface, owing to its superior performance in various applications [56,57]. In addition, the NIR band was chosen to produce textural features because NIR well captures distinguishable spectral responses from burned vegetation. From the bi-temporal images, the co-occurrence textural statistics [58] was computed with a moving window for eight indicators: mean, variance, contrast, homogeneity, dissimilarity, entropy, angular second moment, and correlation. To reduce the influence of direction, each textural statistic was calculated for four directions (0°, 45°, 90°, and 135°) and then averaged on a pixel basis. In addition, the window size and shift for GLCM were determined based on the spatial resolution of the VHR image and scale of change in the scene—a 7 × 7 window with a shift of two pixels for post-fire GE-1 images and a 15 × 15 window with a shift of four pixels for pre-fire PS images.
The simple structure of the proposed change detection methodology is in accordance with the purpose of the study, which assumes instant disaster damage assessment, using the rapid acquisition of multi-sensor images without highly elaborate image processing. In other words, the explicit theoretical background of the proposed method could extend the applicability of the method to various scenes, regardless of the statistical distribution of the data. Through the experiments on 2019 Gangwon wildfire sites, three change detection results were obtained for each study site depending on the selection of input features for change detection algorithms. The input features for change detection was divided into three cases: (1) spectral features only, (2) textural features only, and (3) both spectral and textural features. Then, the change detection accuracy was evaluated for each case based on manually sampled ground-truth data.
3. Experimental Results
3.1. Image Quality Assessment Results for PS Image Selection
Image quality assessment using the blur kernel was performed for two study sites to sort out the PS images with image quality degradation factors, such as cloud, haze, and smoke from the wildfire. Blur kernel estimation is advantageous in that it requires no prior information regarding the sensor or image, and it can be applied to images regardless of its size when proper kernel size is defined. All the parameters were set in reference to the related study [29]; however, the kernel size was adjusted to 11 × 11, considering the degree of blur in the satellite images. In this study, for local image quality assessment, each image was segmented into 500 × 500 image patches with a 50% overlap between the image patches. Such overlapped image patches were intended to increase the probability of detecting the local defects in multiple patches such that an image-level decision can be made regarding image availability.
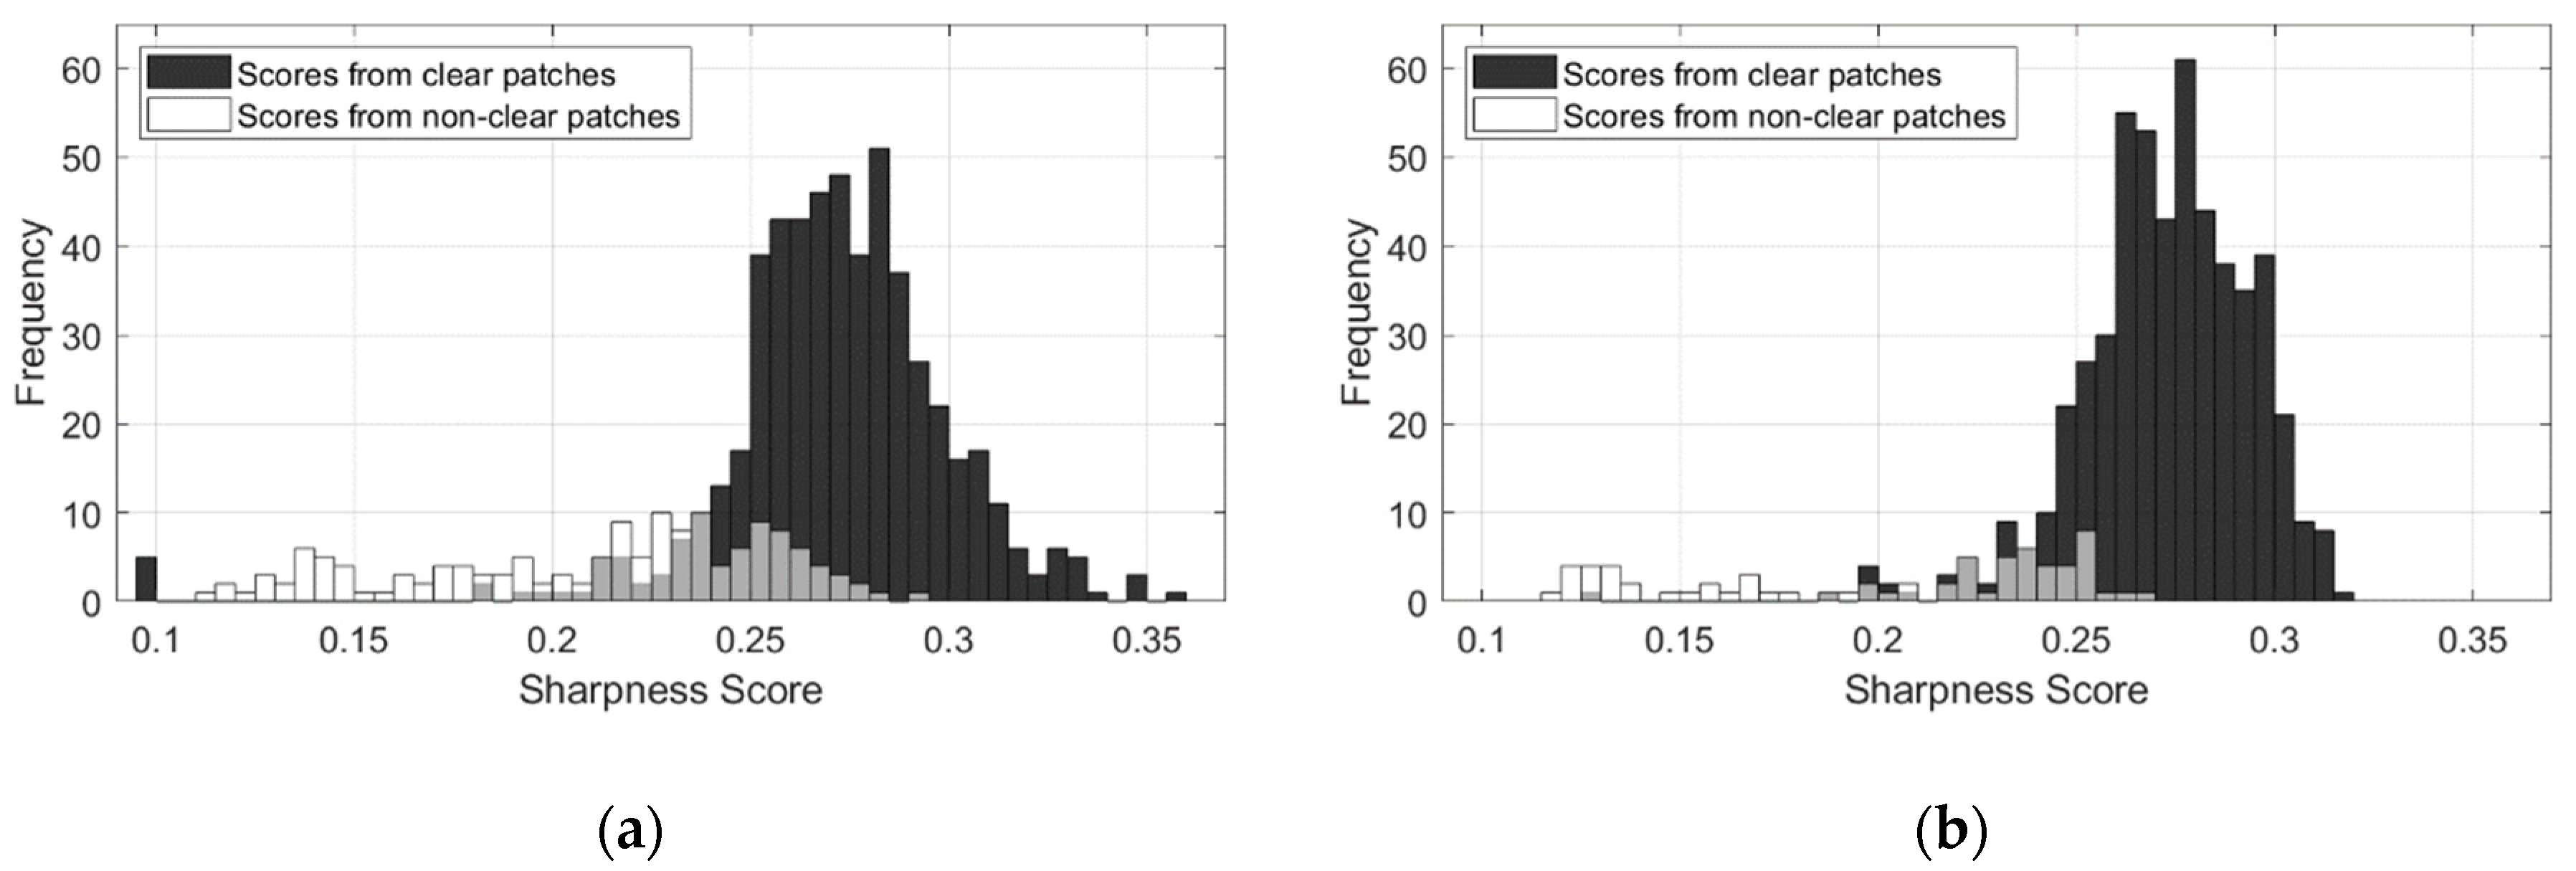
The blur kernel tends to spread out when the image patch contains visual obstruction factors. Thus, it results in a decrease in the sharpness score, which is in agreement with observations from previous studies using PS images [34]. To determine the threshold that separates the clear patches from non-clear patches, pre- and post-fire PS images were employed, and the S value was computed for each patch: 685 image patches from 21 images and 600 image patches from 16 images in the Gangneung–East Sea and Goseong–Sokcho regions, respectively. With reference to visual inspection, the statistical distribution of the S values was compared for clear and non-clear patches (Table 2). For both study sites, the mean value of S for the clear patches was approximately 0.27, which is higher than that for the non-clear patches (0.20–0.21). Based on the S distribution derived from the clear and non-clear patches (Figure 3), the threshold was placed at 0.24 to split between the two classes. Since the S value is an absolute value from the normalized kernel, it can be applied to other remote sensing images with an in-depth investigation on blur kernel and its image quality metrics.
Subsequently, a predefined S value was validated with respect to the detection of a non-clear patch, which is inadequate for further image processing. Using a threshold value of 0.24 for the sharpness score, we compared the clear and non-clear patches obtained from the threshold value with the reference from the visual image interpretation. The discrimination ability of the proposed local image quality assessment method was evaluated for each study site using four metrics (Table 3): false alarm rate (FAR), miss rate (MR), overall accuracy (OA), and F1-score. The effectiveness of the method was verified by showing low FAR (< 8%) and high OA (> 87%) for both study sites. Misclassified patches occurred on patches that consisted of a single land cover with low brightness values, such as dense forest or ocean.
However, the miss rate was quite substantial, and these false-negative detections occurred mostly on image patches that contained clouds in a very small portion of the patch or thin haze, which were transparent enough such that the ground surface could be identified, but it was inappropriate for image analysis. Therefore, image availability was determined based on the number of non-clear patches within the image to reduce the influence of local terrain and atmospheric conditions. Table 4 and Table 5 show the image-level decision regarding image availability in the Gangneung–East Sea and Goseong–Sokcho regions, respectively. In most cases, the number of non-clear image patches well represents the quality of the image. Notably, from the “20190324_022022” product on March 24, 2019, 11 patches were detected as non-clear patches out of a total of 57 image patches, even though the image was clear without blurring factors. With careful visual inspection, the corresponding image was found to contain image distortion resulting from band misalignment, which could not be identified with the image metadata. Thus, the proposed method can assess the image quality, including atmospheric conditions as well as image distortion induced by inconsistencies of micro-satellites on a local scale.
After the image quality assessment of the PS images, we assumed an actual situation in which appropriate pre-fire images were selected from the PS database. From April 4, 2019, the day before the outbreak of the wildfire, the clear images were stacked so that the stacked images covered the entire area of the ROI. The coverage of the images is thought to be more important than the acquisition time because the bi-temporal image analysis cannot be conducted with partial images. Hence, based on the last stacked image, the PS images were again stacked toward the time of wildfire occurrence to minimize the number of images required to cover the area. Consequently, two PS images captured on April 4, 2019 were used to cover the study site for the Gangneung–East Sea region; meanwhile, four images from March 24, 2019 and March 26, 2019 were selected for the Goseong–Sokcho region, such that the stacked images could be close in its acquisition time. Since multiple images are likely to be selected as pre-fire PS images, image mosaicking should be performed to merge these images into a single scene. In addition, as PS images are collected in continuous strips, image mosaicking is also inevitable in most cases to fully cover the ROI. Along with image mosaicking, an image pre-processing sequence was applied to post-fire GE-1 and pre-fire PS images, as described in Section 2.3, to minimize the radiometric and geometric differences from multi-sensor satellite images.
3.2. Unsupervised Object-Based Change Detection Results
Image segmentation was performed for post-fire GE-1 VHR images using the improved SLIC [49] with additional clustering constraints. Considering the scale of change and spatial resolution of the image, the only parameter required for SLIC—the expected size of a single superpixel—was set as 20 × 20 pixels. From the experiment, the image was segmented into 30 083 superpixels from 3160 × 3730 pixels for the Gangneung–East Sea region, and 33 816 superpixels were clustered from 3315 × 3810 pixels for the Goseong–Sokcho region. In comparison with the desired number of superpixels for each site (29,467 and 31,575), the number of resulting superpixels showed a difference within 10% of the expected number. Based on the image segmentation results, bi-temporal change features were calculated for each superpixel, including the spectral, textural, and contextual features. As mentioned in Section 2.4, the contextual feature was employed to identify the superpixels that can be utilized as pseudo-training data, whereas the spectral and textural features were used as input features for SVM and RF classifiers. Figure 4 shows the bi-temporal NDVI correlation (Figure 4a,b) and distribution of pseudo-training data (Figure 4c,d), which were determined by thresholding the NDVI correlation. The superpixels labeled as “changed” were mostly selected from the burned area, and “unchanged” samples were found to be distributed over the surrounding area, regardless of its land-cover type. Using the spectral and textural features of superpixels previously labeled as “changed” and “unchanged”, binary classifiers were trained to classify the entire scene. Not only the undefined superpixels but also the labeled superpixels were involved in the prediction with trained classifiers to refine the change detection results. Since the proposed change detection was performed with superpixel-based features, the computational burden in training was highly reduced compared with that of pixel-based image analysis. In summary, the entire workflow from image selection to change detection was achieved in an unsupervised manner, as intended for the purpose of the study.
The performance of the proposed unsupervised change detection was compared with that of the supervised change detection to verify the usefulness of the pseudo-training data. To perform supervised change detection, the sample data were manually labeled on a superpixel basis through the visual interpretation of the 0.5 m post-fire GE-1 panchromatic images. The labeled superpixels were roughly divided into two classes, “changed” and “unchanged”, and herein, the change denotes the burned vegetation from the wildfire. Meanwhile, “unchanged” superpixels were collected for three subclasses, namely, unburned vegetation, cropland, and urban area, to reflect not only the intact vegetation but also other unchanged regions with different land covers. Hence, we manually produced sample data for a total of four labels, 1000 superpixels per label. From the collection of 1000 “changed” samples and 3000 “unchanged” samples, we used 70% of the sample data to train the classifier and the remaining 30% as test data to evaluate the performance of the binary classifiers. The same test data were also utilized to assess the proposed change detection results for the comparison of accuracy. As quality metrics to assess the change detection accuracy, FAR, MR, OA, kappa coefficient, and F1-score were calculated for the three input cases with two machine learning algorithms (Table 6 and Table 7). The kappa coefficient was calculated through the following equation, which is known as Cohen’s kappa coefficient [59]:
where po is the observed accuracy and pe is the chance agreement. The accuracy assessment results from RF were averaged over 10 trials.
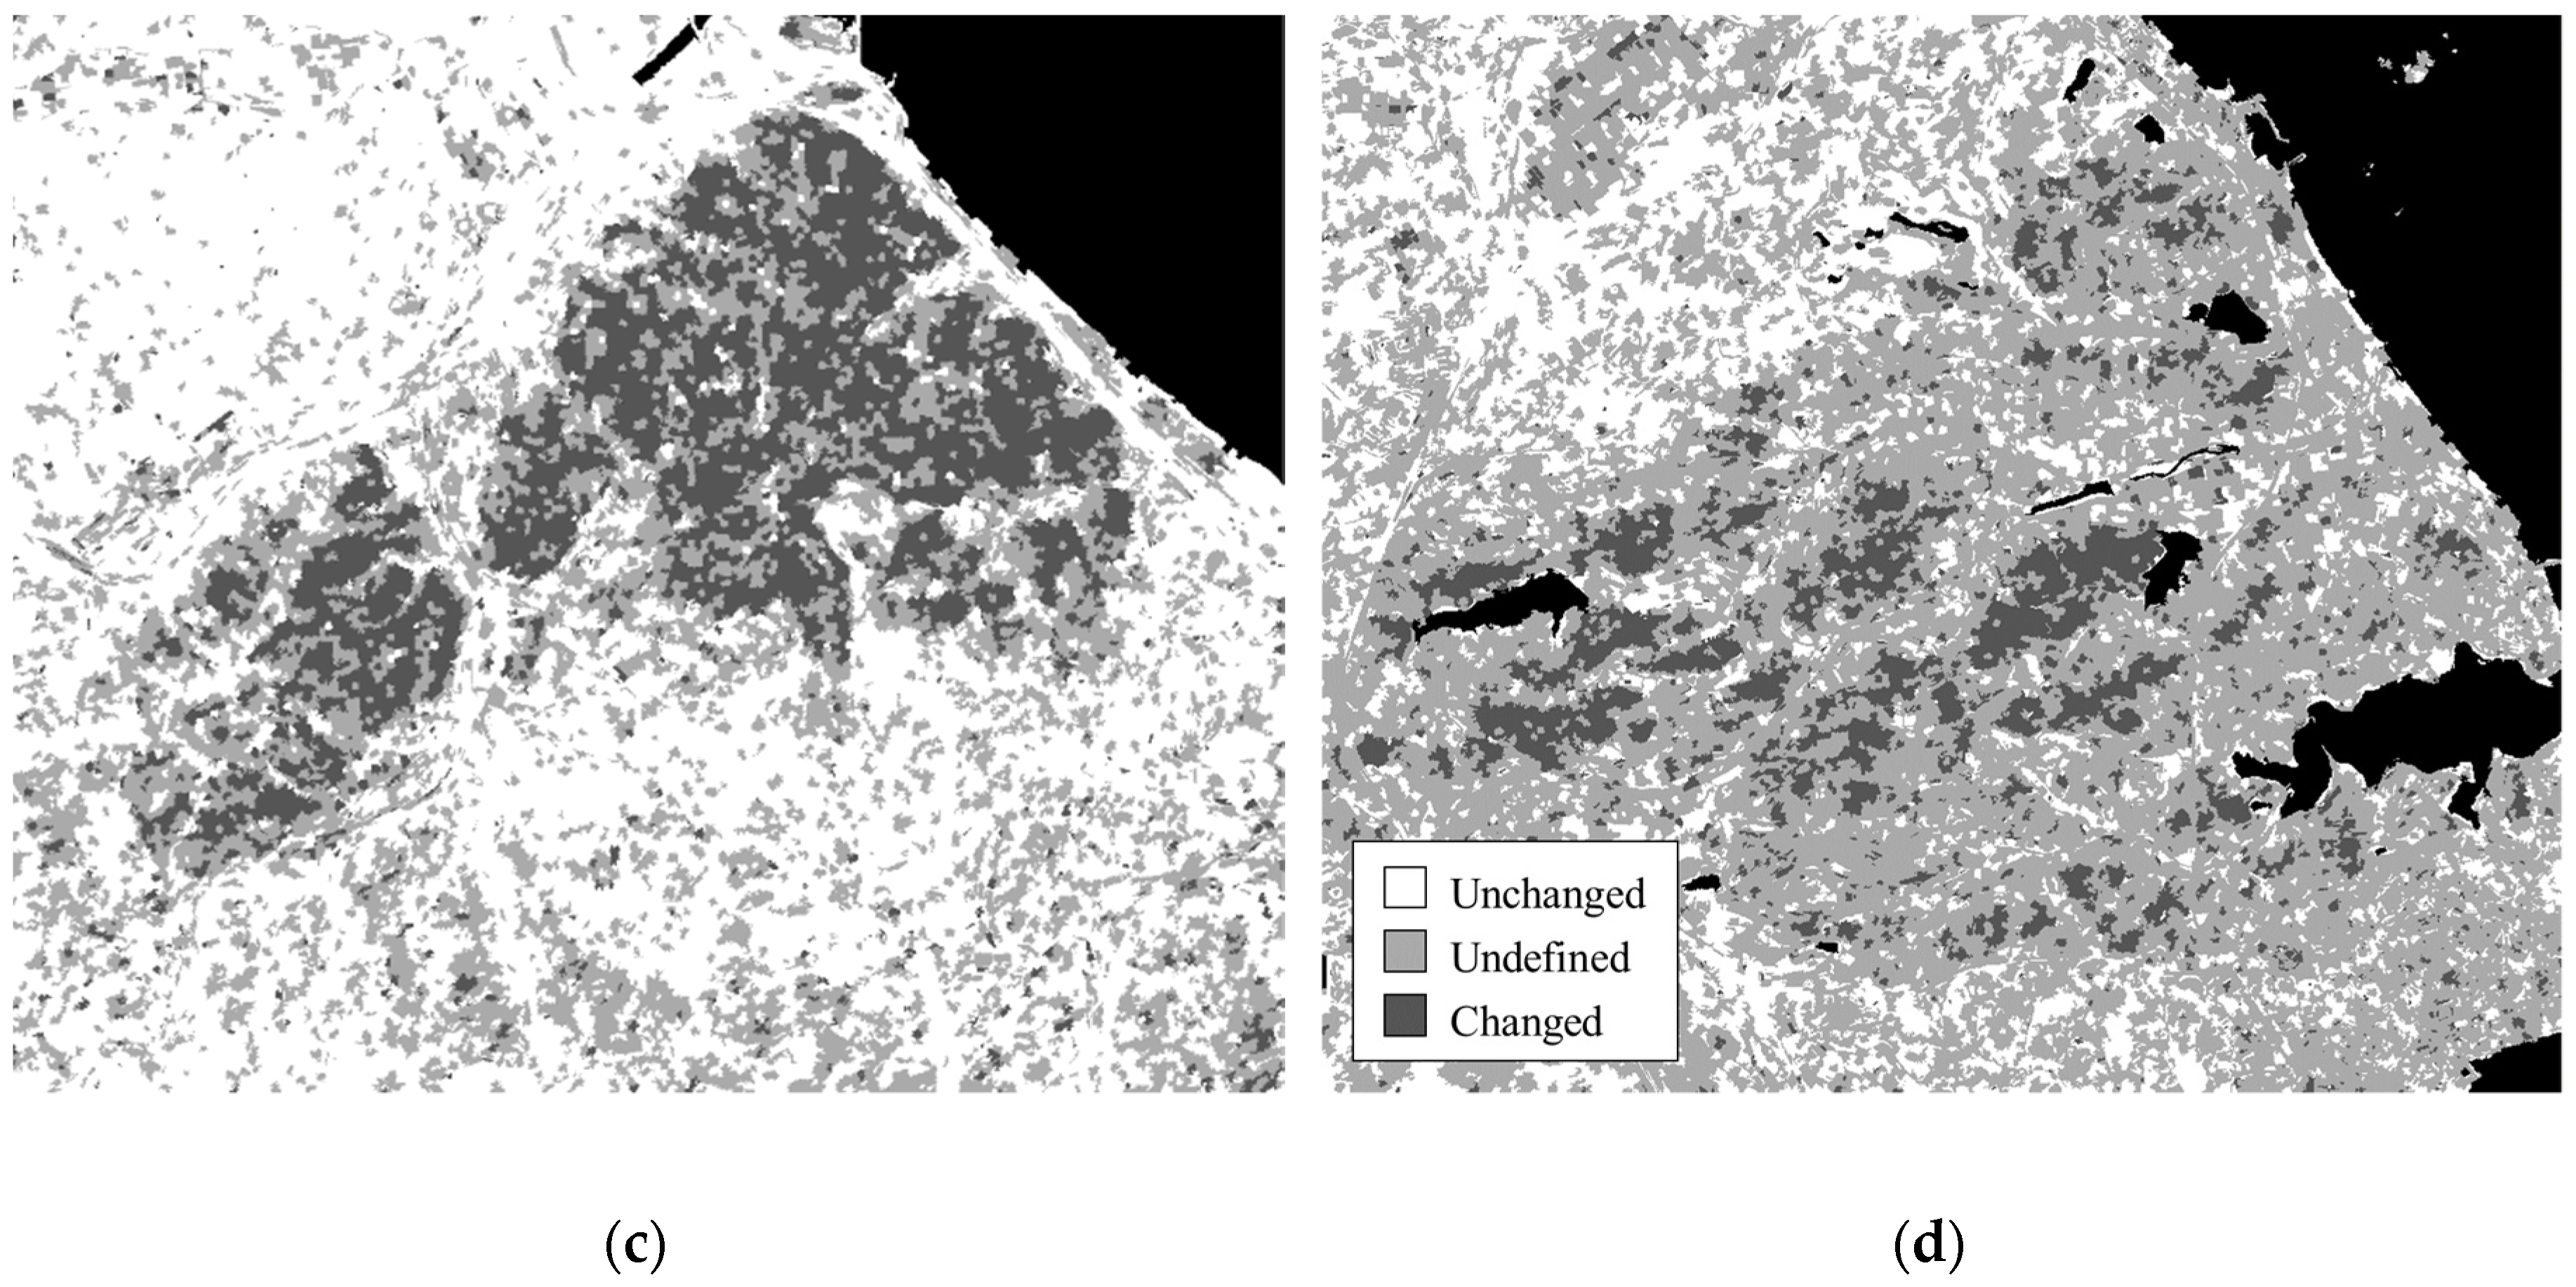
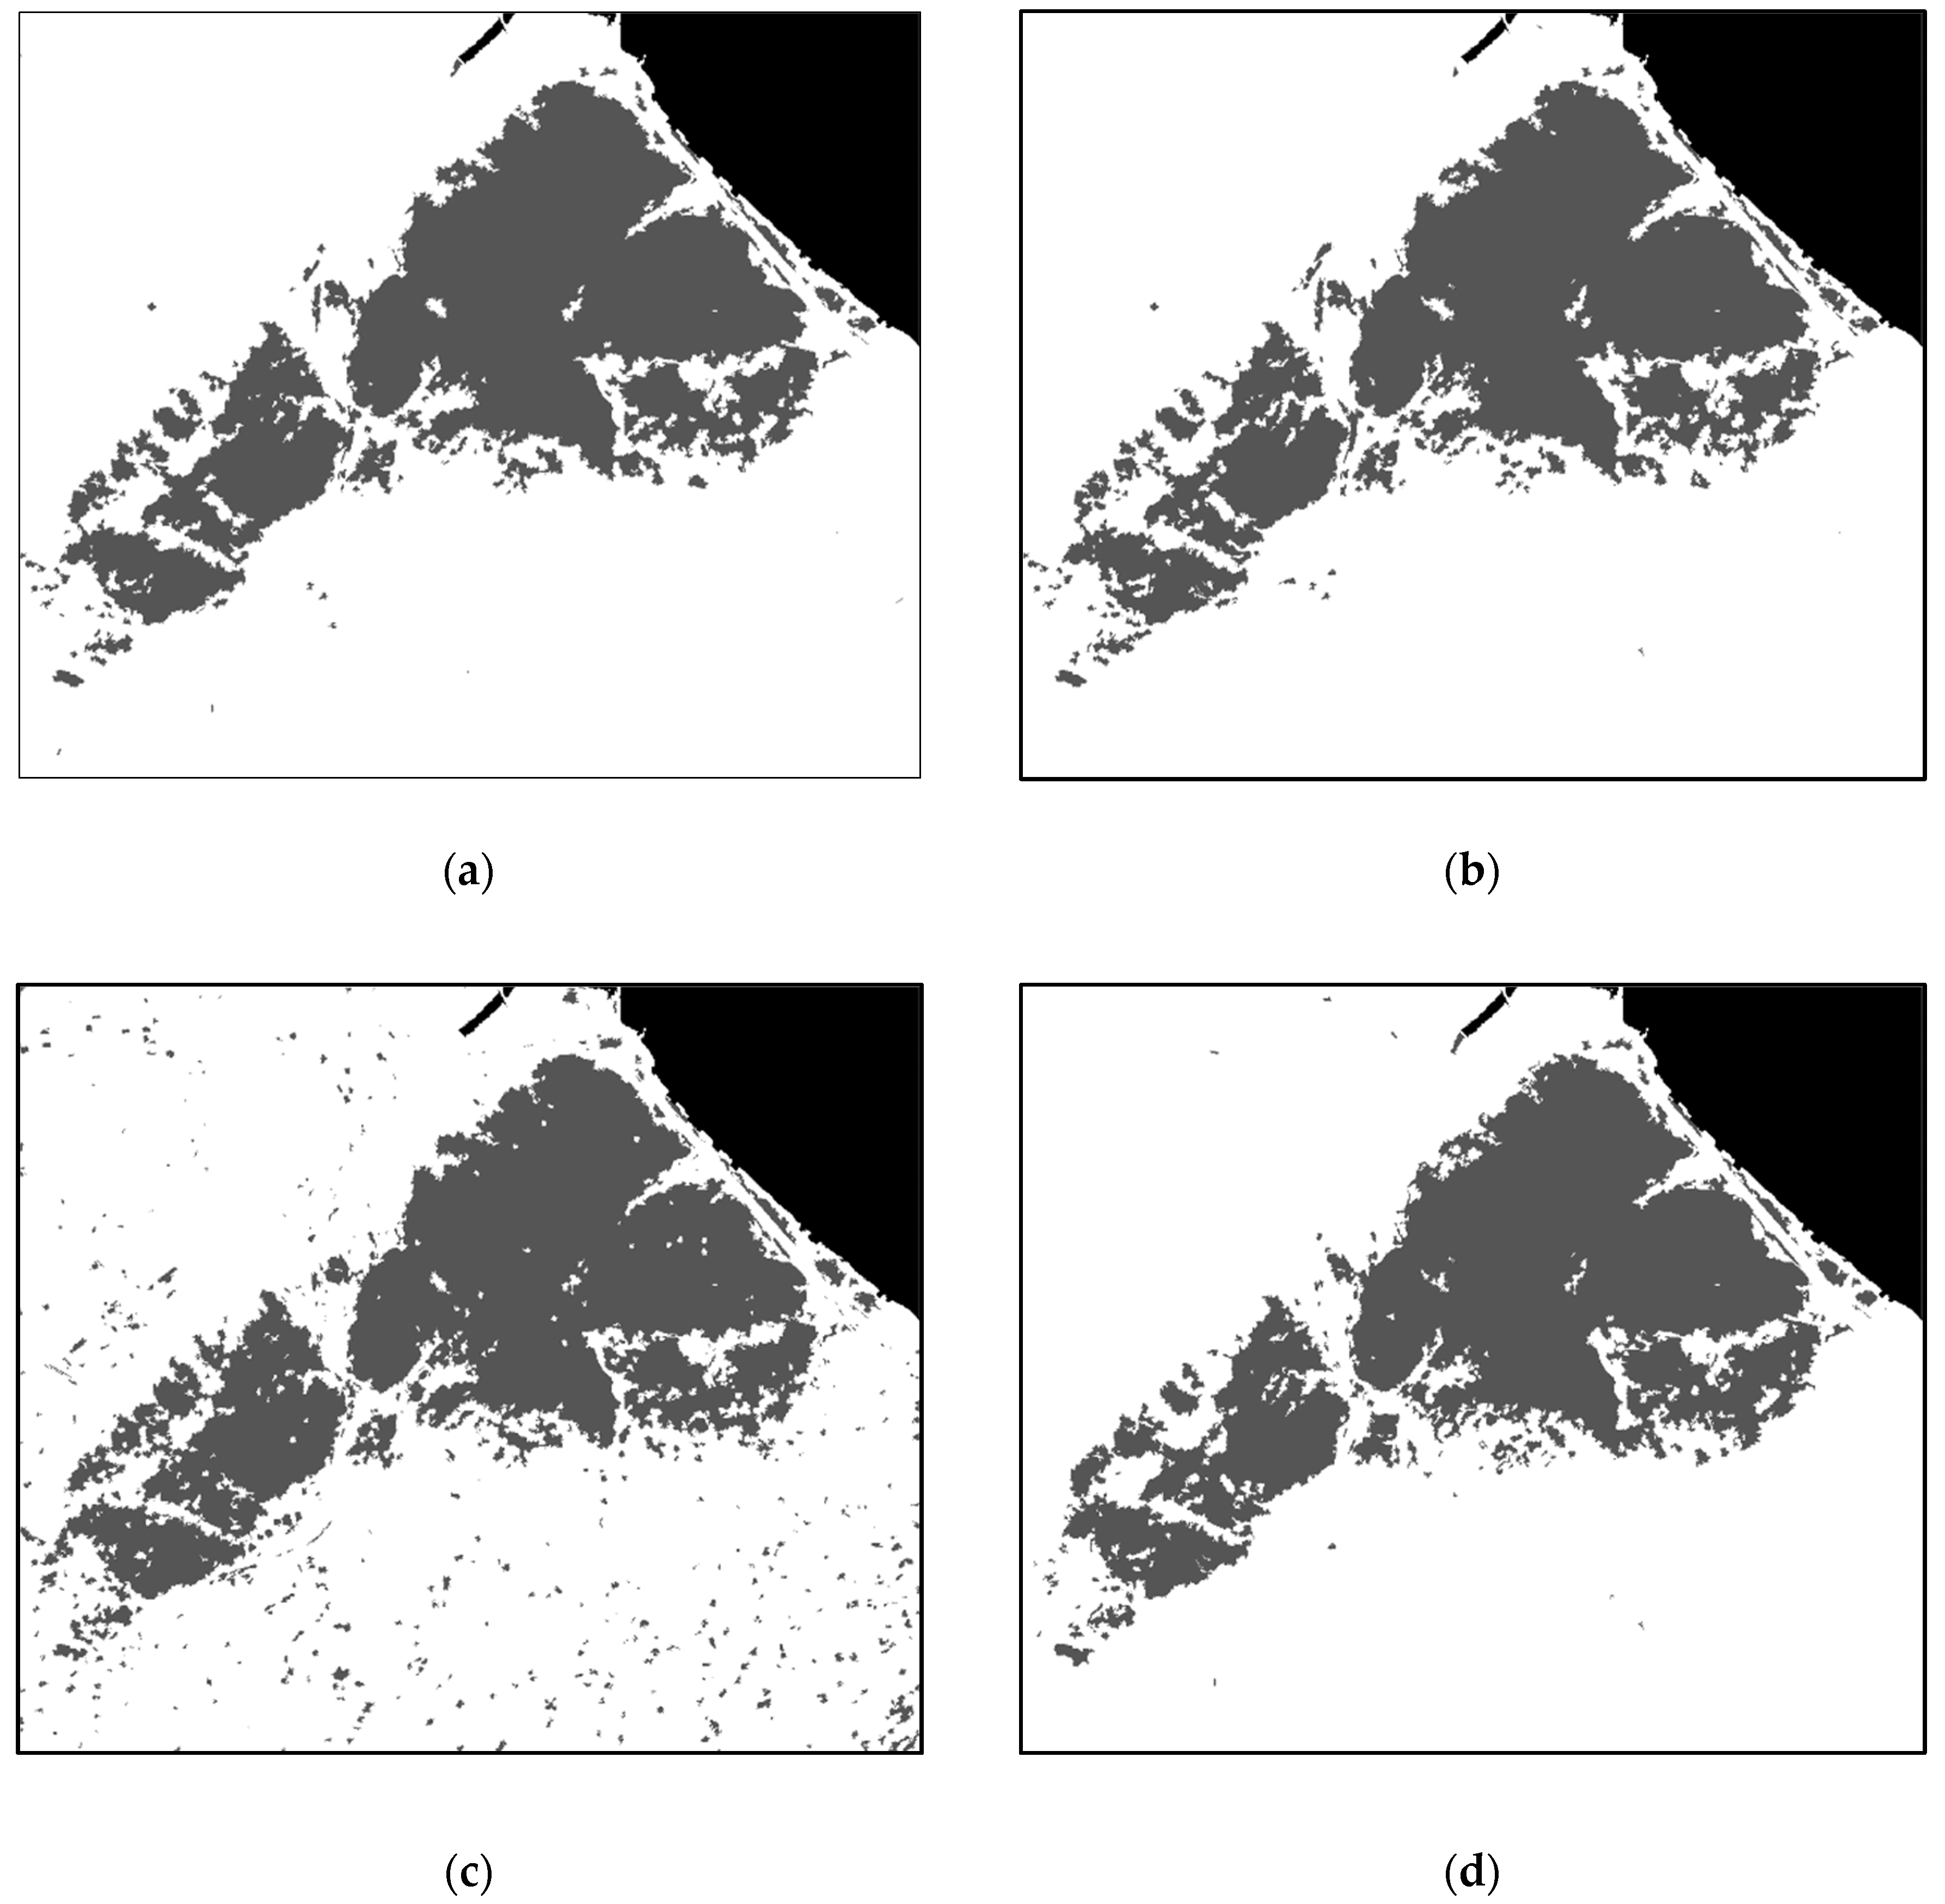
In all cases, the integration of spectral and textural features improved the change detection accuracy and showed higher OA, kappa coefficient, and F1-score values than the cases in which only the spectral features or only the textural features were involved. These observations coincided with results from related studies [51,60,61,62,63] and validated the fact that the use of multiple features could enhance the change detection accuracy. The unsupervised change detection results from SVM showed high OA of over 99% with a low FAR below 0.5%, as well as high values of kappa and F1-score for both study sites. In the Goseong–Sokcho region, the SVM results from pseudo-training data nearly reached the accuracy level of SVM results using manually labeled data. Even in the Gangneung–East Sea region, the unsupervised SVM results outperformed the supervised SVM results, implying the effectiveness of the proposed framework. However, in the case of RF, the unsupervised change detection results also showed a high OA of over 95% and a high F1-score above 0.920 but with increased FAR of over 4.6%, which was more than 20 times greater than the FAR values from the supervised RF results. Such differences could be explained as the RF classifiers being more sensitive to the accuracy of sample data. As shown in Figure 5c and Figure 6c, the unsupervised RF results from both study sites contain much noise within the burned and unburned area, that is, the missed superpixels and falsely detected superpixels. The experimental results confirmed that the proposed method could produce very accurate change detection results, even in an unsupervised approach, by employing the bi-temporal images with relatively short time intervals.
4. Discussion
The most critical point in the proposed method is that change detection is performed with automatically generated training data that have high probabilities of no change and change. To minimize user intervention within the framework, pseudo-training data were obtained from the bi-temporal NDVI correlation. The key aspect of this process is to collect the spatial information of the samples in which the occurrence of change or no change is evident while maintaining a low error level. The generation of pseudo-training data is constrained by two predefined thresholds for bi-temporal NDVI correlation, in which samples with correlations lower than the lower threshold are labeled as “changed”, and samples with correlations higher than the upper threshold are labeled as “unchanged”. We set the lower threshold to 0, implying that superpixels with negative correlation have high probabilities of vegetation change. Meanwhile, the upper threshold can vary as predefined by the user. Therefore, the proper threshold needs to be determined by sufficient investigation to effectively separate the unchanged samples from the samples containing uncertainty. As a result of the trade-off between the quality and amount of training data, it is critical to find a properly balanced threshold value. For example, setting the upper threshold close to 1 produces samples with high probabilities of no change but also reduces the number of unchanged samples.
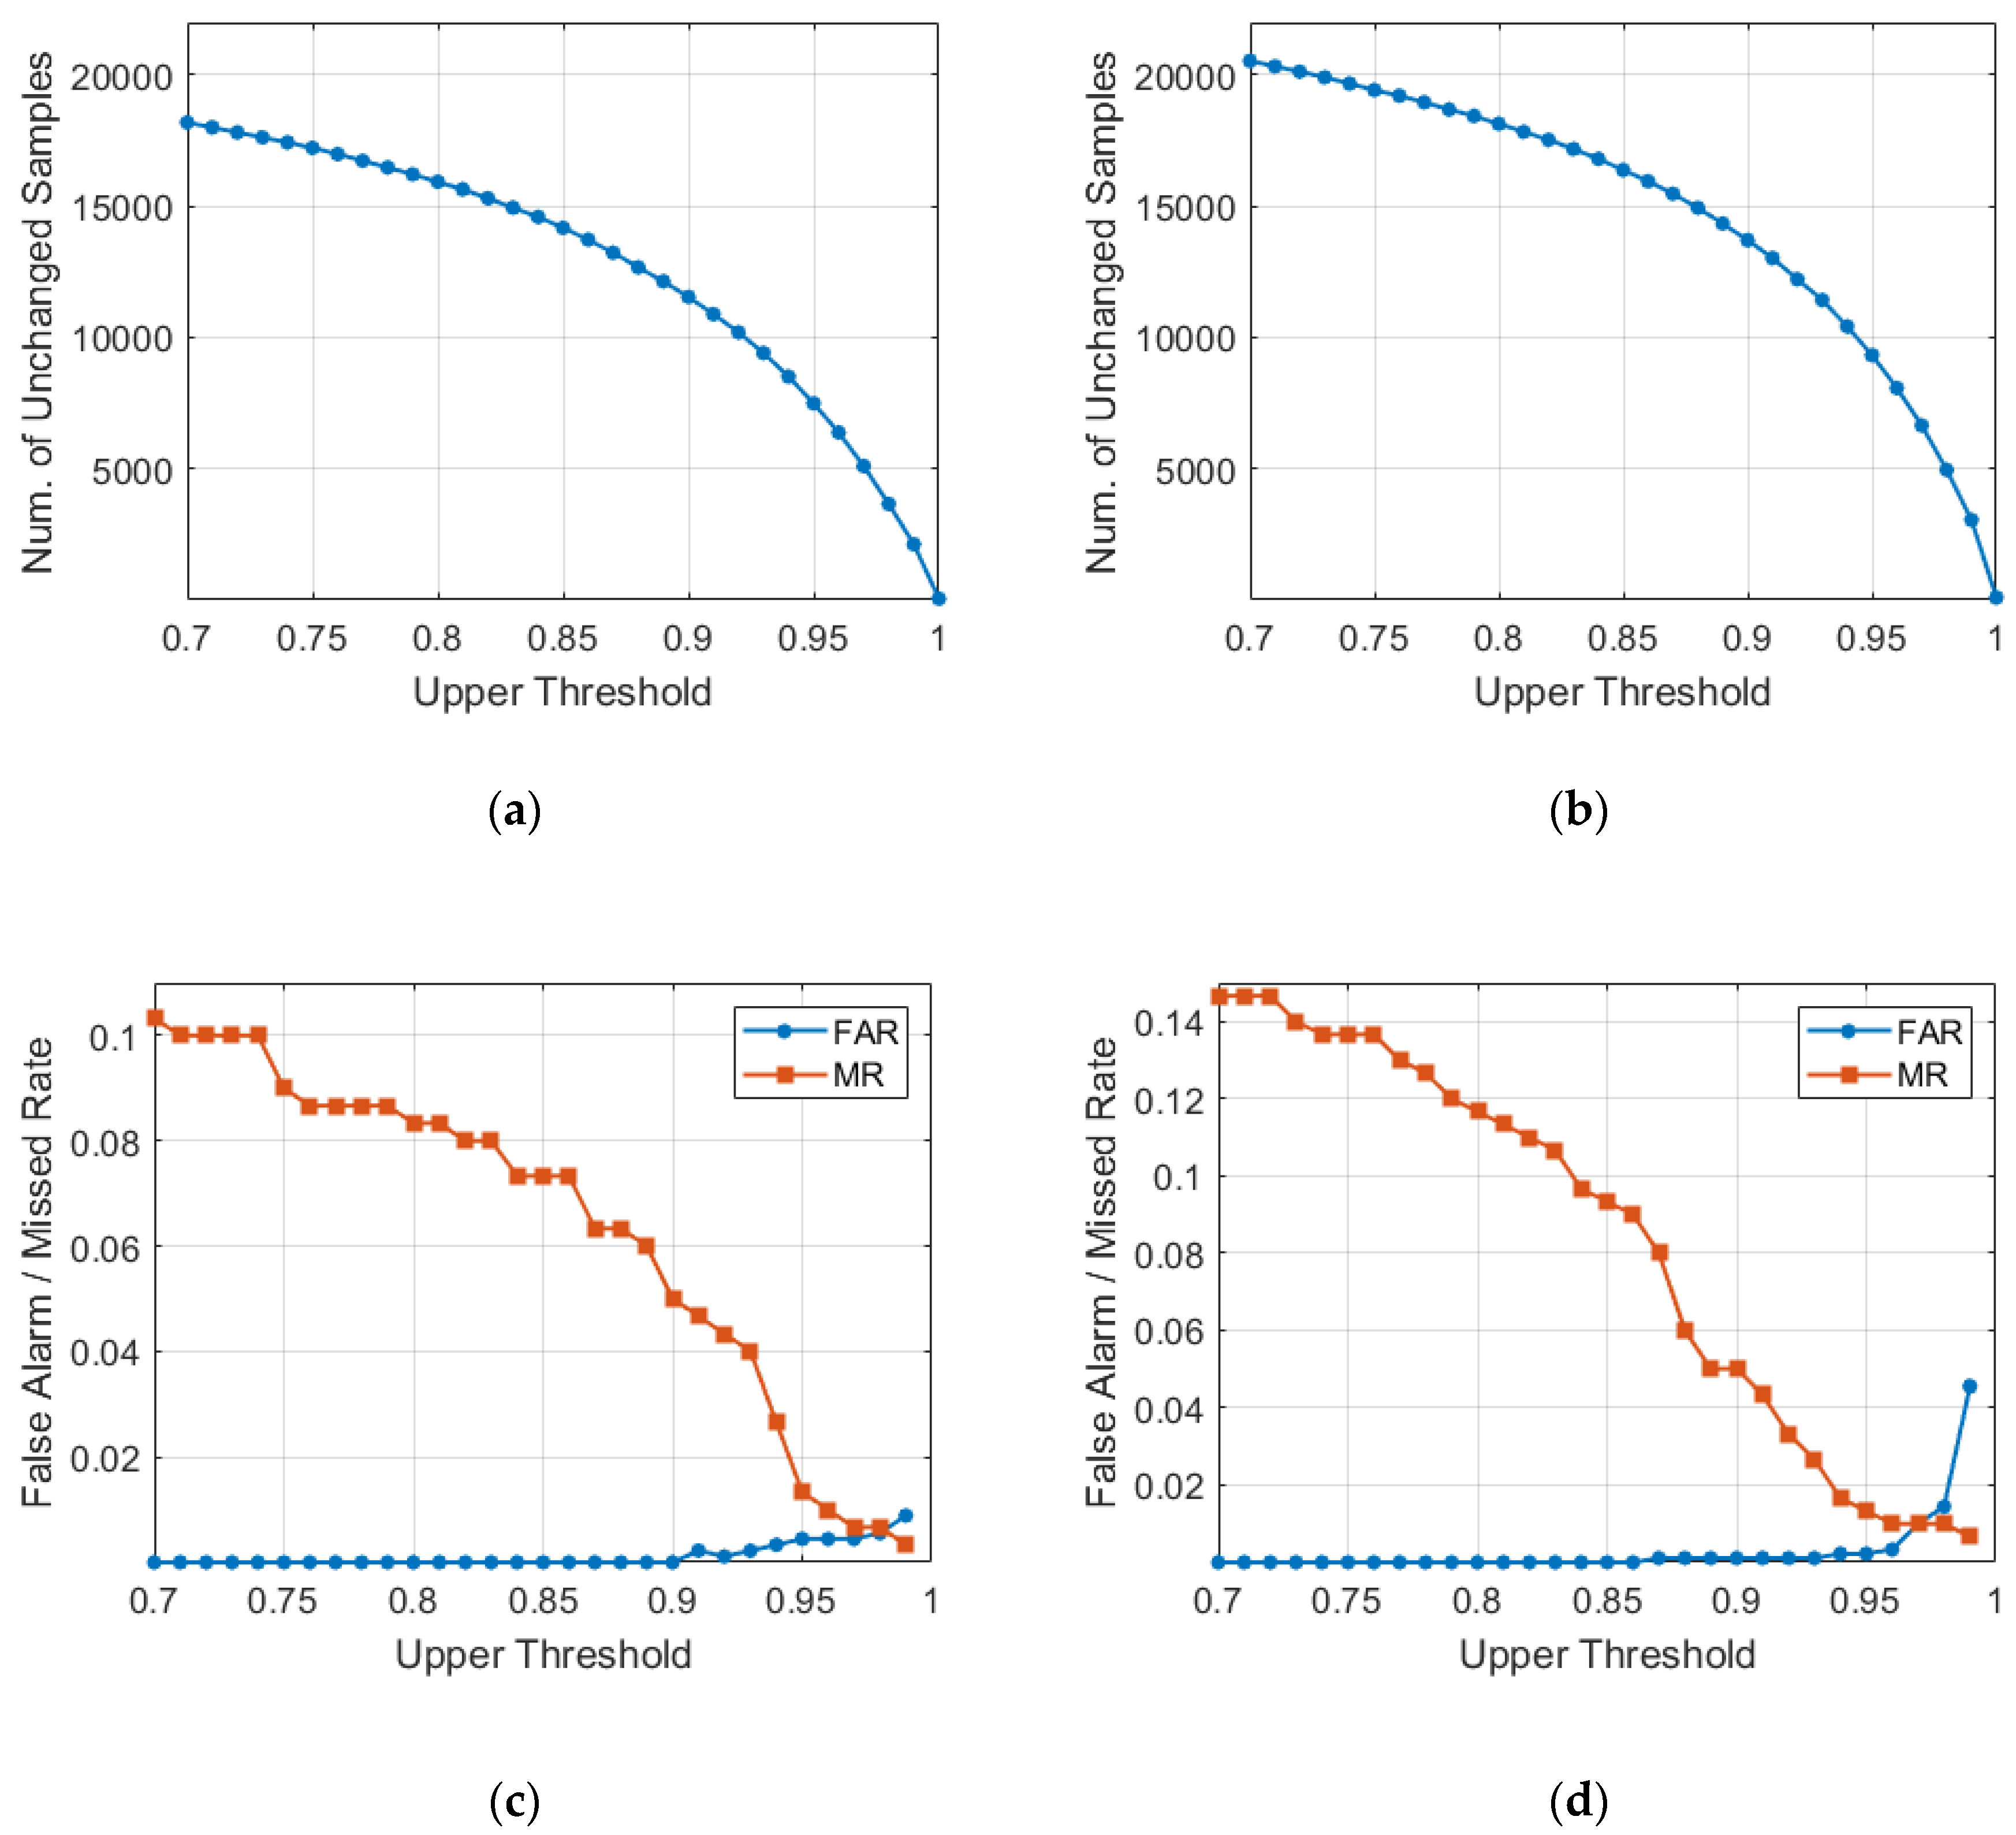
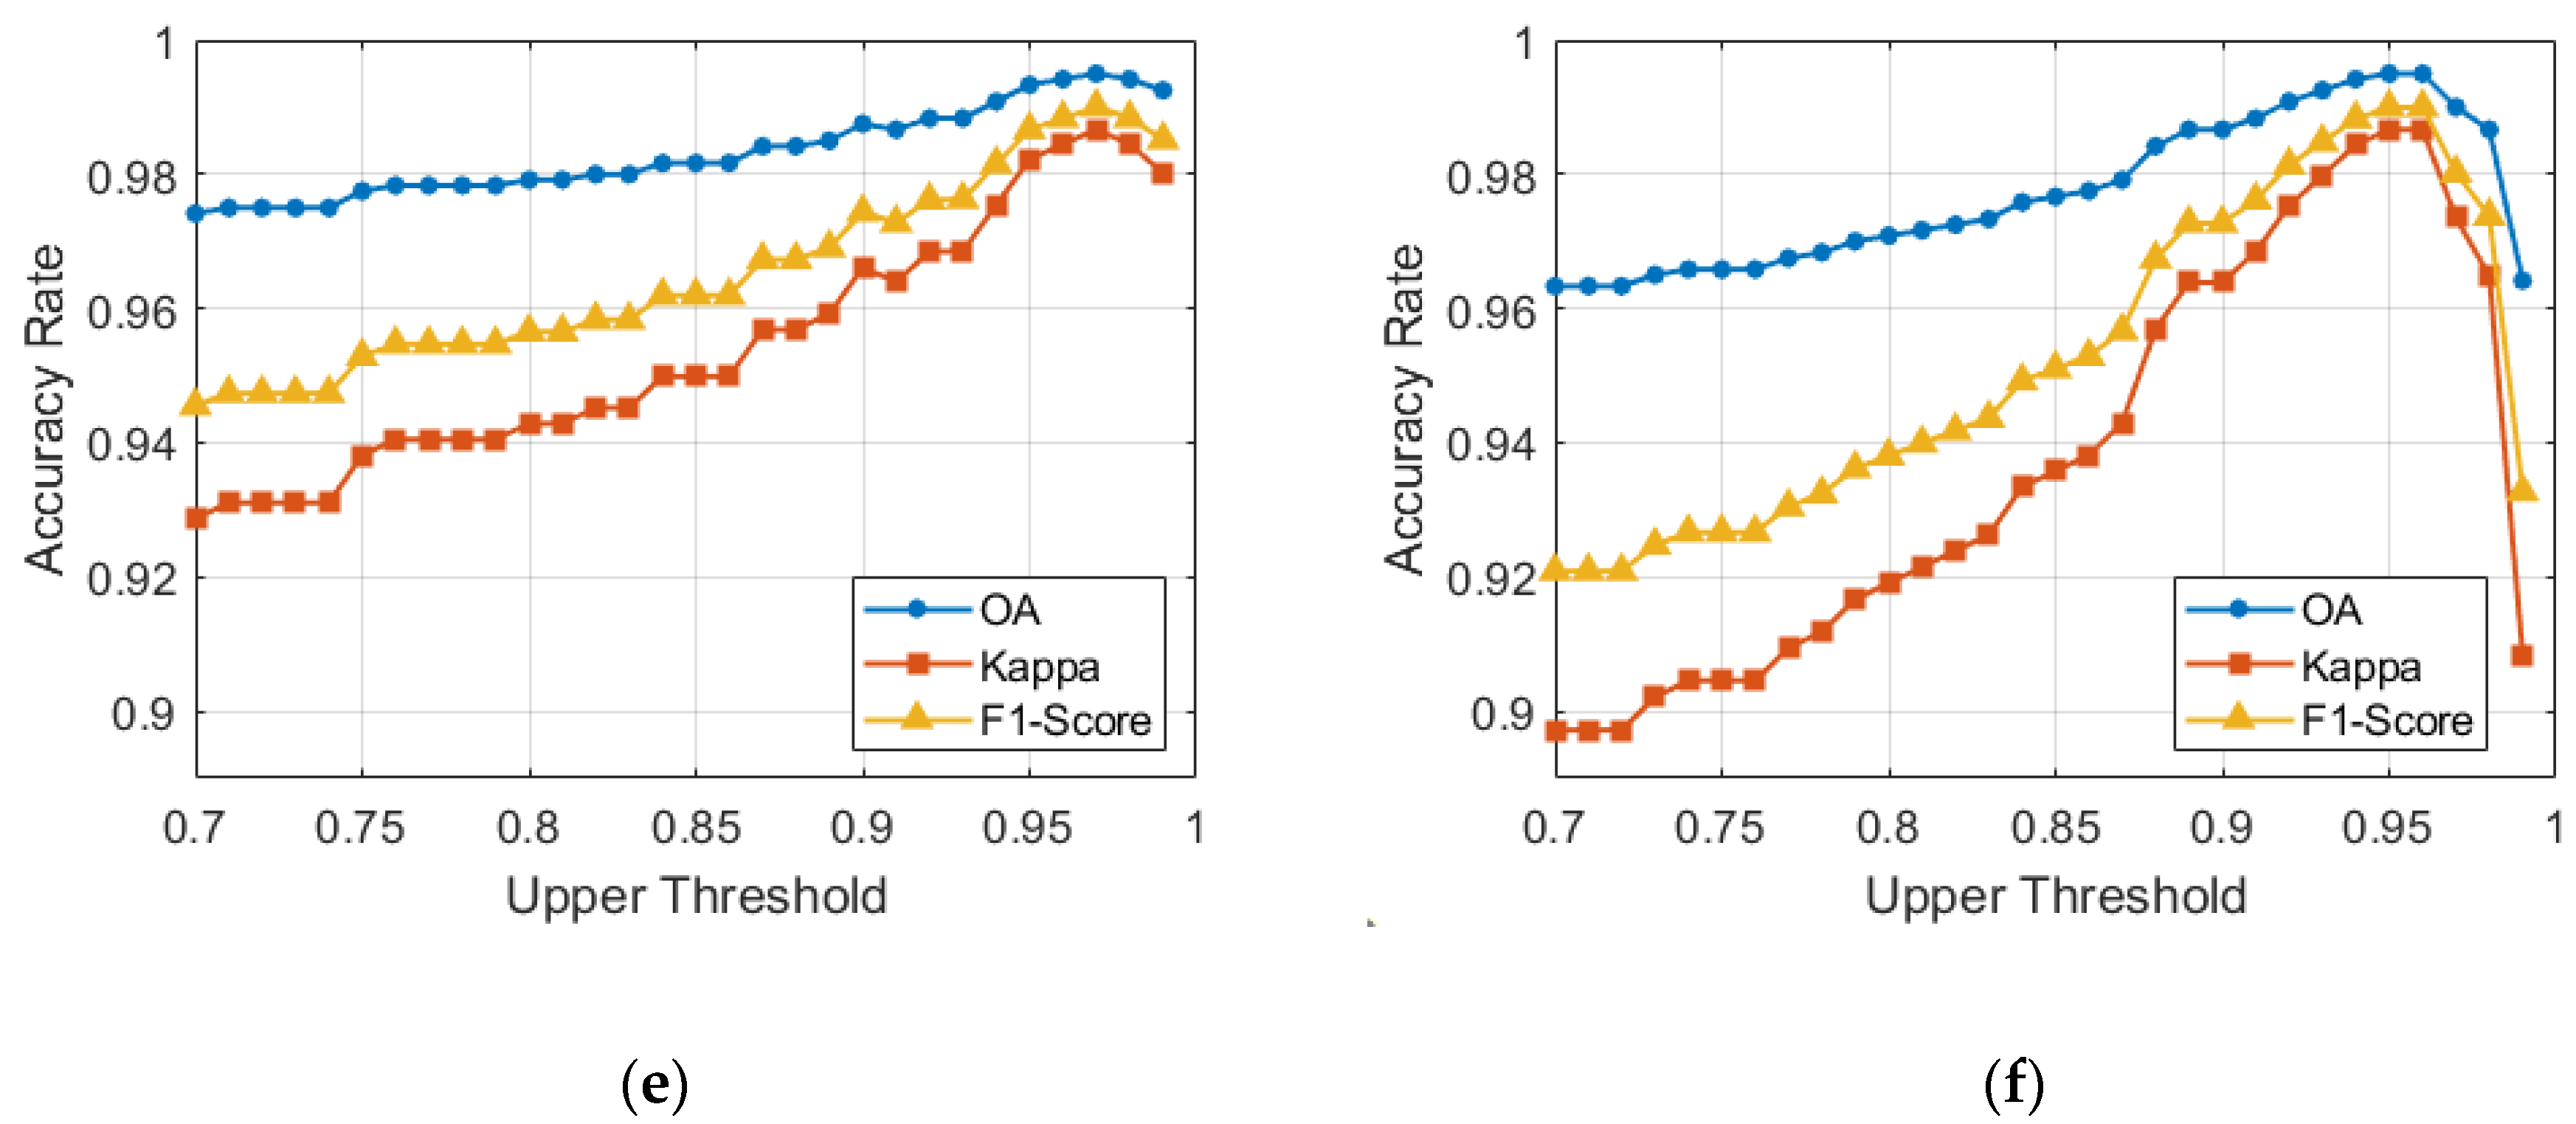
To analyze the influence of the upper threshold for bi-temporal NDVI correlation, we performed the change detection process using the threshold with values between 0.7 and 1.0 at an interval of 0.01. According to the superior performance of SVM with spectral and textural features in Section 3.2, SVM was employed to discriminate the wildfire-induced change region from the unchanged region, with spectral and textural features as input features. From the analysis, the upper threshold for correlation controls the number of superpixels to be used as training data and the accuracy of the subsequent change detection procedures (Figure 7). As higher values are assumed for the upper threshold, MR decreases from approximately 10–14% to nearly 0%. Meanwhile, FAR maintains extremely low rates of under 0.5% until the threshold increases up to a value of 0.95. The other metrics, that is, OA, kappa, and F1-score, showed similar trends with an increase in the threshold, which indicates that the selection of training data with considerably high probabilities is important in effectively training the classifiers. Then, OA, kappa, and F1-score decreased for threshold values greater than 0.96–0.97. This is because of the insufficiency of training data, which is caused by the decrease in the number of unchanged samples to below 5000. These observations validate the trade-off between the quality and amount of training data, along with the effect of the variation of the upper threshold on the change detection results. In addition, the drastic drop in accuracy in the Goseong–Sokcho region can be explained by its more heterogeneous landscape, whereas the Gangneung–East Sea region is mostly composed of sheer forests with less heterogeneity. Despite the differences between the two study sites, in Section 3.2, we set the upper and lower threshold value to 0.95 and 0 for both sites. Using the pseudo-training data from the defined values, the proposed framework produced relatively stable change detection results. In the Gangneung–East Sea region, the numbers of pseudo-training data for the changed and unchanged classes were 3989 and 7488, respectively. In the Goseong–Sokcho region, the numbers of samples for the two classes were 3421 and 9328. When compared with the original size of the images, the generated pseudo-training data reduced the computation in the training process and successfully represented the entire image with the superpixel-based features.
Other than training data generation, input features for classifier and classifier itself also affected the performance of the change detection. First, the overall experimental results clearly indicated the fact that multiple features could enhance change detection accuracy. Such observations coincided with the results from the numerous previous studies as mentioned in Section 3.2; therefore, for more information, the reader can refer to the related studies [51,60,61,62,63]. Second, the selection of classification algorithm could influence the change detection accuracy by RF showing high accuracy values but lower than SVM due to the noise in the change detection results. In this study, we used the basic spectral and textural features as input features, and with the given features, SVM represented the best performance within the proposed unsupervised framework. However, the performance of RF can be improved by integrating additional features. For example, features from morphological operations [51,64] showed the potential to introduce more diverse information into the classifiers.
5. Conclusions
In this study, we proposed an unsupervised framework for wildfire damage assessment using post-fire VHR images with pre-fire PS data. As the proposed method assumed the need for instant disaster damage assessment, the process of PS image selection and change detection was performed without any prior information on data distribution. The use of blur kernel enabled the automatic and blind evaluation of local image quality and successfully selected the adequate pre-fire PS images from the PS database. Moreover, the unsupervised change detection was conducted with the integration of spectral, textural, and contextual information on a superpixel basis to fully exploit the multiple features with reduced computation costs. Comparative analysis with the supervised results validated the superior performance of the proposed unsupervised change detection method by showing high OA of over 99% with low FAR, as well as high values of kappa and F1-score, which is comparable with the accuracy of the supervised results. The essence of this study is in the automatic generation of training data by thresholding the bi-temporal NDVI correlation without any supervision, and the influence of the predefined threshold was investigated thoroughly with respect to the quality and amount of sample data.
Although our method was focused on wildfire cases, it could be applied to other types of disasters, which include changes in vegetation. Furthermore, the proposed framework also has the potential to be extended to other disaster types with non-vegetational changes by the proper replacement of the following three factors: input image for image segmentation, spectral index to calculate bi-temporal correlation, and input band to produce GLCM textural features.
Author Contributions
Conceptualization, M.C.; methodology, M.C. and Y.H.; software, M.C.; validation, M.C.; formal analysis, M.C.; investigation, M.C. and Y.H.; resources, Y.K.; data curation, M.C.; writing—original draft preparation, M.C.; writing—review and editing, Y.H. and Y.K.; visualization, M.C.; supervision, Y.K.; project administration, Y.K.; funding acquisition, Y.K. All authors have read and agreed to the published version of the manuscript.
Funding
This research was supported by a grant (no.20009742) of Disaster-Safety Industry Promotion Program funded by Ministry of Interior and Safety (MOIS, Korea), and by the National Research Foundation of Korea (NRF) grant funded by the Korea government (MSIP) (2017R1C1B2005744).
Acknowledgments
The authors are grateful to Planet for providing PlanetScope satellite image data. In addition, the authors also thank the anonymous reviewers for their comments and suggestions to improve this paper. The Institute of Engineering Research at Seoul National University provided research facilities for this work.
Conflicts of Interest
The authors declare no conflict of interest.
References
- Stryker, T.; Jones, B. Disaster Response and the International Charter Program. Photogramm. Eng. Remote Sens. 2009, 75, 1342–1344. [Google Scholar]
- Jones, B.K.; Stryker, T.S.; Mahmood, A. The International Charter “Space and Major Disasters” Initiative. Acta Astronaut. 2003, 54, 183–190. [Google Scholar] [CrossRef]
- Tigges, J.; Lakes, T.; Hostert, P. Urban Vegetation Classification: Benefits of Multitemporal RapidEye Satellite Data. Remote Sens. Environ. 2013, 136, 66–75. [Google Scholar] [CrossRef]
- Li, D.; Ke, Y.; Gong, H.; Li, X. Object-Based Urban Tree Species Classification Using Bi-Temporal WorldView-2 and WorldView-3 Images. Remote Sens. 2015, 7, 16917–16937. [Google Scholar] [CrossRef] [Green Version]
- Henits, L.; Jürgens, C.; Mucsi, L. Seasonal Multitemporal Land-Cover Classification and Change Detection Analysis of Bochum, Germany, Using Multitemporal Landsat TM Data. Int. J. Remote Sens. 2016, 37, 3439–3454. [Google Scholar] [CrossRef]
- Epting, J.; Verbyla, D.; Sorbel, B. Evaluation of Remotely Sensed Indices for Assessing Burn Severity in Interior Alaska Using Landsat TM and ETM+. Remote Sens. Environ. 2005, 96, 328–339. [Google Scholar] [CrossRef]
- Duro, D.C.; Franklin, S.E.; Dubé, M.G. Multi-Scale Object-Based Image Analysis and Feature Selection of Multi-Sensor Earth Observation Imagery Using Random Forests. Int. J. Remote Sens. 2012, 33, 4502–4526. [Google Scholar] [CrossRef]
- Meng, R.; Wu, J.; Schwager, K.L.; Zhao, F.; Dennison, P.E.; Cook, B.D.; Brewster, K.; Green, T.M.; Serbina, S.P. Using High Spatial Resolution Satellite Imagery to Map Forest Burn Severity across Spatial Scales in a Pine Barrens Ecosystem. Remote Sens. Environ. 2017, 191, 95–109. [Google Scholar] [CrossRef] [Green Version]
- Coppin, P.; Jonckheere, I.; Nackaerts, K.; Muys, B.; Lambin, E. Digital Change Detection Methods in Ecosystem Monitoring: A Review. Int. J. Remote Sens. 2004, 25, 1565–1596. [Google Scholar] [CrossRef]
- Bruzzone, L.; Bovolo, F. A Novel Framework for the Design of Change-Detection Systems for Very-High-Resolution Remote Sensing Images. Proc. IEEE 2013, 101, 609–630. [Google Scholar] [CrossRef]
- Pleniou, M.; Koutsias, N. Sensitivity of Spectral Reflectance Values to Different Burn and Vegetation Ratios: A Multi-Scale Approach Applied in a Fire Affected Area. ISPRS J. Photogramm. Remote Sens. 2013, 79, 199–210. [Google Scholar] [CrossRef]
- Meddens, A.J.H.; Kolden, C.A.; Lutz, J.A. Detecting Unburned Areas within Wildfire Perimeters Using Landsat And Ancillary Data across the Northwestern United States. Remote Sens. Environ. 2016, 186, 275–285. [Google Scholar] [CrossRef]
- Collins, L.; Griffioen, P.; Newell, G.; Mellore, A. The Utility of Random Forests for Wildfire Severity Mapping. Remote Sens. Environ. 2018, 216, 374–384. [Google Scholar] [CrossRef]
- Quintano, C.; Fernández-Manso, A.; Fernández-Manso, O. Combination of Landsat and Sentinel-2 MSI Data for Initial Assessing of Burn Severity. Int. J. Appl. Earth Obs. Geoinf. 2018, 64, 221–225. [Google Scholar] [CrossRef]
- Shimizu, K.; Ota, T.; Mizoue, N. Detecting Forest Changes Using Dense Landsat 8 and Sentinel-1 Time Series Data in Tropical Seasonal Forests. Remote Sens. 2019, 11, 1899. [Google Scholar] [CrossRef] [Green Version]
- Meng, R.; Wu, J.; Zhao, F.; Cook, B.D.; Hanavan, R.P.; Serbin, S.P. Measuring Short-Term Post-Fire Forest Recovery across a Burn Severity Gradient in a Mixed Pine-Oak Forest Using Multi-Sensor Remote Sensing Techniques. Remote Sens. Environ. 2018, 210, 282–296. [Google Scholar] [CrossRef]
- Dragozi, E.; Gitas, I.Z.; Bajocco, S.; Stavrakoudis, D.G. Exploring the Relationship between Burn Severity Field Data and Very High Resolution GeoEye Images: The Case of the 2011 Evros Wildfire in Greece. Remote Sens. 2016, 8, 566. [Google Scholar] [CrossRef] [Green Version]
- Planet Imagery Product Specifications. Available online: https://bit.ly/33pWGGg (accessed on 4 October 2020).
- Santilli, G.; Vendittozzi, C.; Cappelletti, C.; Battistini, S.; Gessini, P. CubeSat Constellations for Disaster Management in Remote Areas. Acta Astronaut. 2018, 145, 11–17. [Google Scholar] [CrossRef]
- Kääb, A.; Altena, B.; Mascaro, J. Coseismic Displacements of the 14 November 2016 Mw 7.8 Kaikoura, New Zealand, Earthquake Using the Planet Optical Cubesat Constellation. Nat. Hazards Earth Syst. Sci. 2017, 17, 627–639. [Google Scholar] [CrossRef] [Green Version]
- Park, S.-H.; Jung, H.-S.; Lee, M.-J.; Lee, W.-J.; Choi, M.-J. Oil Spill Detection from PlanetScope Satellite Image: Application to Oil Spill Accident near Ras Al Zour Area, Kuwait in August 2017. J. Coast. Res. 2019, 90, 251–260. [Google Scholar] [CrossRef]
- Won, M.; Jang, K.; Yoon, S.; Lee, H. Change Detection of Damaged Area and Burn Severity due to Heat Damage from Gangwon Large Fire Area in 2019. Korean J. Remote Sens. 2019, 35, 1083–1093. [Google Scholar] [CrossRef]
- Kim, M.; Jung, M.; Kim, Y. Histogram Matching of Sentinel-2 Spectral Information to Enhance Planetscope Imagery for Effective Wildfire Damage Assessment. Korean J. Remote Sens. 2019, 35, 517–534. [Google Scholar] [CrossRef]
- Shin, J.I.; Seo, W.W.; Kim, T.; Park, J.; Woo, C.S. Using UAV Multispectral Images for Classification of Forest Burn Severity—A Case Study of the 2019 Gangneung Forest Fire. Forests 2019, 10, 1025. [Google Scholar] [CrossRef] [Green Version]
- Bovolo, F.; Bruzzone, L.; Marconcini, M. A Novel Approach to Unsupervised Change Detection Based on a Semisupervised SVM and a Similarity Measure. IEEE Trans. Geosci. Remote Sens. 2008, 46, 2070–2082. [Google Scholar] [CrossRef] [Green Version]
- Han, Y.; Javed, A.; Jung, S.; Liu, S. Object-Based Change Detection of Very High Resolution Images by Fusing Pixel-Based Change Detection Results Using Weighted Dempster–Shafer Theory. Remote Sens. 2020, 12, 983. [Google Scholar] [CrossRef] [Green Version]
- Wu, Z.; Hu, Z.; Fan, Q. Superpixel-based unsupervised change detection using multi-dimensional change vector analysis and SVM-based classification. In Proceedings of the ISPRS Annals of the Photogrammetry, Remote Sensing and Spatial Information Sciences, Melbourne, Australia, 25 August–1 September 2012; pp. 257–262. [Google Scholar]
- Xue, J.-H.; Zhang, Y.-J. Ridler and Calvard’s, Kittler and Illingworth’s and Otsu’s Methods for Image Thresholding. Pattern Recognit. Lett. 2012, 33, 793–797. [Google Scholar] [CrossRef]
- Pan, J.; Hu, Z.; Su, Z.; Yang, M.-H. Deblurring text images via L0-regularized intensity and gradient prior. In Proceedings of the 2014 IEEE Conference on Computer Vision and Pattern Recognition, Columbus, OH, USA, 23–28 June 2014. [Google Scholar]
- Pan, J.; Hu, Z.; Su, Z.; Yang, M.-H. L0-Regularized Intensity and Gradient Prior for Deblurring Text Images and Beyond. IEEE Trans. Pattern Anal. Mach. Intell. 2017, 39, 342–355. [Google Scholar] [CrossRef]
- Gangwon. Research Institute for Gangwon. Gangwon KOFST (Korean Federation of Science & Technology Societies). 1st Gangwon Province Disaster Prevention (Wildfire) Forum 2019. Available online: http://bitly.kr/A6LxHQJV3 (accessed on 4 October 2020).
- Korea Forest Service. Comprehensive Plan for the Prevention of National Forest Fire. 2020. Available online: http://bitly.kr/8OZNhLZQe (accessed on 4 October 2020).
- Planet. Planet Education and Research Program. Available online: https://bit.ly/2HUPr0U (accessed on 4 October 2020).
- Anger, J.; de Franchis, C.; Facciolo, G. Assessing the sharpness of satellite images: Study of the PlanetScope constellation. In Proceedings of the 2019 IEEE International Geoscience and Remote Sensing Symposium, Yokohama, Japan, 28 July–2 August 2019; pp. 389–392. [Google Scholar]
- Wilson, N.; Greenberg, J.; Jumpasut, A.; Collison, A.; Weichelt, H. Absolute Radiometric Calibration of Planet Dove Satellites, Flocks 2p & 2e; Planet: San Francisco, CA, USA, 2017. [Google Scholar]
- Leach, N.; Coops, N.C.; Obrknezev, N. Normalization Method for Multi-Sensor High Spatial and Temporal Resolution Satellite Imagery with Radiometric Inconsistencies. Comput. Electron. Agric. 2019, 164, 104893. [Google Scholar] [CrossRef]
- Pohl, C.; Van Genderen, J. Preprocessing. In Remote Sensing Image Fusion, A Practical Guide; CRC Press: Boca Raton, FL, USA, 2016; pp. 71–92. [Google Scholar]
- Smith, J.A.; Lin, T.L.; Ranson, K.J. The Lambertian Assumption and Landsat Data. Photogramm. Eng. Remote Sens. 1980, 46, 1183–1189. [Google Scholar]
- Teillet, P.M.; Guindon, B.; Goodenough, D.G. On the Slope-Aspect Correction of Multispectral Scanner Data. Can. J. Remote Sens. 1982, 8, 84–106. [Google Scholar] [CrossRef] [Green Version]
- Gu, D.; Gillespie, A. Topographic Normalization of Landsat TM Images of Forest Based on Subpixel Sun–Canopy–Sensor Geometry. Remote Sens. Environ. 1998, 64, 166–175. [Google Scholar] [CrossRef]
- Tan, B.; Wolfe, R.; Masek, J.; Gao, F.; Vermote, E.F. An illumination correction algorithm on Landsat-TM data. In Proceedings of the 2010 IEEE International Geoscience and Remote Sensing Symposium, Honolulu, HI, USA, 25–30 July 2010; pp. 1964–1967. [Google Scholar]
- Chung, M.; Kim, Y. Analysis on Topographic Normalization Methods for 2019 Gangneung-East Sea Wildfire Area Using PlanetScope Imagery. Korean J. Remote Sens. 2020, 36, 179–197. [Google Scholar] [CrossRef]
- Canty, M.J.; Nielsen, A.A. Automatic Radiometric Normalization of Multitemporal Satellite Imagery with the Iteratively Re-weighted MAD Transformation. Remote Sens. Environ. 2008, 112, 1025–1036. [Google Scholar] [CrossRef] [Green Version]
- Vicente-Serrano, S.M.; Pérez-Cabello, F.; Lasanta, T. Assessment of Radiometric Correction Techniques in Analyzing Vegetation Variability and Change Using Time Series of Landsat Images. Remote Sens. Environ. 2008, 112, 3916–3934. [Google Scholar] [CrossRef]
- Achanta, R.; Shaji, A.; Smith, K.; Lucchi, A.; Fua, P.; Süsstrunk, S. SLIC Superpixels Compared to State-of-the-Art Superpixel Methods. IEEE Trans. Pattern Anal. Mach. Intell. 2012, 34, 2274–2282. [Google Scholar] [CrossRef] [Green Version]
- Csillik, O. Fast Segmentation and Classification of Very High Resolution Remote Sensing Data Using SLIC Superpixels. Remote Sens. 2017, 9, 243. [Google Scholar] [CrossRef] [Green Version]
- Lu, L.; Wang, C.; Yin, X. Incorporating texture into SLIC Super-pixels method for high spatial resolution remote sensing image segmentation. In Proceedings of the 2019 8th International Conference on Agro-Geoinformatics (Agro-Geoinformatics), Istanbul, Turkey, 16–19 July 2019. [Google Scholar]
- Tong, H.; Tong, F.; Zhou, W.; Zhang, Y. Purifying SLIC Superpixels to Optimize Superpixel-Based Classification of High Spatial Resolution Remote Sensing Image. Remote Sens. 2019, 11, 2627. [Google Scholar] [CrossRef] [Green Version]
- Kim, K.-S.; Zhang, D.; Kang, M.-C.; Ko, S.-J. Improved simple linear iterative clustering superpixels. In Proceedings of the 2013 IEEE International Symposium on Consumer Electronics (ISCE), Hsinchu, Taiwan, 3–6 June 2013. [Google Scholar]
- Murray, H.; Lucieer, A.; Williams, R. Texture-Based Classification of Sub-Antarctic Vegetation Communities on Heard Island. Int. J. Appl. Earth Obs. Geoinf. 2010, 12, 138–149. [Google Scholar] [CrossRef]
- Volpi, M.; Tuia, D.; Bovolo, F.; Kanevski, M.; Bruzzone, L. Supervised Change Detection in VHR Images Using Contextual Information and Support Vector Machines. Int. J. Appl. Earth Obs. Geoinf. 2013, 20, 77–85. [Google Scholar] [CrossRef]
- Gurney, C.M.; Townshend, J.R.G. The Use of Contextual Information in the Classification of Remotely Sensed Data Contextual Methods. Photogramm. Eng. Remote Sens. 1983, 49, 55–64. [Google Scholar]
- Cortes, C.; Vapnik, V. Support-Vector Networks. Mach. Learn. 1995, 20, 273–297. [Google Scholar] [CrossRef]
- Liu, P.; Choo, K.-K.R.; Wang, L.; Huang, F. SVM or Deep Learning? A Comparative Study on Remote Sensing Image Classification. Soft Comput. 2017, 21, 7053–7065. [Google Scholar] [CrossRef]
- Breiman, L. Random Forests. Mach. Learn. 2001, 45, 5–32. [Google Scholar] [CrossRef] [Green Version]
- Maillard, P. Comparing Texture Analysis Methods through Classification. Photogramm. Eng. Remote Sens. 2003, 69, 357–367. [Google Scholar] [CrossRef] [Green Version]
- Fei, G.; Lu, Z.; Jun, W.; Jingyuan, M. Change detection in remote sensing images of damage areas with complex terrain using texture information and SVM. In Proceedings of the 2015 AASRI International Conference on Circuits and Systems (CAS 2015), Paris, France, 9–10 August 2015; pp. 225–229. [Google Scholar]
- Haralick, R.M.; Shanmugam, K.; Dinstein, I.H. Textural Features for Image Classification. IEEE Trans. Syst. Man. Cybern. Syst. 1973, SMC-3, 610–621. [Google Scholar] [CrossRef] [Green Version]
- Cohen, J. A Coefficient of Agreement for Nominal Scales. Educ. Psychol. Meas. 1960, 20, 37–46. [Google Scholar] [CrossRef]
- Berberoglu, S.; Akin, A.; Atkinson, P.M.; Curran, P.J. Utilizing Image Texture to Detect Land-Cover Change in Mediterranean Coastal Wetlands. Int. J. Remote Sens. 2010, 31, 2793–2815. [Google Scholar] [CrossRef] [Green Version]
- Wang, H.; Zhao, Y.; Pu, R.; Zhang, Z. Mapping Robinia Pseudoacacia Forest Health Conditions by Using Combined Spectral, Spatial, and Textural Information Extracted from IKONOS Imagery and Random Forest Classifier. Remote Sens. 2015, 7, 9020–9044. [Google Scholar] [CrossRef] [Green Version]
- Kim, M.; Warner, T.A.; Madden, M.; Atkinson, D.S. Multi-Scale GEOBIA with Very High Spatial Resolution Digital Aerial Imagery: Scale, Texture and Image Objects. Int. J. Remote Sens. 2011, 32, 2825–2850. [Google Scholar] [CrossRef]
- Mishra, V.N.; Prasad, R.; Rai, P.K.; Vishwakarma, A.K.; Arora, A. Performance Evaluation of Textural Features in Improving Land Use/Land Cover Classification Accuracy of Heterogeneous Landscape Using Multi-Sensor Remote Sensing Data. Earth Sci. Inform. 2019, 12, 71–86. [Google Scholar] [CrossRef]
- Huang, X.; Zhang, L.; Wang, L. Evaluation of Morphological Texture Features for Mangrove Forest Mapping and Species Discrimination Using Multispectral IKONOS Imagery. IEEE Geosci. Remote Sens. Lett. 2009, 6, 393–397. [Google Scholar] [CrossRef] [Green Version]
Figure 1.
Flowchart of the proposed approach: (a) pre-processing step; (b) superpixel-based wildfire change detection step.
Figure 1.
Flowchart of the proposed approach: (a) pre-processing step; (b) superpixel-based wildfire change detection step.


Figure 2.
GeoEye-1 (GE-1) images acquired over (a) Gangneung–East Sea region and (b) Goseong–Sokcho region in Gangwon province, South Korea on April 7, 2019, displayed in false-color image with near-infrared (NIR), red, and green bands.
Figure 2.
GeoEye-1 (GE-1) images acquired over (a) Gangneung–East Sea region and (b) Goseong–Sokcho region in Gangwon province, South Korea on April 7, 2019, displayed in false-color image with near-infrared (NIR), red, and green bands.

Figure 3.
Histograms of sharpness scores derived from clear and non-clear PS image patches over (a) Gangneung–East Sea region and (b) Goseong–Sokcho region.
Figure 3.
Histograms of sharpness scores derived from clear and non-clear PS image patches over (a) Gangneung–East Sea region and (b) Goseong–Sokcho region.

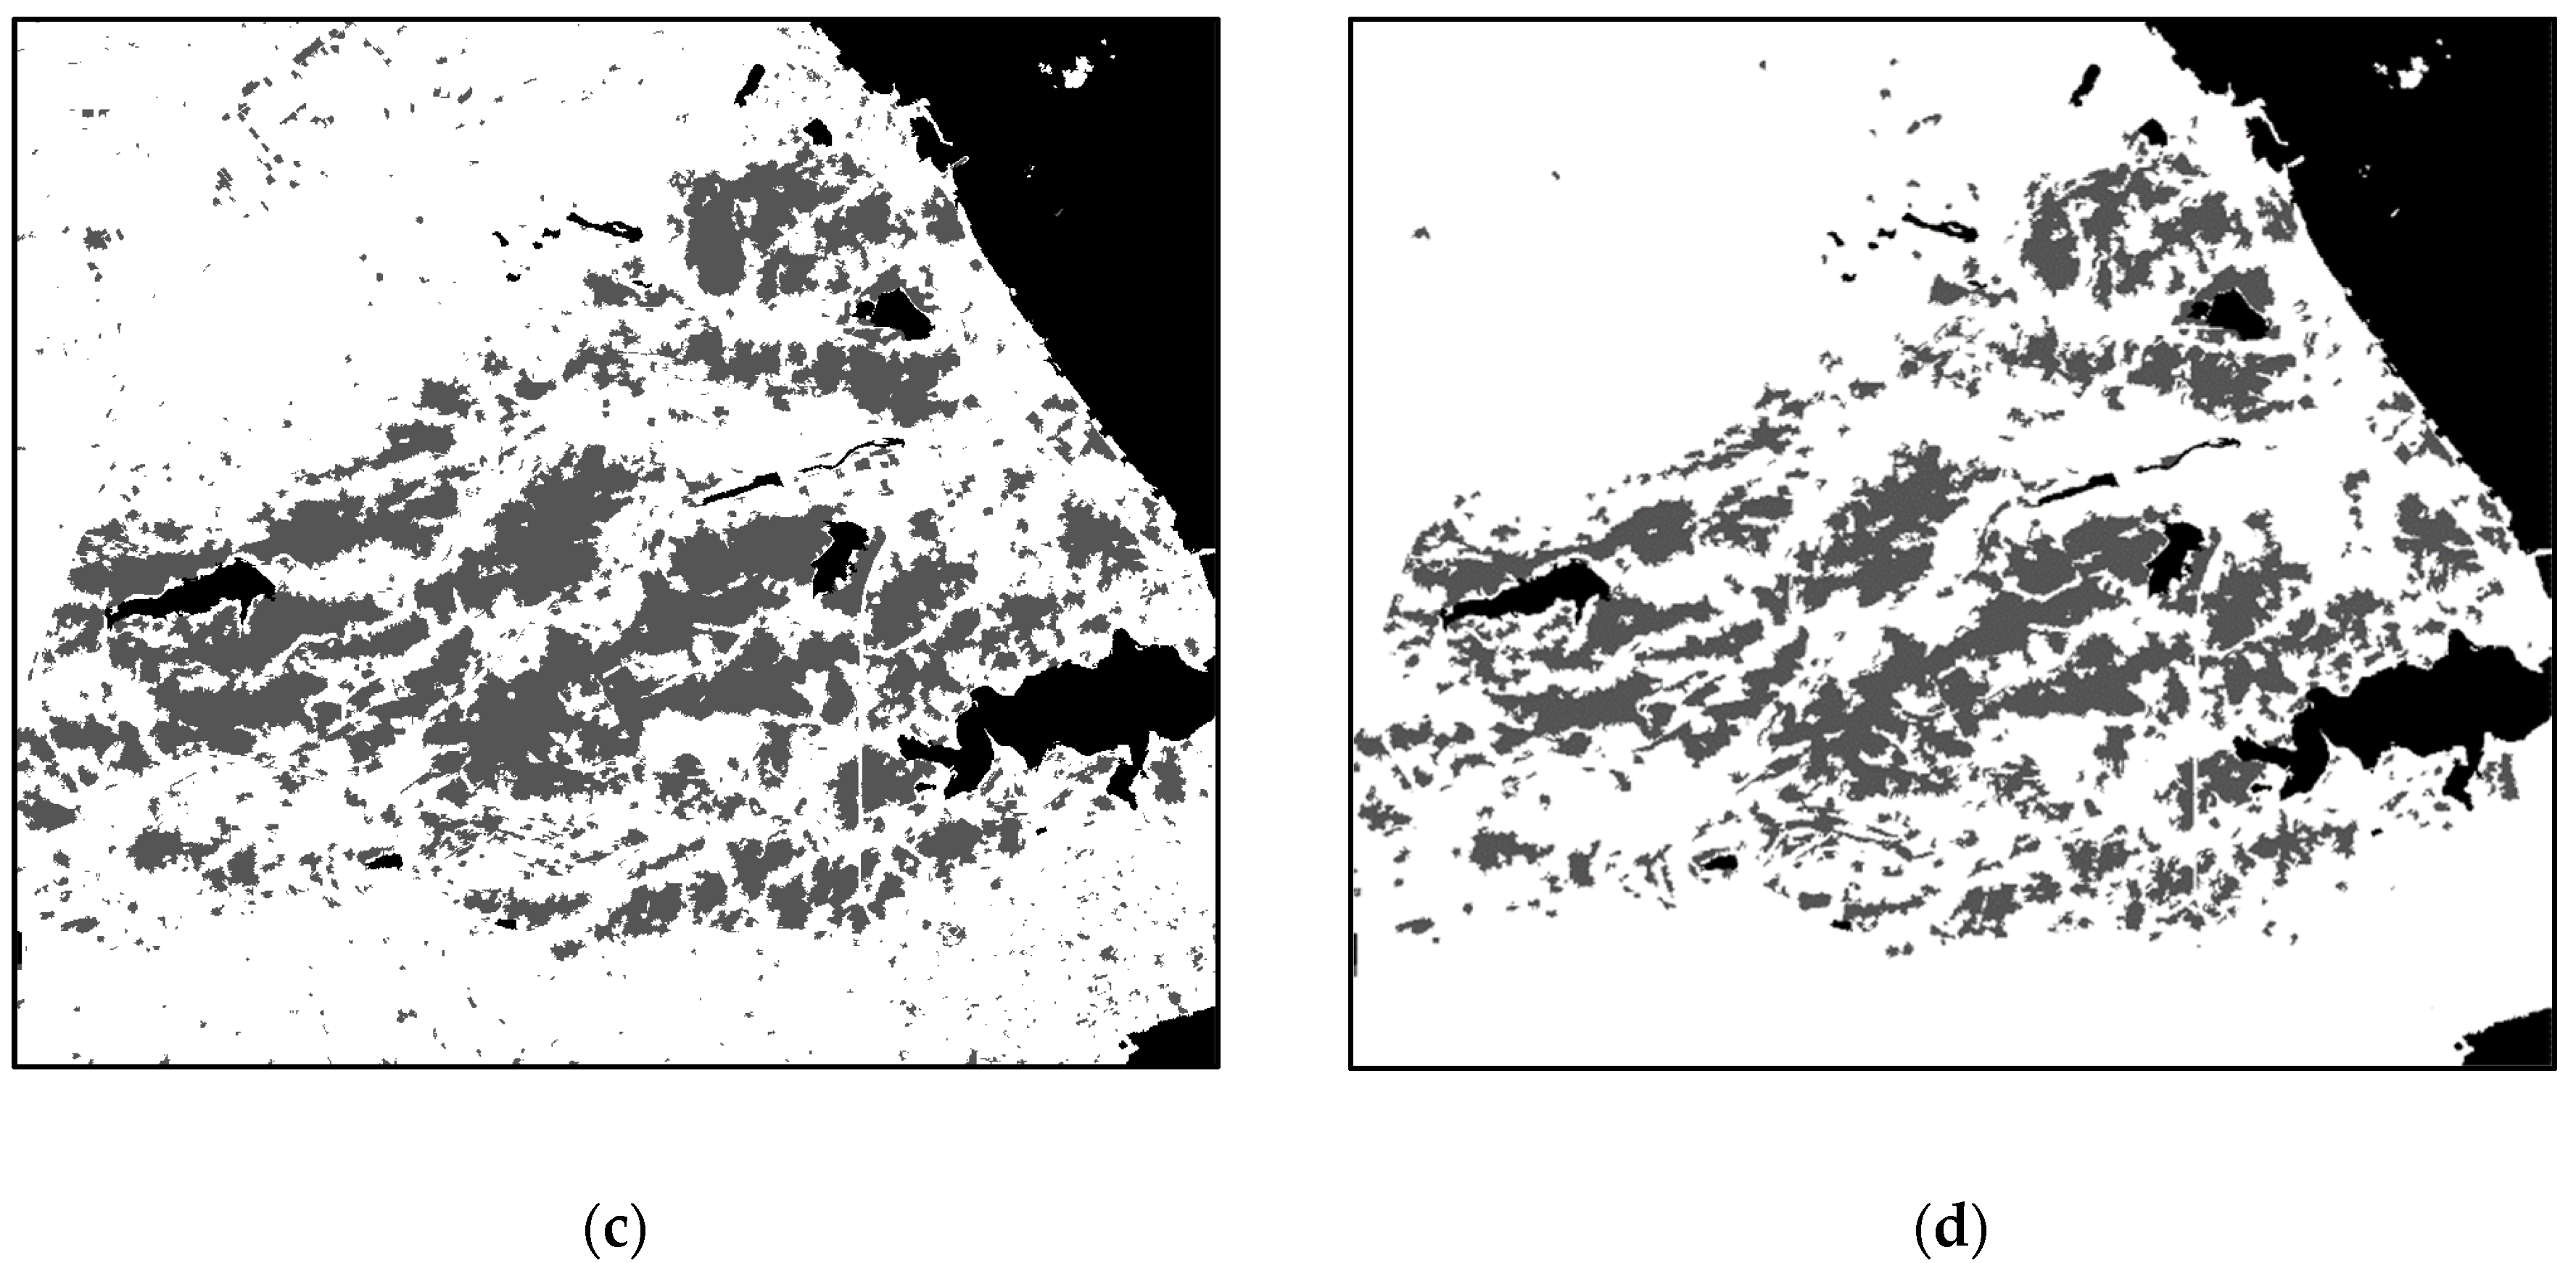
Figure 4.
Bi-temporal normalized difference vegetation index (NDVI) correlation image and pseudo-training data generated by thresholding the correlation over (a,c) Gangneung–East Sea region and (b,d) Goseong–Sokcho region (Location and extent of the study area is the same as Figure 2).
Figure 4.
Bi-temporal normalized difference vegetation index (NDVI) correlation image and pseudo-training data generated by thresholding the correlation over (a,c) Gangneung–East Sea region and (b,d) Goseong–Sokcho region (Location and extent of the study area is the same as Figure 2).


Figure 5.
Change detection results for the Gangneung–East Sea region from support vector machine (SVM) with (a) pseudo-training data; (b) manually labeled training data; from random forest (RF) with (c) pseudo-training data; (d) manually labeled training data (location and extent of the study area is the same as Figure 2).

Figure 6.
Change detection results for the Goseong–Sokcho region from SVM with (a) pseudo-training data; (b) manually labeled training data; from RF with (c) pseudo-training data; (d) manually labeled training data (location and extent of the study area is the same as Figure 2).
Figure 6.
Change detection results for the Goseong–Sokcho region from SVM with (a) pseudo-training data; (b) manually labeled training data; from RF with (c) pseudo-training data; (d) manually labeled training data (location and extent of the study area is the same as Figure 2).


Figure 7.
Comparison of number of samples labeled as “unchanged” through the proposed pseudo-training data generation method and accuracy rates, depending on the value of the upper threshold for bi-temporal NDVI correlation in the Gangneung–East Sea region: (a) number of unchanged samples; (c) false alarm rate (FAR) and miss rate (MR); (e) overall accuracy (OA), kappa coefficient, and F1-score, and in the Goseong–Sokcho region: (b) number of unchanged samples; (d) FAR and MR; (f) OA, kappa coefficient, and F1-score. All the change detection results were obtained from SVM with spectral and textural change features.


Table 1.
Description of GE-1 and PlanetScope (PS) images used in this study.
| Study Site | Sensor | Product | Spatial Resolution | Acquisition Date | Num. of Images 1 |
|---|---|---|---|---|---|
| Gangneung–East Sea region | GeoEye-1 | OR2A (Ortho-ready) | 2.0 m (MS) | 7 April 2019 (Post-fire) | 1 |
| PlanetScope | Level-3B Analytic (Orthorectified) | 3.0 m (MS) | 1–8 April 2019 | 21 (25) | |
| Goseong–Sokcho region | GeoEye-1 | OR2A (Ortho-ready) | 2.0 m (MS) | 7 April 2019 (Post-fire) | 1 |
| PlanetScope | Level-3B Analytic (Orthorectified) | 3.0 m (MS) | 24 March–7 April 2019 | 16 (37) |
1 For the PS image, the number of images refers to the number of images captured within the acquisition date, and the number of selected images based on cloud coverage, ground control, and the quality category from the image metadata. For example, 21 (25) means 21 images were selected out of 25 images.
Table 2.
Statistical distribution of sharpness scores derived from clear and non-clear PS image patches over the study sites.
Table 2.
Statistical distribution of sharpness scores derived from clear and non-clear PS image patches over the study sites.
| Study Site | Patch Type | Sharpness Score (S) | |||
|---|---|---|---|---|---|
| Mean | Std. | Max. | Min. | ||
| Gangneung–East Sea region | Clear patch | 0.2717 | 0.0301 | 0.3574 | 0.0971 |
| Non-clear patch | 0.2116 | 0.0448 | 0.2931 | 0.1133 | |
| Total patch | 0.2587 | 0.0419 | 0.3574 | 0.0971 | |
| Goseong–Sokcho region | Clear patch | 0.2723 | 0.0220 | 0.3169 | 0.1263 |
| Non-clear patch | 0.2011 | 0.0480 | 0.2654 | 0.1187 | |
| Total patch | 0.2640 | 0.0349 | 0.3169 | 0.1187 | |
Table 3.
Non-clear patch detection results from PS images based on thresholding of the sharpness score.
Table 3.
Non-clear patch detection results from PS images based on thresholding of the sharpness score.
| Study Site | FAR | MR | OA (%) | F1-Score |
|---|---|---|---|---|
| Gangneung–East Sea region | 0.080 | 0.297 | 87.299 | 0.705 |
| Goseong–Sokcho region | 0.064 | 0.271 | 91.167 | 0.658 |
Table 4.
Image-level decision of image availability based on the number of non-clear patches over the Gangneung–East Sea region.
Table 4.
Image-level decision of image availability based on the number of non-clear patches over the Gangneung–East Sea region.
| Acquisition Date | Product Name | Total Num. of Patches | Num. of Non-Clear Patches | Reference 1 |
|---|---|---|---|---|
| 8 April 2019 | 20190408_015327 | 16 | 0 | O |
| 20190408_015325 | 70 | 1 | O | |
| 20190408_014857 | 41 | 2 | O | |
| 20190408_014856 | 30 | 4 | O | |
| 20190408_014742 | 14 | 0 | O | |
| 20190408_014740 | 7 | 0 | O | |
| 7 April 2019 | 20190407_015522 | 20 | 3 | O |
| 5 April 2019 | 20190405_014628 | 47 | 27 | X |
| 20190405_013759 | 50 | 29 | X | |
| 20190405_013758 | 21 | 17 | X | |
| 4 April 2019 | 20190404_014158 | 14 | 1 | O |
| 20190404_014157 | 50 | 1 | O | |
| 3 April 2019 | 20190403_014559 | 68 | 5 | X |
| 20190403_014558 | 4 | 0 | O | |
| 20190403_005542_1 | 20 | 5 | X | |
| 20190403_005542 | 51 | 7 | X | |
| 2 April 2019 | 20190402_014510 | 4 | 0 | O |
| 20190402_014509 | 68 | 5 | X | |
| 1 April 2019 | 20190401_014438 | 72 | 40 | X |
| 20190401_005834 | 3 | 0 | O | |
| 20190401_005833 | 15 | 0 | O |
1 The mark implies the availability of the image by the visual image interpretation depending on whether the image contains the image quality degradation factors (cloud, haze, or smoke) or not.
Table 5.
Image-level decision of image availability based on the number of non-clear patches over the Goseong–Sokcho region.
Table 5.
Image-level decision of image availability based on the number of non-clear patches over the Goseong–Sokcho region.
| Acquisition Date | Product Name | Total Num. of Patches | Num. of Non-Clear Patches | Reference 1 |
|---|---|---|---|---|
| 7 April 2019 | 20190407_015731 | 77 | 1 | O |
| 20190407_005941 | 14 | 0 | O | |
| 20190407_005940 | 63 | 0 | O | |
| 4 April 2019 | 20190404_005839 | 14 | 0 | O |
| 3 April 2019 | 20190403_005827 | 35 | 0 | O |
| 20190403_005826 | 14 | 0 | O | |
| 1 April 2019 | 20190401_014748 | 49 | 47 | X |
| 20190401_014747 | 28 | 0 | O | |
| 26 March 2019 | 20190326_015027 | 28 | 2 | O |
| 20190326_015026 | 28 | 1 | O | |
| 25 March 2019 | 20190325_015008 | 76 | 20 | X |
| 20190325_015007 | 3 | 2 | O | |
| 24 March 2019 | 20190324_022022 | 57 | 11 | O |
| 20190324_022020 | 45 | 0 | O | |
| 20190324_014903 | 42 | 0 | O | |
| 20190324_014902 | 27 | 1 | O |
1 The mark implies the availability of the image by the visual image interpretation depending on whether the image contains the image quality degradation factors (cloud, haze, or smoke) or not.
Table 6.
Assessment of change detection accuracy results for the Gangneung–East Sea region.
| Change Detection Algorithm | Input Change Feature | FAR | MR | OA (%) | Kappa | F1-Score |
|---|---|---|---|---|---|---|
| Support vector machine (SVM) | 4 band | 0.001 | 0.103 | 97.333 | 0.926 | 0.944 |
| GLCM | 0.004 | 0.033 | 98.833 | 0.969 | 0.976 | |
| 4 band + GLCM | 0.003 | 0.027 | 99.083 | 0.975 | 0.982 | |
| Random forest (RF) 1 | 4 band | 0.006 | 0.033 | 98.683 | 0.965 | 0.973 |
| GLCM | 0.006 | 0.023 | 99.000 | 0.973 | 0.980 | |
| 4 band + GLCM | 0.002 | 0.017 | 99.442 | 0.985 | 0.989 | |
| SVM with pseudo-training data | 4 band | 0.006 | 0.060 | 98.083 | 0.948 | 0.961 |
| GLCM | 0.008 | 0.017 | 99.000 | 0.973 | 0.980 | |
| 4 band + GLCM | 0.004 | 0.013 | 99.333 | 0.982 | 0.987 | |
| RF with pseudo-training data 1 | 4 band | 0.050 | 0.038 | 95.292 | 0.879 | 0.911 |
| GLCM | 0.046 | 0.021 | 95.992 | 0.897 | 0.924 | |
| 4 band + GLCM | 0.046 | 0.020 | 96.042 | 0.898 | 0.925 |
1 Accuracy assessment results for RF algorithm were averaged values over 10 trials.
Table 7.
Assessment of change detection accuracy results for the Goseong–Sokcho region.
| Change Detection Algorithm | Input Change Feature | FAR | MR | OA (%) | Kappa | F1-Score |
|---|---|---|---|---|---|---|
| Support vector machine (SVM) | 4 band | 0.002 | 0.047 | 98.667 | 0.964 | 0.973 |
| GLCM | 0.002 | 0.017 | 99.417 | 0.984 | 0.988 | |
| 4 band + GLCM | 0.000 | 0.013 | 99.667 | 0.991 | 0.993 | |
| Random forest (RF) 1 | 4 band | 0.004 | 0.014 | 99.317 | 0.982 | 0.986 |
| GLCM | 0.002 | 0.024 | 99.225 | 0.979 | 0.984 | |
| 4 band + GLCM | 0.000 | 0.013 | 99.667 | 0.991 | 0.993 | |
| SVM with pseudo-training data | 4 band | 0.000 | 0.070 | 98.250 | 0.952 | 0.964 |
| GLCM | 0.017 | 0.023 | 98.167 | 0.952 | 0.964 | |
| 4 band + GLCM | 0.002 | 0.013 | 99.500 | 0.987 | 0.990 | |
| RF with pseudo-training data 1 | 4 band | 0.058 | 0.065 | 93.992 | 0.845 | 0.886 |
| GLCM | 0.052 | 0.020 | 95.600 | 0.888 | 0.918 | |
| 4 band + GLCM | 0.048 | 0.026 | 95.767 | 0.891 | 0.920 |
1 Accuracy assessment results for RF algorithm were averaged values over 10 trials.
Publisher’s Note: MDPI stays neutral with regard to jurisdictional claims in published maps and institutional affiliations. |
© 2020 by the authors. Licensee MDPI, Basel, Switzerland. This article is an open access article distributed under the terms and conditions of the Creative Commons Attribution (CC BY) license (http://creativecommons.org/licenses/by/4.0/).
Share and Cite
MDPI and ACS Style
Chung, M.; Han, Y.; Kim, Y. A Framework for Unsupervised Wildfire Damage Assessment Using VHR Satellite Images with PlanetScope Data. Remote Sens. 2020, 12, 3835. https://0-doi-org.brum.beds.ac.uk/10.3390/rs12223835
AMA Style
Chung M, Han Y, Kim Y. A Framework for Unsupervised Wildfire Damage Assessment Using VHR Satellite Images with PlanetScope Data. Remote Sensing. 2020; 12(22):3835. https://0-doi-org.brum.beds.ac.uk/10.3390/rs12223835
Chicago/Turabian StyleChung, Minkyung, Youkyung Han, and Yongil Kim. 2020. "A Framework for Unsupervised Wildfire Damage Assessment Using VHR Satellite Images with PlanetScope Data" Remote Sensing 12, no. 22: 3835. https://0-doi-org.brum.beds.ac.uk/10.3390/rs12223835
Note that from the first issue of 2016, this journal uses article numbers instead of page numbers. See further details here.