Detection and Classification of Non-Photosynthetic Vegetation from PRISMA Hyperspectral Data in Croplands


Abstract
:1. Introduction
2. Materials and Methods
2.1. PRISMA Satellite Data
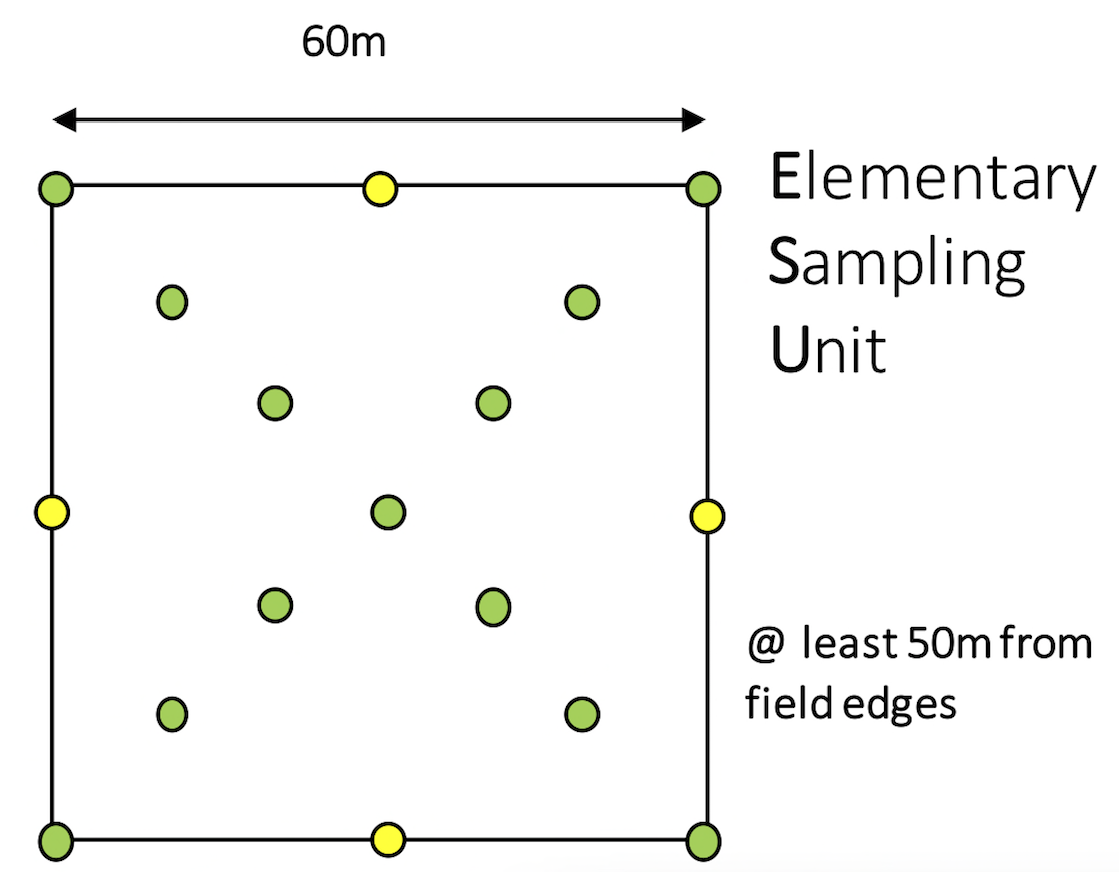
2.2. PRISCAV Fiducial Reference Measurements
2.3. Data Processing
3. Results
3.1. Exploratory Analyses on Cellulose Absorption Band on PRISMA Data
3.2. NPV Detection at Field Level from Satellite Data
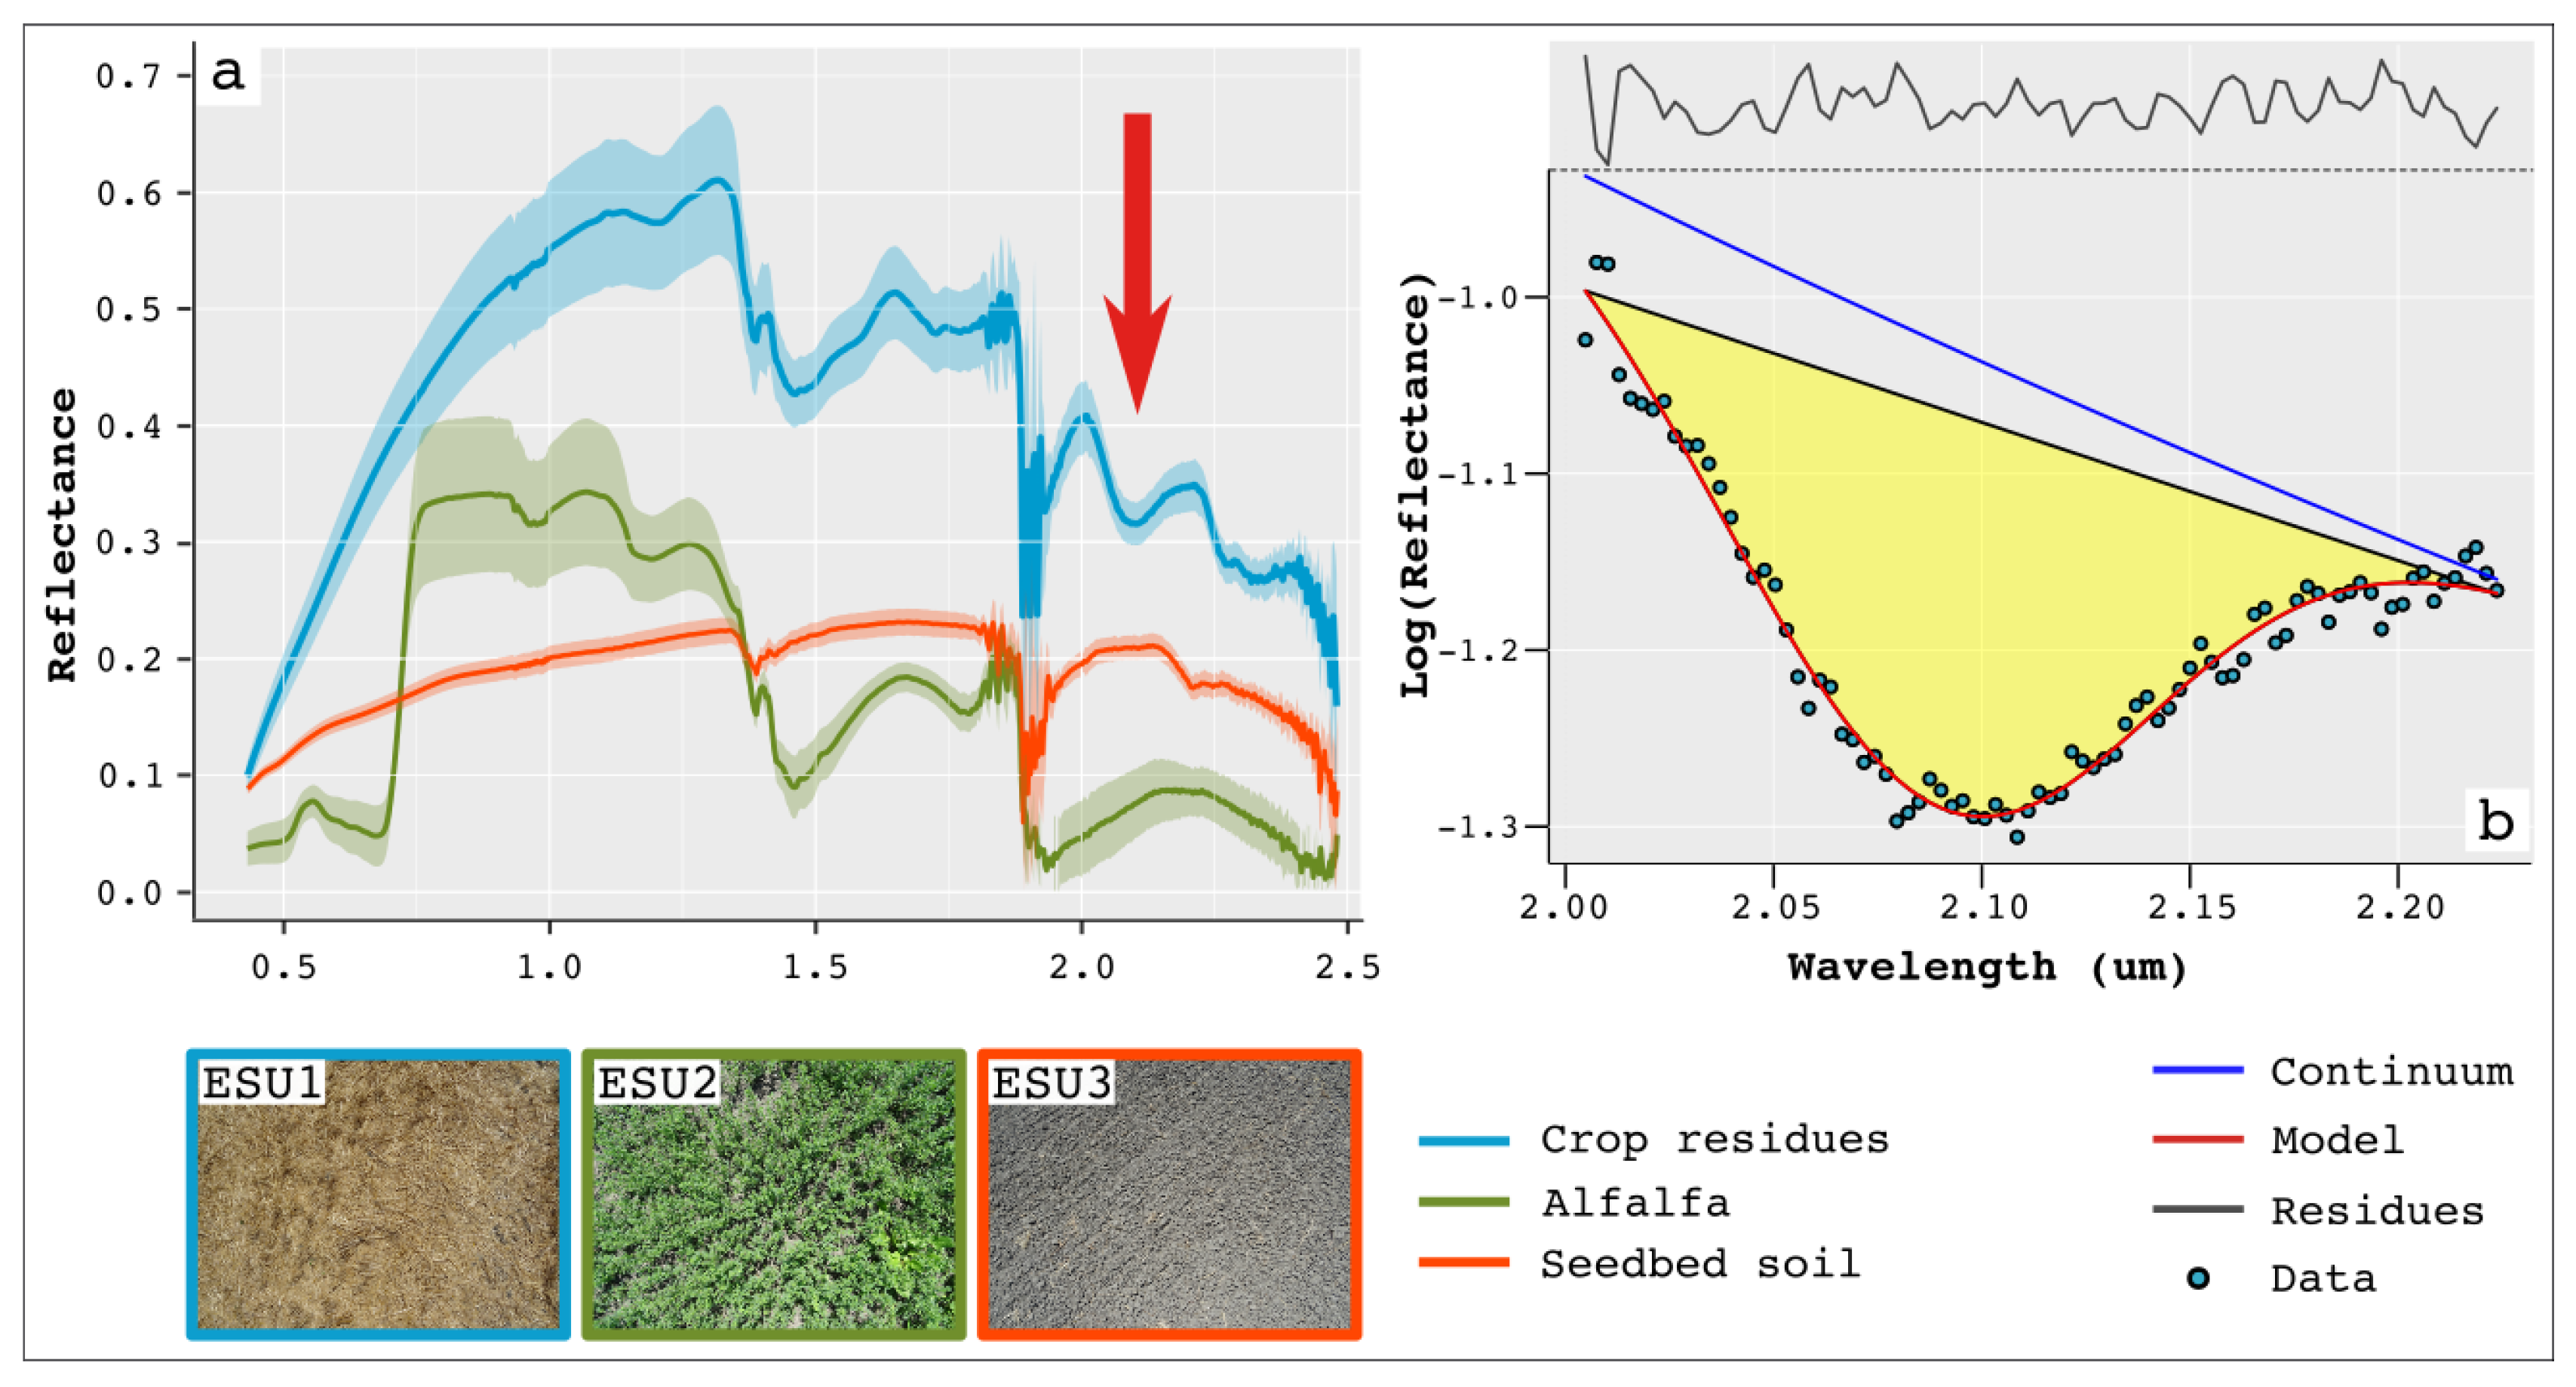
3.3. Spectroscopic Characterisation of Cellulose Band in PRISMA Data
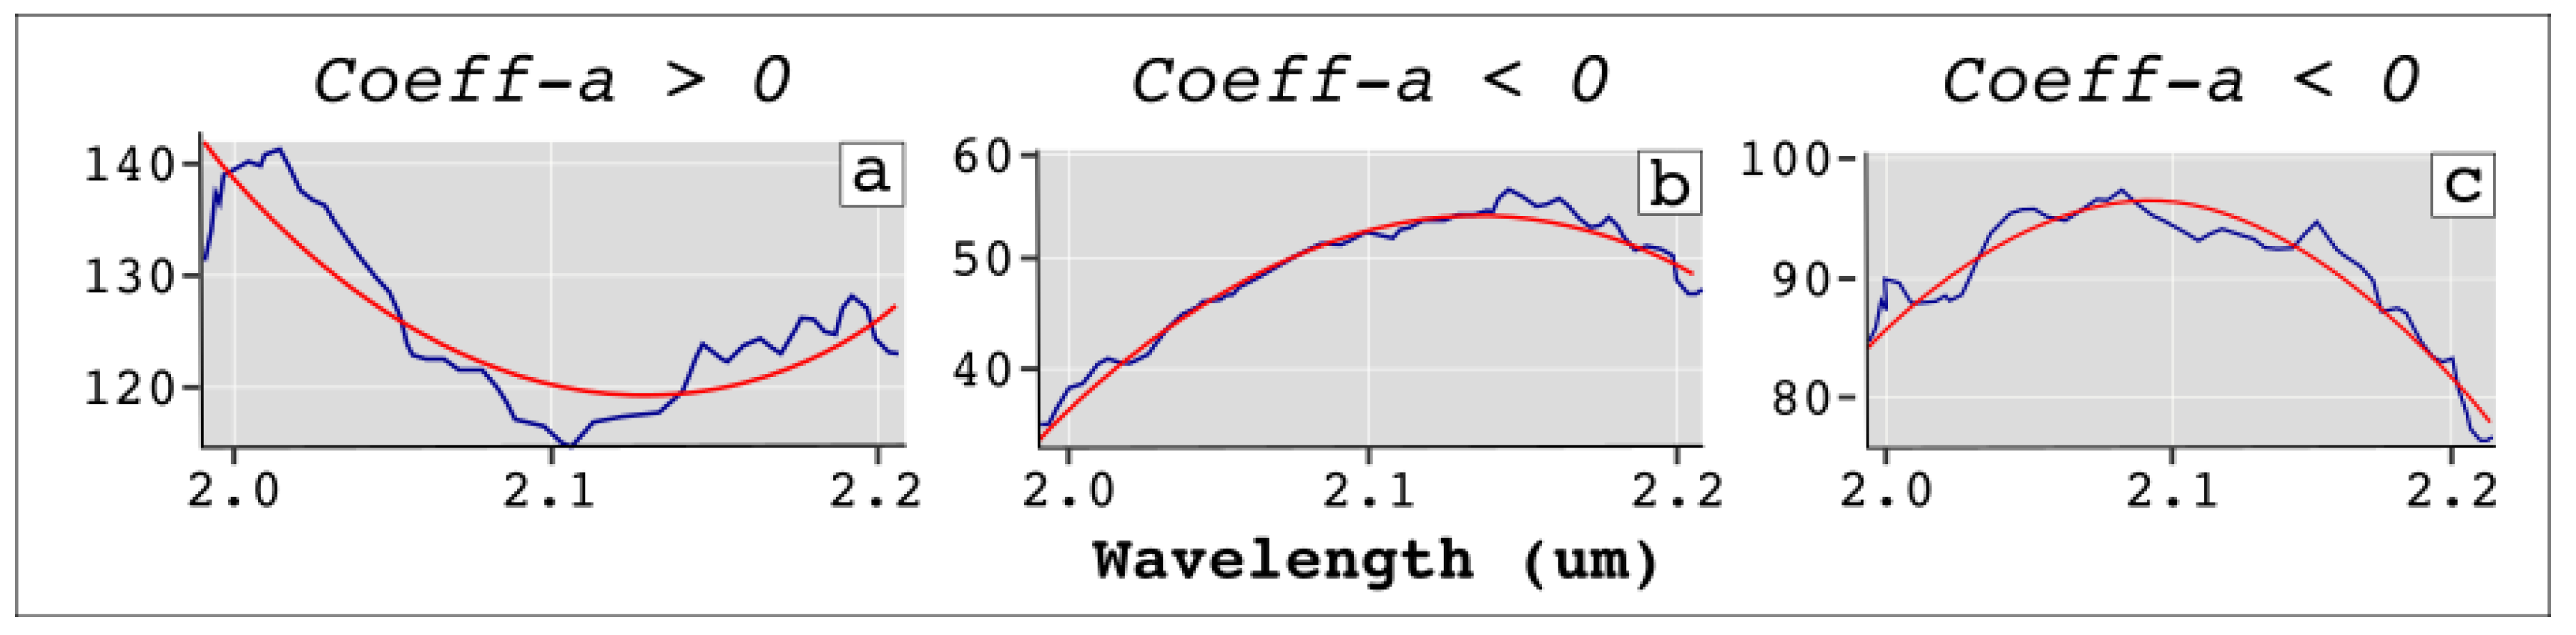
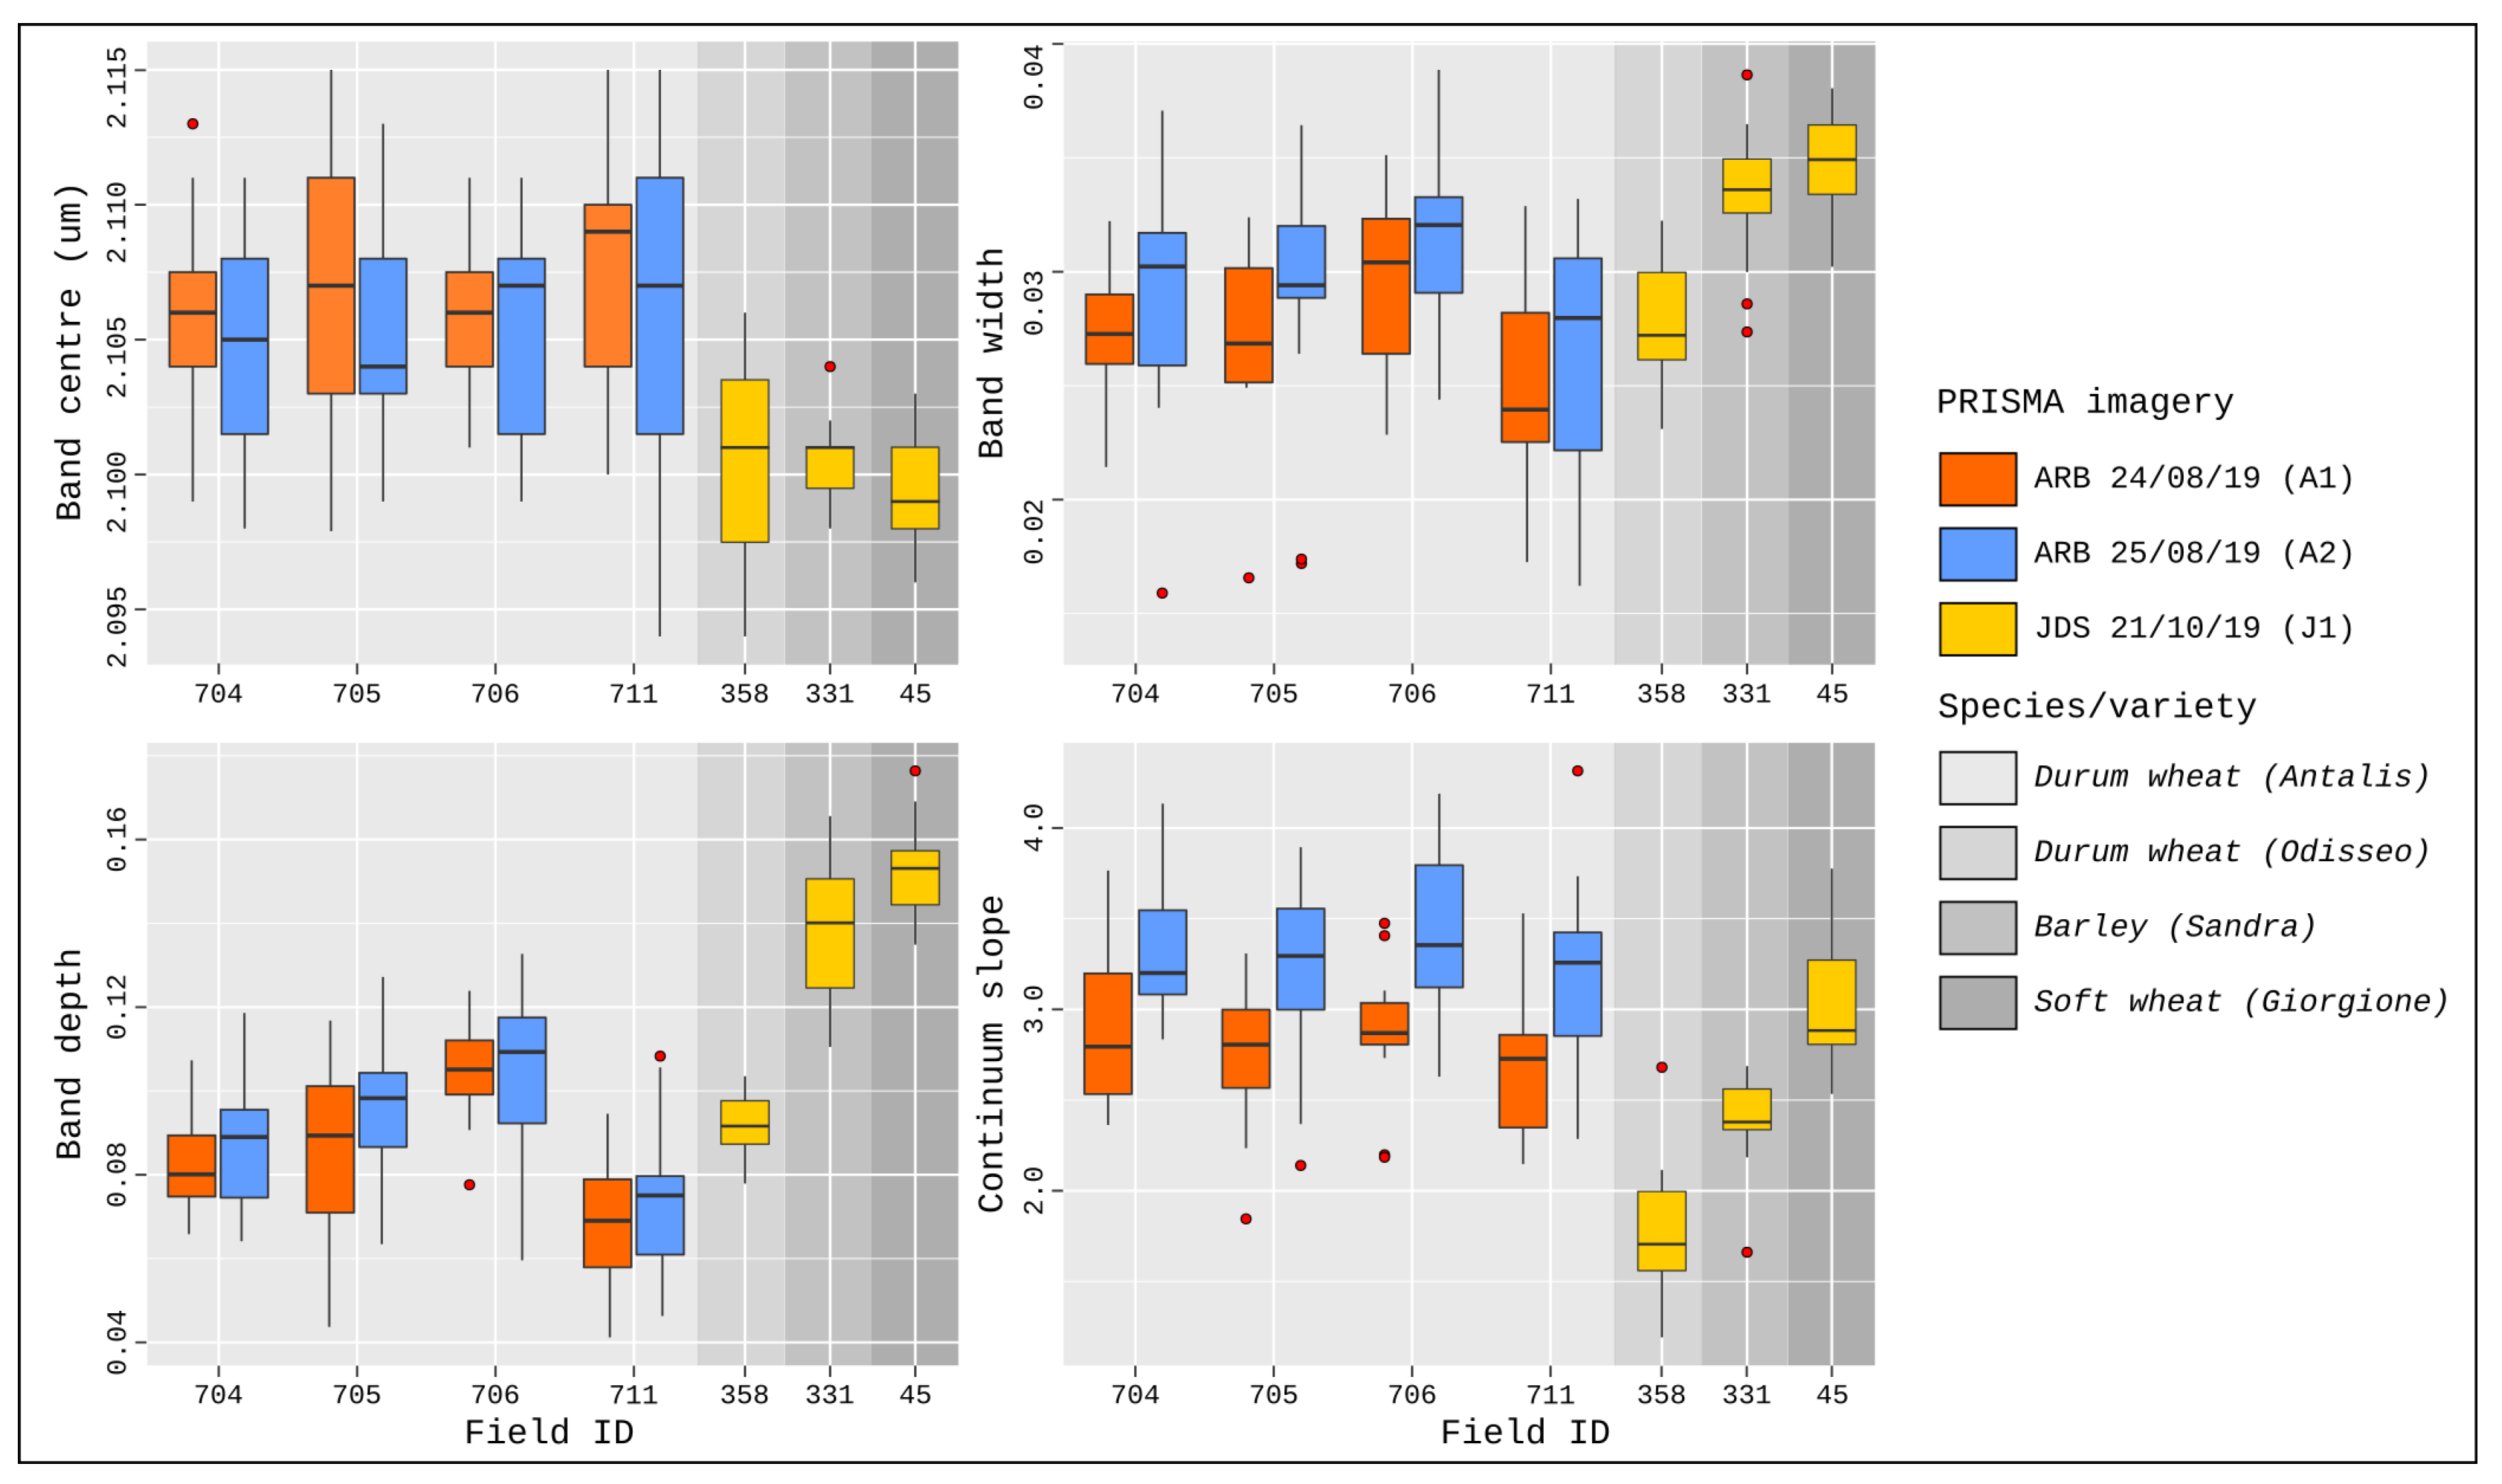
- feature centres are slightly variable within each site, while they are consistent in images A1 and A2. This evidence could be related to the chemical composition of the residues in the two farms or to the influence of the soil background on the spectra, and therefore is worth of further investigation;
- variations of feature widths appear related to the investigated species: the feature is broader for Barley and Soft wheat with respect to Durum wheat, in spectra belonging to both sites;
- as expected, a large variabilty is observed in feature depth, because it is generally related to the abundance of the molecule responsible of the observed spectral feature (cellulose in this case). Thus, feature depth shows to be sensitive to the CR forerunner (Barley and Soft wheat have deeper bands than Durum wheat), and likely to the crop primary productivity (variations within the Durum wheat species). In case of Durum wheat growings, the lowest feature depth observed in parcel ID711, could be related to the different soil composition of that field which has a higher amount of sand over loam and clay than the other parcels.
- continua slopes vary with species (as for J1 data), while when analysed on the same target in two consecutive days (i.e., Durum wheat in A1 and A2) they show a sensitivity to the viewing geometry (A1 and A2 images have been acquired with opposite view angles: −17.6 and +13.5, respectively).
4. Discussion
5. Conclusions and Perspectives
Author Contributions
Funding
Acknowledgments
Conflicts of Interest
Abbreviations
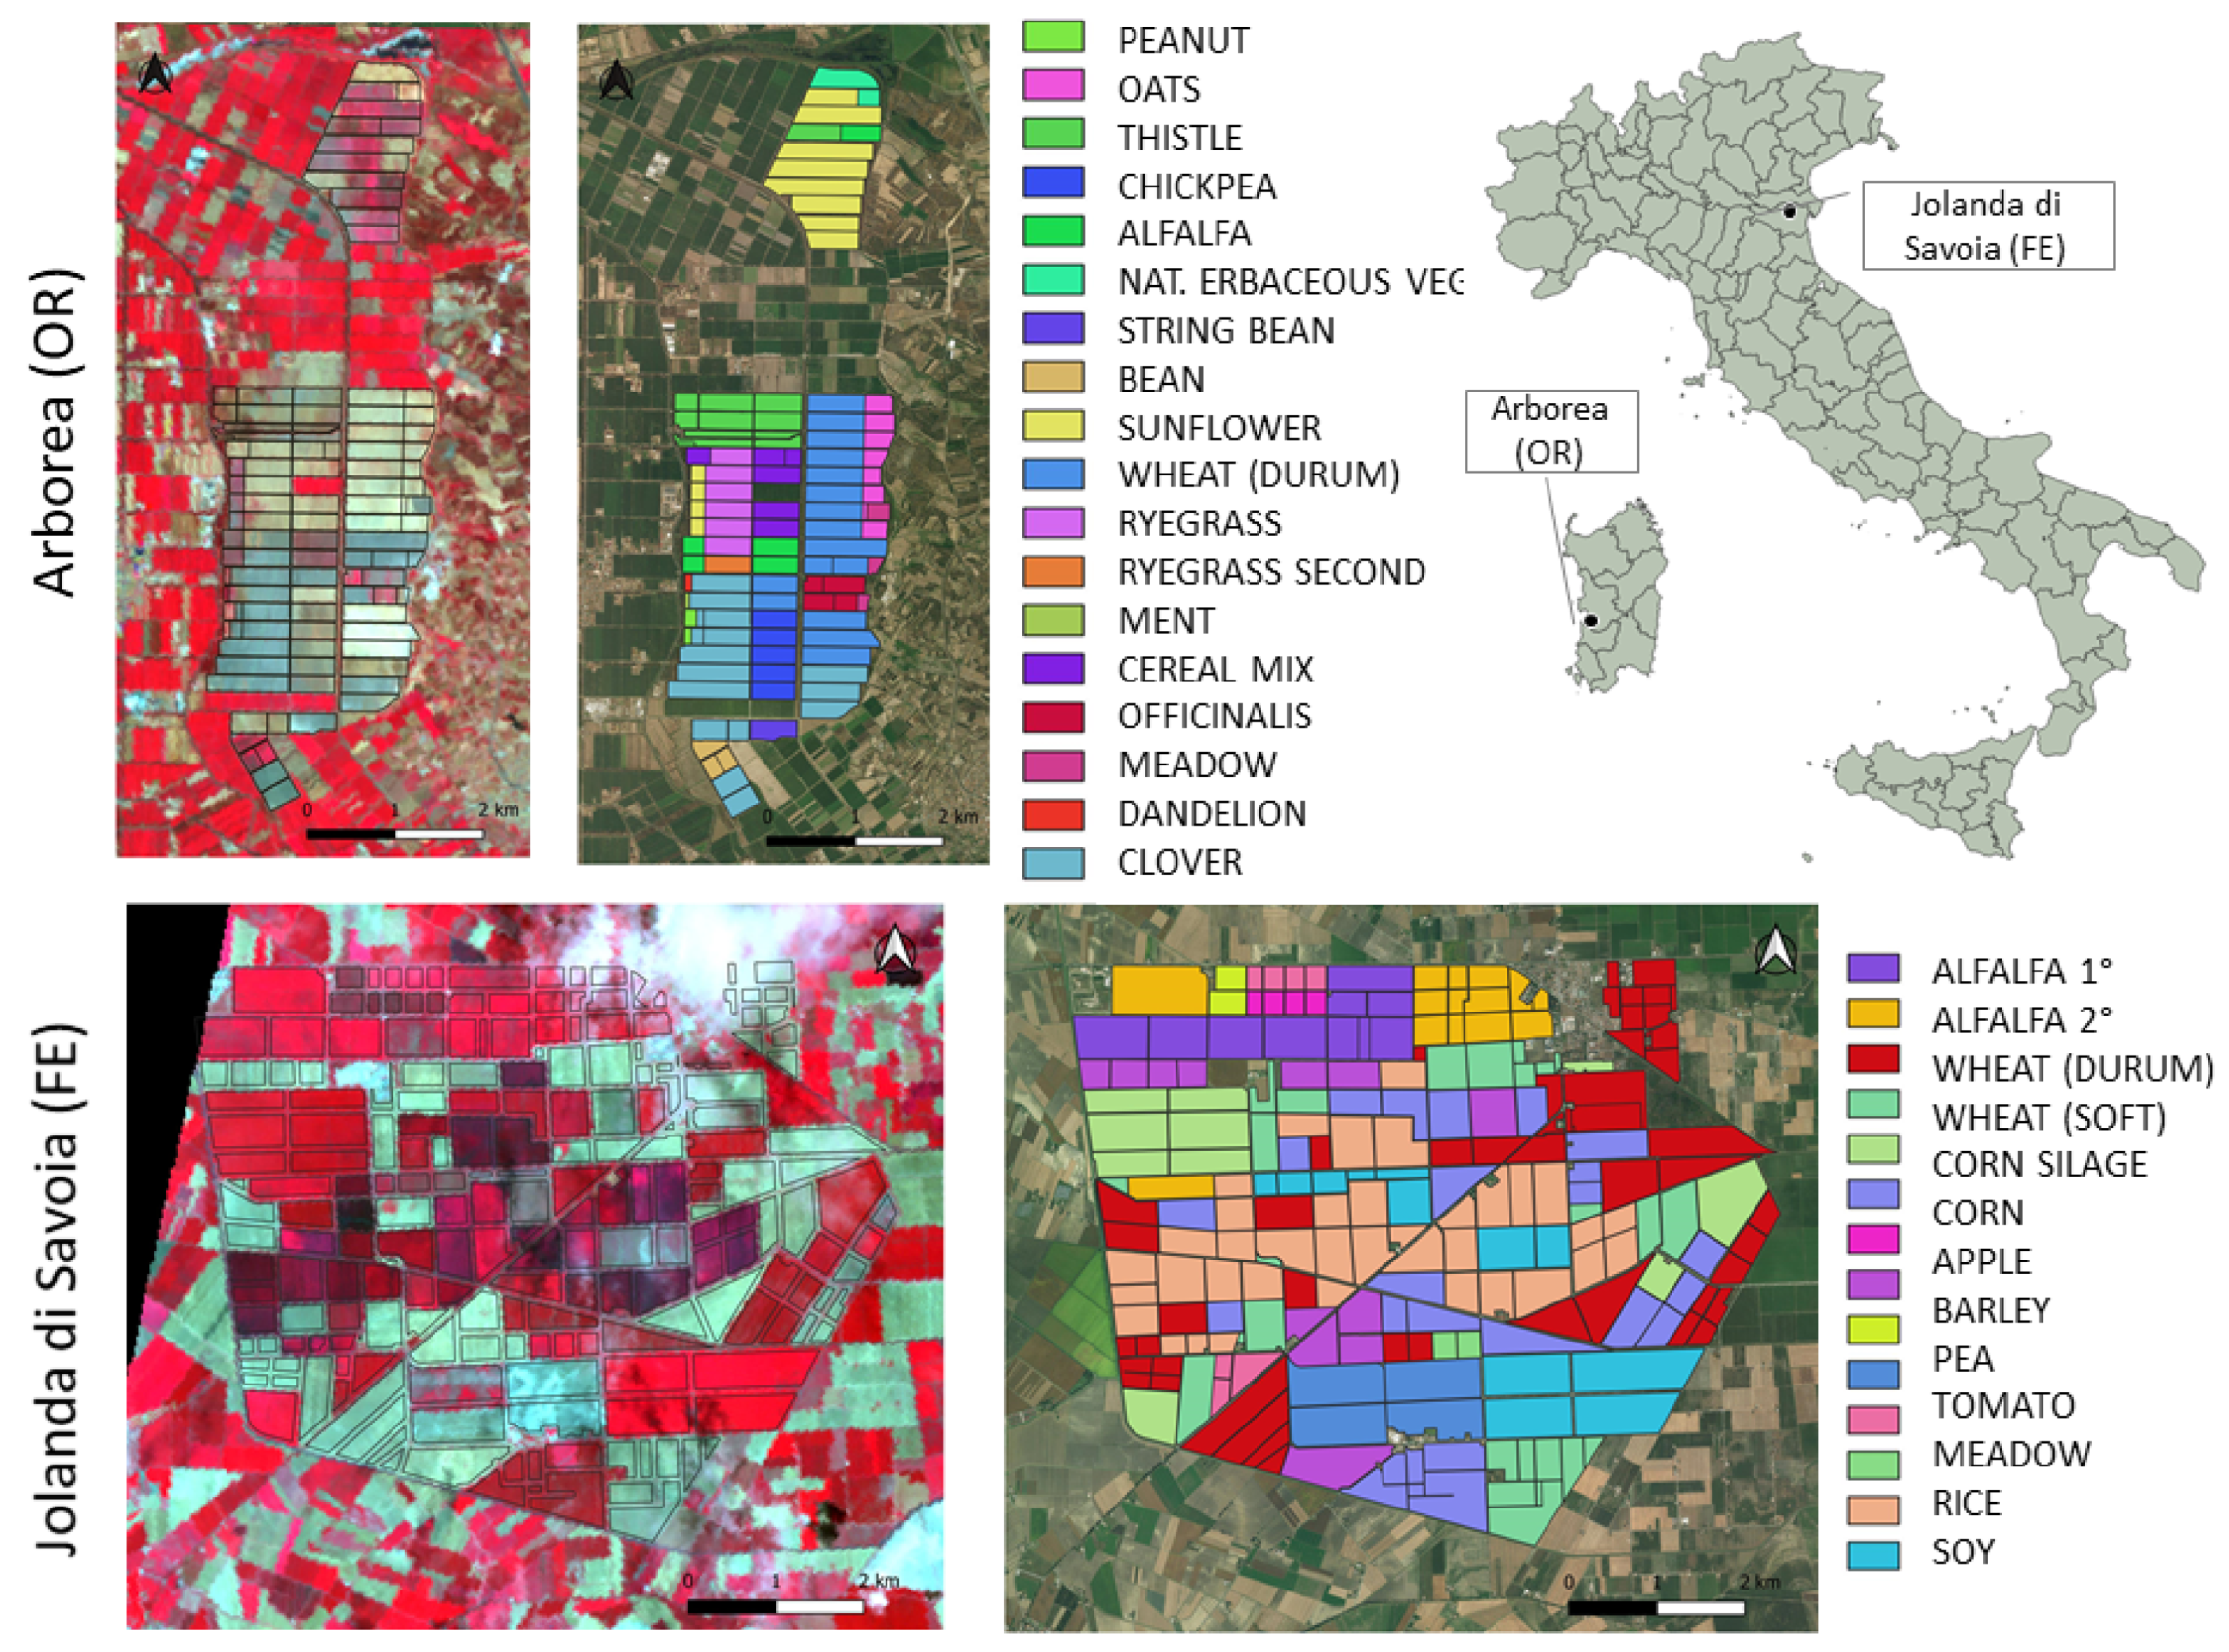
| ARB | Arborea |
| BS | Bare Soil |
| CBC | Carbon-Based Constituents |
| CR | Crop Residues |
| GV | Green Vegetation |
| JDS | Jolanda di Savoia |
| HNB | Hyperspectral Narrow Bands |
| MSBB | Multispectral Broadband |
| PRISMA | PRecursore IperSpettrale della Missione Applicativa |
References
- Li, Z.; Guo, X. Remote sensing of terrestrial non-photosynthetic vegetation using hyperspectral, multispectral, SAR, and LiDAR data. Prog. Phys. Geogr. 2016, 40, 276–304. [Google Scholar] [CrossRef]
- Hank, T.B.; Berger, K.; Bach, H.; Clevers, J.G.P.W.; Gitelson, A.; Zarco-Tejada, P.; Mauser, W. Spaceborne Imaging Spectroscopy for Sustainable Agriculture: Contributions and Challenges. Surv. Geophys. 2019, 40, 515–551. [Google Scholar] [CrossRef] [Green Version]
- Azzari, G.; Grassini, P.; Edreira, J.I.R.; Conley, S.; Mourtzinis, S.; Lobell, D.B. Satellite mapping of tillage practices in the North Central US region from 2005 to 2016. Remote Sens. Environ. 2019, 221, 417–729. [Google Scholar] [CrossRef]
- Arsenault, E.; Bonn, F. Evaluation of soil erosion protective cover by crop residues using vegetation indices and spectral mixture analysis of multispectral and hyperspectral data. Catena 2005, 62, 157–172. [Google Scholar] [CrossRef]
- Kertész, A.; Madarasz, B. Conservation agriculture in Europe. Int. Soil Water Conserv. Res. 2014, 2, 91–96. [Google Scholar] [CrossRef] [Green Version]
- Li, Z. Quantifying Grassland Non-Photosynthetic Vegetation Biomass Using Remote Sensing Data. Ph.D. Thesis, University of Saskatchewan, Saskatoon, SK, Canada, 2017. [Google Scholar]
- Hively, W.D.; Lamb, B.T.; Daughtry, C.S.T.; Shermeyer, J.; McCarty, G.W.; Quemada, M. Mapping Crop Residue and Tillage Intensity Using WorldView-3 Satellite Shortwave Infrared Residue Indices. Remote Sens. 2018, 10, 1657. [Google Scholar] [CrossRef] [Green Version]
- E.C. Directorate-General for Agriculture and Rural Development. Modernising and simplifying the CAP—Challenges for agriculture and rural areas: Environment and climate dimensions. In Agriculture and Rural Development Background Documents; EC: Bruxelles, Belgium, 2018. [Google Scholar]
- Yue, J.; Tian, Q. Estimating fractional cover of crop, crop residue, and soil in cropland using broadband remote sensing data and machine learning. Int. J. Appl. Earth Obs. Geoinf. 2020, 89, 102089. [Google Scholar] [CrossRef]
- Roberts, D.A.; Smith, M.O.; Adams, J.B. Green vegetation, nonphotosynthetic vegetation and soils in AVIRIS data. Remote Sens. Environ. 1993, 44, 255–269. [Google Scholar] [CrossRef]
- Zheng, B.; Campbell, J.B.; de Beurs, K.M. Remote sensing of crop residue cover using multi-temporal Landsat imagery. Remote Sens. Environ. 2012, 117, 177–183. [Google Scholar] [CrossRef]
- Bannari, A.; Staenz, K.; Champagne, C.; Khurshid, K.S. Spatial variability mapping of crop residue using Hyperion (EO-1) hyperspectral data. Remote Sens. 2015, 7, 8107–8127. [Google Scholar] [CrossRef] [Green Version]
- Daughtry, C.S.T.; Graham, M.W.; Stern, A.J.; Quemada, M.; Hively, W.D.; Russ, A.L. Landsat-8 and Worldview-3 Data for Assessing Crop Residue Cover. In Proceedings of the IGARSS 2018, Valencia, Spain, 22–27 July 2018; pp. 3852–3855. [Google Scholar]
- Dennison, P.E.; Qi, Y.; Meerdink, S.K.; Kokaly, R.F.; Thompson, D.R.; Daughtry, C.S.T.; Quemada, M.; Roberts, D.A.; Gader, P.D.; Wetherley, E.B.; et al. Comparison of methods for modeling fractional cover using simulated satellite hyperspectral imager spectra. Remote Sens. 2019, 11, 2072. [Google Scholar] [CrossRef]
- Fourty, T.; Baret, F.; Jacquemoud, S.; Schmuck, G.; Verdebout, J. Leaf optical properties with explicit description of its biochemical composition: Direct and inverse problems. Remote Sens. Environ. 1996, 56, 104–117. [Google Scholar] [CrossRef]
- Berger, K.; Verrelst, J.; Féret, J.B.; Wang, Z.; Wocher, M.; Strathmann, M.; Danner, M.; Mauser, W.; Hank, T. Crop nitrogen monitoring: Recent progress and principal developments in the context of imaging spectroscopy missions. Remote Sens. Environ. 2020, 242, 111758. [Google Scholar] [CrossRef]
- Wang, Z.; Skidmore, A.K.; Wang, T.; Darvishzadeh, R.; Hearne, J. Applicability of the PROSPECT model for estimating protein and cellulose+ lignin in fresh leaves. Remote Sens. Environ. 2015, 168, 205–218. [Google Scholar] [CrossRef]
- Lopinto, E.; Ananasso, C. The Prisma hyperspectral mission. In Towards Horizon 2020: Earth Observation and Social Perspectives, Proceedings of the 33rd EARSeL Symposium, Matera, Italy, 3–7 June 2013; Lasaponara, R., Masini, N., Biscione, M., Eds.; EARSeL: Münster, Germany, 2013. [Google Scholar]
- Schaepman-Strub, G.; Schaepman, M.E.; Painter, T.H.; Dangel, S.; Martonchik, J.V. Reflectance quantities in optical remote sensing—Definitions and case studies. Remote Sens. Environ. 2006, 103, 27–42. [Google Scholar] [CrossRef]
- Busetto, L.; Ranghetti, L. Prismaread: A Tool for Facilitating Access and Analysis of PRISMA L1/L2 Hyperspectral Imagery v1.0.0. Available online: https://lbusett.github.io/prismaread/ (accessed on 4 November 2020).
- Pompilio, L.; Pedrazzi, G.; Sgavetti, M.; Cloutis, E.A.; Craig, M.A.; Roush, T.L. Exponential Gaussian approach for spectral modeling: The EGO algorithm I. Band saturation. Icarus 2009, 201, 781–794. [Google Scholar] [CrossRef] [Green Version]
- Pompilio, L.; Pedrazzi, G.; Cloutis, E.A.; Craig, M.A.; Roush, T.L. Exponential Gaussian approach for spectral modelling: The EGO algorithm II. Band asymmetry. Icarus 2010, 208, 811–823. [Google Scholar] [CrossRef]
- Najafi, P.; Navid, H.; Feizizadeh, B.; Eskandari, I.; Blaschke, T. Fuzzy Object-Based Image Analysis Methods Using Sentinel-2A and Landsat-8 Data to Map and Characterize Soil Surface Residue. Remote Sens. 2019, 11, 2583. [Google Scholar] [CrossRef] [Green Version]
- Agricultural Monitoring. Available online: https://ec.europa.eu/jrc/en/research-topic/agricultural-monitoring (accessed on 4 November 2020).
- Rivera Caicedo, J.P.; Verrelst, J.; Munoz-Marì, J.; Moreno, J.; Camps-Valls, G. Toward a Semiautomatic Machine Learning Retrieval of Biophysical Parameters. Sel. Top. Appl. Earth Obs. Remote Sens. 2014, 7, 1249–1259. [Google Scholar] [CrossRef]


| Feature | Description |
|---|---|
| Orbit altitude reference | 615 km |
| Field of View (FOV) | |
| Instantaneous FOV | 48 mrad |
| Swath | 30 km |
| Ground Sampling Distance | Hyperspectral camera: 30 m; Panchromatic camera: 5 m |
| Spectral range | VNIR: 400–1100 nm (66 bands); SWIR: 920–2500 nm (173 bands) |
| Signal-to-noise ratio | VNIR: >160 (450 at 650 nm); SWIR: >100 (>360 at 1550 nm); PAN: >240 |
| Spectral Width | ≤14 nm |
| Spectral Calibration Accuracy | ±0.1 nm |
| Radiometric quantization | 12 bits |
| Repeat cycle | 29 days (450 orbits) |
| Relook time | <7 days |
| Lifetime | 5 years |
| Site/Date | Type | Land Cover | FRM | SAT | FA | DET | CHA |
|---|---|---|---|---|---|---|---|
| ARB 04 July 2019 | VEG | alfalfa | X | - | X | - | - |
| NPV | harvested durum wheat | X | - | X | - | X | |
| SOIL | seedbed (secondary tillage) | X | - | X | - | - | |
| ARB 24–25 August 2019 | VEG | alfalfa, bean | X | X | X | - | - |
| NPV | harvested wheat, unc. land | X | X | X | X | X | |
| SOIL | bare soil (primary tillage) | - | X | X | - | - | |
| JDS 14 July 2020 | VEG | alfalfa | X | X | X | - | - |
| NPV | harvested wheat and barley | X | X | X | X | X | |
| SOIL | bare soil (primary tillage) | X | X | X | - | - |
Publisher’s Note: MDPI stays neutral with regard to jurisdictional claims in published maps and institutional affiliations. |
© 2020 by the authors. Licensee MDPI, Basel, Switzerland. This article is an open access article distributed under the terms and conditions of the Creative Commons Attribution (CC BY) license (http://creativecommons.org/licenses/by/4.0/).
Share and Cite
Pepe, M.; Pompilio, L.; Gioli, B.; Busetto, L.; Boschetti, M. Detection and Classification of Non-Photosynthetic Vegetation from PRISMA Hyperspectral Data in Croplands. Remote Sens. 2020, 12, 3903. https://0-doi-org.brum.beds.ac.uk/10.3390/rs12233903
Pepe M, Pompilio L, Gioli B, Busetto L, Boschetti M. Detection and Classification of Non-Photosynthetic Vegetation from PRISMA Hyperspectral Data in Croplands. Remote Sensing. 2020; 12(23):3903. https://0-doi-org.brum.beds.ac.uk/10.3390/rs12233903
Chicago/Turabian StylePepe, Monica, Loredana Pompilio, Beniamino Gioli, Lorenzo Busetto, and Mirco Boschetti. 2020. "Detection and Classification of Non-Photosynthetic Vegetation from PRISMA Hyperspectral Data in Croplands" Remote Sensing 12, no. 23: 3903. https://0-doi-org.brum.beds.ac.uk/10.3390/rs12233903