Article

Multi-Temporal Analysis and Trends of the Drought Based on MODIS Data in Agricultural Areas, Romania

1
Remote Sensing and GIS Laboratory, National Meteorological Administration, 013686 Bucharest, Romania
2
Romanian Academy, Institute of Geography, 023993 Bucharest, Romania
*
Author to whom correspondence should be addressed.
Remote Sens. 2020, 12(23), 3940; https://0-doi-org.brum.beds.ac.uk/10.3390/rs12233940
Submission received: 9 October 2020 / Revised: 16 November 2020 / Accepted: 26 November 2020 / Published: 1 December 2020
(This article belongs to the Section Remote Sensing in Agriculture and Vegetation)

Abstract

:
The aim of this study is to analyze the performance of the Drought Severity Index (DSI) in Romania and its validation based on other data sources (meteorological data, soil moisture content (SMC), agricultural production). Also, it is to assess the drought based on a multi-temporal analysis and trends of the DSI obtained from Terra MODIS satellite images. DSI is a standardized product based on evapotranspiration (ET) and the Normalized Difference Vegetation Index (NDVI), highlighting the differences over a certain period of time compared to the average. The study areas are located in Romania: three important agricultural lands (Oltenia Plain, Baragan Plain and Banat Plain), which have different environmental characteristics. MODIS products have been used over a period of 19 years (2001–2019) during the vegetation season of the agricultural crops (April–September). The results point out that those agricultural areas from the Baragan Plain and Oltenia Plain were more affected by drought than those from Banat Plain, especially in the years 2002, 2007 and 2012. Also, the drought intensity and the agricultural surfaces affected by drought decreased in the first part of the vegetation season (March–May) and increased in the last part (August–September) in all three study areas analyzed. All these results are confirmed by those of the Standardized Precipitation Evapotranspiration Index (SPEI) and Soil Moisture Anomaly (SMA) indices.

Graphical Abstract

1. Introduction

Drought is a very complex phenomenon without a generally accepted definition, but most of them highlight the deficit of precipitation in a certain period of time. Because of the complexity of the natural hazard that affects many aspects of society and environment [1,2], drought is commonly classified into four types: meteorological, agricultural, hydrologic, and socio-economic [3,4]. According to the World Meteorological Organization (WMO), meteorological drought depends on the atmospheric conditions and is defined as: “prolonged absence or marked deficiency of precipitation” [5]. Meteorological drought is analyzed in terms of the intensity and duration of the dry period observed based on meteorological data [4]. The intensity of meteorological drought can lead to agricultural drought, associated with soil moisture deficits, higher soil temperatures and increasing evapotranspiration. Agricultural drought happens when the soil moisture available to plants has dropped to such a low level that the crop yield is reduced or even totally compromised. The hydrological drought is analyzed based on the decrease in the volume of surface or groundwater, while socio-economic drought focuses on the impact of the first three types of drought on the demand and supply of goods [4].
Temperatures are expected to increase according to The Intergovernmental Panel on Climate Change (IPCC) reports between 2030 and 2052 by 1.5 °C, reflected by rising average temperature in most regions, heat waves in inhabited areas, heavy rainfall in several regions and the increase in the probability of drought and rainfall deficit in some regions [6]. Climate change manifests itself differently from one region of the globe to another, hence the need to identify and monitor climate change regionally, as well as to develop methods of analysis and monitoring as accurate as possible.
Drought is frequently analyzed based on meteorological information. Meteorological variables are used to compute multiscale drought indicators, such as the Palmer Drought Severity Index (PDSI) [7,8], the Aridity Index (AI) [9], the Standardized Precipitation Index (SPI) [10] or the Standardized Precipitation Evapotranspiration Index (SPEI) [11]. However, since 1970 the drought has begun to be monitored more and more based on remote sensing data. The most used indices are Normalized Difference Vegetation Index (NDVI), Gross Primary Production (GPP), Backscatter ratio, Vegetation Condition Index (VCI) and Enhanced Vegetation Index (EVI) [12]. Drought indices can be classified into various categories, depending on the number of the input parameters, applications, strengths and weaknesses [13].
Indices based on satellite images offer indirect information about the drought types, such as the decrease of chlorophyll in natural or agricultural vegetation, which may be related to the decrease of water resources in the soil. Thus, taking into account the characteristics of the four types of drought mentioned above based on satellite images, the agricultural drought and hydrological drought can be analyzed, respectively, in terms of the effect that a natural or anthropogenic phenomenon has on vegetation and water resources [14,15,16].
The drought monitoring is performed, mainly, at country level (usually by the National Weather Services, National Water Authorities; Ministries of Agriculture etc.), at a regional and continental level (e.g., Drought Management Centre for South-eastern Europe (DMCSEE) [17], the U.S. Drought Monitor (USDM) [18], EDO [19]) or global level (Global Drought Information System [20], Copernicus Global Drought Observatory [21]).
At the European level, drought is monitored by the EDO [19], which provides relevant information on drought in Europe, such as maps of indicators derived from different data sources (e.g., precipitation measurements, satellite measurements, modelled soil moisture content). There are six drought indicators at the European scale: SPI, Soil Moisture Anomaly (SMA), Anomaly of Vegetation Condition (FAPAR Anomaly), Low-Flow Index (LFI), Heat and Cold Wave Index (HCWI), Combined Drought Indicator (CDI). The last one (CDI) combines the first five indicators into a single index using both surface and remote data [22].
At the regional level, the DMCSEE, established in 2007, has been nominated to monitor and assess the hazard, vulnerability and risk of drought in South-eastern Europe. Most parts of the Pannonian Basin are included in the region monitored by DMCSEE, except for the Czech Republic, Slovakia and Ukraine. The indicators used to monitor drought are: SPI, Percentiles and precipitation forecast, based on the Global Precipitation Climatology Centre (GPCC), and satellite-based products are also used by DMCSEE, such as: NDVI, Vegetation Condition Index (VCI), Soil Water Index anomalies (SWI), derived from a variety of sensors: Proba-V, MODIS, MetOp/ASCAT etc. [17,23].
In Romania, the National Meteorological Administration (NMA) [24] is the leading institution for meteorological and agricultural drought related activities. Thus, the agro-meteorology activity consists in two basic components: the operational service and applied researches for modelling, forecasting and evaluating the agro-climatic resources with respect to the vegetation production.
The monitoring of agriculture is performed due to the fact that Romania is one of the important producers of cereals in the European Union [25]. The 21st Century started with three consecutive droughty years: 2000–2001, 2001–2002 and 2002–2003, while 2006–2007, 2011–2012 and 2014–2015 are considered the driest years in Romania [26]. The most affected parts were in the southern, southeastern and eastern parts of the country [27]. According to Carrão et al. [28] and Vogt et al. [2] those regions records a higher drought risk for agricultural production compared to the rest of the country and even to other areas of Europe. The average yields of various crops represented only 35–60% of the potential yields, during the extremely droughty years [27].
In the last two decades, drought analysis based on in-situ measurements reveals the most severe droughts were recorded: i. in the Southeastern part of Romania (Baragan Plain) in the years 2000, 2003, 2007 and 2012 [29]; ii. in the Southwest (Oltenia Plain) in the years 2000, 2002, 2007 and 2012 [30]; iii. in the Western part of Romania (Banat Plain) in the years 2000, 2003 and 2007 and less intense [31,32]. Significant agricultural areas were affected in 2000 and 2003 in Banat Plain [33], and in Eastern, South-Eastern and Southern parts of the country in 2007 [32,34], according to the analysis of drought indices derived from satellite images. Drought not only affects agricultural crops, but also causes vegetation fires [35].
However, indices obtained from satellite images are used not very often in Romania to compensate the lack of meteorological data in areas where there are no measuring stations, as well as the lack of information on the affected areas and the intensity of the phenomenon. In general, the coverage of these areas is done by interpolating existing data. So far, remote sensing indices focused on monitoring and assessing drought are not well known, with the exception of few common indices such as Normalized Difference Drought Index (NDDI) [34,35] and also vegetation indices such as NDVI [30,33] and Leaf Area Index (LAI) [34], which are used to identify the impact of drought on vegetation and also certain climatic parameters such as Land Surface Temperature (LST) used for the analysis of high temperatures [33,35].
The Drought Severity Index (DSI) developed by researchers from NTSG University of Montana [36] is based on the Evapotranspiration (ET)-Potential Evapotranspiration (PET) ratio to compensate for the lack of direct meteorological data input, ET being directly related to for water, carbon and energy cycles of the land surface [37]. The evapotranspiration is an important indicator for the identification and monitoring of drought. Also, for assessing the vegetation response to drought, NDVI is used as a very good indicator of vegetation drought or water stress in plants [38]. This approach is set to provide high quality temporal and spatial information over vegetated surfaces but also to get rid of the uncertainties of meteorological data and modelling [37].
DSI is a standardized index, where the values theoretically range from unlimited negative values (drier than normal) to unlimited positive values (wetter than normal) [39]. The negative values of the DSI show how much the vegetation has been affected by meteorological drought, in other words—it highlights the agricultural drought.
The main purpose of this paper is to analyze the performance of the DSI in Romania and its validation based on other data sources (meteorological data, soil moisture content (SMC), agricultural production). The DSI is used for the first time over Romania, while other remote sensing indices (NDVI, NDWI, TCI, WHI etc.) have been used in limited studies [40,41]. Once to validate the performance of this index, there can be increase the confidence in using it.

2. Materials and Methods
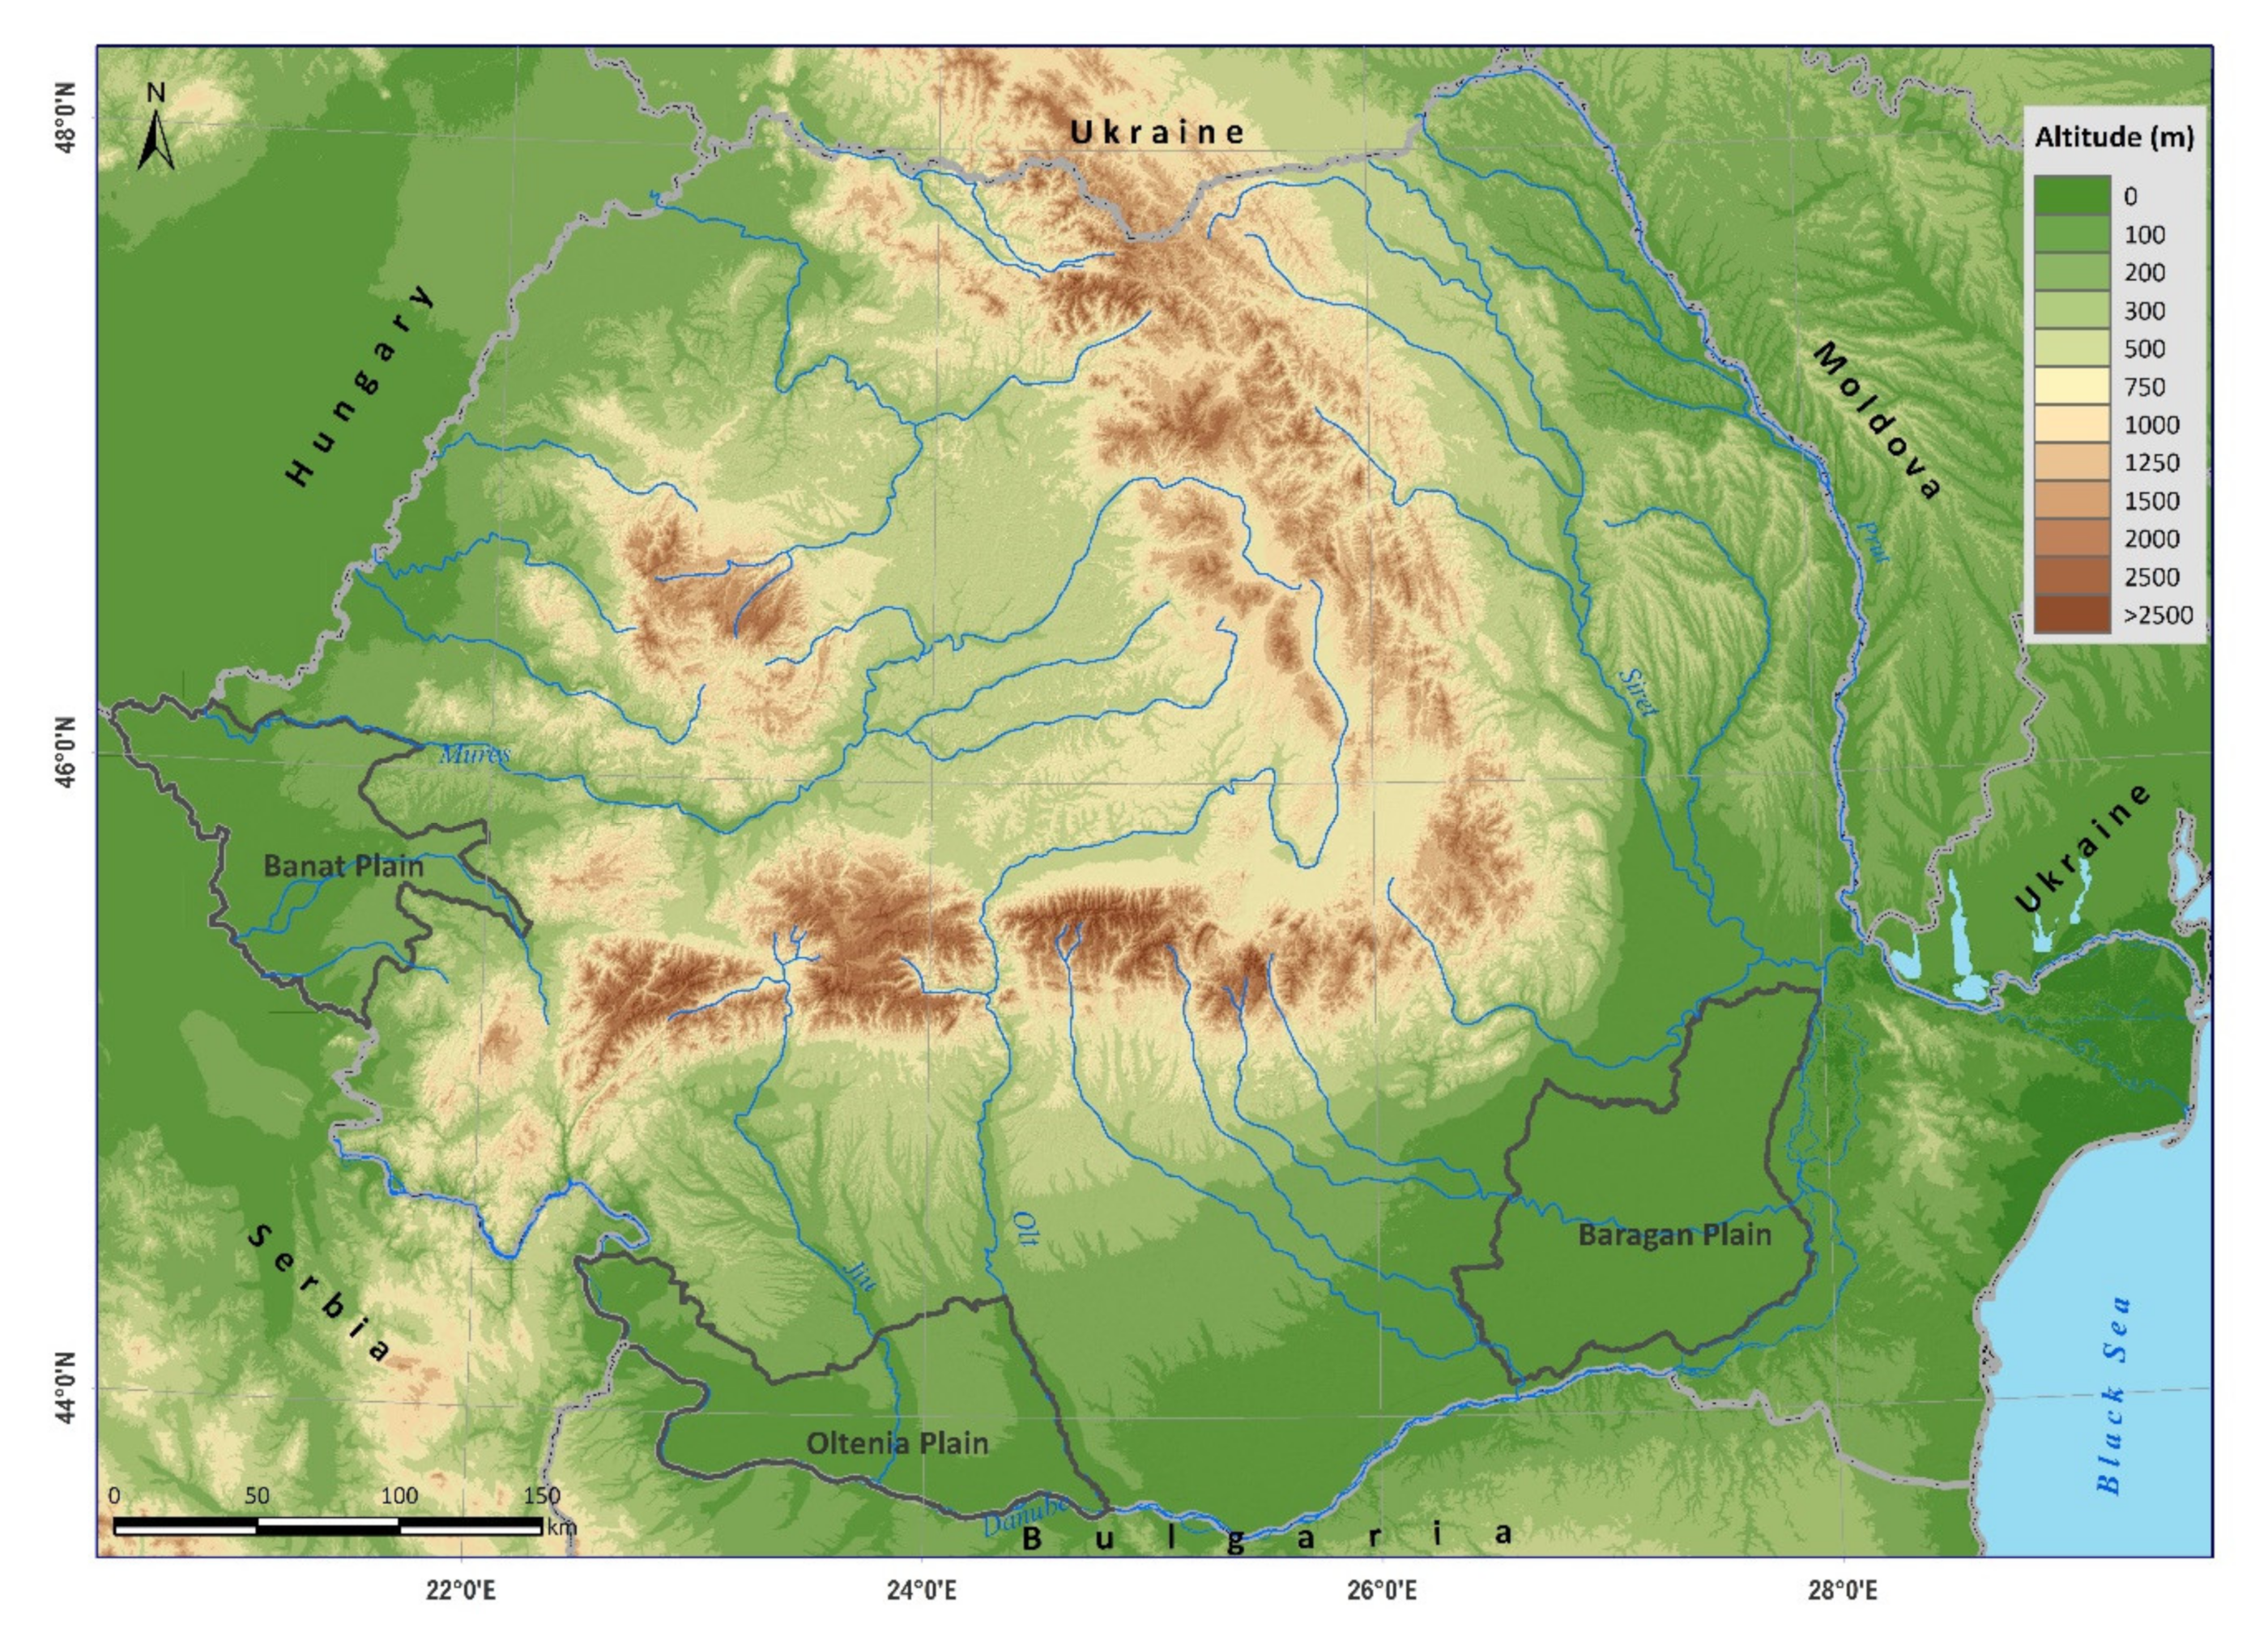
2.1. Study Areas

The study was carried out for the agricultural land of Romania, which is about 13.3 million ha [42,43], with the focus set on three main agricultural areas: Baragan Plain, Oltenia Plain and Banat Plain, which represents about 17% of the total. Their agricultural area is around 685,000 ha in Oltenia Plain, 664,000 ha in Banat Plain and 926,000 ha in Baragan Plain, according to Corine Land Cover Data (2018) [43].
Located in areas with different climatic conditions, due to the natural obstacle of the Carpathian Arch but also to the Eastern atmospheric circulation, rainfall does not fall evenly in all three field areas. The Banat Plain is located in the Western part of Romania, Oltenia Plain—In the Southwest of Romania and the Baragan Plain—in the Southeastern part of the country, Figure 1.
The climate of Oltenia Plain is temperate-continental with Sub-Mediterranean influences characterized by mild winters and a significant precipitation regime (especially in autumn) [44]. The average annual temperatures were 11.5 °C, about one degree higher in the South and South-West than in the North and North-East of the plain, according to the climatological period 1981–2010, Table S1. Also, the precipitation amount recorded 532 mm, increasing from South to North by about 100 mm. The correlation of soil type (sandy) with the deforestation of forest protection curtains, plots fragmentation (land restitution measures) and the irrigation system degradation lead to the occurrence of deflation [45]. As a consequence, those changes lead to the emergence of drought and finally to decreasing yields [30].
The climate of the Baragan Plain is also temperate-continental, but the continental character is more enhanced than in the other two regions [44]. It is a warm region (11.2 °C) with rich thermal and radiative resources and low precipitation (480 mm/year), Table S1. It is a dry region with a significant water deficit during the active crop vegetation period (April–October) [44,46]. The expansion of dry areas has been facilitated by the same factors as in Oltenia Plain (the destruction and abandonment of irrigation systems, deforestation, excessive land fragmentation and inadequate farming practices) [47]. However, according to the values of the aridity index, climatic conditions are more severe in this region than in the other regions, which enhance the risk of agricultural damage [44,48].
In the Banat Plain, the climate is temperate-continental with influences of Atlantic Cyclones, which bring significant precipitation and moderate temperatures [44], resulting in higher annual precipitation (601 mm) and a mean annual air temperature similar with that in the other two regions (11 °C), Table S1. While the first two are vulnerable to drought, the Banat Plain, on the other hand, is vulnerable to floods [49], with drought occurring less frequently than in the other analyzed regions: 37.4% in Banat-Crisana region (including the Banat Plain) between 1961–2008, compared with 41.6% in Oltenia region or 58.4% in Muntenia region (including the Baragan Plain) [46].
The irrigation system of Romania covers an area representing 31% of the total arable land (9.4 mil. ha), according to the National Institute of Statistics (NIS). However, most parts of the system were decommissioned post-1989 (post-socialist period), only 284,000 ha (3%) being irrigated at least once in 2019. The state of irrigation in all three test areas is presented in Table 1 and is based on data from every county encompassed by each of the plains [50].
Romania has the 6th widest agriculture area of the EU countries and should have a high level of crop productivity. Even though it is one of the top ten exporters of wheat and maize worldwide, Romania has yields affected by land fragmentation, poor land reclamation systems, insufficient mechanization and human resources. The main crops grown over the three test areas are common wheat, maize, sun flower, rape, sugar beet, etc.

2.2. Data Collection

The Terra MODIS collection 6 dataset has been used: MOD16A2, level 4 and MOD09A1, level 3, which are 8 days composite syntheses produced at a 500-m pixel resolution and MOD11A2, level 3, 8 days composite products with a 1 km spatial resolution [51,52,53]. The dataset was downloaded from EARTHDATA [54].
The surface reflectance product (MOD09A1) was used to compute the NDVI for drought analysis, while the Land Surface Temperature (MOD11A2) was used for the mean land surface temperature and cloud mask during the 8-day synthesis to eliminate errors. The MODIS surface spectral reflectance products are corrected for atmospheric conditions such as gasses, aerosols, and Rayleigh scattering [55].
The Evapotranspiration and Potential Evapotranspiration products (MOD16A2) were used to compute DSI. Each layer (ET and PET) is the sum of all of the eight days within the synthesis period and the algorithm used for these products is based on the logic of the Penman–Monteith equation [56,57].
Drought analysis was performed between the 89th and 265th days of the year (DOY), i.e., the period between 29 March and 30 September, which is considered the vegetation season (a total of 23 synthesis products per year), over 2001–2019; Table S2. It should be noted that there was a lack of MODIS satellite data for the synthesis product/DOY 169 (18th–25th of June) and DOY 177 (26th of June–3rd of July) in 2001.
An auxiliary dataset used to identify agriculture areas, was CORINE Land Cover (2018), with 100 m spatial resolution (Minimum Mapping Unit: 25 ha), [43]. The SPEI was used for validation of the DSI results and is calculated from in-situ data (measured precipitation and air temperature data from weather stations). Volumetric surface soil moisture products represent the content of liquid water in a surface soil layer of 2 to 5 cm depth expressed as m3 water per m3 soil. The ESA CCI Soil Moisture data products [58] were used for the validation procedure (2001–2019).
The data sets used in this paper were synthesized in Table 2 and the workflow of data used to compute the DSI is summarized in the flowchart below, Figure 2.

2.3. Methods

The Drought Severity Index was computed according to the methodology developed by Mu et al. [39]—see Equations (1) and (2) below—resulting in a DSI 8 days composite at a 500 m resolution for the 2001–2019 period. The negative values of DSI were classified in three classes of drought intensity according to Table 3, which are equivalent to those used by EDO [19].
DSI   =   z z ¯ σ z
z   =   E T / P E T E T / P E T ¯ σ E T / P E T + N D V I N D V I ¯ σ N D V I
where:
  • ET—Evapotranspiration;
  • PET—Potential Evapotranspiration;
  • ET/PET—Ratio;
  • E T / P E T ¯ —Ratio average (2001–2019);
  • σ E T / P E T   —Standard deviation of Ratio (2001–2019);
  • NDVI—Normalized Difference Vegetation Index;
  • N D V I ¯ —Average of the NDVI (2001–2019);
  • σ n d v i   —Standard deviation of NDVI (2001–2019);
  • σ z —Standard deviation of z (2001–2019);
  • z ¯ —Average of the z (2001–2019).
NDVI [59] was computed based on surface reflectance (Red and NIR bands) extracted from MOD09A1 product. It has valid values between −1 and 1, but in this study a NDVI threshold value greater than 0.2 was used for the vegetation season analysis. Values below 0.2 designate barren soil (0–0.2 interval), as a result of works performed on the agricultural land, such as plowing or harvesting.
The NDVI, ET, PET [56,60] indices were clipped by the LST and by Romanian border. Because clouds affect the quality of data and could give some erroneous results or bare soil leads to some drought overestimation, the NDVI, ET and PET data were clipped by the positive value of LST (the LST values > 0 were considered valid, while values < 0 were considered invalid), which was resampled to 500 m in order to have the same spatial resolution as the other indices. Performing this process, the possibility to have negative LST pixels was eliminated, especially during the summer season (June–August). The lack of LST data marks the clouds so the vegetation indices values are excluded in the DSI computation.
The results obtained based on the DSI from MODIS were compared with monthly SPEI obtained from meteorological data and 8 days Soil Moisture Anomaly obtained from EEA soil moisture products.
The SPEI is an index developed by Serano et al. [11] for drought variability analysis on multiple time scales, suited to detecting, monitoring, and exploring the consequences of global warming on drought conditions [61,62]. As an extension of the widely used SPI, it takes into account both precipitation and PET. It can measure drought severity according to its intensity and duration, and can identify the beginning and end of drought episodes [63,64,65]. The PET can be estimated by several formulas (e.g., the Thornthwaite equation, the Penman-Monteith equation, the Hargreaves equation etc.), but SPEI is not linked to any particular one. In this study, the Thornthwaite equation [66,67] was used to calculate PET. Also, the negative values of SPEI were classified in three classes of drought intensity according to Table 3.
Since the SPEI is calculated from in-situ data, which represents measured points data from weather stations, SPEI values are interpolated at 1 km spatial resolution, by using Radial Basis interpolation. The reference period taken into account in the calculation of the SPEI was 1961–2019. This is the common period in which meteorological data are available at most stations in Romania.
Soil Moisture Anomaly was obtained from European Environmental Agency (EEA) soil moisture products. Soil Moisture dataset combine long-term (1978–2019) passive and active products retrieved from radiometrically calibrated backscatter or brightness temperature measurements [68]. The ACTIVE (active-microwave-based only) product merges data from AMI-WS and ASCAT (Metop-A and Metop-B), and the PASSIVE (passive-microwave-based only) product merges data from SMMR, SSM/I, TMI, AMSR-E, WindSat, AMSR2, and SMOS [69]. The SMA equation takes into account the multiannual average of the soil moisture as well as the standard deviation. The negative values of SMA are equivalent to those used by EDO [19] to establish drought intensity (Table 3).
In order to highlight the trend and its statistical significance, the non-parametric Mann-Kendall test and Sen’s slope estimator were used [70]. These were calculated with MAKESENS-application [71]. Also, ANOVA statistical test was applied to check the hypothesis of equal mean (H0) between agricultural areas affected by drought based on three drought indices (DSI, SPEI and SMA), against the alternative hypothesis (H1) which shows that there are at least two data sets that are different. If the null hypothesis (H0) is true, then any differences in the means from the agricultural areas affected by the three drought indices are explained by chance alone [72].

3. Results

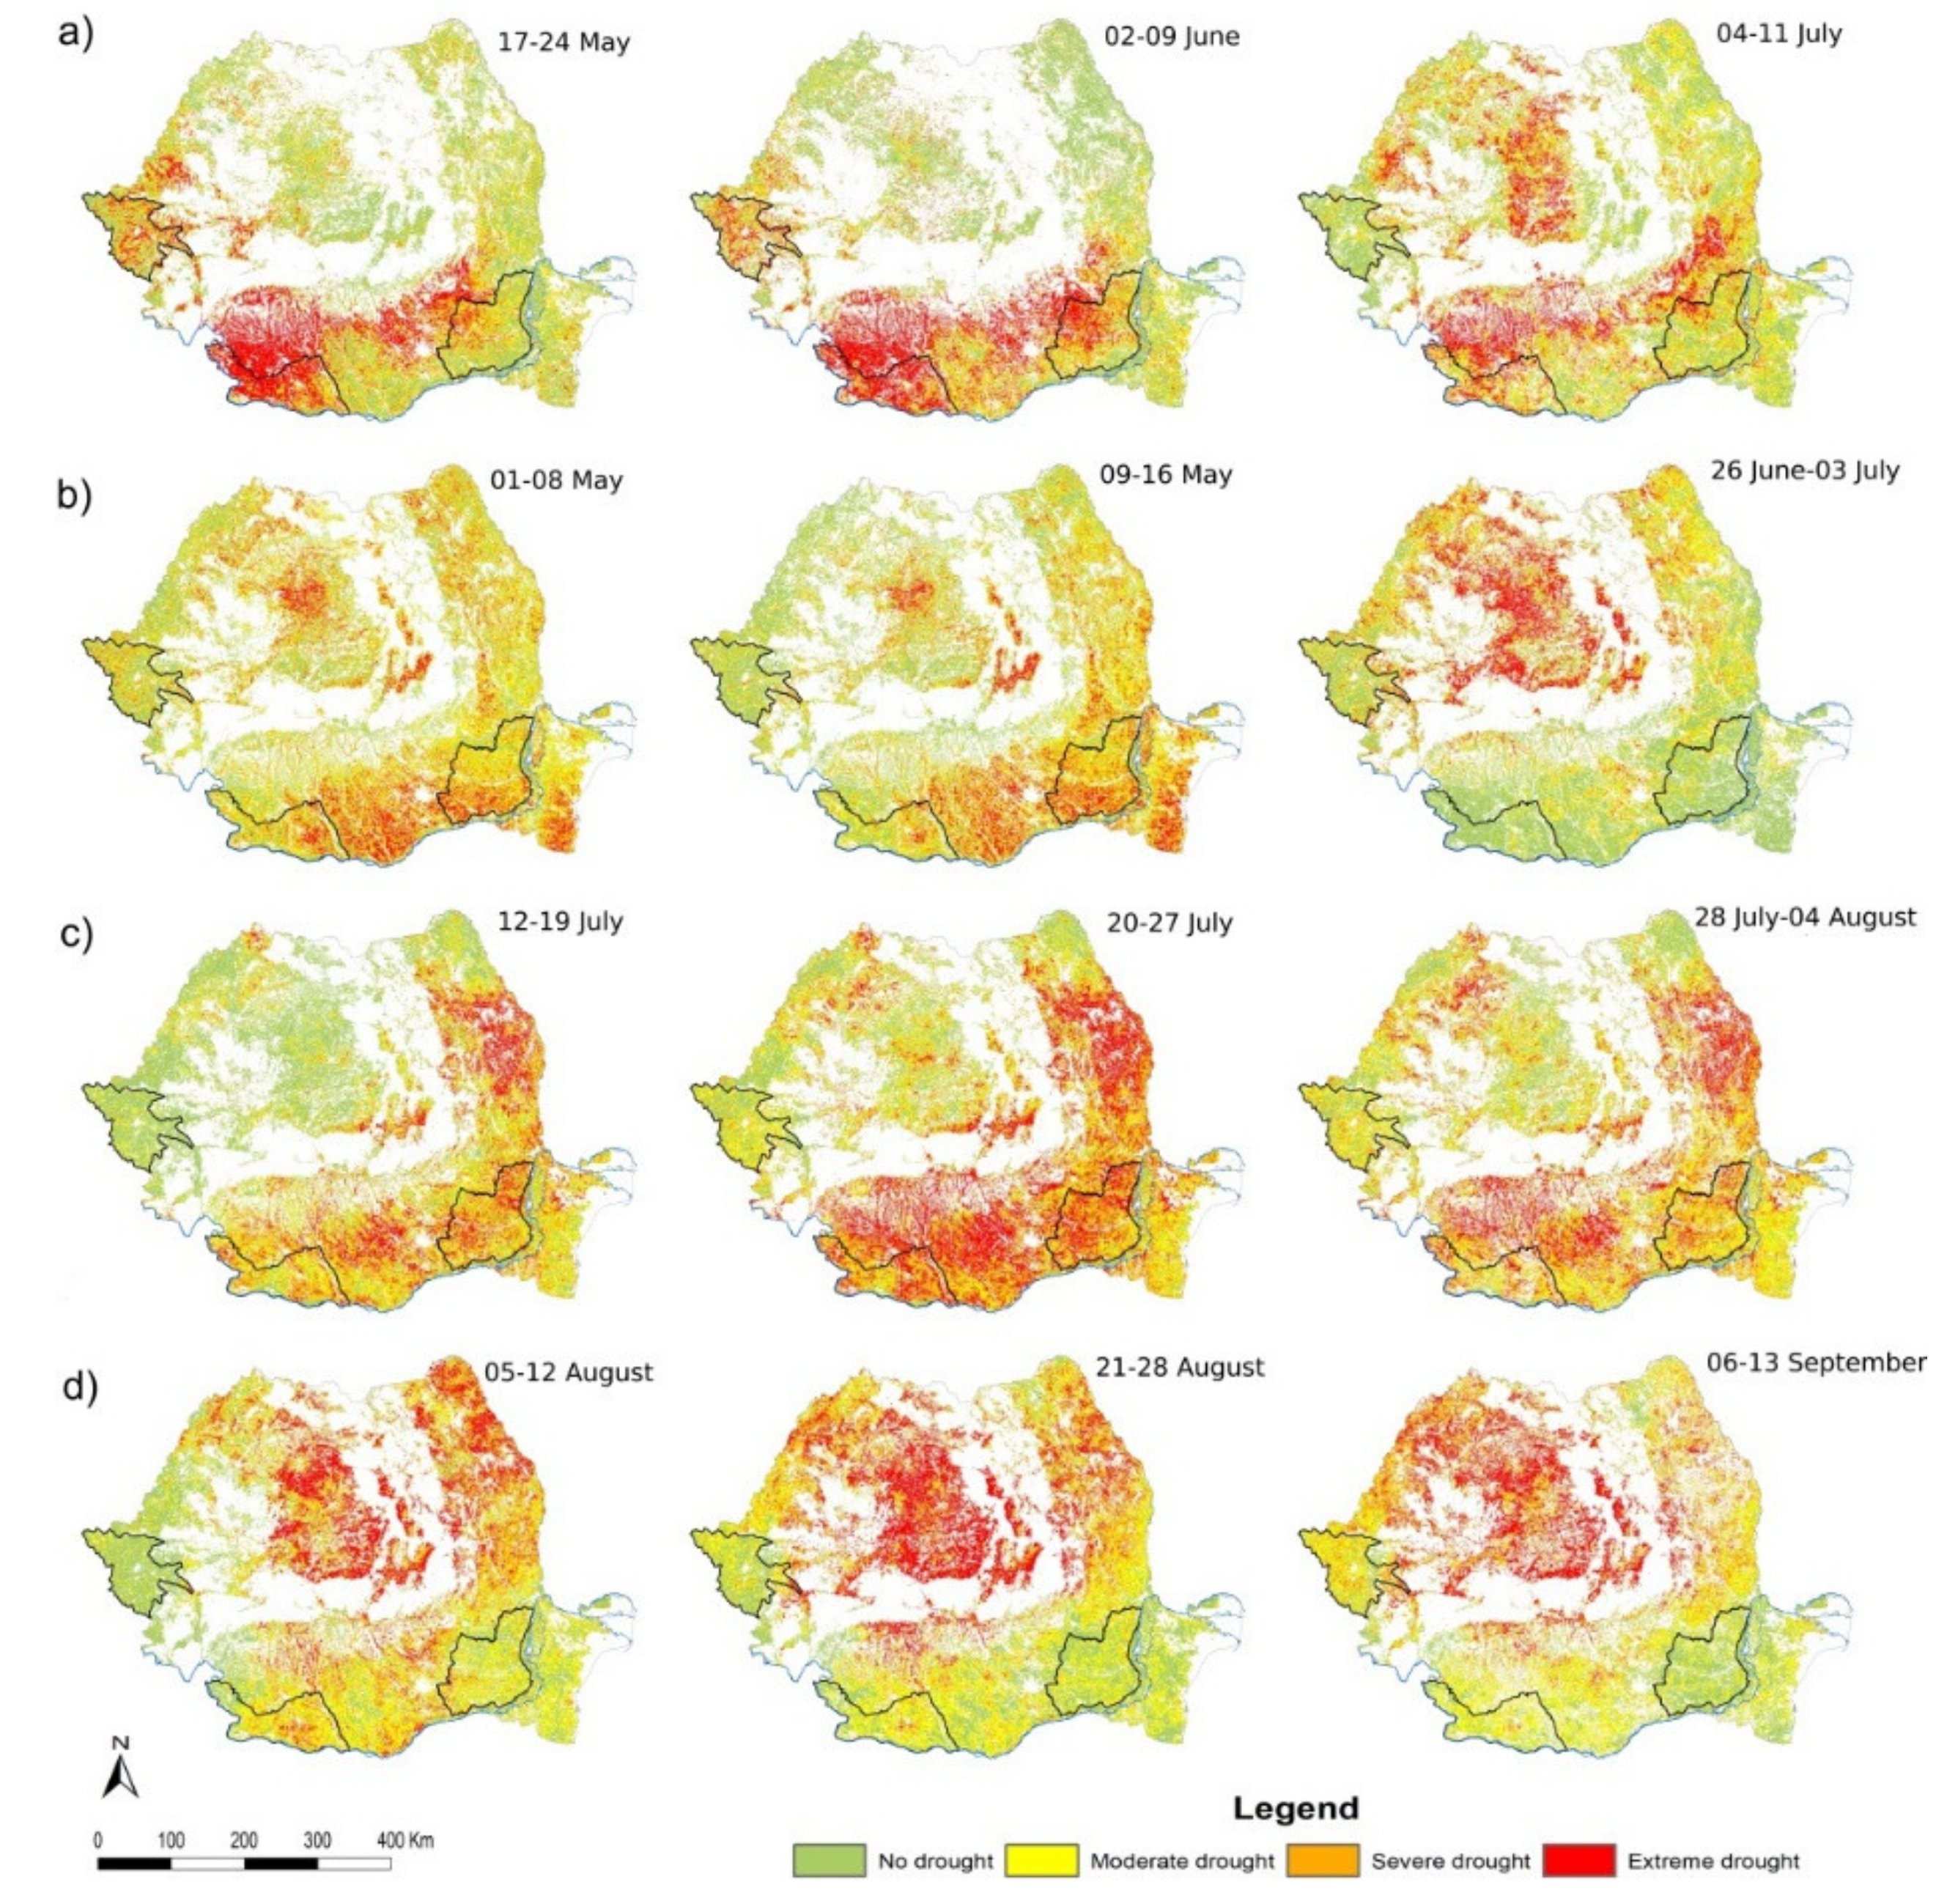
3.1. Spatial Distribution of DSI, SMA and SPEI

The agricultural drought was identified at the level of Romania between 2001 and 2019, based on the analysis of DSI synthesis over 8 days. 2002, 2003, 2007 and 2012 are the years when the drought was recorded on the largest surface of the country. In 2002, the extreme drought commenced in May and early June the South-West and West; early July it extended to the East and center (Figure 3a). The extreme drought affected large areas in Southern Romania in May 2003, even though it had a smaller extension than in the previous year (Figure 3b). The extreme drought affected almost all the agricultural areas in Southern and Eastern Romania in July 2007, Figure 3c. Also, in 2012, the extreme drought occupied large areas of Romania, i.e., the entire center of the country and most of the East, in August and mid-September (Figure 3d).
The spatial distribution of the soil moisture deficit according to the SMA is very similar to that of the DSI, Figure 4. In the first part of June 2002 the extreme drought, as in the case of the DSI index covered most of the Oltenia Plain (Figure 4a), and in the second part of July 2007, extreme drought affected the whole south of Romania (Figure 4c).
According to the SPEI index, the drought covered large areas in Romania in years such as 2002, 2003, 2007 and 2012 (Figure 5). In July 2007, extreme drought covered most of Southern, South Eastern and Eastern Romania (Figure 5c) and in May 2003 it covered its Northern half, Figure 5b. In August 2012, central Romania was affected by severe drought according to the SPEI (Figure 5d), while the DSI indicated extreme drought, Figure 3d. Differences can be seen between the two indices in 2002. DSI indicates extreme drought in the South West (Figure 3a), while SPEI indicates incipient drought and normal conditions (Figure 5a). The differences can be explained by the fact that SPEI is calculated from interpolated meteorological data and does not take into account the soil moisture reserve, as DSI reflects drought in terms of vegetation.

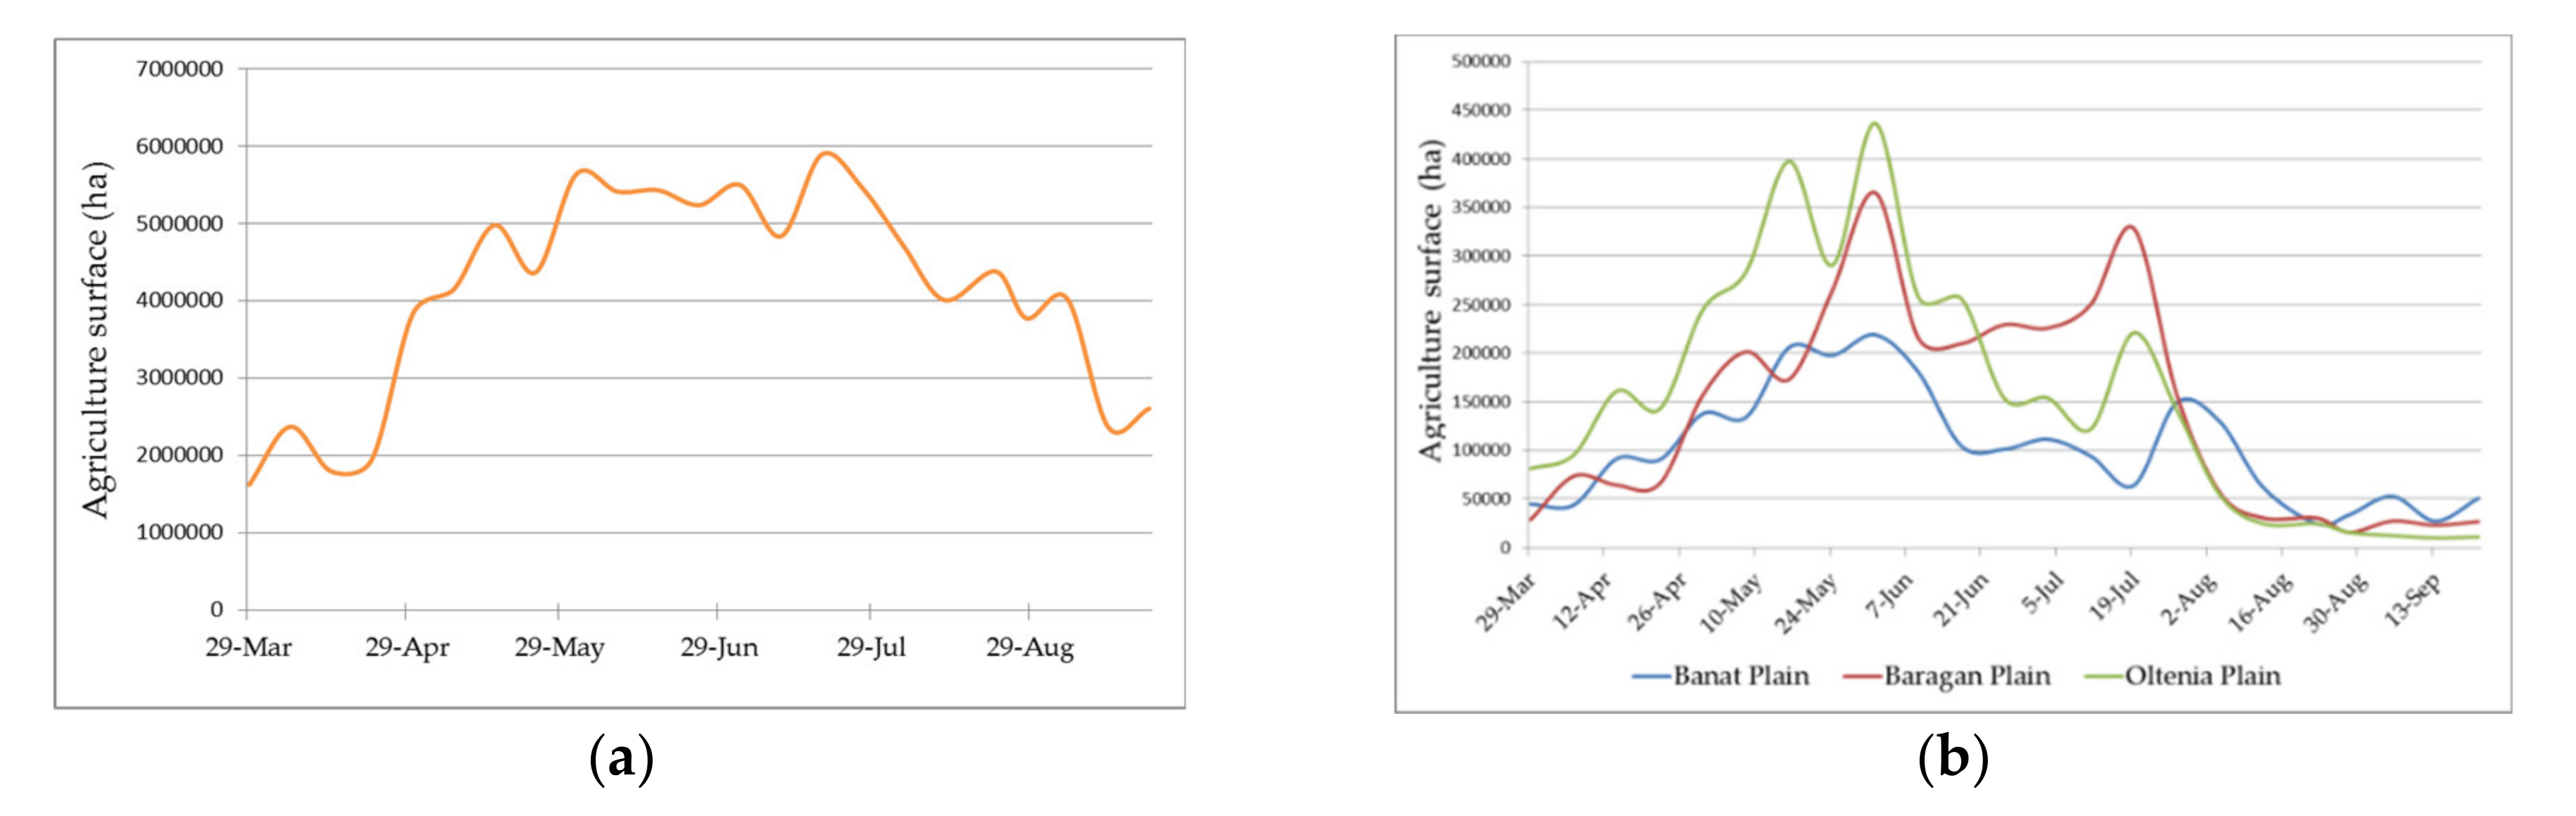
3.2. Drought Frequency According to the Drought Severity Index

The frequencies of agricultural drought were between 5% and 37%, during the vegetation season, according to the DSI analysis from 2001 to 2019. The 10–20% of drought frequency annually affects the same area of about 9.3 million ha (68.8% of the country’s agricultural land) (Figure 6a top), of which about: 458,000 ha in the Banat Plain (71.5% of the agricultural area of the plain), 461,000 ha in the Oltenia Plain (67.3%) and 608,000 ha in the Baragan Plain (65.7%) (Figure 6b top), Table S3. Over 20% of drought frequency annually affects the same area of about 2.8 million ha, and less than 10% occupies the same 2.4 million ha of Romania’s agriculture areas. The distribution of the drought frequency (over 20%) is kept at the level of the three analyzed plains, the largest affected areas being in the Baragan Plain (220,000 ha), followed by the Banat Plain (148,000 ha) and the Oltenia Plain (138,000 ha), Table S3.
Extreme drought has the lowest frequency of all types of drought, only from 5% to 16%. The largest affected areas (over 5 mil ha) in Romania are reported in the June-August period with a frequency up to 16% (Figure 6a bottom). On the other hand, extreme drought affected during the May–June period over 390,000 ha in the Oltenia Plain and over 300,000 ha in Baragan Plain, while in Banat Plain there were affected around 200,000 ha, with a frequency up to 11% (Figure 6b bottom).

3.3. Drought Variability Over the Last Two Decades

In the last 20 years, there have been droughts and extremely droughty periods that have had a negative impact on the agricultural crops.
The largest agricultural areas were affected by drought (with different degrees of intensity) in 2007 (76.3% between July 21–28) and 2012 (70.3% between August 22–29), followed by 2003 (65.6% between May 2–9) and 2002 (56.9% between July 5–12), according to DSI at country level (Figure 7a). Although the affected agricultural area was higher in 2007 than in 2012, the drought duration in 2012 was longer than in 2007. Thus, the drought phenomena occurred in over half of the vegetation period of the agricultural crops (March 30–September 30), affecting over 40% of the agricultural land of Romania (50th percentile). Also, the 75th percentile indicated an area of 57.9% affected in 2012, an area of 46.7% affected at the level of Romania in 2007, and an area of 42.6% in 2002.
The analysis of the agricultural surface of Romania affected by the extreme drought highlighted that the area was small in 2012 (a maximum of 21.95% in August 22–29), also in 2007 (a maximum of 25.5% in July 21–28) and in 2002 (a maximum of 17.2% between June 3–10), Figure 7b.
In contrast with the results at the country level, in the Banat Plain the largest areas affected by drought were registered in 2017 (77% of agricultural area being the most affected), followed by the year 2012 (73.5% of agricultural area) and 2009 (67.5% of agricultural area) (Figure 8a). The most affected 8-days syntheses are: August 6–13 (2017), September 7–14 (2012) and September 23–30 (2009), (Figure S1). As can be seen, the largest extension of the area affected by drought was recorded in the second decade of the analyzed period, in the latter part of the years, in the Banat Plain. 2012 is the year with the largest agricultural area affected by drought (52%), according to the 75th percentile (Figure 8a). Also, in 2007–2009 and 2002–2003 large areas affected are recorded, but for shorter time period (one synthesis) than 2012 (6 synthesis).
The extreme drought is very rare present in the Banat Plain. Thus, it affected about 20% in 2002, and 15% in 2017 of the agricultural area (Figure 8b). In the rest of the years, the extreme drought affected areas only narrowly. The most affected months are May 2002 and August 2017 (Figure S1).
In the Oltenia Plain, the drought affected agricultural areas larger than in the Banat Plain.
The most affected 8-day syntheses are: July 21–28 interval (2007), May 18 and 25 (2002), August 6–13 (2012) (Figure S1). Thus, the largest areas affected by drought were registered in 2007, over 90% agricultural area being the most affected, followed by the year 2002 (88.6%% of agricultural area) and 2012 (75.5% of agricultural area) (Figure 9a). 2002 is the year with the largest agricultural area affected by drought (70%), according to the 75th percentile, followed by the year 2007 and 2012 (65%). Also, 2002 is also marked by the percentile of 50th or median, having a value over 50% as regards the affected agricultural area. The drought phenomenon occurred haft of the time (50th percentile) in 2002 which affected over 50% of the area of the Oltenia Plain.
In contrast with the results at the Banat Plain, in the Oltenia Plain the extreme drought affected 57% of the agricultural area (2002), and 28.5% according to the 75th percentile, Figure 9b. Also, the drought affected 33% of the agricultural area in 2007, between 21 and 28 July (Figure S1).
The Baragan Plain is similar to the Oltenia Plain with regard to intensity and duration of the drought with some exceptions. 2007 is the driest year with the largest agricultural area affected by drought, according to the 75th percentile (80%) and the 50th percentile (48.9%) (Figure 10a). Also, large areas affected are recorded in 2002 (65.43%), 2003 (86.9%) and 2012 (45.52%), according to the 75th percentile.
The extreme drought affected 35.7% in 2007 (between July 21 and 28) and 22.4% in 2002 (June 3–10) of the Baragan Plain’s agricultural area (Figure 10b) (Figure S1). Extreme drought affected 14% of the agricultural area in 2007 and 7.6% in 2002, according to the 75th percentile. The values are much lower than in the case of the Oltenia Plain, but higher than in Banat Plain.

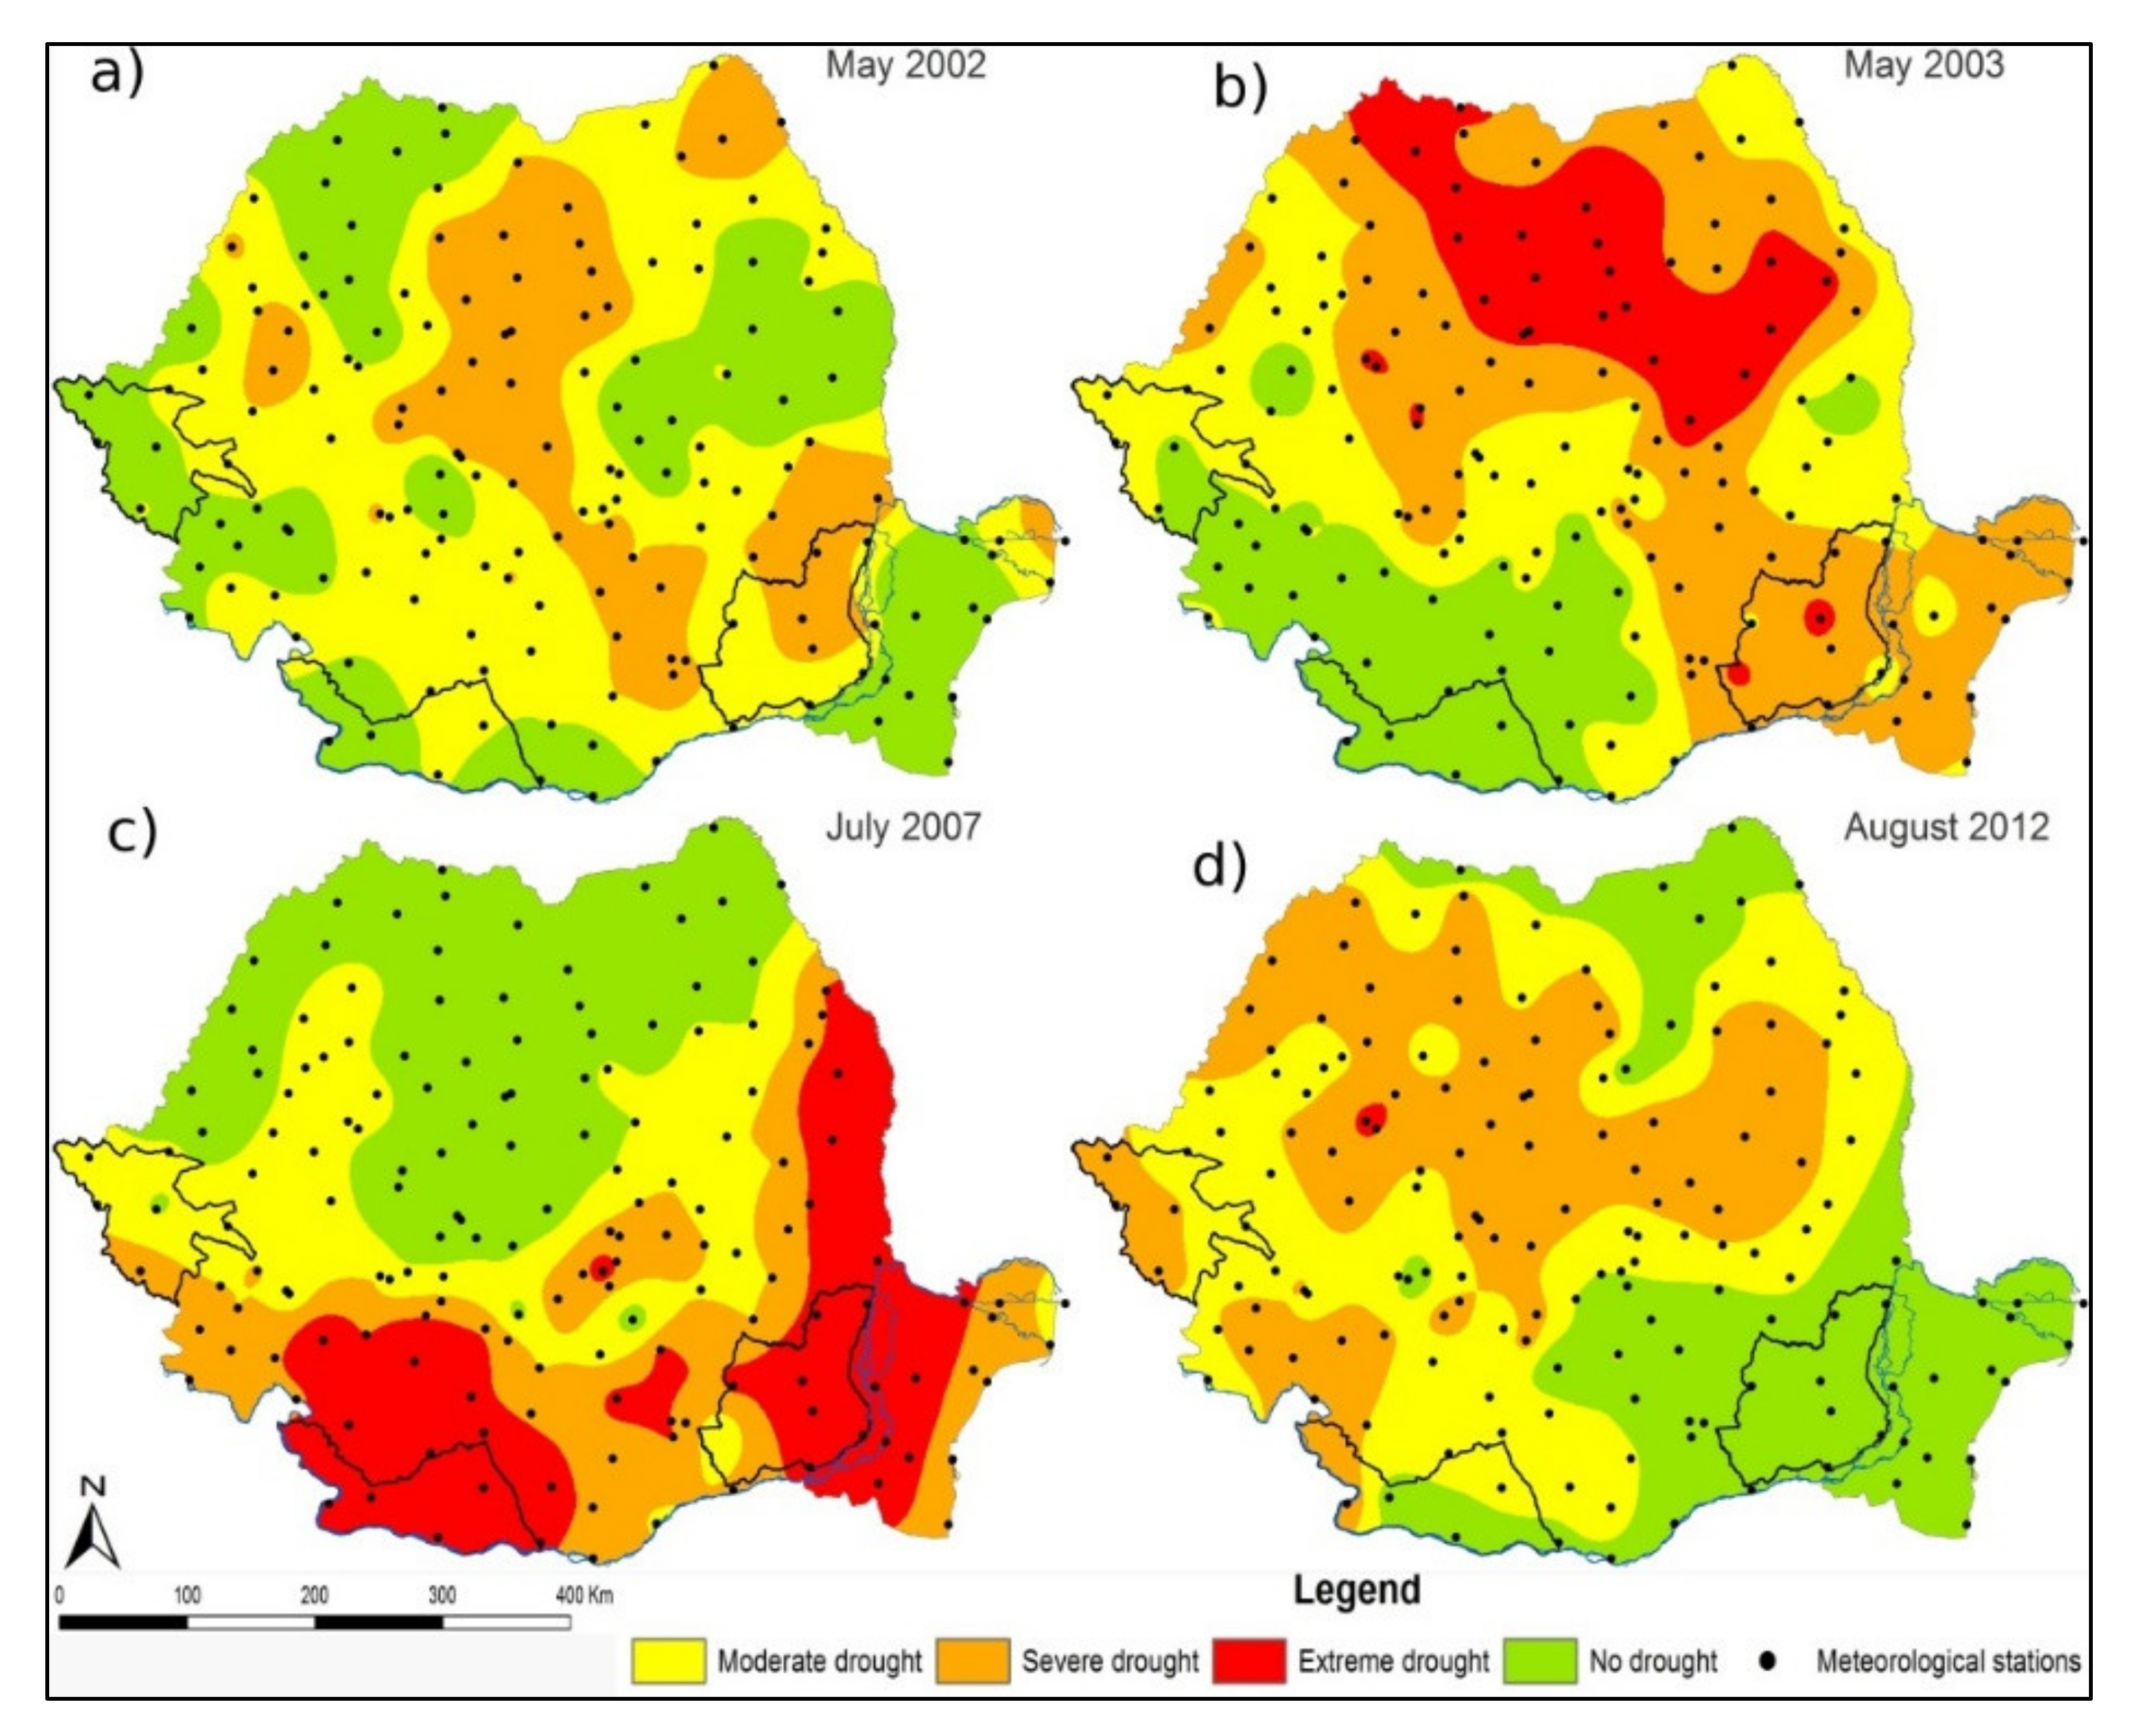
3.4. Drought Severity Index Validation

The SPEI and SMA values have been used for DSI results validation. The same extent and the same period of time have been used for comparison and validation. Thus, the differences can be observed between the weights of the surfaces from 2003, 2009, 2011, 2015, 2018 in Romania. While the results from SPEI have much higher values, the SMA values are similar to those of DSI, with the exception of 2003 and 2009 (Figure 11a).
The correlation between DSI, SPEI and precipitation it is also very good: low precipitation amounts are transposed in the presence of drought during the vegetation seasons in 2003, 2007–2009, 2011, 2012, 2015 and 2019. The exception is the year 2018 in which the analyzed elements are not correlated: the DSI, SMA and precipitation values do not indicate the presence of drought, while the SPEI value gives and also the air temperature registered high values, above average. Therefore, although the potential evapotranspiration could have had high values, it did not have a negative impact on the agricultural vegetation, and the soil registered optimal humidity values. The correlation between DSI and SPEI has a Pearson coefficient of 0.72, which means that both identify the occurrence of drought, while the correlation coefficient between DSI and SMA is 0.82.
Regarding the agricultural areas affected by drought in Banat Plain, the three indices have similar results except 2011 and 2018 when a large difference is present between DSI/SMA and SPEI (Figure 11b). In many cases, the SPEI has a higher value than DSI and SMA. Therefore, even though the meteorological drought occurred in those years, soil moisture did not decrease so as to cause agricultural drought. Based on these data, the correlation between DSI and SPEI has a Pearson coefficient of 0.57, while between DSI and SMA the correlation coefficient is 0.87.
The three indices have similar results in Oltenia Plain, except 2003, 2011, 2015, 2018 and 2019 (Figure 11c), when a large difference is present between DSI/SMA and SPEI. In many cases, the SPEI has a higher value than DSI and SMA except 2002. The correlation between DSI and SPEI has a Pearson coefficient of 0.60, while the correlation coefficient between DSI and SMA is 0.88.
There are height differences between SPEI and DSI in 2003, 2010 and 2015–2018 in Baragan Plain Figure 11d. On the other hand, DSI results overestimate the surfaces affected by drought comparative with SPEI in 2002. The DSI and SMA results are almost the same. The correlation between DSI and SPEI has a Pearson coefficient of 0.57 in Baragan Plain, while between DSI and SMA the correlation coefficient is 0.80.
The results of the ANOVA statistical test applied for the agricultural areas affected by drought based on DSI, SPEI and SMA shows that the null hypothesis (H0) is true for all the study areas (Table S4). Therefore, any differences in the means of the agricultural areas affected by the three indices drought are explained by chance alone. The three data sets that were compared have the same mean values. There are no differences in the results of the three drought indices.
The negative effects of drought in Romania can be ascertained by the low yields of certain crops, such as wheat and maize. Thus, the average wheat and maize yields in Romania in the 2001–2019 period were 3215.9 kg/ha and 4057.6 kg/ha [54]. According to the data from the NIS, the wheat production in Romania registered a decrease of up to 55.6% in 2003, 52.0% in 2007 and 40.2% in 2002, while maize decreased by up to 62.4% in 2007, 46.3% in 2012 and 28.2% in 2002 (Figure 12a). Although, SPEI indicates large areas with drought in the 2015–2019, high productions (over 40% compared to the average) confirm the results obtained from DSI. In other words, even if there was a meteorological drought, the in-soil moisture reserve did not decrease significantly so as to affect agricultural crops, especially wheat and maize, and cause the onset of agricultural drought.
The average production of wheat crop was 4003.7 kg/ha and 4803.3 kg/ha for maize crop during the analyzed period in Banat Plain. In dry years such as 2002, 2003, 2007 and 2009, the production of wheat decreased by 17–27%, and that of corn by 23–39%, Figure 12b. 2012 is the worst year for maize production, it decreased by up to 44%. The yield of both wheat and maize increased starting with 2017. The productions of wheat and maize invalidate the results obtained from SPEI for 2011 and 2018.
The average production of the wheat crop was 2926.5 kg/ha and that of the maize crop 3657.5 kg/ha in Oltenia Plain, about 1000 kg/ha less than in the Banat Plain. The wheat production decreased by 50–75%, in dry years such as 2002, 2003 and 2007 and the maize production by 60–80% in 2002, 2007, 2012 (Figure 12c).
In Baragan Plain, the average production of the wheat crop was 3586.5 kg/ha (2001–2019), and that of the maize crop 4734.4 kg/ha. This means about 1000 kg/ha more than in the Oltenia Plain and slightly lower than in Banat Plain. The wheat production decreased in dry years such as 2003 (55.6%), 2007 (52.0%) and 2002 (40.2%). The maize production decreased by 62.4% in 2007, 46.3% in 2012, 61.6% in 2012 and 24.4–28.5% between 2001 and 2003 (Figure 12d). It can be seen that the lowest productions were registered mainly in the former part of the analyzed period (2001–2010), the latter part being characterized by above average yields.

3.5. Drought Severity Index Trend According to the Mann-Kendall Test

According to the Mann-Kendall test, applied on the values of the DSI (2001–2019), the trend is positive, increasing the values of the index, between 30 March–27 July and negative between 28 July and 29 September, both at the level of the three analyzed fields and in Romania overall (Table 4). This means that in the former part of the year the drought phenomenon tends to decrease, while in the latter part it tends to increase.
The trend of DSI is for statistically significant growth at a level of 0.001 (99.9% confidence level) at the beginning of May in the Baragan Plain and at the end of April-early May for the agricultural area of Romania. Also, a statistically significant increase to a level of 0.01 (99.0% confidence level) is recorded in April and May in the Baragan Plain, end of April-early May in the Banat Plain and in May in the Oltenia Plain.
In contrast to the positive trend of DSI, the negative trend has a level of statistical significance of 0.01 (99.0% confidence level) in September and 0.1 (90.0% confidence level) in August, in the Baragan Plain. In the other analyzed areas, there were recorded statistically significant decreases of the DSI values to a level of 0.05 (95.0% confidence level) and 0.1 (90.0% confidence level), respectively.
The tendency of the areas affected by the drought is negative in the first part of the vegetation season and positive in the second part, the values of the Mann-Kendal test being higher for the Baragan Plain compared to the other two plains (Figure 13).
The increasing tendency of the areas affected by the drought is statistically significant at a level of 0.001 for the moderate drought in the Baragan Plain and at a level of 0.01 and 0.1 for the severe drought, respectively extreme drought (Table S5). In contrast, in the other two plains the increasing tendency is significant at a level of 0.05 (moderate drought) and 0.1 (severe drought), the rest being a statistically insignificant trend. The decreasing tendency of the areas affected by the drought is statistically significant for the Baragan Plain and the Oltenia Plain for all types of drought, while in the Banat Plain the trend is significant only for moderate and extreme drought at a level of 0.05 and 0.1.
The trend of the SPEI for the period 2001–2019, is similar to that of the DSI, being statistically significant decrease at a level of 0.01 in the Baragan Plain and statistically insignificant in the other plains (Table 5).
Also, the decreasing trend of SMA in the second part of the vegetation period is statistically significant for the three plains analyzed, at a level of 0.01, 0.05 respectively (Table 6). Unlike DSI, soil moisture has a decreasing trend in the first part of the analyzed period.

4. Discussion

Two decades have passed since the MODIS sensor is being collecting daily information at the Earth’s surface. This makes it possible to calculate some statistical parameters that are necessary for DSI analysis such as: multiannual average and standard deviation, frequency but also the trend.
The performance of the DSI index can be comparable to that of the SPEI and SMA indices, the intensity of the drought being identified as accurately as possible in time and space. Based on the analysis performed we were able to identify some strengths but also some limitations regarding its use. Thus, the strengths are:
  • The DSI takes into account the evapotranspiration, being one of the few remote sensing indices that take into account this parameter in drought analysis;
  • The values of DSI are standardized, therefore the results may be comparable to those from other indices;
  • DSI is useful to identify the spatial extent of agricultural drought, at 500 m spatial resolution, over different time intervals (weekly, monthly, seasonal etc.);
  • It can be applied globally and also locally.
The limitations are:
  • Cloud cover (especially for daily products) and bare soil (it can offer wrong information-overestimate the drought). The cloud cover is a very well-known problem of the optical images; thus, 8-days synthesis and cloud mask filter have been used.
  • Vegetation responds differently to the drought according to phenological phase, being necessary to identify the type of vegetation. The spatial resolution of MODIS data (500 m) does not allow the vegetation identification by species; therefore, limitation could not be solved.
  • MK test cannot be applying for DSI on the spatial scale due to existing pixels with missing value.
  • The short DSI samples (19), used in this case study, are not enough for the MK test.
The drought results, in this study, were influenced by the lack of information caused by the clouds and the state of the agricultural land before sowing and after harvesting. Therefore, the analysis of drought over the agricultural land was limited to those pixels without clouds and filtered by an NDVI threshold. According to the surface affected by clouds and filtered by the 0.2 NDVI threshold during all of the 435 synthesis images for each study area, it was noticed that a wide agricultural surface was removed from analyses: around 12.6% (116,571 ha agricultural land in Baragan Plain), 15.1% (100,506 ha agricultural land in Banat Plain) and 12% (82,227 ha agricultural land in Oltenia Plain).
At annual level (average of the 23 synthesis), in the Baragan Plain and Oltenia Plain, the highest cloud cover was registered in 2019 around 16.5%, and the lowest, in 2005 and 2007 with 8% in Baragan Plain and in 2011 in Oltenia Plain (9.1%). In the Banat Plain, the highest cloud cover was registered in 2013 (20.4%), and the lowest in 2005 (10.7%).
However, the results obtained from DSI highlight the droughts of the last 20 years. The dry periods and spatial extent identified in this study are consistent with those identified based on other indicators in previous studies [46,73]. However, Southern, Southeastern and Eastern Romania are the main agriculture areas affected by drought. The occurrence, duration and intensity of the drought are different from one region to another due to natural conditions (geographical position, relief, soil, climate etc.), agricultural measures and farm practices, as mentioned in previous studies [29,48,49].
The ANOVA test was applied to check the hypothesis of equal mean between agricultural areas affected by drought based on DSI, SPEI and SMA and the result was that there were no differences between the three data sets or there is insufficient evidence to deny the null hypothesis. Thus, the null hypothesis (H0) was confirmed. However, there are some differences between those obtained on the basis of DSI, SPEI and SMA. The spatial extent (%) of Romanian agricultural areas affected by drought, based on SPEI data, is greater than the one displayed by DSI, which favors possibility of an overestimation of drought when the meteorological index is used, to the detriment of satellite vegetation index. Higher drought estimation, obtained from SPEI data, was also observed by Um et al., 2018 [74], who used MODIS and AVHRR data in order to calculate and revise the DSI in East Asia.
The spatial droughts areas are not expected to match each other exactly each time, since the SPEI and DSI measure different types of drought. While the SPEI is used to measure meteorological drought, as a result of precipitation and potential evapotranspiration, the DSI measures vegetation, agricultural drought, based on the NDVI and actual and potential evapotranspiration [74]. On the other hand, the results from DSI are much closer to those of SMA as expected, the agricultural drought being strongly influenced by the soil moisture reserve.
Compared to DSI, the SPEI grids and SMA are not affected by clouds. Therefore, the extend of agricultural land analyzed remains the same. Despite the fact that SPEI does not depend on cloud cover, the results are considerably influenced by the number of in-situ measurements, which do not continuously monitor the drought through satellite information. Meanwhile, the results of the SMA depends on the resolution of the input data.
Regarding the DSI trend, it is similar to the SPEI and SMA indices. The trend of the drought phenomenon decreases in the first part of the year, while in the second half of the year the trend increase. This trend is confirmed by other studies conducted on Romania.
According to Busuioc et. al. (2016) [75], the increasing trend in the spring rain shower frequency in Romania, between 1961 and 2010, could be due to more instability events covering Romania, accompanied by more frequent cyclonic structures and more precipitable water. Also, the atmospheric instability is accompanied by changes in atmospheric circulation in spring (more frequent southern circulations transporting humid air masses from the Mediterranean Sea to Romania) and precipitable water in the case of summer that shows an upward trend over Romania.
Compared to the European trends of the mean air temperature that increased everywhere, in Romania decreases, according to the analyses made by Spinoni et al. 2016 [76], and precipitation shows the increasing trend in northern and the decreasing trend in the southern of Europe. As well, in northern and eastern European countries, drought severity shows a decrease linked to increase PET (excluding Romania) and precipitation.

5. Conclusions

The Drought Severity Index is a useful tool for monitoring and evaluating the drought phenomenon. The performance of the DSI in Romania is comparable to that of the SPEI and SMA indices. Negatively influencing the quality of life and the environment, drought can become a long-term phenomenon that can lead to arid agricultural lands and, in the worst case, desertification. The identification of the occurrence of the drought and its severity can be achieved through a complex analysis by the combined use of the data sets from in-situ measurements and from satellite images.
DSI capability was proved for the agricultural drought monitoring in Romania and especially in the three investigated agricultural areas: Banat Plain, Oltenia Plain and Baragan Plain. Thus, according to the results, the agricultural lands more affected by drought are located in the South, Southeast and East of Romania, mostly in 2002, 2003, 2007 and 2012. The results obtained from DSI were confirmed by the low yields in the dry years.
Although the affected agricultural area was higher in 2007 than in 2012, the drought duration in 2012 was longer than in 2007. 25% of the period analyzed in 2012, the drought phenomenon occurred which affected over 50% of the agricultural area.
Results indicated that the Baragan Plain is the most vulnerable region to agricultural drought, the intensity and frequency of the phenomenon being strongly influenced by its climatic characteristics. After Baragan Plain, the Oltenia Plain is the second most affected and vulnerable region to drought, while the Banat Plain is the least affected by the drought effects.
The drought trend in the last two decades is decreasing in the former part of the vegetation season and increasing in the latter part. Thus, an enhancement of drought is expected at the end of the vegetation season, which may have negative effects on next year’s agricultural vegetation, such as autumn wheat and rape.

Supplementary Materials

The following are available online at https://0-www-mdpi-com.brum.beds.ac.uk/2072-4292/12/23/3940/s1, Table S1: Air temperature and precipitation in the 1981–2010 period. Table S2: Correspondence of time periods for each synthesis of MODIS products. Table S3: Agricultural surface (ha) affected by drought. Table S4: ANOVA test between DSI, SPEI and SMA. Table S5: Trend and statistical significance of the agricultural surface affected by DSI according to the Mann-Kendall test (2001–2019). Figure S1: Agricultural areas (%) affected by drought (moderate, severe and extreme droughts).

Author Contributions

Conceptualization, C.-V.A., I.O. and A.I.; Data curation, C.-V.A.; Formal analysis, I.O.; Methodology, C.-V.A., I.O. and A.I.; Software, C.-V.A. and G.B.; Supervision, A.I.; Visualization, D.M.; Writing-original draft, I.O.; Writing-review & editing, C.-V.A., G.B., D.M., A.N., V.C., S.C. and A.I. All authors have read and agreed to the published version of the manuscript.

Funding

“This work was supported by a grant of the Romanian National Authority for Scientific Research and Innovation, CCCDI-UEFISCDI, project number COFUND-SUSCROP-SUSCAP-2, within PNCDI III”.

Acknowledgments

The authors would like to thank Alexandru Dumitrescu for SPEI computation at country level as grid data at 1 km spatial resolution. We are also very grateful to the anonymous reviewers who provided us with very helpful comments to improve the quality of this study.

Conflicts of Interest

The authors declare no conflict of interest.

References

  1. De Jager, A.; Naumann, G.; Vogt, J.V. Drought. In Recommendations for National Risk Assessment for Disaster Risk Management in EU; JRC Report; Publications Office of the European Union: Luxembourg, 2019. [Google Scholar]
  2. Vogt, J.V.; Naumann, G.; Masante, D.; Spinoni, J.; Cammalleri, C.; Erian, W.; Pischke, F.; Pulwarty, R.; Barbosa, P. Drought Risk Assessment. In A Conceptual Framework; EUR 29464 EN; Publications Office of the European Union: Luxembourg, 2018; ISBN 978-92-79-97469-4. [Google Scholar] [CrossRef]
  3. Wilhite, D. Preparing for Drought: A Guidebook for Developing Countries; UNEP: Nairobi, Kenya, 1992. [Google Scholar]
  4. Wilhite, D.; Glantz, M.H. Understanding the Drought Phenomenon: The Role of Definitions. Water Int. 1985, 10, 111–120. [Google Scholar] [CrossRef] [Green Version]
  5. World Meteorological Organization. International Meteorological Vocabulary; World Meteorological Organization: Geneva, Switzerland, 1992; Volume 182, pp. 1–802. [Google Scholar]
  6. IPCC. 2018: Summary for Policymakers. In Global Warming of 1.5 °C: An IPCC Special Report on the Impacts of Global Warming of 1.5 °C above Pre-Industrial Levels and Related Global Greenhouse Gas Emission Pathways, in the Context of Strengthening the Global Response to the Threat of Climate Change, Sustainable Development, and Efforts to Eradicate Poverty; Masson-Delmotte, V.P., Zhai, H.-O., Pörtner, D., Roberts, J., Skea, P.R., Shukla, A., Pirani, W., Moufouma-Okia, C., Péan, R., Pidcock, S., et al., Eds.; World Meteorological Organization: Geneva, Switzerland, 2018; p. 32. [Google Scholar]
  7. Palmer, W.C. Meteorological Drought; Research Paper; US Weather Bureau: Washington, DC, USA, 1965; Volume 45. [Google Scholar]
  8. Alley, W.M. The Palmer Drought Severity Index: Limitations and Assumptions. J. Clim. Appl. Meteorol. 1984, 23, 1100–1109. [Google Scholar] [CrossRef] [Green Version]
  9. Spinoni, J. Global Precipitation Climatology Centre and Potential Evapotranspiration Data from the Climate Research Unit of the University of East Anglia (CRUTSv3.20), WAD3-JRC. 2015. Available online: https://wad.jrc.ec.europa.eu/patternsaridity (accessed on 21 August 2020).
  10. McKee, T.B.; Doesken, N.J.; Kleist, J. The Relationship of Drought Frequency and Duration to Time Scales. In Proceedings of the 8th Conference on Applied Climatology, Anaheim, CA, USA, 17–22 January 1993. [Google Scholar]
  11. Vicente-Serrano, S.M.; Beguería, S.; López-Moreno, J.I. A Multi-scalar drought index sensitive to global warming: The Standardized Precipitation Evapotranspiration Index—SPEI. J. Clim. 2010, 23, 1696–1718. [Google Scholar] [CrossRef] [Green Version]
  12. West, H.; Quinn, N.; Horswell, M. Remote sensing for drought monitoring & impact assessment: Progress, past challenges and future opportunities. Remote Sens. Environ. 2019, 232, 1–14. [Google Scholar] [CrossRef]
  13. Svoboda, M.; Fuchs, B.A. Handbook of Drought Indicators and Indices; World Meteorological Organization and Global Water Partnership: Geneva, Switzerland, 2016. [Google Scholar]
  14. Reinermann, S.; Gessner, U.; Asam, S.; Kuenzer, C.; Dech, S. Analysis Based on Two Decades of Satellite Earth Observation Time Series and Crop Yield Statistics. Remote Sens. 2019, 11, 1783. [Google Scholar] [CrossRef] [Green Version]
  15. Podaebradská, M.; Wylie, B.; Hayes, M.J.; Wardlow, B.; Bathke, D.; Bliss, N.; Dahal, D. Monitoring Drought Impact on Annual Forage Production in Semi-Arid Grasslands: A Case Study of Nebraska Sandhills. Remote Sens. 2019, 11, 2106. [Google Scholar] [CrossRef] [Green Version]
  16. Zhang, L.; Yao, Y.; Bei, X.; Jia, K.; Zhang, X.; Xie, X.; Jiang, B.; Shang, K.; Xu, J.; Chen, X. Assessing the Remotely Sensed Evaporative Drought Index for Drought Monitoring over Northeast China. Remote Sens. 2019, 11, 1960. [Google Scholar] [CrossRef] [Green Version]
  17. Drought Management Centre for South-Eastern. Available online: http://www.dmcsee.org/en/home/ (accessed on 21 March 2020).
  18. U.S. Drought Monitor. Available online: https://droughtmonitor.unl.edu/ (accessed on 15 April 2020).
  19. European Drought Observatory. Available online: https://edo.jrc.ec.europa.eu/ (accessed on 20 April 2020).
  20. Global Drought Information System. Available online: https://www.drought.gov/gdm/content/welcome (accessed on 20 March 2020).
  21. Copernicus Global Drought Observatory. Available online: https://edo.jrc.ec.europa.eu/gdo/php/index.php?id=2000 (accessed on 20 March 2020).
  22. Sepulcre-Canto, G.; Horion, S.; Singleton, A.; Carrao, H.; Vogt, J.V. Development of a Combined Drought Indicator to detect agricultural drought in Europe. Nat. Hazards Earth Syst. Sci. 2012, 12, 3519–3531. [Google Scholar] [CrossRef] [Green Version]
  23. Drought Risk in the Danube Region. Available online: https://droughtwatch.eu/ (accessed on 2 July 2020).
  24. National Meteorological Administration. Available online: http://www.meteoromania.ro/despre-noi/cercetare/agrometeorologie/ (accessed on 30 April 2020).
  25. EUROSTAT. Statistics Explained. Available online: https://ec.europa.eu/eurostat/statistics-explained/pdfscache/26212.pdf (accessed on 15 June 2020).
  26. Alexandru, D.; Mateescu, E.; Tudor, R.; Leonard, I. Analysis of agroclimatic resources in Romania in the current and foreseeable climate change –concept and methodology of approaching. Agron. Ser. Sci. Res. 2019, 61, 221–229. [Google Scholar]
  27. Mateescu, E.; Smarandache, M.; Jeler, N.; Apostol, V. Drought conditions and management strategies in Romania. In Initiative on “Capacity Development to Support National Drought Management Policy” (WMO, UNCCD, FAO and UNW-DPC) Country Report, Romania, Bucharest, 2013. [Google Scholar]
  28. Carrão, H.; Naumann, G.; Barbosa, P. Mapping global patterns of drought risk: An empirical framework based on sub-national estimates of hazard, exposure and vulnerability. Glob. Environ. Chang. 2016, 39, 108–124. [Google Scholar] [CrossRef]
  29. Sima, M.; Popovici, E.A.; Balteanu, D.; Micu, D.M.; Kucsicsa, G.; Dragota, C.; Grigorescu, I. A farmer-based analysis of climate change adaptation options of agriculture in the Baragan Plain, Romania. Earth Perspect. 2015, 2, 1–21. [Google Scholar] [CrossRef] [Green Version]
  30. Ontel, I.; Vladut, A. Impact of drought on the productivity of agricultural crops within the Oltenia Plain, Romania. Geogr. Pannonica 2015, 19, 9–19. [Google Scholar] [CrossRef] [Green Version]
  31. Popa, V.; Borza, I. The Evolution of the Pluviometric Conditions in Connection with the Development of the Drought Phenomenon in the Plain of Banat. Bul. USAMV-CN 2006, 62, 132–137. [Google Scholar]
  32. Nichita, C.; Hauer, E.; Mircov, V. Analysis of the 2011 drought in western Romania. Res. J. Agric. Sci. 2014, 46, 38–46. [Google Scholar]
  33. Nertan, A.T.; Panaitescu, M.; Stancalie, G.; Irimescu, A.; Flueraru, C.; Panaitescu, V. Analysis of drought phenomenon using remote sensing data in Romania. In Recent Advances in Energy, Environment, Economics and Technological Innovation, Proceedings of the 4th International Conference on Development, Energy, Environment, Economics—DEEE’13, Paris, France, 29–31 October 2013; Neck, R., Ed.; WSEAS Press: Paris, France, 2013; pp. 204–213. ISBN 978-960-474-343-8. ISSN 227-4588. [Google Scholar]
  34. Stancalie, G.; Nertan, A.T.; Serban, F. Agricultural Drought Monitoring Using Satellite—Based Products in Romania. In Proceedings of the Third International Conference on Telecommunications and Remote Sensing, Luxembourg, 26–27 June 2014; ICTRS, SCITEPRESS: Luxembourg, 2014; Volume 1, pp. 100–106, ISBN 978-989-758-033-8. [Google Scholar] [CrossRef]
  35. Angearu, C.-V.; Irimescu, A.; Mihailescu, D.; Virsta, A. Evaluation of Droughts and Fires in the Dobrogea Region, Using Modis Satellite Data. Agric. Life Life Agric. Conf. Proc. 2018, 1, 336–345. [Google Scholar] [CrossRef] [Green Version]
  36. Numerical Terradynamic Simulation Group (NTSG). Available online: https://www.ntsg.umt.edu/default.php (accessed on 30 April 2020).
  37. Mu, Q.; Zhao, M.; Kimball, J.; Running, S. MODIS Global Terrestrial Drought Severity Index. Available online: https://www.ntsg.umt.edu/project/modis/dsi.php (accessed on 30 April 2020).
  38. Nicholson, S.E.; Tucker, C.J.; Ba, M.B. Desertification, drought, and surface vegetation: An example from the West African Sahel. Bull. Am. Meteor. Soc. 1998, 79, 815–829. [Google Scholar] [CrossRef]
  39. Mu, Q.; Zhao, M.; KiMbal, J.S.; Mcdowell, N.G.; Running, S.W. A Remotely Sensed Global Terrestrial Drought Severity Index. Bull. Am. Meteor. Soc. 2013, 94, 83–98. [Google Scholar] [CrossRef] [Green Version]
  40. Bordun, C.; Nertan, A.T.; Cimpeanu, S.M. Evolution of Vegetation Fraction Cover in Agricultural Areas Affected by Prellonged Droughts in the South Regions of Romania. Agric. Life Life Agric. 2018. [Google Scholar] [CrossRef] [Green Version]
  41. Pravalie, R.; Sîrodoev, I.; Peptenatu, D. Detecting climate change effects on forest ecosystems in Southwestern Romania using Landsat TM NDVI data. J. Geogr. Sci. 2014, 24, 815–832. [Google Scholar] [CrossRef] [Green Version]
  42. Ministerul Agriculturii și Dezvoltării Rurale. Available online: https://www.madr.ro/docs/agricultura/agricultura-romaniei-2015.pdf (accessed on 10 May 2020).
  43. CORINE Land Cover. Available online: https://land.copernicus.eu/pan-european/corine-land-cover/clc2018 (accessed on 20 February 2020).
  44. Administratia Nationala de Meteorologie. Clima Romaniei; Editura Academiei Române: Bucuresti, Romania, 2008; p. 365. [Google Scholar]
  45. Fraser, E.D.; Stringer, L.C. Explaining agricultural collapse: Macro-forces, micro-crises and the emergence of land use vulnerability in southern Romania. Glob. Environ. Chang. 2009, 19, 45–53. [Google Scholar] [CrossRef]
  46. Sandu, I.; Mateescu, E.; Vătămanu, V.V. Schimbări Climatice în România şi Efectele Asupra Agriculturii; Sitech: Craiova, Romania, 2010; p. 406. [Google Scholar]
  47. Balteanu, D.; Dragota, C.; Popovici, A.; Dumitrascu, M.; Kucsicsa, G.; Grigorescu, I. Land use and crop dynamics related to climate change signals during the post-communist period in the south Oltenia, Romania. Proc. Rom. Acad. 2013, 15, 265–278. [Google Scholar]
  48. Dumitrascu, M.; Mocanu, I.; Mitrica, B.; Dragota, C.; Grigorescu, I.; Dumitrica, C. The assessment of socio-economic vulnerability to drought in Southern Romania (Oltenia Plain). Int. J. Disaster Risk Reduct. 2018, 27, 142–154. [Google Scholar] [CrossRef]
  49. Popovici, E.A.; Costache, A.; Balteanu, D.; Dogaru, D.; Sima, M. Vulnerability Assessment of Rural Communities to Floods in the Western Part of Romania (Banat Plain). Int. Multidiscip. Sci. GeoConf. SGEM 2013, 1, 1161. [Google Scholar]
  50. National Institute of Statistics. Available online: https://insse.ro/cms/ (accessed on 20 January 2020).
  51. Wan, Z. MODIS Land Surface Temperature Products Users’ Guide. 2013. Available online: https://lpdaac.usgs.gov/documents/118/MOD11_User_Guide_V6.pdf (accessed on 20 January 2020).
  52. Vermote, E. MOD09A1 MODIS/Terra Surface Reflectance 8-Day L3 Global 500 m SIN Grid V006. [Data Set], NASA EOSDIS Land Processes DAAC. 2015. Available online: https://lpdaac.usgs.gov/products/mod09a1v006/ (accessed on 20 January 2020).
  53. Running, S.; Mu, Q.; Zhao, M. “MOD16A2 MODIS/Terra Net Evapotranspiration 8-Day L4 Global 500 m SIN Grid V006 [Data Set].” NASA EOSDIS Land Processes DAAC. 2017. Available online: https://lpdaac.usgs.gov/products/mod16a2v006/ (accessed on 20 February 2020).
  54. Earth Data. NASA’s Earth Science Data Systems. Available online: https://earthdata.nasa.gov/ (accessed on 15 January 2020).
  55. Vermote, E.F.; Roger, J.C.; Ray, J.P. MOD09A1—MODIS/Terra Surface Reflectance 8-Day L3 Global 500 m SIN Grid. 2015. Available online: http://modis-sr.ltdri.org/guide/MOD09_UserGuide_v1.4.pdf (accessed on 20 February 2020).
  56. Mu, Q.; Zhao, M.; Running, S.W. Improvements to a MODIS global terrestrial evapotranspiration algorithm. Remote Sens. Environ. 2011, 115, 1781–1800. [Google Scholar] [CrossRef]
  57. Monteith, J.L. Evaporation and environment. Symp. Soc. Exp. Biol. 1965, 19, 205–224. [Google Scholar]
  58. Kidd, R.; Scanlon, T.; Chung, D.; Paulik, C. Product User Guide and Specification Soil Moisture. 2018. Available online: http://datastore.copernicus-climate.eu/c3s/published-forms/c3sprod/satellite-soil-moisture/product-user-guide-v2.3.pdf (accessed on 15 August 2020).
  59. Rouse, J.W.; Haas, R.H.; Well, J.A.; Deering, D.W. Monitoring vegetation systems in the Great Plains with ERTS, NASA. Goddard Space Flight Cent. 3d ERTS-1 Symp. 1974, 1, 309–317. [Google Scholar]
  60. Mu, Q.; Heinsch, F.A.; Zhao, M.; Running, S.W. Development of a global evapotranspiration algorithm based on MODIS and global meteorology data. Remote Sens. Environ. 2007, 111, 519–536. [Google Scholar] [CrossRef]
  61. Beguería, S.; Vicente-Serrano, S.M.; Angulo-Martínez, M. A multi-scalar global drought data set: The SPEIbase: A new gridded product for the analysis of drought variability and impacts. Bull. Am. Meteor. Soc. 2010, 91, 1351–1354. [Google Scholar] [CrossRef] [Green Version]
  62. Vicente-Serrano, S.M.; Beguería, S.; López-Moreno, J.I.; Angulo-Martínez, M.; El Kenawy, A. A new global 0.5° gridded dataset (1901–2006) of a multiscalar drought index: Comparison with current drought index datasets based on the Palmer Drought Severity Index. J. Hydrometeorol. 2010, 11, 1033–1043. [Google Scholar] [CrossRef] [Green Version]
  63. Beguería, S.; Vicente-Serrano, S.M.; Reig, F.; Latorre, B. Standardized Precipitation Evapotranspiration Index (SPEI) revisited: Parameter fitting, evapotranspiration models, kernel weighting, tools, datasets and drought monitoring. Int. J. Climatol. 2014, 34, 3001–3023. [Google Scholar] [CrossRef] [Green Version]
  64. Vicente-Serrano, S.M.; Beguería, S. Comment on “Candidate Distributions for Climatological Drought Indices (SPI and SPEI)” by James H. Stagge et al. Int. J. Climatol. 2016, 36, 2120–2131. [Google Scholar] [CrossRef] [Green Version]
  65. Boroneant, C.; Ionita, M.; Brunet, M.; Rimbu, N. CLIVAR-SPAIN contributions: Seasonal drought variability over the Iberian Peninsula and its relationship to global sea surface temperature and large scale atmospheric circulation. In Proceedings of the WCRP OSC: Climate Research in Service to Society, Denver, CO, USA, 24–28 October 2011. [Google Scholar]
  66. Thornthwaite, C.W. An approach toward a rational classification of climate. Geogr. Rev. 1948, 38, 55–94. [Google Scholar] [CrossRef]
  67. Portela, M.M.; Santos, J.; Marinho de Carvalho Studart, T. Effect of the Evapotranspiration of Thornthwaite and of Penman-Monteith in the Estimation of Monthly Streamflows Based on a Monthly Water Balance Model, Current Practice in Fluvial Geomorphology—Dynamics and Diversity, Krishna Gopal Ghosh and Sutapa Mukhopadhyay. IntechOpen 2019. [Google Scholar] [CrossRef] [Green Version]
  68. Soil Moisture CCI. Available online: https://www.esa-soilmoisture-cci.org/node/50 (accessed on 15 June 2020).
  69. Dorigo, W.; Wagner, W.; Albergel, C.; Albrecht, F.; Balsamo, G.; Brocca, L.; Chung, D.; Ertl, M.; Forkel, M.; Gruber, A.; et al. ESA CCI Soil Moisture for improved Earth system understanding: State-of-the art and future directions. Remote Sens. Environ. 2017. [Google Scholar] [CrossRef]
  70. Gilbert, R.O. Statistical Methods for Environmental Pollution Monitoring; VanNostrand Reinhold: New York, NY, USA, 1987. [Google Scholar]
  71. MAKESENS-Application for Trend Calculation. Available online: https://en.ilmatieteenlaitos.fi/makesens (accessed on 15 June 2020).
  72. Miller, R.G., Jr. Beyond ANOVA—Basics of Applied Statistics; CRC Taylor & Francis Group Press: Boca Raton, FL, USA, 1997; 336p, ISBN 978-0-412-07011-2. [Google Scholar]
  73. Vizitiu, O.-P.; Calciu, I.C.; Simota, C.C. Drought intensity on arable land in Romania—Processes and tendencies. Lucr. Semin. Geogr. Dimitrie Cantemir 2016, 42, 67–80. [Google Scholar]
  74. Um, M.J.; Kim, Y.; Park, D. Evaluation and modification of the Drought Severity Index (DSI) in East Asia. Remote Sens. Environ. 2018, 209, 66–76. [Google Scholar] [CrossRef]
  75. Busuioc, A.; Birsan, M.-V.; Carbunaru, D.; Baciu, M.; Orzan, A. Changes in the large-scale thermodynamic instability and connection with rain shower frequency over Romania: Verification of the Clausius–Clapeyron scaling. Int. J. Climatol. 2016, 36, 2015–2034. [Google Scholar] [CrossRef]
  76. Spinoni, J.; Naumann, G.; Vogt, J.; Barbosa, P. Meteorological Droughts in Europe: Events and Impacts—Past Trends and Future Projections; Publications Office of the European Union: Luxembourg, 2016. [Google Scholar] [CrossRef]
Figure 1. Location of study areas (dark gray polygons on the map) within Romania.
Remotesensing 12 03940 g001
Figure 2. Flowchart for Drought Severity Index.
Remotesensing 12 03940 g002
Figure 3. Drought Severity Index in the agricultural areas of Romania in: (a) 2002; (b) 2003; (c) 2007; (d) 2012.
Remotesensing 12 03940 g003
Figure 4. Soil Moisture Anomaly in the agricultural areas of Romania in: (a) 2002; (b) 2003; (c) 2007; (d) 2012.
Remotesensing 12 03940 g004
Figure 5. Standardized Precipitation Evapotranspiration Index in the agricultural areas of Romania in: (a) 2002; (b) 2003; (c) 2007; (d) 2012.
Remotesensing 12 03940 g005
Figure 6. Agriculture drought frequency (%) and agricultural surface (ha) affected in (a) Romania and (b) study areas (2001–2019).
Remotesensing 12 03940 g006aRemotesensing 12 03940 g006b
Figure 7. Box-plot type diagram of agriculture areas affected: (a) by drought with different intensities according DSI; (b) by extreme drought according DSI, between 2001 and 2019 in Romania. The number of samples for 2001 is 21 and for the other years is 23.
Remotesensing 12 03940 g007
Figure 8. Box-plot type diagram of agriculture areas affected: (a) by drought with different intensities and (b) by extreme drought, between 2001 and 2019 in Banat Plain. Number of samples for 2001 is 21 and for the other years the number of samples it is 23.
Remotesensing 12 03940 g008
Figure 9. Box-plot type diagram of agriculture areas affected: (a) by drought with different intensities; (b) by extreme drought, between 2001 and 2019 in Oltenia Plain. The number of samples for 2001 is 21 and for the other years the number of samples it is 23.
Remotesensing 12 03940 g009
Figure 10. Box-plot type diagram of agriculture areas affected: (a) by drought with different intensities; (b) by extreme drought, between 2001 and 2019 in Baragan Plain. The number of samples for 2001 is 21 and for the other years it is 23.
Remotesensing 12 03940 g010
Figure 11. Mean of agricultural areas affected by meteorological drought (SPEI), agricultural drought (DSI) and soil moisture deficit (SMA) between 2001 and 2019 (period of reference for SPEI was 1961–2019 and for DSI and SMA, 2001–2019); (a) Romania, (b) Banat Plain, (c) Oltenia Plain, (d) Baragan Plain.
Remotesensing 12 03940 g011
Figure 12. Production of wheat and maize crops in (a) Romania, (b) Banat Plain, (c) Oltenia Plain (d) Baragan Plain, compared to the average of the 2001–2019 period (data source: NIS).
Remotesensing 12 03940 g012
Figure 13. Trend of the agricultural surface affected by DSI according to the Mann-Kendall test (2001–2019).
Remotesensing 12 03940 g013
Table 1. Share of irrigated areas (% of total arable land/unit).
Study AreaIrrigation [%]
Oltenia Plain1.7
Baragan Plain14
Banat Plain0.15
Data Source: National Institute of Statistics.
Table 2. Data used.
Table 2. Data used.
Input DataDescriptionUnitsResolution (m)Data Source
MOD16A2Total Evapotranspiration (ET)mm/8 days500https://earthdata.nasa.gov
MOD16A2Total Potential Evapotranspiration (PET)mm/8 days500https://earthdata.nasa.gov
MOD09A1Surface Reflectance (SR)Unit less500https://earthdata.nasa.gov
MOD11A2Daytime Land Surface Temperature (LST)Kelvin1000https://earthdata.nasa.gov
CLC2018CORINE Land Coverha100https://land.copernicus.eu/pan-european/corine-land-cover
PrecipitationTotal precipitationmm/month1000NMA
Air temperatureMean air temperature°C/month1000NMA
Soil moistureVolumetric surface soil moisturem3 water/m3soil25,000https://cds.climate.copernicus.eu/cdsapp#!/dataset/satellite-soil-moisture?tab=overview
Table 3. Drought intensity according to EDO classification 1.
ValuesDrought Intensity
<−2.0.Extreme drought
−2.0 to −1.5Severe drought
−1.49 to −1.0Moderate drought
−0.99 to 0.99Normal conditions/No Drought
>1Wetter than normal/No Drought
1 Drought intensity classes were established based on classification scheme used in EDO for other indicators of drought.
Table 4. Drought Severity Index trend according to the Mann-Kendall test (2001–2019).
Synthesis
(8 Days Composite Period)
Banat PlainOltenia PlainBaragan PlainRomania
Test ZSigTest ZSigTest ZSigTest ZSig
30.03–06.042.449*2.379*2.309*2.52*
07.04–14.041.399 2.029*2.309*1.40
15.04–22.040.560 1.609 2.659**2.03*
23.04–30.041.329 1.679+2.659**1.47
01.05–08.052.589**2.519*2.939**3.43***
09.05–16.052.729**2.939**3.359***3.78***
17.05–24.051.819+2.799**3.848***2.87**
25.05–01.062.519*2.449*3.009**2.17*
02.06–09.062.029*1.819+3.009**3.15**
10.06–17.061.819+1.259 2.029*3.01**
18.06–25.061.030 0.865 0.618 1.85+
26.06–03.071.607 1.607 0.124 2.27*
04.07–11.070.630 1.819+0.770 2.03*
12.07–19.070.700 2.029*0.700 1.75+
20.07–27.070.560 1.399 0.560 1.54
28.07–04.08−0.140 0.210 −0.210 −0.35
05.08–12.08−0.840 −0.980 −0.630 −0.91
13.08–20.08−0.980 −1.120 −0.490 −1.19
21.08–28.08−0.700 −1.329 −1.679+−1.40
29.08–05.09−1.329 −1.259 −1.749+−1.61
06.09–13.09−1.469 −1.889+−1.959+−1.61
14.09–21.09−1.591 −1.894+−2.803**−2.20*
22.09–29.09−1.749+−2.099*−2.589**−2.03*
*** α = 0.001 level of statistical significance, ** α = 0.01 level of statistical significance, * α = 0.05 level of statistical significance, + α = 0.1 level of statistical significance.
Table 5. SPEI trend according to the Mann-Kendall test (2001–2019).
MonthBanat PlainBaragan PlainOltenia Plain
Test ZSigTest ZSigTest ZSig
April−1.33 0.63 −0.77
May1.68+0.77 0.84
June0.07 0.21 0.91
July−0.84 −0.14 0.00
August−0.84 −0.84 −0.98
September−1.19 −2.59**−2.52
*** α = 0.001 level of statistical significance, ** α = 0.01 level of statistical significance, * α = 0.05 level of statistical significance, + α = 0.1 level of statistical significance.
Table 6. Soil Moisture Anomaly trend according to the Mann-Kendall test (2001–2019).
Synthesis (8 Days Composite PeriodBanat PlainOltenia PlainBaragan Plain
Test ZSignific.Test ZSignific.Test ZSignific.
30.03–06.040.630 −0.210 −0.420
07.04–14.04−0.530 0.140 −0.420
15.04–22.04−1.539 −0.840 −0.210
23.04–30.04−1.889+−1.679+−0.560
01.05–08.051.469 0.420 0.840
09.05–16.050.350 0.350 0.980
17.05–24.050.303 −0.303 0.630
25.05–01.060.700 0.210 0.280
02.06–09.060.530 −0.420 −0.630
10.06–17.060.000 −0.227 0.490
18.06–25.062.121*0.833 0.000
26.06–03.072.197*0.833 −0.700
04.07–11.07−0.070 0.000 0.420
12.07–19.070.420 −0.350 −1.190
20.07–27.07−0.070 −0.490 −0.910
28.07–04.080.280 −0.530 −0.770
05.08–12.08−0.490 −1.819+−2.099*
13.08–20.08−0.140 −1.120 −1.399
21.08–28.080.070 −0.630 −0.770
29.08–05.09−0.560 −2.029*−1.959+
06.09–13.090.000 −1.889+−2.729**
14.09–21.09−2.309*−2.099*−2.449*
22.09–29.09−1.061 −2.309*−1.539
*** α = 0.001 level of statistical significance, ** α = 0.01 level of statistical significance, * α = 0.05 level of statistical significance, + α = 0.1 level of statistical significance.
Publisher’s Note: MDPI stays neutral with regard to jurisdictional claims in published maps and institutional affiliations.

