Exploring the Fingerprints of Past Rain-on-Snow Events in a Central Andean Mountain Range Basin Using Satellite Imagery


1
Oceans and Atmosphere Unit, Commonwealth Scientific and Industrial Research Organization, P.O. Box 2583, Brisbane, QLD 4001, Australia
2
Programa Marino Costero, Fundación CSIRO Chile Research, P.O. Box 7560969, Santiago, Chile
3
Centro Interdisciplinario de Cambio Global, Pontificia Universidad Católica de Chile, P.O. Box 7820436, Santiago, Chile
4
Departamento de Ecosistemas y Medio Ambiente, Pontificia Universidad Católica de Chile, P.O. Box 7560969, Santiago, Chile
5
Aquasec, IAI Center of Excellence for Water Security, P.O. Box 7820436, Santiago, Chile
*
Author to whom correspondence should be addressed.
Remote Sens. 2020, 12(24), 4173; https://0-doi-org.brum.beds.ac.uk/10.3390/rs12244173
Submission received: 20 November 2020
/
Revised: 14 December 2020
/
Accepted: 16 December 2020
/
Published: 20 December 2020
(This article belongs to the Special Issue South American Hydrology and Remote Sensing (South America Water from Space))
Abstract
:Rain-on-snow (ROS) events can alter nival regimes and increase snowmelt, peak river flow, and reduce water storage. However, detection of ROS events is challenging and only the most intense and obvious cases are identified. Rain is known to reduce snow cover and decrease near-infrared reflectance due to increased grain size. This study explored the fingerprints of ROS events on mountain snowpack with a simple typology that classifies changes in snow reflectance using fifteen years of MODIS imagery, reanalysis, and surface hydrometeorological data. The Maipo River Basin, with strong nival regime and a steep topography, in the western Andean mountain range was selected as a case study. Statistical analysis showed two distinct and opposite responses in the near infrared reflectance distribution of snow-covered pixels after precipitation, consistent with the typology for rain or snow events. For the probable ROS events, the daily maximum and minimum temperature increased in the days preceding the event and subsequently decreased, in some cases followed by a less consistent response in river flow. Although much remains to be studied, this approach can be used to expand historical records and improve modelling and detection schemes.
1. Introduction
1.1. Dynamics of Rain-on-Snow Events
In all mountain basins with a nival regime, temperature decreases with altitude, allowing snow accumulation from precipitation events that occur above the zero-degree isotherm (ZDI). The ZDI can change throughout the year, between storms, and even during individual storms. Changes in storm intensity, wind, or temperature can cause rain to fall in high elevations, modifying existing snow cover [1]. These events are known as rain-on-snow (ROS).
ROS events have complex generation mechanisms, influenced by snow depth, precipitation type (rain or snow), and air temperature [2,3], along with other meteorological variables and the interaction with topography. ROS events are also dependent on the amount and temperature of the raindrops that fall on the snow [4]. Much of the dynamics that precede and trigger a ROS event remain unclear, but their effects have been studied around the world.
Seasonal snow suffers structural changes know as metamorphism, where individual snow grains clump and compact over time, creating larger grains with less air between them. ROS enhances snow metamorphism [5], adds energy to the snowpack [6], increases water content and melting rate [7,8], reduces snow reflectance, and alters the energy balance that maintains low surface temperatures [9]. Even for a deep snowpack, rain forms a more compact and shallow cover, reducing thermal resistivity by up to a factor of eight, thus increasing snowmelt [10]. Short-term hydrological effects include peak-flow surges [11], increased flooding during storms [12,13], and avalanches [14,15].
ROS is common in spring [4,16] where it accelerates melting and sometimes triggers early peak flow and flooding [13]. ROS is less common in winter or fall but can modify snow properties [17] altering local hydrological regimes [13]. The more intense ROS events are widely recognized to dominate much of the flood generation in mountainous and boreal regions [15,18]. Most of the largest floods in British Columbia, Washington, Oregon, and California have been associated with ROS [3,19]. In Germany, ROS has a much larger hydrological influence than rain alone in catchments above 400 meters above mean sea level (m.a.m.s.l.) and are a primary cause of changes in channel morphology due to erosion [20,21,22]. In the Oregon Cascades, 85% of all landslides are associated with snowmelt during rainfall [20]. A combination of rainfall and snow melt has been reported to trigger debris flows in Norway [23]. In the Ésera river in the Pyrenees, Northern Spain, a large flooding was caused by torrential rains from 18 to 19th of June 2013, where snowmelt was estimated to contribute 33% of the total runoff during the main flood and 23% of the peak flow [24]. In the long term, frequent low-intensity ROS can change the distribution of river-flow of a given year, with earlier peak river-flows, less spring-melt, and lower summer flow [7,16,25,26,27]. many studies have been carried out for the more extreme ROS events where large floods occurred [2,16,28]. In the absence of systematic monitoring and records, previous studies have focused on the long-term changes using observation datasets in relation to rising air temperatures as suggestive of occurrence [3,29,30]. Increased occurrence of ROS has been detected in Eurasia [3,31,32] and expected to increase in the Northeast United States [7,16,25,32].
Changes in ROS events from climate change have been explored using GCM (Global Circulation Models) runs and regional climate models for limited areas [33,34,35]. Increasing atmospheric temperatures may decrease the frequency of ROS events in mid-latitude regions [3] by reducing snow cover extent and duration [36]. In mountainous and high-latitude regions like the Andes, ROS events are projected to increase due to increasing rainfall days and occurrence of rain at high-elevations [34]. The mountain range holds a significant area above the ZDI where snow can be accumulated that is vulnerable to ROS events [37]. However, detailed regional scale studies predicting how ROS events will change under future climate are not yet available for most parts of the world that face such risks [36].
For the Western Andean slopes, ROS is known to occur, but no systematic monitoring exists. However, an increase of 127 meters in the ZDI has been observed during the last quarter century [38,39,40,41], likely influencing glacier thinning [42]. By the end of the century, climate change projections anticipate a 10 to 30% decrease in precipitation [41] and a 2 °C increase in annual average temperature [43]. Other changes in precipitation can be expected, such as increased intensity, shorter duration, and the occurrence of early or late precipitation in the season. Prolonged changes in temperature and precipitation can alter the snow regime, with more frequent extreme events like winter ROS and an overall reduction of snow accumulation [13].
Observing and understanding extreme weather events like ROS is fundamental for the future and climate change adaptation. However, the study of ROS events is not that common as it is rarely being detected unless it has significant impact to populated areas. Furthermore, ROS occurs mostly in high-elevation areas where monitoring can be difficult [3,31]. High-elevation weather stations in mountains are scarce, especially for the western Andes. Furthermore, these events can be sudden and sporadic, easily missed by an individual station in the wrong location.
Field measurements of snow properties are sparse or infrequent, often subject to availability of instruments, personnel duty cycles, and constrained by cloud cover or storms. In addition to the difficulties in observation, mountain weather with winter frontal storms is often very complex and dependent on specific interactions between storms, atmosphere, and terrain. Systematic monitoring of ROS from weather stations has been very difficult [44] and in most cases, historical records are mostly anecdotal. Only the most extreme events have been clearly identified by observing the ZDI and the impacts on the resulting river flow [3,17,21,23]. Reconstructing past events from this information can be challenging.
1.2. ROS Monitoring
Weather modelling and forecasting is a fundamental tool for the observation and early warning of extreme events. However, the correct determination of the precipitation phase over changing terrain is critical to identify an ongoing ROS event. Precipitation phase determination schemes rely on weather stations and often assume a constant temperature lapse rate with height and invariant atmospheric conditions [45]. These schemes can also ignore interactions between atmosphere and terrain, warm and cold air masses, or between water droplet and the lower atmosphere as it falls through [46,47,48]. Changes in the ZDI from interactions with terrain and the properties of the melting layer might not be captured in this approach [48]. Other overlooked interactions include: airmass boundaries that introduce a warm air layer over cold air that increases atmospheric melt energy, or earth surface heating or cooling a shallow layer of air allowing rain at cooler temperatures or snow at warmer temperatures [46].
Improving forecasts of rain-on-snow events is hindered by the lack of general knowledge about the character of local historical rain-on-snow events [3]. More complex approaches for weather modelling require a broad understanding of the specific mountain weather, knowledge of the initial hydrometeor phase [26], shape and size [49], and detailed atmospheric information, often not available [26,45]. Considering the importance and need for widespread weather monitoring and knowledge of the complex Andean mountain weather, currently, weather modelling is unlikely to accurately detect or forecast ROS events from strong frontal storms.
1.3. Remote Sensing Applications for ROS
Remote sensing is the most extensive technique to observe snow [44] and can regularly and safely provide maps of snow properties [50]. While optical satellites like the Moderate Resolution Imaging Spectroradiometer (MODIS) and Landsat are frequently used to map snow, to the best of our knowledge they have not been explored to identify ROS events.
The potential use of passive microwave (PMW) sensors to study snow properties has been proven useful and measurements of Temperature Brightness (TB) has been shown to be sensitive to wet snow [51,52,53]. These approaches are based on the detection of change of surface dielectric properties from the presence of water at the air-snow interface, leading to surface scattering in the horizontal polarization and increased emission [54]. Dolant et al. (2016) [55] and Langlois et al. (2017) [56] proposed an empirical detection approach from observed ROS events and ground based PMW measurements of TB to detect a wet snow layer. The research aimed to establish a link between snow properties and signals at 18.7 and 36.5 GHz at both vertical and horizontal polarization [57].
The algorithm was tested for the Advanced Microwave Scanning Radiometer for the Earth observing system (AMSR-E) at 12.5 km pixels. A second testing of this approach was presented for Alaska where ROS events were reconstructed using remote sensing AMSR microwave brightness temperature-based freeze-thaw retrievals (12.5 km resolution) and MODIS snow maps (500m resolution) with a high degree of success [37]. Although very promising, this approach can struggle to differentiate between melt events (wet snow) and ROS events and heavily affected by cloud cover [55]. More robust detection algorithms remain to be explored [51].
Multispectral optical satellites can estimate snow cover extent using the difference between the visible and near-infrared (NIR) using the Normalized Difference Snow Index (NDSI) [58], and also retrieve information of albedo, grain size, liquid water close to the surface, and temperature [50]. While snow reflectance is dependent on grain size, water content, surface roughness, depth, and impurities [59], near-infrared reflectance is mainly affected by grain size [60].
Snow metamorphosis occurs gradually and unidirectionally after a snow fall, causing grain size to increase over time. Increase in grain size can be observed by a near-linear decay in NIR reflectance, from high-reflectance fresh snow to lower-reflectance ice [37,50]. In seasonal snow, this means a potential tracking of new snow from increased NIR reflectance, which can be indicative of ROS. Rain has a similar but more drastic effect on snow, washing away thin layers of snow and forcing wet-snow metamorphosis. This will cause small grains to form large clusters in a matter of hours [10,17]. These clusters behave optically as large grains with low near-infrared reflectance, even after refreezing [50,61]. Observing the reflectance of snow in the near infrared to discern between natural and sudden metamorphism can help to identify the occurrence and extent of ROS events.
The objective of this work is to use near-infrared reflectance from readily available remote sensing data and radiation-reflectance principles [50] and develop a simple typology to discern the likelihood of events from the effects of liquid water on grain size against those of fresh snow. Our central hypothesis is that certain changes in snow extent and status, along with climatic conditions and hydrological responses, consistent with ROS events, can typified to discern the likelihood of ROS.
Although significant efforts are being done to detect events and study its effects and dynamics, we believe a clear dataset and understanding of events are the missing link between detection, modelling, and forecasting. To the best of our knowledge, NIR reflectance has not been explored in the context of ROS events and remote sensing has not been used in the reconstruction of likely past events. This approach has the potential to support and explore the typification of events from historical data, which will contribute to the study and eventual understating of these events for future detection schemes.
2. Materials and Methods
2.1. Study Area
In mountain regions, precipitation can infiltrate the soil, generate outflow, or accumulate as snow until melting, altering temporal water distribution [62]. This accumulation of water and delay in river flow is fundamental for Mediterranean climate regions like the Central Andean mountain range with rainy winters and dry summers when water demands are substantially larger.
The Pacific Westerlies transport most of the water to the Central Andes and regulate precipitation via frontal extratropical systems. Westerlies reach the south of the continent in winter and are diverted north to the central Andes along the mountain range, where precipitation is blocked by the southeast Pacific anticyclone (31°S), creating a Mediterranean climate, and causing aridity further north [63,64]. For the Central Andes, snow is seasonal and peak accumulation occurs in winter, while summer is dry and stable, blocking precipitation and driving snowmelt and river flow [65]. River flow patterns depend mainly on the snowpack characteristics and the energy balance during snowmelt [62,66,67], and the amount and extent of snow helps determine available water supply [68].
The Maipo River basin in central Chile (~33°S, ~70°W), is defined by a strong Mediterranean climate and nival regime, characterized by wet and cold winters and dry hot summers. The Maipo Basin is bounded north by the Aconcagua basin, south by the Cachapoal, east by the Andes and west by the Pacific Ocean. Water flows East to West, beginning in the Andes at 6570 meters above mean sea level (m.a.m.s.l.) and ends in the Pacific Ocean, 250 km away. Like other rivers in the area, the Maipo and its tributaries are short with steep slopes. Maximum precipitation occurs between July and September, with average annual precipitation close to 290 mm [69]. Precipitation amounts are, in general, larger towards south and east. The basin is about 15 thousand square kilometers and is comprised of two main tributaries, the Maipo and the Mapocho Rivers (Figure 1). The Mapocho sub-basin is considerably smaller and with lower attitude (2370 m.a.m.s.l.) than the Maipo sub-basin. The Mapocho sub-basin has less area above the ZDI and therefore less winter snow accumulation. Its fluctuations mostly depend on snowmelt, peak river flow tends to be earlier in spring with a maximum in November, and the extreme low-water flow occurs in the autumn months [63]. This highlights the contrast of nival influence between the sub-basins.
Average annual flow in the Maipo River is 4445 million cubic meters and average annual runoff discharged into the Central Valley, pre-mountain range, amounts to 2620 million cubic meters. River flow in winter is close to 40 cubic meters per second and rises to 170 cubic meters per second in the summer. Average annual flow can vary between 90 and 250 million cubic meters from dry to wet years [63]. Even though there are many factors involved in the precipitation-river flow dynamic, affecting how fast a basin responds to rain/snow events, the Maipo basin is good example of a small basin with a fast and direct response on hydrology. Going from 5500 to 560 m.a.m.s.l. in less than 60 km to the metropolitan region of Santiago and 250 km to the Pacific Ocean, the effects of rain or snow in the upper part of the basin where rain transitions to snow should be easier to discern.
2.2. Datasets
2.2.1. Moderate Resolution Imaging Spectrometer (MODIS) Data
The Moderate Resolution Imaging Spectroradiometer (MODIS, 1999 to present) operates on the National Aeronautics and Space Administration (NASA) Terra and Aqua platforms for a daily repeat cycle with 36 spectral bands ranging from 250 to 1000-meter resolution [70]. Spectral bands between the visible and infrared spectrum are frequently used in snow and sea ice mapping and bands in the short-wave infrared parts of the spectrum (i.e., bands 6 (1.6 mm) and band 7 (2.1 mm)) are adequate for snow/cloud discrimination [71,72,73].
The Terra MOD09A1 Surface Reflectance 8-Day L3 Global 500 m SIN Grid Version 6 product (8-Day composite, L3 processing, Global 500m resolution) provides an estimate of the surface spectral reflectance of Bands 1 through 7 with atmospheric correction to account for aerosols, gasses, and Rayleigh scattering [74]. The 8-day composite period selects the best pixel observed based on cloud and solar zenith criteria [70,74,75]. This product has series of significant improvements that are relevant to the analysis [70]: (1) Improved aerosol retrieval and correction algorithm and (2) refinements to the internal snow, cloud, and cloud shadow detection algorithms.
We selected the MODIS Surface Reflectance 8-Day L3 Global 500m SIN Grid V006 [70] to observe the NIR reflectance data from mostly-snow cover pixels without cloud cover. The main reasons are (i) its temporal frequency and time of acquisition, (ii) NIR band closer to the range of grain size sensitivity (1230–1250 nm), (iii) correction of low-view angle, cloud cover or shadow, aerosol loading and atmospheric gases, (iv) accounts for the possible bidirectional effect of surface roughness in off-nadir angles, specifically relevant for mountain terrain. Even though the 8-day window can potentially hide some events with fresh snow (True Negative), our priority in this analysis is to obtain a clear observation of True Positive events, to set the typology of their characterization. Snow metamorphism would not show any significant effects in the period up to 8 days between MODIS scenes, hence it is unlikely to cause confusion between normal snow metamorphism and the effects of rain, leading to a False Positive. All scenes were downloaded from the United States Geological Survey (USGS) Earth Explorer web portal from 2001 to 2015, providing 678 images.
Snow cover was detected using the NDSI algorithm and processing scheme currently used in NASA’s Earth Observing System (EOS) for the MODIS snow map product [71,73,76]. The NDSI [72,76,77] measures the ratio of reflectance of snow in the visible where is higher, and short-wave infrared (SWIR), where is lower. This algorithm is widely used in the identification of snow- and ice-covered pixels and their separation from cloud cover. Further details can be found in Hall & Riggs (2010) [72].
Pixels with NDSI > 0.4 are classified as snow [72,78,79], and can be assumed to contain snow of depth ≥ 2.5 cm [30,70,80]. NDSI is insensitive to various illumination conditions, atmospheric effects, viewing-geometric distortions, and terrain effects [50,68,71,72]. Making it especially useful for mountainous terrain and shadows.
To focus on seasonal snow and better observe the changes in NIR reflectance, avoiding confusion from patchy snow cover, water, vegetation, dark pixels or cloud cover, a set of pixel discrimination criteria was added to improve the likelihood of observing clear and unobstructed signals from snow:
Elevation and NDVI to exclude vegetation: We used the 30-m ASTER Global Digital Elevation Model (DEM) [81], selecting only pixels higher than 1000 m.a.m.s.l., excluding vegetation and limiting the study area to extents with seasonal snow cover. Normalized Difference Vegetation Index (NDVI) was also used in combination with the Normalized Difference Snow Index (NDSI) to exclude snow covered forest from the observation.
- Pixel fractional snow cover: The NDSI algorithm identifies pixels with over 66% fractional snow cover [50]. A higher threshold was set using the MB3U algorithm (model MB for 3 test sites [68], that uses the NDSI values in a regression to obtain fractional snow cover (MB3U algorithm), excluding pixels with less than 75% snow cover, and avoiding pixels with low snow cover that might reduce reflectance for reasons other than grain size.
- Elimination of dark or cloudy pixels: Pixels with values below 10% in band 4 and 20% in band 6 are identified as dark or cloudy, and thus removed from the analysis [70].
- Decaying seasonal snow: Seasonal snow-cover discrimination excluded data during summer-spring, when snow has the highest state of decay and least amount of snow (leaving 337 usable scenes).
2.2.2. Hydrometeorological Data
Four hydrometeorological parameters were selected to study ROS events along with the MODIS scenes: Minimum and Maximum daily temperature (before and after ROS event), Precipitation (triggering ROS event) and river flow (resulting from ROS event). A high-resolution precipitation and temperature dataset for hydroclimatic research in Chile was selected to use as reference data for interval of 2001–2015 (CR2MET, from the Center for Climate and Resilience Research) [82]. The CR2MET is a spatial dataset that contains precipitation, max and min temperatures for a rectangular grid of 0.05° (~5 km). For the CR2MET dataset, precipitation was based on ERA-Interim atmospheric reanalysis data, statistically downscaled from a ~70 km grid, accounting for local topography, calibrated with local observations of precipitation; the temperature products were built from integration of ground data, reanalysis and MODIS Land Surface Temperature [82].
The spatial precipitation in the original ERA-Interim precipitation product is quite coarse and only a few pixels will cover the snow-covered are of the Maipo basin. Although the final product is statistically downscaled, we cannot confidently assume where a precipitation occurred, only that it occurred in the basin. The same difficulty is found using weather stations, where stations are sparse and rarely found in high elevation areas where winter snow occurs. In both cases, precipitation is not directly observed in the mountain range.
We assume that precipitation occurs in the whole basin, supported with the knowledge of the dynamics of frontal storms in the region that usually cover several kilometers [63]. Values are analyzed visually to verify the occurrence of precipitation at the basin level.
River flow data is collected in situ by river gauges operated by the Chilean Directorate General of Water (DGA) and daily average and monthly average river flow were used. A quality control procedure was applied to remove stations with incomplete records within the period of analysis. All data is accessible from the CR2 Climate Explorer [83] and IDE Chile: Geospatial Data Infrastructure of Chile [84].
2.3. Method
Conceptually, both snow cover and NIR reflectance are expected to increase following snowfall, while an abrupt reduction of both after precipitation could signal the effect of ROS. To be able to detect an event, the response to a precipitation should be opposite to that of fresh snow and significantly different from normal snow metamorphism. The assumptions for this approach are as follows:
- Fresh snow follows a continuous metamorphism in the winter-summer span until the melting process begins.
- Snow metamorphism can be tracked by the observation of NIR reflectance of clear snow-covered pixels.
- The highest levels of metamorphism and lowest NIR reflectance should be observed closest to the snowmelt period, signaling the largest grain size and clumps.
- For the colder months, snow NIR reflectance should remain in relative high levels of reflectance in comparison to those of the snowmelt period due to the frequent addition of fresh snow and the small amount of time for metamorphism.
We compiled daily precipitation record at the basin level and aggregated them for the 8-day interval to match the MODIS scenes. This process was performed with the software Quantum GIS (QGIS) [85] and specific packages from the Geographic Resources Analysis Support System (GRASS) [86]. The MODIS Surface Reflectance products were used to observe the seasonal snow accumulation in the Central Andes for the Maipo River basin, by creating two variables that describe extent and state of snow, respectively:
- Snow-Cover Area (SCA) as the count of pixels with more than 75% snow cover, and
- Near-infrared Reflectance Snow Reflectance (NIR-SR) from Band 5 reflectance pixels (1.0 to 1.3 μm) from the SCA.
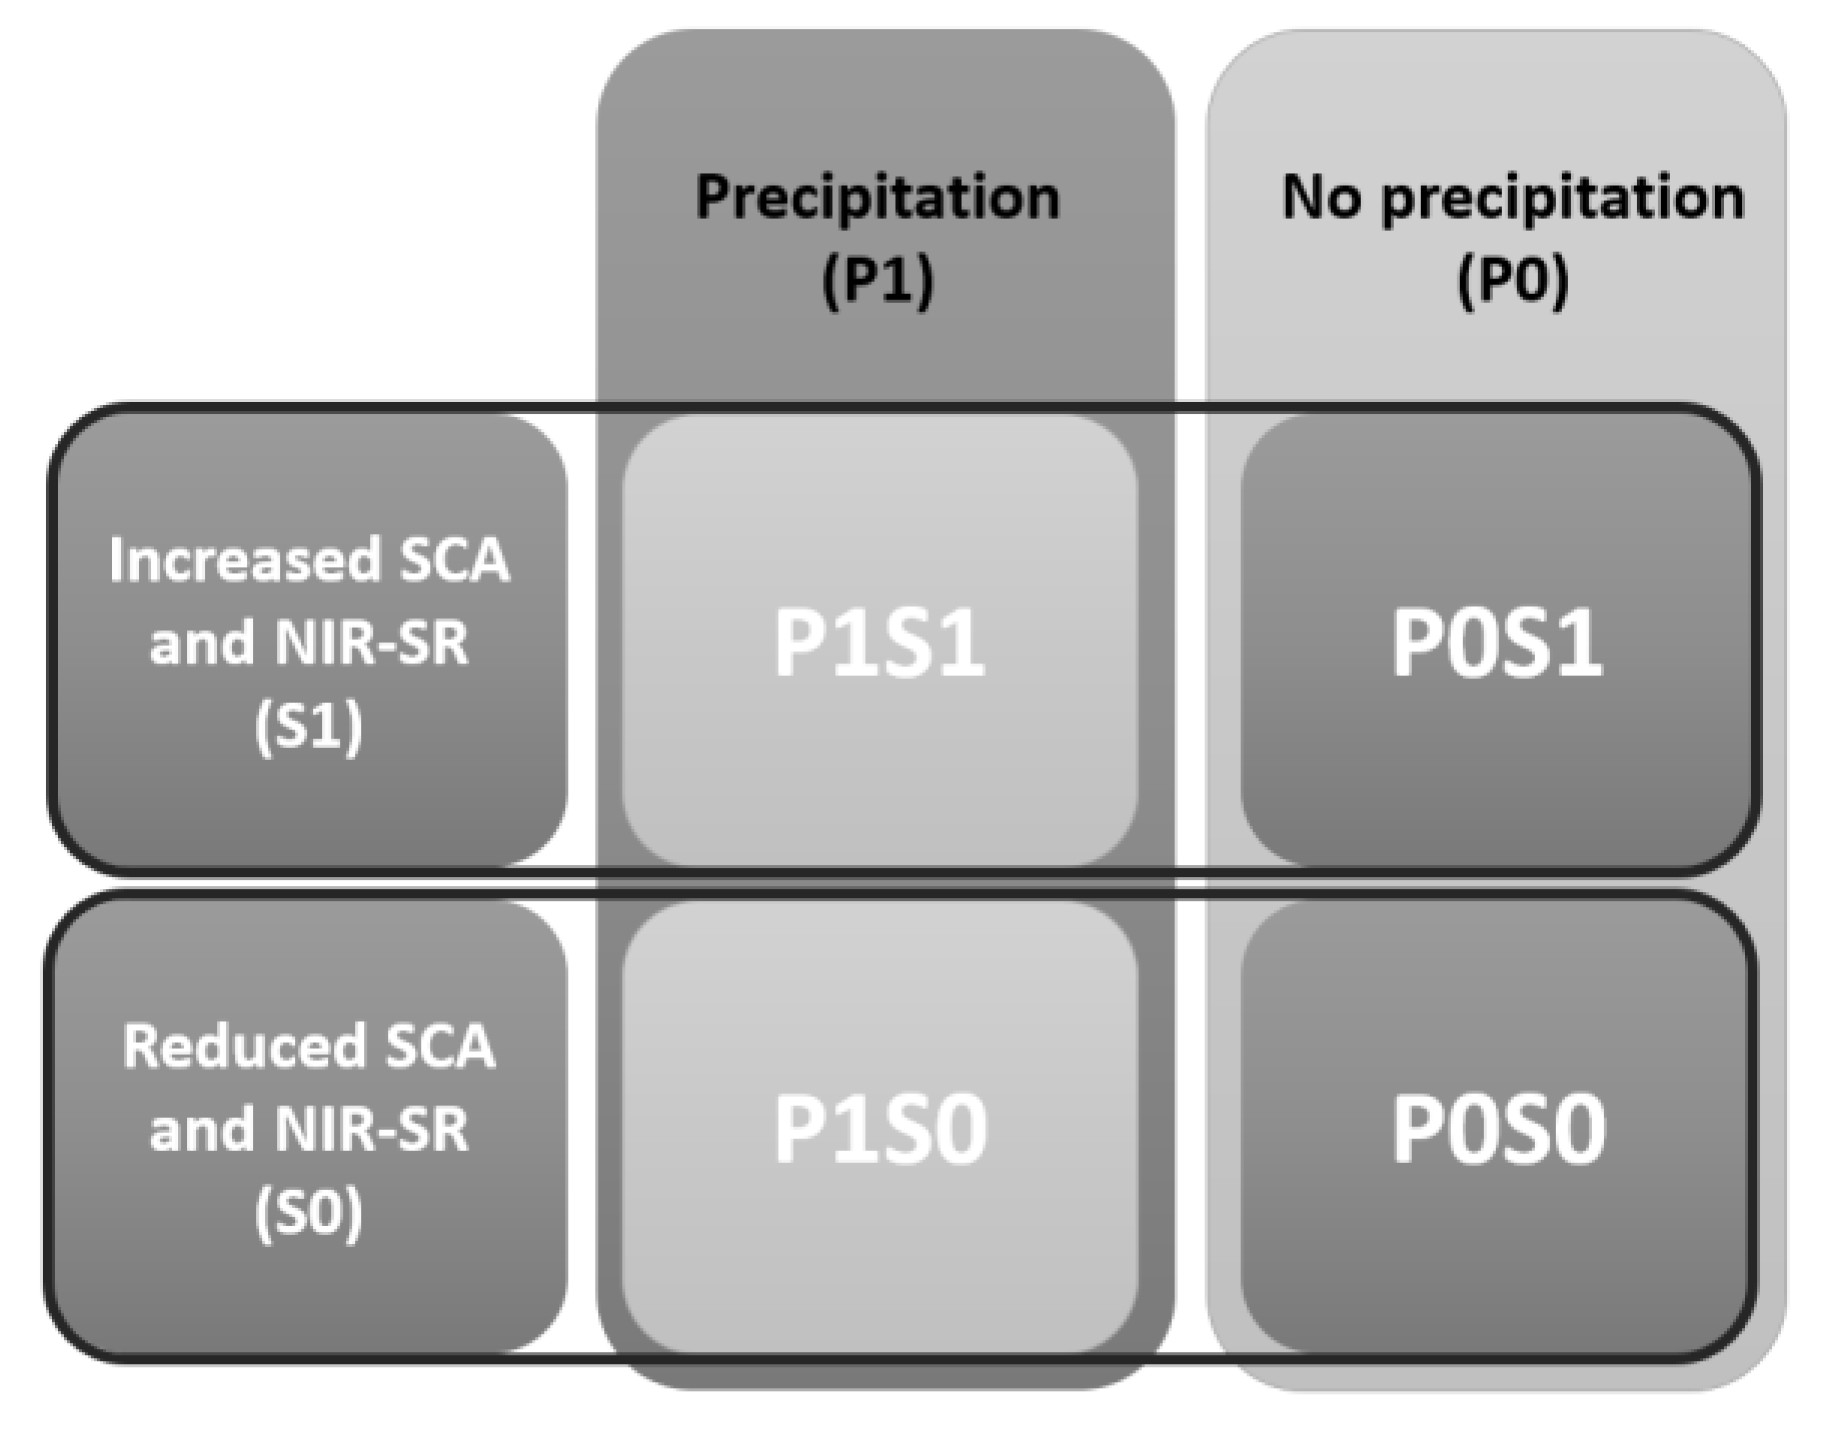
A simple typology of likely events was proposed using a 2 × 2 matrix to classify the change in SCA/NIR-SR associated with occurrence of precipitation since the last image (Figure 2).
Snow precipitation (P1S1) is expected to increase the snowpack in extent and state (SCA and NIR-SR, respectively), while rain would reduce both (P1S0). In cases of no precipitation, SCA and NIR-SR can stay unchanged (P0S1) or decrease slightly (P0S0) from the previous image, depending on temperature. P1S0 suggests the occurrence of ROS. To identify and discern the fingerprints of P1S0 from P1S1 events, we study the shapes of the NIR-SR distribution moments (Mean, variance, skewness, and kurtosis), comparing them between the four event types, using non-parametric tests (Mann-Whitney and Kolmogorov-Smirnov [87,88]).
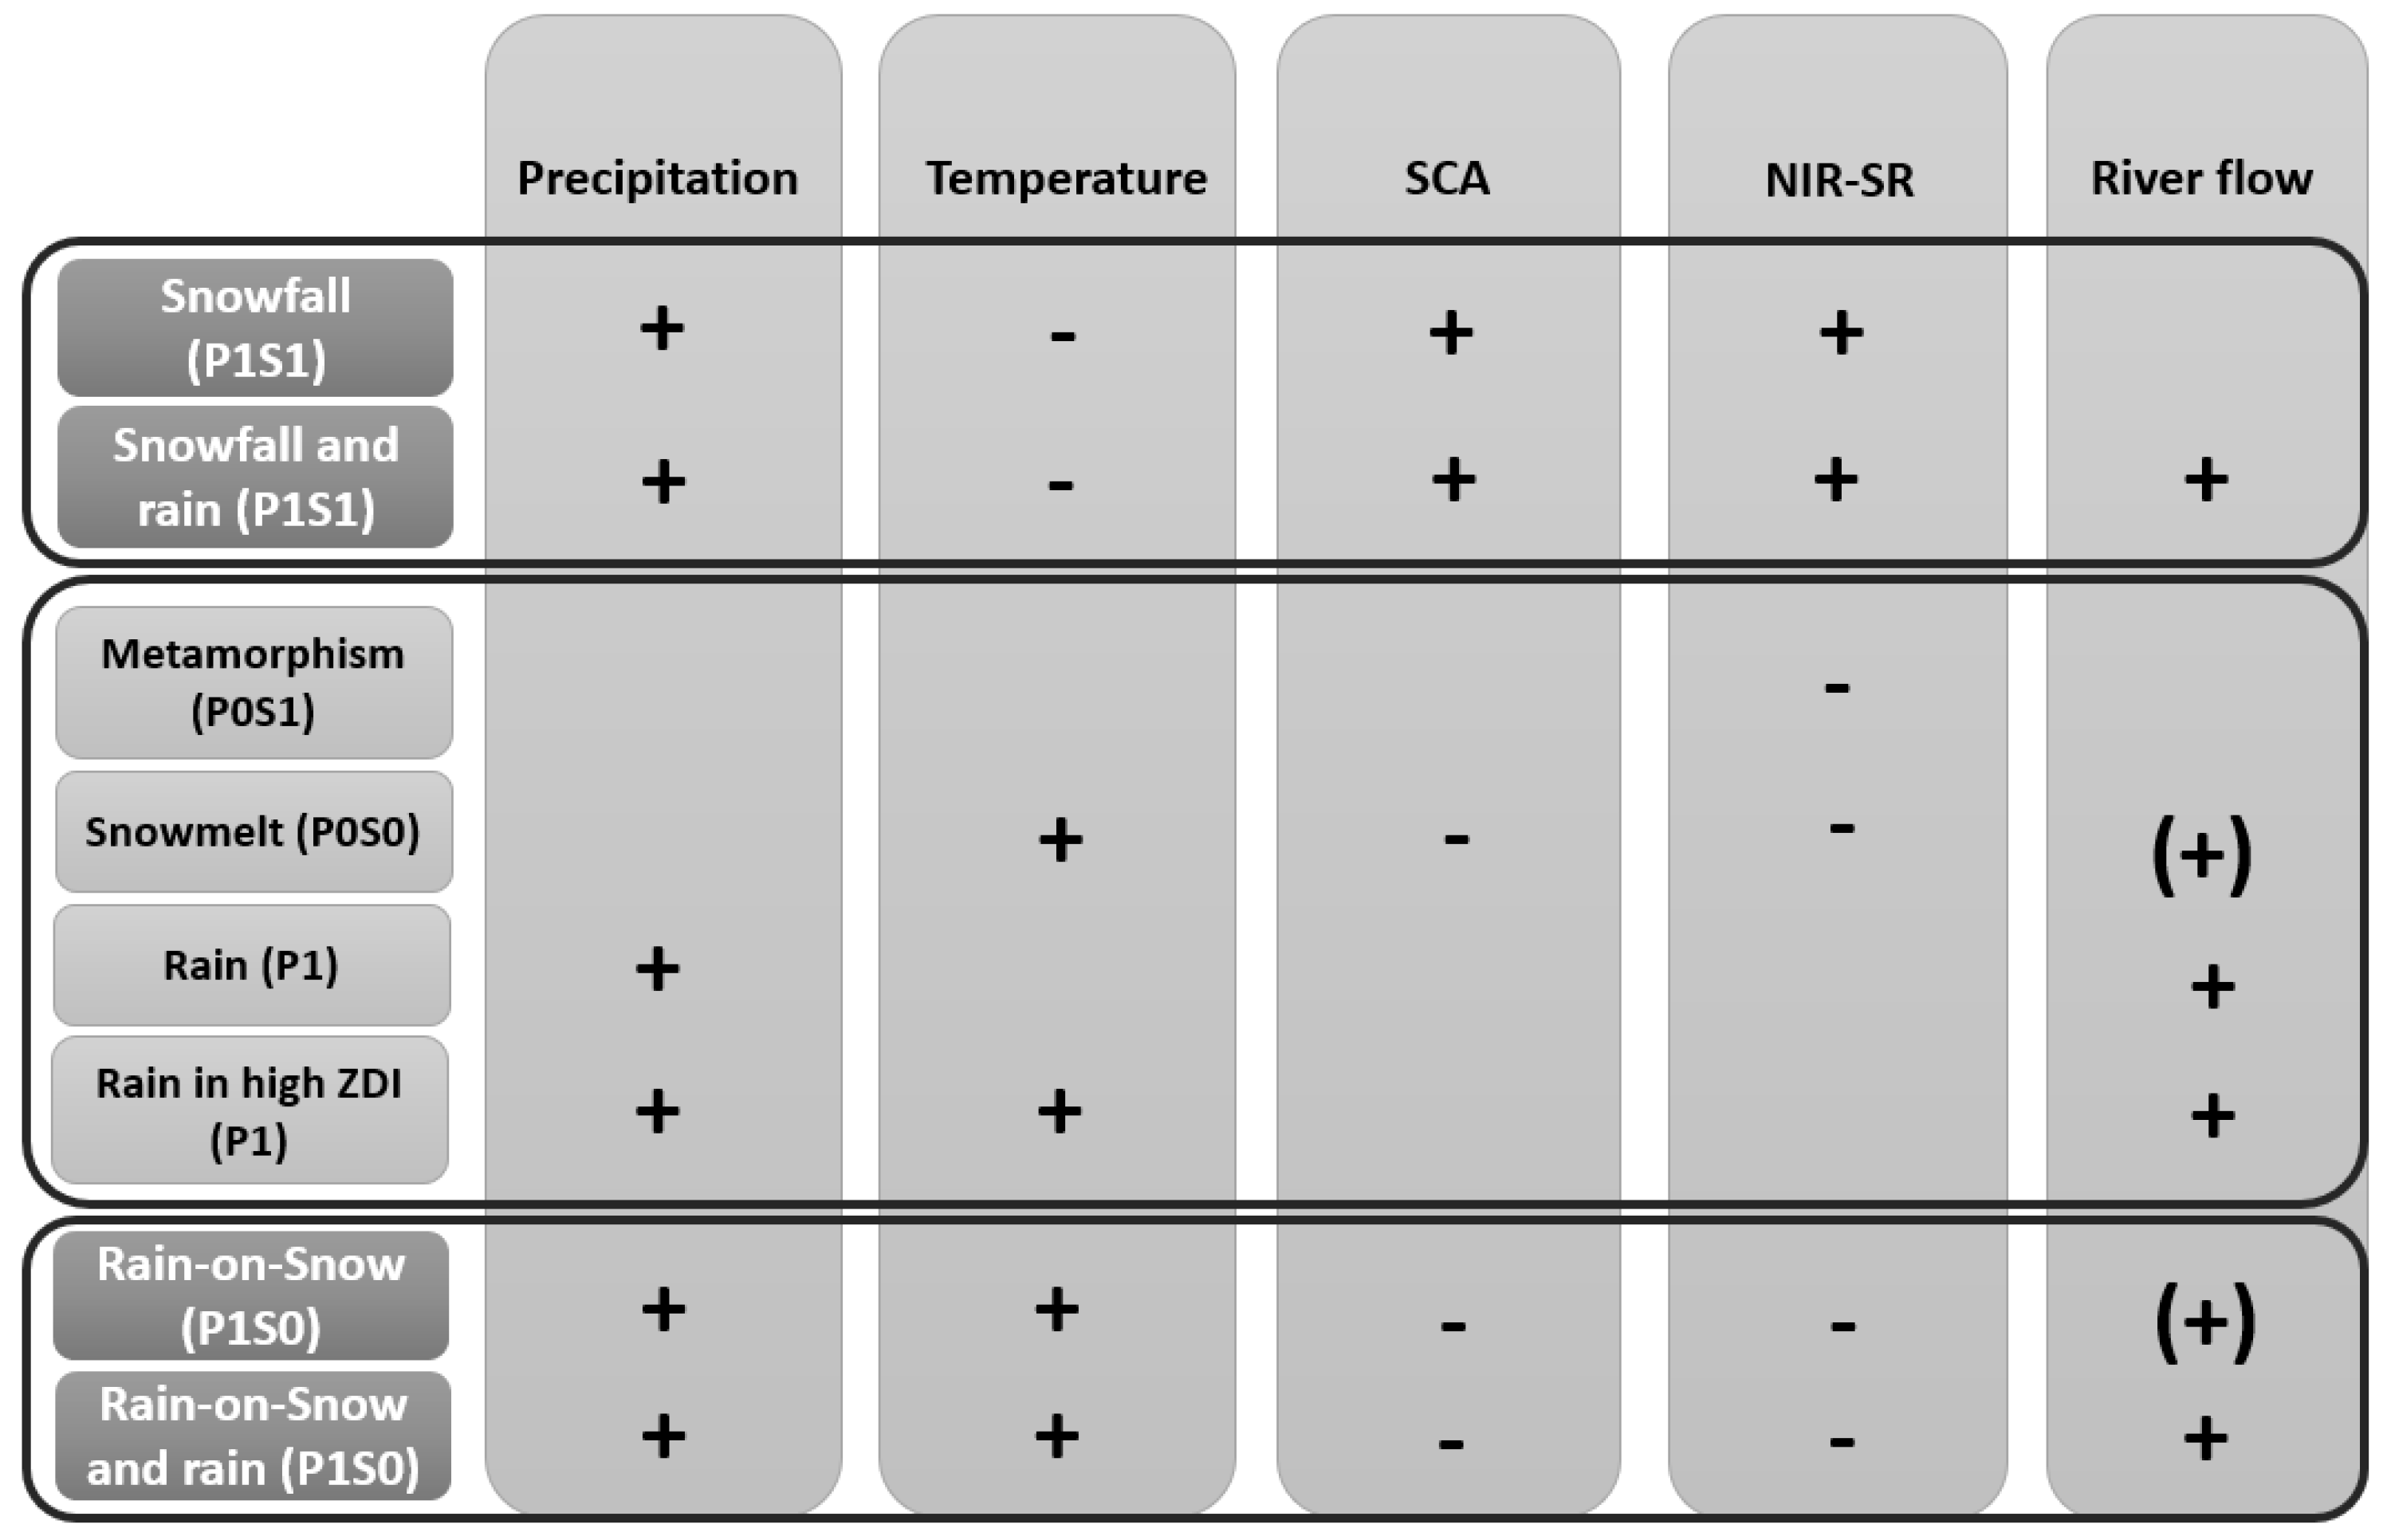
P1S0 events were analyzed to assess changes in daily temperature (max, min), and river flow (immediate effects). Figure 3 describes the implications of each type of event in terms of changes in precipitation, temperature, SCA, NIR-SR, and river-flow.
In Figure 3, the responses on Precipitation, Temperature, SCA, NIR-SR, and River flow are matched for events of snowfall, rain, rain-on-snow, and combinations of events. Plus (+) and minus (−) signs indicate if an increase or decrease is expected from an event (parentheses are used when the response is not certain). Empty cells suggest no response is expected. In snowfall events, precipitation is accompanied by a decrease in temperature, increase in SCA and NIR-SR. Rain events are expected to be matched with a response in river flow. Rain-on-snow events would most likely be related to increases in temperature and reduced SCA and NIR-SR.
There are, however, important sources of error and uncertainty that need to be stated and further explored, including in situ calibration, bidirectional reflectance effects, cloud cover, frequency of observation and other sources of grain size increase. Without in situ grain size measurements and calibrations, we observed the changes on NIR reflectance after precipitation as the most significant response to rain or snow, suggesting the changes in grain size from metamorphism. The influence of surface roughness on the bidirectional reflectance of snow for viewing geometries over rough terrain are mostly negligible for near-nadir but not for off-nadir sensors [89,90,91], Thus a comparison between a series of images needs to account for time of collection. Only the surface snow metamorphism is observable by remote sensing and new snow will reset the observable metamorphism. In the near infrared, the snow is effectively semi-infinite when depth exceeds approximately 3 cm, but different bands can reach different snowpack depth and respond to different grain sizes [50,92], therefore, this approach needs to build upon single band measurements, to eventually explore a multi-band ratio approach.
3. Results
3.1. Likelihood of Rain-on-Snow Events
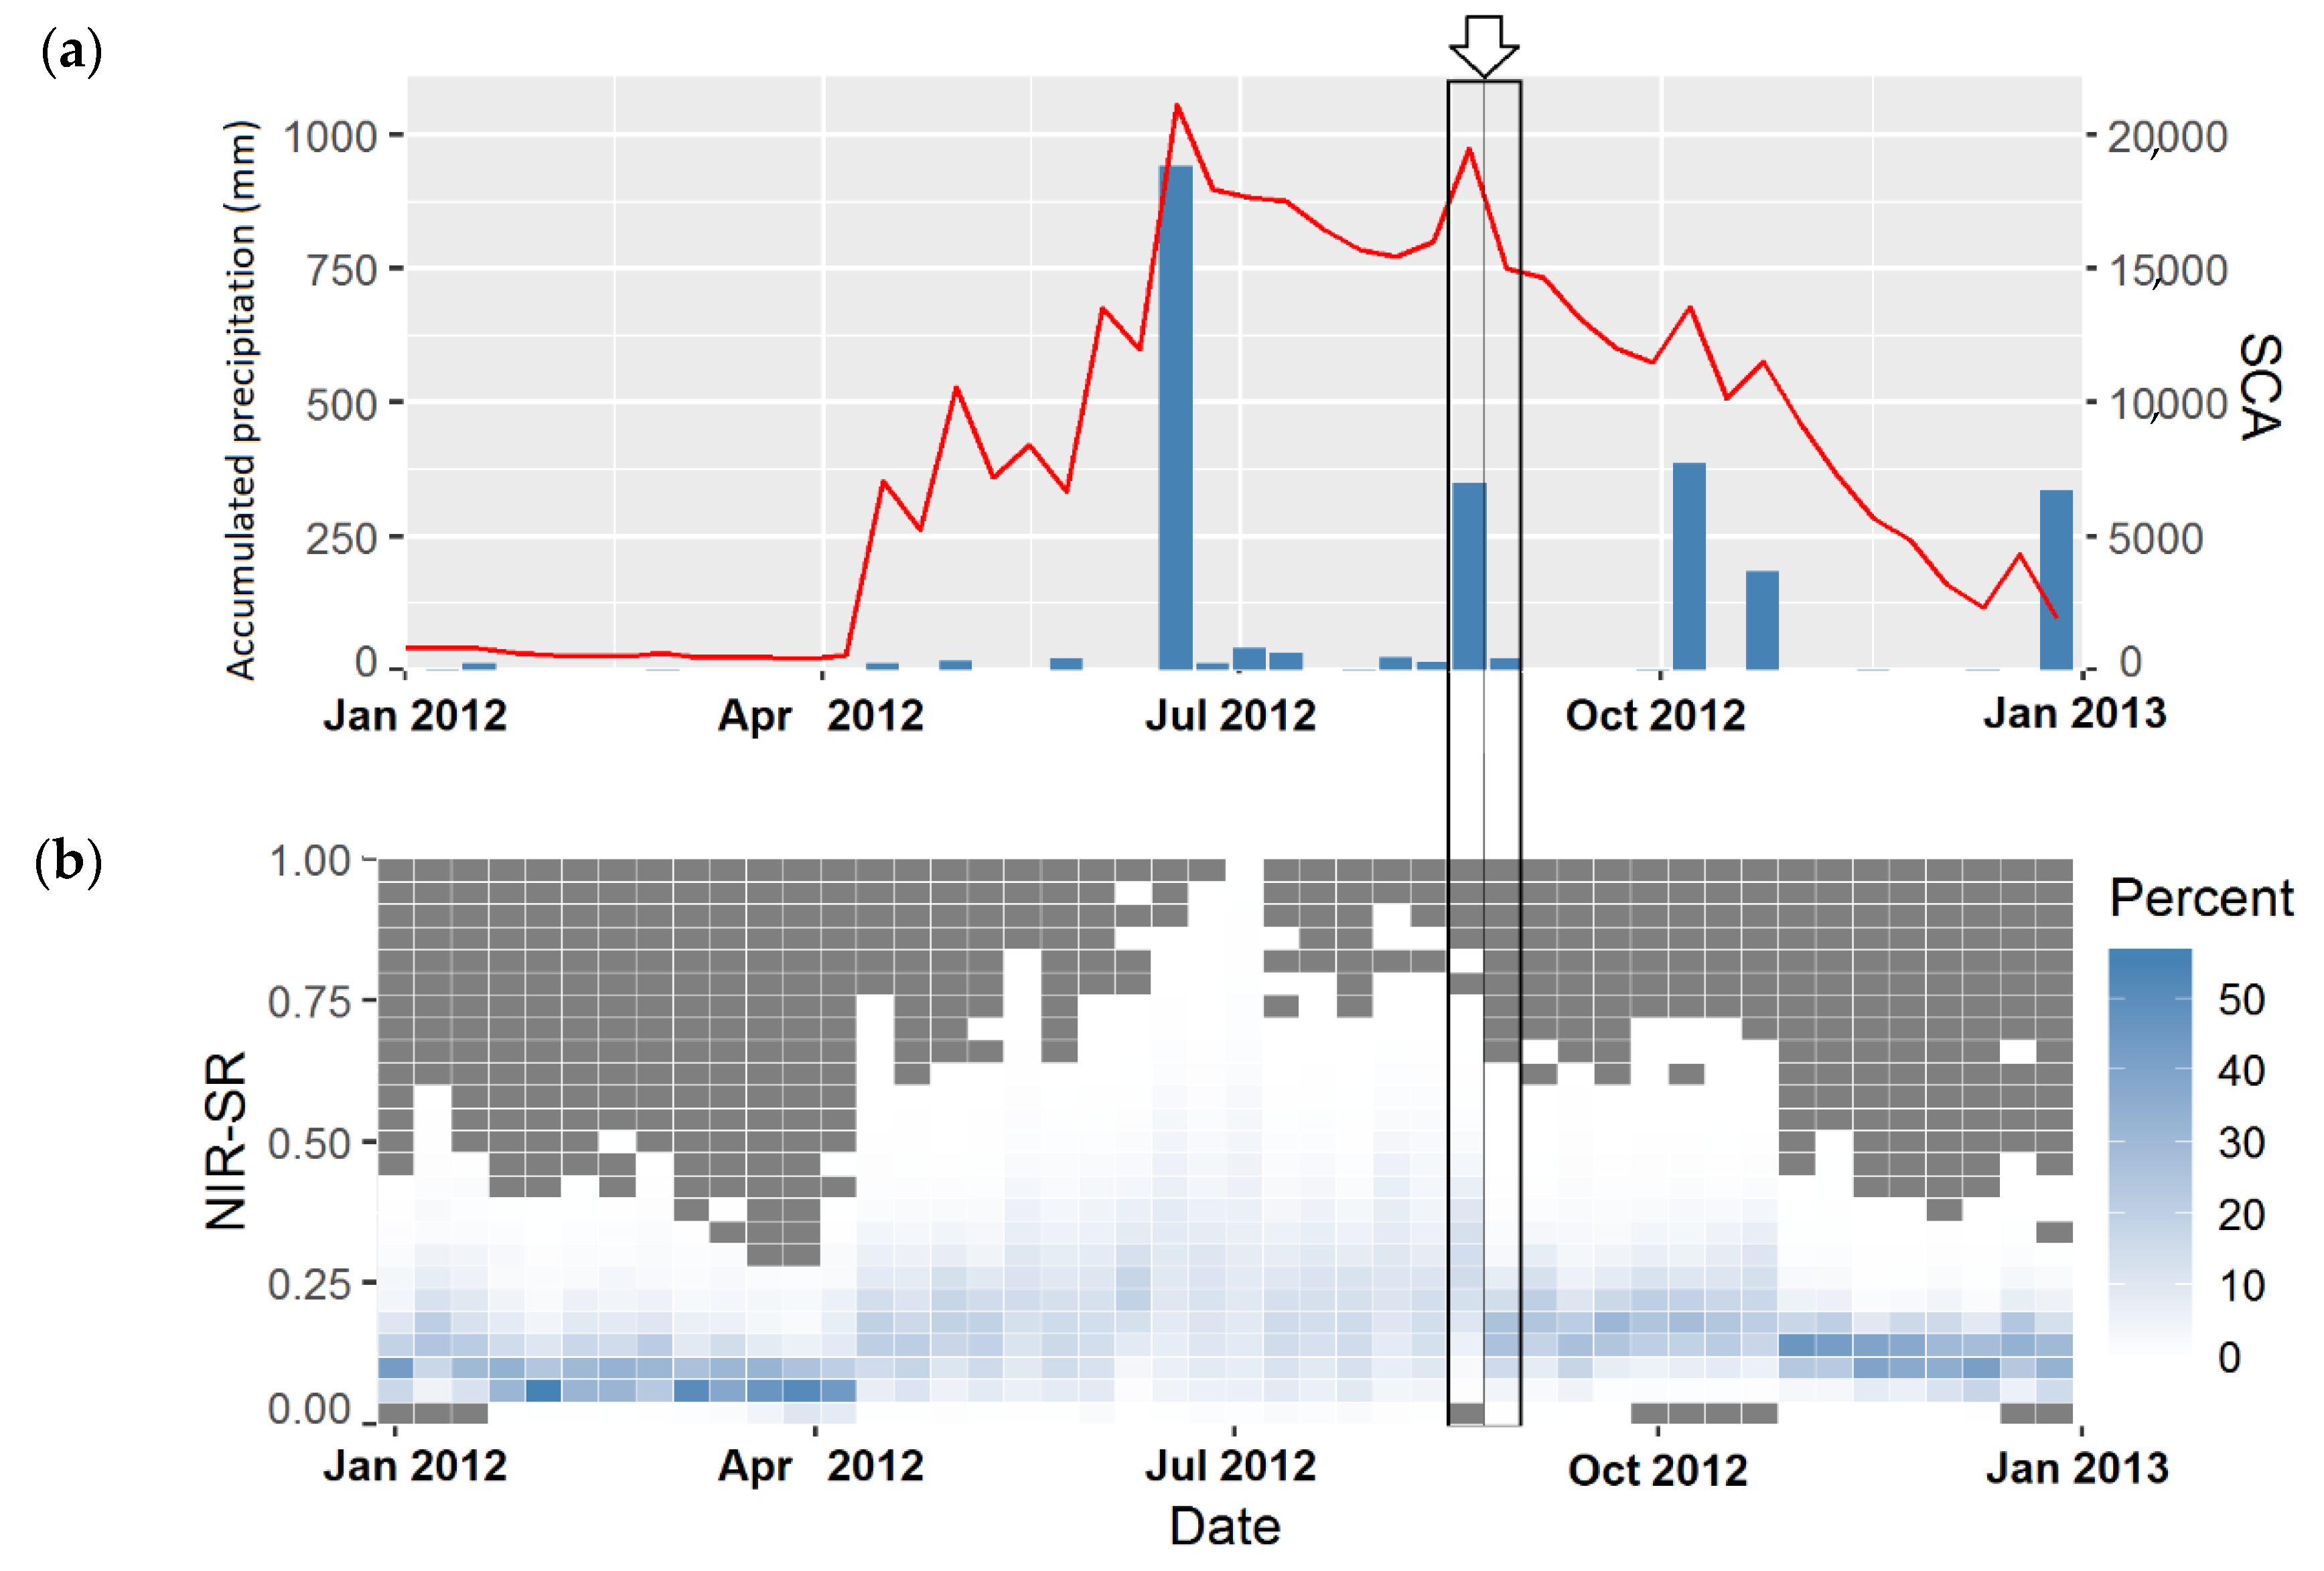
We used 678 MOD09A1 scenes covering the period 2001 to 2015 for the Maipo basin, to obtain a dataset of SCA, NIR-SR and accumulated precipitation, all in 8-day intervals. Each timestep was classified using the simple typology from Figure 2. For a closer look at the individual analysis of timesteps, Figure 4 shows an example of the arranged datasets to make specific events easy to spot. This figure shows the different SCA/NIR-SR responses to precipitation for the Maipo basin. The Figure is organized as follows:
- X-axis: From left to right, the X-axis is the same for both figures and represents the time steps in an 8-day interval to match the satellite products.
- Bottom figure: the figure uses a heatmap to display NIR-SR in the Y-axis from the lowest reflectance (0) at the bottom and the highest at the top (1). The NIR-SR histogram for each scene is displayed vertically in the heatmap using the color gradient, from white to blue, where the blue means a high frequency of pixels in that reflectance level. The grey pixels are null values where no NIR-SR was found.
- Top figure: two variables are displayed, using two distinct types of graphs: (a) the red line displays SCA as the number of pixels classified as snow, and (b) the blue bars display accumulated precipitation over 2 mm (selecting amounts over 2 mm and above 1000 mamsl to discard low-impact rain).
The patterns of snow accumulation over time can be observed by comparing the shift from one timestep to the next along the X axis. For most cases, precipitation is accompanied by a shift in snow reflectance and cover area (SCA and NIR-SR), consistent with a nival regime. For the year 2012, two events are highlighted where two distinct responses are clearly observed:
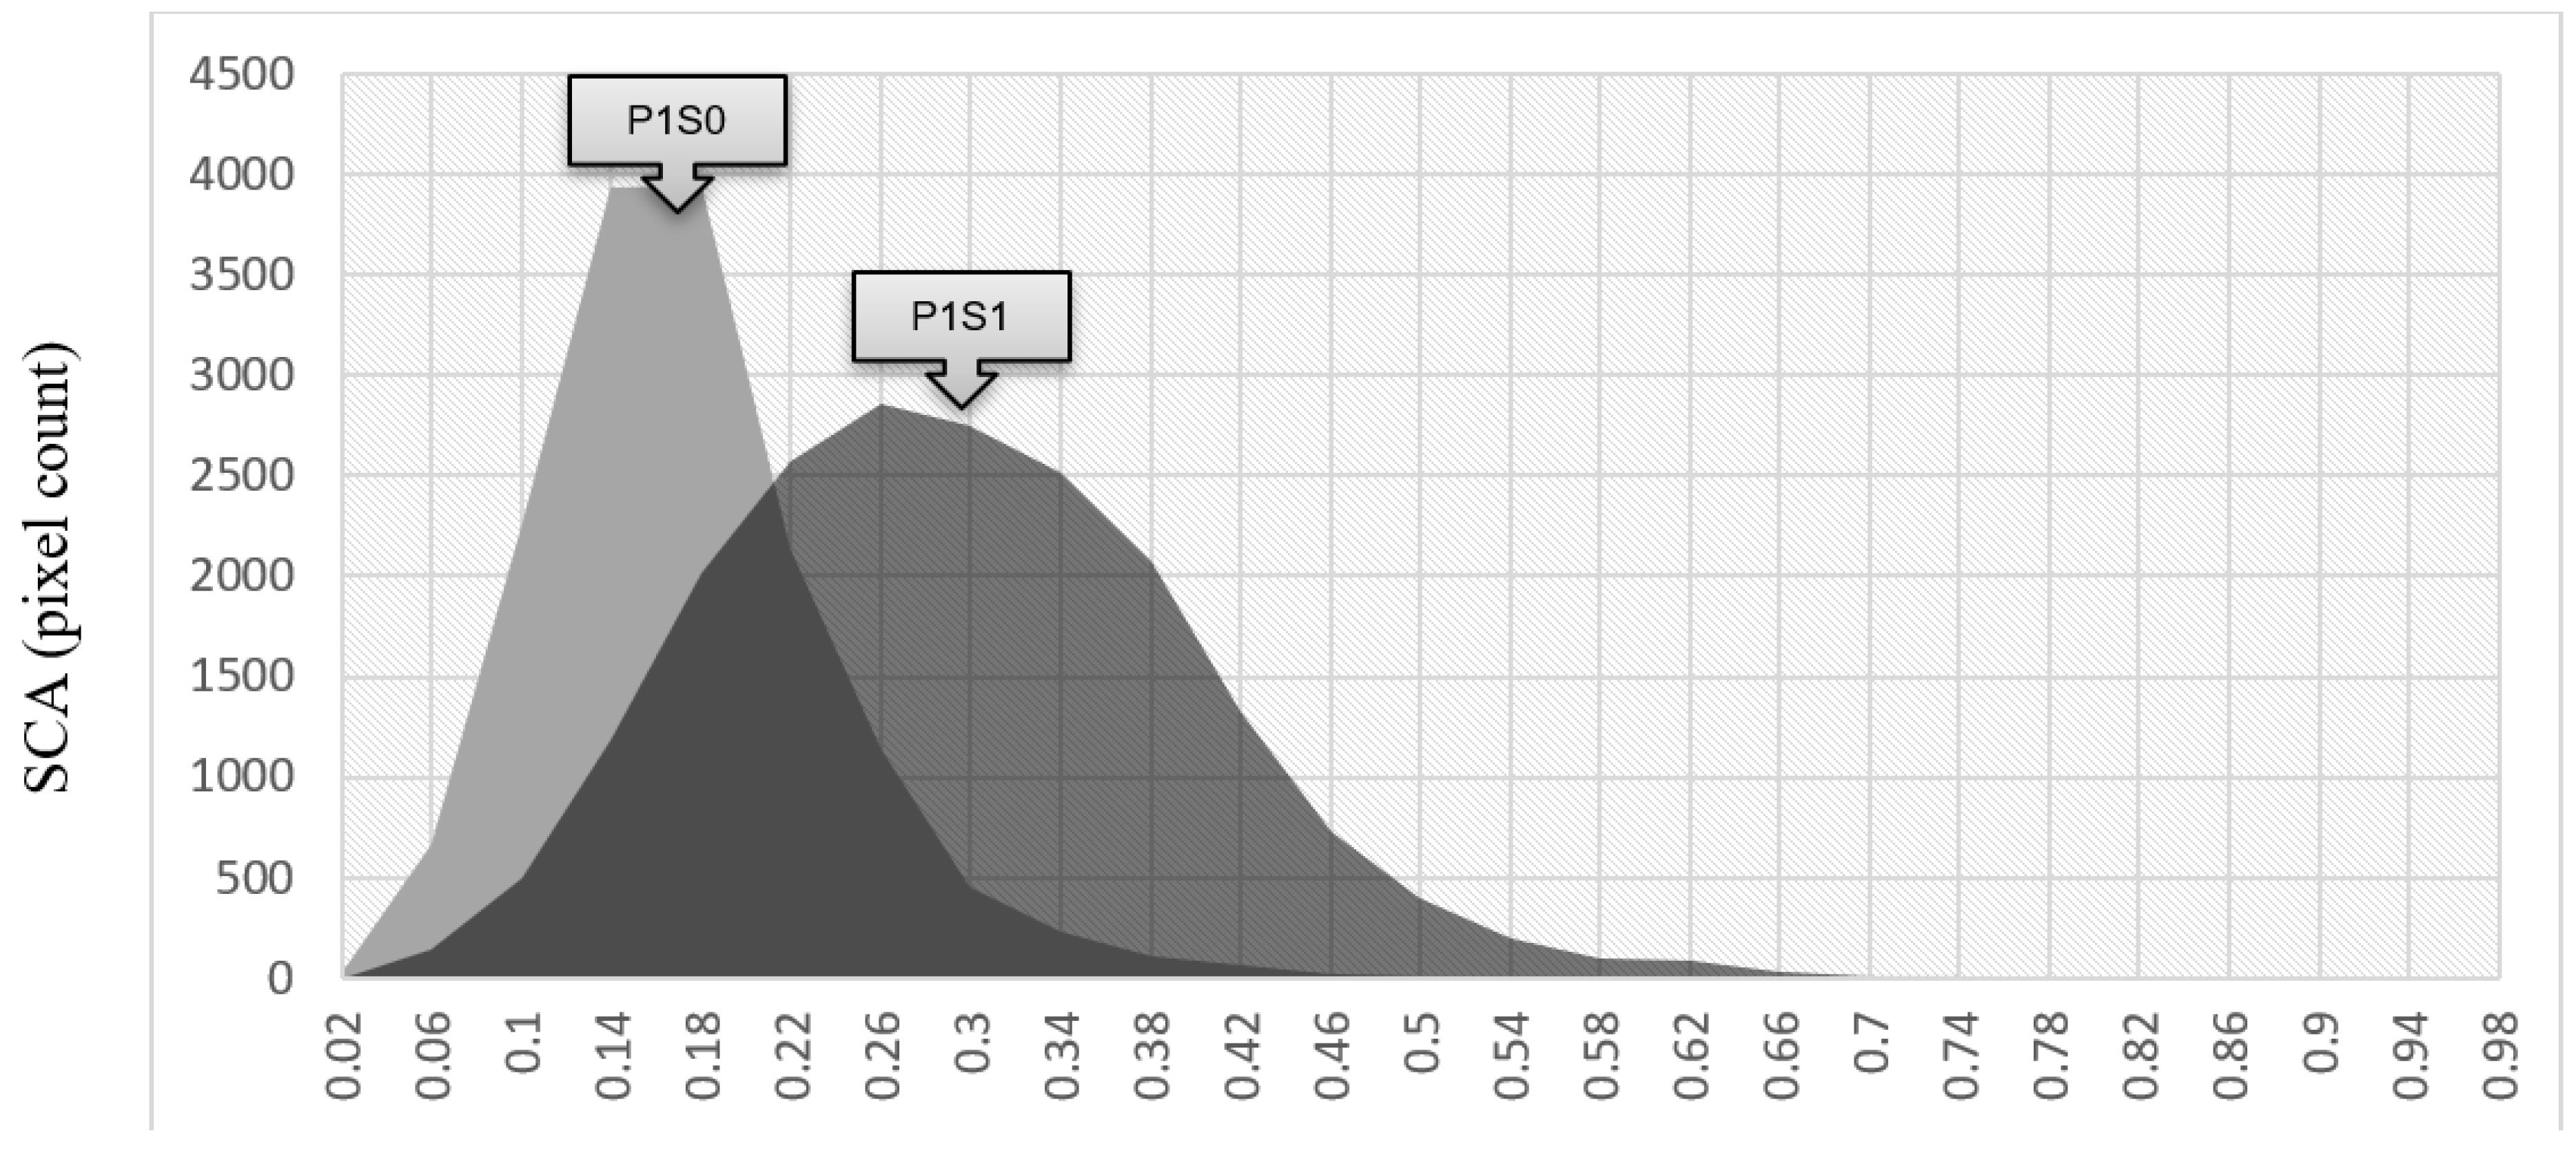
Two events are highlighted in Figure 4. The first one, when compared to the previous timestep, shows a normal response for P1S1 with increased high reflectance and snow cover, found in most events of precipitation during winter. However, we found some cases of reduced SCA and NIR-SR after a precipitation event classified as P1S0, highly suggestive of ROS events. The number of P1S0 cases vary between 3 and 10 events a year. However, this is not a clear indication of occurrence since this approach only looks at clear events in an 8-day window. In Figure 5, we take a closer look at the same two scenes from Figure 4 where distinctly different typologies are observed from their resulting snow reflectance distribution (NIR-SR).
The first event, classified as P1S1, is displayed in Figure 5 in a darker color. The second event is displayed in a lighter color and corresponds to the next timestep. The first event displays a normal-looking distribution of NIR-SR ranging between 20% and 40% reflectance, with a symmetric unimodal curve (skew and kurtosis close to zero). The second event is much more skewed, ranging between 10% and 30% reflectance, it has both lower mean and variance. Along with a reduction in SCA, the second event (displayed as P1S0) shows significant changes in the snowpack during a small window of time. These changes are very inconsistent with a snowfall but highly suggestive of ROS.
The mean, variance, skew, and kurtosis for NIR-SR were compared between events, focusing on the differences of snow (P1S1), melting (P0S1 and P0S0), and rain (P1S0). P1S1 events showed and overall higher mean and standard deviation, lower skewness, and kurtosis, the closest to a normal distribution. In P0 events (no precipitation), snow shows either slight changes in moments with no large deviations from fresh conditions (P0S1) or stronger metamorphism (P0S0), often found at the end or beginning of winter. Moments for P1S0 event distribution (likely ROS) show strong changes in NIR-SR, even after precipitation that ought to add fresh snow.
Without assuming a normal distribution for the Mean, Variance, Kurtosis and Skewness of P1S1 and P1S0 events, each distribution moment was compared between types of events using both the Mann-Whitney U and Kolmogorov-Smirnov tests. These are non-parametric tests [49,87] used to determine if two sets of data are significantly different, in this case, P1S1 and P1S0 events (Table 1).
High W values for the Mann-Whitney U test and close to 0 values for the D Kolmogorov-Smirnov test indicate the goodness of fit and suggest P1S0 and P1S1 belong to two different types of precipitation. The p-value for all four moments is below 0.0001, rejecting the null hypotheses of P1S1 being equal to P1S0. The results show two significantly different reflectance distributions for precipitation events, one closely related to snow precipitation (P1S1) and the other the likely result of ROS (P1S0). Higher NIR-SR variance and mean, with a lower skew and kurtosis, closely resembling a normal distribution around a reflectance of 30%, are characteristic of P1S1 events. P1S0 events had significantly lower means and variance, with higher skew and kurtosis.
3.2. Characteristics and Patterns
Unlike the previous precipitation data that was aggregated for the 8-day interval, here we used daily precipitation around the 8-day interval to observe changes in minimum and maximum temperature before and after the event. For most P1S0 events in the database, at least one precipitation day inside the 8-day window showed increased temperature leading up to it. We labeled such days as day-0 and tested the changes in daily maximum and minimum temperature on surrounding days for significant differences using t-tests (Table 2).
Both daily maximum and minimum temperature were observed to have increase briefly, leading up to an event, and subsequently decrease. Minimum temperature shows a higher increase, suggesting a lower temperature amplitude during warmer rain events. A temperature increase, by itself, could directly cause the changes observed in snow for P1S0 events, but this is very unlikely for a snowpack between 4000 and 6000 m.a.m.s.l., at least 2000 meters above the winter ZDI.
River-flow changes were tested using seven gauging stations situated above 1000 m.a.m.s.l. in the Maipo basin, comparing the two major sub-basins (the Mapocho and Maipo). The Mapocho sub-basin is smaller in size and elevation, closer to the ZDI, and further north in the aridity gradient of Central Chile. The effects of the transition to rain between these sub-basins should be different. A four-day interval was used to analyze and test for differences in river-flow between the day prior and the two days following each precipitation event (Table 3).
While no responses were observed for the Mapocho sub-basin, positive responses (albeit non-significant) were found in the Maipo sub-basin. Only three stations (Rio Maipo en las Hualtatas, Rio Maipo en San Alfonso, Rio Volcan en Queltehues), showed significant increases in river-flow after day-0. The results suggest that no immediate general response to river-flow is caused by ROS, but large peak-flows can occur in subsequent days in certain cases. For the Mapocho sub-basin some outliers, whose river flow values were over 300% increase after an event, had to be removed from the analysis because the basin is located at lower elevation and shows pluvial events early and late in the winter. This is not suggestive of ROS all by itself, but when considered in the context of the changes in extent and state of snow presented by the typology in Figure 2, it adds validity the claim that P1S1 and P1S0 events are indeed different from each other.
4. Discussion
Based on the proposed typology [10,50,61,66], between 2001 and 2015 in the Maipo River basins, remote sensing of extent (SCA) and state of snow (NIR-SR) showed two different responses to precipitation. Snowfall was identified by an increase SCA and NIR-SR after a precipitation, with NIR-SR 20 to 40% reflectance, low kurtosis, and skewness. Likely ROS events were identified by a reduction in SCA and NIR-SR after a precipitation, with a NIR-SR below 30%, high skew and kurtosis. This is consistent with the theory of the effect of liquid water on snow [10,17,50,65]. There is a clear difference in the distribution moments between fresh snow and likely ROS, and between likely ROS and normal metamorphism. The distribution moments of likely ROS events are more similar to the snowmelt metamorphism observed at the end of the season.
Moreover, some changes in weather, and hydrology suggested by theory [7,16,27,55] were observed, before and after the occurrence of the selected ROS events. A significant increase in maximum and minimum temperature was observed in the two days prior to most ROS events, followed by a decrease in both. A temperature increase, by itself, could cause the changes observed in snow for P1S0 events, but this is very unlikely for a snowpack between 4000 and 6000 m.a.m.s.l., at least 2000 meters above the winter ZDI. This temperature increase prior to the event suggests the possibility of eventual prediction.
No clear immediate river-flow response was observed. But the more dramatic effects (like river flow surges) commonly associated with ROS, are mostly found in the more extreme and easily observed events. We believe these events more frequent than perceived but less intense, often going unnoticed.
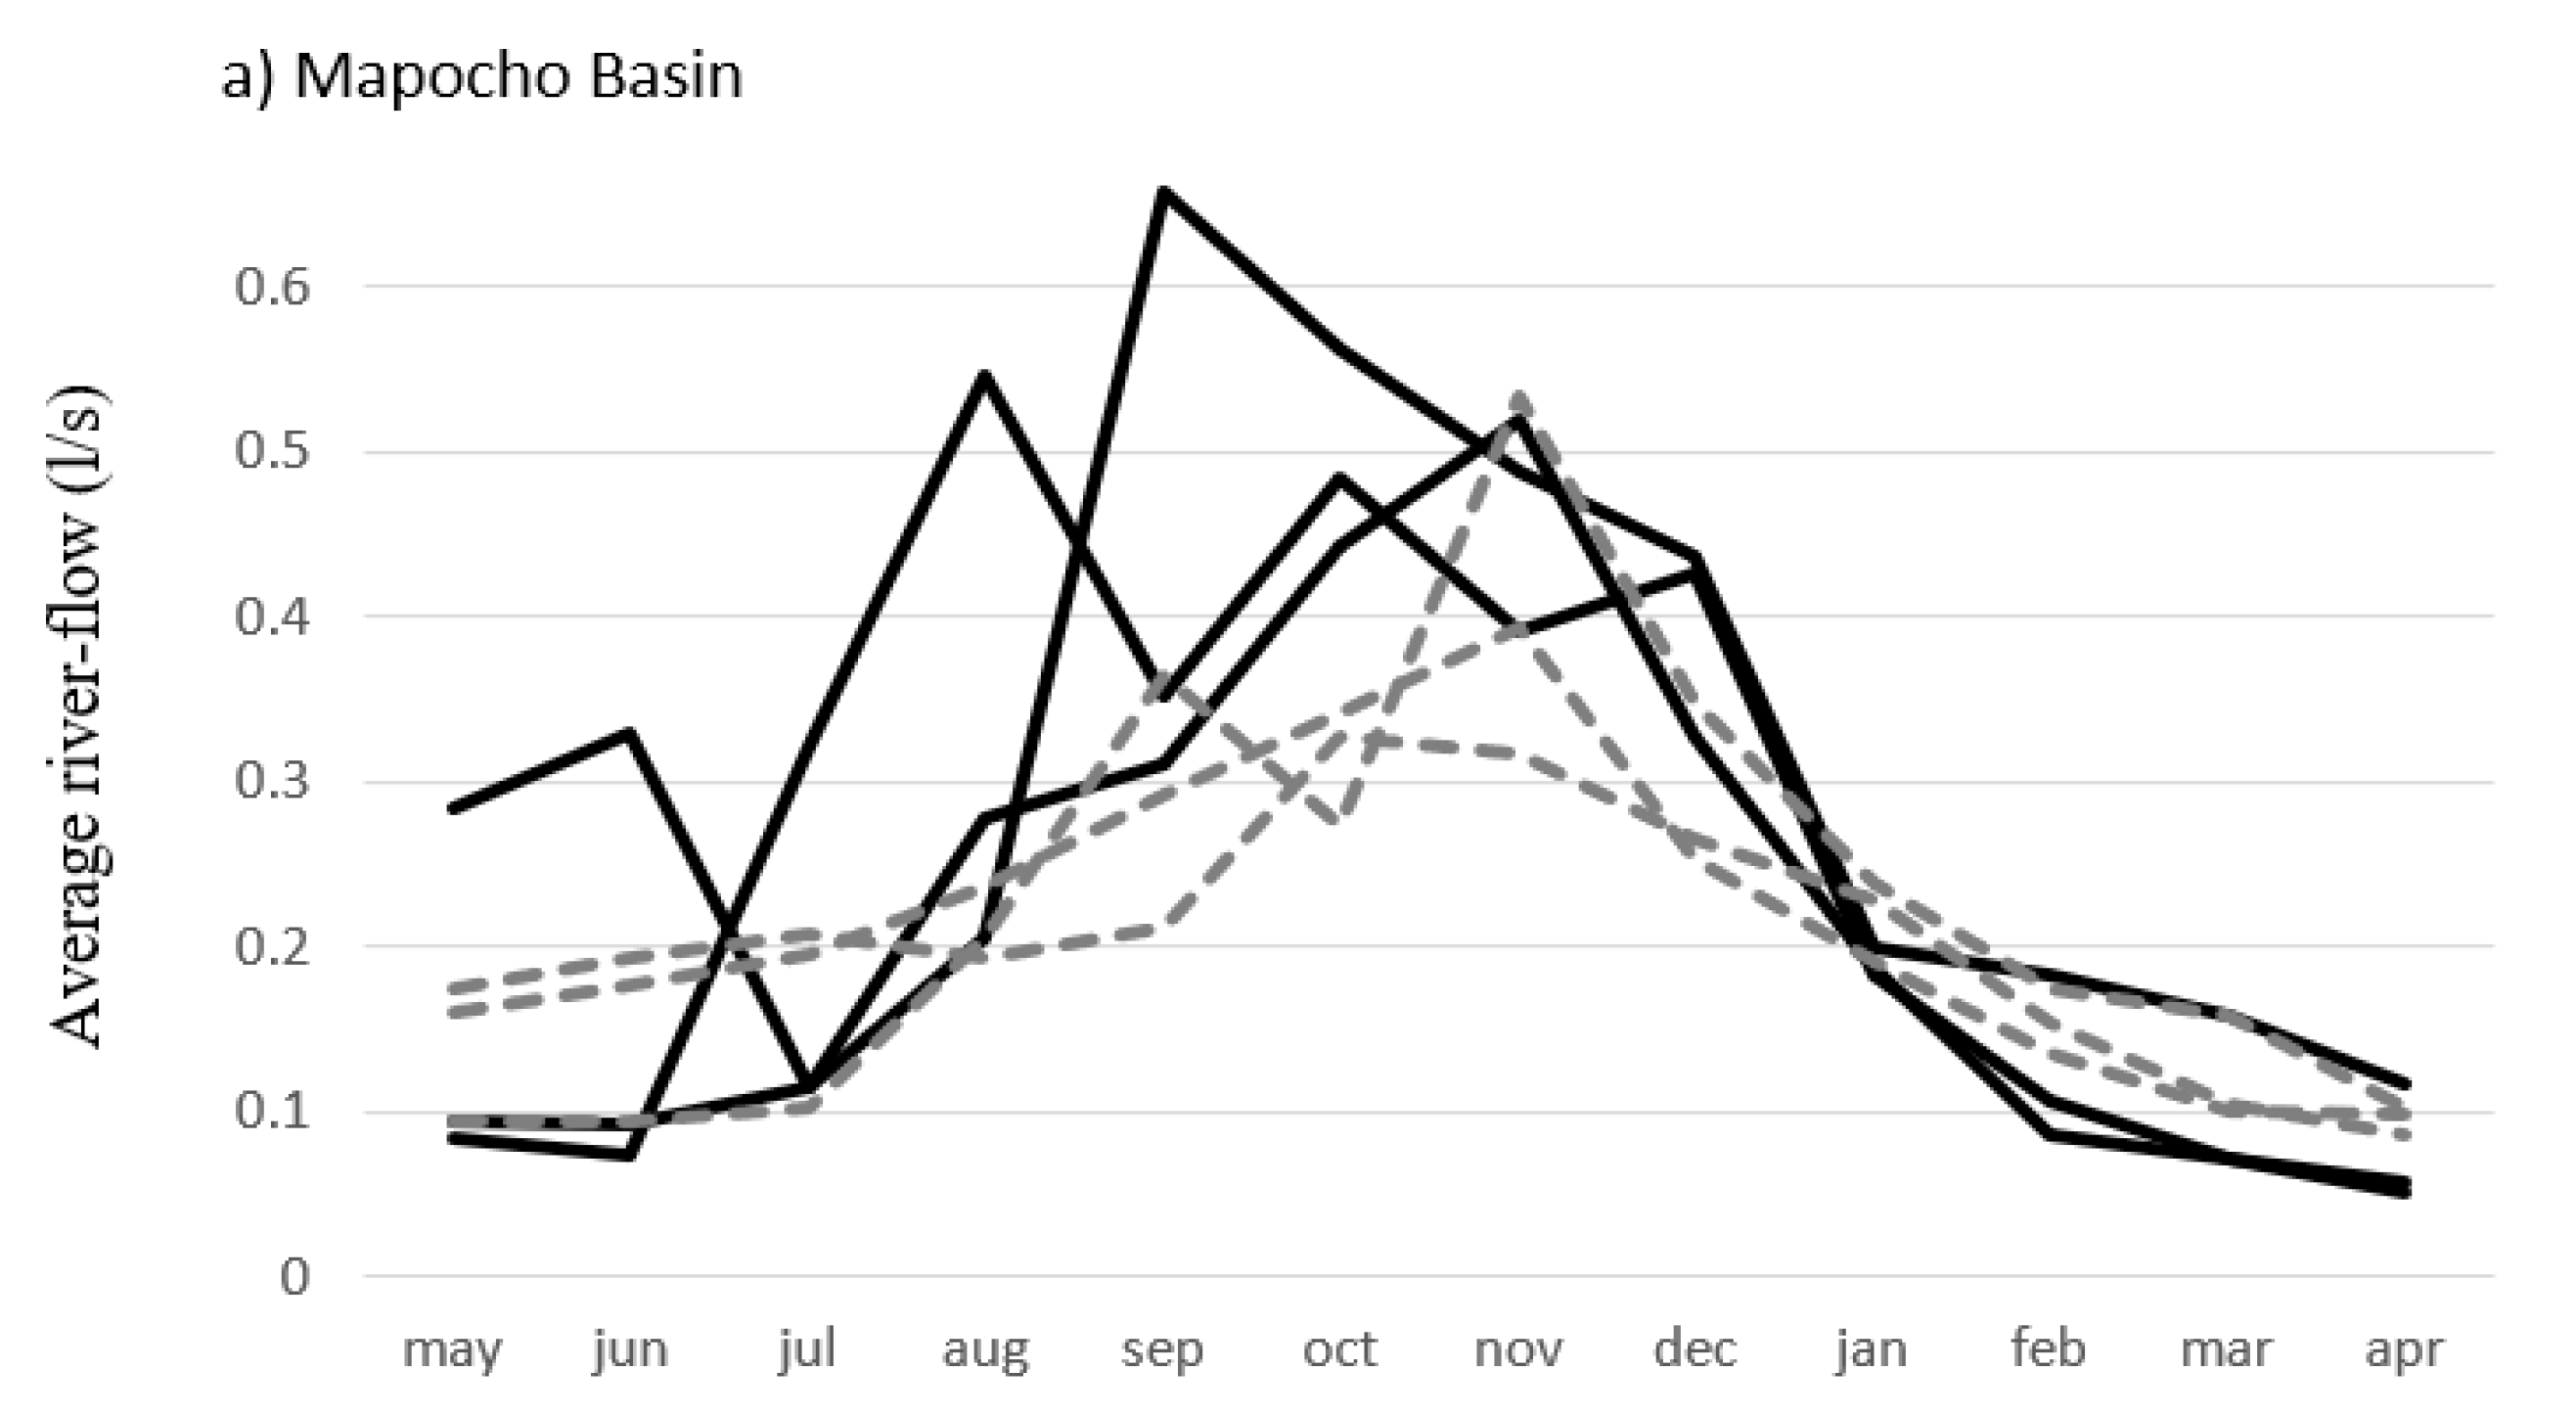
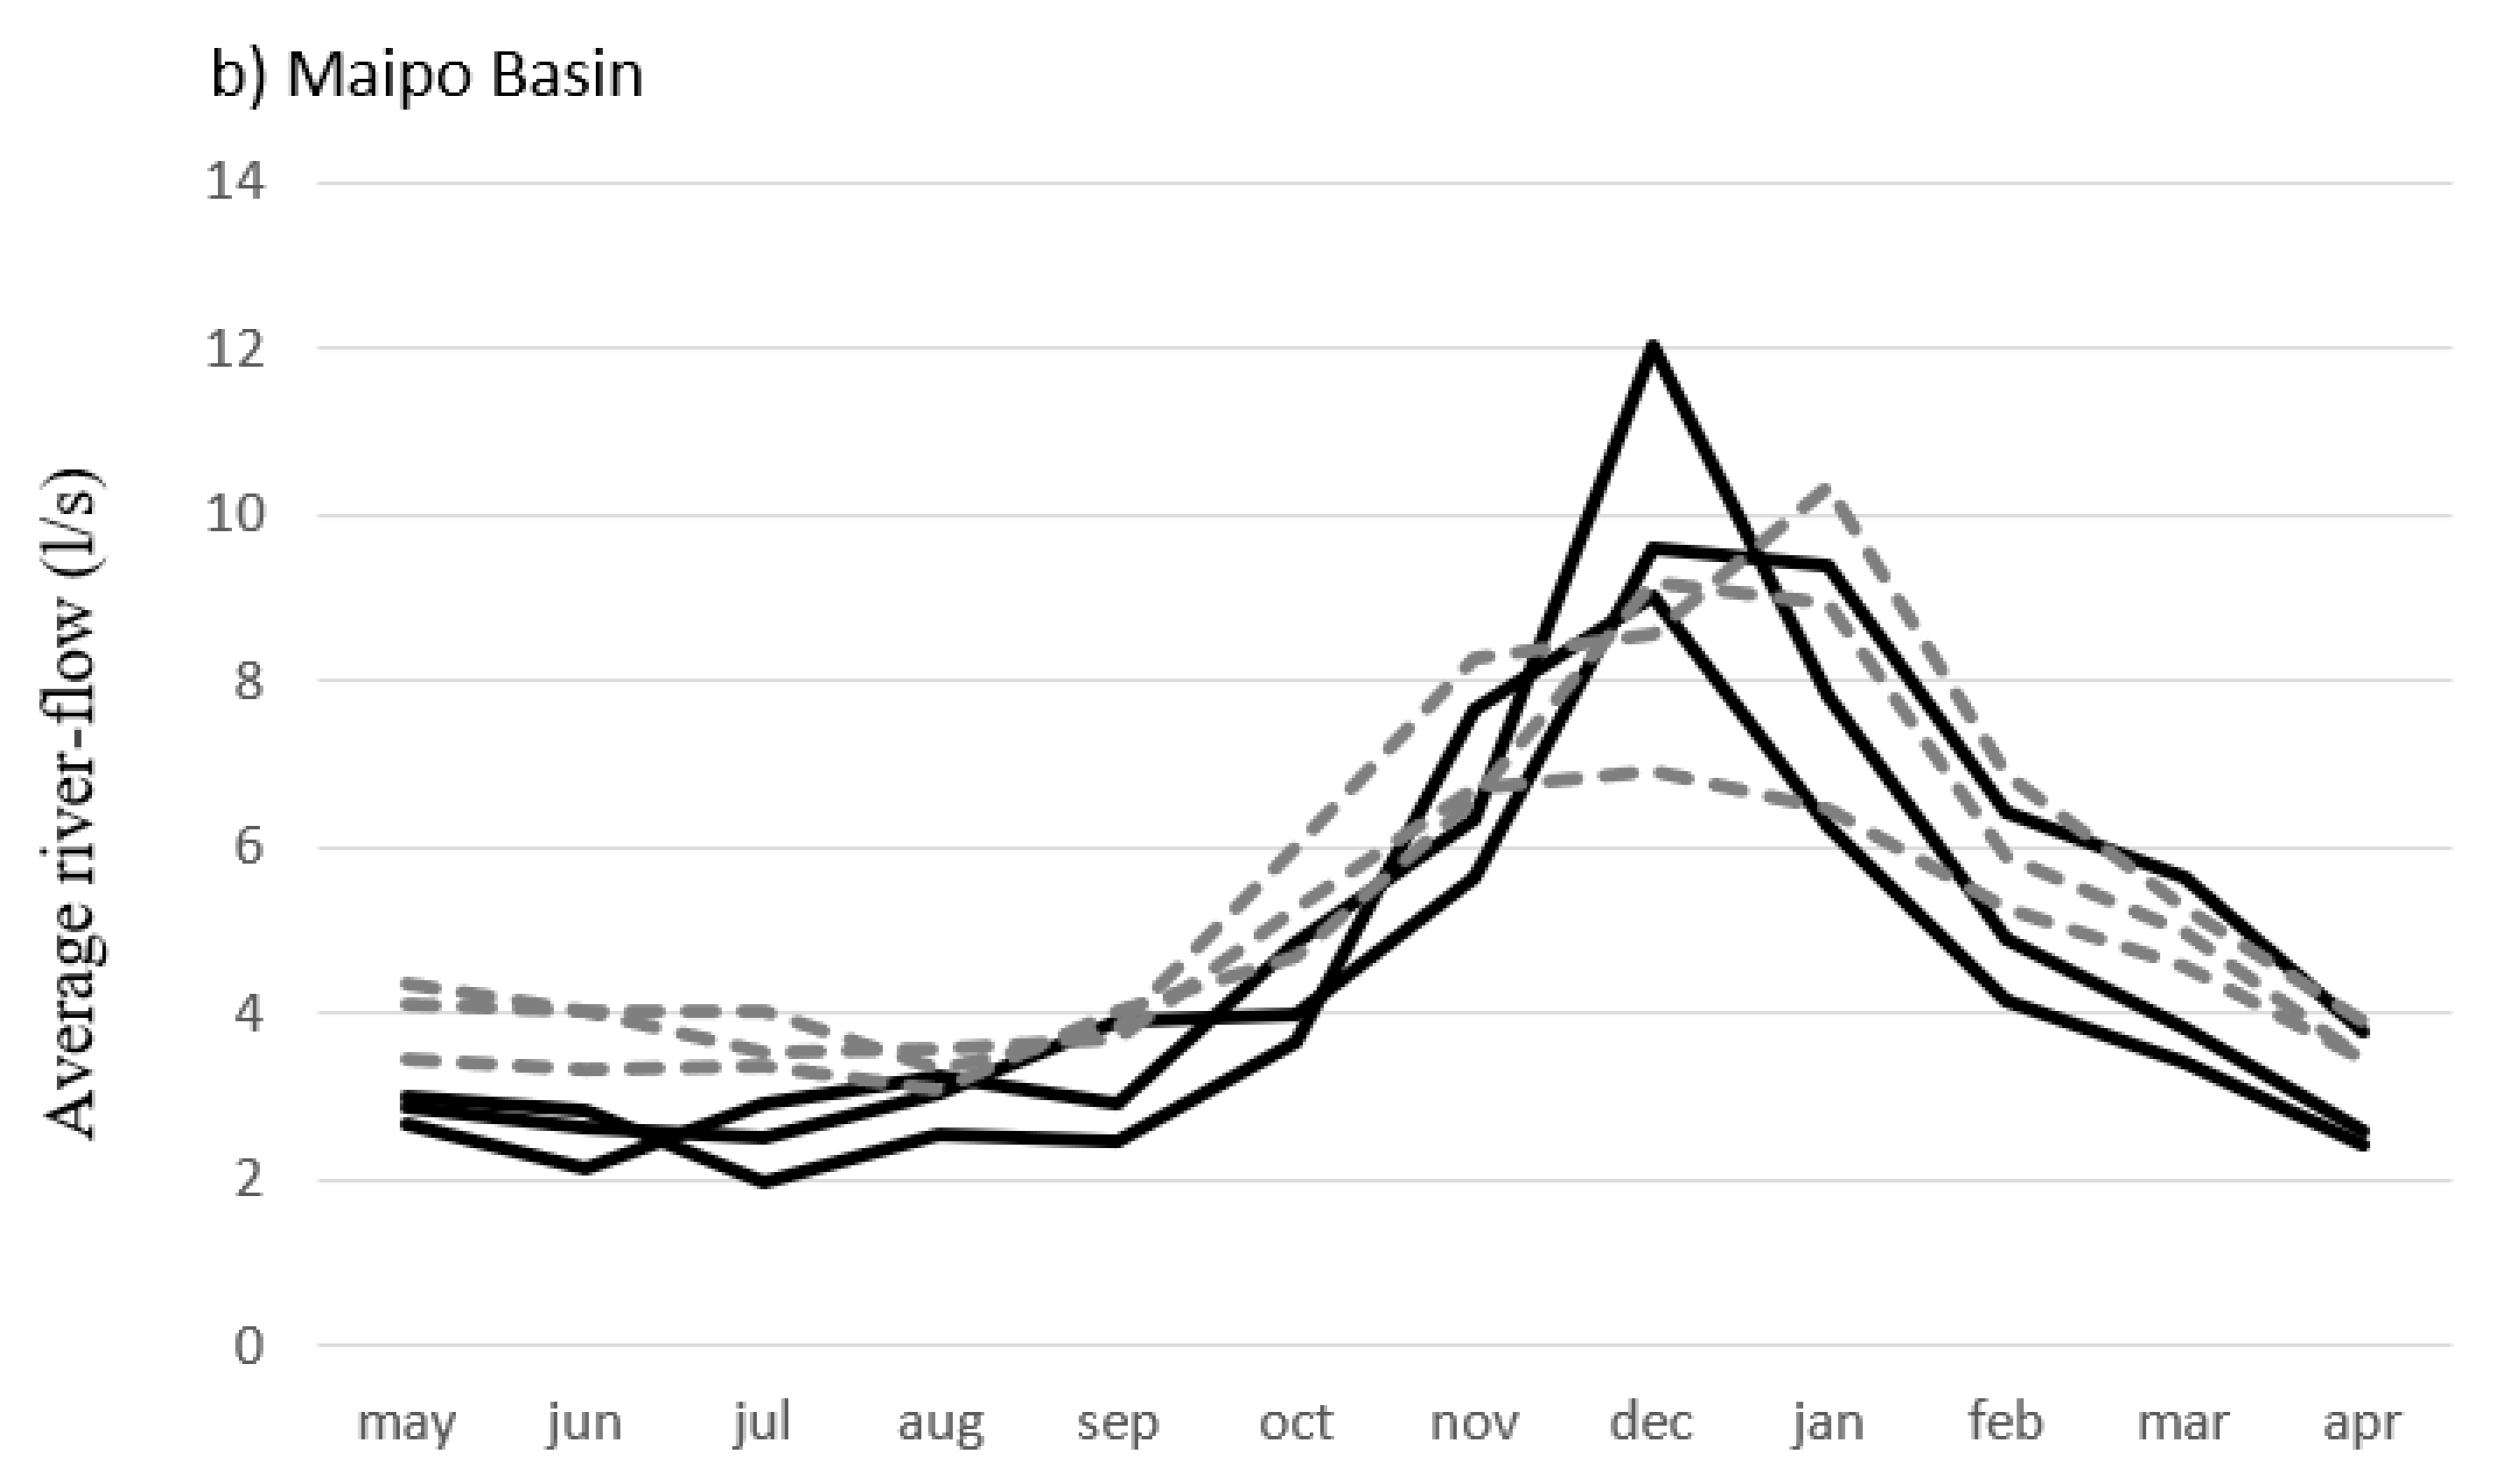
To further discuss the possibility of cumulative effects, a simple comparison was done for the spring-summer river-flow of years with more frequent (likely) ROS events and years with less. This comparison was applied to the sub-basins to observe the difference in response between them. The Mapocho sub-basin is smaller in size and elevation, closer to the ZDI, and further north in the aridity gradient of Central Chile. It is also less dependent on snow accumulation. We examined the effects of high (≥10 P1S0/year) and low (5–6 P1S0/year) occurrence of P1S0 on snowmelt using hydrographs for two stations (Mapocho sub-basin: Los Almendros and Maipo sub-basin: El Manzano; Figure 6).
There are some clear differences in river-flow between years with high and low occurrences of P1S0 events. With a mostly pluvial regime, the Mapocho river has several peak events before summer melting (Figure 6a). The Maipo sub-basin shows a normal-shaped hydrograph with a unimodal peak, more closely related to snowmelt-driven hydrology (Figure 6b). This is likely due to the lower altitude of the Mapocho sub-basin in relation to the ZDI, causing immediate snowmelt with less changes in the later melting period ROS events affect both sub-basins, with higher peak values associated with more ROS events. The Maipo shows a more skewed hydrograph and slightly earlier rise in river-flow with more ROS events. However, the number of detected events is not a clear indication of occurrence since this approach only looks at clear events in an 8-day window and requires a more detailed analysis before exploring cumulative effects of ROS.
There are, however, important sources of error and uncertainty that need to be stated and further explored. The lack of high-elevation weather stations meant that this analysis had to be based on lower altitude data (but over 1000 m.a.m.s.l.). Remote sensing and reanalysis spatial products for precipitation are too coarse and not a good indicator of weather conditions in the Andes. For the analysis, no direct or remote observation of precipitation was done on the mountain range. We build on the assumption that winter frontal storms in central Chile ascend over the Andes, as suggested in the literature [63,93]. We observed snow (SCA) respond to most precipitation records in the low elevation stations, which supports the assumption for frontal storms. This is common problem around the world and any approach that aims at past events needs to overcome the limitation with sturdier analysis. If precipitation did not in fact reach the snowpack in the mountain, P0S1 or P0S0 events can be mistaken for P1S0. However, the abrupt changes observed in those events is significantly different to those of normal winter snow metamorphism. It is unlikely that precipitation detected in a lower elevation station was not involved in the changes observed in the snow further up in the basin. Rain remains the most consistent explanation for the observed rapid metamorphism.
Other sources of uncertainty are the specific sensor limitations like bidirectional reflectance effects, cloud cover, frequency of observation and other sources of grain size increase. The influence of surface roughness on the bidirectional reflectance of snow for viewing geometries over rough terrain are mostly negligible for near-nadir but not for off-nadir sensors [89,90,91]. Thus, a comparison between a series of images needs to account for time of collection. The surface reflectance obtained from the MOD09A1 [70,72,76,77] products can still be affected be affected by atmospheric correction, water, aerosol loading, geometry, vegetation, and ageing of snow [70,74,75]. This study attempted to avoid some sources of error by only observing high elevation without significant vegetation and water bodies, while focusing on areas of seasonal snow with less influence from pollution. The main limitation of the MOD09A1 [70,71,72,77] is the 8-day interval that provides a composite of images that are likely to miss important changes in snow. Within this interval, rain effects can be covered by subsequent snowfall and events can go undetected, leading to False Negatives.
Without in situ grain size measurements and calibrations, we observed the changes on NIR reflectance after precipitation as the most significant response to rain or snow, suggesting the changes in grain size from metamorphism. Only the surface snow metamorphism is observable by remote sensing and new snow will reset the observable metamorphism. Near-infrared bands can reach up to approximately 3 cm, but different bands can reach different snowpack depth and respond to different grain sizes [50,92]. As an initial study it was decided to build upon single-bland measurements, but further studies should explore a sturdier multi-band ratio approach with in-situ hyperspectral calibration.
5. Conclusions
Under normal winter conditions precipitation is expected to contribute fresh snow with a high NIR reflectance that is gradually reduced over time due to snow metamorphism. This gradual reduction in NIR reflectance is reset after each winter snowfall, and only reaches significantly low reflectance levels at the end of winter when snow precipitation stops and temperature increases. However, we detected two different responses to winter precipitation with significantly different reflectance distributions. One of those is inconsistent with what is expected from a winter nival regime, and highly suggestive of the effects of rain on snow [7,16,25,32]. Moreover, most of these events were preceded by an increase in maximum and minimum temperature, followed by a decrease in both. Changes in river flow were less consistent but only expected from intense ROS events where snowmelt is accelerated. River flow surges are commonly associated with ROS in the more extreme and easily observed events. We believe ROS events more frequent than perceived but less intense, often going unnoticed.
The aim, however, is not a detection scheme for all past events but to discern obvious rain from snow, contributing to the historical records of ROS events in poorly monitored areas. This study was focused on True Positives for past events, and a lot of exclusion had to be applied that needs to be addressed to avoid False Positives if this approach can support future detection schemes. Cloud remains a source of confusion if applied for detection [58], since it is causes high reflectance in the NIR, it can mask the viewing of snow and lead to False Negatives. Geometry, cloud cover and aerosol loading might still be a source of confusion that needs to be address in further studies to better define the range of values for NIR-SR [70,74]. Future detection schemes will require in situ validation, daily products and higher resolutions, multi-band indexes and multi-sensor integration, all validated against confirmed ROS events.
Significant efforts are being done to detect events and study its effects and dynamics. However, we believe a clear dataset and understanding of events are the missing link between detection, modelling, and forecasting. To the best of our knowledge, NIR reflectance has not been explored in the context of ROS events and remote sensing has not been used in the reconstruction of likely past events. This research presents a deductive approach to study rain-on-snow by exploring and highlighting likely past rain events on the Andean snowpack. The typology presented can be helpful in discerning the effects of snow from those of rain and natural melt. The responses in snow cover and reflectance to precipitation show that the designated typology and approach are useful to study rain-on-snow events in the absence of observation records, contributing valuable records and datasets to expand understanding. There are clear signs that ROS occur in the study area, even if they do not cause significant impact and can go unnoticed. This approach has the potential to support and explore the typification of events from historical data, which will contribute to the study and eventual understating of these events for future detection schemes and assessing climate change impacts on nival regimes. Clearly, a lot of work remains to be done but a clarity of the fingerprints left by rain on snow open the door for the next steps.
Author Contributions
Conceptualization, D.O.M. and F.J.M.; methodology, D.O.M. and F.J.M.; software, D.O.M.; validation, D.O.M. and F.J.M.; formal analysis, D.O.M. and F.J.M.; investigation, D.O.M. and F.J.M.; resources, F.J.M.; data curation, D.O.M.; writing—original draft preparation, D.O.M. and F.J.M.; writing—review and editing, D.O.M. and F.J.M.; visualization, D.O.M.; supervision, F.J.M.; project administration, F.J.M.; funding acquisition, F.J.M. All authors have read and agreed to the published version of the manuscript.
Funding
This work was supported by the International Water Security Network founded by the Lloyd’s Register Foundation, a charitable foundation helping to protect life and property by supporting engineering-related education, public engagement, and the application of research. We also received support from the Inter American Institute for Global Change Research (IAI) CRN3056, which is supported by the National Science Foundation [GEO-1128040] and from Fondecyt grant 1170429.
Acknowledgments
This work could not have been accomplished without the support from the Pontifical Catholic University of Chile, Agronomy Faculty, the Department of Ecosystems and Environment, the Global Climate Center and Climatology Laboratory. Additional thanks to Shaw Lacy for assistance with the manuscript.
Conflicts of Interest
The authors declare no conflict of interest.
References
- Thériault, J.M.; Milbrandt, J.A.; Doyle, J.; Minder, J.R.; Thompson, G.; Sarkadi, N.; Geresdi, I. Impact of melting snow on the valley flow field and precipitation phase transition. Atmos. Res. 2015, 156, 111–124. [Google Scholar] [CrossRef] [Green Version]
- Freudiger, D.; Kohn, I.; Stahl, K.; Weiler, M. Large-scale analysis of changing frequencies of rain-on-snow events with flood-generation potential. Hydrol. Earth Syst. Sci. 2014, 18, 2695–2709. [Google Scholar] [CrossRef]
- McCabe, G.J.; Clark, M.P.; Hay, L.E. Rain-on-snow events in the western United States. Bull. Am. Meteorol. Soc. 2007, 88, 319–328. [Google Scholar] [CrossRef]
- Ishii, Y.; Hirashima, H.; Yamaguchi, S.; Macdonald, H. Snow hydrological impacts due to rain-on-snow events. Low Temp. Sci. 2019, 77, 41–48. [Google Scholar] [CrossRef] [Green Version]
- Lliboutry, L. Glaciers of the dry Andes. In Satellite Image Atlas of Glaciers of the World: South America; United States Government Printing Office: Washington, DC, USA, 1998; pp. I1–I206. [Google Scholar]
- Marks, D.; Winstral, A.; Reba, M.; Pomeroy, J.; Kumar, M. An evaluation of methods for determining during-storm precipitation phase and the rain/snow transition elevation at the surface in a mountain basin. Adv. Water Resour. 2013, 55, 98–110. [Google Scholar] [CrossRef]
- Gellens, D.; Roulin, E. Streamflow response of Belgian catchments to IPCC climate change scenarios. J. Hydrol. 1998, 210, 242–258. [Google Scholar] [CrossRef]
- Mazurkiewicz, A.B.; Callery, D.G.; McDonnell, J.J. Assessing the controls of the snow energy balance and water available for runoff in a rain-on-snow environment. J. Hydrol. 2008, 354, 1–14. [Google Scholar] [CrossRef]
- Déry, S.J.; Salomonson, V.V.; Stieglitz, M.; Hall, D.K.; Appel, I. An approach to using snow areal depletion curves inferred from MODIS and its application to land surface modelling in Alaska. Hydrol. Process. 2005, 19, 2755–2774. [Google Scholar] [CrossRef]
- Pomeroy, J.; Brun, E. Physical properties of snow. In Snow Ecology: An Interdisciplinary Examination of Snow-Covered Ecosystems; Jones, H.G., Pomeroy, J.W., Walker, D.A., Hoham, R.W., Eds.; Cambridge University Press: Cambridge, UK, 2001; pp. 45–126. [Google Scholar]
- Qu, S.M.; Liu, H.; Cui, Y.P.; Shi, P.; Bao, W.M.; Yu, Z.B. Test of newly developed conceptual hydrological model for simulation of rain-on-snow events in forested watershed. Water Sci. Eng. 2013, 6, 31–43. [Google Scholar] [CrossRef]
- Kattelmann, R. Flooding from Rain-on-Snow Events in the Sierra Nevada; IAHS-AISH Publication: Anaheim, CA, USA, 1997; pp. 59–65. [Google Scholar]
- Surfleet, C.G.; Tullos, D. Variability in effect of climate change on rain-on-snow peak flow events in a temperate climate. J. Hydrol. 2013, 479, 24–34. [Google Scholar] [CrossRef] [Green Version]
- Conway, H.; Raymond, C.F. Snow stability during rain. J. Glaciol. 1993, 39, 635–642. [Google Scholar] [CrossRef] [Green Version]
- Singh, P.; Spitzbart, G.; Hübl, H.; Weinmeister, H.W. Hydrological response of snowpack under rain-on-snow events: A field study. J. Hydrol. 1997, 202, 1–20. [Google Scholar] [CrossRef]
- Surfleet, C.G.; Tullos, D. Uncertainty in hydrologic modelling for estimating hydrologic response due to climate change (Santiam River, Oregon). Hydrol. Process. 2013, 27, 3560–3576. [Google Scholar] [CrossRef] [Green Version]
- Colbeck, S.C. Grain clusters in wet snow. J. Colloid Interface Sci. 1979, 72, 371–384. [Google Scholar] [CrossRef]
- Morán-Tejeda, E.; López-Moreno, J.; Stoffel, M.; Beniston, M. Rain-on-snow events in Switzerland: Recent observations and projections for the 21st century. Clim. Res. 2016, 71, 111–125. [Google Scholar] [CrossRef]
- Brunengo, M.J. A method of modeling the frequency characteristics of daily snow amount, for stochastic simulation of rain-on-snowmelt events. In Proceedings of the 58th Annual Western Snow Conference, Sacramento, CA, USA, 17–19 April 1990; pp. 110–121. [Google Scholar]
- Harr, R.D. Some characteristics and consequences of snowmelt during rainfall in western Oregon. J. Hydrol. 1981, 53, 277–304. [Google Scholar] [CrossRef]
- Harr, R.D. Effects of clearcutting on rain-on-snow runoff in western oregon: A new look at old studies. Water Resour. Res. 1986, 22, 1095–1100. [Google Scholar] [CrossRef]
- Jones, J.A.; Perkins, R.M. Extreme flood sensitivity to snow and forest harvest, western Cascades, Oregon, United States. Water Resour. Res. 2010, 46, 1–21. [Google Scholar] [CrossRef] [Green Version]
- Sandersen, F.; Bakkehøi, S.; Hestnes, E.; Lied, K. The influence of meteorological factors on the initiation of debris flows, rockfalls, rockslides and rockmass stability. Nor. Geotech. Inst. Oslo. Rep. 1997, 201, 97–114. [Google Scholar]
- Corripio, J.; López-Moreno, J. Analysis and Predictability of the Hydrological Response of Mountain Catchments to Heavy Rain on Snow Events: A Case Study in the Spanish Pyrenees. Hydrology 2017, 4, 20. [Google Scholar] [CrossRef] [Green Version]
- Eckhardt, K.; Ulbrich, U. Potential impacts of climate change on groundwater recharge and streamflow in a central European low mountain range. J. Hydrol. 2003, 284, 244–252. [Google Scholar] [CrossRef]
- Harder, P.; Pomeroy, J. Estimating precipitation phase using a psychrometric energy balance method. Hydrol. Process. 2013, 27, 1901–1914. [Google Scholar] [CrossRef]
- Yang, D.; Kane, D.L.; Hinzman, L.D.; Zhang, X.; Zhang, T.; Ye, H. Siberian Lena River hydrologic regime and recent change. J. Geophys. Res. Atmos. 2002, 107. [Google Scholar] [CrossRef]
- Sui, J.; Koehler, G. Rain-on-snow induced flood events in southern Germany. J. Hydrol. 2001, 252, 205–220. [Google Scholar] [CrossRef]
- Cohen, J.; Ye, H.; Jones, J. Trends and variability in rain-on-snow events. Geophys. Res. Lett. 2015, 42, 7115–7122. [Google Scholar] [CrossRef] [Green Version]
- Pall, P.; Tallaksen, L.M.; Stordal, F. A climatology of rain-on-snow events for Norway. J. Clim. 2019, 32, 6995–7016. [Google Scholar] [CrossRef]
- Ye, H.; Cohen, J. A shorter snowfall season associated with higher air temperatures over northern Eurasia. Environ. Res. Lett. 2013, 8. [Google Scholar] [CrossRef]
- Ye, H.; Yang, D.; Robinson, D. Winter rain-on-snow and its association with air temperature in northern Eurasia. Hydrol. Proc. 2008, 22, 2728–2736. [Google Scholar] [CrossRef] [Green Version]
- Bieniek, P.A.; Bhatt, U.S.; Walsh, J.E.; Lader, R.; Griffith, B.; Roach, J.K.; Thoman, R.L. Assessment of Alaska rain-on-snow events using dynamical downscaling. J. Appl. Meteorol. Climatol. 2018, 57, 1847–1863. [Google Scholar] [CrossRef]
- Il Jeong, D.; Sushama, L. Rain-on-snow events over North America based on two Canadian regional climate models. Clim. Dyn. 2018, 50, 303–316. [Google Scholar] [CrossRef] [Green Version]
- Musselman, K.N.; Lehner, F.; Ikeda, K.; Clark, M.P.; Prein, A.F.; Liu, C.; Barlage, M.; Rasmussen, R. Projected increases and shifts in rain-on-snow flood risk over western North America. Nat. Clim. Chang. 2018, 8, 808–812. [Google Scholar] [CrossRef]
- Ohba, M.; Kawase, H. Rain-on-Snow events in Japan as projected by a large ensemble of regional climate simulations. Clim. Dyn. 2020, 55, 2785–2800. [Google Scholar] [CrossRef]
- Pan, C.G.; Kirchner, P.B.; Kimball, J.S.; Kim, Y.; Du, J. Rain-on-snow events in Alaska, their frequency and distribution from satellite observations. Environ. Res. Lett. 2018, 13. [Google Scholar] [CrossRef] [Green Version]
- Carrasco, J.F.; Casassa, G.; Quintana, J. Changes of the 0 °C isotherm and the equilibrium line altitude in central Chile during the last quarter of the 20th century. Hydrol. Sci. J. 2005, 50, 933–948. [Google Scholar] [CrossRef]
- Casassa, G.; Rivera, A.; Escobar, F.; Acuña, C.; Carrasco, J.; Quintana, J. Snow line rise in central Chile in recent decades and its correlation with climate. Geophys. Res. Abs. 2003, 5, 14395. [Google Scholar] [CrossRef]
- Nayak, A.; Marks, D.; Chandler, D.G.; Seyfried, M. Long-term snow, climate, and streamflow trends at the reynolds creek experimental watershed, Owyhee Mountains, Idaho, United States. Water Resour. Res. 2010, 46. [Google Scholar] [CrossRef]
- Valdés-Pineda, R.; Pizarro, R.; García-Chevesich, P.; Valdés, J.B.; Olivares, C.; Vera, M.; Balocchi, F.; Pérez, F.; Vallejos, C.; Fuentes, R.; et al. Water governance in Chile: Availability, management and climate change. J. Hydrol. 2014, 519, 2538–2567. [Google Scholar] [CrossRef]
- Rivera, A.; Acuna, C.; Casassa, G.; Bown, F. Use of remotely sensed and field data to estimate the contribution of Chilean glaciers to eustatic sea-level rise. Ann. Glaciol. 2002, 34, 367–372. [Google Scholar] [CrossRef] [Green Version]
- Bradley, R.S.; Keimig, F.T.; Diaz, H.F. Projected temperature changes along the American cordillera and the planned GCOS network. Geophys. Res. Lett. 2004, 31, 2–5. [Google Scholar] [CrossRef] [Green Version]
- Fang, X.; Pomeroy, J.W.; Ellis, C.R.; MacDonald, M.K.; Debeer, C.M.; Brown, T. Multi-variable evaluation of hydrological model predictions for a headwater basin in the Canadian Rocky Mountains. Hydrol. Earth Syst. Sci. 2013, 17, 1635–1659. [Google Scholar] [CrossRef] [Green Version]
- Feiccabrino, J.; Gustafsson, D.; Graff, W.; Lundberg, A.; Sandström, N. Meteorological Knowledge Useful for the Improvement of Snow Rain Separation in Surface Based Models. Hydrology 2015, 2, 266–288. [Google Scholar] [CrossRef] [Green Version]
- Lundquist, J.D.; Neiman, P.J.; Martner, B.; White, A.B.; Gottas, D.J.; Ralph, F.M. Rain versus snow in the Sierra Nevada, California: Comparing doppler profiling radar and surface observations of melting level. J. Hydrometeorol. 2008, 9, 194–211. [Google Scholar] [CrossRef] [Green Version]
- Minder, J.R.; Durran, D.R.; Roe, G.H. Mesoscale controls on the mountainside snow line. J. Atmos. Sci. 2011, 68, 2107–2127. [Google Scholar] [CrossRef]
- Üçkardeş, F.; Aslan, E.; Üçükönder, H.K. Review A fast approach to select the appropriate test statistics. Acad. J. Agric. 2013, 2, 55–61. [Google Scholar]
- Pimentel, R.; Aguilar, C.; Herrero, J.; Pérez-Palazón, M.J.; Polo, M.J. Comparison between Snow Albedo Obtained from Landsat TM, ETM+ Imagery and the SPOT VEGETATION Albedo Product in a Mediterranean Mountainous Site. Hydrology 2016, 3, 10. [Google Scholar] [CrossRef] [Green Version]
- Dozier, J.; Painter, T.H. Multispectral and Hyperspectral Remote Sensing of Alpine Snow Properties. Annu. Rev. Earth Planet. Sci. 2004, 32, 465–494. [Google Scholar] [CrossRef] [Green Version]
- Grenfell, T.C.; Putkonen, J. A method for the detection of the severe rain-on-snow event on Banks Island, October 2003, using passive microwave remote sensing. Water Resour. Res. 2008, 44, 1–9. [Google Scholar] [CrossRef]
- Semmens, K.A.; Ramage, J.; Bartsch, A.; Liston, G.E. Early snowmelt events: Detection, distribution, and significance in a major sub-arctic watershed. Environ. Res. Lett. 2013, 8. [Google Scholar] [CrossRef]
- Thakur, P.K.; Garg, P.K.; Aggarwal, S.P.; Garg, R.D.; Mani, S. Snow Cover Area Mapping Using Synthetic Aperture Radar in Manali Watershed of Beas River in the Northwest Himalayas. J. Indian Soc. Remote Sens. 2013, 41, 933–945. [Google Scholar] [CrossRef]
- Ulaby, F.; Long, D. Microwave Radar and Radiometric Remote Sensing. Microw. Radar Radiom. Remote Sens. 2014. [Google Scholar] [CrossRef]
- Dolant, C.; Langlois, A.; Montpetit, B.; Brucker, L.; Roy, A.; Royer, A. Development of a rain-on-snow detection algorithm using passive microwave radiometry. Hydrol. Process. 2016, 30, 3184–3196. [Google Scholar] [CrossRef]
- Langlois, A.; Brucker, L.; Roy, A.; Montpetit, B.; Dolant, C.; Royer, A. Meteorological inventory of rain-on-snow events in the Canadian Arctic Archipelago and satellite detection assessment using passive microwave data. Phys. Geogr. 2017, 39, 428–444. [Google Scholar] [CrossRef]
- Nolin, A.; Dozier, J. A hyperspectral method for remotely sensing radiative impact of impurities in. Remote Sens. Environ. 2000, 216, 207–216. [Google Scholar] [CrossRef]
- Frei, A.; Lee, S.Y. A comparison of optical-band based snow extent products during spring over North America. Remote Sens. Environ. 2010, 114, 1940–1948. [Google Scholar] [CrossRef]
- World Meteorological Organization (WMO). Review on remote sensing of the snow cover and on methods of mapping snow. In Proceedings of the Fourteenth Session of the WMO Commission for Hydrology (CHy-14), Geneva, Switzerland, 6–14 November 2012; p. 26. [Google Scholar]
- Niwano, M.; Aoki, T.; Kuchiki, K.; Hosaka, M.; Kodama, Y. Snow Metamorphism and Albedo Process (SMAP) model for climate studies: Model validation using meteorological and snow impurity data measured at Sapporo, Japan. J. Geophys. Res. Earth Surf. 2012, 117. [Google Scholar] [CrossRef]
- O’Brien, H.W.; Munis, R.H. Red and Near-Infrared Spectral Reflectance of Snow; Research report (Cold Regions Research and Engineering Laboratory (U.S.)): Hanover, NH, USA, 1975; Volume 332. [Google Scholar]
- Marks, D.; Winstral, A. Comparison of snow deposition, the snow cover energy balance, and snowmelt at two sites in a semiarid mountain basin. J. Hydrometeorol. 2001, 2, 213–227. [Google Scholar] [CrossRef]
- Garreaud, R.D. The Andes climate and weather. Adv. Geosci. 2009, 22, 3–11. [Google Scholar] [CrossRef] [Green Version]
- Montecinos, A.; Aceituno, P. Seasonality of the ENSO-related rainfall variability in central Chile and associated circulation anomalies. J. Clim. 2003, 16, 281–296. [Google Scholar] [CrossRef] [Green Version]
- Pellicciotti, F.; Helbing, J.; Rivera, A.; Favier, V.; Corripio, J.; Araos, J.; Carenzo, M. A study of the energy balance and melt regime on Juncal Norte Glacier, semi-arid Andes of central Chile, using melt models of different complexity. Hydrol. Process. 2010, 2274, 2267–2274. [Google Scholar] [CrossRef]
- Clark, M.P.; Hendrikx, J.; Slater, A.G.; Kavetski, D.; Anderson, B.; Cullen, N.J.; Kerr, T.; Örn Hreinsson, E.; Woods, R.A. Representing spatial variability of snow water equivalent in hydrologic and land-surface models: A review. Water Resour. Res. 2011, 47. [Google Scholar] [CrossRef] [Green Version]
- Marks, D.; Dozier, J. Climate and energy exchange at the snow surface in the Alpine Region of the Sierra Nevada: 2. Snow cover energy balance. Water Resour. Res. 1992, 28, 3043–3054. [Google Scholar] [CrossRef]
- Salomonson, V.V.; Appel, I. Estimating fractional snow cover from MODIS using the normalized difference snow index. Remote Sens. Environ. 2004, 89, 351–360. [Google Scholar] [CrossRef]
- Masiokas, M.H.; Villalba, R.; Luckman, B.H.; Quesne, C.; Le, J.C. Aravena snowpack variations in the central andes of Argentina and Chile, 1951–2005: Large-Scale atmospheric influences and implications for water resources in the region. J. Clim. 2006, 19, 6334–6352. [Google Scholar] [CrossRef]
- Vermote, E. MOD09A1 MODIS/Surface Reflectance 8-Day L3 Global 500 m SIN Grid; NASA, Land Processes Distributed Active Archive Center (LP DAAC): Sioux Falls, SD, USA, 2015. [CrossRef]
- Hall, D.K.; Riggs, G.A.; Salomonson, V.V. Development of methods for mapping global snow cover using moderate resolution imaging spectroradiometer data. Remote Sens. Environ. 1995, 54, 127–140. [Google Scholar] [CrossRef]
- Hall, D.K.; Riggs, G.A. Normalized-Difference Snow Index (NDSI). Crysopberic Sci. 2010, 70–71. [Google Scholar] [CrossRef] [Green Version]
- Hall, D.K.; Riggs, G.A.; Salomonson, V.V.; Barton, J.S.; Casey, K.L.; Chien, N.E.; DiGirolamo, A.G.; Klein, H.; Powell, W.; Tait, A.B. Algorithm Theoretical Basis Document (ATBD) for the MODIS Snow and Sea Icemapping Algorithms; NASA Goddard Space Flight Center: Greenbelt, MD, USA, 2001.
- Vermote, J.C.; Ray, J.P. MODIS Surface Reflectance User’ s Guide Collection 6; MODIS Land Surface Reflectance; Science Computing Facility, Land processes Distributed Active Archive Center (LP DAAC): Sioux Falls, SD, USA, 2015. [Google Scholar]
- Vermote, E.F.; Vermeulen, A. Atmospheric Correction Algorithm: Spectral Reflectances (MOD0 ) NASA Contract NAS5-96062; MODIS Algorithm Technical Background Document; University of Maryland: Greenbelt, MD, USA, 1999; Version 4; p. 107. [Google Scholar] [CrossRef]
- Hall, D.K.; Riggs, G.A.; Barton, J.S. MODIS Snow and Sea Ice-Mapping Algorithms; MODIS Algorithm Technical Background Document; University of Maryland: Greenbelt, MD, USA, 2001; p. 45. [Google Scholar]
- Cea López, C.; Cristóbal Rosselló, J.; Pons Fernández, X. Determinación de la Superficie Nival del Pirineo Catalán Mediante Imágenes Landsat y Modis. Presented at XII Congreso Nacional de Tecnologías de la Información Geográfica, Granada, Spain, September 2007; pp. 1–10. [Google Scholar]
- Kulkarni, A.V.; Singh, S.K.; Mathur, P.; Mishra, V.D. Algorithm to monitor snow cover using AWiFS data of RESOURCESAT-1 for the Himalayan region. Int. J. Remote Sens. 2006, 27, 2449–2457. [Google Scholar] [CrossRef]
- Xiao, X.; Moore, B.; Qin, X.; Shen, Z.; Boles, S. Large-scale observations of alpine snow and ice cover in Asia: Using multi-temporal VEGETATION sensor data. Int. J. Remote Sens. 2002, 23, 2213–2228. [Google Scholar] [CrossRef] [Green Version]
- Bowley, C.J.; Barnes, J.C.; Rango, A. Applications Systems Verification and Transfer. Volume 3 Project Operational Applications of Satellite Snow Cover Observations in California; NASA Technical Paper 1829; NASA: Greenbelt, MD, USA, 1981.
- Tachikawa, T.; Hato, M.; Kaku, M.; Iwasaki, A. Characteristics of ASTER GDEM Version 2. In Proceedings of the 2011 IEEE International Geoscience and Remote Sensing Symposium, Vancouver, BC, Canada, 24–29 July 2011; pp. 3657–3660. [Google Scholar] [CrossRef]
- Boisier, J.P.; Alvarez-Garretón, C.; Cepeda, J.; Osses, A.; Vásquez, N.; Rondanelli, R. CR2MET: A high-resolution precipitation and temperature dataset for hydroclimatic research in Chile. Geophys. Res. Abstr. 2018, 20, 2018–19739. [Google Scholar]
- Centro de Ciencias del Clima y la Resiliencia (CR2) CR2 Climate Explorer. Available online: http://explorador.cr2.cl/ (accessed on 20 February 2018).
- IDE Chile Infraestructura de Datos Geoespaciales de Chile. Available online: http://www.ide.cl (accessed on 15 January 2018).
- 2015. Available online: http://qgis.osgeo.org (accessed on 15 December 2020).
- Neteler, M.; Bowman, M.H.; Landa, M.; Metz, M. GRASS GIS: A multi-purpose open source GIS. Environ. Model. Softw. 2012, 31, 124–130. [Google Scholar] [CrossRef] [Green Version]
- Depuy, B.V.; Berger, V.W.; Zhou, Y. Wilcoxon-Mann-Whitney Test: Overview. Wiley StatsRef Stat. Ref. Online 2014, 1–5. [Google Scholar] [CrossRef]
- Thériault, J.M.; Stewart, R.E. A parameterization of the microphysical processes forming many types of winter precipitation. J. Atmos. Sci. 2010, 67, 1492–1508. [Google Scholar] [CrossRef] [Green Version]
- Jin, Z.; Simpson, J.J. Bidirectional anisotropic reflectance of snow and sea ice in AVHRR Channel 1 and 2 spectral regions—Part I: Theoretical analysis. IEEE Trans. Geosci. Remote Sens. 1999, 37, 543–554. [Google Scholar] [CrossRef]
- Jin, Z.; Simpson, J.J. Bidirectional anisotropie reflectance of snow and sea ice in AVHRR channel 1 and channel 2 spectral regions–Part ii: Correction applied to imagery of snow on sea ice. IEEE Trans. Geosci. Remote Sens. 2000, 38, 999–1015. [Google Scholar] [CrossRef]
- Jin, Z.; Simpson, J.J. Anisotropic reflectance of snow observed from space over the arctic and its effect on solar energy balance. Remote Sens. Environ. 2001, 75, 63–75. [Google Scholar] [CrossRef]
- Zhou, X.; Zhou, J.; Kinzelbach, W.; Stauffer, F. Simultaneous measurement of unfrozen water content and ice content in frozen soil using gamma ray attenuation and TDR. Water Resour. Res. 2014, 50, 9630–9655. [Google Scholar] [CrossRef]
- Cornwell, E.; Molotch, N.P.; McPhee, J. Spatio-temporal variability of snow water equivalent in the extra-tropical Andes Cordillera from distributed energy balance modeling and remotely sensed snow cover. Hydrol. Earth Syst. Sci. 2016, 20, 411–430. [Google Scholar] [CrossRef] [Green Version]
Figure 1.
Study area in the Maipo basin in the Central-Western Andes.

Figure 2.
Classification of events based on precipitation and snow changes.

Figure 3.
Events based on precipitation and SCA/NIR-SR response with temperature and river-flow changes.
Figure 3.
Events based on precipitation and SCA/NIR-SR response with temperature and river-flow changes.

Figure 4.
An example of the analysis done with (a) SCA (red line), (b) NIR-SR (heatmap) and precipitation events (blue bars) for the Maipo basin in the year 2012.
Figure 4.
An example of the analysis done with (a) SCA (red line), (b) NIR-SR (heatmap) and precipitation events (blue bars) for the Maipo basin in the year 2012.

Figure 5.
NIR-SR distribution for P1S1 and P1S0 events previously identified (8-day delay).

Figure 6.
Average river-flow for high (solid lines) and low occurrence (dotted lines) of rain-on-snow event, for the Maipo (a) and Mapocho (b) sub-basins.
Figure 6.
Average river-flow for high (solid lines) and low occurrence (dotted lines) of rain-on-snow event, for the Maipo (a) and Mapocho (b) sub-basins.


Table 1.
Test of similarity between Snow (P1S1) and rain (P1S0) reflectance distribution moments (W: Mann-Whitney U test; D: Kolmogorov-Smirnov test. * p < 0.0001).
Table 1.
Test of similarity between Snow (P1S1) and rain (P1S0) reflectance distribution moments (W: Mann-Whitney U test; D: Kolmogorov-Smirnov test. * p < 0.0001).
| Moment | Statistic | Value |
|---|---|---|
| Mean | W D | 1647.5 * 0.5695 * |
| Standard Deviation | W D | 2853.5 * 0.365 * |
| Skew | W D | 8647.5 * 0.4682 * |
| Kurtosis | W D | 8336.5 * 0.4297 * |
Table 2.
5-day interval temperature change test for likely rain-on-snow events (P1S0).
| Variable Test | 2 Days Prior | 1 Day Prior | 1 Day Later | 2 Days Later |
|---|---|---|---|---|
| Maximum temperature | −14% | −17% | −16% | −13% |
| 0.1324 | 0.003143 | 0.06251 | 0.03397 | |
| Minimum temperature | −42% | −31% | −26% | −46% |
| 0.02515 | 0.04885 | 0.03224 | 0.004365 |
Table 3.
Test of 4-day interval changes in river-flow for likely rain-on-snow events (P1S0).
| Sub-Basin | Station Name | 1 Day Prior | 1 Day Later | 2 Days Later |
|---|---|---|---|---|
| Mapocho | Rio Mapocho en los Almendros | 0.19% | 6.9% | 3% |
| 0.9206 | 0.08302 | 0.1957 | ||
| Mapocho | Estero Yerba Loca antes Junta San Francisco | 1.26% | 1.6% | 1.6% |
| 0.214 | 0.2015 | 0.3089 | ||
| Mapocho | Estero Arrayan en La Montosa | −0.23% | 3.27% | 0.95% |
| 0.8631 | 0.4181 | 0.7648 | ||
| Maipo | Rio Colorado antes Junta Rio Maipo | 2.6% | 3.7% | 5.78% |
| 0.4237 | 0.2094 | 0.03362 | ||
| Maipo | Rio Colorado Antes Junta Rio Olivares | 0.67% | 0.2% | 2.4% |
| 0.6462 | 0.9103 | 0.4772 | ||
| Maipo | Rio Maipo en El Manzano | −0.06% | 3.2% | 2.4% |
| 0.9673 | 0.1456 | 0.1569 | ||
| Maipo | Rio Maipo en Las Hualtatas | 0.3% | 3.9% | 4.4% |
| 0.7639 | 0.0327 | 0.06183 | ||
| Maipo | Rio Maipo en San Alfonso | −0.6% | 2.9% | 4.6% |
| 0.6589 | 0.05487 | 0.008764 | ||
| Maipo | Rio Olivares antes Junta Rio Colorado | −1.5% | 1.5% | −0.37% |
| 0.543 | 0.562 | 0.9045 | ||
| Maipo | Rio Volcan en Queltehues | 1.12% | 8.17% | 8.9% |
| 0.6968 | 0.03065 | 0.06366 |
Publisher’s Note: MDPI stays neutral with regard to jurisdictional claims in published maps and institutional affiliations. |
© 2020 by the authors. Licensee MDPI, Basel, Switzerland. This article is an open access article distributed under the terms and conditions of the Creative Commons Attribution (CC BY) license (http://creativecommons.org/licenses/by/4.0/).
Share and Cite
MDPI and ACS Style
Ocampo Melgar, D.; Meza, F.J. Exploring the Fingerprints of Past Rain-on-Snow Events in a Central Andean Mountain Range Basin Using Satellite Imagery. Remote Sens. 2020, 12, 4173. https://0-doi-org.brum.beds.ac.uk/10.3390/rs12244173
AMA Style
Ocampo Melgar D, Meza FJ. Exploring the Fingerprints of Past Rain-on-Snow Events in a Central Andean Mountain Range Basin Using Satellite Imagery. Remote Sensing. 2020; 12(24):4173. https://0-doi-org.brum.beds.ac.uk/10.3390/rs12244173
Chicago/Turabian StyleOcampo Melgar, D., and F.J. Meza. 2020. "Exploring the Fingerprints of Past Rain-on-Snow Events in a Central Andean Mountain Range Basin Using Satellite Imagery" Remote Sensing 12, no. 24: 4173. https://0-doi-org.brum.beds.ac.uk/10.3390/rs12244173
Note that from the first issue of 2016, this journal uses article numbers instead of page numbers. See further details here.