1. Introduction
An aerosol is a general term for the solid or liquid particles suspended in the atmosphere with a diameter of 10
−3–10
2 μm [
1,
2]. Aerosols not only directly, indirectly or semi-indirectly affect the global climate by absorbing and scattering solar radiation, but can also seriously threaten human health by spreading harmful substances [
3,
4,
5]. The aerosol optical depth (AOD), one of the most basic optical properties of aerosols, represents the attenuation effect of aerosols on solar radiation, which can be used as an indicator of the local air pollution level to a certain extent. AOD information collection is of great significance, especially in developed urban/industrial regions where anthropogenic perturbations dominate. Traditionally, the primary methods of AOD acquisition are ground measurements, which do not exhibit spatial continuity and cannot meet the needs of regional research because ground measurements are restricted by the distribution of observation stations. Based on its unique advantages, remote sensing (RS) is an AOD acquisition method that is feasible over a wide range of spatial scales and has a high temporal resolution, which can greatly make up for the shortage of ground-based observation data and solve problems related to the lack of data and uneven spatial distribution. RS not only provides a reference for comprehensively understanding the concentration and distribution of AOD but also offers theoretical support for regional atmospheric environment management.
The development of satellite RS technologies has facilitated dynamic real-time aerosol monitoring on a large scale. The difficulty in retrieving continental AOD data from satellite RS lies in the determination of the aerosol model and removal of the contribution of land surface reflectance (LSR) [
6,
7]. In terms of removing the contribution of LSR, the most commonly used methods include the dark target method [
8,
9], structure-function method [
10], deep blue (DB) algorithm [
11,
12], polarization algorithm [
13], and multiangle algorithm [
14]. In bright areas, such as cities and other areas with little or no vegetation cover, the land surface contribution to the radiance received by satellite is larger than that over vegetated areas, making it difficult to estimate the LSR with high precision. Numerous studies have shown that the DB algorithm has incomparable advantages over the other AOD inversion algorithms in bright regions [
15,
16,
17]. The DB algorithm has been successfully applied in arid and semiarid regions, such as the Sahara Desert, and has become the mainstream algorithm for AOD inversion of bright targets with its own advantages. Wang, Z. [
18] and Tian, X. [
19] used the DB algorithm to achieve high spatial resolution extraction in Ningbo and Beijing based on Environment Satellite 1 and Landsat 8 OLI satellites, respectively. Sun successfully retrieved the spatial distribution of local aerosols in Wuhan using GaoFen-1 16 m wide field-of-view camera (GF-1 WFV) data [
20,
21].
The Xinjiang Uygur Autonomous Region in Northwest China is part of the Central Asian dust storm area, which is one of the main sources of dust aerosols [
22]. In recent years, many Xinjiang cities, especially the provincial capital, Urumqi, have suffered a severe deterioration in air quality with significant contributions from atmospheric particulates [
23]. As the core area of the Silk Road Economic Belt, Urumqi is located in the hinterland of Eurasia and is the world’s furthest city from the ocean. With the growth of the population and advancement of the urbanization process, Urumqi, as one of the typical cities with serious air pollution caused by human activities and industrialization processes, is not optimistic about its atmospheric environment. Especially during the heating period in winter, the visibility of the atmosphere decreases seriously, and the air pollution level is grim. Since the implementation of the coal to natural gas (NG) strategy in 2013, Urumqi’s energy industry structure has been effectively adjusted, and further deterioration of the atmosphere has been initially curbed. AOD research has shifted from traditional ground observation to ground-based RS, and at present, satellite RS collaborative research is being conducted. Nevertheless, most studies have focused on AOD research at coarse spatial resolution scales and have rarely involved typical cities in arid and semiarid areas.
Satellite-derived AOD estimates are key predictors in particulate air pollution. Due to the lack of ground observation data in Northwest China, the coarse-scale limitation of existing AOD RS products, and the applicability of the AOD RS estimation algorithm to bright surfaces, it has become difficult to conduct high-resolution AOD research in arid cities. Urumqi is a typical large-scale industrial city in Northwest China, and the air quality is alarming and has been impacted by many factors. It is necessary to obtain a detailed AOD situation in Urumqi. Obtaining high-resolution AOD data in Urumqi not only makes up for the lack of AOD data in Northwest China but also provides excellent data support for further research on the spatiotemporal changes in the local AOD in Urumqi. Furthermore, research on the spatiotemporal distribution characteristics, driving force analysis, and trajectory simulation of the AOD in Urumqi are of great guiding significance for Urumqi to respond positively to the national construction of ecological civilization and to build an ecologically civilized city, which is closely related to the health and well-being of residents.
In this paper, taking the coal to NG project implementation in 2013 as the time node and based on the minimum value synthesis method, an improved DB algorithm is used to estimate the AOD at a wavelength of 550 nm in Urumqi using Landsat Thematic Mapper (TM) and Landsat Operational Land Imager (OLI) data from 2010 to 2018. The major objectives of this study are to (1) conduct fine-resolution AOD estimation through the improved DB algorithm; (2) examine the spatiotemporal characteristics of the AOD in Urumqi; (3) combine multiple impact factors to perform AOD impact factor importance ranking; and (4) simulate the potential AOD trajectory distribution in high-value seasons.
2. Study Area and Data Collection
2.1. Study Area
Urumqi (E86°37’–88°58’, N42°45’–44°08’), the provincial capital of the Xinjiang Uygur Autonomous Region of China, is located in the middle zone of Eurasia, which is at the north foot of the Tian Mountain and at the south edge of the Junggar Basin (
Figure 1). Urumqi is surrounded by mountains on three sides to the east, south, and west. The terrain is high in the southeast and low in the northwest. From north to south, a slender strip canyon is formed. The temperature of Urumqi is characterized by a mild continental and arid climate, in which the temperature difference between day and night is notable, and the changes between winter and summer are distinct. Urumqi is the only megacity in Xinjiang, with a strong industrial foundation and a coal-fired energy structure. Based on the typical canyon terrain features, arid and semiarid climate and industrial background, the pollutants discharged from Urumqi are not easily diffused, and they often envelop the city for a long time. In addition, these pollutants are liable to produce secondary pollution, which seriously damages the safety and well-being of urban residents [
24].
2.2. Satellite Data
2.2.1. Landsat Series Data
The Landsat series sensor provides a long-term sequence of data sets with a 16-day ground track repeat cycle. The Landsat TM has seven spectral bands: six visible (VIS)-near-infrared (NIR) bands at 30 m and one thermal infrared band at 120 m. Landsat OLI has 11 spectral bands: six VIS-NIR bands at 30 m, two thermal infrared bands at 100 m, one panchromatic band at 15 m, and two bands (coastal and cirrus) at 30 m spatial resolution. In this study, the data are divided into three periods every year, and the tile is 142/30. Landsat TM worked until 2011 and the Landsat OLI began to operate in 2013. Moreover, a fault in the Landsat Enhanced Thematic Mapper Plus (ETM+) in 2003 caused the data to be missing, making it inappropriate for the quantitative inversion of RS parameters. Therefore, the 2012 AOD analysis is omitted in this paper. Through the USGS (
https://search.earthdata.nasa.gov/), 24 images (TM and OLI provided six and 18 images, respectively) were collected with a small cloud amount of less than 10% from March 2010 to October 2018 for the AOD retrieval experiments in Urumqi. In the RS estimation of AOD using the improved DB algorithm, the Landsat data bands used are blue band, quality control band, solar zenith angle, solar elevation angle, satellite zenith angle, and satellite elevation angle, and the spatial resolution resampling is 500 m.
2.2.2. Moderate Resolution Imaging Spectroradiometer (MODIS) Series Data
Moderate Resolution Imaging Spectroradiometer (MODIS) is an optical RS instrument mounted on the Terra/Aqua satellite. MODIS provides 36 bands of global observation data from visible (0.4 micron) to mid-infrared (14 micron). The MOD09A1 dataset provides the surface reflectance at a resolution of 500 m in sinusoidal projection. Each MOD09A1 pixel has the best possible observation during an 8-day period as selected by high observation coverage, small view angle, absence of clouds or cloud shadows, and low aerosol loading. In this study, the MOD09A1 datasets for eight years (2010–2018) and one tile (H24V04) were used to build the surface reflectance database to support AOD retrieval. At the same time, the spatial resolution of the simultaneous transit with the Landsat image is 10 km in Urumqi, and the time resolution of the MYD04L2 DB AOD data is one day to assist verification. All of the above data were downloaded from the NOAA website (
https://ladsweb.modaps.eosdis.nasa.gov/).
2.3. Statistical Yearbook Data
Based on previous studies, urban aerosols are mainly restricted by meteorological conditions, energy structure, transportation, and other human factors [
25,
26,
27]. Therefore, comprehensively considering various natural and anthropogenic influences, the following 11 main parameters, including temperature (T), precipitation (P), sunshine hours (SH), heating coal consumption (HC), natural gas (NG) usage, motor vehicle ownership (MVO), number of private cars (NPC), total industrial consumption (TIC), population (PL), construction land (CL), and urban green space (UGS) are identified as the main indicators that affect the AOD concentration. All data used in the study were collected from the China Urban Statistical Yearbook, the Xinjiang Statistical Yearbook, and the Urumqi Statistical Yearbook during the 2010–2018 period.
2.4. Sunphotometer Field Sampling Data
AOD field observations are considered the most effective tool for validating satellite AOD data. The Microtops II sunphotometer, which is a portable handheld multiband sunphotometer to monitor AOD, is used in this study. The selected observation bands are 440, 675, 870, 936, and 1020 nm. The observation period is 9:30–21:00 (Beijing time) every day, the sampling interval is set to 15 min, and the sampling details can be found in
Table S1. The uncertainty in the Microtops II sunphotometer mainly arises from human observations, such as the judgment of different people regarding the weather as well as normal differences in operation, because the manufacture precision of Microtops II reached 1%–2% [
28]. The AOD RS estimation based on the DB algorithm obtains values at 550 nm, the Microtops II sunphotometer is not used to provide AOD ground observations at 550 nm. To better match the measured AOD by the sunphotometer with the inverted RS AOD in the corresponding band and spatiotemporal scale, the AOD values at 550 nm are calculated using the Ångström exponent algorithm with the nearest available pair of wavelengths to the measured AOD values, usually 675 nm and 440 nm [
29,
30]. The average of five AOD measurements within ±30 min of the Landsat satellite overpass is obtained [
31]. Then, AOD retrieval is carried out within a common sampling window of 3 × 3 pixels around the sampling site, and the average of the effective values (AOD > 0) is the AOD retrieval value at this site. Auxiliary verification of the Landsat satellite DB inversion results is carried out by analyzing the relationship between the ground and RS-extracted AOD values.
2.5. Aerosol Robotic Network (AERONET) Data
AERONET is a ground-based aerosol RS observation network jointly established by NASA and LOA-PHOTONS (CNRS) that provides aerosol optical properties with high temporal resolution and long-time series [
32]. AERONET covers the main areas of the world and includes more than 500 sites. Because of the high data quality of AERONET, it is widely considered as an effective reference to verify satellite AOD retrievals [
33]. Because there is no AERONET site in Urumqi, to carry out more extensive verification of the retrieval AOD, we use the nearby AERONET sites with the same geographic characteristics as Urumqi for validation. This study uses the version 3 cloud-screened and quality-controlled level 2.0 AOD ground-based observations obtained from the “Issyk-Kul”, “Dushanbe”, “IAOCA-KRSU”, and “Muztagh_Ata” sites from January 2010 to December 2018 (
Table S1). All stations are located in arid and semi-arid areas with similar geographical and climatic characteristics to Urumqi. Therefore, it is representative and appropriate to assist with verification. The data were downloaded from the AERONET website (
https://aeronet.gsfc.nasa.gov). For space-time and wavelength matching of the data, please refer to the previous section.
3. Methodology
3.1. Aerosol Inversion Principle
The atmospheric aerosol RS approach is based on the relationship between the top-of-atmospheric (TOA) radiance and the surface reflectivity obtained by the sensor to solve the aerosol-related parameters. The radiant energy received by the satellite sensor has a wide range of sources, which reflects the coupling of electromagnetic waves and the Earth-atmosphere system. Assuming that the surface is a Lambertian body, the TOA spectral reflectance (LTOA), as measured by the satellite sensor, is a function of the solar and view zenith and azimuth angles and can be estimated using the following equation [
28,
34]:
where µ
s is the solar zenith angle, µ
v is the view zenith angle,
Ø is the relative azimuth angle, L
0 is the path radiance that is produced by the scattering of particles and molecules in the atmosphere, r is the surface reflectance,
S is the atmospheric backscattering ratio,
F0 is the total downward radiance, and
T is the atmospheric transmittance.
The essence of satellite aerosol RS is removing LSR noise from the signal received by satellite and obtaining atmospheric aerosol information. Kaufman’s earlier research showed that an error of 0.01 in the surface reflectance would cause an AOD inversion error of 0.1 [
35]; thus, the accurate estimation of the surface reflectance is a very important part of aerosol RS inversion [
36]. In this study, we use the DB algorithm, specifically refer to the research of Hsu, N. and Tian, X. [
11,
19]. First, to remove the surface contributions from the satellite signal, MOD09A1 is used to build an LSR database for AOD retrieval. The detailed construction method of the database entails using the LSR data products covering the Urumqi urban area from 2010–2018. Through the minimum value synthesis method, a minimum LSR monthly product data set in the MOD09A1 blue band is obtained, and the minimum value synthesis method can effectively eliminate the influence of clouds. Second, the differences in the spectral conditions of the different satellite sensors, which generate different features of the same object, may possess different reflection characteristics on different sensor platforms. Third, we perform radiation calibration on Landsat to calculate the apparent reflectivity and use the quality-controlled data to perform the cloud mask. After resampling the Landsat data to 1 km, the spectral conversion of the sensor is corrected to the same reference. Based on the 6S radiation transmission model and under the different atmospheric conditions and observation geometries, a lookup table is constructed. Then, the DB algorithm is used to remove the surface contribution from the pixel-by-pixel angle to achieve Earth-atmosphere decoupling and realize AOD extraction.
3.2. Gray Relational Analysis (GRA)
GRA, a systematic analysis approach, can evaluate correlations between related factor sequences and characteristic data based on the ultimate objective [
37]. GRA is a nonstatistical method that is not limited by the sample type and probability distribution. It has unique advantages when the data and information are limited or the conditions do not meet the statistical requirements [
38]. Its performance in examining complicated interrelationships between multiple factors and variables has been widely evaluated [
39,
40]. A detailed description of GRA can be found in the literature [
41]. GRA is used to measure the influence of the comparison factor sequence on the reference factor sequence. The closer the value is to 1, the more significant the effect of the comparison factor sequence is on the reference factor sequence.
3.3. The Hybrid Single-Particle Lagrangian Integrated Trajectory (HYSPLIT) Model
The HYSPLIT model is a commercial model for the analysis of atmospheric pollutant diffusion, which can simulate pollutant sources and diffusion paths [
42]. The HYSPLIT model is also one of the most widely used atmospheric transport and diffusion models in the field of atmospheric science [
43,
44,
45]. The model has more complete functions of transport and dispersion and settlement patterns, handles a variety of meteorological and physical transport processes and different types of emission sources and has been widely used for the analysis of atmospheric pollutant transport [
46,
47,
48]. Based on the HYSPLIT model, this study simulates the AOD trajectories in Urumqi in high-value seasons to obtain the AOD source and diffusion in this area.
4. Results
4.1. Accuracy Validation
To verify the AOD estimation using the improved DB algorithm in typical cities in arid areas, field monitoring data from handheld sunphotometer and AERONET are used for accuracy verification; additionally, comparison with MODIS DB aerosol products (MYD04 C6) is also performed (
Figure 2). Generally, ground station monitoring has high accuracy and is widely used for AOD verification [
49,
50]. In this study, the ground-based observation data are used during the transit of the Landsat satellite (approximately 10:00 AM and 11:30 AM local mean time). The satellite-retrieved AOD and sunphotometer ground observation data and MODIS DB aerosol products are combined for spatiotemporal matching. Decisive coefficient (
R2), root mean square error (RMSE), mean absolute error (MAE), and the relative mean bias (RMB) indicators are used to evaluate the performance of the estimates. It is found that the retrieved AOD and ground-based AOD have very good consistency, with a high correlation coefficient (0.953) and decisive coefficient (0.909) and a small RMSE (0.033) and MAE (0.027). The fitting curve is in good agreement with the 1:1 line, especially in low-value AOD areas. The MODIS AOD products have been widely accepted, recognized, and applied by many scholars [
51,
52,
53,
54]. Assuming that the AOD remains unchanged over a short period of time, the AOD estimation results using Landsat satellite data are compared with those using MODIS aerosol products on the same day, and the site data are used as the medium in between. It is found that the data exhibit good consistency, with a high correlation coefficient (0.844) and a decisive coefficient (0.713) and a small RMSE (0.061) and MAE (0.05). The general trend is consistent with that of the former but is even more scattered. This may be due to the difference between the Landsat and MODIS transit times. Regarding the spatial distribution, the retrieved AOD is better at describing local detailed information than the MODIS DB AOD product (
Figure S2). In addition, we compare the verification results with the results of Tian’s research in the arid and semiarid regions of northern Xinjiang, China, and the comparison exhibits good consistency in precision due to the use of similar algorithms [
19]. In summary, it is feasible to retrieve the AOD in Urumqi using the improved DB algorithm, and the inversion results are highly credible.
4.2. Characteristics of the AOD Spatial Distribution
The four seasons are divided according to changes in temperature, namely, spring is from March to May, summer is from June to August, autumn is from September to November, and winter is from December to February [
43]. Based on the unique geographical location, climate background, and industrial structure of the study area, the 500 m resolution AOD estimation results are shown in
Figure 3. The overall distribution of the AOD in Urumqi shows a significant difference between the urban and suburban areas. The AOD increases from the suburban area to the urban area in a stepwise manner.
Figure 4 shows the relevant statistical information of the spatial distribution of the AOD in the Urumqi area. In spring, the AOD is significantly higher than in the other seasons in the entire urban area, which indicates that the air pollution in Urumqi is serious in spring and that the urban air quality situation has greatly decreased. The spatial distributions of high-AOD areas in summer and autumn are basically the same, although the summer AOD values are significantly higher than the autumn values, and the summer high-AOD area is localized, mostly concentrated in Xinshi District, Shaybak District, and other central urban areas. In autumn, all of the city is relatively clean, and the suburban areas are low-value AOD areas. Regardless of the time period, the AOD on both sides of the Hetan highway is large. The main reason may be traffic and ground dust, as the highway passes through the two large salt lakes of Chaiwopu Lake and Dabancheng Salt Lake, and a large amount of salt dust is exposed next to the lakes as a source of dust. Therefore, the large AOD along the Hetan highway, especially near the two salt lakes, results in a high-value area. An interesting phenomenon is that the AOD in spring in the Dabancheng District has a high value that persists for a long time, which may be related to the special geographical location of the area. The ground exposure is high, the vegetation coverage rate is extremely low, and windy weather occurs often. Strong winds entrain dust from the ground to form dust storms, which leads to high AOD values in spring in the region.
4.3. Characteristics of the AOD Temporal Distribution
The AOD in Urumqi shows significant seasonal changes (
Figure 5), and the AOD change in spring is notable and reaches a maximum value of 0.411; the AOD is 0.285 in summer and reaches a minimum value of 0.203 in autumn. Urumqi is a severely cold area in the national urban climate zone with a long heating period in the cold season. Combined with unfavorable diffusion conditions, Urumqi experiences serious air quality problems in winter [
55]. The cumulative effect of aerosols generated by coal-fired heating throughout winter promotes the increase in the AOD in spring. In addition, Urumqi frequently experiences dust and sand weather conditions in spring, and the AOD fluctuation range is the largest over the entire year because of the changeable weather conditions. In summer, the surface air temperature is higher and the atmospheric transparency is excellent. The coverage rate of surface vegetation increases, leading to a decrease in the amounts of aerosols entering the atmosphere from the surface. Moreover, precipitation in summer is higher than that in other seasons, and the cleaning effect of rainfall on atmospheric aerosols is notable. The results show that the AOD in summer is significantly lower than that in spring. At the same time, Urumqi has a high moisture content in the atmosphere in summer, which may contribute to AOD growth. The average AOD in autumn is the lowest, and the variation range of the AOD is the smallest among the four seasons. The reason for the low AOD values in autumn is different from that of summer. The atmosphere is controlled by high pressure in autumn, resulting in stable conditions and good diffusion conditions. In summary, the maximum AOD value occurs in spring, which indicates that the entire atmosphere is seriously polluted in spring, and from spring to autumn, the air condition improves gradually.
As shown in
Figure 6 and
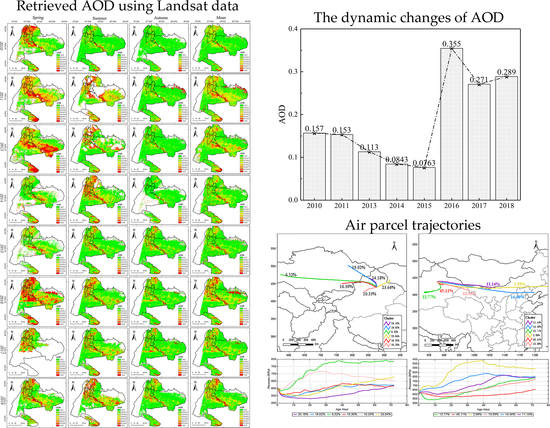
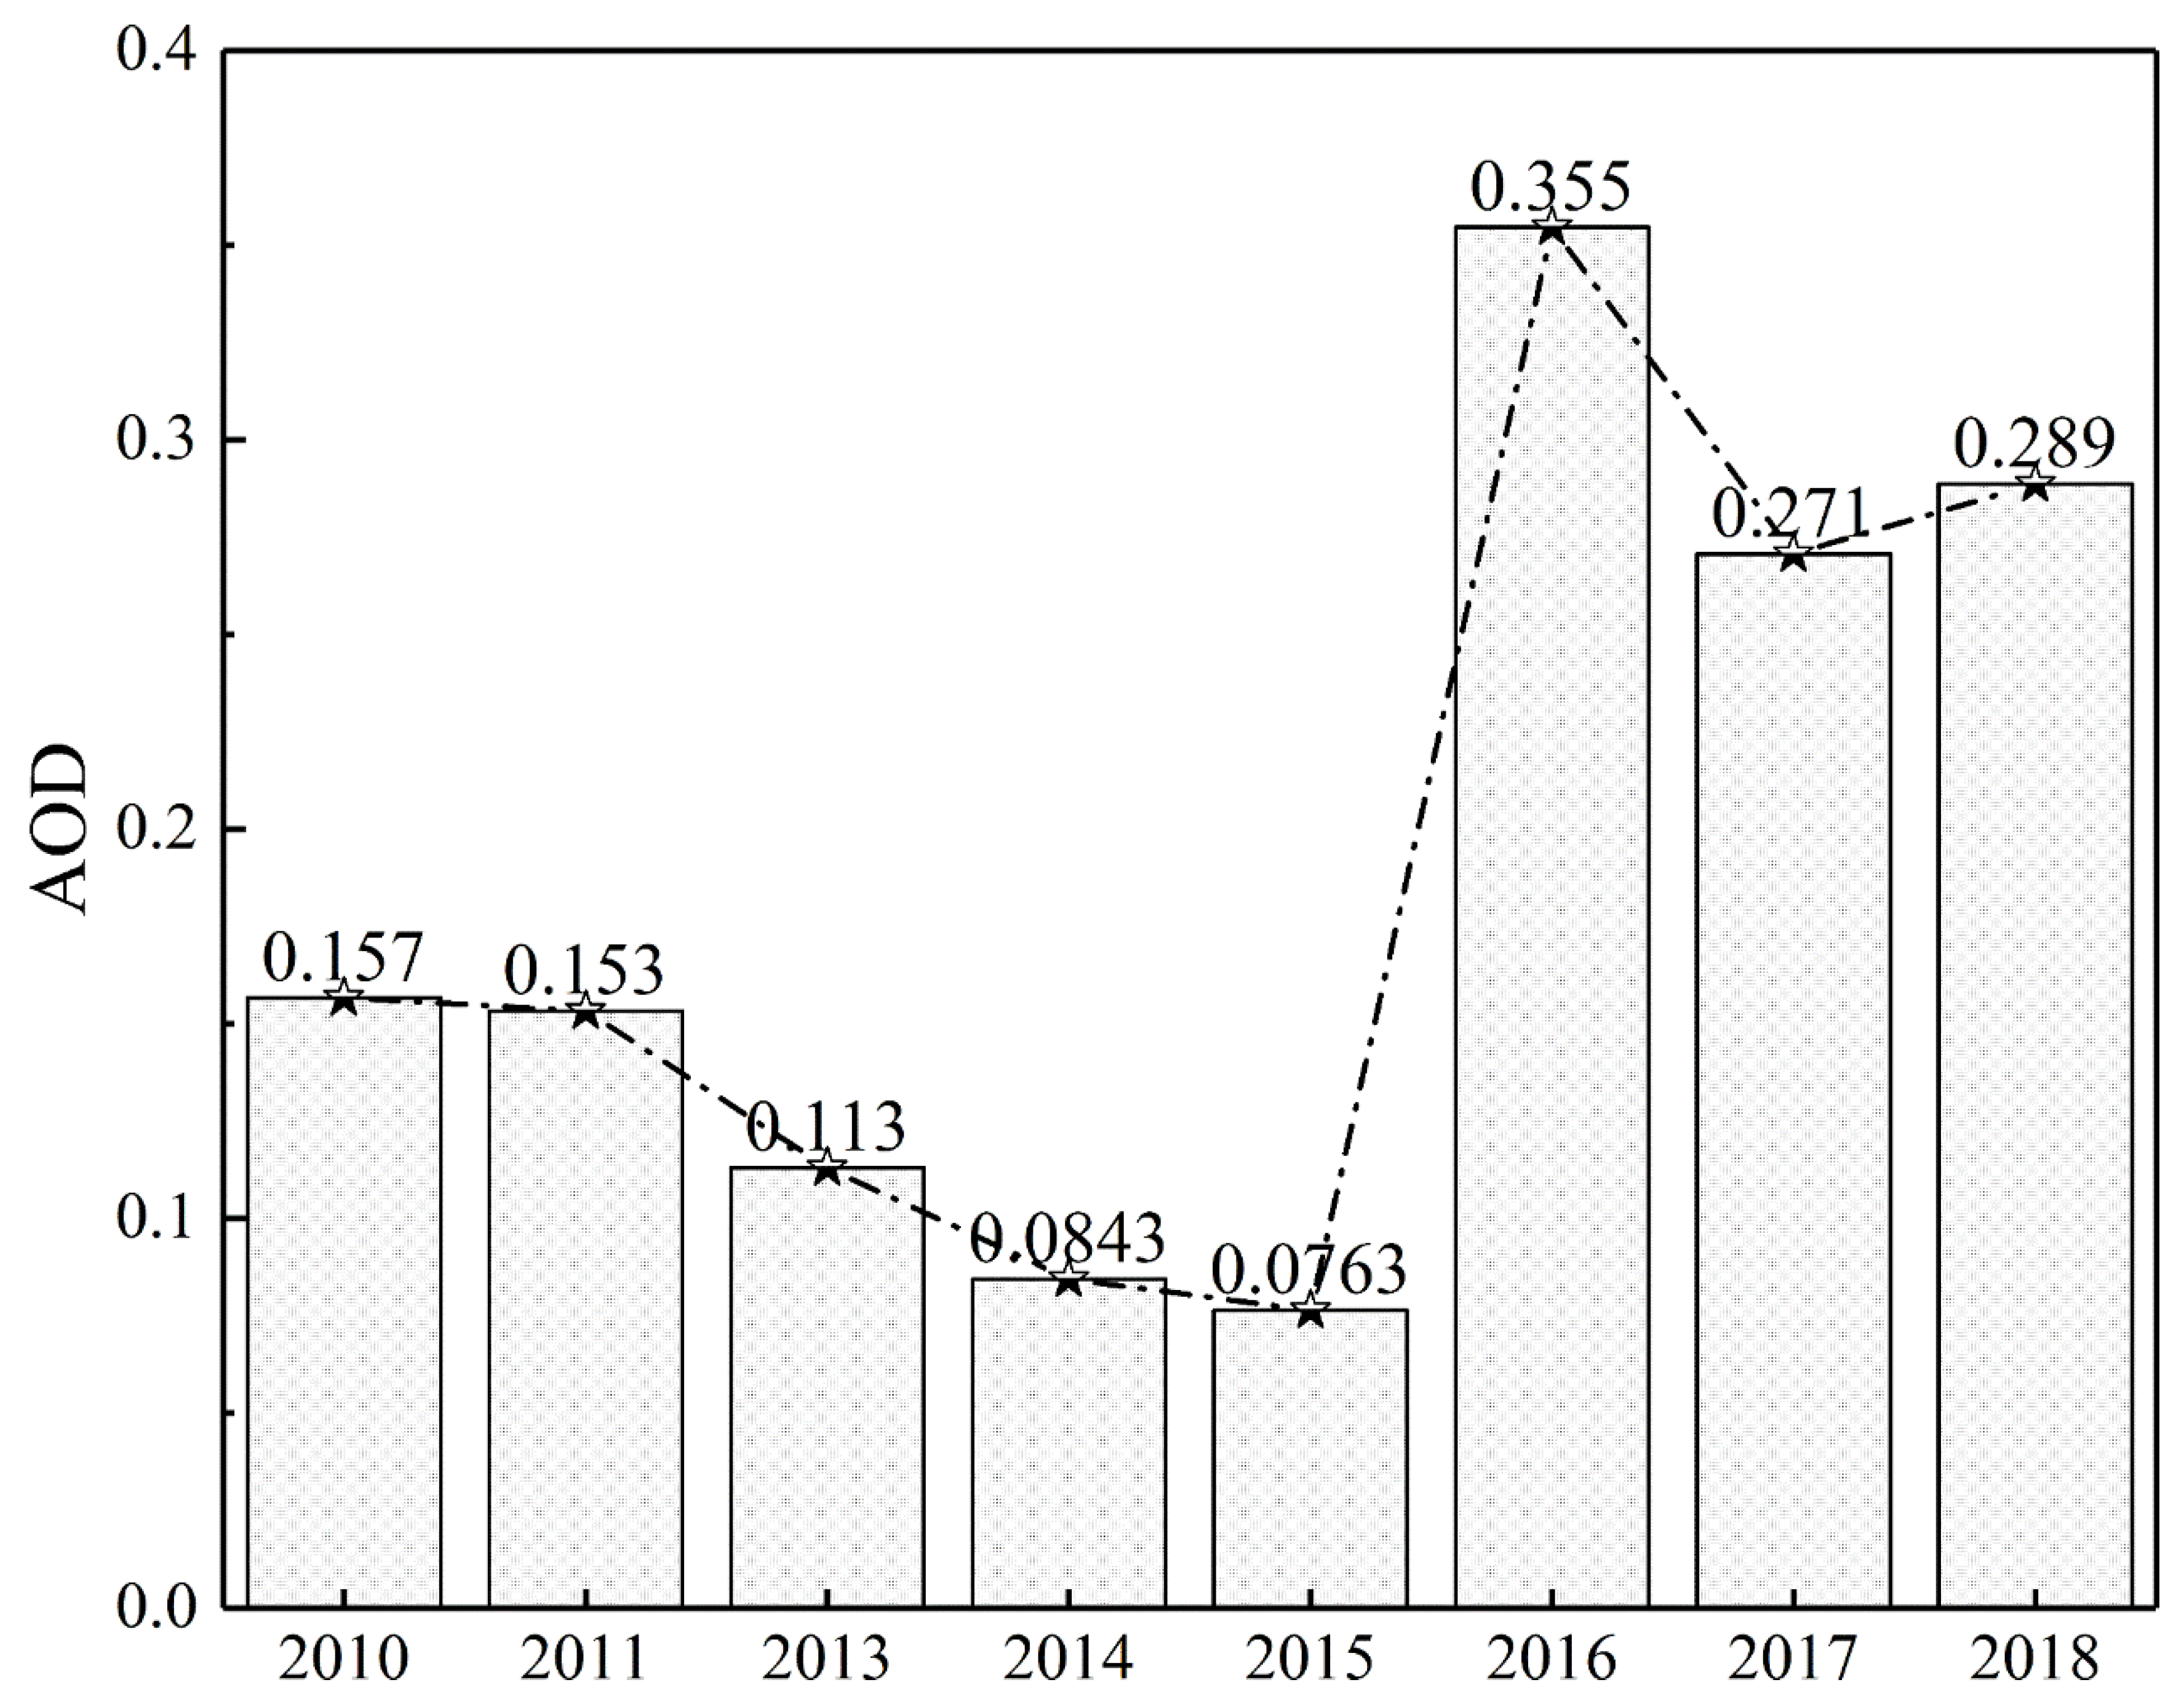
Figure 7, the average AOD in Urumqi decreased gradually from 2010 to 2015. Moreover, the largest rate of decline occurred in 2012–2013, and the AOD reached a minimum of 0.076 in 2015. Then, in the period from 2015–2016, AOD showed a dramatic rise, which may have been related to the promotion of the core area of the Silk Road Economic Belt and the associated rapid economic development of Urumqi. The main growth point in the AOD in Urumqi is representative of the transition from traditional coal-fired heating (burning of fossil fuels) to industry and motor vehicle exhaust emissions. From 2016 to 2018, the AOD exhibited a general downward trend, which may have been due to the increase in residents’ awareness of environmental protection and the government’s macroeconomic regulation. It is worth mentioning that in 2016, the AOD peaked at 0.355. At the same time, the average AOD value in the eight years was 0.187. However, the AOD generally increased, and the high-AOD proportion increased to varying degrees, indicating that the air pollution situation in Urumqi has intensified over the past 10 years. During 2010–2015, the average AOD in Urumqi remained at a low level, indicating that Urumqi’s air pollution control was initially effective. During 2015–2018, the changing trend in the AOD in Urumqi showed good consistency with that of the northwest regions, although the average AOD in the urban areas of Urumqi was significantly higher than that of the northwestern regions [
28]. Urumqi is a typical city with atmospheric pollution caused by human activities in northern Xinjiang. From 2012 to 2013, Urumqi city began to implement the coal to NG conversion project. Subsequently, the average AOD in 2012–2015 decreased significantly. This result shows that the implementation of the coal to NG project in Urumqi promoted the improvement of the city’s atmospheric environment.
4.4. Drive Factor Analysis
The main reasons affecting the AOD in Urumqi can be summarized as the two aspects of natural and human activities. A total of eleven comprehensive indicators were used to analyze the dominant factors affecting the AOD changes. For the 11 quantitative evaluation indicators selected above, the gray correlation degree with the AOD was calculated via GRA, and the results are shown in
Figure 8. The results show that temperature is the most notable factor (0.699), followed by HC (0.698), and CL (0.693). It is no surprise that temperature, HC and CL are the most notable factors affecting the AOD because they are closely connected with the daily life of citizens. It is worth noting that the gray correlation coefficient of all indicator factors with the AOD is greater than 0.5, indicating that all index factors have an important impact on the AOD, which is not to be underestimated. Among these factors, NG has the lowest correlation coefficient (0.529), and those of the remaining 10 factors are greater than 0.65. This once again verifies that the AOD is controlled by a variety of natural and human factors with complex genesis conditions. Each factor influences the AOD directly or indirectly and semi-indirectly, such as HC, NG, vehicle ownership, and NPC, and the total industrial energy consumption affects the AOD by directly reducing the particulate matter entering the atmosphere. Population, CL, UGS and precipitation affect the AOD by indirectly interfering with the local climate. Finally, temperature and SH affect the AOD by semi-indirectly influencing cloud formation and particulate matter decomposition.
4.5. Characteristics of the Contaminant Potential Transport Pathways
This study is based on the meteorological dataset from the National Centers for Environmental Prediction (NCEP) and global reanalysis of the global data assimilation system (GDAS), including temperature, air pressure, relative humidity, horizontal and vertical wind speed. The forward and backward trajectories of atmospheric pollutants were simulated by MeteoInfo, thus acquiring the potential sources and transport pathways of pollutants in the spring of 2016 in Urumqi. The main steps are as follows: (1) To determine the latitude and longitude information of the starting location. In this study, the geographic center position of Urumqi (43.82°N, 87.59°E) is the destination position of the backward trajectory and the starting position of the forward trajectory. (2) Define the starting time of the simulation. This study simulates the trajectory in the high-AOD season (March–May). (3) Set the simulation run time. Starting from the initial time, the time interval is 6 h. That is, the 72 h forward and backward trajectories at approximately 00:00, 06:00, 12:00, and 18:00 each day are simulated.
To trace the origins of the air masses arriving at the study domain and the destinations of the air masses leaving the study domain, the HYSPLIT model is used to simulate the 3-day forward and backward movements of pollutants every 6 h. The starting position of the trajectory calculation is 500 m above the ground, and a total of 368 simulated trajectories are generated. Using clustering analysis according to the airflow spatial similarity in the HYSPLIT model, the potential transport paths of pollutants in Urumqi are analyzed, and the potential transport directions and proportions of air parcel trajectories are estimated, as shown in
Figure 9. As shown in the figure, when Urumqi’s air quality is poor in spring, it is not only influenced by local factors, such as heating and transportation, but also by external dust sources, which are an important aspect of air quality deterioration. Spring is a season of continuous gales, and dust storms occur frequently. The external dust sources are mainly Central Asian salt dust sources (41.84%), the Gurbantunggut Desert (24.18%), the southwestern part of Mongolia (23.64%), and the Taklimakan Desert (10.33%), most of which are transported across a short-range. As the transport distance increases, the particles that reach Urumqi decrease gradually in size. This is mainly determined by the weight of the particles; for example, salt dust is lighter than sand dust; thus, the former floats higher and travels farther. An analysis of the pollutant spread in Urumqi reveals that the air parcel trajectories spread mainly to the east and southeast, accounting for 42.12% and 45.11%, respectively. The southeast-moving 45.11% pollutant trajectory with the shortest distance from the origin is principally concentrated at a low level above the surface of the origin, and the diffusion height is approximately 1 km, resulting in the nearby settlement. Within three days, the air parcels can potentially affect North China and parts of Mongolia, with the northeast Korean Peninsula as the farthest reached location, as mentioned above. The larger the influence range of the diffusion trajectory is, the lower the probability of occurrence. Interestingly, the 12.27% diffusion trajectory shifts in the middle phase, turning from the southeast to the southwest and finally reaching southern Xinjiang through the Tianshan Mountains.
5. Discussion
5.1. Influence of the AOD Acquisition Algorithm
Currently, among the aerosol RS algorithms, the DB algorithm is undoubtedly the most suitable AOD inversion algorithm for arid/semiarid areas and has a better inversion ability for bright surfaces [
56]. The problem of the coarse resolution of traditional aerosol products is greatly overcome by the DB algorithm, and the resolution reaches a good scale of 500 m for studying aerosol spatial characteristics. The accuracy of DB aerosol acquisition is mainly determined by the accuracy of surface reflectance estimation and the aerosol mode. The premise of aerosol inversion in this study is as follows: it is assumed that there is no change or only a small change in surface reflectivity within a short period of time. In fact, due to factors such as changes in land-use patterns and vegetation growth, there is inevitably an error in surface reflectivity. Furthermore, when the lookup table is constructed by the 6S radiation transmission model, aerosol parameter selection will affect the simulation results directly, which will affect the satellite inversion AOD results. Moreover, due to the existence of spatial heterogeneity, the uncertainty of sunphotometer measurements and the influence of the BRDF effect, an accurate estimation of the AOD is limited. In the process of inversion, to avoid the influences of different geometric positions on the AOD, it is ensured that in terms of the angle difference between pixels, each pixel has its own observation geometry instead of a scene image sharing an angle value to effectively improve the AOD extraction effect.
5.2. Estimation of the AOD and Uncertainty Analysis
The accuracy of RS-based AOD monitoring is susceptible to surface coverage, weather, and climate. Specifically, the difference in surface coverage may obscure atmosphere information and cause large errors in AOD identification. At the same time, the uncertainty in the Microtops II sunphotometer observations is also not negligible because the observer’s observation behavior and the judgment of the observation conditions differ. In this study, it can be found that the agreement between the site-measured AOD and Landsat inversion AOD is better than that between the site-measured AOD and the MODIS AOD products. As shown in
Figure 2, the trends in the fitting relationships of the AOD retrieved from Landsat and the MODIS AOD products with the ground-observed AOD are consistent. Most of the verification points fall within the expected range, which indicates that the AOD inverted by the improved DB algorithm is credible. It is worth noting that the Landsat inversion AOD is better than the MODIS DB AOD. This may be due to the local nature of some parameters.
The AOD is significantly influenced by different environmental factors. Analyzing the spatiotemporal variation characteristics of the AOD, the highest AOD levels are found in spring; in fact, the AOD in spring is not only high but also varies greatly, which is mainly related to the uncertainty in the gale weather conditions and surface characteristics. In spring, the Earth becomes warmer, snow and ice melt, more land becomes exposed, and the soil is loose. Additionally, windy weather occurs often, which raises the dust from the bare ground, resulting in a large increase in the particulate matter concentration in the air. Combined with the special terrain of Urumqi, the AOD generated by the heating period of the entire winter shrouds Urumqi for a long time, which promotes the increase in AOD in spring [
55]. How to reduce the uncertainty in the AOD estimation is a key aspect of future research, which we hope to quantify in our next study.
5.3. Rehabilitation of the Atmospheric Environment
Currently, how to take effective measures to avoid further urban atmospheric contamination and to rehabilitate the atmospheric environment in dry and semidry typical city regions has attracted scholarly and governmental attention. Severe air pollution will ultimately endanger human health and even limit sustainable urban development. Driving force analysis of the AOD in Urumqi was carried out by GRA in this study, and it was found that the amount of coal burned, construction land, and other factors contribute greatly to the AOD. In fact, the AOD in Urumqi is greatly affected by human activities. Because Urumqi is surrounded by mountains on three sides, pollutants are difficult to diffuse once they are discharged, and they will linger over the city for a long time. All of these factors seriously affect air quality and atmospheric visibility, causing problems in normal human production and life activities. Furthermore, air pollution has increased the incidence of respiratory diseases and has even caused deaths, posing a great threat to the safety of people’s lives and properties [
57,
58]. In the face of serious air pollution and based on the other factors remaining nearly constant over the study period, changes in the atmospheric conditions can be related to the NG project causing the observed decline in the AOD.
Figure 6 shows that since the implementation of the project, the AOD has dropped significantly. This project provides valuable experience for the restoration of the atmospheric environment under similar conditions, especially for the management of the present atmospheric contamination in Urumqi. For the protection and management of atmospheric environments as well as to support sustainable urban development, it might be inevitable to implement atmospheric treatment projects.
However, the AOD has significantly increased since 2016 and has maintained a high level. This implies that when the way of energy utilization is adjusted to a certain level, coal combustion will no longer be the dominant factor influencing air quality. New methods to improve air quality should be introduced, by not only relying on government decision-making but also by paying attention to the protection of the air environment in public activities. For the government, it is necessary to implement new and effective measures to improve urban facilities, rationally adjust the urban layout, promote clean energy, divert and restrict urban cars, optimize public transport, fundamentally reduce the production of pollutants, and improve the environmental air quality. For the public, it is indispensable to respond to the government’s call, use clean energy, advocate public transportation, and cultivate environmental protection awareness.
6. Conclusions
This study combined a series of measured AOD and RS data (i.e., Landsat TM/OLI, MOD09A1, MYD04, meteorological, and socio-economic data) from 2010–2018, and the AOD in the Urumqi area was retrieved at a high spatial resolution. On the basis of the retrieved AOD, we further analyzed the spatial and temporal variations in the AOD, conducted influencing factor analysis, and simulated diffusion trajectories. The conclusions are as follows:
The improved DB algorithm can be applied to urban areas with high surface reflectance and complex surface structures to derive continuous AODs with a high spatial resolution and a high inversion accuracy.
The AOD variation in Urumqi is regional and is greatly affected by the landforms and climate. The spatial AOD distribution decreases from urban to suburban areas. Higher AODs are concentrated in the urban areas and along roads, and strong winds increase the AOD in the Dabancheng area. Among these areas, Xinshi District has the highest AOD, and Urumqi County has the lowest AOD. The seasonal variation in the AOD is notable. The AOD order is spring (0.411) > summer (0.285) > autumn (0.203), with the largest variation in spring. In addition, the range and frequency of the higher values are more apparent in spring than in summer and autumn.
The average AOD in Urumqi is 0.187, and the interannual variation as a whole shows an upward trend. However, from 2010 to 2018, the AOD first declined gradually, then declined significantly, and then reached the lowest value in 2015 (0.076). Next, the AOD increased significantly and reached a peak in 2016 (0.354), while the fluctuation in the AOD was the most significant. Finally, the AOD as a whole decreased from 2016 to 2018. This result shows that the implementation of the coal to NG project in Urumqi has promoted the improvement of the city’s atmospheric environment.
According to GRA, the AOD in Urumqi is influenced by a variety of natural and human factors and is the result of a combination of natural and human factors. Among these factors, the results show that temperature is the most notable factor (0.699), followed by CL (0.693).
The HYSPLIT model is used to simulate the forward and backward trajectories of the severe air pollution season (spring), revealing the sources and destinations of pollutants. It was found that the aerosols observed over the Urumqi domain are associated with long-range transport from Central Asia, and these aerosols can affect the entire northern part of China through long-distance transport.
Author Contributions
Conceptualization, J.D. and J.W.; methodology, X.C. (Xiangyue Chen), X.G. and M.R.; software, X.C. (Xiangyue Chen); validation X.C. (Xiangyue Chen), X.C. (Xiangyue Chen); formal analysis, J.W., X.C. (Xiaoxiao Chen), X.C. (Xiaoyi Cao) and Y.D.; investigation, X.C. (Xiangyue Chen) and J.L.; resources, X.C. (Xiangyue Chen); data curation, X.C. (Xiangyue Chen); writing—original draft preparation, X.C. (Xiangyue Chen); writing—review and editing, X.C. (Xiangyue Chen), J.W., J.D. and Y.D.; visualization, X.C. (Xiangyue Chen), X.G., M.R. and Z.Z.; supervision, J.D. and J.W.; project administration, J.D.; funding acquisition, J.D. All authors have read and agreed to the published version of the manuscript.
Funding
This research was funded by the Scientific Research Project for Higher Educational Universities in Xinjiang Uygur Autonomous Region (No. XJEDU2018I008) and National Natural Science Foundation of China (No. 41961059, 41771470) and Xinjiang Uygur Autonomous Region scientific research and innovation projects of Postgraduates (No. XJ2019G053).
Acknowledgments
The authors wish to thank all co-authors of this article for their help and support, especially Jingzhe Wang. We are especially grateful to the anonymous reviewers and editors for reviewing our manuscript and for offering instructive comments, which strengthened the manuscript. In addition, we would like to thank AJE (
http://secure.aje.com) for providing linguistic assistance during the preparation of this manuscript.
Conflicts of Interest
The authors declare no conflict of interest.
References
- Kaufman, Y.J.; Tanré, D.; Boucher, O. A satellite view of aerosols in the climate system. Nature 2002, 419, 215. [Google Scholar] [CrossRef] [PubMed]
- Baltensperger, U.; Prévôt, A.S. Chemical analysis of atmospheric aerosols. Anal. Bioanal. Chem. 2008, 390, 277–280. [Google Scholar] [CrossRef] [PubMed] [Green Version]
- Mehta, M.; Singh, R.; Singh, A.; Singh, N. Recent global aerosol optical depth variations and trends—A comparative study using MODIS and MISR level 3 datasets. Remote Sens. Environ. 2016, 181, 137–150. [Google Scholar] [CrossRef]
- Myhre, G.; Samset, B.H.; Schulz, M.; Balkanski, Y.; Bauer, S.; Berntsen, T.K.; Bian, H.; Bellouin, N.; Chin, M.; Diehl, T. Radiative forcing of the direct aerosol effect from AeroCom Phase II simulations. Atmos. Chem. Phys. 2013, 13, 1853. [Google Scholar] [CrossRef] [Green Version]
- Wang, K.; Dickinson, R.E.; Liang, S. Clear sky visibility has decreased over land globally from 1973 to 2007. Science 2009, 323, 1468–1470. [Google Scholar] [CrossRef] [PubMed]
- Shi, Y.R.; Levy, R.C.; Eck, T.F.; Fisher, B.; Mattoo, S.; Remer, L.A.; Slutsker, I.; Zhang, J. Characterizing the 2015 Indonesia fire event using modified MODIS aerosol retrievals. Atmos. Chem. Phys. 2019, 19, 259–274. [Google Scholar] [CrossRef] [Green Version]
- Xu, F.; Diner, D.J.; Dubovik, O.; Schechner, Y. A Correlated Multi-Pixel Inversion Approach for Aerosol Remote Sensing. Remote Sens. 2019, 11, 746. [Google Scholar] [CrossRef] [Green Version]
- Remer, L.A.; Kaufman, Y.; Tanré, D.; Mattoo, S.; Chu, D.; Martins, J.V.; Li, R.-R.; Ichoku, C.; Levy, R.; Kleidman, R. The MODIS aerosol algorithm, products, and validation. J. Atmos. Sci. 2005, 62, 947–973. [Google Scholar] [CrossRef] [Green Version]
- Levy, R.C.; Remer, L.A.; Mattoo, S.; Vermote, E.F.; Kaufman, Y.J. Second-generation operational algorithm: Retrieval of aerosol properties over land from inversion of Moderate Resolution Imaging Spectroradiometer spectral reflectance. J. Geophys. Res. Atmos. 2007, 112, D13. [Google Scholar] [CrossRef] [Green Version]
- Holben, B.; Vermote, E.; Kaufman, Y.J.; Tanré, D.; Kalb, V. Aerosol retrieval over land from AVHRR data-application for atmospheric correction. Ieee Trans. Geosci. Remote Sens. 1992, 30, 212–222. [Google Scholar] [CrossRef]
- Hsu, N.; Jeong, M.J.; Bettenhausen, C.; Sayer, A.; Hansell, R.; Seftor, C.; Huang, J.; Tsay, S.C. Enhanced Deep Blue aerosol retrieval algorithm: The second generation. J. Geophys. Res. Atmos. 2013, 118, 9296–9315. [Google Scholar] [CrossRef]
- Almazroui, M. A comparison study between AOD data from MODIS deep blue collections 51 and 06 and from AERONET over Saudi Arabia. Atmos. Res. 2019, 225, 88–95. [Google Scholar] [CrossRef]
- Deuzé, J.L.; Bréon, F.M.; Devaux, C.; Goloub, P.; Herman, M.; Lafrance, B.; Maignan, F.; Marchand, A.; Nadal, F.; Perry, G. Remote sensing of aerosols over land surfaces from POLDER-ADEOS-1 polarized measurements. J. Geophys. Res. Atmos. 2001, 106, 4913–4926. [Google Scholar] [CrossRef] [Green Version]
- Diner, D.J.; Braswell, B.H.; Davies, R.; Gobron, N.; Hu, J.; Jin, Y.; Kahn, R.A.; Knyazikhin, Y.; Loeb, N.; Muller, J.-P. The value of multiangle measurements for retrieving structurally and radiatively consistent properties of clouds, aerosols, and surfaces. Remote Sens. Environ. 2005, 97, 495–518. [Google Scholar] [CrossRef]
- Ginoux, P.; Garbuzov, D.; Hsu, N.C. Identification of anthropogenic and natural dust sources using Moderate Resolution Imaging Spectroradiometer (MODIS) Deep Blue level 2 data. J. Geophys. Res. Atmos. 2010, 115, D5. [Google Scholar] [CrossRef] [Green Version]
- Mhawish, A.; Banerjee, T.; Sorek-Hamer, M.; Lyapustin, A.; Broday, D.M.; Chatfield, R. Comparison and evaluation of MODIS Multi-angle Implementation of Atmospheric Correction (MAIAC) aerosol product over South Asia. Remote Sens. Environ. 2019, 224, 12–28. [Google Scholar] [CrossRef]
- Mhawish, A.; Banerjee, T.; Broday, D.M.; Misra, A.; Tripathi, S.N. Evaluation of MODIS Collection 6 aerosol retrieval algorithms over Indo-Gangetic Plain: Implications of aerosols types and mass loading. Remote Sens. Environ. 2017, 201, 297–313. [Google Scholar] [CrossRef]
- Wang, Z.; Gao, Z.; Li, Q.; Wang, W.; Chen, L.; Li, S. Urban aerosol monitoring over Ning-Bo from HJ-1. In 2012 IEEE International Geoscience and Remote Sensing Symposium; IEEE: Piscataway Township, NJ, USA, 2012; pp. 2520–2523. [Google Scholar]
- Tian, X.; Liu, Q.; Song, Z.; Dou, B.; Li, X. Aerosol optical depth retrieval from Landsat 8 OLI images over urban areas supported by MODIS BRDF/Albedo Data. Ieee Geosci. Remote Sens. Lett. 2018, 15, 976–980. [Google Scholar] [CrossRef]
- Sun, K.; Chen, X.; Wang, J.; Zhang, T.; Zhu, Z. Investigation of air quality over the largest city in central China using high resolution satellite derived aerosol optical depth data. Atmos. Pollut. Res. 2018, 9, 584–593. [Google Scholar] [CrossRef] [Green Version]
- Sun, K.; Chen, X.; Zhu, Z.; Zhang, T. High resolution aerosol optical depth retrieval using Gaofen-1 WFV camera data. Remote Sens. 2017, 9, 89. [Google Scholar] [CrossRef] [Green Version]
- Zhang, X.-X.; Sharratt, B.; Chen, X.; Wang, Z.-F.; Liu, L.-Y.; Guo, Y.-H.; Li, J.; Chen, H.-S.; Yang, W.-Y. Dust deposition and ambient PM 10 concentration in northwest China: Spatial and temporal variability. Atmos. Chem. Phys. 2017, 17, 1699–1711. [Google Scholar] [CrossRef] [Green Version]
- Mamtimin, B.; Meixner, F.X. Air pollution and meteorological processes in the growing dryland city of Urumqi (Xinjiang, China). Sci. Total Environ. 2011, 409, 1277–1290. [Google Scholar] [CrossRef] [PubMed]
- Huang, R.-J.; Zhang, Y.; Bozzetti, C.; Ho, K.-F.; Cao, J.-J.; Han, Y.; Daellenbach, K.R.; Slowik, J.G.; Platt, S.M.; Canonaco, F. High secondary aerosol contribution to particulate pollution during haze events in China. Nature 2014, 514, 218. [Google Scholar] [CrossRef] [PubMed] [Green Version]
- Calvo, A.; Alves, C.; Castro, A.; Pont, V.; Vicente, A.; Fraile, R. Research on aerosol sources and chemical composition: Past, current and emerging issues. Atmos. Res. 2013, 120, 1–28. [Google Scholar] [CrossRef]
- Crippa, M.; El Haddad, I.; Slowik, J.G.; DeCarlo, P.F.; Mohr, C.; Heringa, M.F.; Chirico, R.; Marchand, N.; Sciare, J.; Baltensperger, U. Identification of marine and continental aerosol sources in Paris using high resolution aerosol mass spectrometry. J. Geophys. Res. Atmos. 2013, 118, 1950–1963. [Google Scholar] [CrossRef] [Green Version]
- Budisulistiorini, S.H.; Baumann, K.; Edgerton, E.S.; Bairai, S.T.; Mueller, S.; Shaw, S.L.; Knipping, E.M.; Gold, A.; Surratt, J.D. Seasonal characterization of submicron aerosol chemical composition and organic aerosol sources in the southeastern United States: Atlanta, Georgia, and Look Rock, Tennessee. Atmos. Chem. Phys. 2016, 16, 5171–5189. [Google Scholar] [CrossRef] [Green Version]
- Tian, X.; Liu, S.; Sun, L.; Liu, Q. Retrieval of aerosol optical depth in the arid or semiarid region of northern Xinjiang, China. Remote Sens. 2018, 10, 197. [Google Scholar] [CrossRef] [Green Version]
- Ångström, A. The parameters of atmospheric turbidity. Tellus 1964, 16, 64–75. [Google Scholar] [CrossRef] [Green Version]
- Jiang, P.; Yang, J.; Huang, C.; Liu, H. The contribution of socioeconomic factors to PM2. 5 pollution in urban China. Environ. Pollut. 2018, 233, 977–985. [Google Scholar] [CrossRef]
- Ichoku, C.; Chu, D.A.; Mattoo, S.; Kaufman, Y.J.; Remer, L.A.; Tanré, D.; Slutsker, I.; Holben, B.N. A spatio-temporal approach for global validation and analysis of MODIS aerosol products. Geophys. Res. Lett. 2002, 29, MOD1-1–MOD1-4. [Google Scholar] [CrossRef] [Green Version]
- Holben, B.N.; Eck, T.F.; Slutsker, I.; Tanre, D.; Buis, J.; Setzer, A.; Vermote, E.; Reagan, J.A.; Kaufman, Y.; Nakajima, T. AERONET—A federated instrument network and data archive for aerosol characterization. Remote Sens. Environ. 1998, 66, 1–16. [Google Scholar] [CrossRef]
- Sayer, A.; Hsu, N.; Bettenhausen, C.; Jeong, M.; Holben, B.; Zhang, J. Global and regional evaluation of over-land spectral aerosol optical depth retrievals from SeaWiFS. Atmos. Meas. Tech. 2012, 5, 1761–1778. [Google Scholar] [CrossRef] [Green Version]
- Chen, X.; Ding, J.; Wang, J.; Ge, X.; Liang, J. Spatiotemporal Evolution and Driving Mechanism of Aerosol Optical Depth in the Ebinur Lake Basin. Environ. Sci. 2019, 40, 4824–4832. [Google Scholar]
- Kaufman, Y.; Tanré, D.; Remer, L.; Vermote, E.; Chu, A.; Holben, B. Remote sensing of tropospheric aerosol from EOS-MODIS over the land using dark targets and dynamic aerosol models. J. Geophys. Res 1997, 102, 17051–17067. [Google Scholar] [CrossRef]
- Li, Z.; Zhao, X.; Kahn, R.; Mishchenko, M.; Remer, L.; Lee, K.; Wang, M.; Laszlo, I.; Nakajima, T.; Maring, H. Uncertainties in satellite remote sensing of aerosols and impact on monitoring its long-term trend: A review and perspective. Ann. Geophys 2009, 27, 2755–2770. [Google Scholar] [CrossRef]
- He, D.; Yi, G.; Zhang, T.; Miao, J.; Li, J.; Bie, X. Temporal and spatial characteristics of EVI and its response to climatic factors in recent 16 years based on grey relational analysis in inner Mongolia Autonomous Region, China. Remote Sens. 2018, 10, 961. [Google Scholar] [CrossRef] [Green Version]
- Yao, Z.; Wei, Z. Correlation analysis between vegetation fraction and vegetation indices in reclaimed forest: A case study in Pingshuo mining area. In Proceedings of the IEEE International Workshop on Earth Observation and Remote Sensing Applications, Guangzhou, China, 4–6 July 2016; pp. 122–126. [Google Scholar]
- Morán, J.; Granada, E.; Míguez, J.; Porteiro, J. Use of grey relational analysis to assess and optimize small biomass boilers. Fuel Process. Technol. 2006, 87, 123–127. [Google Scholar] [CrossRef]
- Wang, J.; Ding, J.; Yu, D.; Ma, X.; Zhang, Z.; Ge, X.; Teng, D.; Li, X.; Liang, J.; Lizaga, I. Capability of Sentinel-2 MSI data for monitoring and mapping of soil salinity in dry and wet seasons in the Ebinur Lake region, Xinjiang, China. Geoderma 2019, 353, 172–187. [Google Scholar] [CrossRef]
- Kuo, Y.; Yang, T.; Huang, G.-W. The use of grey relational analysis in solving multiple attribute decision-making problems. Comput. Ind. Eng. 2008, 55, 80–93. [Google Scholar] [CrossRef]
- Stein, A.; Draxler, R.R.; Rolph, G.D.; Stunder, B.J.; Cohen, M.; Ngan, F. NOAA’s HYSPLIT atmospheric transport and dispersion modeling system. Bull. Am. Meteorol. Soc. 2015, 96, 2059–2077. [Google Scholar] [CrossRef]
- Ge, Y.; Abuduwaili, J.; Ma, L.; Wu, N.; Liu, D. Potential transport pathways of dust emanating from the playa of Ebinur Lake, Xinjiang, in arid northwest China. Atmos. Res. 2016, 178, 196–206. [Google Scholar] [CrossRef]
- Chai, T.; Crawford, A.; Stunder, B.; Pavolonis, M.J.; Draxler, R.; Stein, A. Improving volcanic ash predictions with the HYSPLIT dispersion model by assimilating MODIS satellite retrievals. Atmos. Chem. Phys. 2017, 17, 2865–2879. [Google Scholar] [CrossRef] [Green Version]
- Doğan, T.R.; Yeşilnacar, M.İ.; Cullu, M.A. Seasonal Investigation of Atmospheric Desert Dust Affecting Sanliurfa Using Modis Satellite and Hysplit Model Data. Sigma J. Eng. Nat. Sci. -Sigma Muhendis. Ve Fen Bilimleri Derg. 2018, 36, 905–916. [Google Scholar]
- Alam, K.; Qureshi, S.; Blaschke, T. Monitoring spatio-temporal aerosol patterns over Pakistan based on MODIS, TOMS and MISR satellite data and a HYSPLIT model. Atmos. Environ. 2011, 45, 4641–4651. [Google Scholar] [CrossRef]
- Escudero, M.; Stein, A.; Draxler, R.; Querol, X.; Alastuey, A.; Castillo, S.; Avila, A. Source apportionment for African dust outbreaks over the Western Mediterranean using the HYSPLIT model. Atmos. Res. 2011, 99, 518–527. [Google Scholar] [CrossRef]
- Rolph, G.; Stein, A.; Stunder, B. Real-time environmental applications and display sYstem: READY. Environ. Model. Softw. 2017, 95, 210–228. [Google Scholar] [CrossRef]
- Sun, L.; Wei, J.; Bilal, M.; Tian, X.; Jia, C.; Guo, Y.; Mi, X. Aerosol optical depth retrieval over bright areas using Landsat 8 OLI images. Remote Sens. 2016, 8, 23. [Google Scholar] [CrossRef] [Green Version]
- Tian, X.; Liu, Q.; Li, X.; Wei, J. Validation and Comparison of MODIS C6. 1 and C6 Aerosol Products over Beijing, China. Remote Sens. 2018, 10, 2021. [Google Scholar] [CrossRef] [Green Version]
- Karimi, N.; Namdari, S.; Sorooshian, A.; Bilal, M.; Heidary, P. Evaluation and modification of SARA high-resolution AOD retrieval algorithm during high dust loading conditions over bright desert surfaces. Atmos. Pollut. Res. 2019, 10, 1005–1014. [Google Scholar] [CrossRef]
- Kim, D.; Kim, J.; Jeong, J.; Choi, M. Estimation of health benefits from air quality improvement using the MODIS AOD dataset in Seoul, Korea. Environ. Res. 2019, 173, 452–461. [Google Scholar] [CrossRef]
- Zhang, Z.; Ding, J.; Wang, J. Spatio-temporal variations and potential diffusion characteristics of dust aerosol originating from CentralAsia. Acta Geogr. Sinca 2017, 72, 507–520. [Google Scholar]
- Zhao, C.; Liu, Z.; Wang, Q.; Ban, J.; Chen, N.X.; Li, T. High-resolution daily AOD estimated to full coverage using the random forest model approach in the Beijing-Tianjin-Hebei region. Atmos. Environ. 2019, 203, 70–78. [Google Scholar] [CrossRef]
- Li, X.; Xia, X.; Che, H.; Yu, X.; Liu, Y.; Dubovik, O.; Goloub, P.; Holben, B.; Estellés, V. Contrast in column-integrated aerosol optical properties during heating and non-heating seasons at Urumqi-Its causes and implications. Atmos. Res. 2017, 191, 34–43. [Google Scholar] [CrossRef]
- Hsu, N.C.; Tsay, S.-C.; King, M.D.; Herman, J.R. Deep blue retrievals of Asian aerosol properties during ACE-Asia. Ieee Trans. Geosci. Remote Sens. 2006, 44, 3180–3195. [Google Scholar] [CrossRef]
- Zhou, M.; He, G.; Fan, M.; Wang, Z.; Liu, Y.; Ma, J.; Ma, Z.; Liu, J.; Liu, Y.; Wang, L. Smog episodes, fine particulate pollution and mortality in China. Environ. Res. 2015, 136, 396–404. [Google Scholar] [CrossRef]
- Xing, Y.-F.; Xu, Y.-H.; Shi, M.-H.; Lian, Y.-X. The impact of PM2. 5 on the human respiratory system. J. Thorac. Dis. 2016, 8, E69. [Google Scholar]
Figure 1.
Location of Urumqi in Xinjiang Uygur Autonomous Region. (a) Xinjiang and insert of China. (b) Map of the study area.
Figure 1.
Location of Urumqi in Xinjiang Uygur Autonomous Region. (a) Xinjiang and insert of China. (b) Map of the study area.
Figure 2.
Comparison between the AOD retrieved from (a) Landsat8 OLI images and (b) MYD04 C6 DB AOD against observations using a sunphotometer. The blue line is the regression line, the black solid line is the 1:1 line, and the black dashed lines indicate the 95% confidence range.
Figure 2.
Comparison between the AOD retrieved from (a) Landsat8 OLI images and (b) MYD04 C6 DB AOD against observations using a sunphotometer. The blue line is the regression line, the black solid line is the 1:1 line, and the black dashed lines indicate the 95% confidence range.
Figure 3.
Retrieved AOD using Landsat data from 2000–2015. The label on the left represents the year, and the label above represents spring, summer, autumn, and the average.
Figure 3.
Retrieved AOD using Landsat data from 2000–2015. The label on the left represents the year, and the label above represents spring, summer, autumn, and the average.
Figure 4.
Spatial distribution of the average AOD in different seasons (Spring, Summer, Autumn, and mean value) from 2010 to 2018.
Figure 4.
Spatial distribution of the average AOD in different seasons (Spring, Summer, Autumn, and mean value) from 2010 to 2018.
Figure 5.
Time distribution of the average AOD. The polar axis of (a) is the AOD, and the labels around it represent the year. (b) Different levels of AOD seasonal variations.
Figure 5.
Time distribution of the average AOD. The polar axis of (a) is the AOD, and the labels around it represent the year. (b) Different levels of AOD seasonal variations.
Figure 6.
The dynamic changes of AOD in the study area from 2010 to 2018.
Figure 6.
The dynamic changes of AOD in the study area from 2010 to 2018.
Figure 7.
Inter-annual AOD variation at the different levels in Urumqi from 2010 to 2018.
Figure 7.
Inter-annual AOD variation at the different levels in Urumqi from 2010 to 2018.
Figure 8.
Gray correlation coefficient between the AOD and the impact factors. T, HC, CL, TIC, P, MVO, NPC, PL, SH, UGS and NG represents temperature, heating coal consumption, construction land, total industrial consumption, precipitation, motor vehicle ownership, number of private cars, population, sunshine hours, urban green space and natural gas, respectively.
Figure 9.
Cluster analysis of the air parcel trajectories from Urumqi in the spring of 2016. (a) Backward trajectory and (b) forward trajectory.
Figure 9.
Cluster analysis of the air parcel trajectories from Urumqi in the spring of 2016. (a) Backward trajectory and (b) forward trajectory.
© 2020 by the authors. Licensee MDPI, Basel, Switzerland. This article is an open access article distributed under the terms and conditions of the Creative Commons Attribution (CC BY) license (http://creativecommons.org/licenses/by/4.0/).


 ,
, 


