Mapping and Quantifying the Human-Environment Interactions in Middle Egypt Using Machine Learning and Satellite Data Fusion Techniques


Abstract
:
1. Introduction
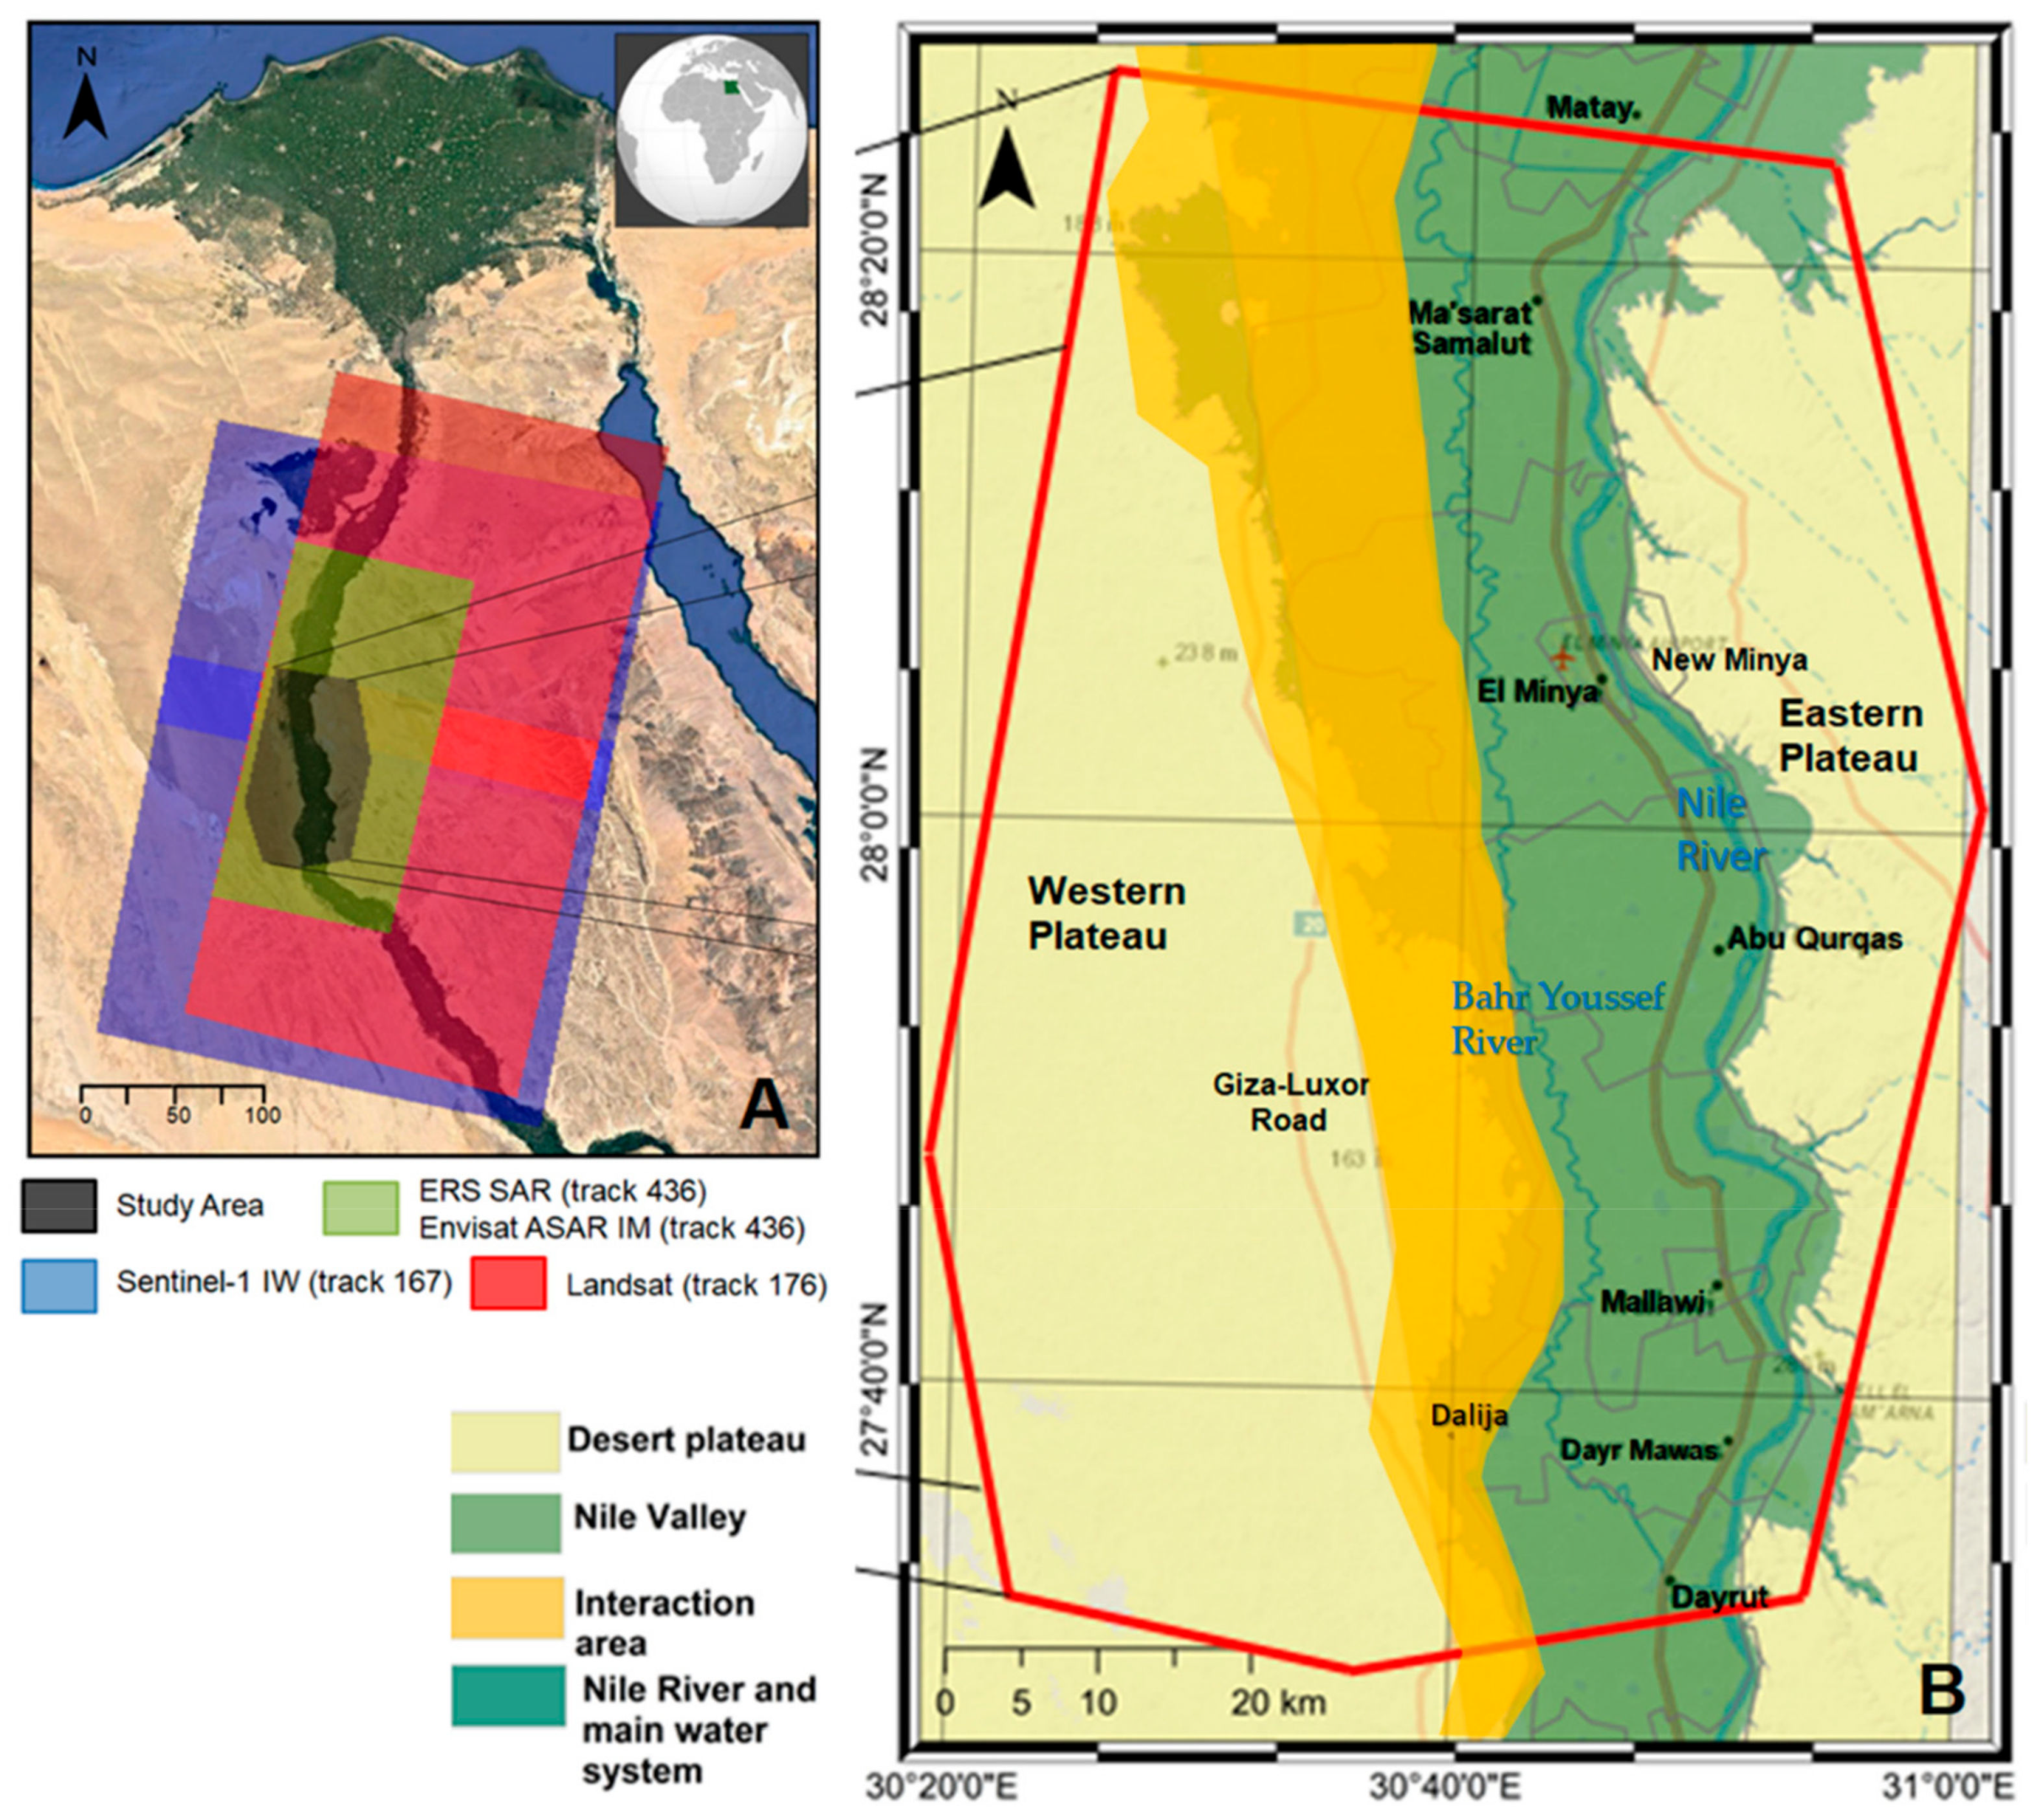
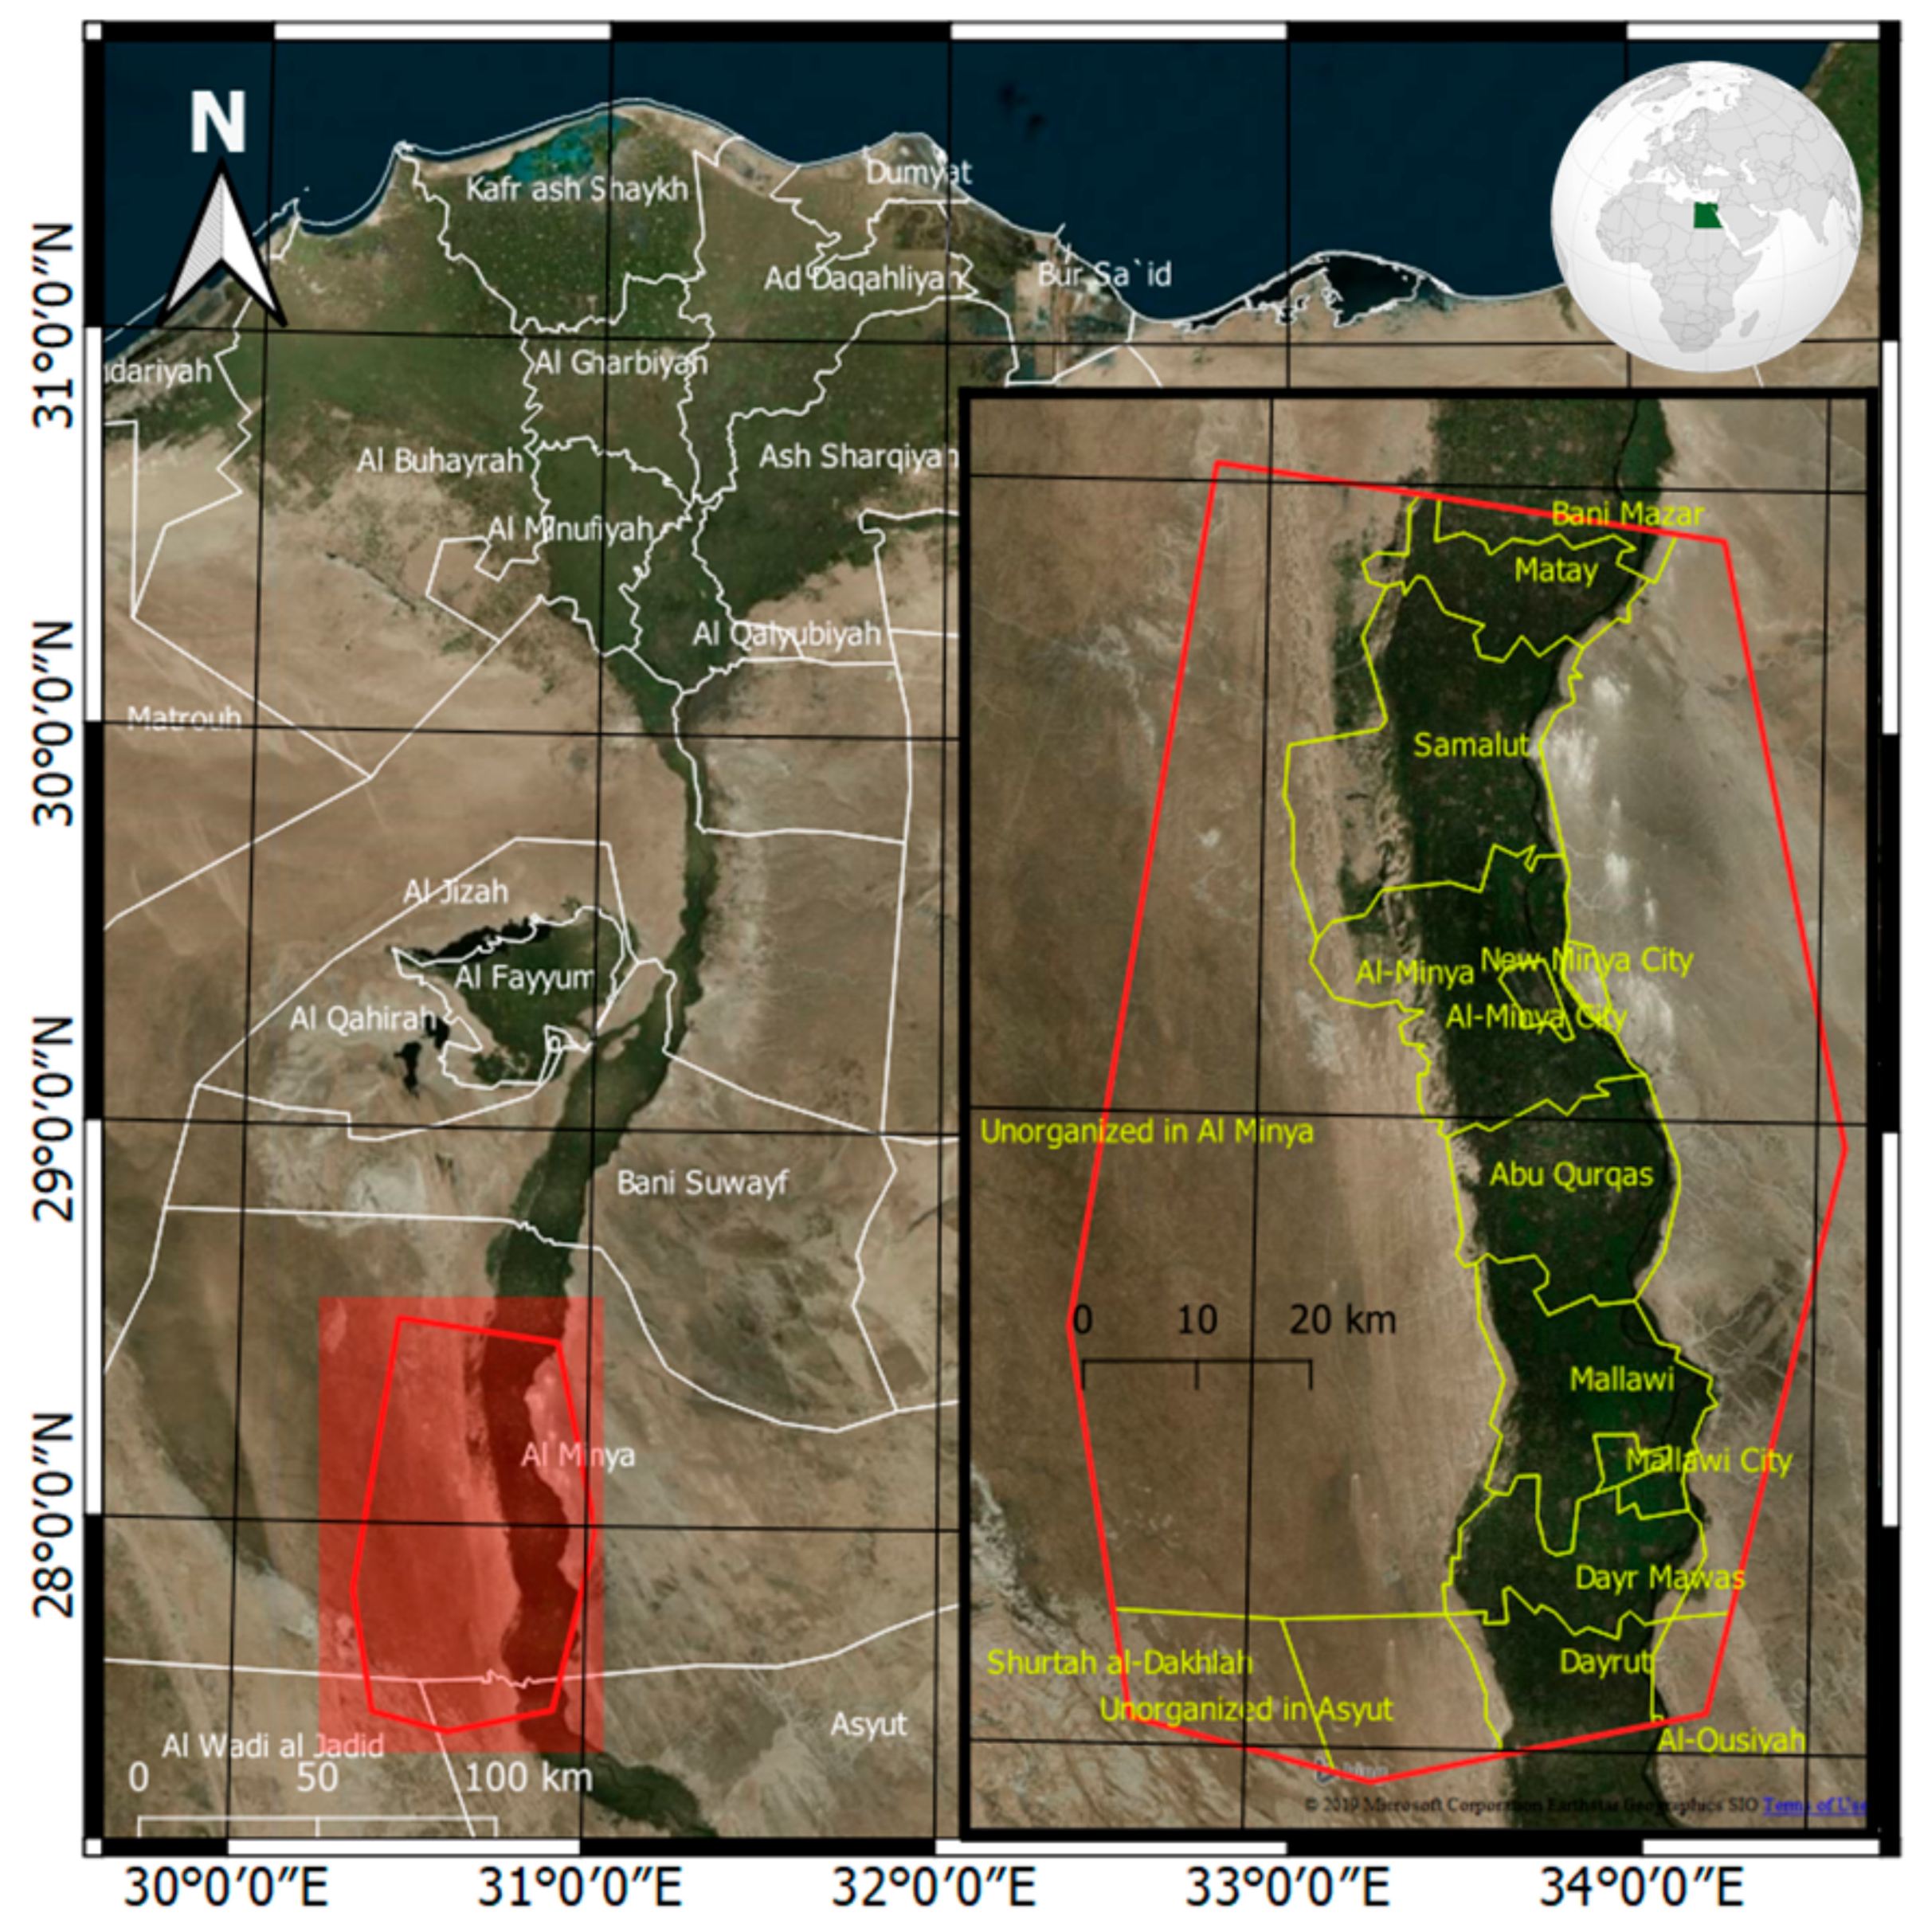
2. The Study Area
3. Materials and Methods
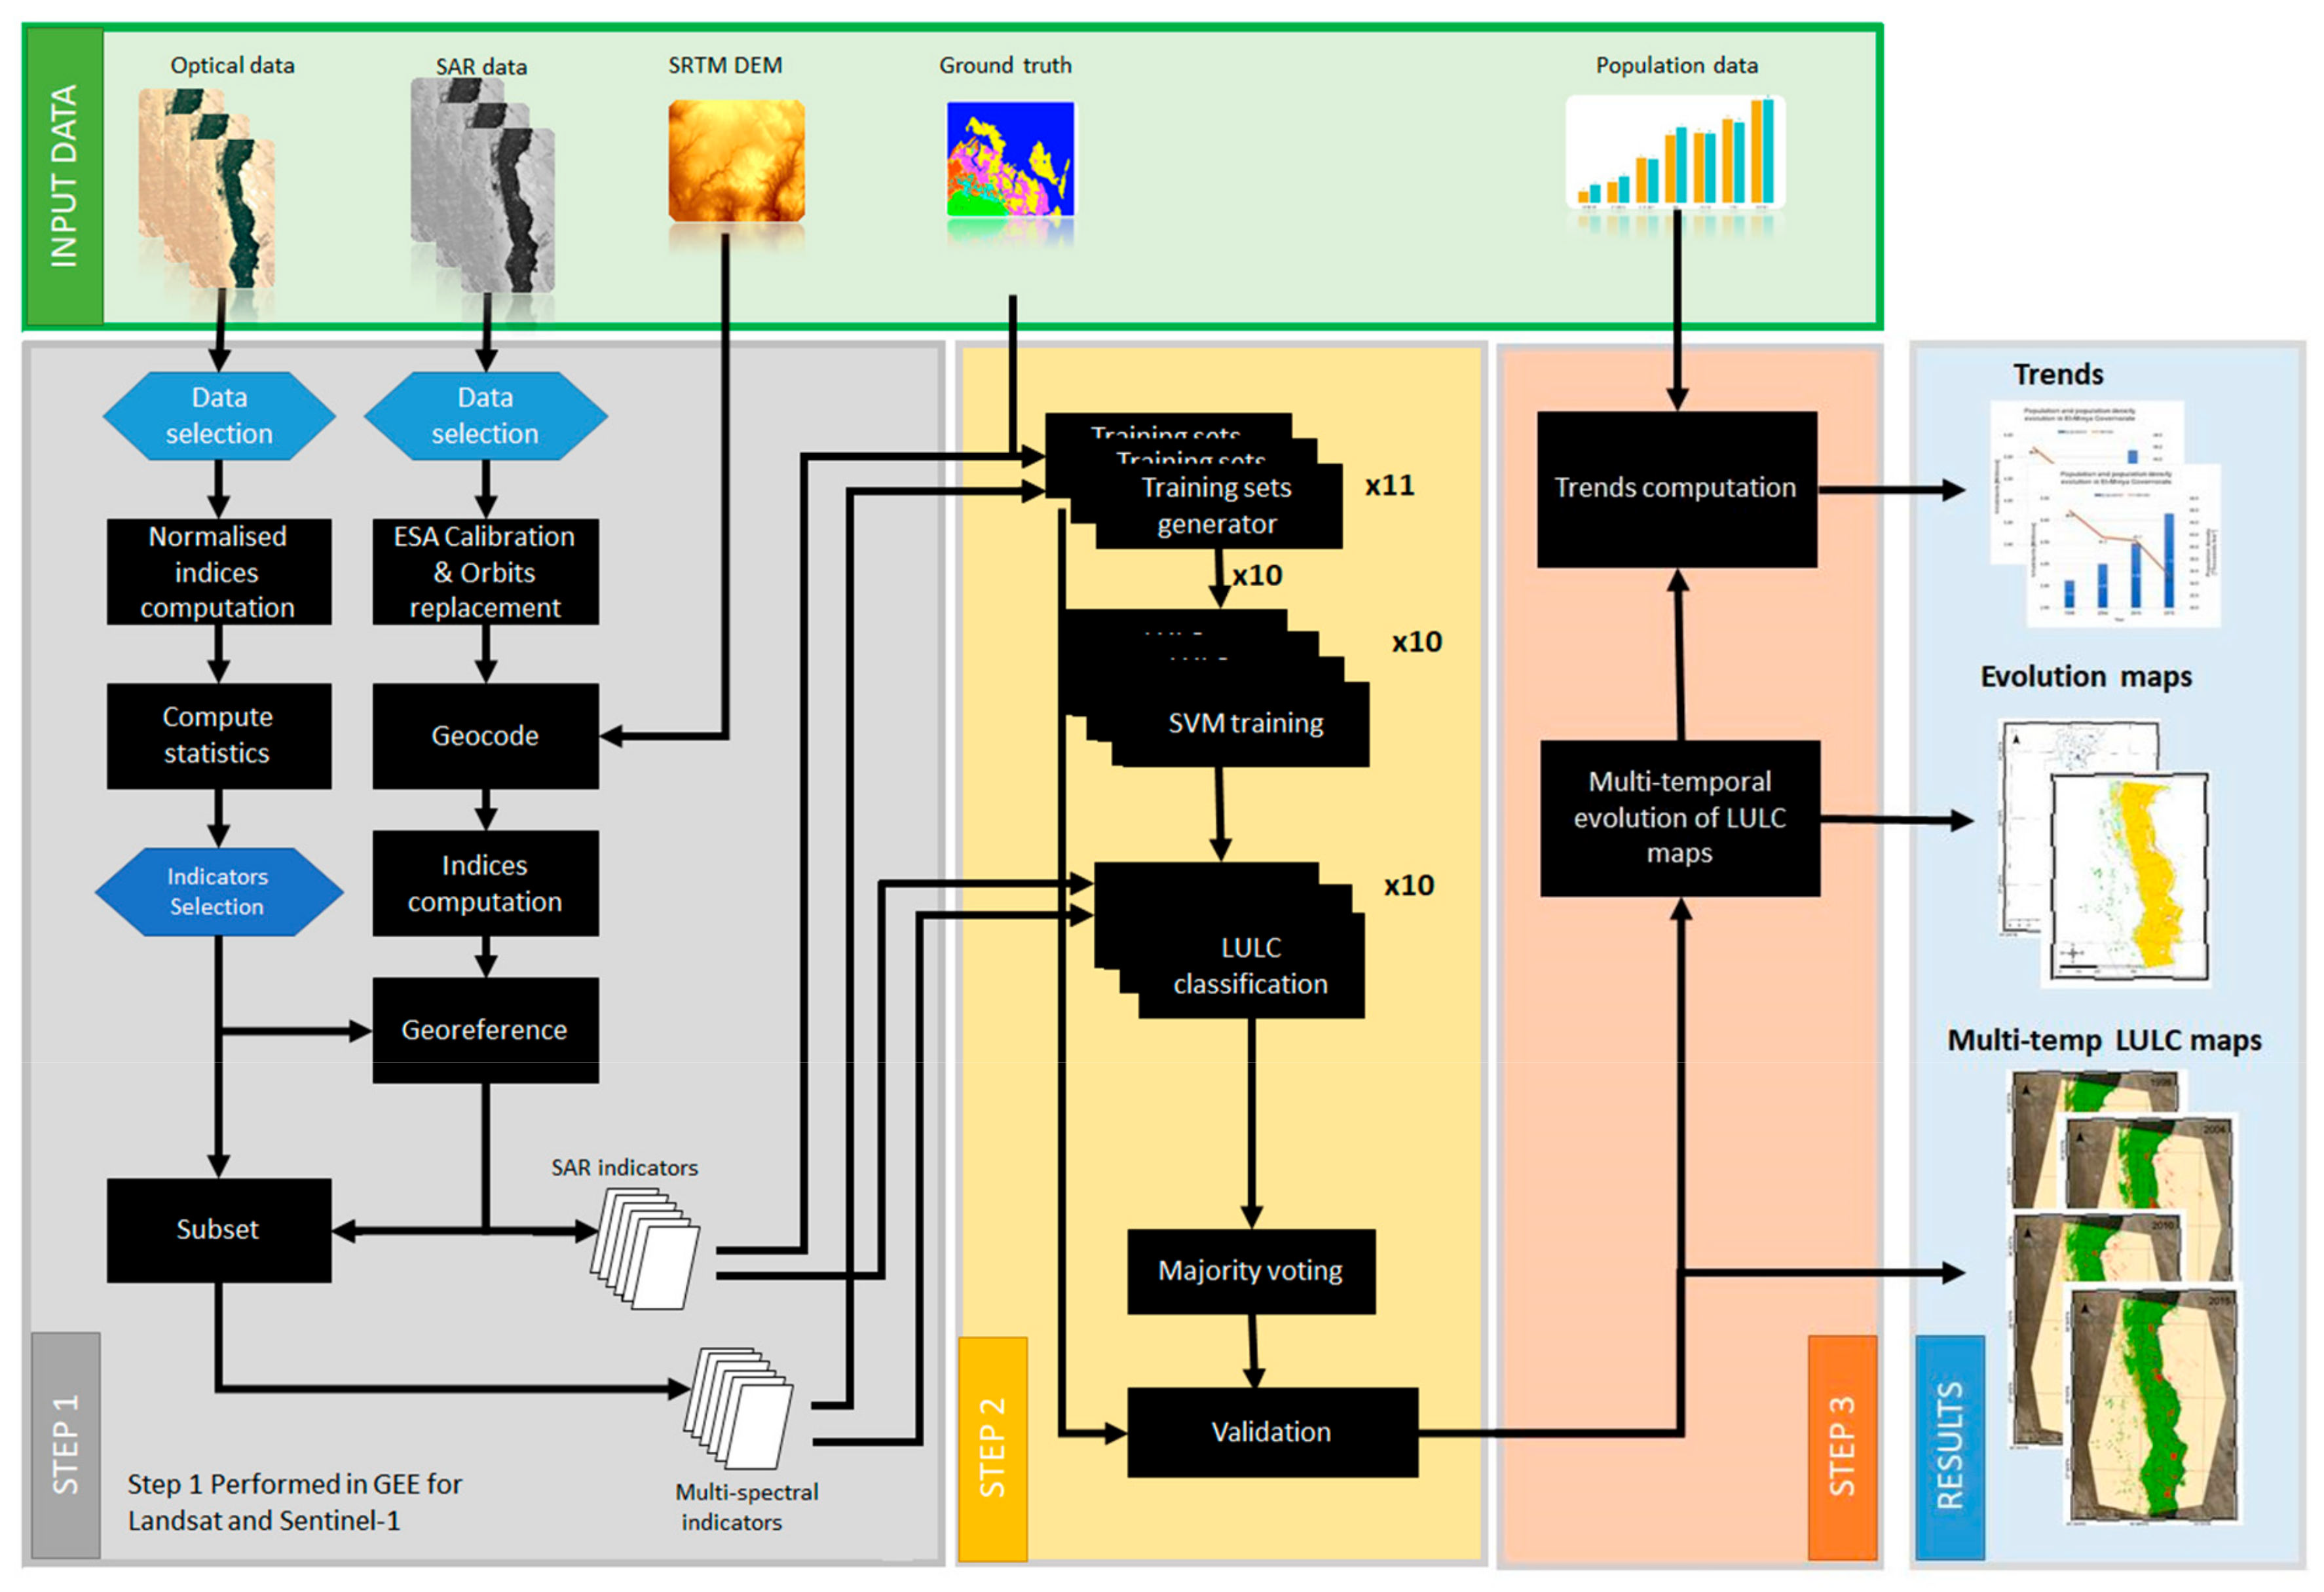
3.1. Step 1: Data Preparation and Indicators Extraction
Satellite-Derived Indicators for Land-Cover Classification
3.2. Step 2: Land Cover Mapping
3.2.1. Supervised Classifiers
3.2.2. Land Cover Classes
3.2.3. Land Cover Classification
3.2.4. Validation Approaches
3.2.4.1. Validation against Ground Truth Datasets
3.2.4.2. Comparison with State-of-the-Art Datasets
3.3. Step 3: Multi-Temporal Evolution Analysis
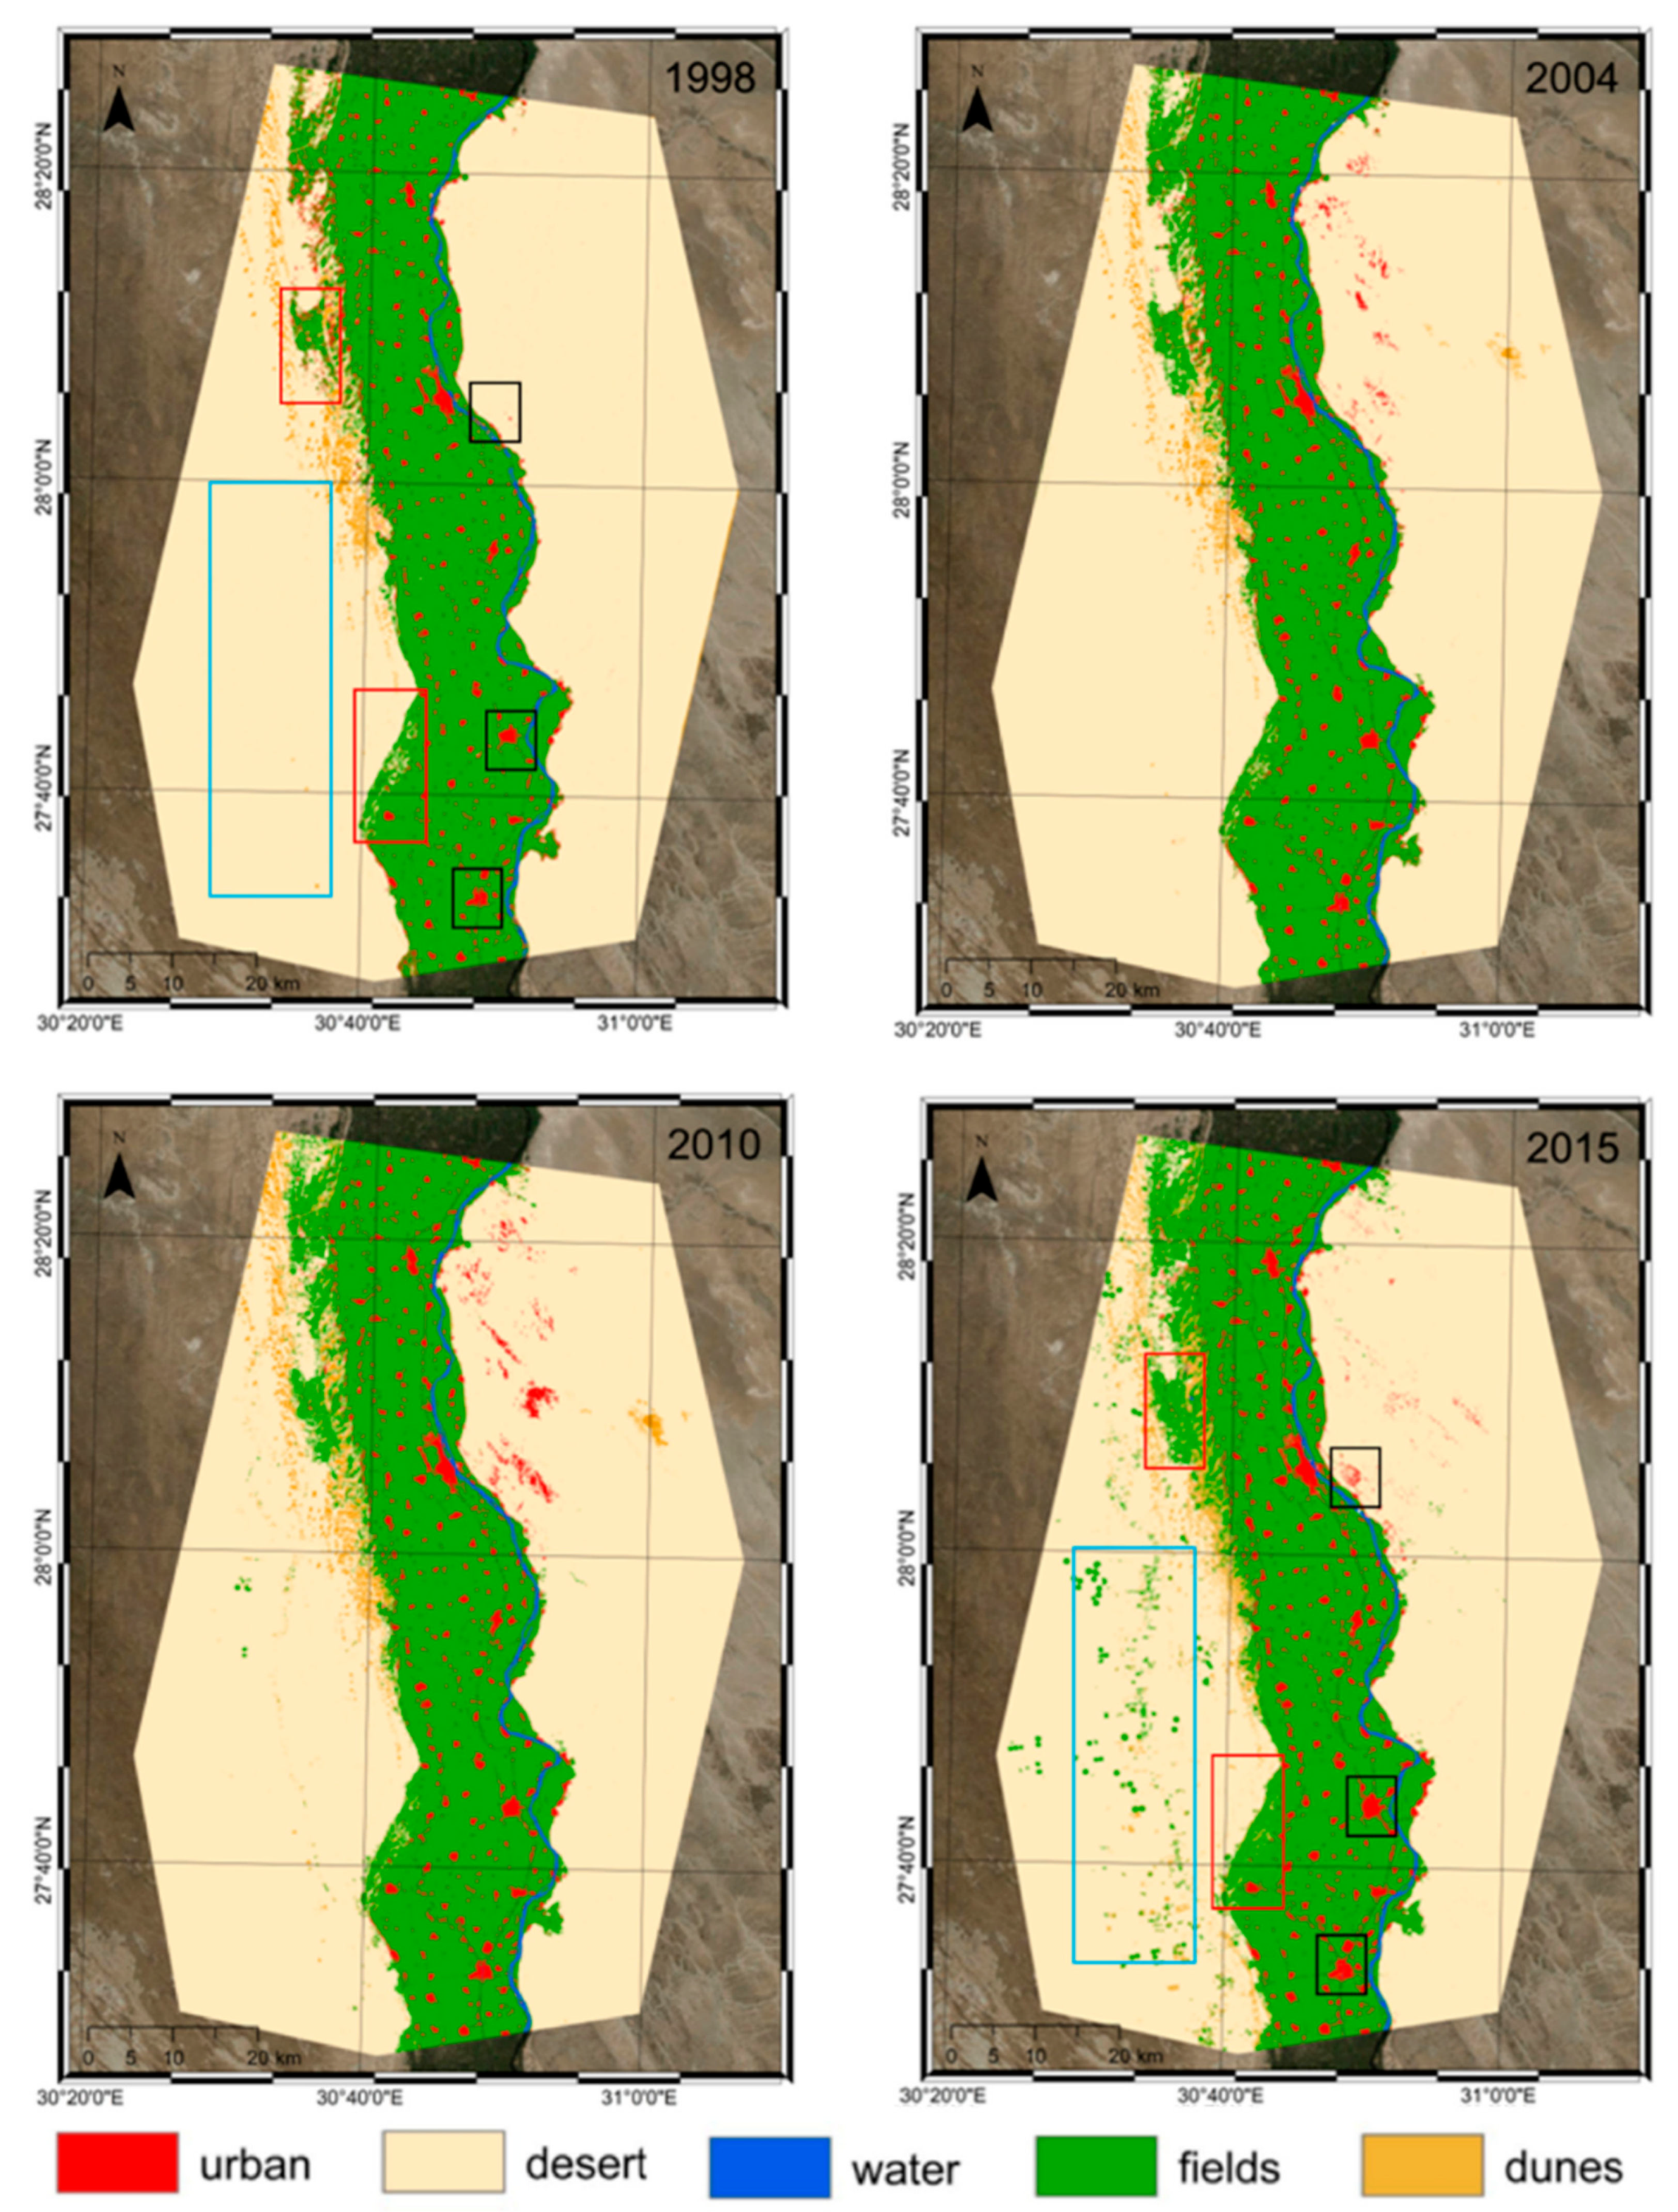
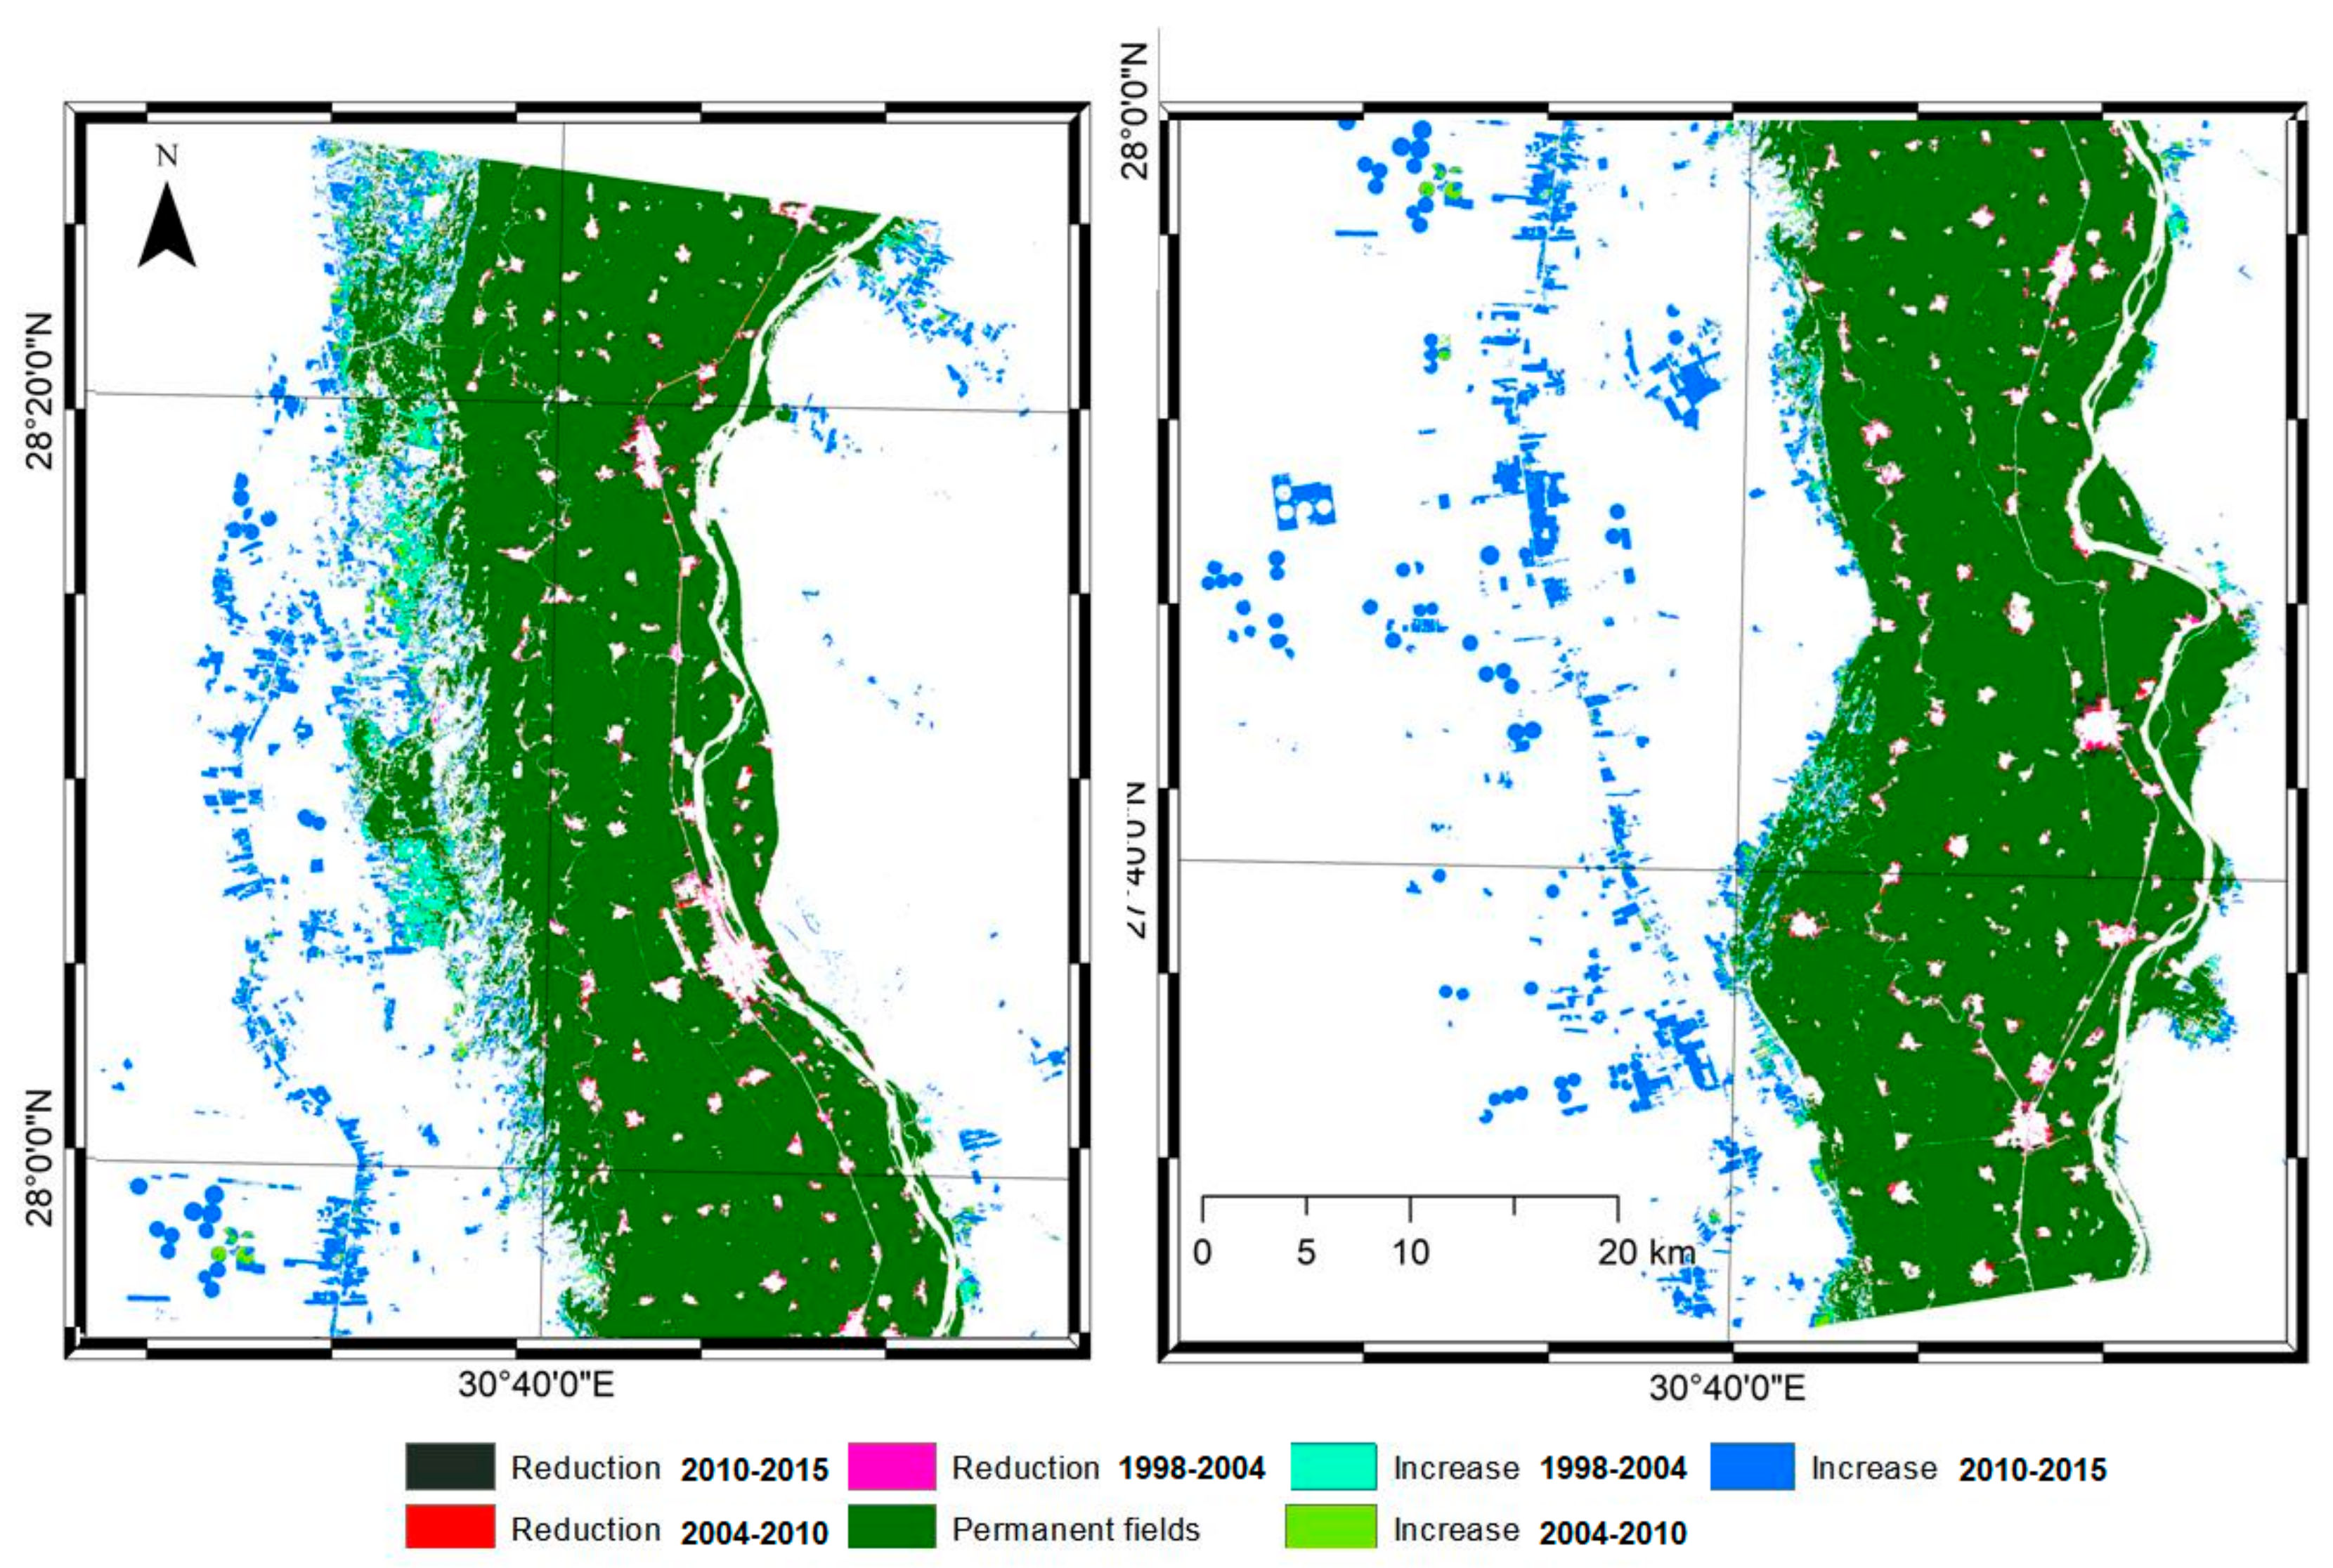
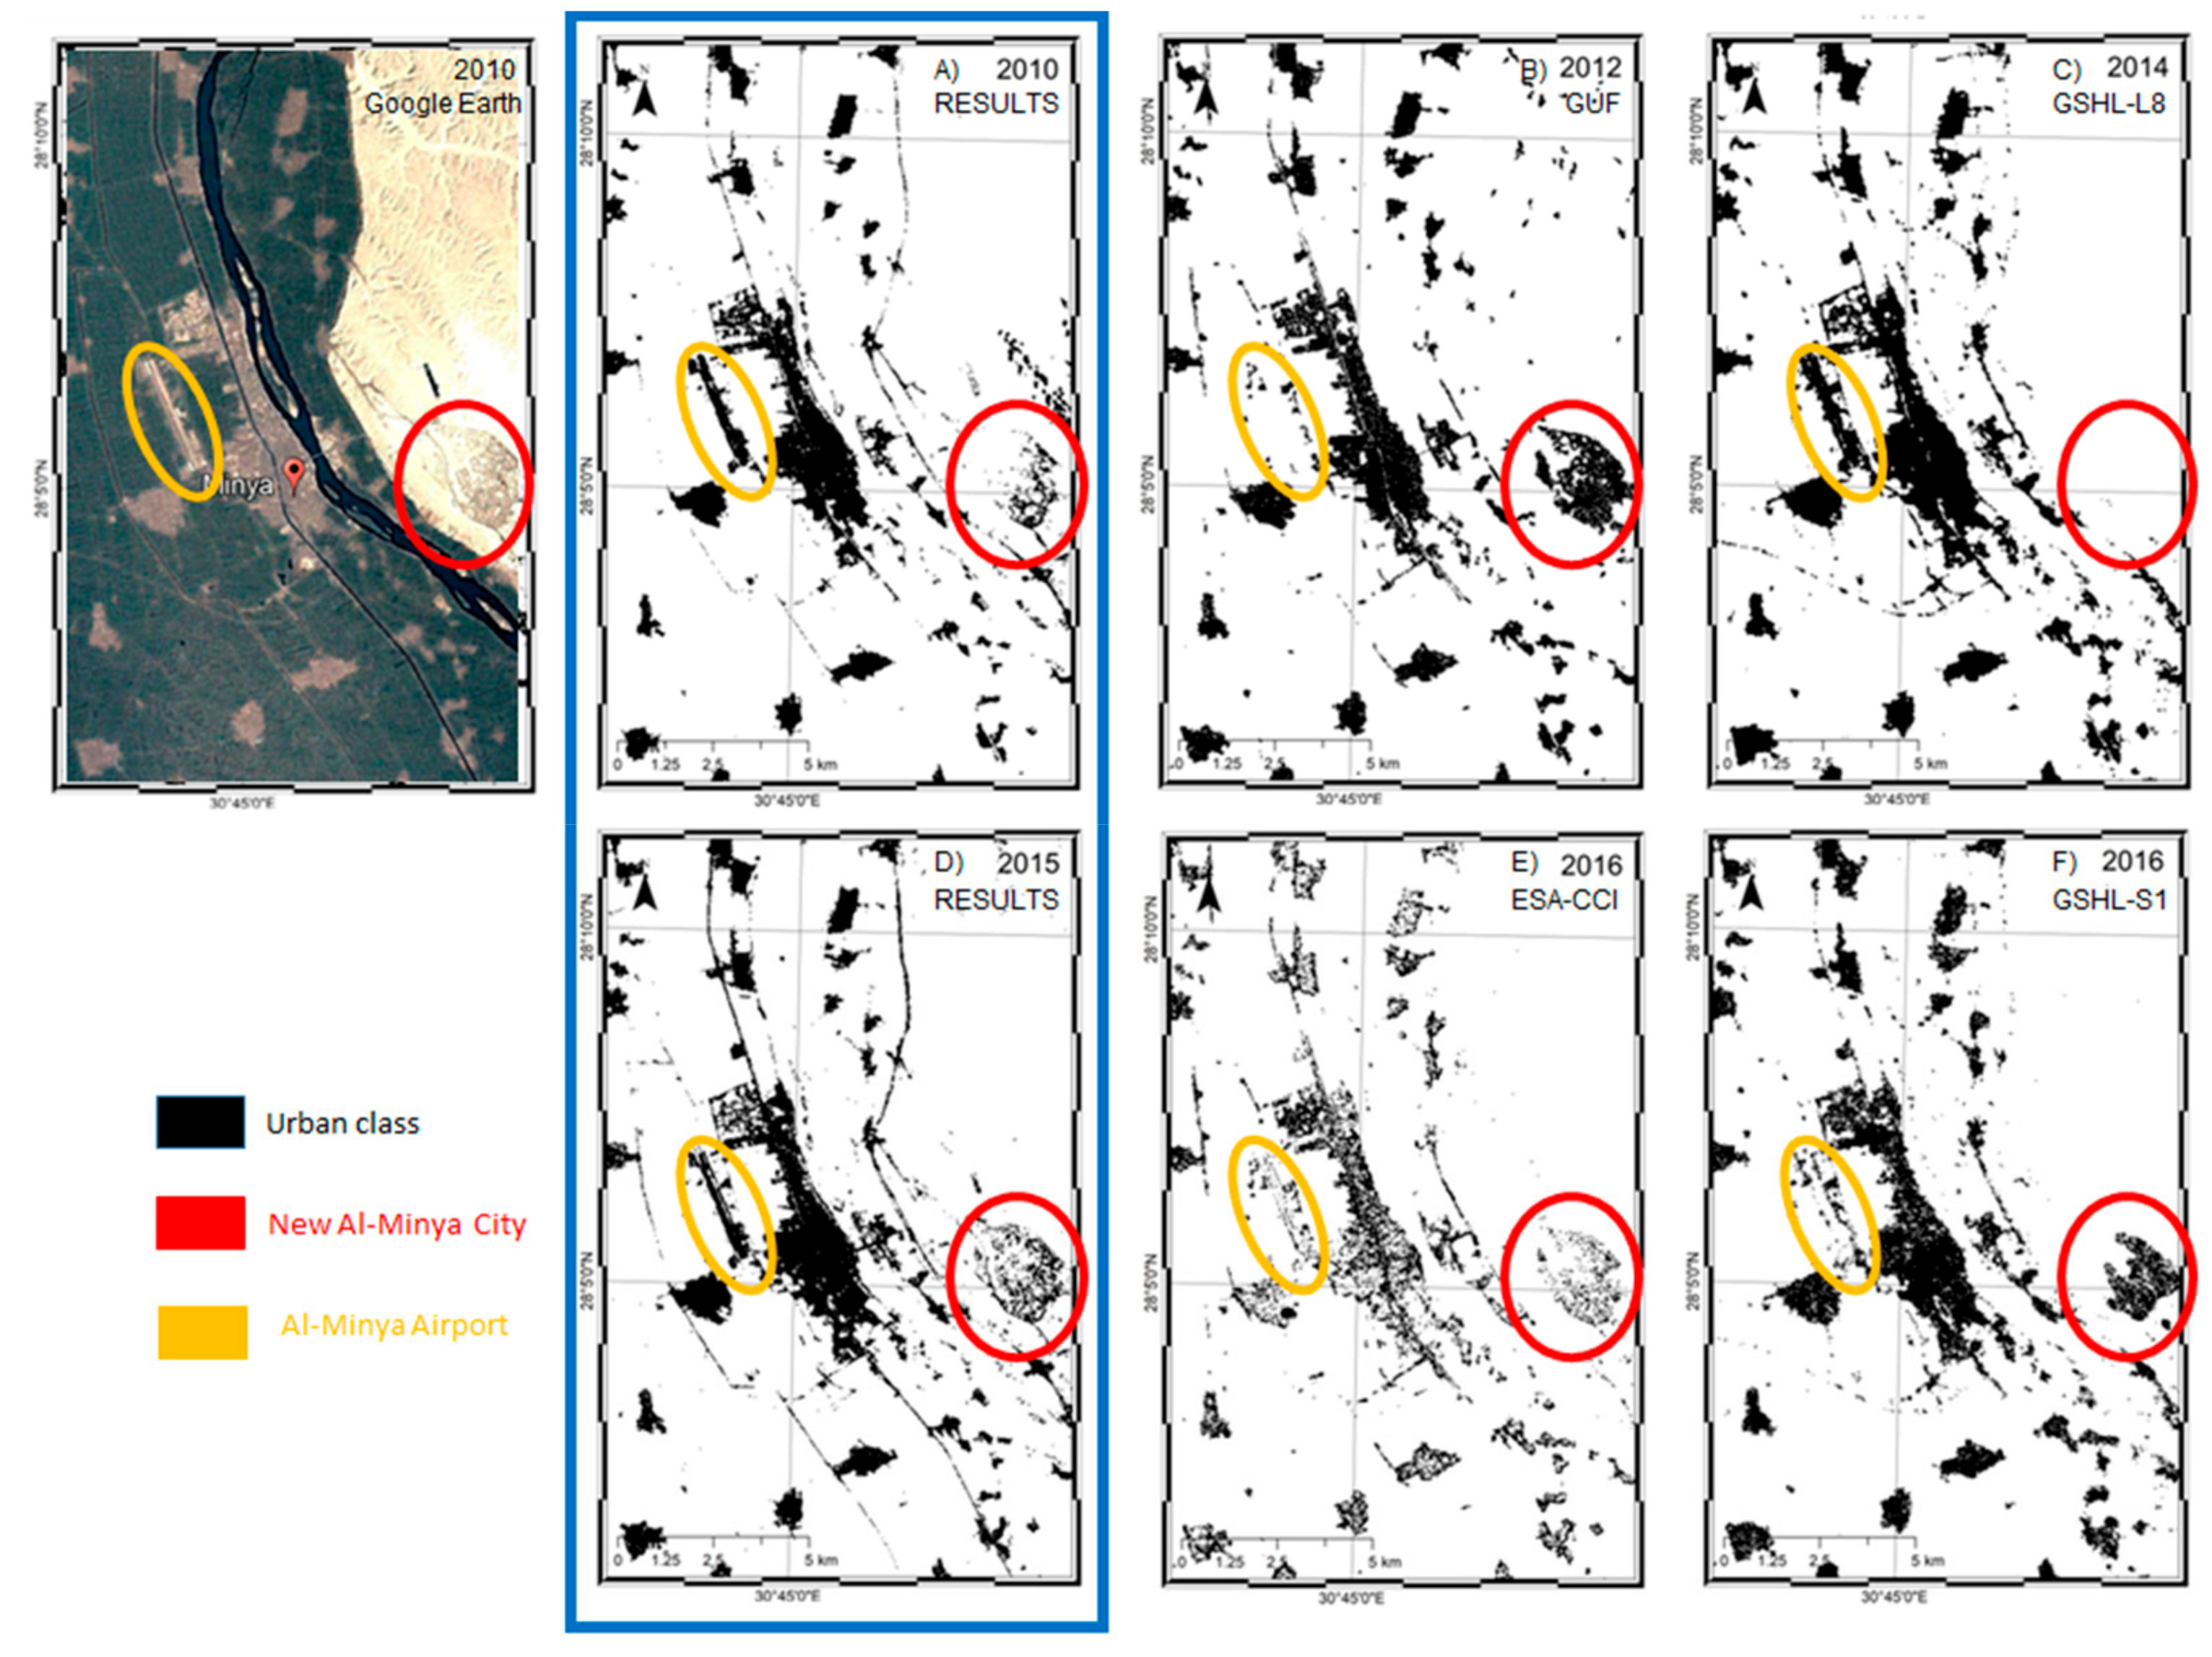
4. Results
5. Discussion
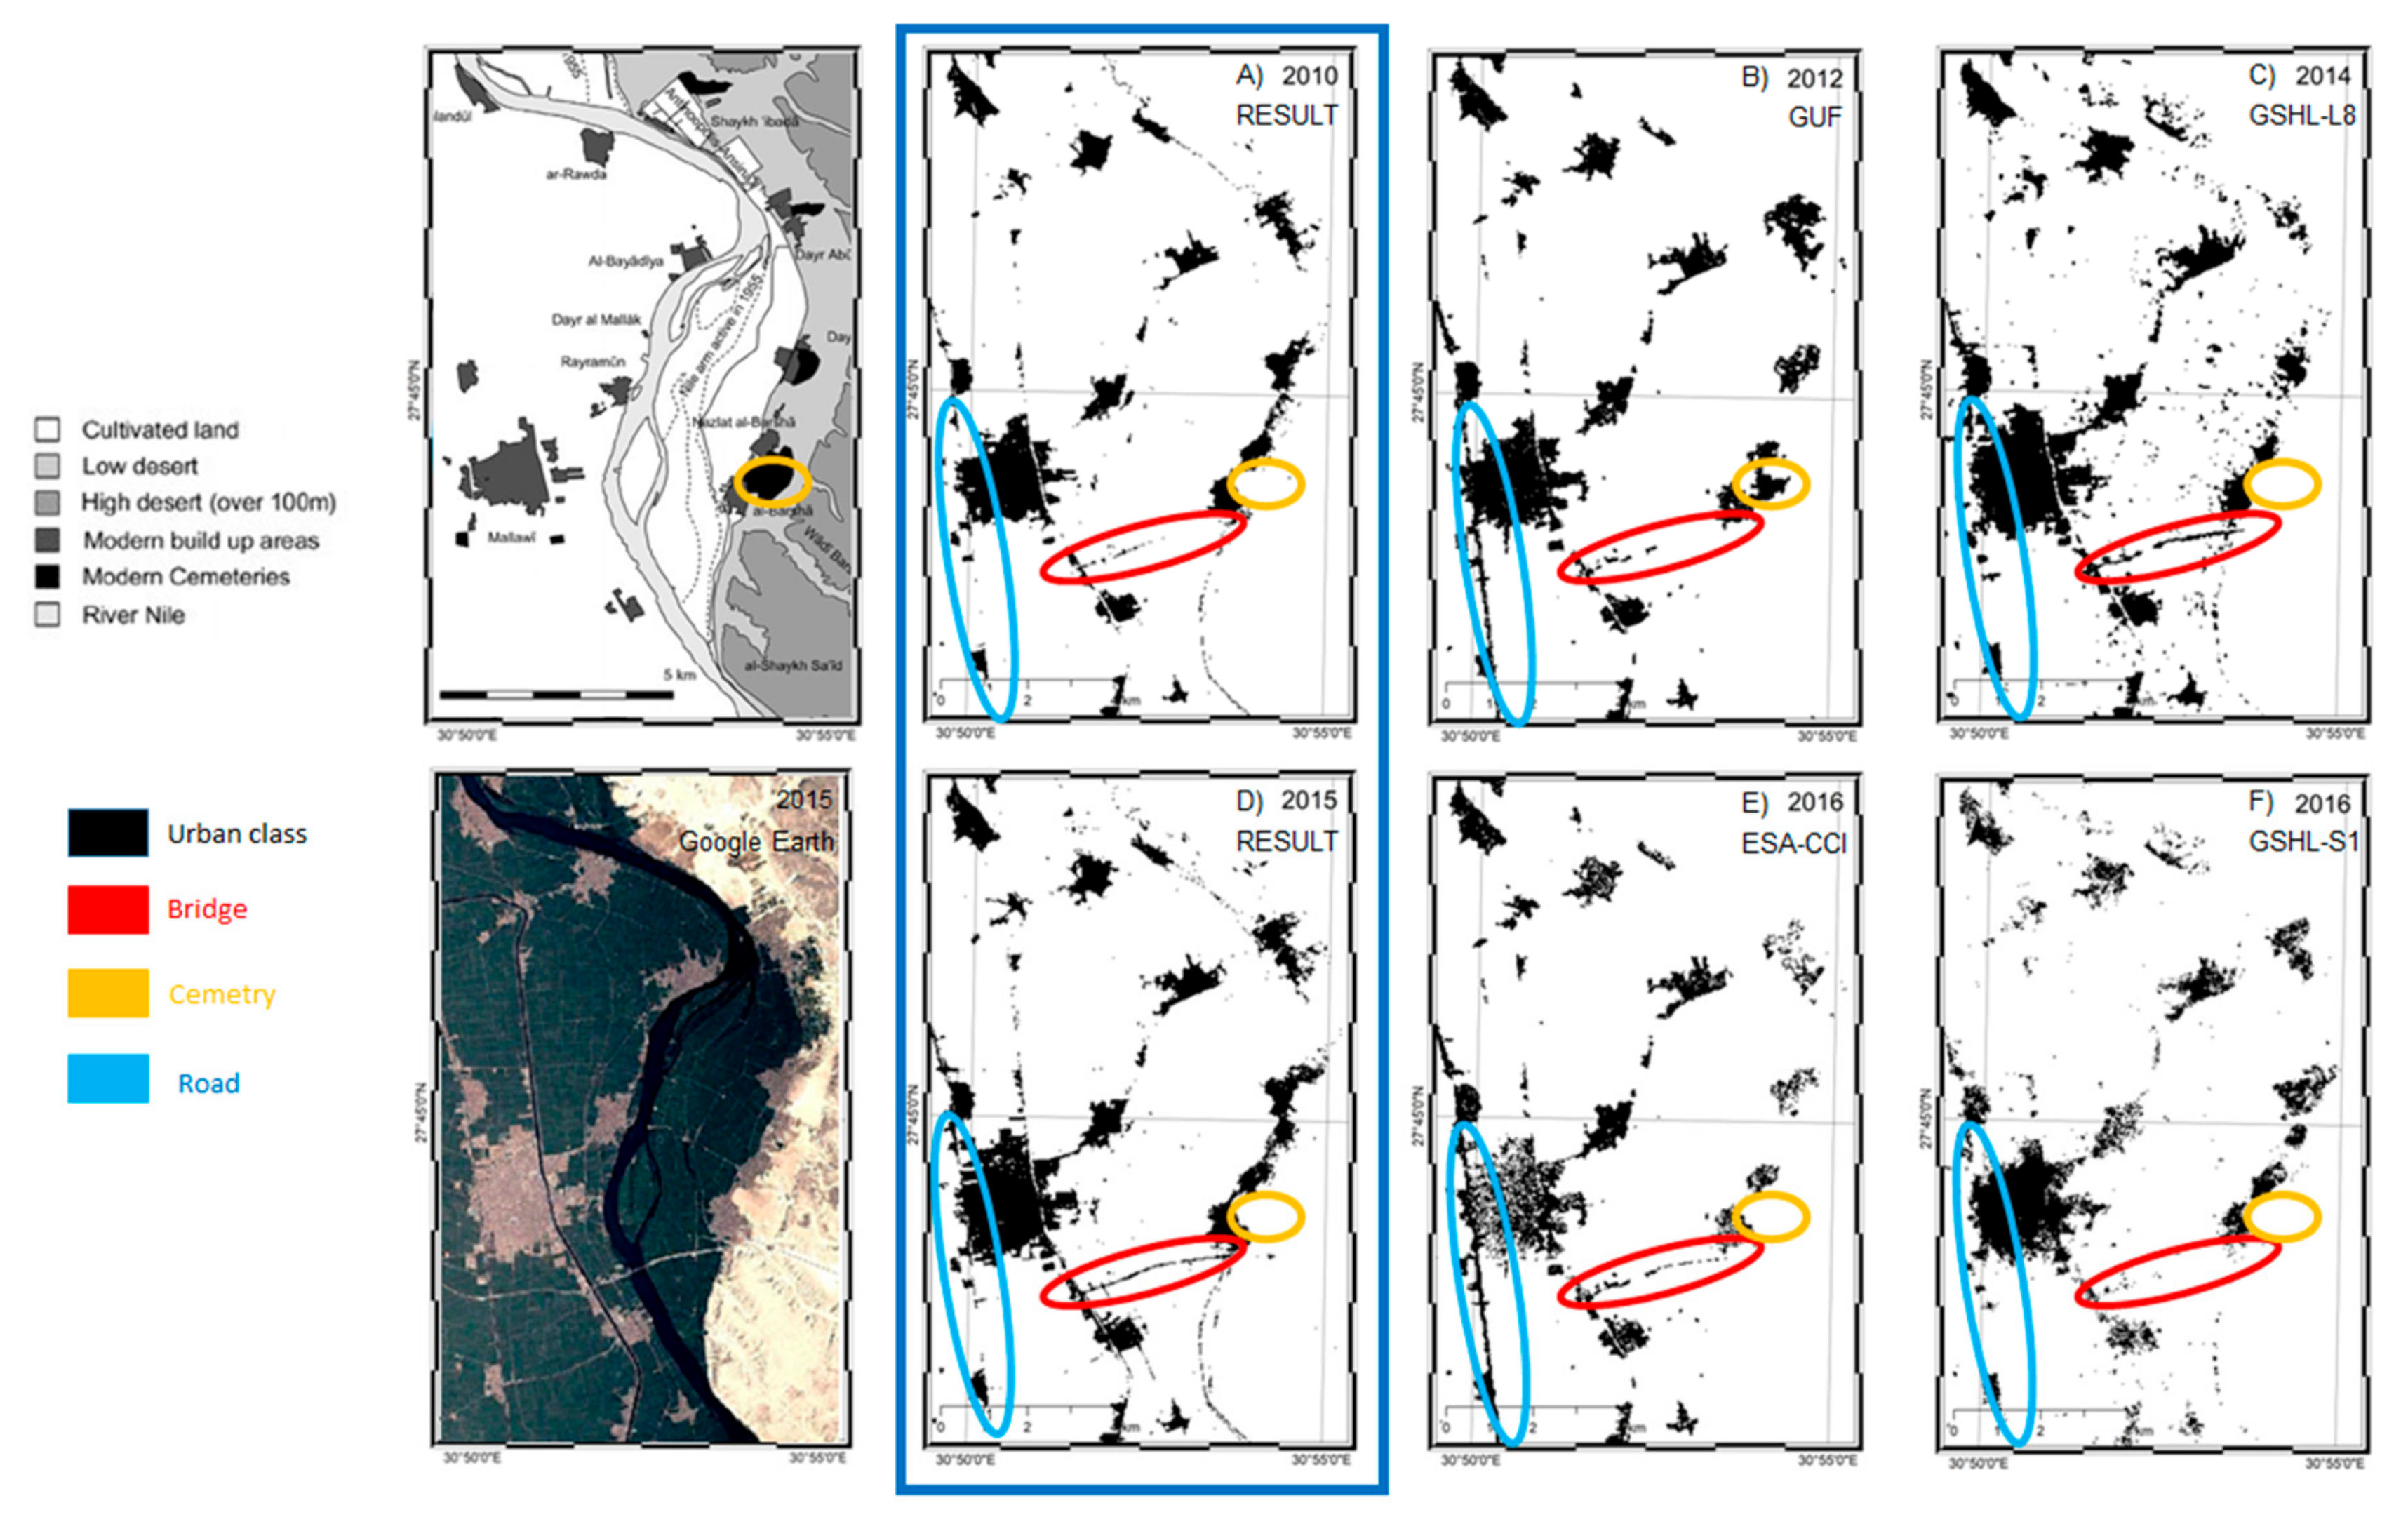
5.1. Quality of the Data Fusion Approach Compared to Single Platform Approaches
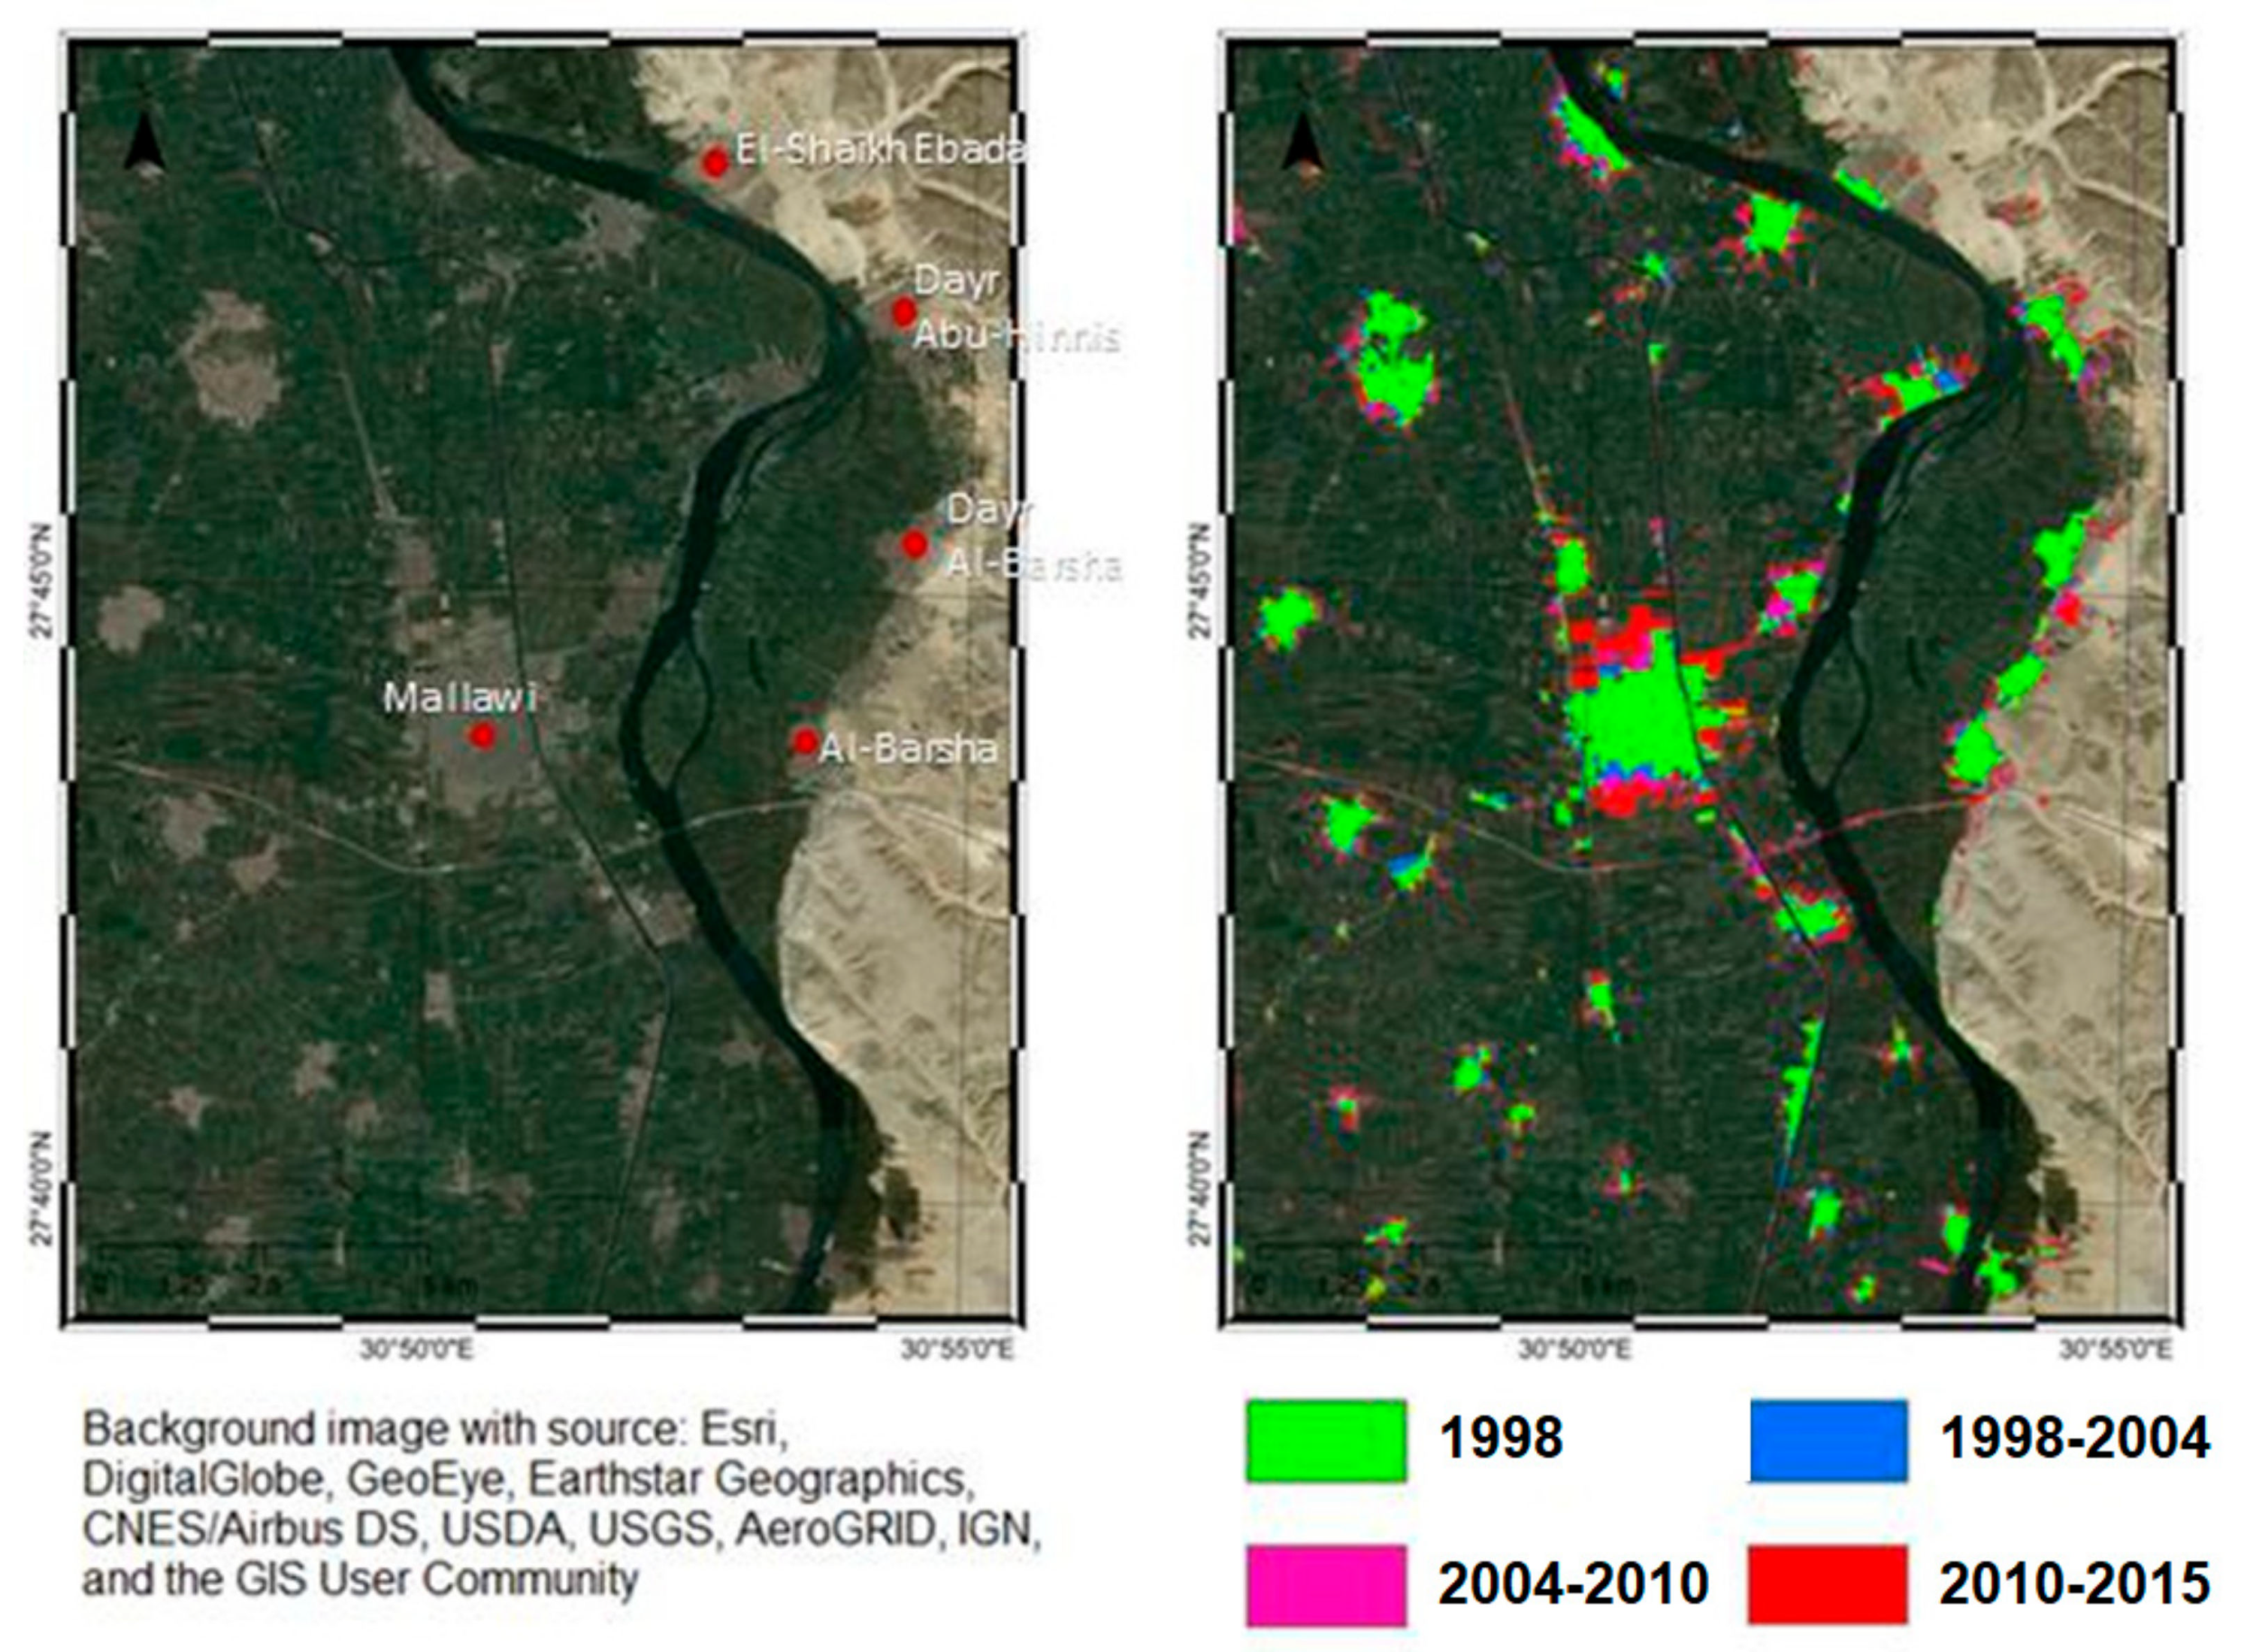
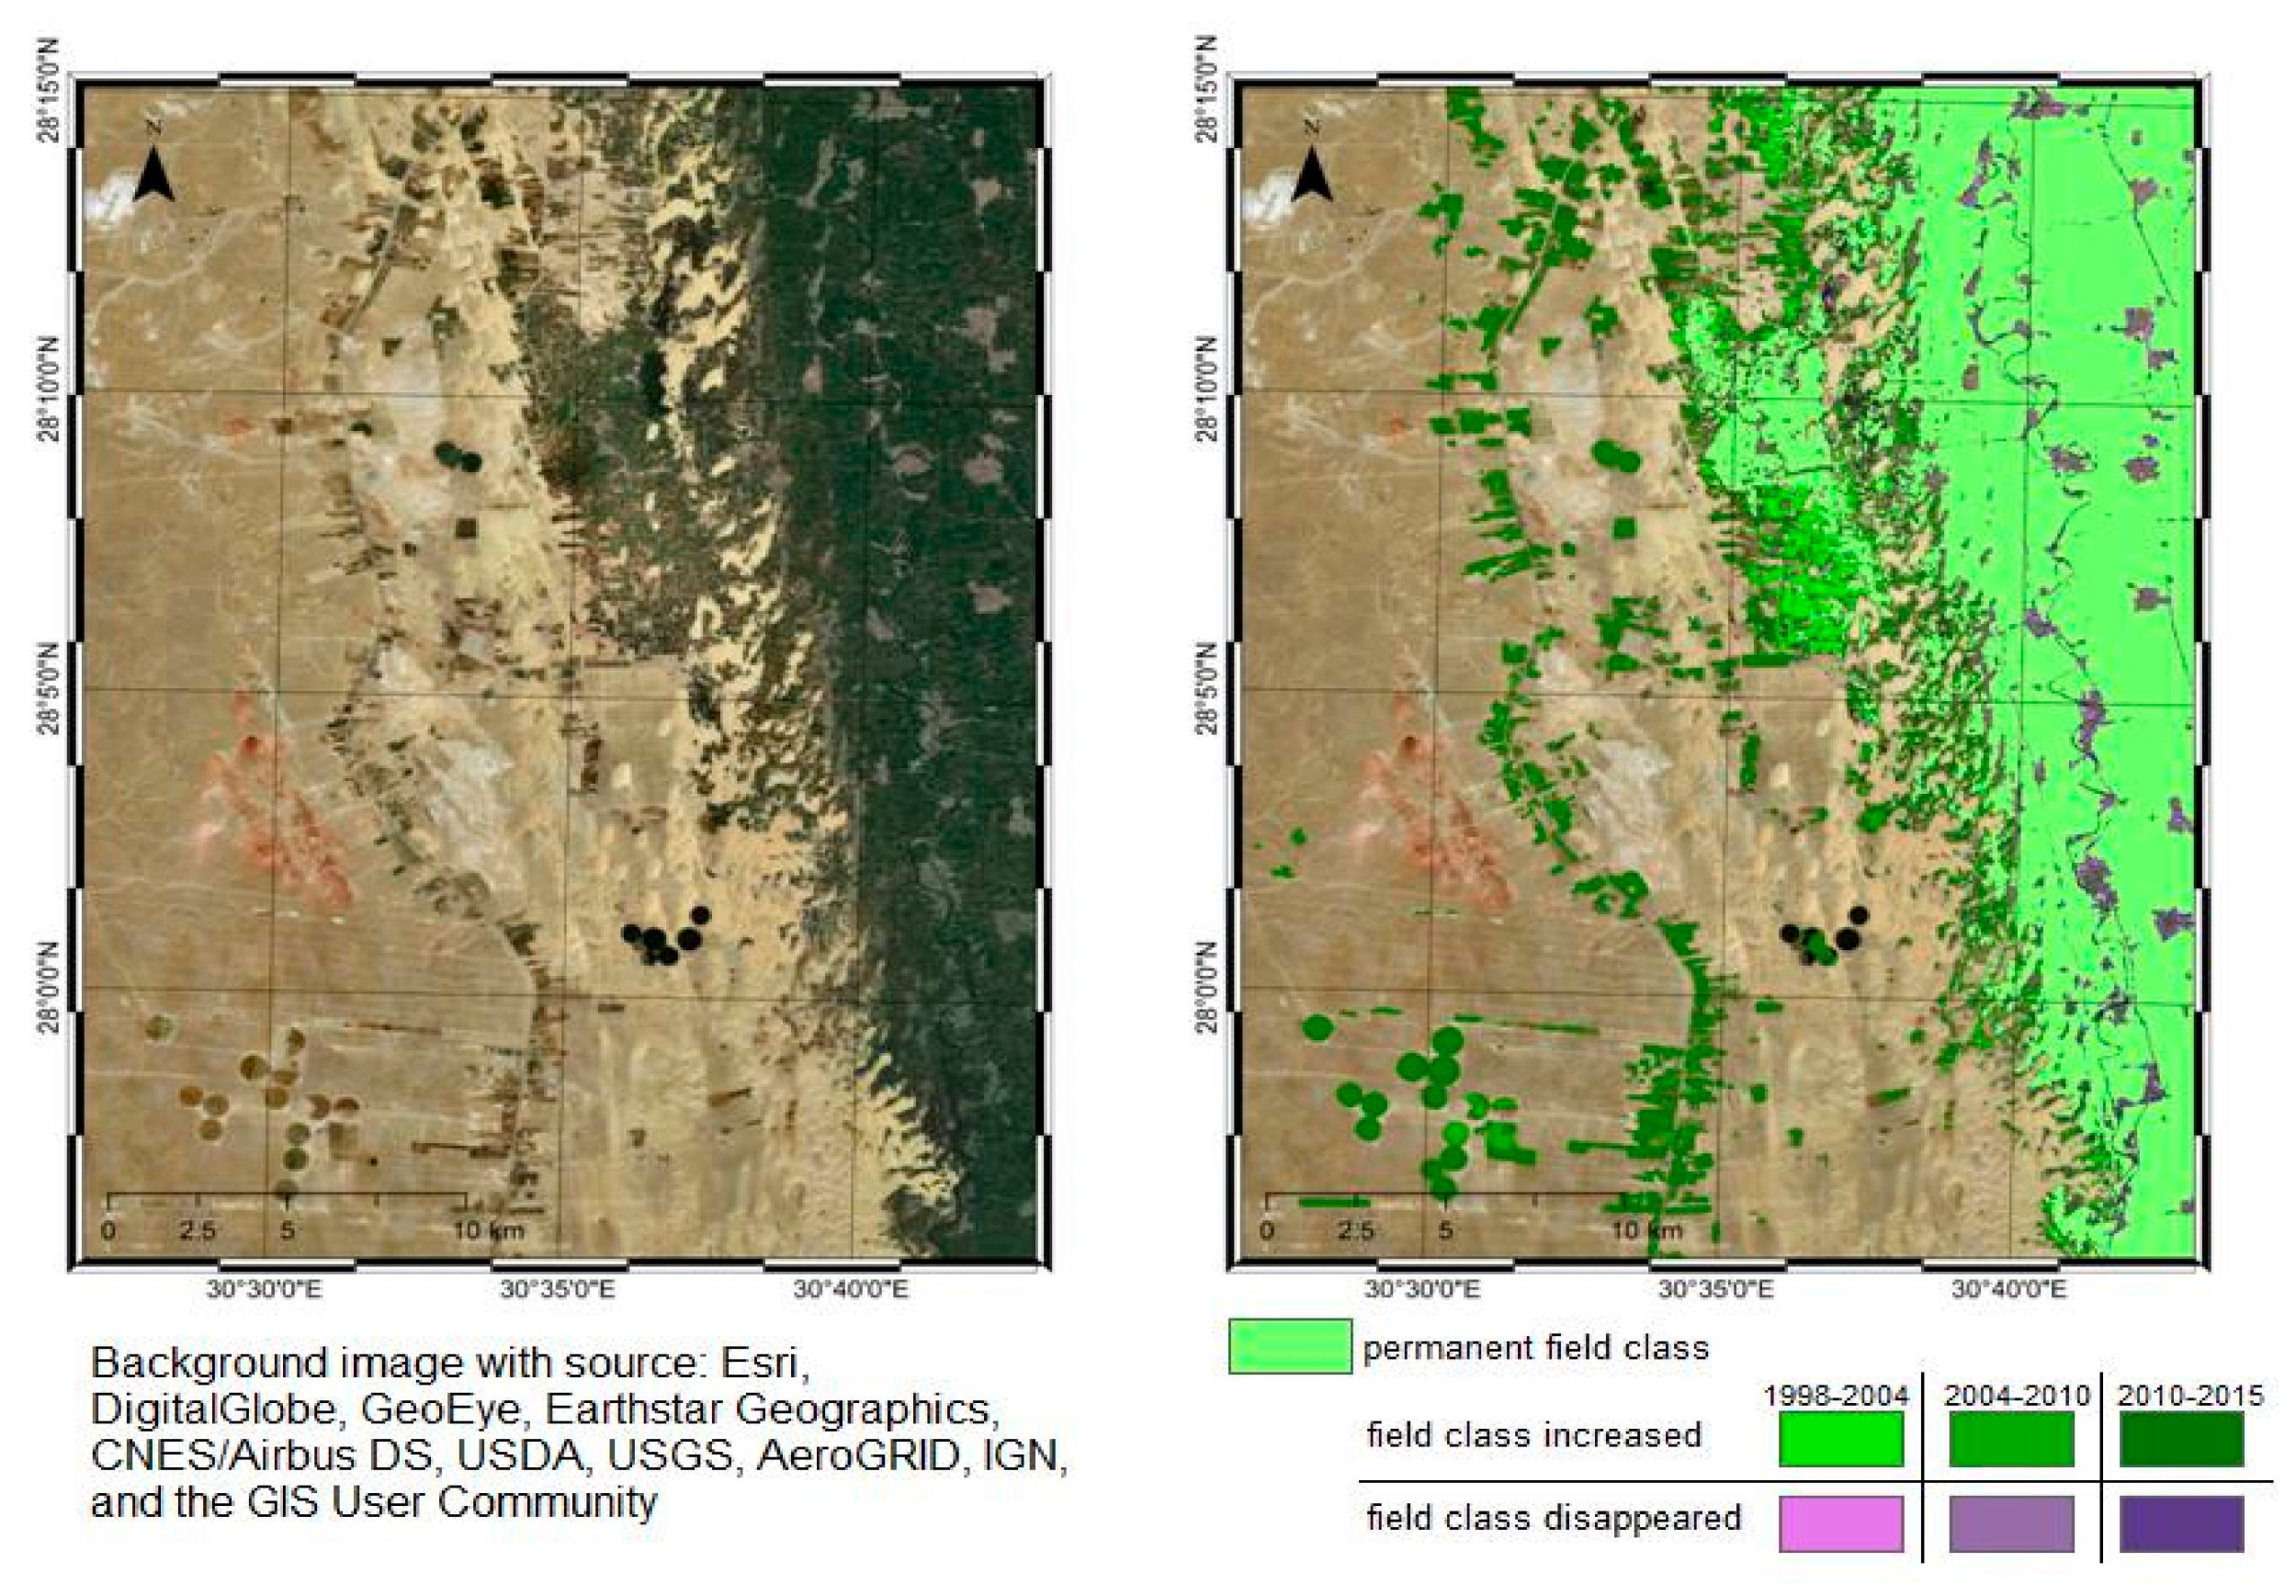
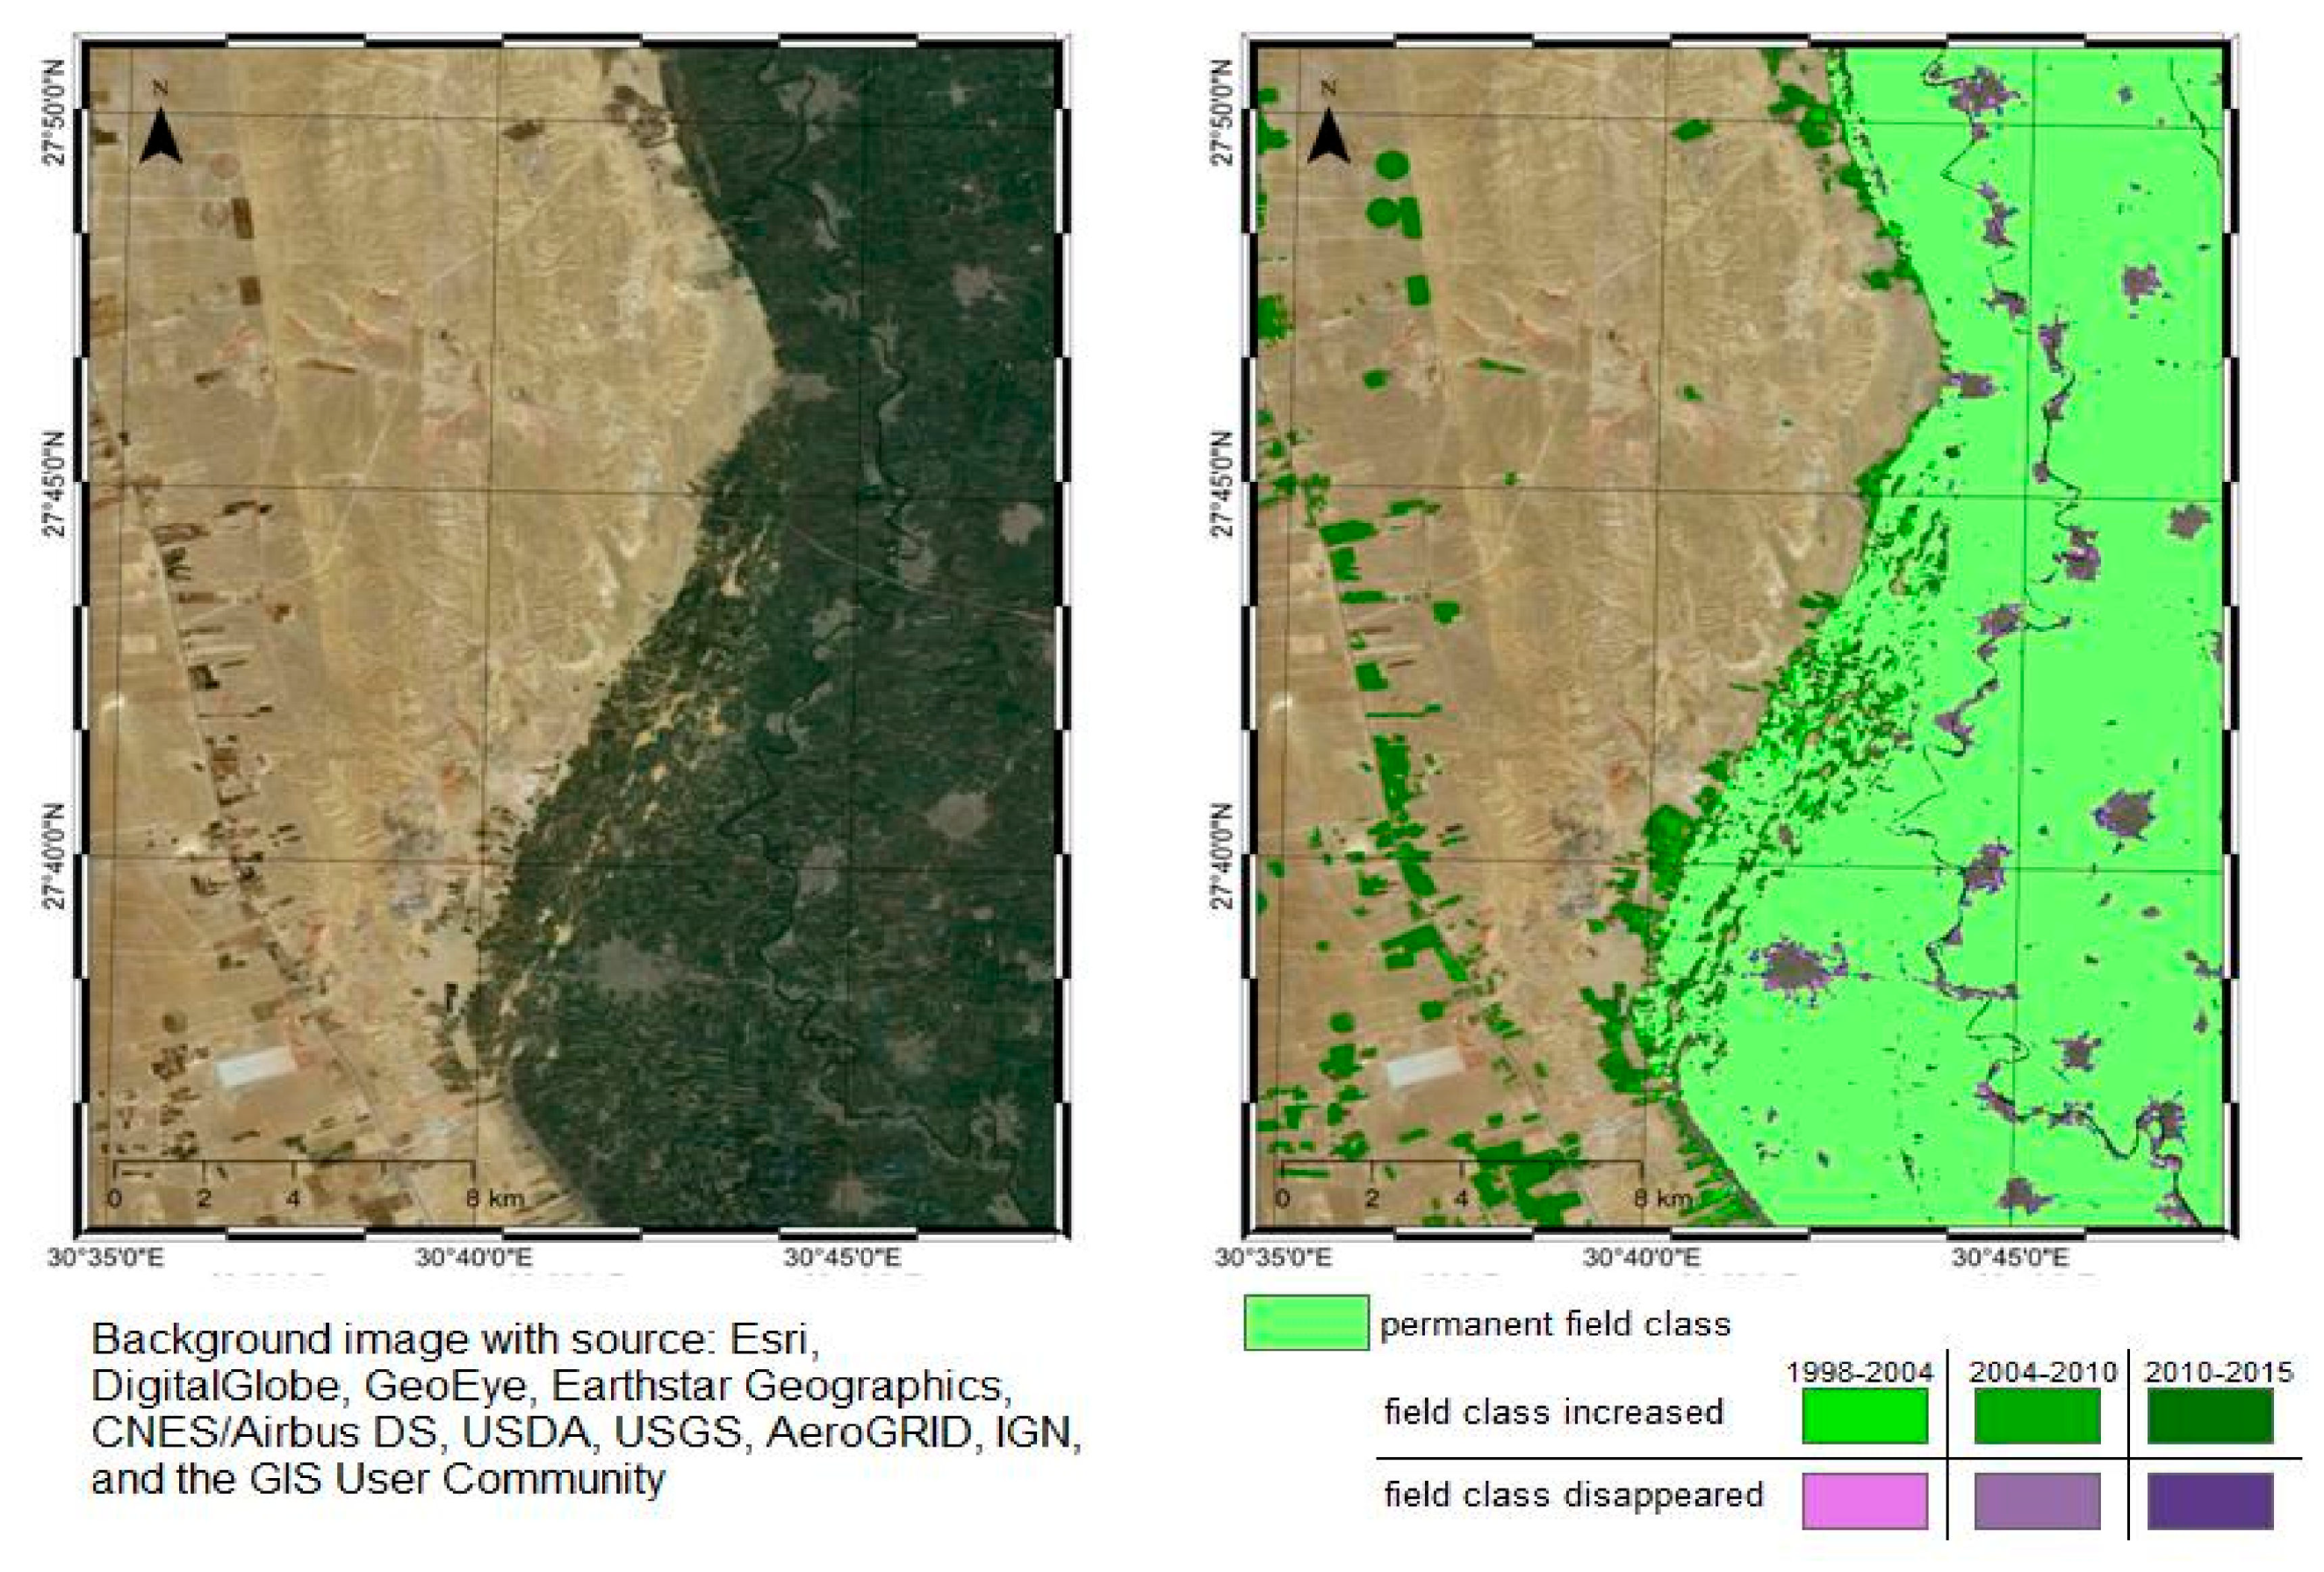
5.2. Urban and Agricultural Land Dynamics
6. Conclusions
Author Contributions
Funding
Acknowledgments
Conflicts of Interest
References
- Vermeiren, K.; Van Rompaey, A.; Loopmans, M.; Serwajja, E.; Mukwaya, P. Urban growth of Kampala, Uganda: Pattern analysis and scenario development. Landsc. Urban Plan. 2012, 106, 199–206. [Google Scholar] [CrossRef]
- Cohen, B. Urbanization in developing countries: Current trends, future projections, and key challenges for sustainability. Technol. Soc. 2006, 28, 63–80. [Google Scholar] [CrossRef]
- Cobbinah, P.B.; Erdiaw-Kwasie, M.O.; Amoateng, P. Africa’s urbanisation: Implications for sustainable development. Cities 2015, 47, 62–72. [Google Scholar] [CrossRef]
- Sutton, K.; Fahmi, W. Cairo’s urban growth and strategic master plans in the light of Egypt’s 1996 population census results. Science 2001, 18, 135–149. [Google Scholar] [CrossRef]
- Harris, R.; Wahba, M. The Urban Geography of Low-Income Housing: Cairo (1947–96) Exemplifies a Model. Int. J. Urban Reg. Res. 2002, 26, 58–79. [Google Scholar] [CrossRef]
- Schneider, A.; Woodcock, C.E. Compact, dispersed, fragmented, extensive? A comparison of urban growth in twenty-five global cities using remotely sensed data, pattern metrics and census information. Urban Stud. 2008, 45, 659–692. [Google Scholar] [CrossRef]
- Ward, D.; Phinn, S.R.; Murray, A.T. Monitoring growth in rapidly urbanizing areas using remotely sensed data. Prof. Geogr. 2000, 52, 371–386. [Google Scholar] [CrossRef]
- Griffiths, P.; Hostert, P.; Gruebner, O.; van der Linden, S. Mapping megacity growth with multi-sensor data. Remote Sens. Environ. 2010, 114, 426–439. [Google Scholar] [CrossRef]
- Hou, H.; Estoque, R.C.; Murayama, Y. Spatiotemporal analysis of urban growth in three African capital cities: A grid-cell-based analysis using remote sensing data. J. Afr. Earth Sci. 2016, 123, 381–391. [Google Scholar] [CrossRef]
- Brinkmann, K.; Schumacher, J.; Dittrich, A.; Kadaore, I.; Buerkert, A. Analysis of landscape transformation processes in and around four West African cities over the last 50 years. Landsc. Urban Plan. 2012, 105, 94–105. [Google Scholar] [CrossRef]
- Li, Y. Urban–rural interaction patterns and dynamic land use: Implications for urban–rural integration in China. Reg. Environ. Chang. 2012, 12, 803–812. [Google Scholar] [CrossRef]
- Inostroza, L.; Hamstead, Z.; Spyra, M.; Qhreshi, S. Beyond urban–rural dichotomies: Measuring urbanisation degrees in central European landscapes using the technomass as an explicit indicator. Ecol. Indic. 2019, 96, 466–476. [Google Scholar] [CrossRef]
- Embabi, N.S. The geomorphology of Egypt, landforms and evolution, Volume I: The Nile Valley and the Western Desert. Spec. Pub. Egypt. Geogr. Soc 2004, 447. [Google Scholar]
- Mohamed, I.N.L.; Verstraeten, G. Analyzing dune dynamics at the dune-field scale based on multi-temporal analysis of Landsat-TM images. Remote Sens. Environ. 2012, 119, 105–117. [Google Scholar] [CrossRef]
- Willems, H.; Dahms, J.-M. (Eds.) The Nile: Natural and Cultural Landscape in Egypt. In Proceedings of the International Symposium, L’Ecole du Val-de-Grâce, Paris, France, 22–23 February 2013; Transcript Verlag: Bielefeld, Germany, 2013; p. 14957BC, ISBN 9783837636154. [Google Scholar]
- De Noronha Vaz, E.; Caetano, M.; Nijkamp, P. A multi-level spatial urban pressure analysis of the Giza pyramid plateau in Egypt. J. Herit. Tour. 2011, 6, 99–108. [Google Scholar] [CrossRef]
- Hassan, A.A.M. Change in the urban spatial structure of the Greater Cairo metropolitan area, Egypt. Archives 2011, XXXVIII, 133–136. [Google Scholar]
- Delgado Blasco, J.M.; Verstraeten, G.; Hanssen, R.F. Detecting modern desert to urban transitions from space in the surroundings of the Giza World Heritage site and Greater Cairo. J. Cult. Herit. 2016, 23, 71–78. [Google Scholar] [CrossRef] [Green Version]
- Mohamed, H.E. Analysis of urban growth at Cairo, Egypt using remote sensing and GIS. Nat. Sci. 2012, 4, 355–361. [Google Scholar]
- Taubenböck, H.; Wegmann, M.; Roth, A.; Mehl, H.; Dech, S. Analysis of urban sprawl at mega city Cairo, Egypt using multisensoral remote sensing data, landscape metrics and gradient analysis. Area 2008. [Google Scholar]
- Osman, T.; Arima, T.; Divigalpitiya, P. Measuring urban sprawl patterns in Greater Cairo Metropolitan Region. J. Indian Soc. Remote Sens. 2016, 44, 287–295. [Google Scholar] [CrossRef]
- Stewart, D.J.; Yin, Z.; Bullard, S.M.; Maclachlan, J.T. Assessing the spatial structure of urban and population growth in the greater Cairo area, Egypt: A GIS and imagery analysis approach. Urban Stud. 2004, 41, 95–117. [Google Scholar] [CrossRef]
- El-Bayomi, G.; Ali, R.R. Assessment of Urban Sprawl on El Minya Archeological Sites, Egypt. J. Appl. Sci. 2015, 15, 264–270. [Google Scholar]
- Wikipedia Mallawi. Available online: https://en.wikipedia.org/wiki/Mallawi (accessed on 29 June 2018).
- Kalensky, Z.D. AFRICOVER land cover database and map of Africa. Can. J. Remote Sens. 1998, 24, 292–297. [Google Scholar] [CrossRef]
- Lesiv, M.; Fritz, S.; McCallum, I.; Tsendbazar, N.; Herold, M.; Pekel, J.-F.; Buchhorn, M.; Smets, B.; Van De Kerchove, R. Evaluation of ESA CCI Prototype Land Cover Map at 20m; IIASA: Laxenburg, Austria, 2017. [Google Scholar]
- Tupin, F. Fusion of optical and SAR images. In Radar Remote Sens. Urban Areas; Springer: Berlin/Heidelberg, Germany, 2010; pp. 133–159. [Google Scholar]
- Joshi, N.; Baumann, M.; Ehammer, A.; Fensholt, R.; Grogan, K.; Hostert, P.; Jepsen, M.; Kuemmerle, T.; Meyfroidt, P.; Mitchard, E.; et al. A review of the application of optical and radar remote sensing data fusion to land use mapping and monitoring. Remote Sens. 2016, 8, 70. [Google Scholar] [CrossRef] [Green Version]
- El Gammal, E.S.A.; El Gammal, A.E.D.A. Hazard impact and genetic development of sand dunes west of Samalut, Egypt. Egypt. J. Remote Sens. Sp. Sci. 2010, 13, 137–151. [Google Scholar] [CrossRef] [Green Version]
- Gorelick, N. Google Earth Engine. In Proceedings of the AGU Fall Meeting Abstracts; American Geophysical Union: San Francisco, CA, USA, 2012; Volume 1, p. 4. [Google Scholar]
- Delgado Blasco, J.M.; Sabatino, G.; Cuccu, R.; Rivolta, G.; Marchetti, P.G. Research and Service Support: Bringing Users to Data. In Proceedings of the Living Planet Symposium; ESA, Ed.; European Space Agency: Prague, Czech Republic, 2016; Volume 740, p. 271. [Google Scholar]
- ARRAY. NEST-Calibration Operator. Available online: http://corp.array.ca/nest-web/help/operators/CalibrationOp.html (accessed on 21 January 2015).
- Angiuli, E.; Trianni, G. Urban mapping in Landsat images based on normalized difference spectral vector. IEEE Geosci. Remote Sens. Lett. 2014, 11, 661–665. [Google Scholar] [CrossRef]
- Aswatha, S.M.; Mukhopadhyay, J.; Biswas, P.K. Spectral slopes for automated classification of land cover in landsat images. In Proceedings of the 2016 IEEE International Conference on Image Processing (ICIP), Phoenix, AZ, USA, 25–28 September 2016; pp. 4354–4358. [Google Scholar]
- Li, S.; Chen, X. A new bare-soil index for rapid mapping developing areas using landsat 8 data. Int. Arch. Photogramm. Remote Sens. Spat. Inf. Sci. 2014, 40, 139. [Google Scholar] [CrossRef] [Green Version]
- Silleos, N.G.; Alexandridis, T.K.; Gitas, I.Z.; Perakis, K. Vegetation indices: Advances made in biomass estimation and vegetation monitoring in the last 30 years. Geocarto Int. 2006, 21, 21–28. [Google Scholar] [CrossRef]
- Zhou, Y.; Yang, G.; Wang, S.; Wang, L.; Wang, F.; Liu, X. A new index for mapping built-up and bare land areas from Landsat-8 OLI data. Remote Sens. Lett. 2014, 5, 862–871. [Google Scholar] [CrossRef]
- López-Caloca, A.A. Data fusion approach for Urban area identification using multisensor information. In Proceedings of the 8th International Workshop on the Analysis of Multitemporal Remote Sensing Images (Multi-Temp), Annecy, France, 22–24 July 2015. [Google Scholar]
- Patel, N.N.; Angiuli, E.; Gamba, P.; Gaughan, A.; Lisini, G.; Stevens, F.R.; Tatem, A.J.; Trianni, G. Multitemporal settlement and population mapping from Landsat using Google Earth Engine. Int. J. Appl. Earth Obs. Geoinf. 2015, 35, 199–208. [Google Scholar] [CrossRef] [Green Version]
- Trianni, G.; Angiuli, E.; Lisini, G.; Gamba, P. Human settlements from landsat data using google earth engine. In Proceedings of the 2014 IEEE Geoscience and Remote Sensing Symposium, Quebec City, QC, Canada, 13–18 July 2014; IEEE: Piscataway, NJ, USA, 2014; pp. 1473–1476. [Google Scholar]
- McInerney, D.; Kempeneers, P. Pktools. In Open Source Geospatial Tools; Springer: Berlin/Heidelberg, Germany, 2015; pp. 173–197. [Google Scholar]
- Vapnik, V.N. Statistical Learning Theory; John Wiley & Sons: New York, New York, USA, 1998. [Google Scholar]
- Keerthi, S.S.L.C.J. Asymptotic behaviors of support vector machines with Gaussian kernel. Neural Comput. 2003, 15, 1667–1689. [Google Scholar] [CrossRef] [PubMed]
- Cohen, J. A Coefficient of Agreement for Nominal Scales. Educ. Psychol. Meas. 1960, 20, 37–46. [Google Scholar] [CrossRef]
- Congalton, R.G. A Review of Assessing the Accuracy of Classifications of Remotely Sensed Data. Remote Sens. Environ. 1991, 46, 35–46. [Google Scholar] [CrossRef]
- Mather, P.M.; Koch, M. Computer Processing of Remotely-Sensed Images: An introduction, 3rd ed.; John Wiley & Sons Ltd.: Chichester, UK, 2004; ISBN 0470849193. [Google Scholar]
- Esch, T.; Heldens, W.; Hirner, A.; Keil, M.; Marconcini, M.; Roth, A.; Zeidler, J.; Dech, S.; Strano, E. Breaking new ground in mapping human settlements from space—The Global Urban Footprint. ISPRS J. Photogramm. Remote Sens. 2017, 134, 30–42. [Google Scholar] [CrossRef] [Green Version]
- Esch, T.; Schenk, A.; Ullmann, T.; Thiel, M.; Roth, A.; Dech, S. Characterization of land cover types in TerraSAR-X images by combined analysis of speckle statistics and intensity information. IEEE Trans. Geosci. Remote Sens. 2011, 49, 1911–1925. [Google Scholar] [CrossRef]
- European Space Agency CCI Land Cover -Sentinel-2 Prototype Land Cover 20m of Africa 2016. Available online: http://2016africalandcover20m.esrin.esa.int/ (accessed on 9 September 2018).
- Florczyk, A.; Politis, P.; Corbane, C.; Pesaresi, M. GHS-BUILT R2018A—GHS built-up grid INPUT DATA, Landsat multitemporal collections (1975-1990-2000-2014). European Commission, Joint Research Centre (JRC). Available online: http://data.europa.eu/89h/jrc-ghsl-10009 (accessed on 10 September 2018).
- Corbane, C.; Politis, P.; Syrris, V.; Pesaresi, M. GHS built-up grid, derived from Sentinel-1 (2016), R2018A. European Commission, Joint Research Centre (JRC). Available online: http://data.europa.eu/89h/jrc-ghsl-10008 (accessed on 10 September 2018).
- Corbane, C.; Pesaresi, M.; Politis, P.; Syrris, V.; Florczyk, A.J.; Soille, P.; Maffenini, L.; Burger, A.; Vasilev, V.; Rodriguez, D.; et al. Big earth data analytics on Sentinel-1 and Landsat imagery in support to global human settlements mapping. Big Earth Data 2017, 1, 118–144. [Google Scholar] [CrossRef] [Green Version]
- Central Agency for Public Mobilization and Statistics (CAPMAS). Census Data. Available online: https://egypt.opendataforafrica.org/data#source=CAPMAS (accessed on 10 June 2019).
- Landis, J.R.; Koch, G.G. The measurement of observer agreement for categorical data. Biometrics 1977, 159–174. [Google Scholar] [CrossRef] [Green Version]
- Willems, H.M.W.M. A note on the origin of the toponym al-Barshā. J. Egypt. Archaeol. 2010, 96, 232–236. [Google Scholar] [CrossRef]
- Stewart, D.J. Cities in the desert: The Egyptian new-town program. Ann. Assoc. Am. Geogr. 1996, 86, 459–480. [Google Scholar] [CrossRef]
- Ibrahim, M.R.; Masoumi, H.E. Will Distance to the Capital City Matter When Supplying New Cities in Egypt? GeoScape 2016, 10, 35–52. [Google Scholar] [CrossRef] [Green Version]
- Hegazy, I.R. Informal settlement upgrading policies in Egypt: Towards improvement in the upgrading process. J. Urban. Int. Res. Placemaking Urban Sustain. 2016, 9, 254–275. [Google Scholar] [CrossRef]
- Adriansen, H.K. Land reclamation in Egypt: A study of life in the new lands. Geoforum 2009, 40, 664–674. [Google Scholar] [CrossRef] [Green Version]
- Barnes, J. Pumping possibility: Agricultural expansion through desert reclamation in Egypt. Soc. Stud. Sci. 2012, 42, 517–538. [Google Scholar] [CrossRef]
- Angel, S.; Parent, J.; Civco, D.L.; Blei, A.M. Persistent Decline in Urban Densities: Global and Historical Evidence of ‘Sprawl’; Lincoln Institute of Land Policy: Cambridge, MA, USA, 2010. [Google Scholar]
- New Urban Communities Authorities. New Minia. Available online: http://www.newcities.gov.eg/english/New_Communities/Minia/default.aspx (accessed on 23 December 2019).
- Harms, H. Challenges for sustainable development of informal settlements and of desert new towns in Cairo. In Revitalizing City Districts; Springer: Berlin/Heidelberg, Germany, 2017; pp. 147–169. [Google Scholar]
- Database of Global Administrative Areas (GADM). Egypt Administrative Boundaries. Available online: https://gadm.org/ (accessed on 7 July 2017).


| LULC Map Created | Acquisition Dates Start–Stop | Sensor | Signal Characteristics | Spatial Resolution [m] | N. Images |
|---|---|---|---|---|---|
| 1998 | 1997-05-15–1999-03-11 1998-01-01–1998-12-31 | ERS-1/2 SAR Landsat 5 TM | C band, VV channel Visible, NIR, SWIR-1/2 | 4 × 20 30 × 30 | 6 32 |
| 2004 | 2003-11-20–2004-12-09 2004-01-01–2004-12-31 | Envisat ASAR Landsat 7 EMT+ | C band, VV channel Visible, NIR, SWIR-1/2 | 4 × 20 30 × 30 | 9 50 |
| 2010 | 2009-01-22–2010-08-05 2010-01-01–2010-12-31 | Envisat ASAR Landsat 7 ETM+ | C band, VV channel Visible, NIR, SWIR-1/2 | 4 × 20 30 × 30 | 9 31 |
| 2015 | 2015-01-01–2015-12-31 2015-01-01–2015-12-3 | Sentinel-1 IW Landsat 8 OLITIRS | C band, VV channel Visible, NIR, SWIR-1/2 | 20 × 23 30 × 30 | 53 8 |
| Indicators | Formula |
|---|---|
| Backscatter average [dB] | |
| Backscatter standard deviation [dB] | |
| Coefficient of variation [dB] | |
| Coefficient of dispersion |
| Indicators | Formula |
|---|---|
| Normalised Difference Built-up Index | |
| Normalised Difference Water Index | |
| Normalised Difference Vegetation Index | |
| Normalised Difference SWIR channels |
| Year | Ground | Land Use Classification Map | Accuracy | ||||
|---|---|---|---|---|---|---|---|
| Truth | Urban | Desert | Water | Fields | Dunes | Criteria | |
| 2004 | Urban | 431 | 1 | 0 | 0 | 0 | Kappa Index |
| Desert | 1 | 6081 | 0 | 0 | 22 | 99.0 % | |
| Water | 0 | 0 | 150 | 0 | 0 | Overall accuracy 99.5% | |
| Fields | 0 | 0 | 0 | 1936 | 0 | ||
| Dunes | 0 | 17 | 0 | 0 | 186 | ||
| 2010 | Urban | 431 | 0 | 0 | 0 | 0 | Kappa Index |
| Desert | 1 | 6088 | 1 | 0 | 21 | 99.1% | |
| Water | 0 | 0 | 151 | 0 | 0 | Overall accuracy 99.6% | |
| Fields | 0 | 0 | 0 | 1936 | 0 | ||
| Dunes | 0 | 13 | 0 | 0 | 189 | ||
| 2015 | Urban | 430 | 0 | 0 | 0 | 0 | Kappa Index |
| Desert | 1 | 6092 | 1 | 0 | 13 | 99.1% | |
| Water | 0 | 0 | 147 | 0 | 0 | Overall accuracy 99.6% | |
| Fields | 1 | 2 | 5 | 1936 | 7 | ||
| Dunes | 0 | 7 | 0 | 0 | 193 | ||
| Class | Landform | Year | |||
|---|---|---|---|---|---|
| 1998 | 2004 | 2010 | 2015 | ||
| Field | Valley | 1705.1 | 1690.13 | 1679.73 | 1651.99 |
| Desert | 0 | 22.06 | 46.52 | 259.69 | |
| Urban | Valley | 85.49 | 100.46 | 110.86 | 138.61 |
| Desert | 0 | 2.33 | 4.74 | 13.81 | |
| District | District Area * (km²) | Urban Spatial Extent (km²) | Urban Growth Rate 1998–2015 | ||||
|---|---|---|---|---|---|---|---|
| 1998 | 2004 | 2010 | 2015 | % | km2/yr | ||
| Abu Qurqas | 279.42 | 10.54 | 13.33 | 14.81 | 19.07 | 80.93 | 0.47 |
| El-Minya | 356.24 | 10.97 | 13.86 | 15.94 | 21.29 | 94.07 | 0.57 |
| El-Minya City | 21.80 | 6.62 | 7.49 | 8.06 | 8.86 | 33.84 | 0.12 |
| Dayr Mawas | 195.85 | 7.32 | 8.96 | 10.06 | 12.81 | 75.00 | 0.31 |
| Dayrut | 221.66 | 11.9 | 13.68 | 14.99 | 18.61 | 56.39 | 0.37 |
| Mallawi | 294.51 | 10.66 | 13.08 | 14.66 | 18.39 | 72.51 | 0.43 |
| Mallawi City | 17.96 | 3.13 | 3.58 | 3.91 | 5.13 | 63.90 | 0.11 |
| Matay | 169.03 | 3.18 | 3.63 | 4.08 | 5.67 | 78.30 | 0.14 |
| New Minya City | 15.66 | 0.08 | 0.15 | 0.23 | 0.79 | 887.50 | 0.04 |
| Samalut | 468.49 | 12.29 | 15.19 | 17.24 | 23.34 | 89.91 | 0.61 |
| Surtah Al Dakhlah | 177.72 | 0.09 | 0.09 | 0.1 | 0.24 | 166.67 | 0.01 |
| Unorganised Asyut | 254.18 | 0.09 | 0.09 | 0.11 | 0.24 | 169.00 | 0.01 |
| Unorganised El-Minya | 3697.48 | 2.07 | 3.06 | 4.83 | 11.51 | 456.04 | 0.52 |
| Total | 6170 | 78.85 | 96.09 | 108.9 | 145.74 | 84.83 | 3.72 |
| Year | Urban Extent [km2] | Producer | Data Employed | Dataset Name | Spatial Resolution [m] |
|---|---|---|---|---|---|
| 2010 | 109.0 | Our | Envisat ASAR IMS/Landsat 7 ETM+ | Results | 30 |
| 2012 | 184.35 | DLR | TerraSAR-X/TanDEM-X | GUF | 12 |
| 2014 | 207.31 | JRC | Landsat 8 OLITIRS | GHSL-L8 | 38 |
| 2015 | 148.88 | Our | Sentinel-1/Landsat 8 OLITIRS | Results | 30 |
| 2016 | 145.81 | ESA | Sentinel-2 | ESA-CCI | 20 |
| 2016 | 147.45 | JRC | Sentinel-1 | GHSL-S1 | 19 |
© 2020 by the authors. Licensee MDPI, Basel, Switzerland. This article is an open access article distributed under the terms and conditions of the Creative Commons Attribution (CC BY) license (http://creativecommons.org/licenses/by/4.0/).
Share and Cite
Delgado Blasco, J.M.; Cian, F.; Hanssen, R.F.; Verstraeten, G. Mapping and Quantifying the Human-Environment Interactions in Middle Egypt Using Machine Learning and Satellite Data Fusion Techniques. Remote Sens. 2020, 12, 584. https://0-doi-org.brum.beds.ac.uk/10.3390/rs12030584
Delgado Blasco JM, Cian F, Hanssen RF, Verstraeten G. Mapping and Quantifying the Human-Environment Interactions in Middle Egypt Using Machine Learning and Satellite Data Fusion Techniques. Remote Sensing. 2020; 12(3):584. https://0-doi-org.brum.beds.ac.uk/10.3390/rs12030584
Chicago/Turabian StyleDelgado Blasco, José Manuel, Fabio Cian, Ramon F. Hanssen, and Gert Verstraeten. 2020. "Mapping and Quantifying the Human-Environment Interactions in Middle Egypt Using Machine Learning and Satellite Data Fusion Techniques" Remote Sensing 12, no. 3: 584. https://0-doi-org.brum.beds.ac.uk/10.3390/rs12030584