An Atmospheric Correction Method over Bright and Stable Surfaces for Moderate to High Spatial-Resolution Optical Remotely Sensed Imagery

 ,
, 

Abstract
:
1. Introduction
2. Materials and Methods
2.1. Moderate to High Spatial-Resolution (MHSR) Remotely Sensed Data
2.2. Methodology
- (1).
- It is not easy to select the clearest images from multi-temporal images automatically;
- (2).
- For most of the Chinese MHSR data having very wide swath, the reflectance difference induced by BRDF is aggregated into the retrieved AOD while choosing one clear image as reference and the difference can reach as high as 15% in extreme cases [17]; the retrieved AOD is consequently degraded.
2.2.1. The Retrieval of the Bidirectional Reflectance Distribution Factor (BRDF) Characterization
- (1).
- Instead of being applied to all land surfaces, the proposed method is only for the arid areas with bright and stable surfaces; the stability of the land surface enables use of much longer temporal range to retrieve more data to fit the BRDF characterization and subsequently improve the fitting accuracy of the BRDF characterization. Therefore, instead of using 1 km MODIS data within only one year, the proposed method uses a multi-year time-series dataset composed of 500 m MODIS data from both Terra and Aqua, which has higher resolution and a longer temporal period; thus, higher resolution means more detail and a multi-year time series dataset retrieves more “clearest” observations which captures better the BRDF characterization. Whether the AOD’s resolution of 500 m from MODIS data is enough for atmospheric correction of MHSR data needs to be clarified before moving on; the method is only applied to the arid areas, such as desert and the Gobi, where the spatial variation of aerosol is usually very small, so 500 m is a suitable resolution of AOD retrieval, which can also greatly improve the algorithm’s efficiency.
- (2).
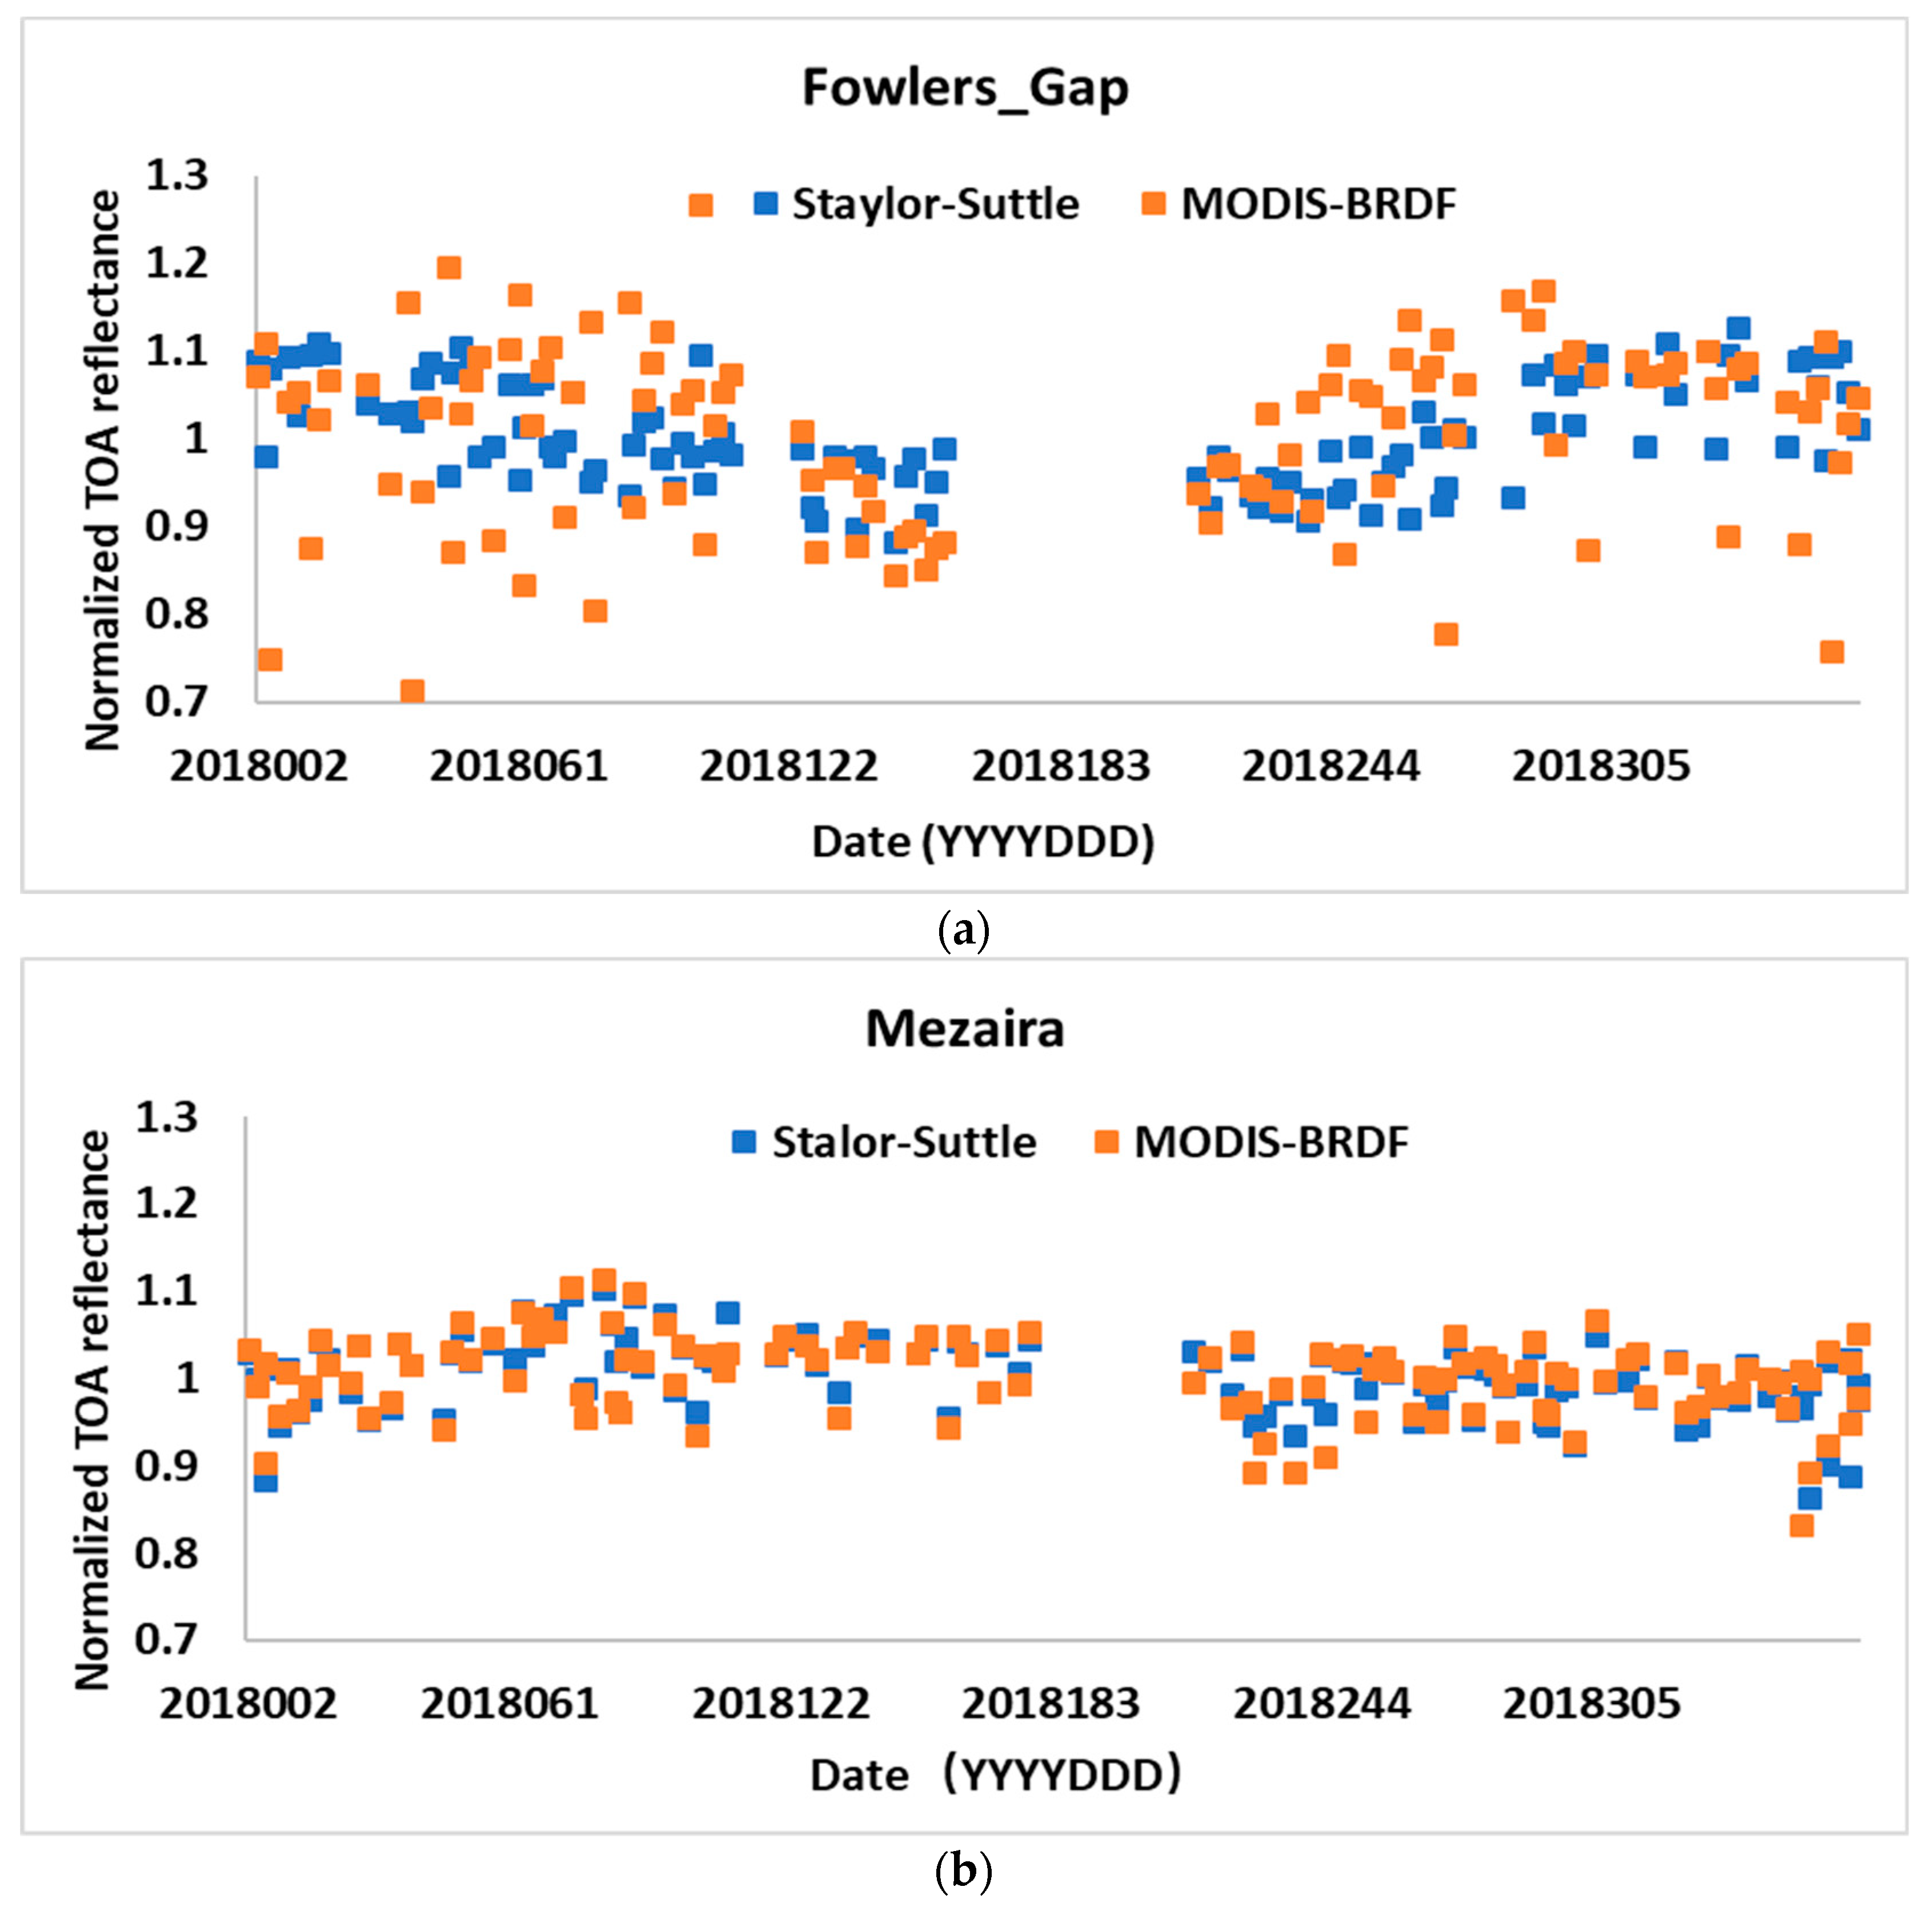
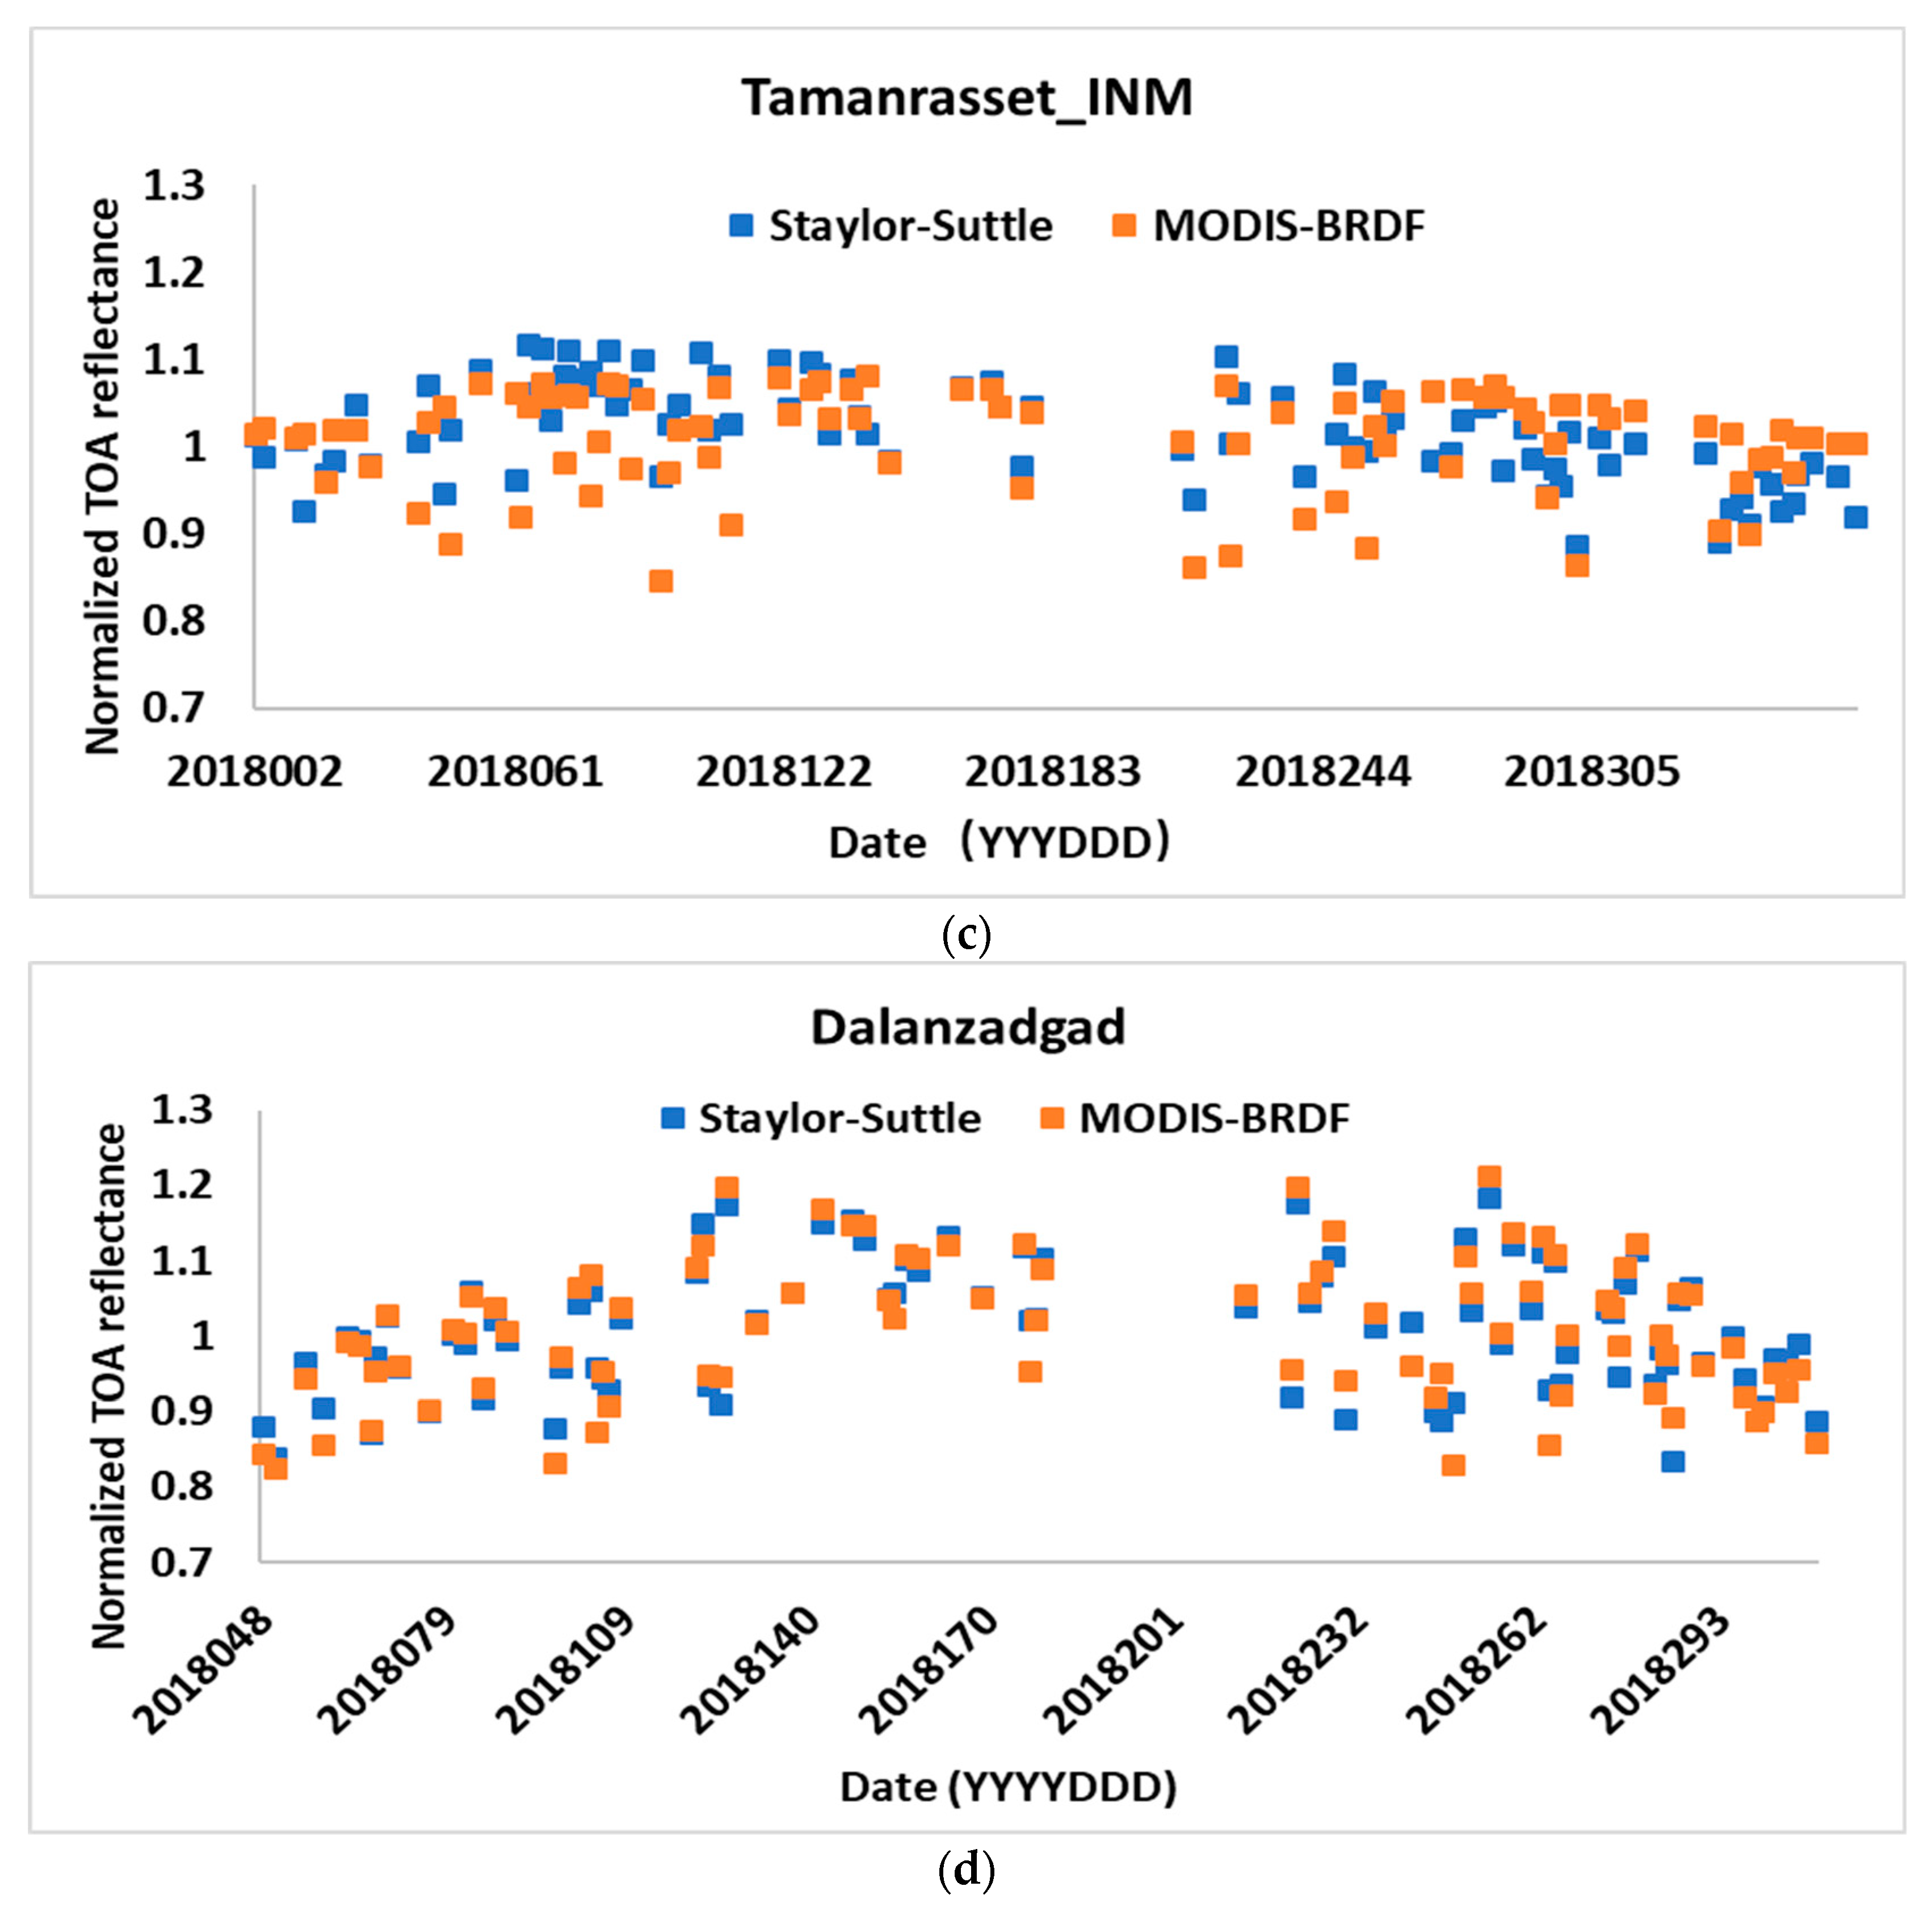
- Due to the path becoming longer with the increasing of view zenith angle, the TOA reflectance increases; however, the view zenith angle (VZA) is not taken into consideration while choosing the clearest observations and most of the clearest observations concentrate on observations with smaller VZA, which may cause large error. Thus, the proposed method chooses the clearest observations for every 10 degrees’ interval of VZA from 0 to 40 degrees (0–10, 11–20, 21–30, and 31–40), which will obtain observations with an even distribution of VZAs and subsequently improve the accuracy of the simulated BRDF. In addition, VZAs of MHSR data are seldom larger than 40 degree. Zhong et al. [17] undertook an accuracy evaluation of different BRDF models at a desert site, which showed that the Staylor–Suttles BRDF model [19] had the best fitting accuracy and the kernel model [20] was the second best. Therefore, a comparison between the Staylor–Suttles and the kernel BRDF models is carried out at four different AERONET sites (Fowlers_Gap, Mezaira, and Tamanrasset_INM, and Dalanzadgad) based on the method of Bhatt et al. [21]. In this comparison, the reflectance of long time series from different models is normalized. The normalized result is shown in Figure 2. The information of the four AERONET sites is listed in Table 2.
- (3).
- The TOA reflectance observed from MODIS in the blue band (459–479 nm) over the four different AERONET sites were normalized by the Staylor–Suttles and the kernel BRDF models in 2018 and the mean/standard deviation pairs (Staylor–Suttles, kernel) for the four sites are (1.0069/0.0852, 1.0072/0.0936), (1.0047/0.0613, 1.0025/0.1090), (1.0015/0.0430, 1.0014/0.0464), and (1.0163/0.0563, 1.0077/0.0580) respectively. The comparison between the Staylor–Suttles and the kernel BRDF models at the red band is also carried out at the four AERONET sites, and the mean/standard deviation pairs (Staylor–Suttles, kernel) for the four sites at the red band are (1.0009/0.0307, 1.0005/0.0247), (1.0004/0.0240, 1.0004/0.0135), (1.0005/0.0227, 1.0005/0.0313), and (1.0026/0.0505, 1.0116/0.0336), respectively. The fitting accuracy of the Staylor–Suttles model is much better than that of the kernel model at Fowlers_Gap (the first one) and the fitting accuracy is very similar at the other three sites. Thus, the Staylor–Suttles model is strongly recommended in this study and the kernel model is also recommended in most cases.
2.2.2. Aerosol Optical Depth (AOD) Determination for ‘Clearest’ Days
2.2.3. Creation of the Look-Up Tables (LUTs)
3. Results and Validation
3.1. Atmospheric Correction Results
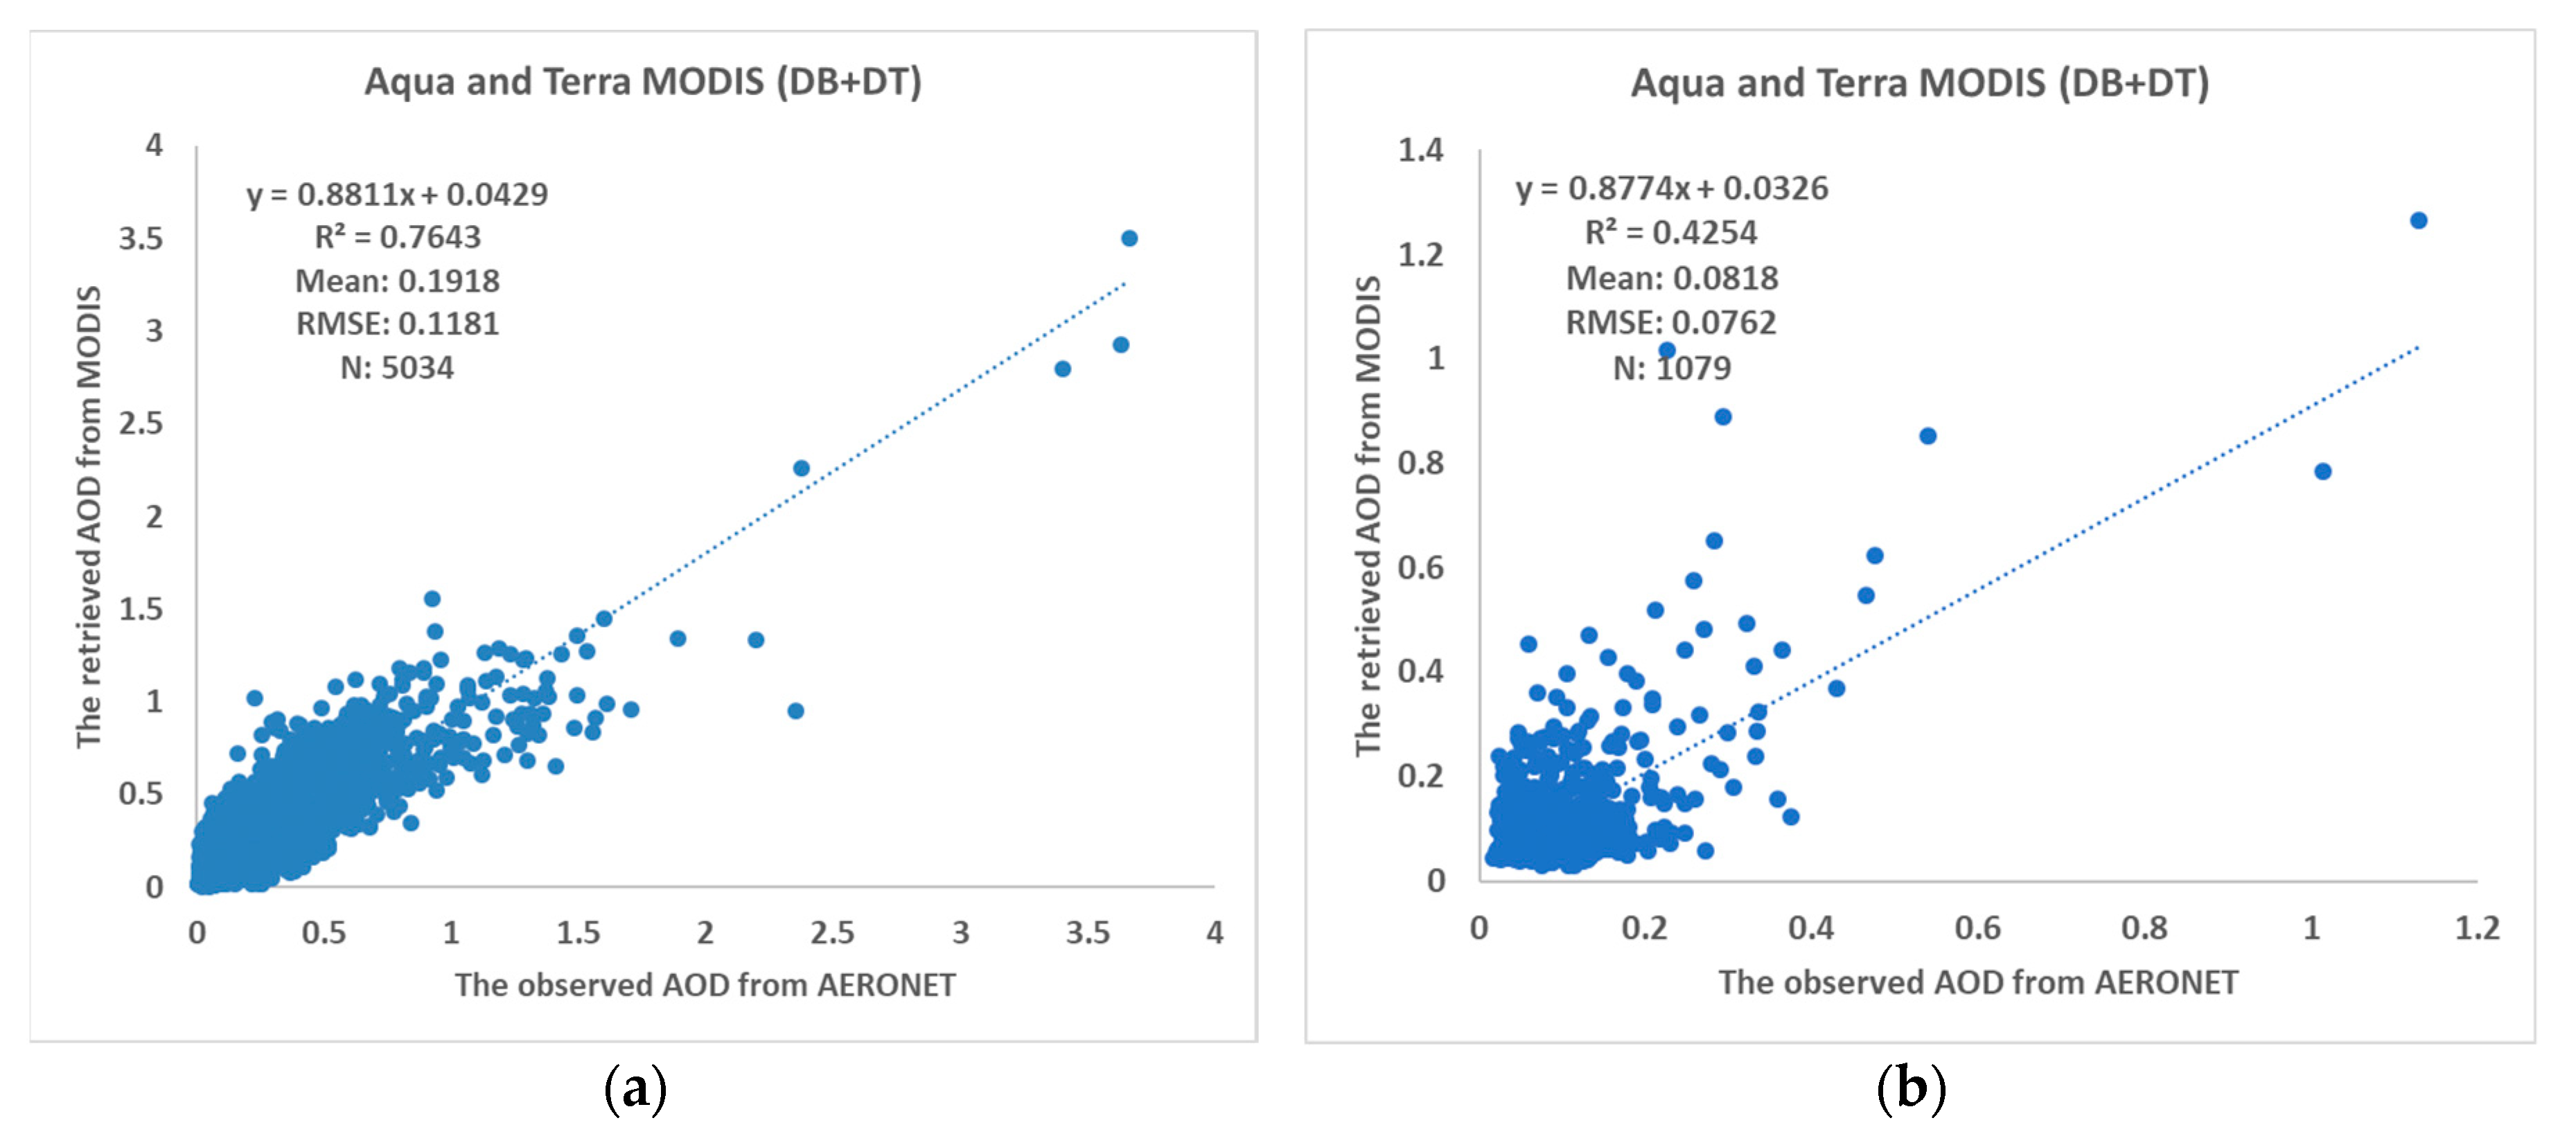
3.2. Validation
4. Discussion
5. Conclusions
Author Contributions
Funding
Acknowledgments
Conflicts of Interest
References
- Gong, P.; Wang, J.; Yu, L.; Zhao, Y.; Zhao, Y.; Liang, L.; Niu, Z.; Huang, X.; Fu, H.; Liu, S.; et al. Finer resolution observation and monitoring of global land cover: First mapping results with Landsat TM and ETM+ data. Int. J. Remote Sens. 2013, 34, 2607–2654. [Google Scholar] [CrossRef]
- Hansen, M.C.; Potapov, P.V.; Moore, R.; Hancher, M.; Turubanova, S.A.; Tyukavina, A.; Tyukavina, D.; Thau, S.V.; Stehman, S.J.; Goetz, T.R.; et al. High-Resolution Global Maps of 21st-Century Forest Cover Change. Science 2013, 342, 850–853. [Google Scholar] [CrossRef]
- Liang, S.; Fang, H.; Chen, M. Atmospheric correction of Landsat ETM+ land surface imagery. I. Methods. IEEE Trans. Geosci. Remote Sens. 2001, 39, 2490–2498. [Google Scholar] [CrossRef]
- Ouaidrari, H.; Vermote, E.F. Operational atmospheric correction of Landsat TM data. Remote Sens. Environ. 1999, 70, 4–15. [Google Scholar] [CrossRef]
- Masek, J.G.; Vermote, E.F.; Saleous, N.E.; Wolfe, R.; Hall, F.G.; Huemmrich, K.F.; Gao, F.; Kutler, J.; Lim, T.-K.A. Landsat surface reflectance dataset for North America, 1990–2000. IEEE Trans. Geosci. Remote Sens. Lett. 2006, 3, 68–72. [Google Scholar] [CrossRef]
- Ju, J.; Roy, D.P.; Vermote, E.; Masek, J.; Kovalskyy, V. Continental-scale validation of MODIS-based and LEDAPS Landsat ETM+ atmospheric correction methods. Remote Sens. Environ. 2012, 122, 175–184. [Google Scholar] [CrossRef]
- Sun, L.; Sun, C.K.; Liu, Q.H.; Zhong, B. Aerosol optical depth retrieval by HJ-1/CCD supported by MODIS surface reflectance data. Sci. China Earth Sci. 2010, 53, 74–80. [Google Scholar] [CrossRef]
- Remer, L.A.; Kaufman, Y.J.; Tanre, D.; Mattoo, S.; Chu, D.A.; Martins, J.V.; Li, R.R.; Ichoku, C.; Levy, R.C.; Kleidman, R.G.; et al. The MODIS aerosol algorithm, products, and validation. J. Atmos. Sci. 2005, 62, 947–973. [Google Scholar] [CrossRef]
- Kaufman, Y.J.; Tanre, D.; Remer, L.A.; Vermote, E.F.; Chu, A.; Holben, B.N. Operational remote sensing of tropospheric aerosol over land EOS moderate resolution imaging spectroradiometer. J. Geophys. Res. 1997, 102, 17051–17067. [Google Scholar] [CrossRef]
- Hsu, N.C.; Tsay, S.C.; King, M.D.; Herman, J.R. Aerosol properties over bright-reflecting source regions. IEEE Trans. Geosci. Remote Sens. 2004, 42, 557–569. [Google Scholar] [CrossRef]
- Kaufman, Y.J.; Karnieli, A.; Tanre, D. Detection of dust over deserts using satellite data in the solar wavelengths. IEEE Trans. Geosci. Remote Sens. 2000, 38, 525–531. [Google Scholar] [CrossRef]
- Tanre, D.; Legrand, M. On the satellite retrieval of Saharan dust optical thickness over land: Two different approaches. J. Geophys. Res. 1991, 96, 5221–5227. [Google Scholar] [CrossRef]
- Luo, N.; Wong, M.S.; Zhao, W.; Yan, X.; Xiao, F. Improved aerosol retrieval algorithm using Landsat images and its application for PM10 monitoring over urban areas. Atmos. Res. 2015, 153, 264–275. [Google Scholar] [CrossRef]
- Richter, R. A spatially adaptive fast atmospheric correction algorithm. Int. J. Remote Sens. 1996, 17, 1201–1214. [Google Scholar] [CrossRef]
- Zhong, B.; Wu, S.; Yang, A.; Liu, Q. An improved aerosol optical depth retrieval algorithm for moderate to high spatial resolution optical remotely sensed imagery. Remote Sens. 2017, 9, 555. [Google Scholar] [CrossRef]
- Liang, S.; Zhong, B.; Fang, H. Improved estimation of aerosol optical depth from MODIS imagery over land surfaces. Remote Sens. Environ. 2006, 104, 416–425. [Google Scholar] [CrossRef]
- Zhong, B.; Yang, A.; Wu, S.; Li, J.; Liu, S.; Liu, Q. Cross-calibration of reflective bands of major moderate resolution remotely sensed data. Remote Sens. Environ. 2018, 204, 412–423. [Google Scholar] [CrossRef]
- Zhong, B.; Liang, S.; Holben, B. Validating a new algorithm for estimating aerosol optical depths over land from MODIS imagery. Int. J. Remote Sens. 2007, 28, 4207–4214. [Google Scholar] [CrossRef]
- Staylor, W.F.; Suttles, J.T. Reflection and emission models for deserts derived from nimbus-7 ERB scanner measurements. J. Clim. Appl. Meteor. 1986, 25, 196–202. [Google Scholar] [CrossRef]
- Schaaf, C.B.; Gao, F.; Strahler, A.H.; Lucht, W.; Li, X.; Tsang, T.; Strugnell, N.C.; Zhang, X.; Jin, Y.; Muller, J.-P.; et al. First operational BRDF, albedo nadir reflectance products from MODIS. Remote. Sens. Environ. 2002, 83, 135–148. [Google Scholar] [CrossRef]
- Bhatt, R.; Doelling, D.R.; Morstad, D.; Scarino, B.R.; Gopalan, A. Desert-based absolute calibration of successive geostationary visible sensors using a daily exoatmospheric radiance model. IEEE Trans. Geosci. Remote. Sens. 2013, 52, 3670–3682. [Google Scholar] [CrossRef]
- Xu, Y.; Zhao, Q.; Chen, A. Lookup Table based Pixel-by-Pixel Atmospheric Correction Method of Remote Sensing Images. U.S. Patent CN101915914B, 24 October 2012. [Google Scholar]
- Xu, Y.; Qin, Z.; Chen, A. A pixel-by-pixel atmospheric correction algorithm for MODIS data based on look-up table. Geomat. Inf. Sci. Wuhan Univ. 2010, 35, 959–962. [Google Scholar]
- Hu, S.; She, X.; Tong, Q. Design and interpolation of a general look-up table for remote sensing image atmospheric correction. J. Remote Sens. 2014, 18, 45–60. [Google Scholar]
- Kotchenova, S.; Vermote, E.R.; Matarrese, R.; Klemm, F., Jr. Validation of a vector version of the 6S radiative transfer code for atmospheric correction of satellite data. Part I: Path radiance. Appl. Opt. 2006, 45, 6762–6774. [Google Scholar] [CrossRef]


| Sensor(s) | Platform(s) | Spatial Resolution (m) | Swath (km) | Spectra for AOD Retrieval | Nation |
|---|---|---|---|---|---|
| TM, ETM+, OLI | Landsat | 30 | 185 | VNIR, SWIR | USA |
| MSI | Sentinel-2 | 10/20/60 | 290 | VNIR, SWIR | ESA |
| CCD | HJ-1/A&B | 30 | 700 (2 cameras) | VNIR | China |
| CCD | CBERS-02B | 20 | 113 | VNIR | China |
| WFI | 2.36 | 27 | |||
| CCD | GF-1 | 8 | 60 | VNIR | China |
| WFV | 16 | 800 (4 cameras) | |||
| MSI | ZY-3 | 5.8 | 52 | VNIR | China |
| CCD | GF-6 | 8 | 60 | VNIR | China |
| WFV | 16 | 800 (1 camera) | |||
| MODIS | Terra/Aqua | 250/500/1000 | 2330 | VNIR, SWIR | USA |
| Site_Name | Longitude (°) | Latitude (°) | Elevation (m) | Average AOD Level 2.0 (AOD_500 nm) in 2018 | Average Water Vapor in 2018 (g/cm2) | Surrounding Surface Type |
|---|---|---|---|---|---|---|
| Fowlers_Gap | 141.700820 | −31.086300 | 181 | 0.0320 | 1.2355 | Gobi |
| Mezaira | 53.754660 | 23.104520 | 201 | 0.3078 | 1.3620 | Gobi |
| Tamanrasset_INM | 5.530000 | 22.790000 | 1377 | 0.1943 | 0.6060 | Desert |
| Dalanzadgad | 104.419167 | 43.577222 | 1470 | 0.0863 | 0.6667 | Gobi-desert |
| Parameter | Setting | Format | Source |
|---|---|---|---|
| View zenith angle | 0–30°:5° | Range: interval | Metadata of MHSR imagery |
| Solar zenith angle | 0–50°:5° | Range: interval | Metadata of MHSR imagery |
| Relative azimuth angle | 0–180°:10° | Range: interval | Metadata of MHSR imagery |
| Atmospheric model | Mid-latitude summer, mid-latitude winter, tropical | Geographic latitude | |
| Aerosol model | Desert and continental models | Land cover from FROM-GLC 1 | |
| AOD | 0.01, 0.05, 0.1, 0.2, 0.4, 0.8, 1.0, 1.5, and 2.0. | ||
| Altitude | 0, 100, 200, 500, 1000, 2000, 3000, 4000, and 5000 m | ASTER digital elevation model (http://asterweb.jpl.nasa.gov/gdem.asp) | |
| Water vapor | 0.1–5.1: 1 g/cm2 | Range: interval | MODIS product |
| Surface reflectance | Blue: 0–0.2:0.02 Green: 0–0.4:0.04 Red: 0–0.4:0.04 NIR: 0–0.5:0.05 | Range: interval | |
| Sensor | All the sensors listed in Table 1 | Metadata of MHSR imagery |
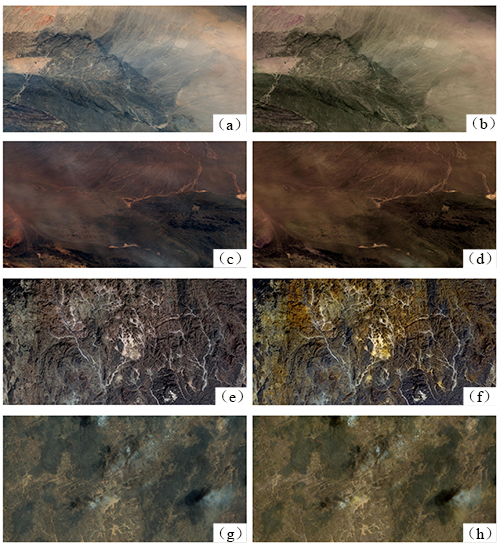
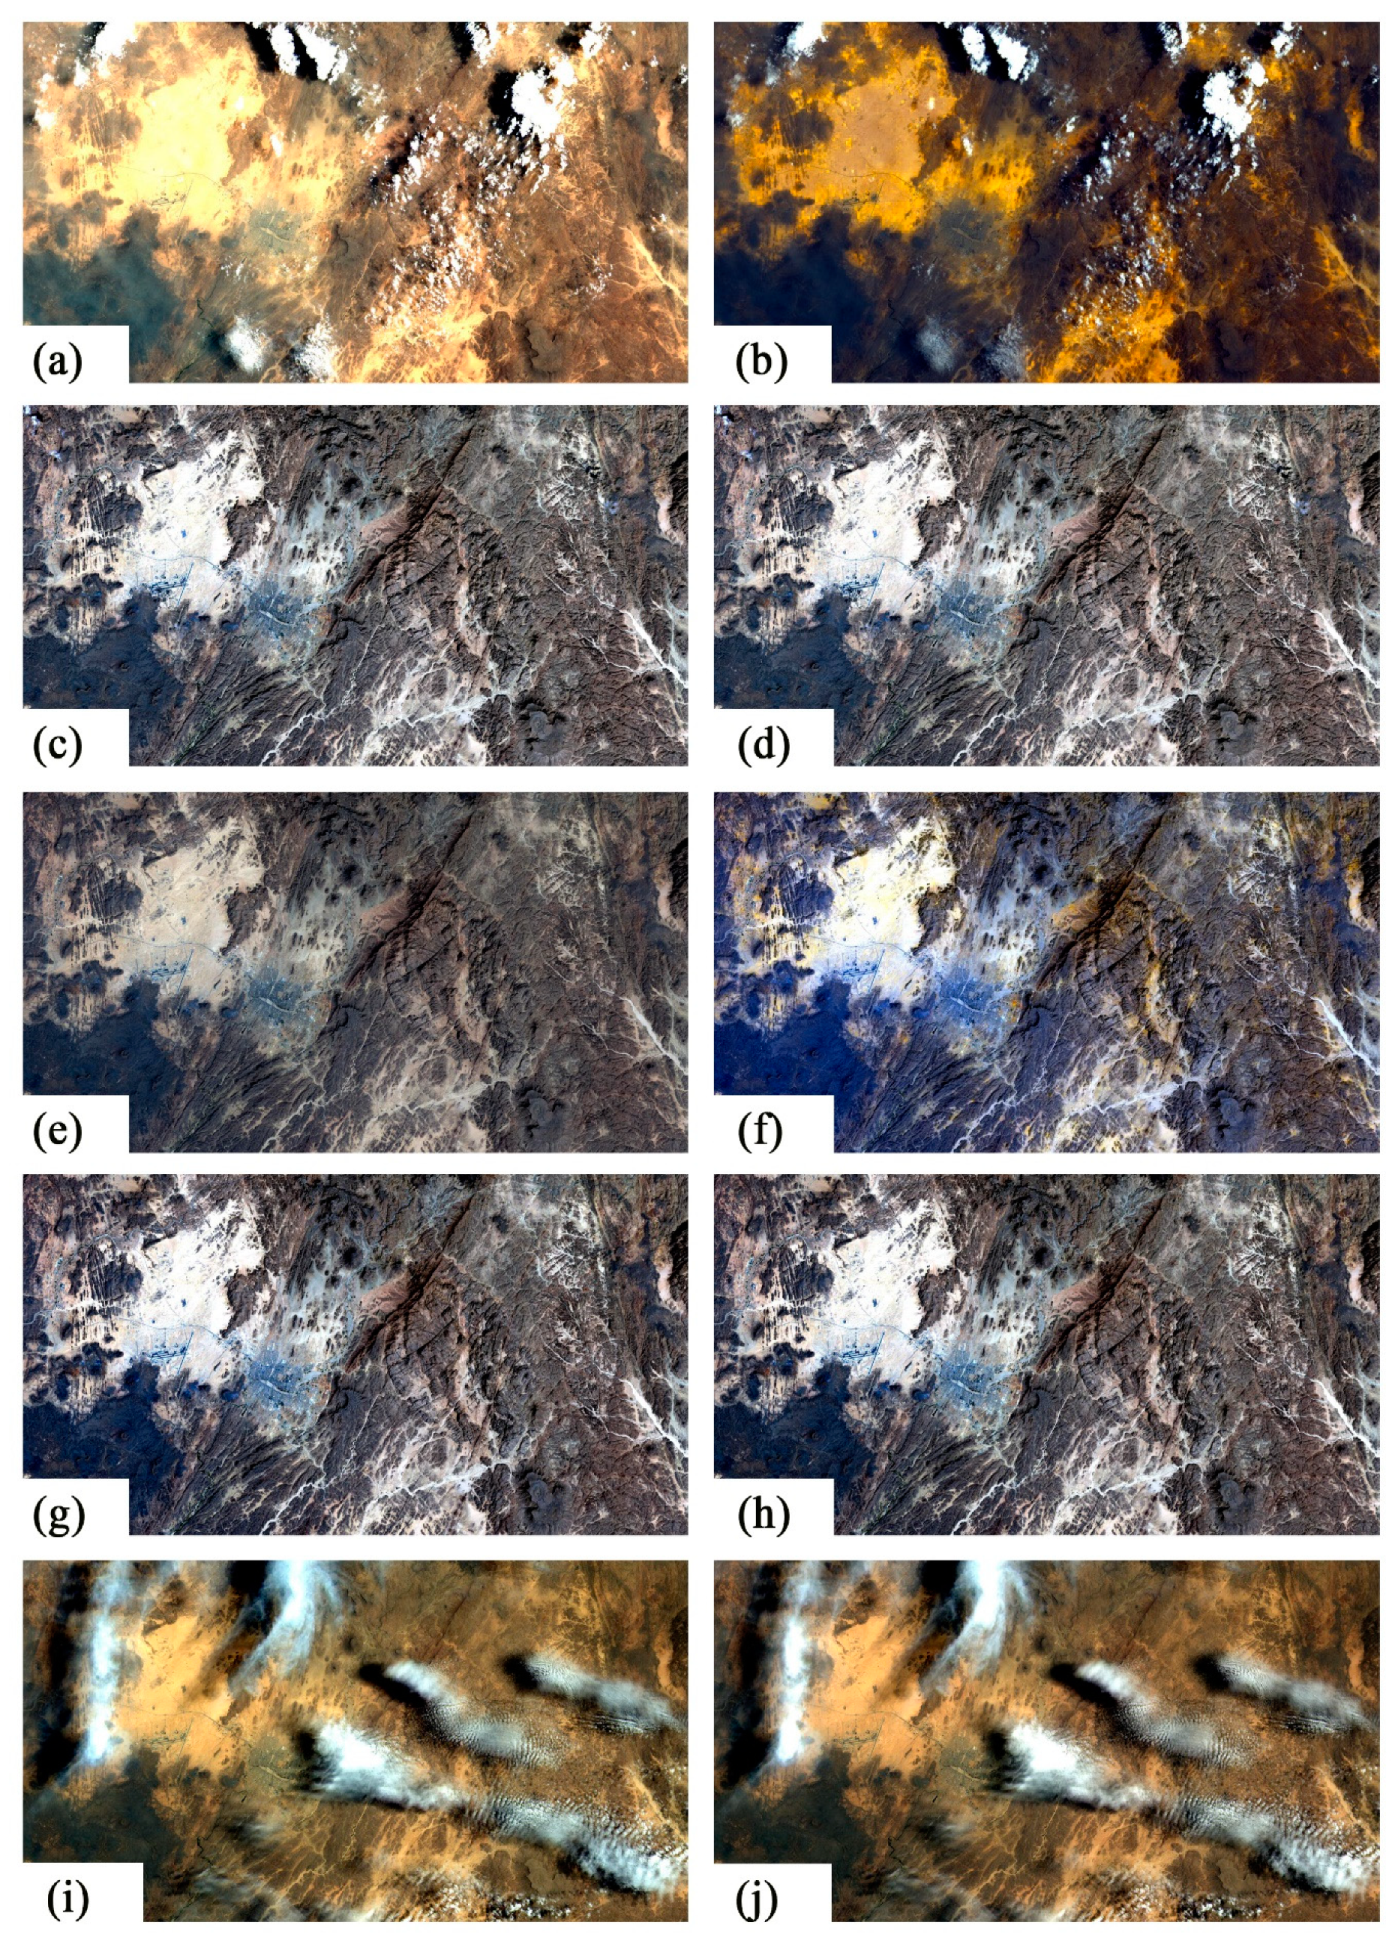
| Parameter | (a) and (b) | (c) and (d) | (e) and (f) | (g) and (h) |
|---|---|---|---|---|
| Image date | 31 May 2018 | 31 May 2018 | 19 February 2017 | 24 May 2018 |
| View zenith angle (°) | 8.78 | 26.58 | 0 | 3.99 |
| Solar zenith angle (°) | 22.38 | 21.61 | 43.18 | 16.45 |
| Relative azimuth angle 1 (°) | 116.15 | 112.75 | 139.62 | 157.16 |
| Atmospheric model | Mid-latitude, summer | Mid-latitude, summer | Mid-latitude, winter | Mid-latitude, summer |
| Aerosol model | Continental | Continental | Continental | Continental |
| AOD | 0.15 | 0.12 | 0.24 | 0.71 |
| Altitude (m) | 1569 | 1545 | 774 | 772 |
| Surface reflectance | 0.117 | 0.098 | 0.12 | 0.142 |
| Sensor | GF-1/WFV3 | GF-1/WFV4 | Landsat8/OLI | Sentinel2B/MSI |
| Parameter | (a) and (b) | (c) and (d) | (e) and (f) | (g) and (h) | (i) and (j) |
|---|---|---|---|---|---|
| Image date | 29 May 2015 | 1 December 2016 | 19 February 2017 | 23 March 2017 | 11 June 2017 |
| View zenith angle (°) | 0 | 0 | 0 | 0 | 0 |
| Solar zenith angle (°) | 21.34 | 49.28 | 43.18 | 32.79 | 21.49 |
| Relative azimuth angle 1 (°) | 89.47 | 154.47 | 139.62 | 128.42 | 85.37 |
| Atmospheric model | Mid-latitude, summer | Mid-latitude, winter | Mid-latitude, winter | Mid-latitude, winter | Mid-latitude, summer |
| Aerosol model | Continental | Continental | Continental | Continental | Continental |
| AOD | 1.16 | 0.25 | 0.24 | 0.15 | 1.2 |
| Surface reflectance | 0.132 | 0.15 | 0.12 | 0.14 | 0.13 |
© 2020 by the authors. Licensee MDPI, Basel, Switzerland. This article is an open access article distributed under the terms and conditions of the Creative Commons Attribution (CC BY) license (http://creativecommons.org/licenses/by/4.0/).
Share and Cite
Zhong, B.; Wu, S.; Yang, A.; Ao, K.; Wu, J.; Wu, J.; Gong, X.; Wang, H.; Liu, Q. An Atmospheric Correction Method over Bright and Stable Surfaces for Moderate to High Spatial-Resolution Optical Remotely Sensed Imagery. Remote Sens. 2020, 12, 733. https://0-doi-org.brum.beds.ac.uk/10.3390/rs12040733
Zhong B, Wu S, Yang A, Ao K, Wu J, Wu J, Gong X, Wang H, Liu Q. An Atmospheric Correction Method over Bright and Stable Surfaces for Moderate to High Spatial-Resolution Optical Remotely Sensed Imagery. Remote Sensing. 2020; 12(4):733. https://0-doi-org.brum.beds.ac.uk/10.3390/rs12040733
Chicago/Turabian StyleZhong, Bo, Shanlong Wu, Aixia Yang, Kai Ao, Jinhua Wu, Junjun Wu, Xueshuang Gong, Haibo Wang, and Qinhuo Liu. 2020. "An Atmospheric Correction Method over Bright and Stable Surfaces for Moderate to High Spatial-Resolution Optical Remotely Sensed Imagery" Remote Sensing 12, no. 4: 733. https://0-doi-org.brum.beds.ac.uk/10.3390/rs12040733