Influence of the Sun Position and Platform Orientation on the Quality of Imagery Obtained from Unmanned Aerial Vehicles


Abstract
:
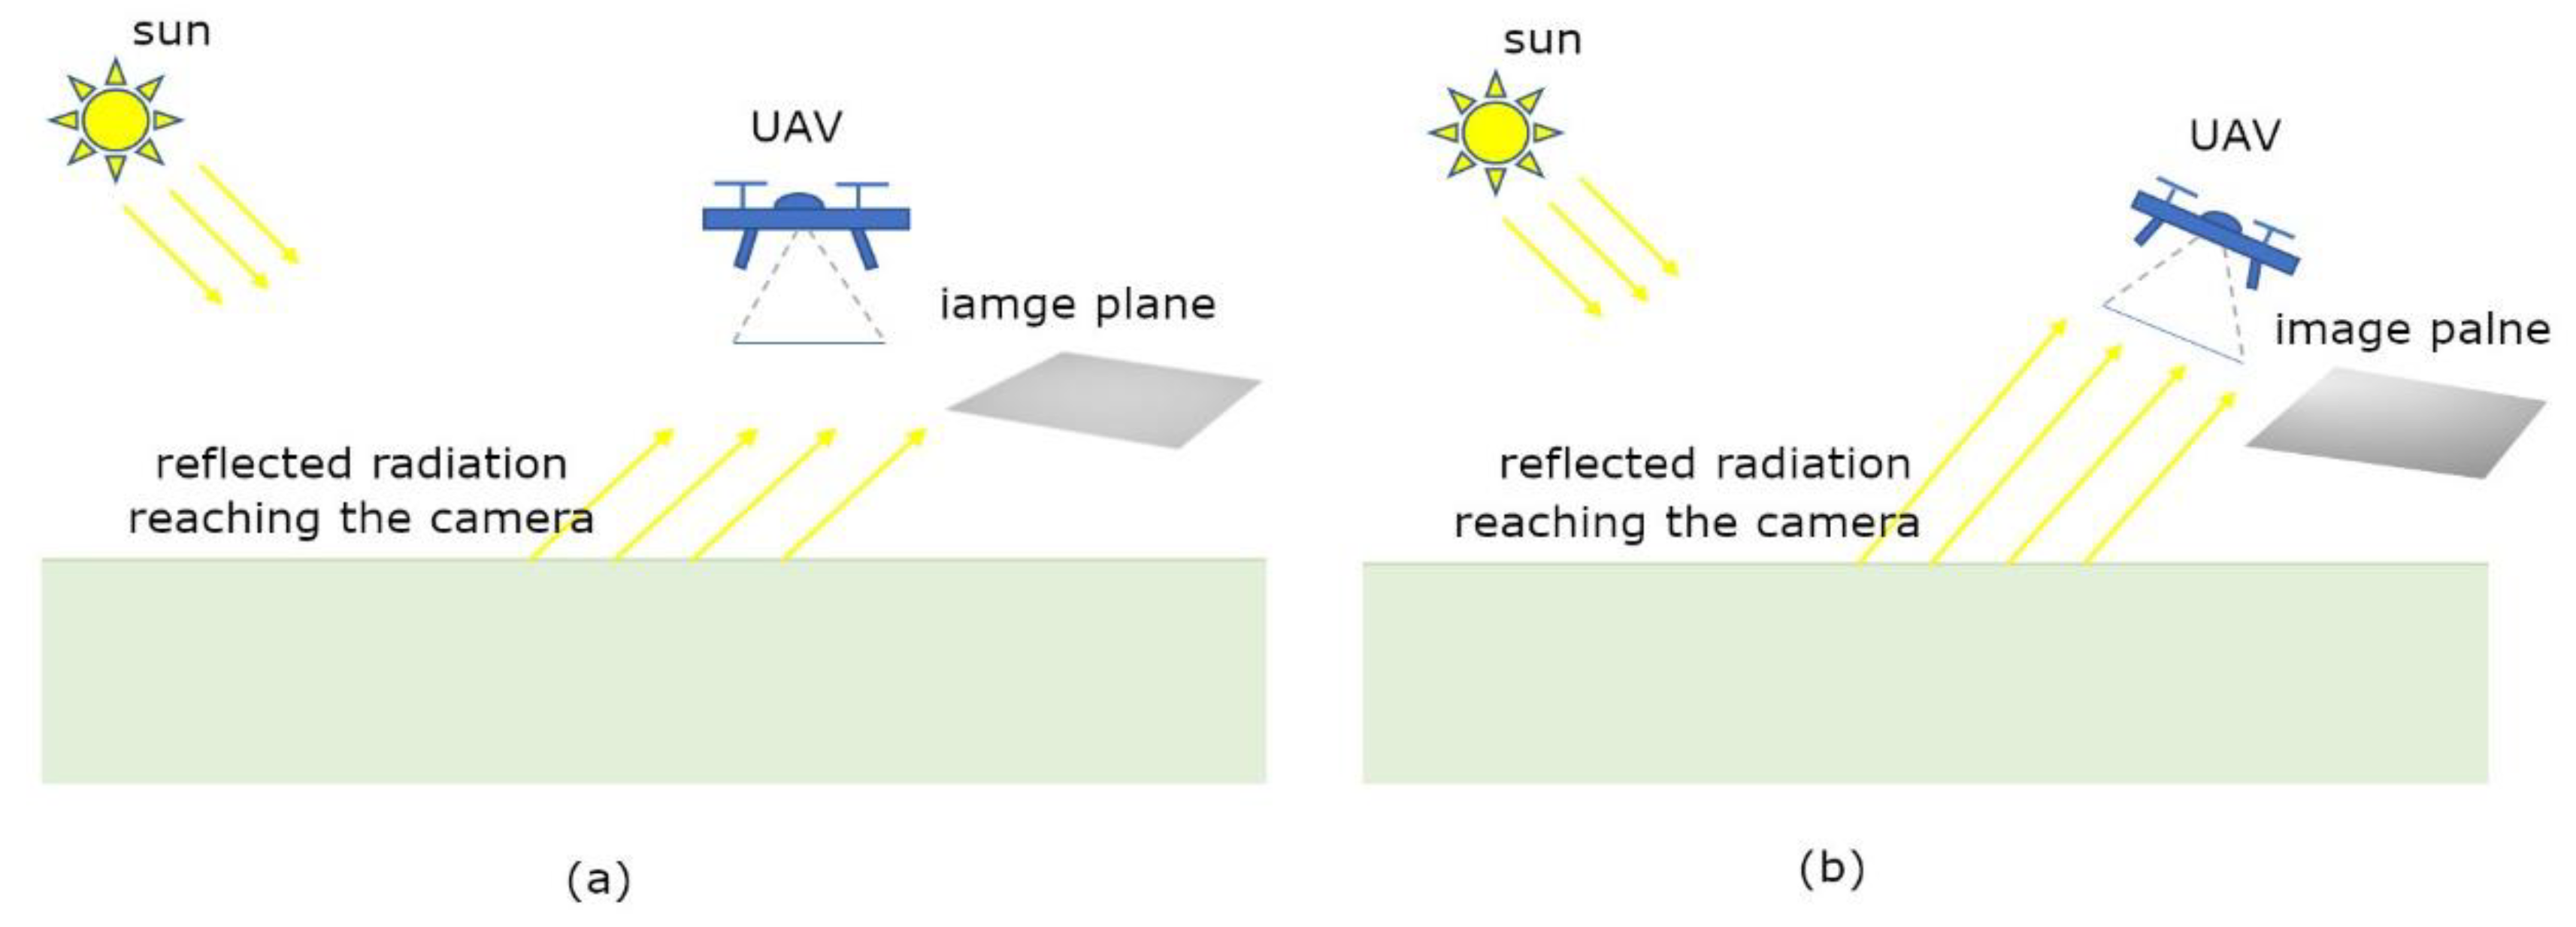
1. Introduction
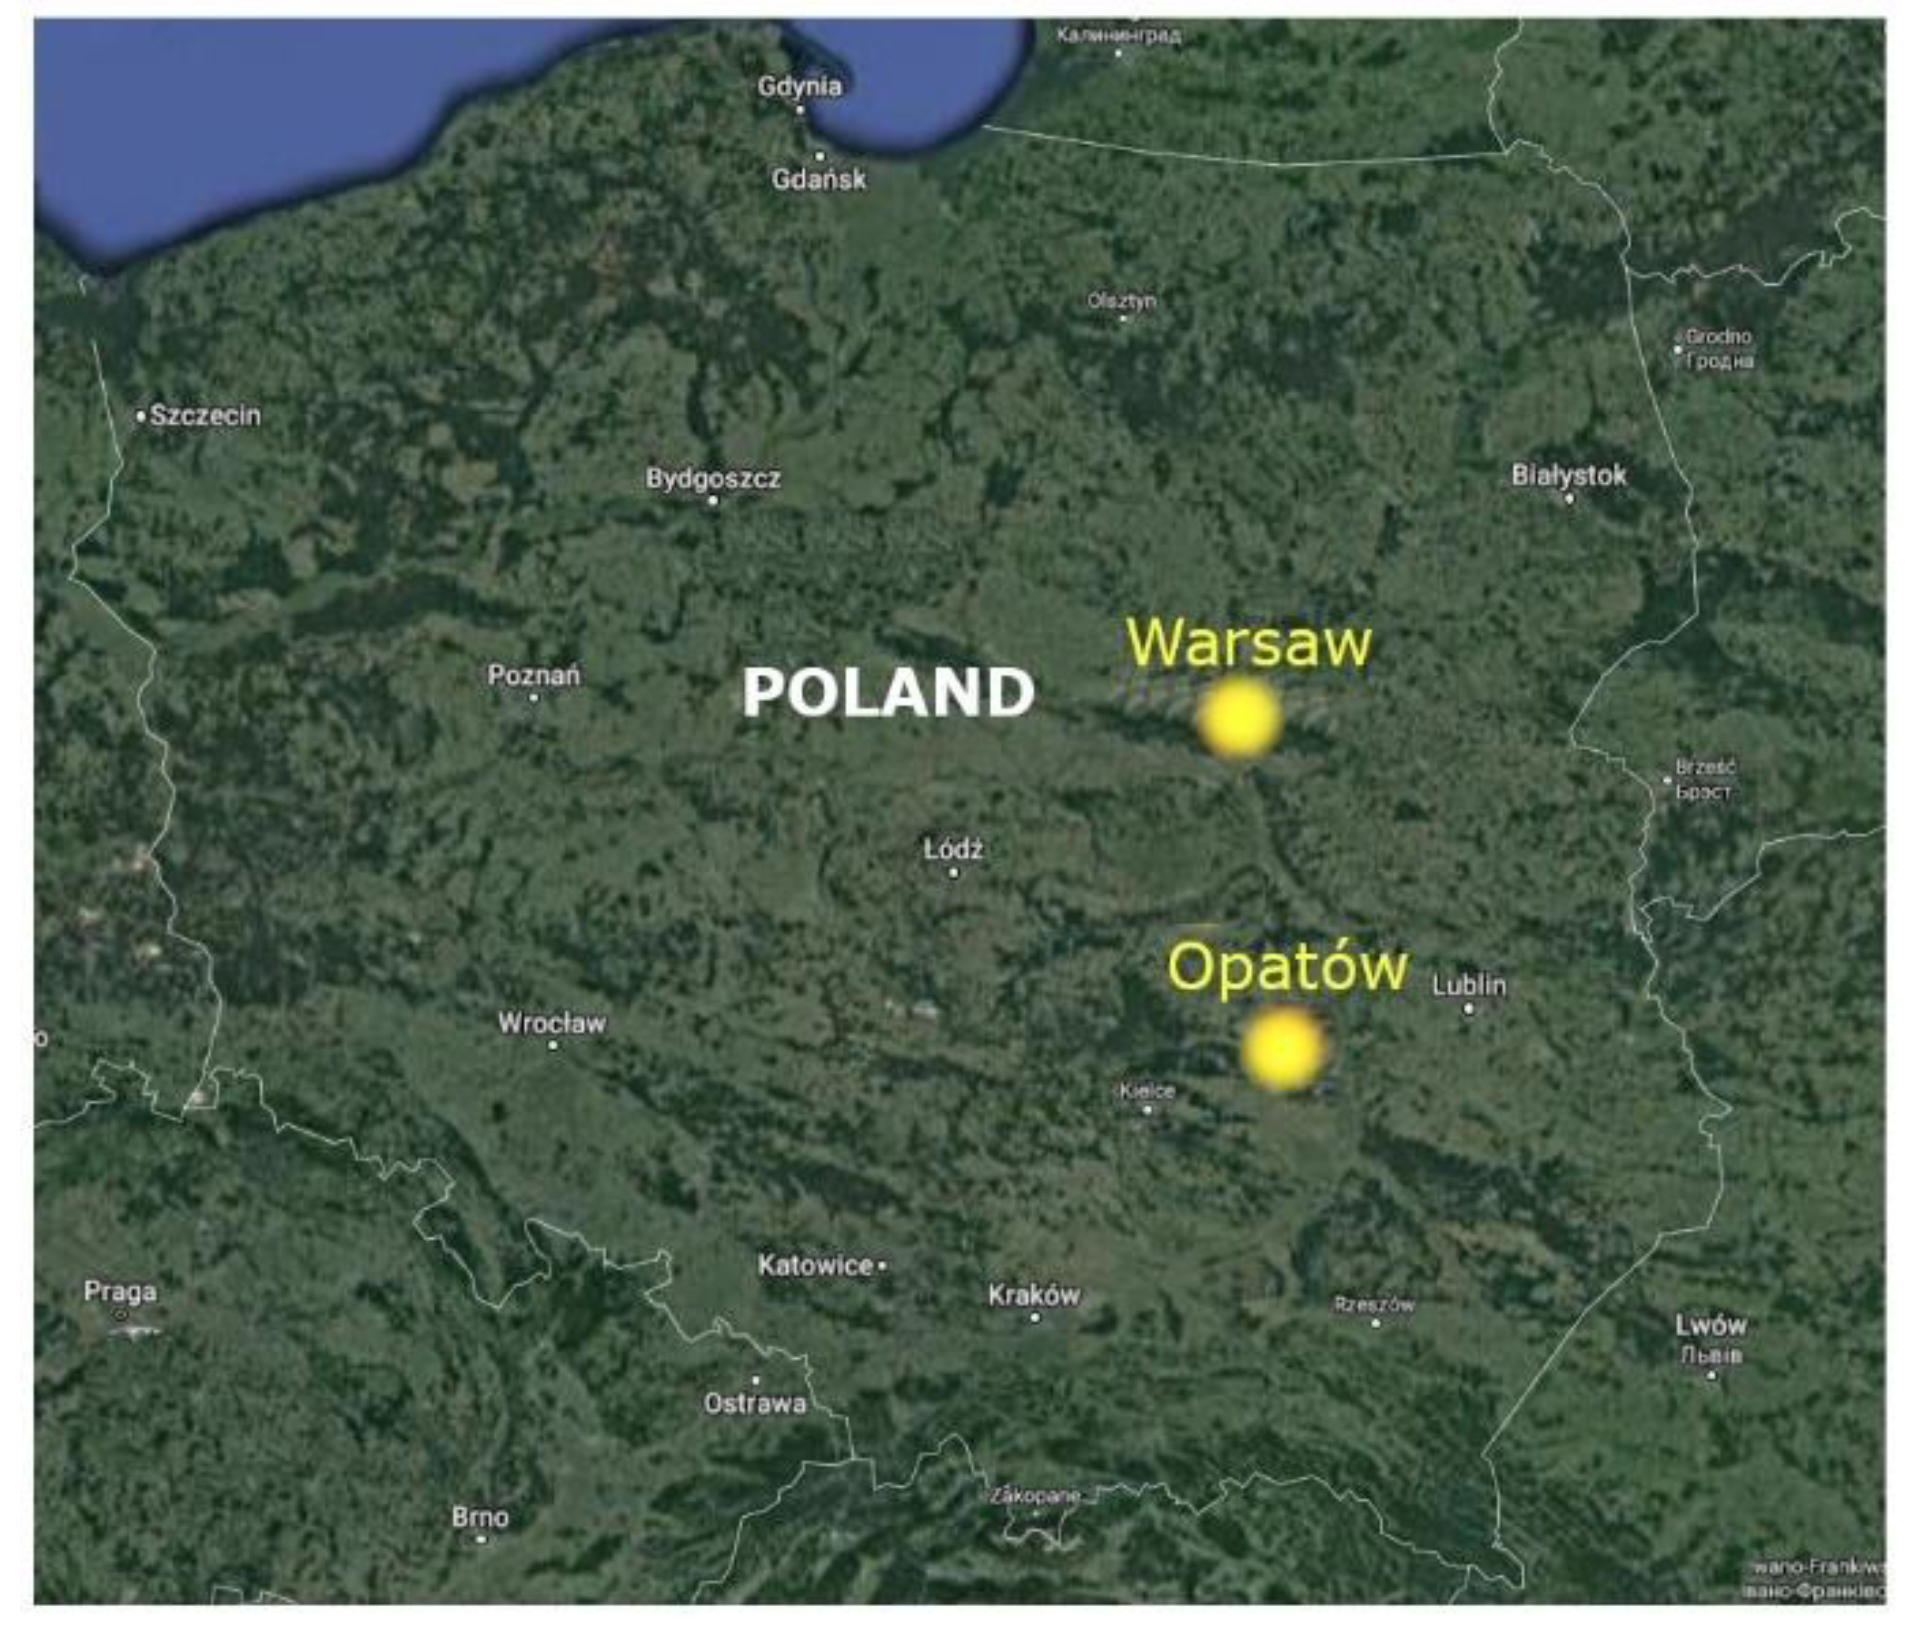
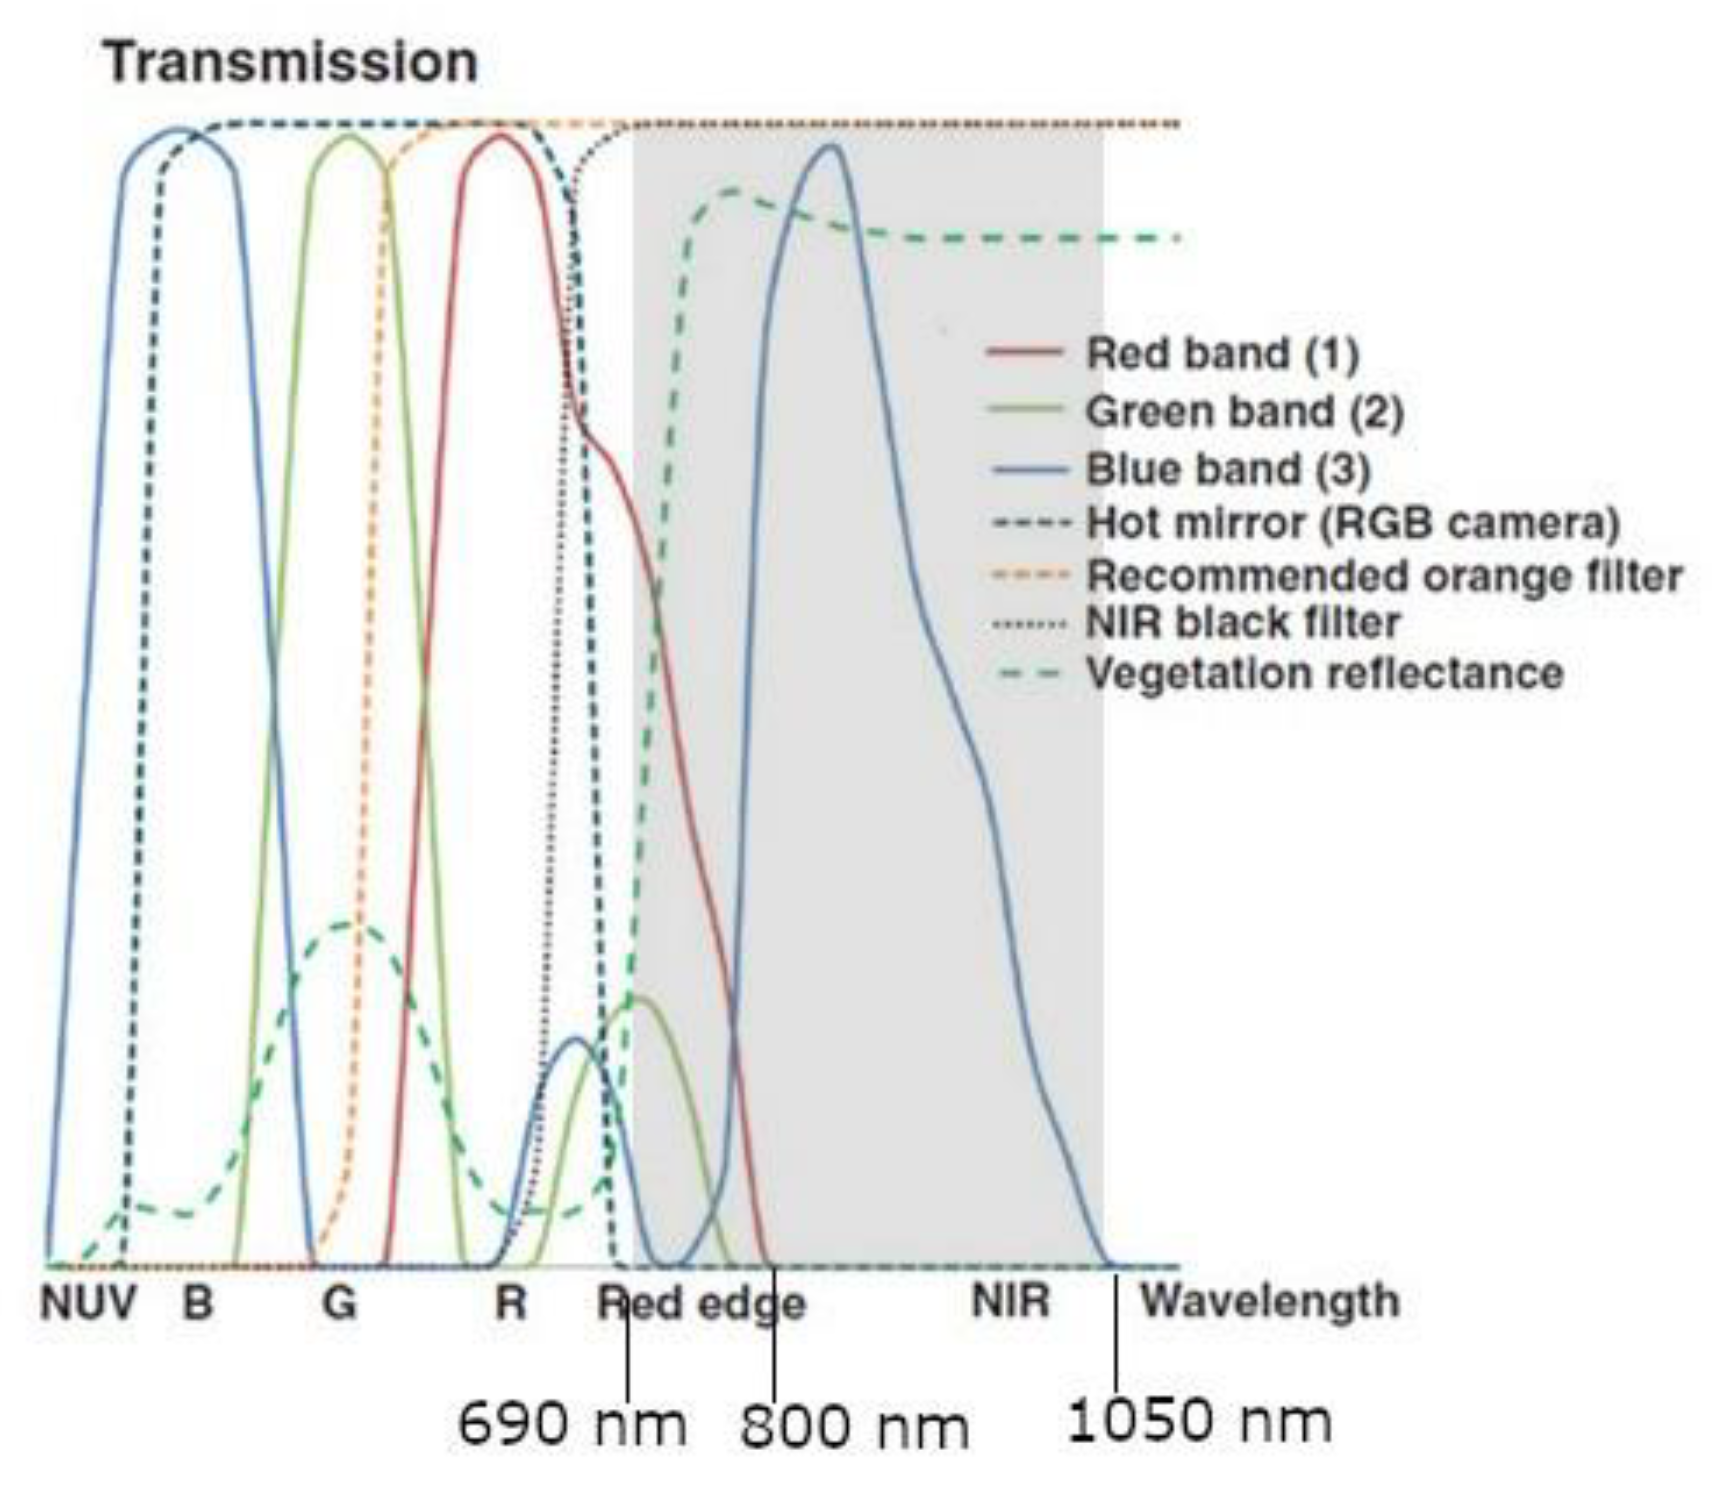
2. Materials
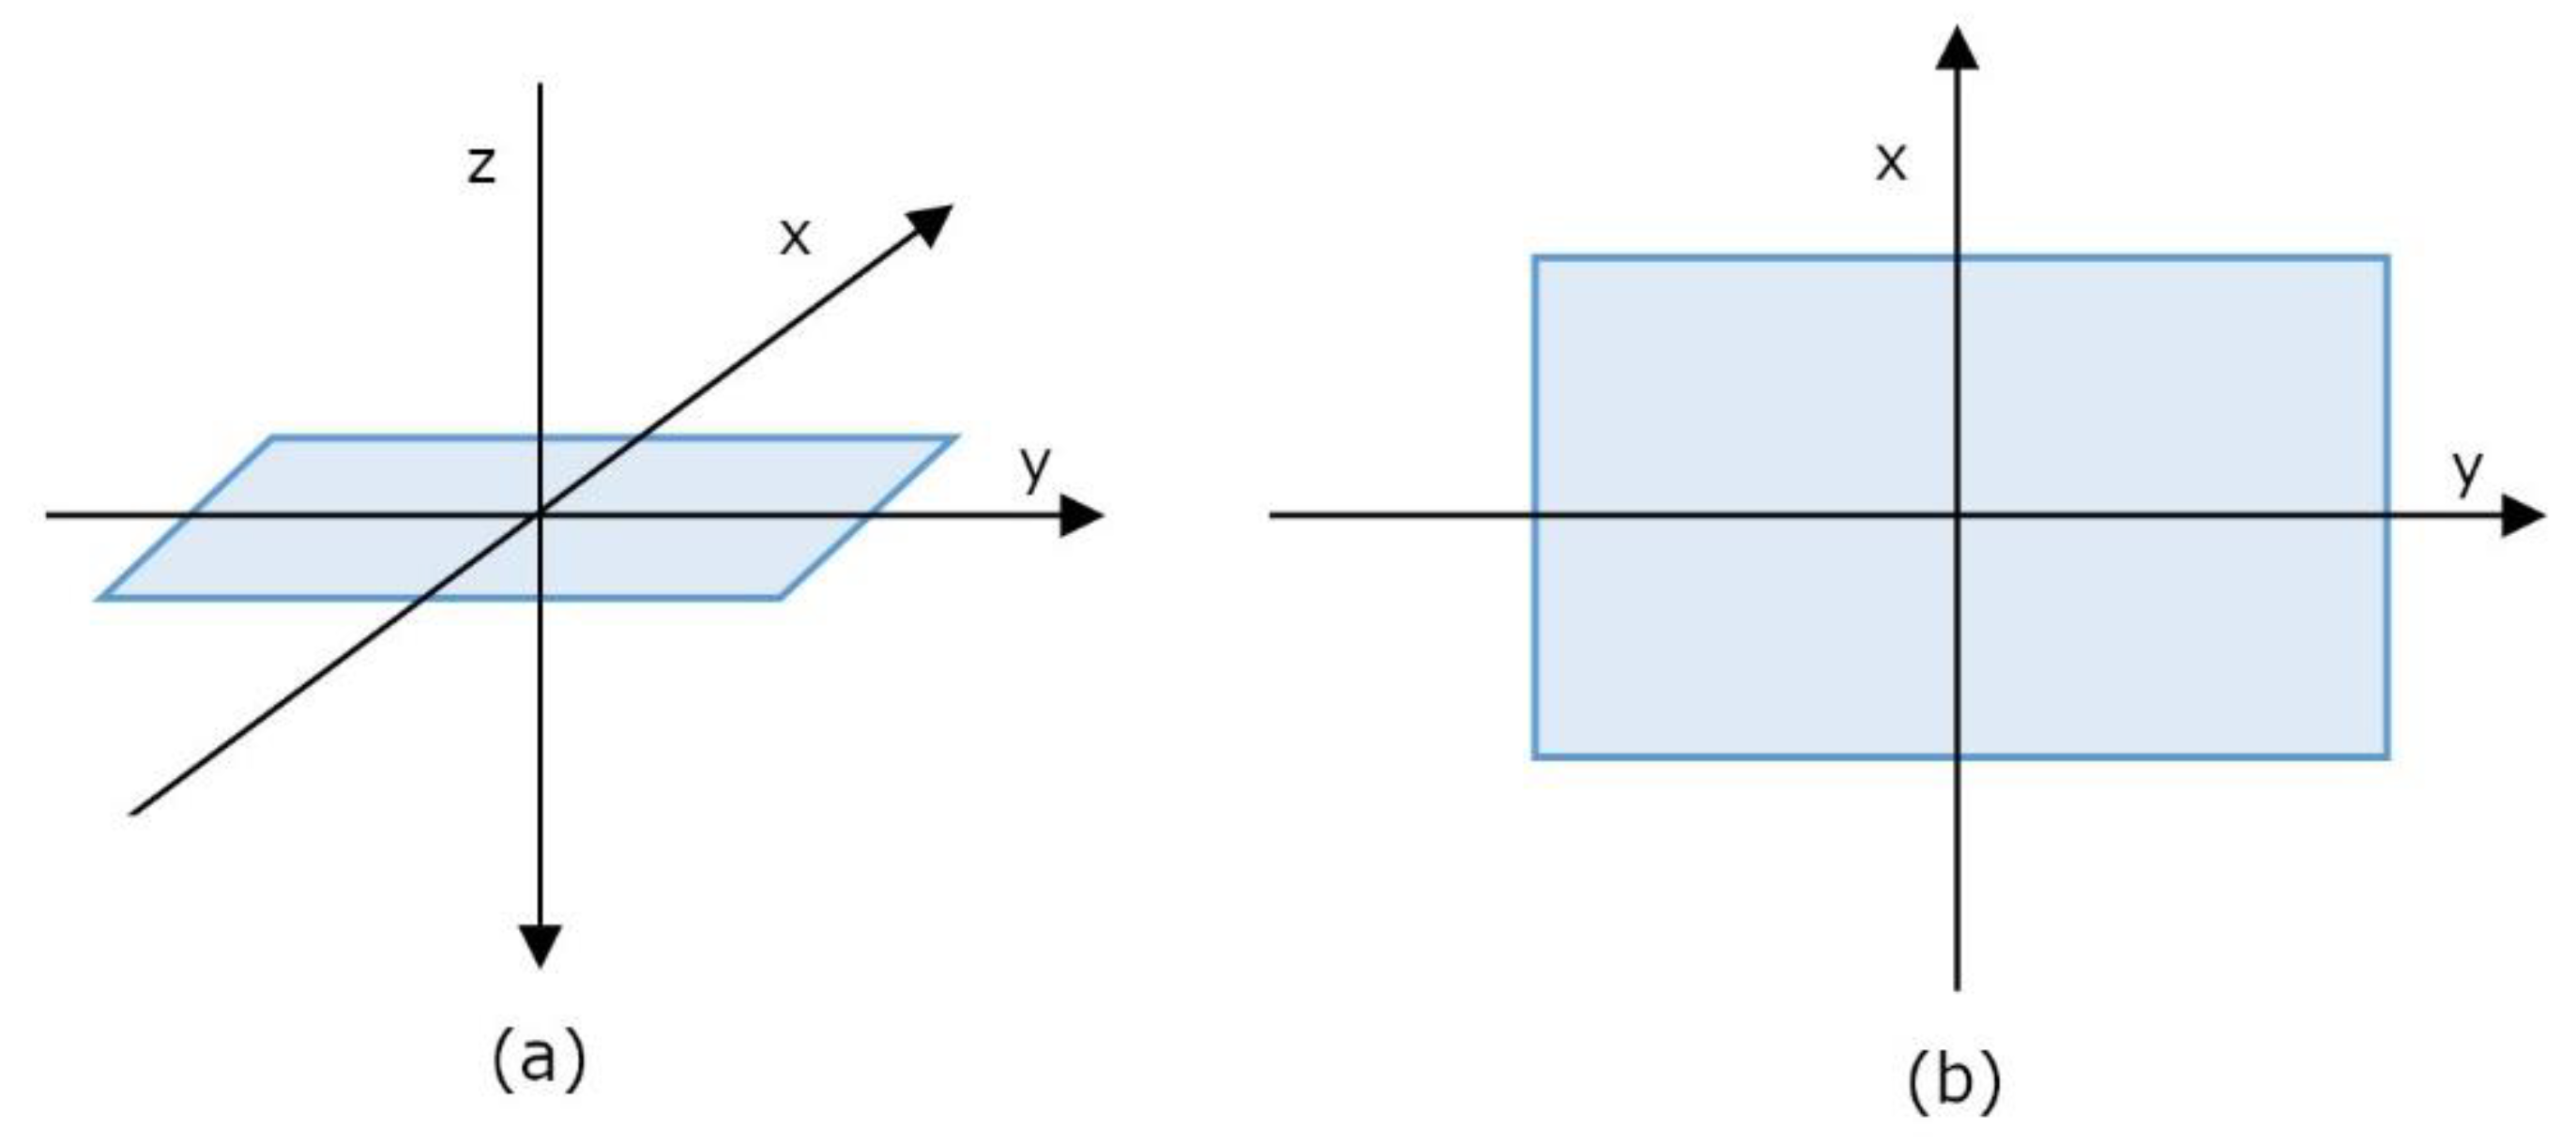
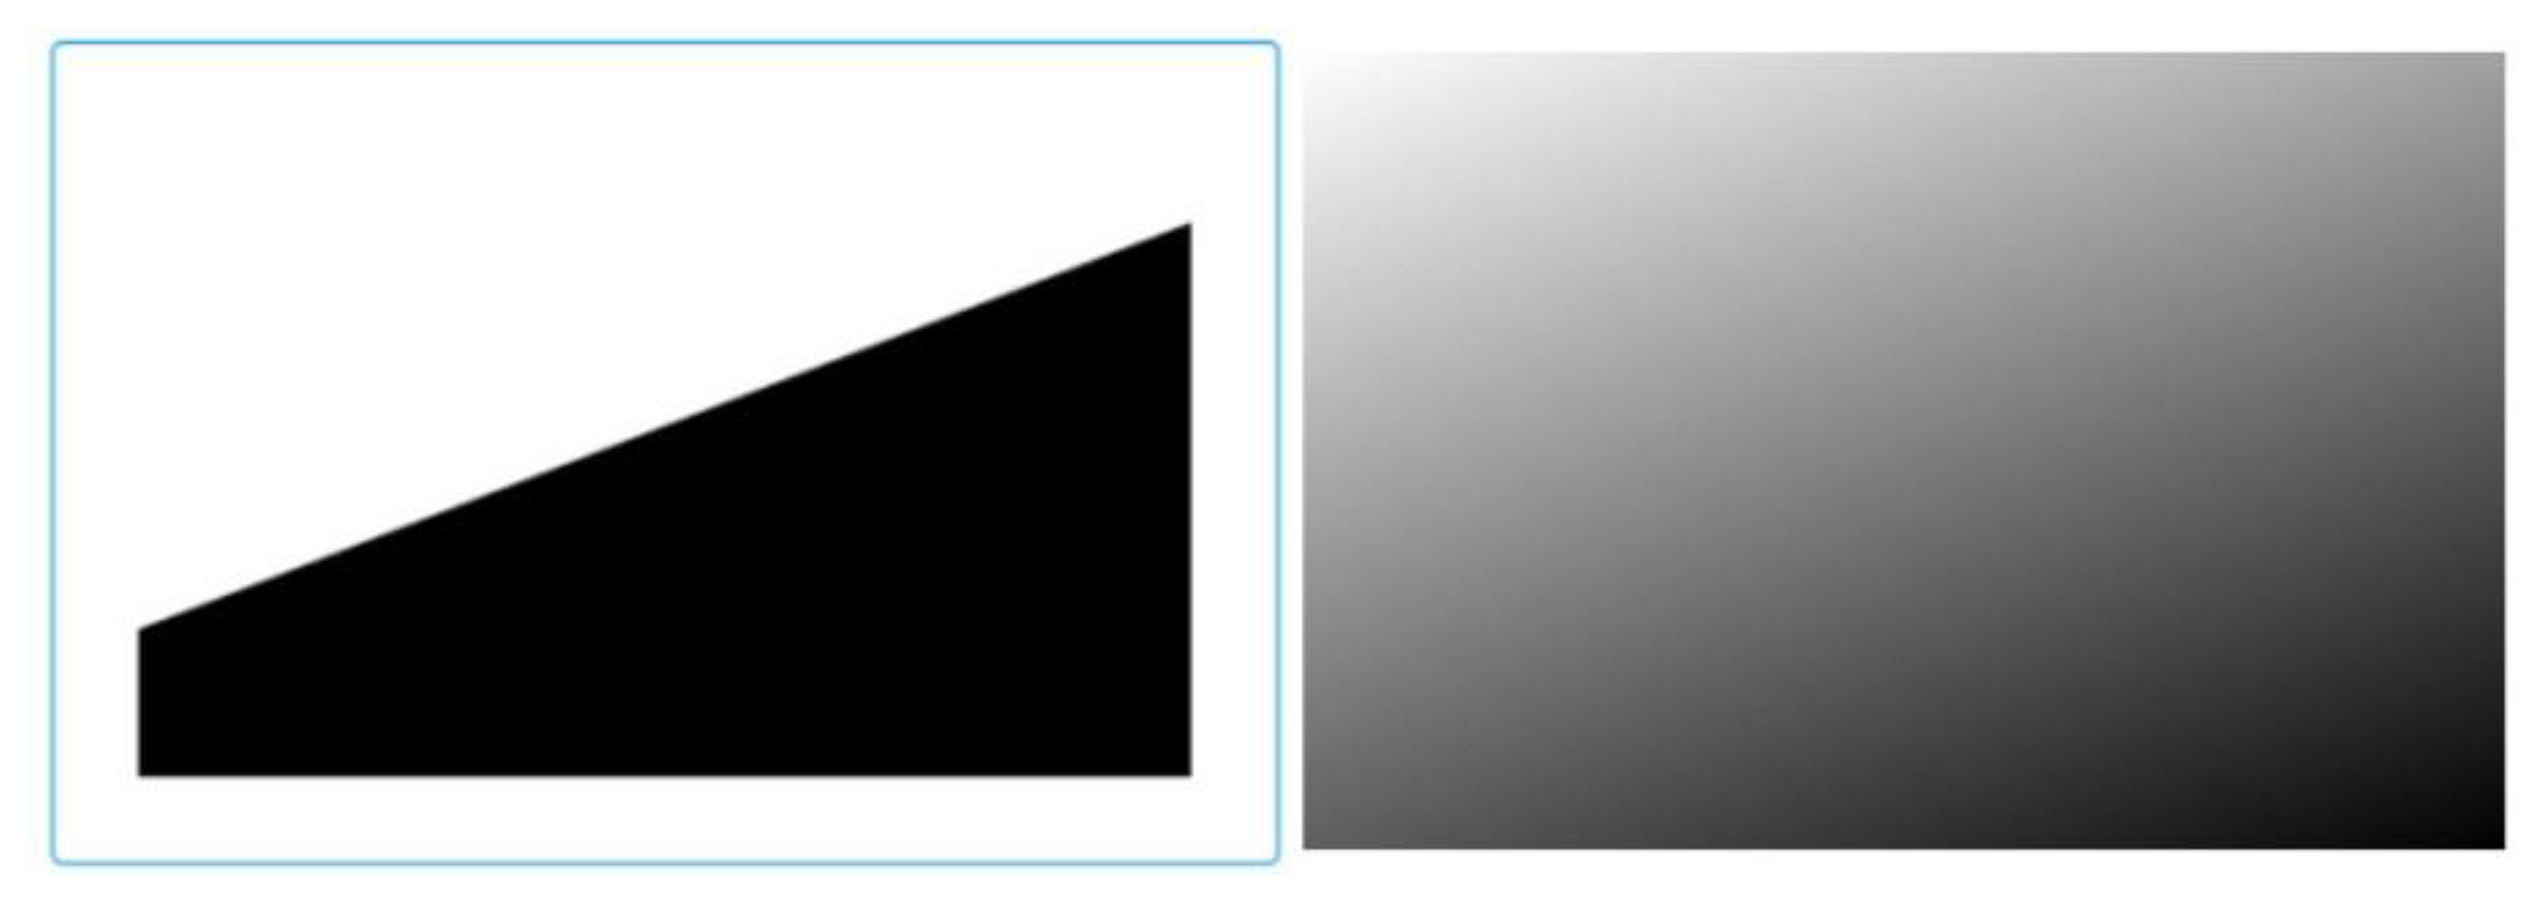
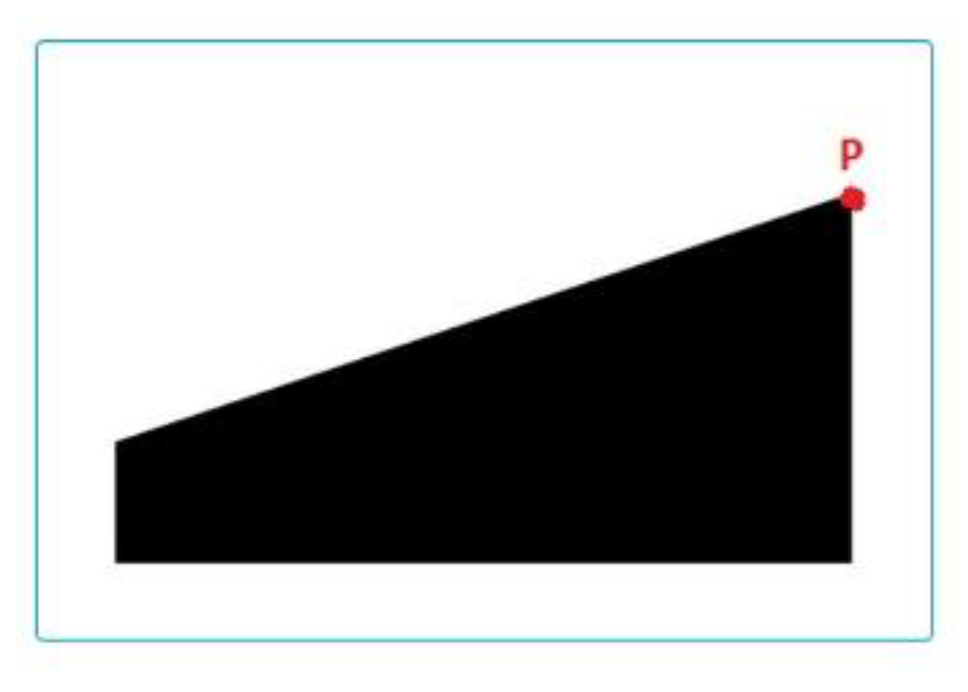
3. Methods
The k Coefficient
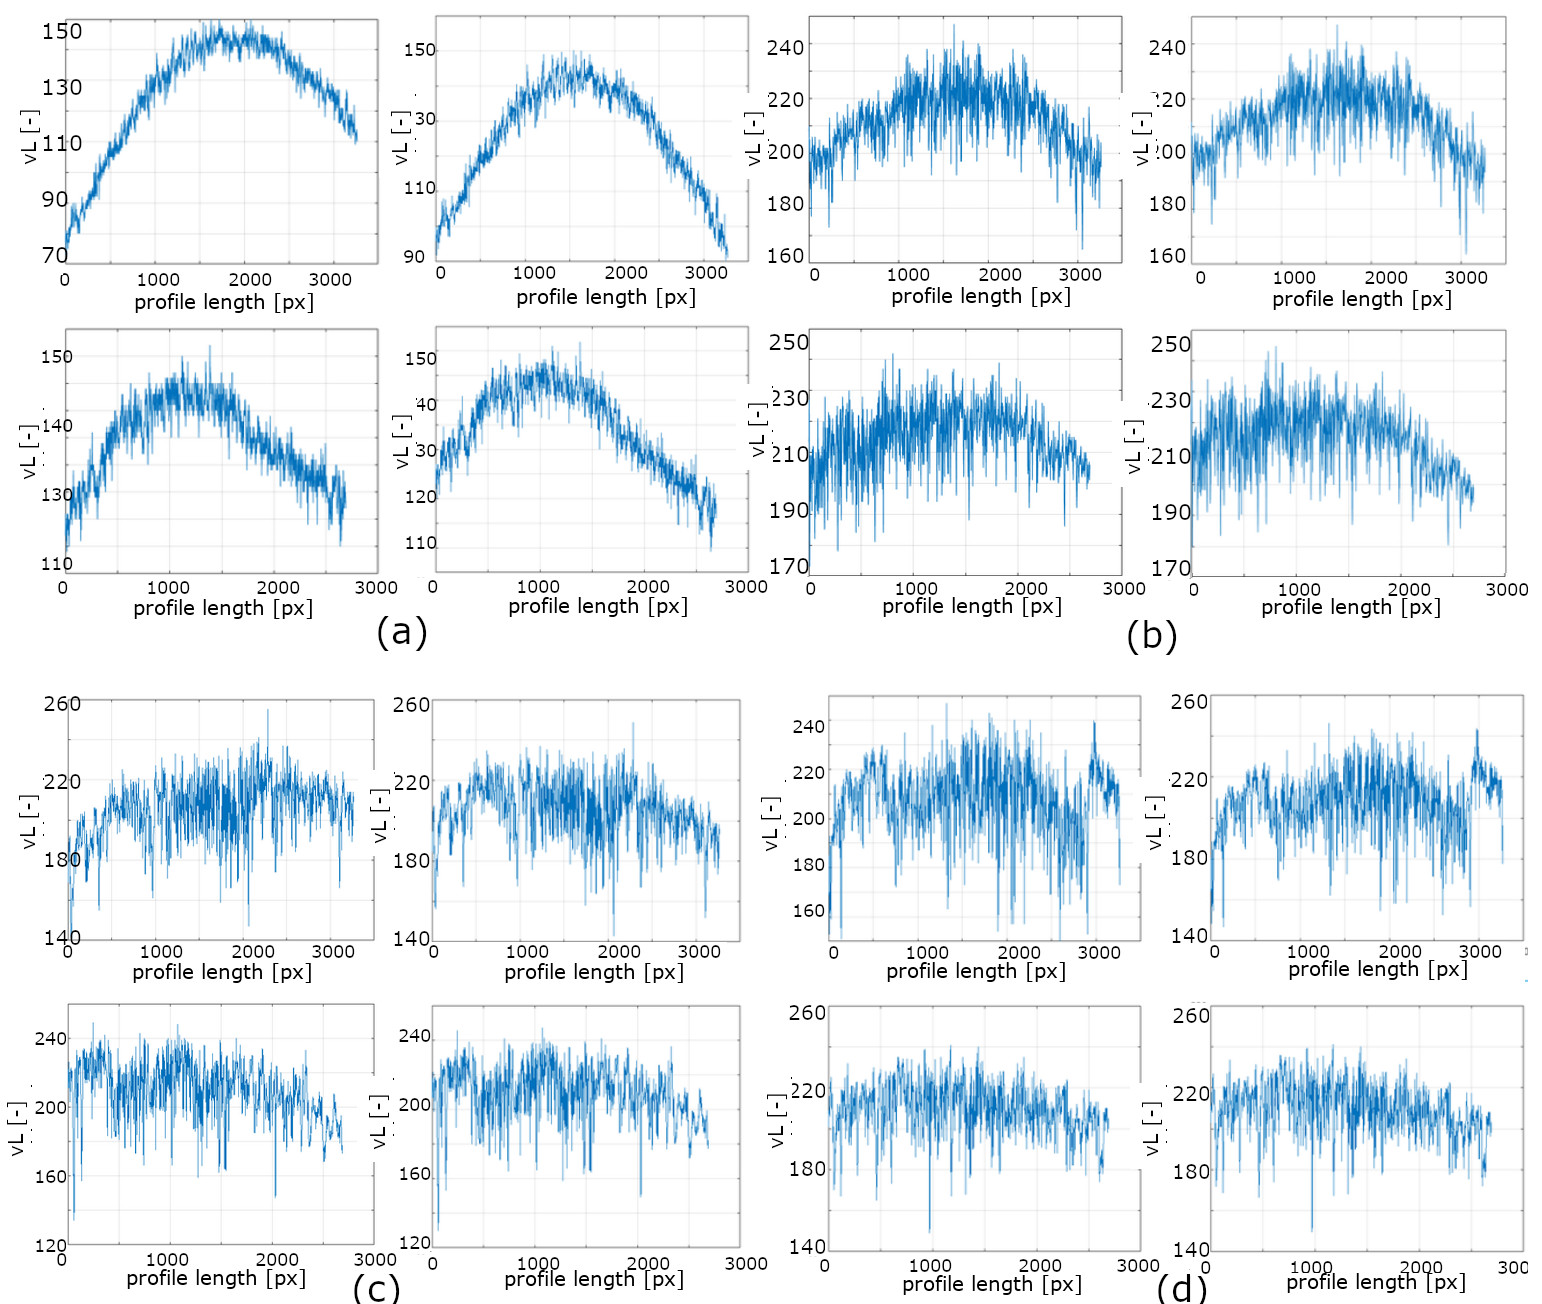
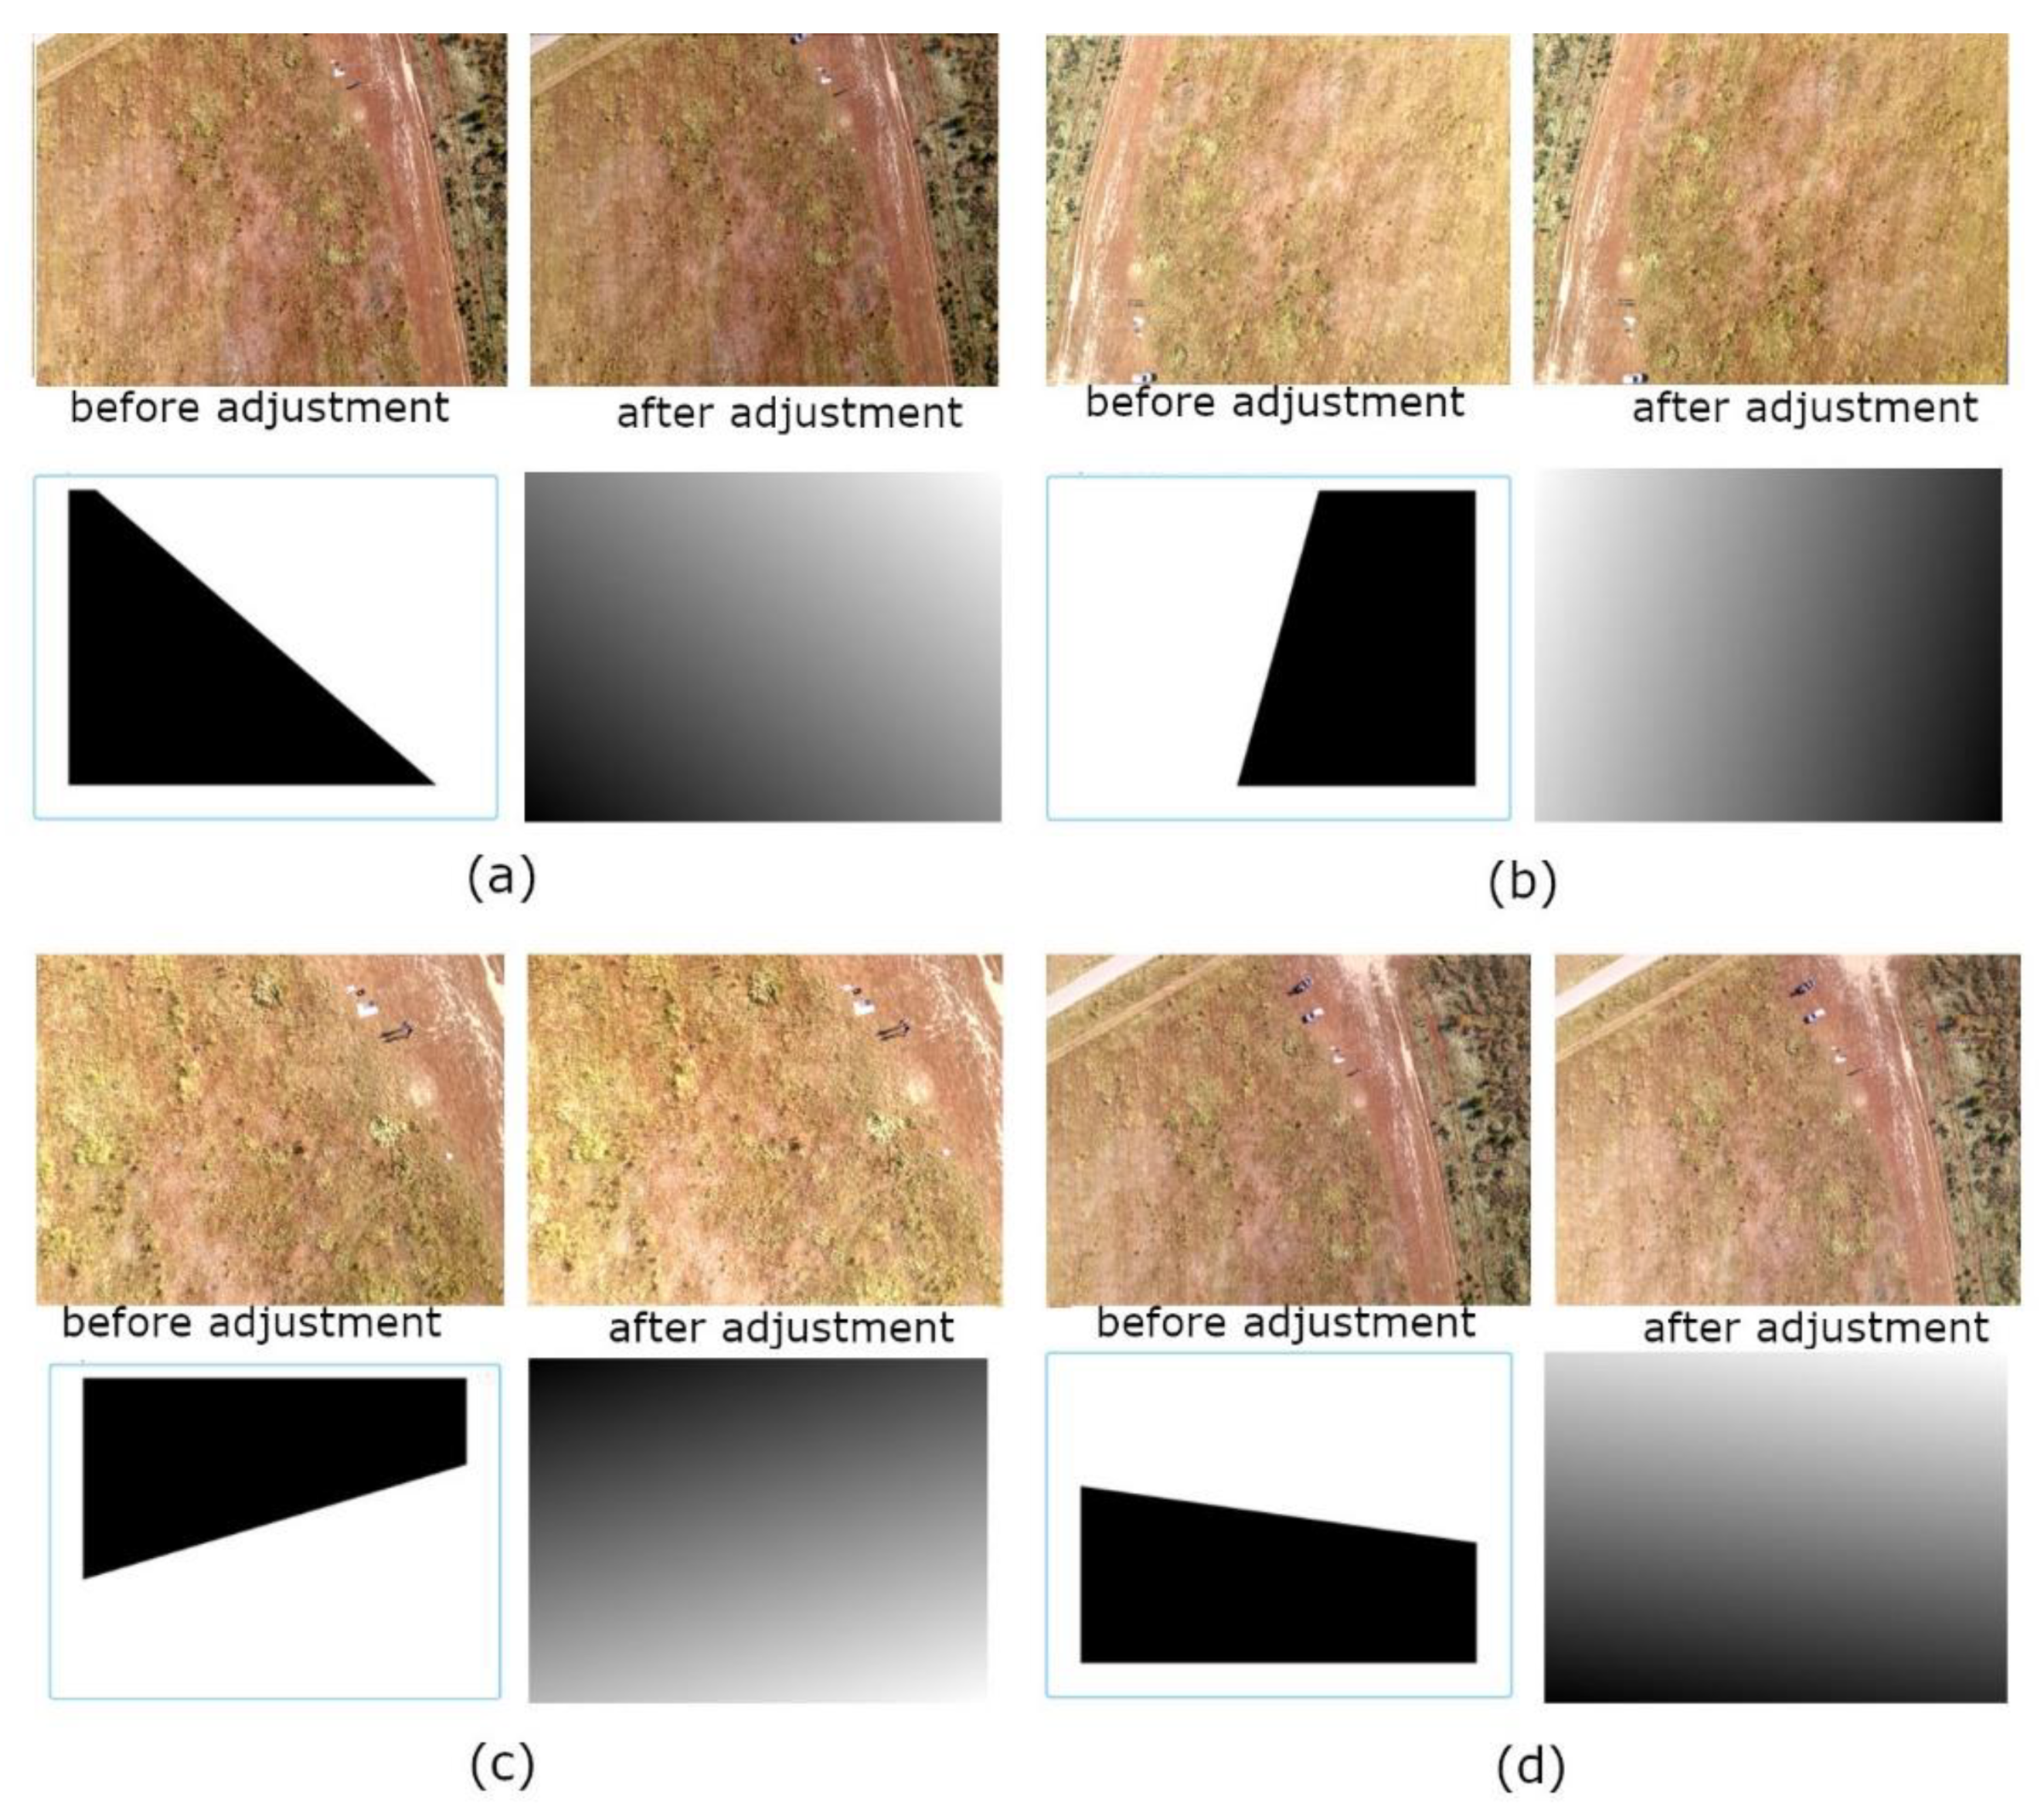
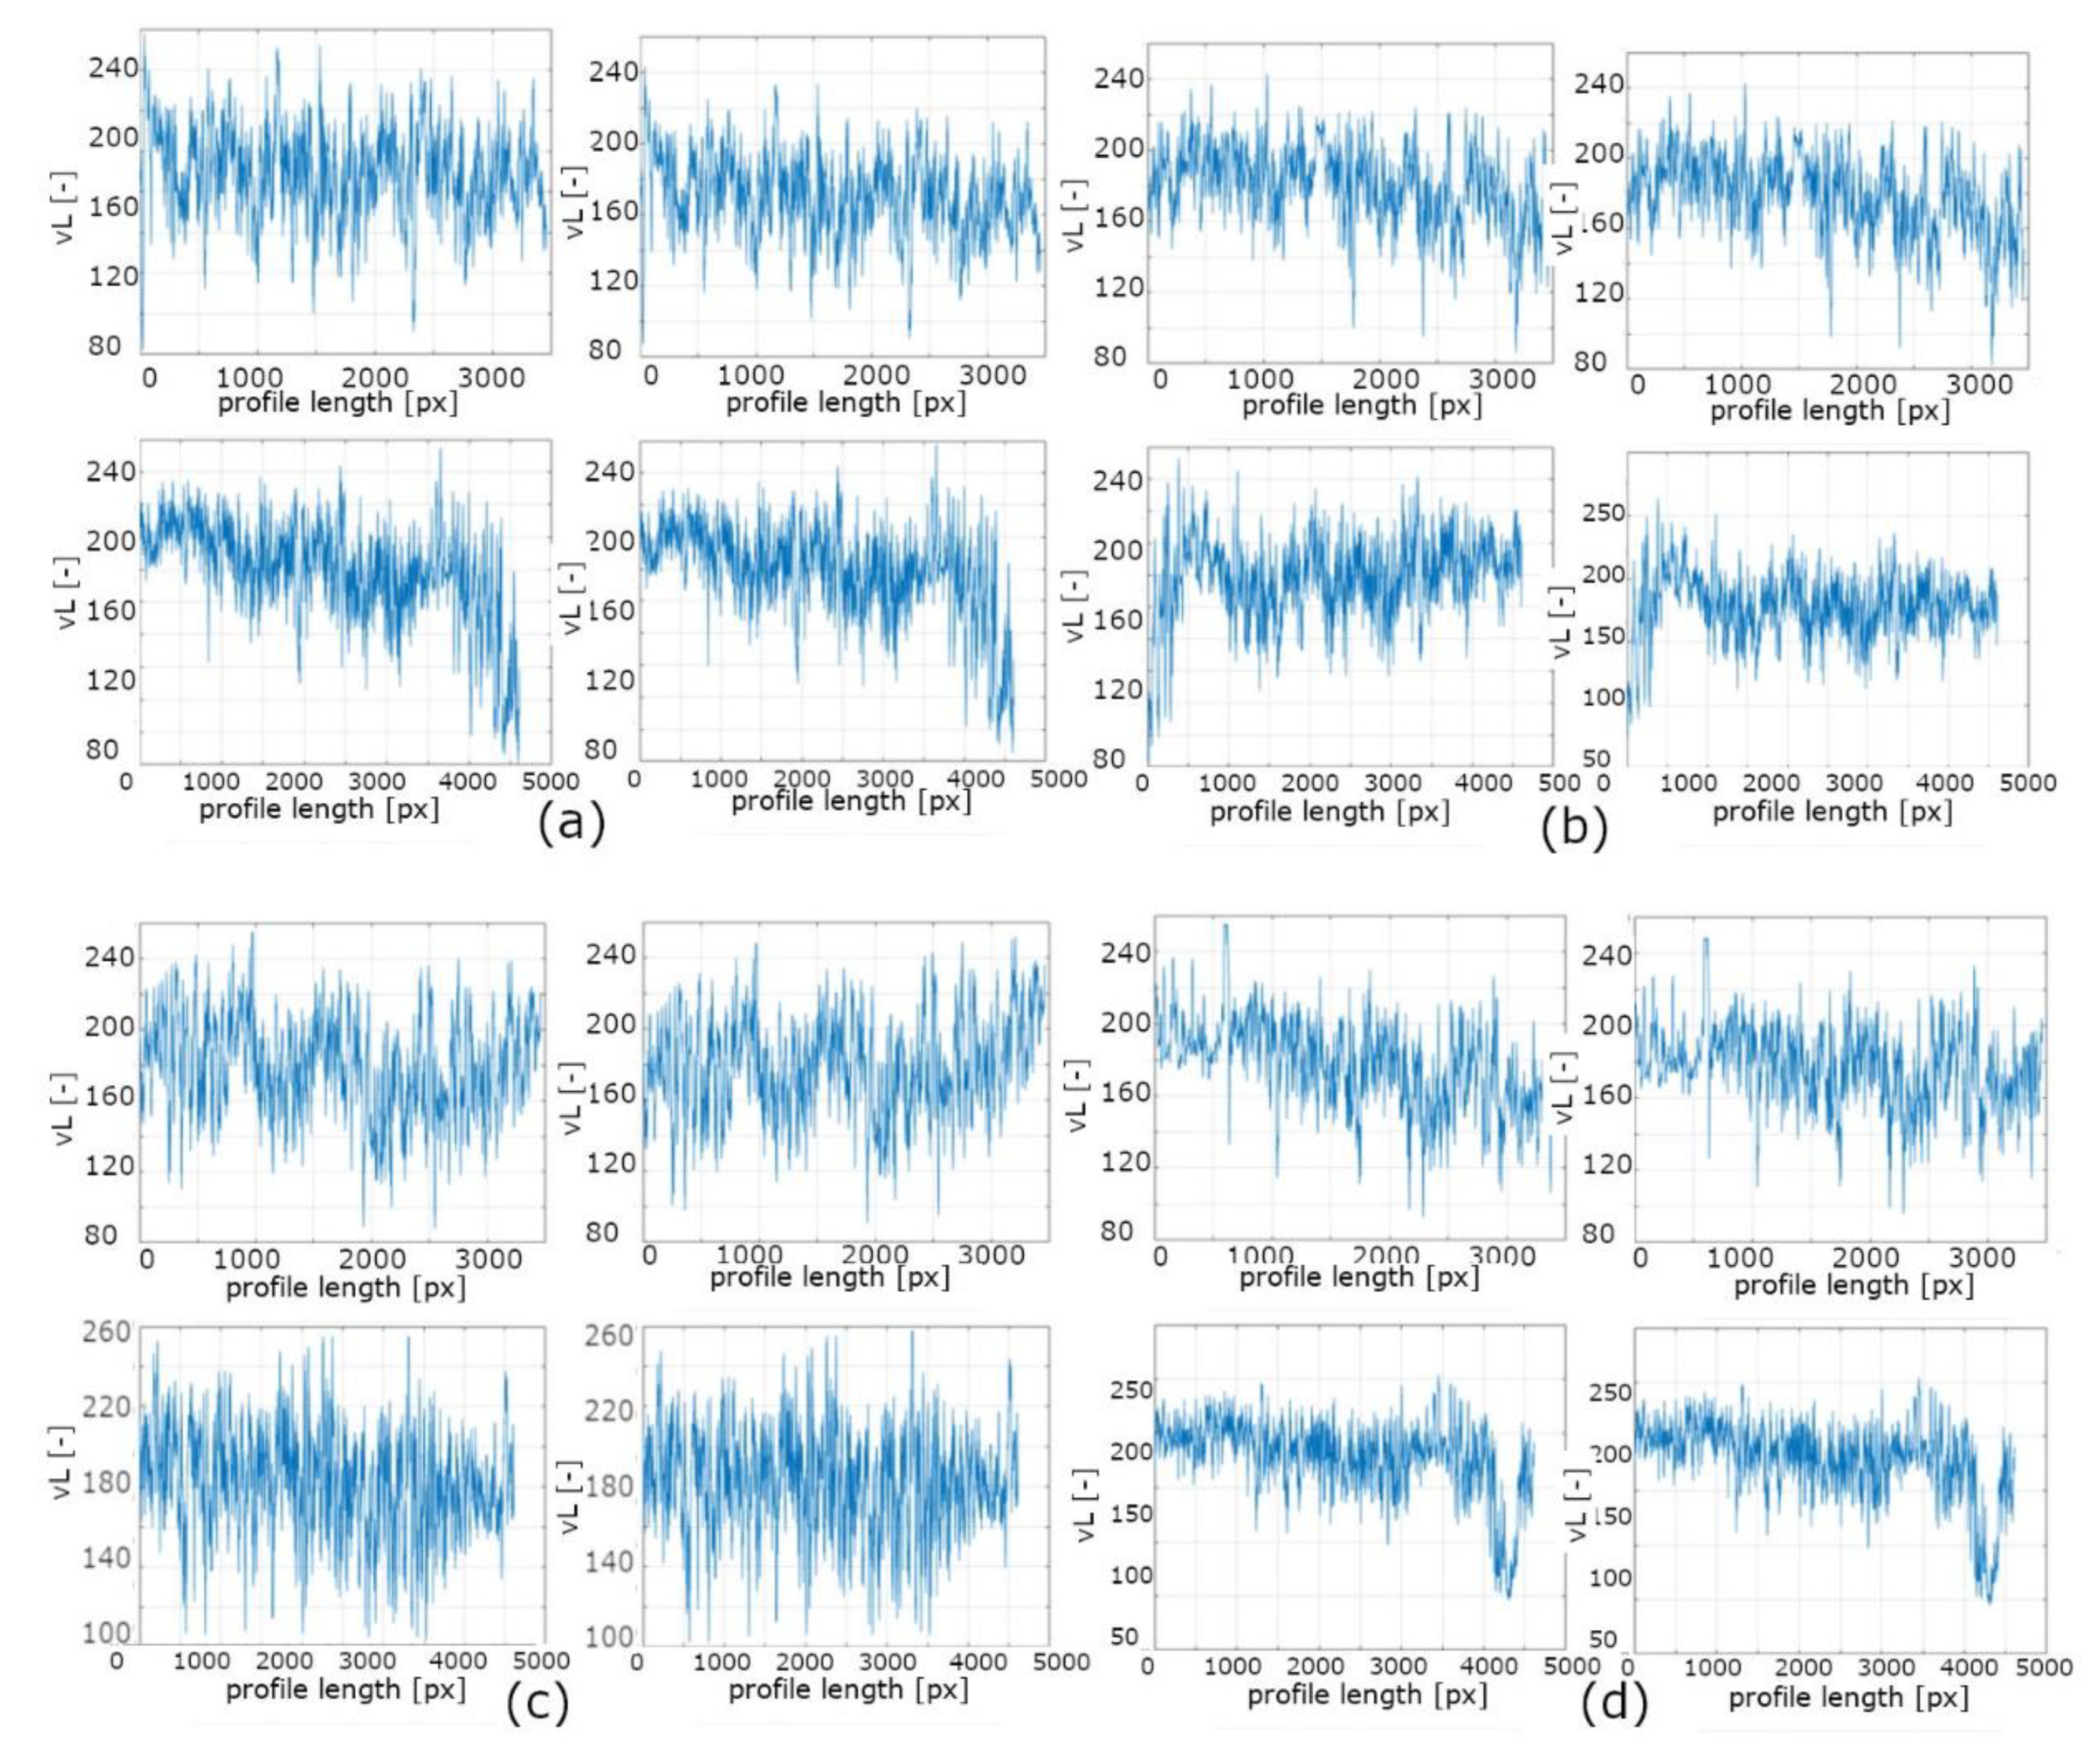
4. Results
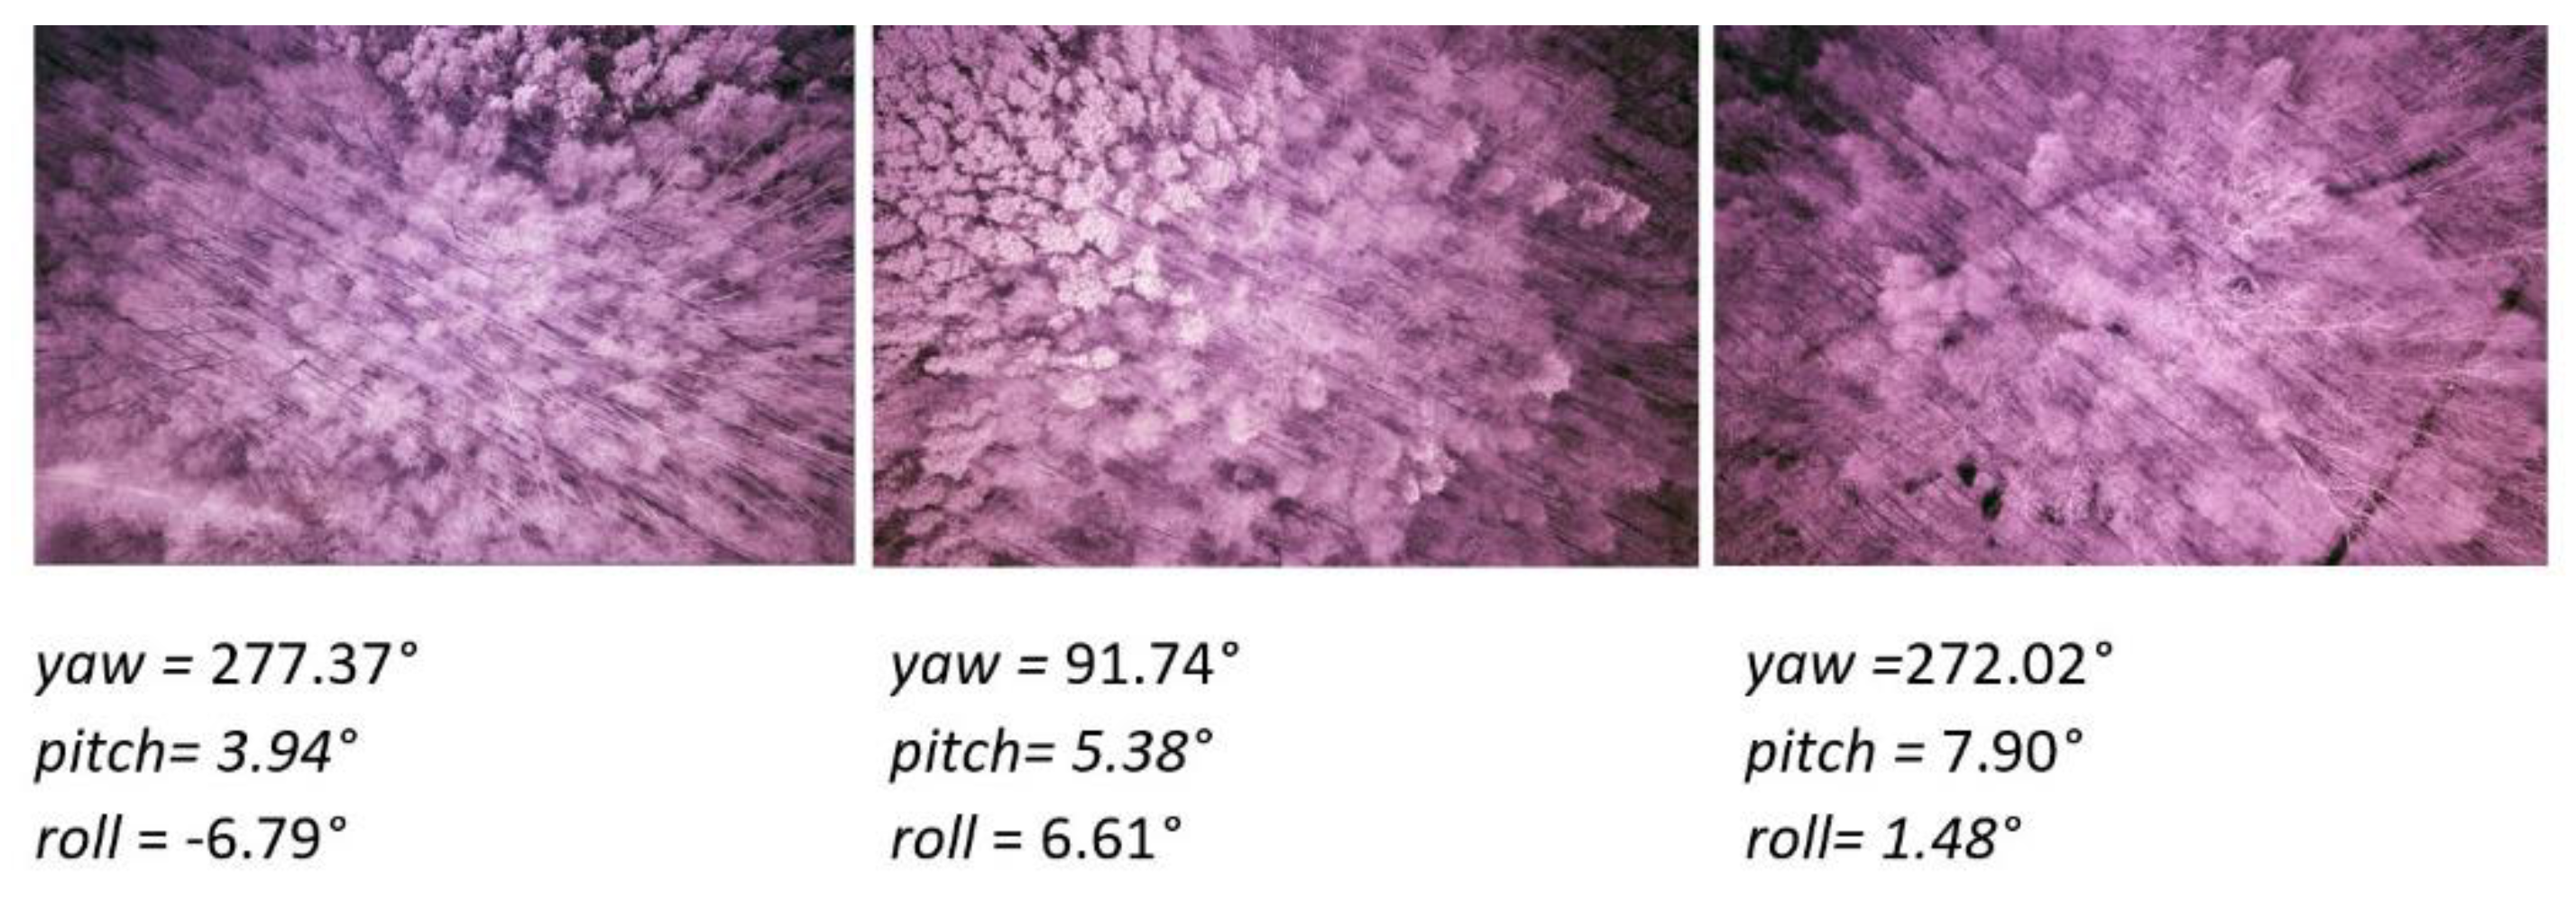
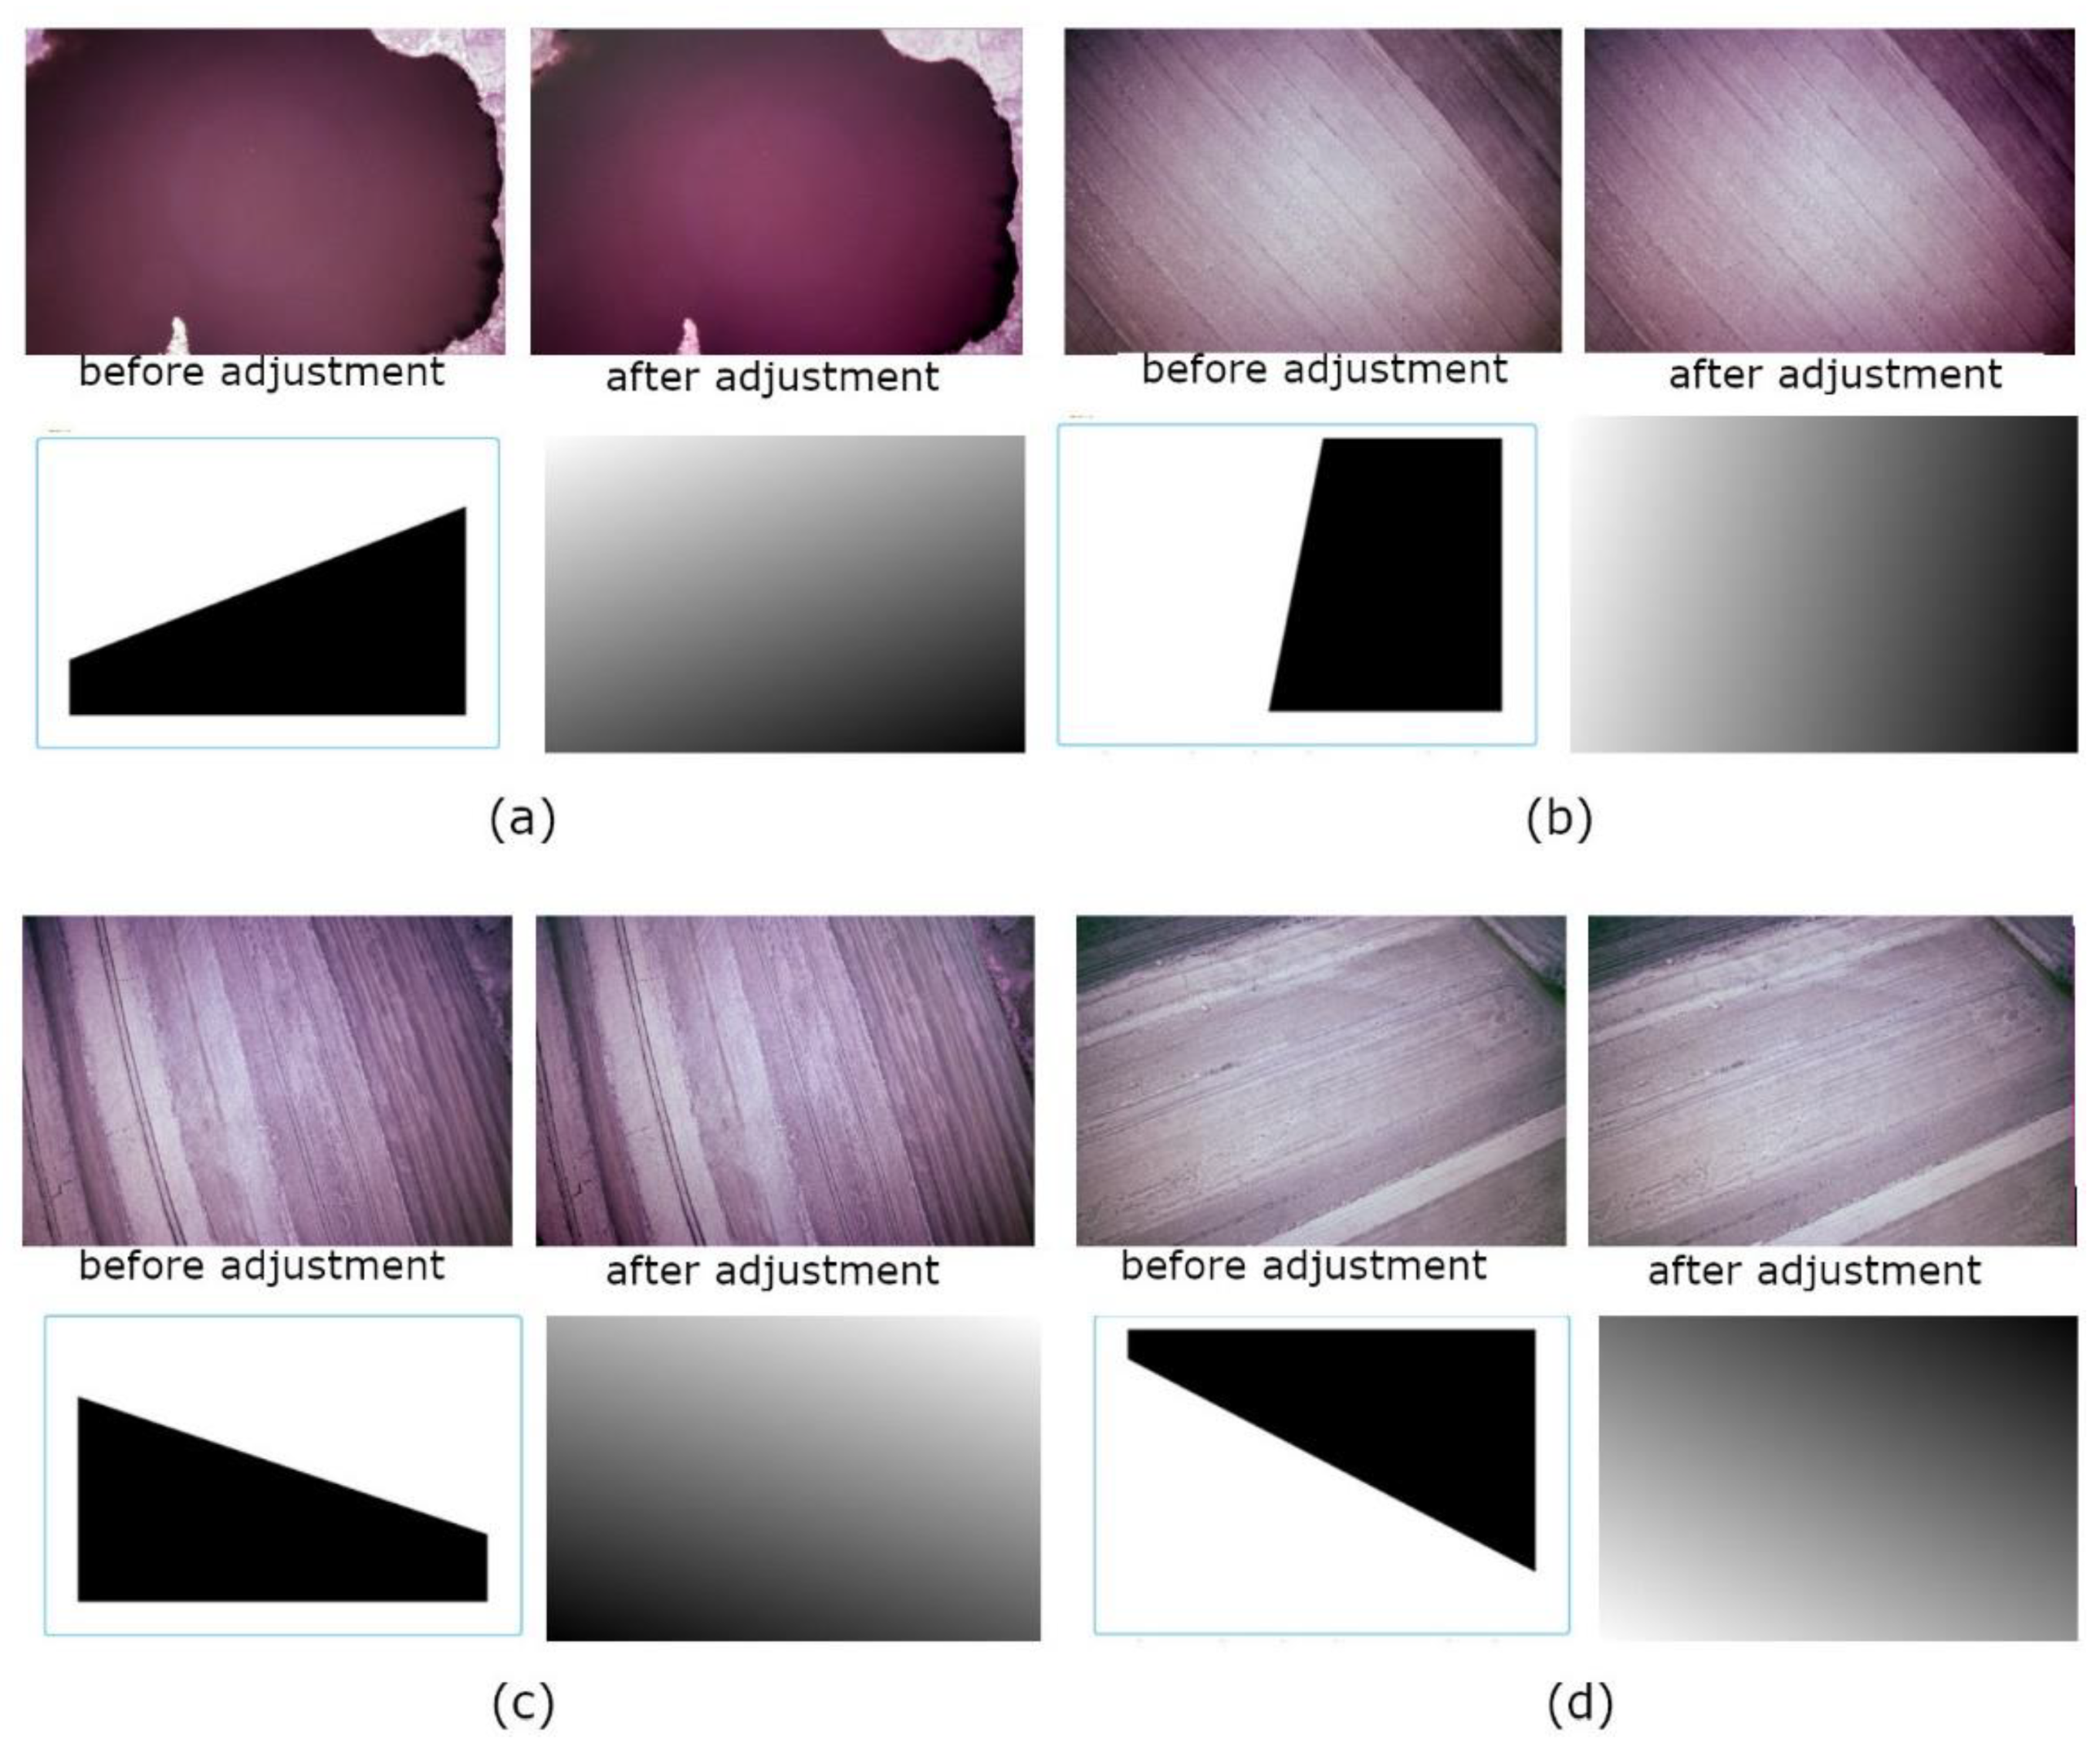
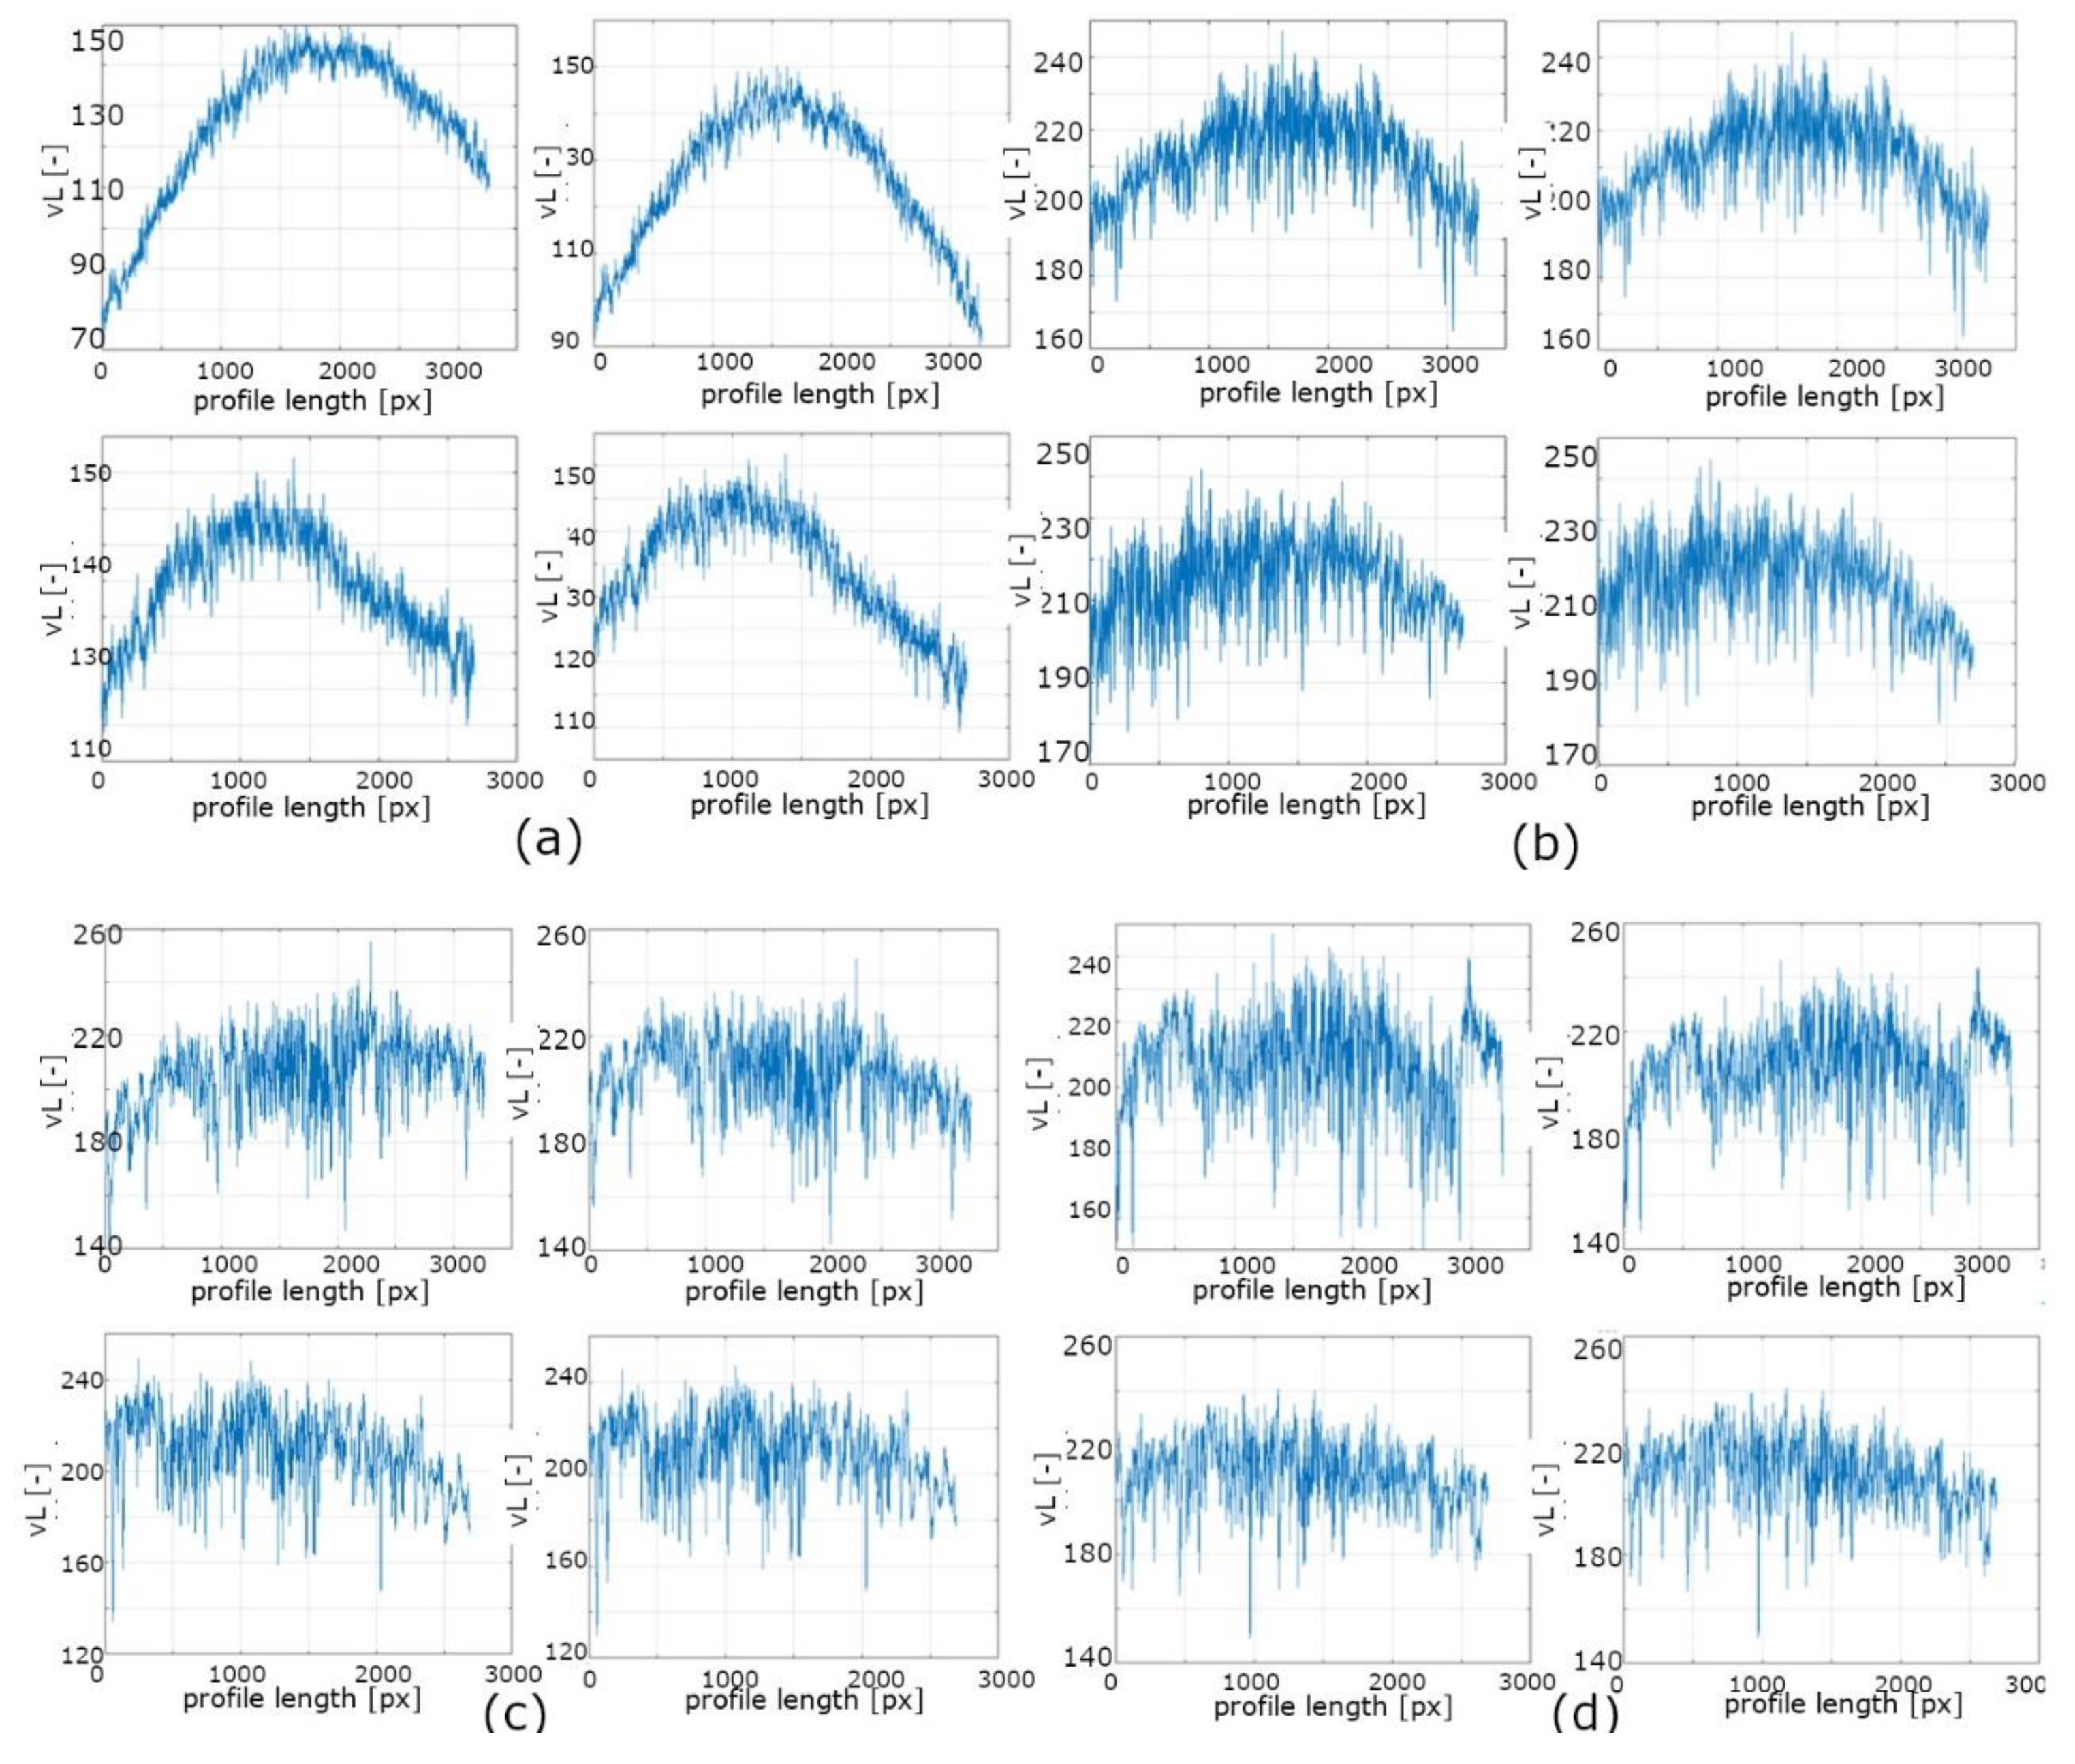
4.1. UX5 System (Sony Nex 5T Camera)
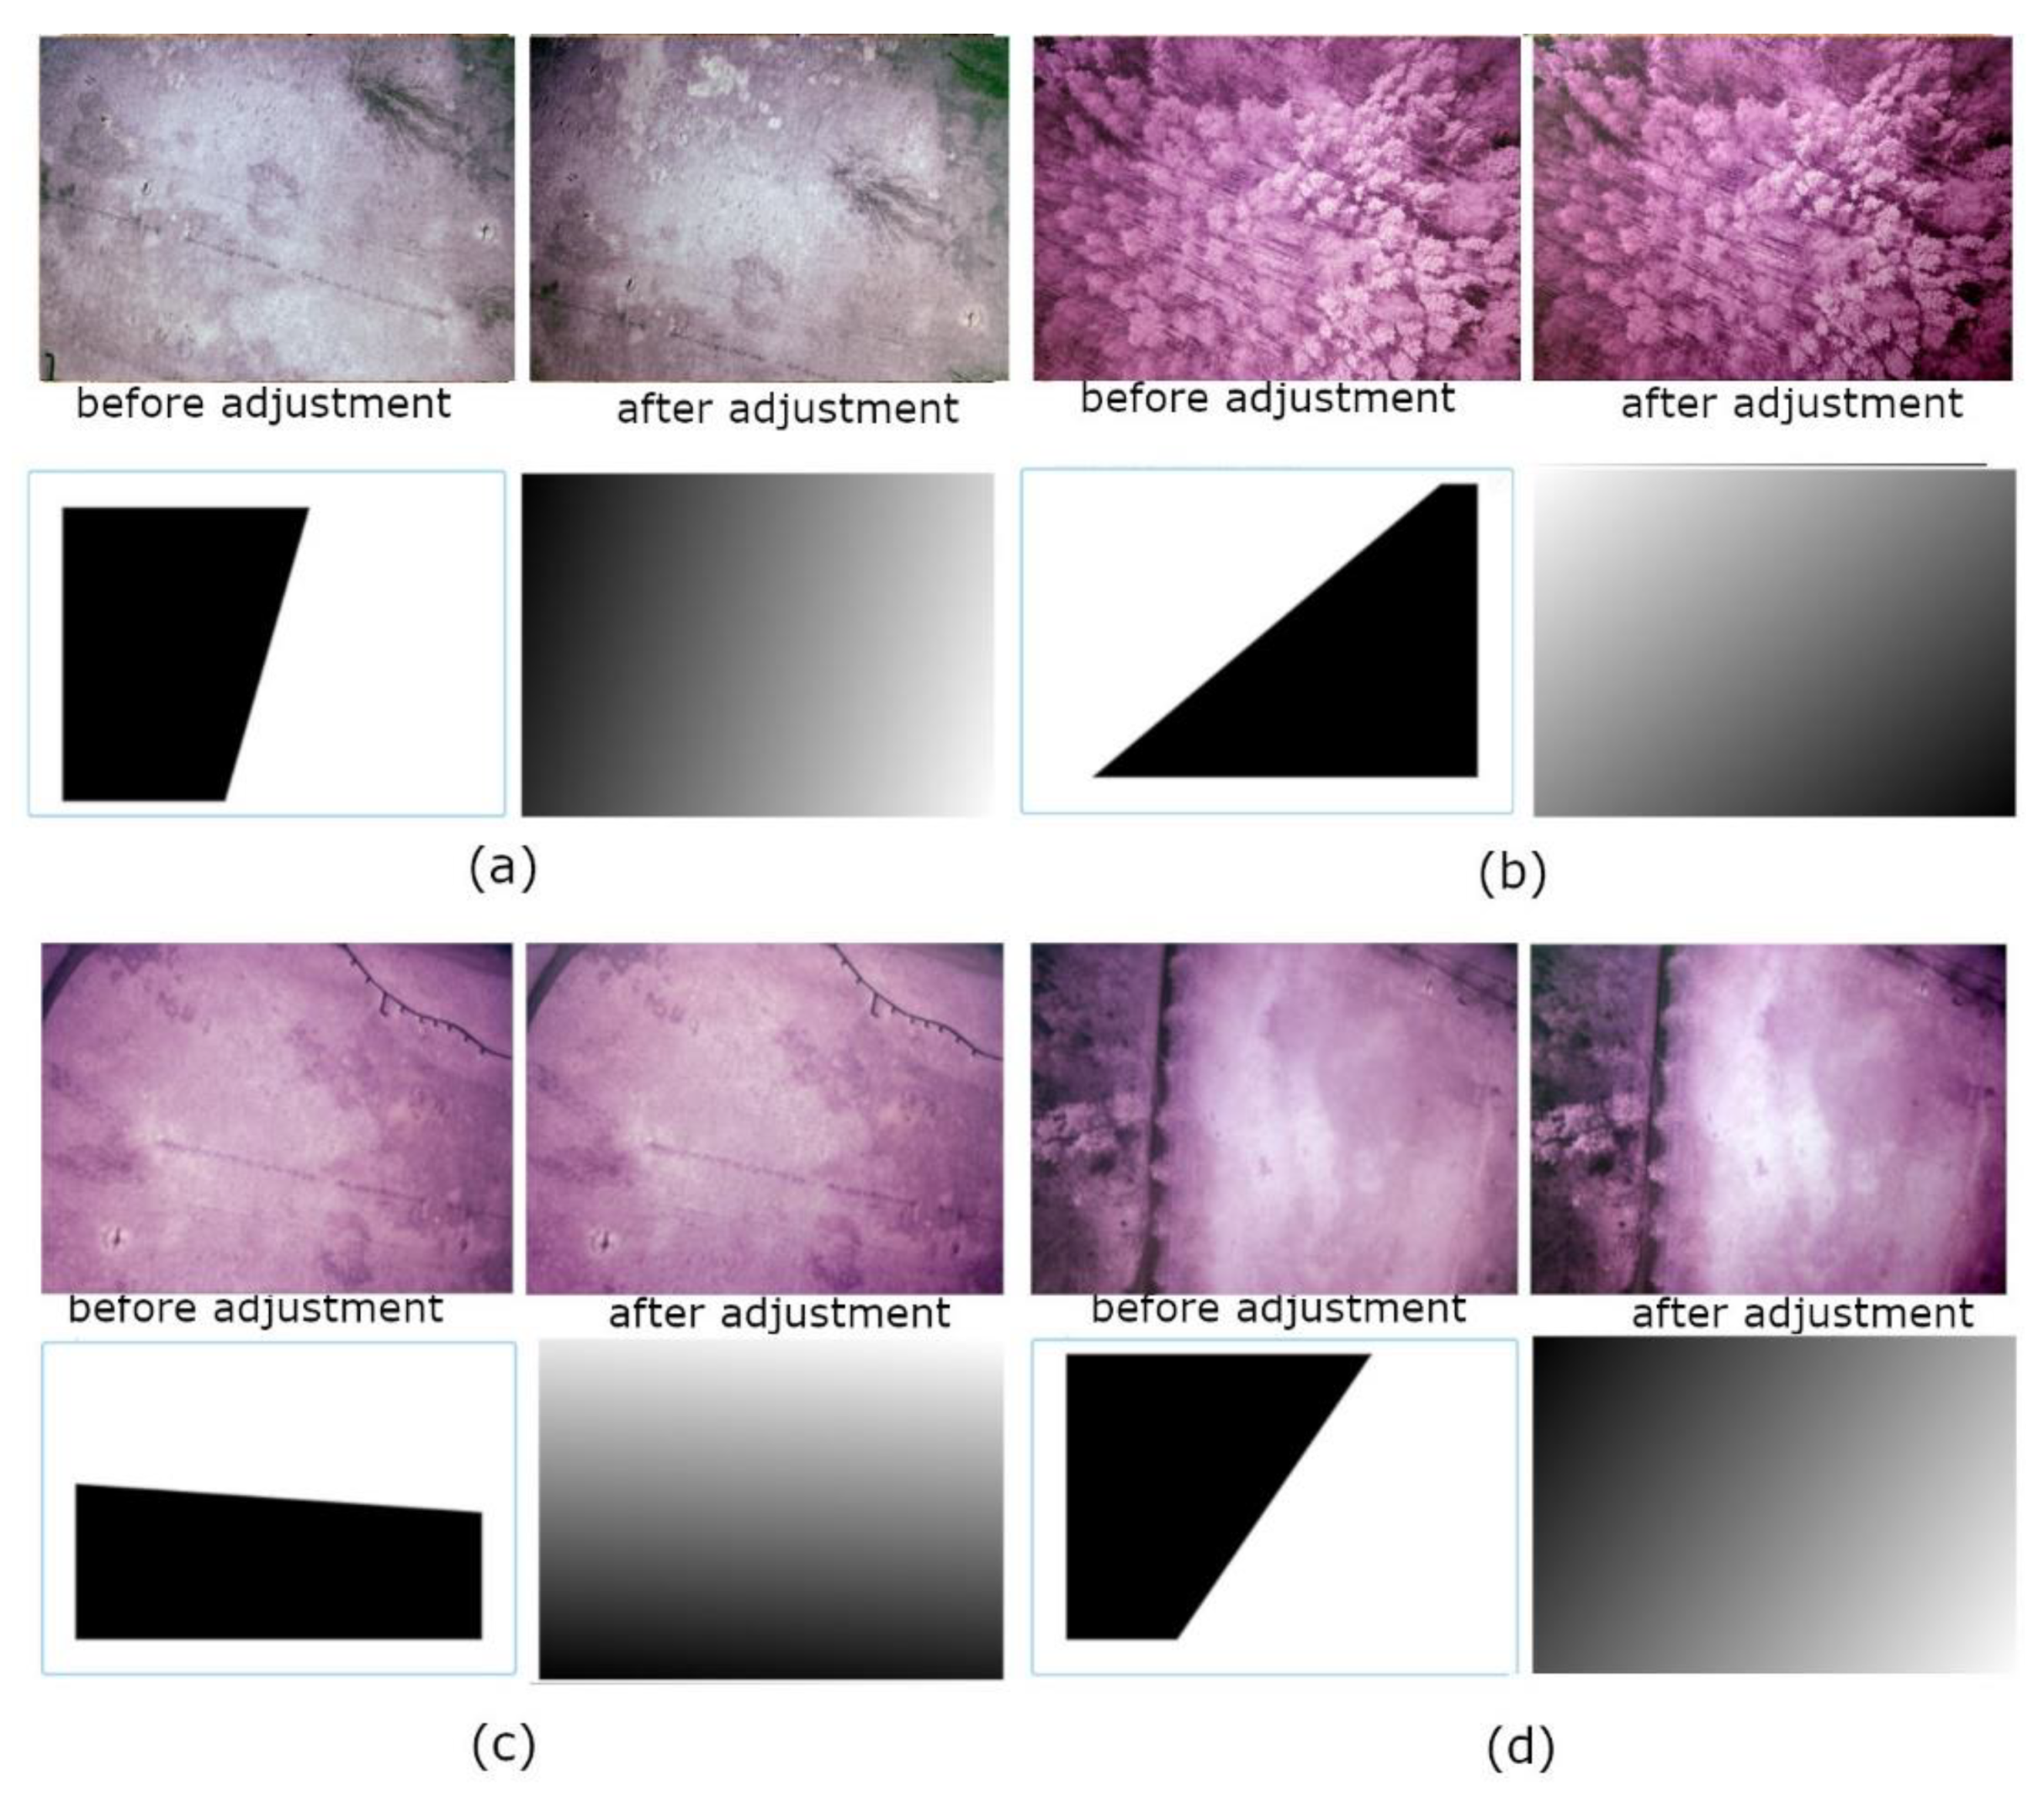
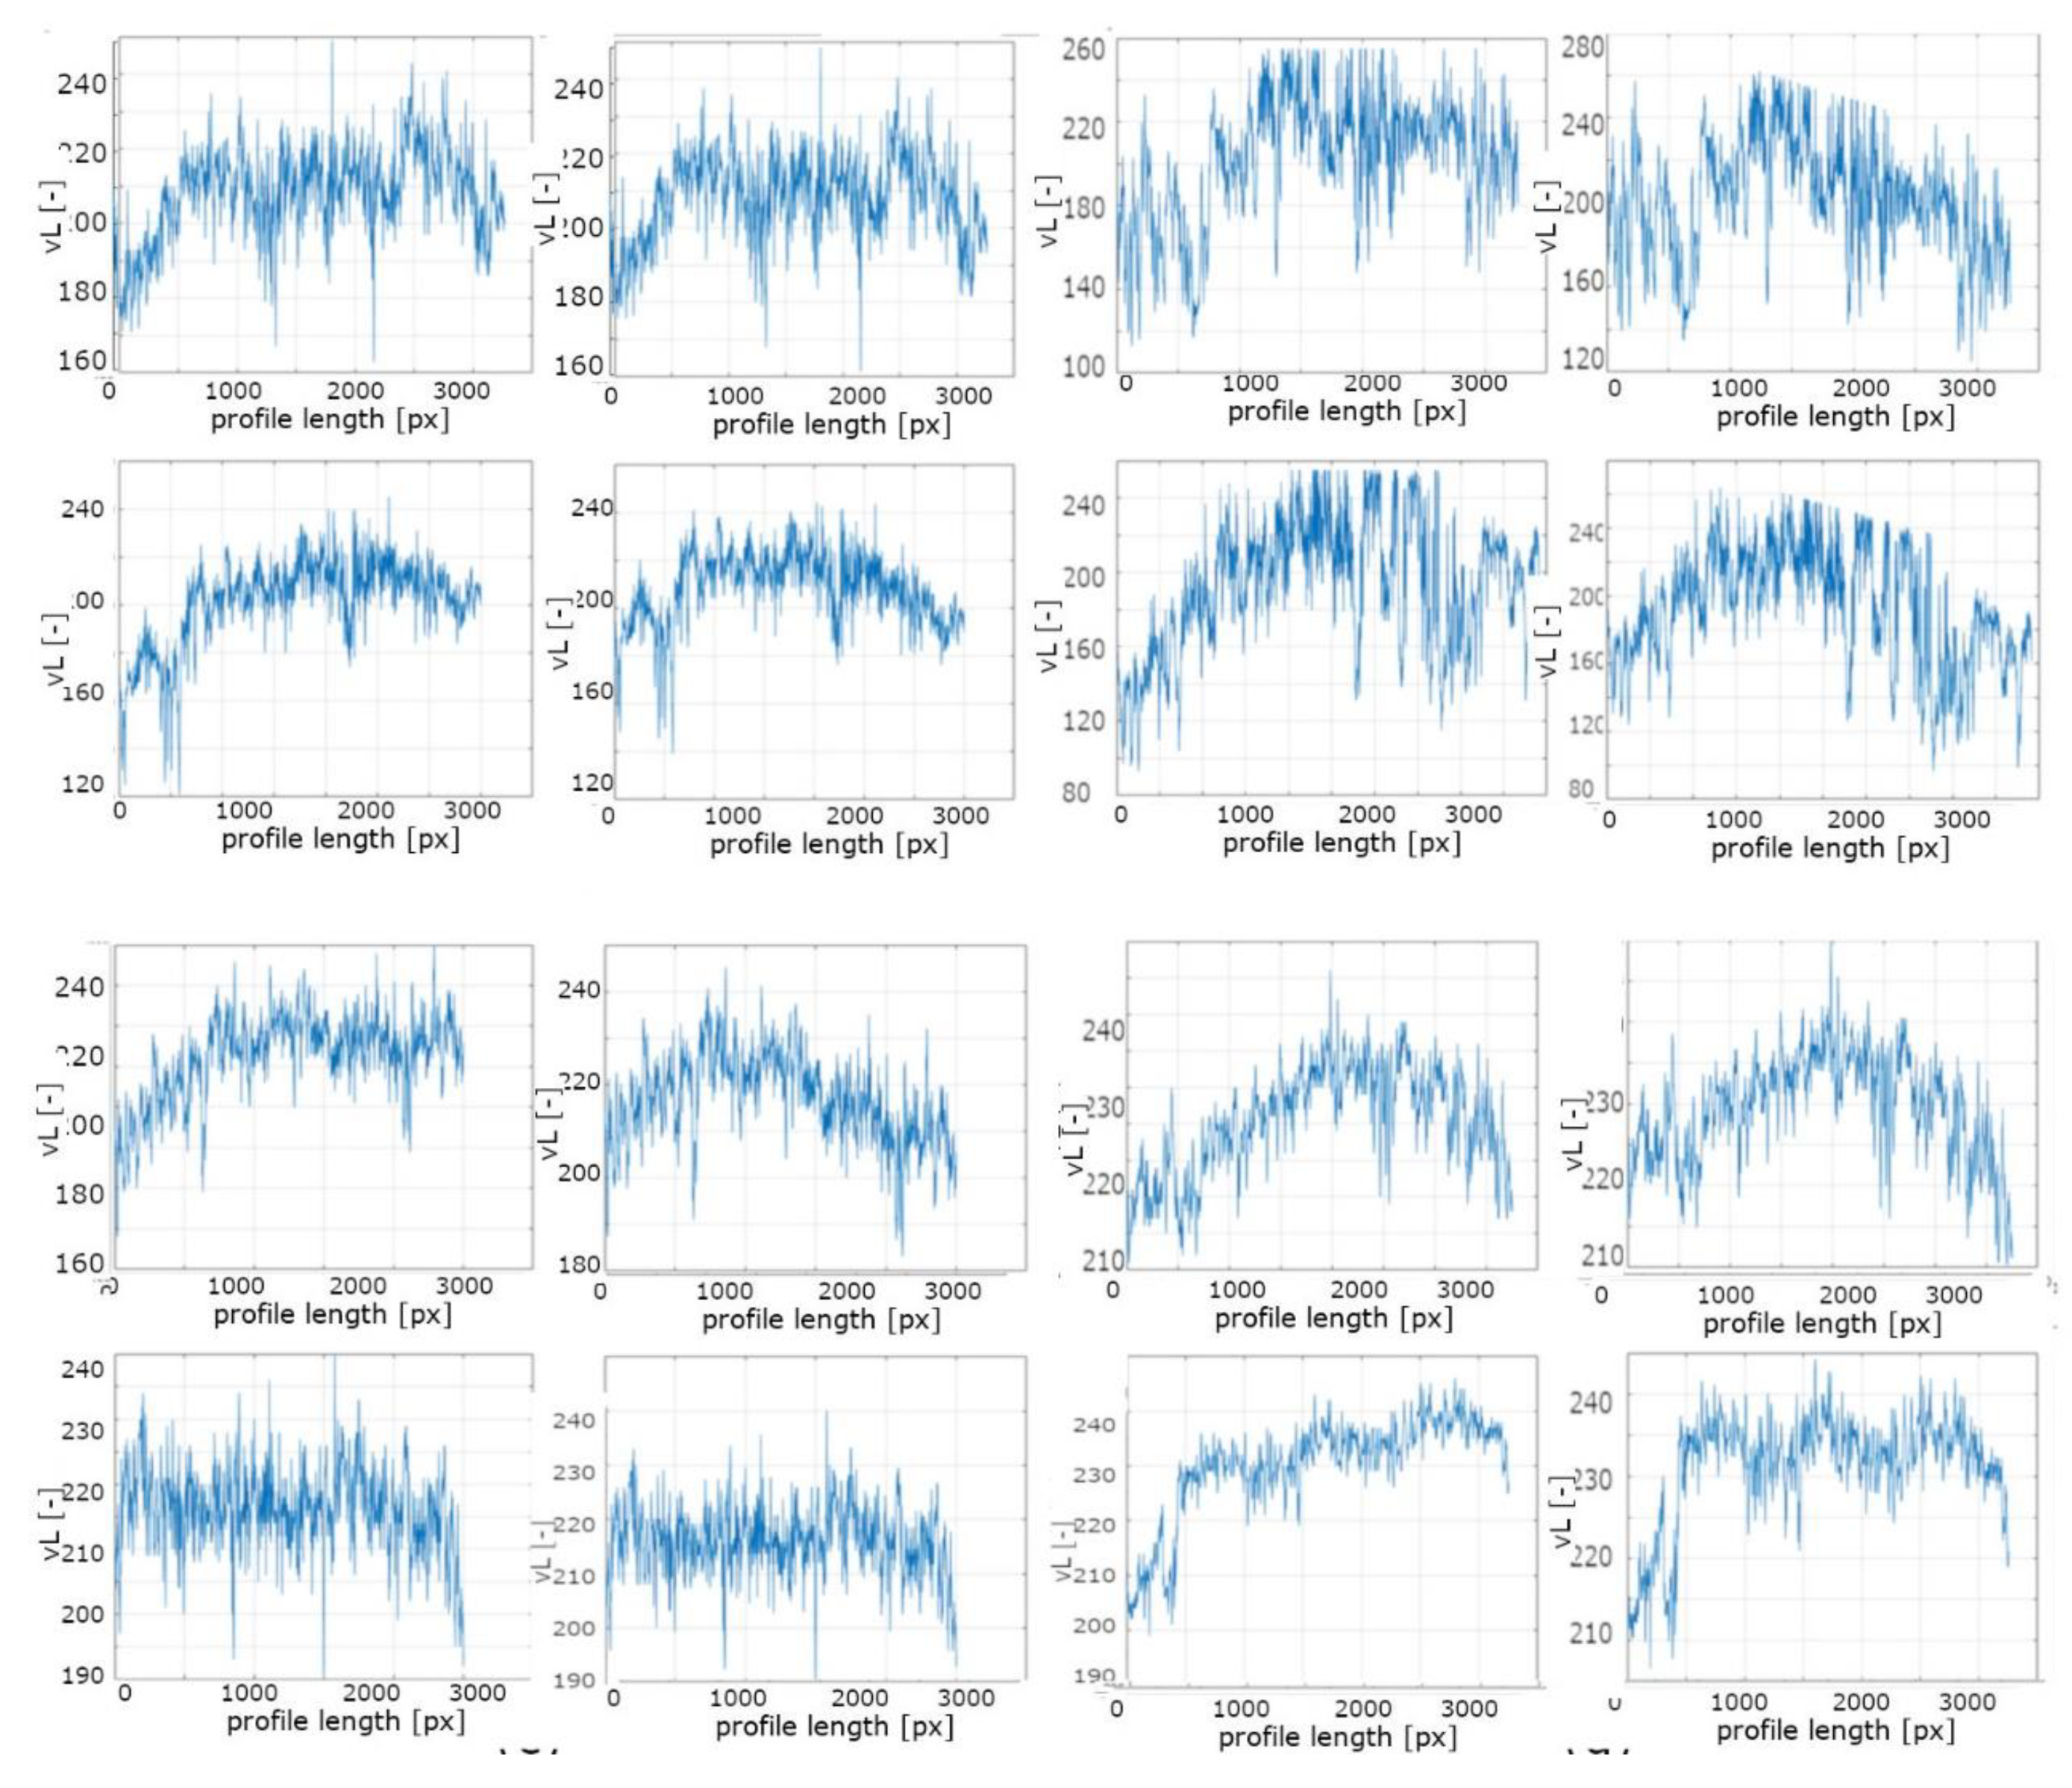
4.2. ParrotSequoia
5. Discussion
6. Conclusions
Author Contributions
Funding
Acknowledgments
Conflicts of Interest
References
- Honkavaara, E.; Saari, H.; Kaivosoja, J.; Pölönen, I.; Hakala, T.; Litkey, P.; Mäkynen, J.; Pesonen, L. Processing and Assessment of Spectrometric, Stereoscopic Imagery Collected Using a Lightweight UAV Spectral Camera for Precision Agriculture. Remote. Sens. 2013, 5, 5006–5039. [Google Scholar] [CrossRef] [Green Version]
- Qiu, Z.; Feng, Z.; Wang, M.; Li, Z.; Lu, C. Application of UAV Photogrammetric System for Monitoring Ancient Tree Communities in Beijing. Forestry 2018, 9, 735. [Google Scholar] [CrossRef] [Green Version]
- Vivoni, E.R.; Rango, A.; Anderson, C.A.; Pierini, N.A.; Schreiner-McGraw, A.; Saripalli, S.; Laliberte, A.S. Ecohydrology with unmanned aerial vehicles. Ecosphere 2014, 5, 1–14. [Google Scholar] [CrossRef] [Green Version]
- Jakomulska, A.; Sobczak, M. Radiometric Correction of Satellite Images—Methodology and Exemplification; Teledetekcja Środowiska: Warsaw, Poland, 2001. [Google Scholar]
- Clemens, S.R. Procedures for Correcting Digital Camera Imagery Acquired by the AggieAir Remote Sensing Platform; Utah State University: Logan, UT, USA, 2012. [Google Scholar]
- Honkavaara, E.; Khoramshahi, E. Radiometric Correction of Close-Range Spectral Image Blocks Captured Using an Unmanned Aerial Vehicle with a Radiometric Block Adjustment. Remote. Sens. 2018, 10, 256. [Google Scholar] [CrossRef] [Green Version]
- Kedzierski, M.; Wierzbicki, D.; Sekrecka, A.; Fryskowska, A.; Walczykowski, P.; Siewert, J. Influence of Lower Atmosphere on the Radiometric Quality of Unmanned Aerial Vehicle Imagery. Remote. Sens. 2019, 11, 1214. [Google Scholar] [CrossRef] [Green Version]
- Yu, X.; Liu, Q.; Liu, X.; Liu, X.; Wang, Y. A physical-based atmospheric correction algorithm of unmanned aerial vehicles images and its utility analysis. Int. J. Remote. Sens. 2016, 38, 3101–3112. [Google Scholar] [CrossRef]
- Yoon, I.; Jeong, S.; Jeong, J.; Seo, D.; Paik, J. Wavelength-Adaptive Dehazing Using Histogram Merging-Based Classification for UAV Images. Sensors 2015, 15, 6633–6651. [Google Scholar] [CrossRef] [Green Version]
- Huang, Y.; Ding, W.; Li, H. Haze removal for UAV reconnaissance images using layered scattering model. Chin. J. Aeronaut. 2016, 29, 502–511. [Google Scholar] [CrossRef] [Green Version]
- Honkavaara, E.; Hakala, T.; Markelin, L.; Rosnell, T.; Saari, H.; Mäkynen, J. A Process for Radiometric Correction of UAV Image Blocks. Photogramm. Fernerkund. Geoinf. 2012, 2012, 115–127. [Google Scholar] [CrossRef]
- Hakala, T.; Honkavaara, E.; Saari, H.; Mäkynen, J.; Kaivosoja, J.; Pesonen, L.; Pölönen, I. Spectral Imaging from Uavs under Varying Illumination Conditions. ISPRS Int. Arch. Photogramm. Remote. Sens. Spat. Inf. Sci. 2013, 189–194. [Google Scholar] [CrossRef] [Green Version]
- Schowengerdt, R.A. Remote Sensing, Models and Methods for Image Processing, 3rd ed.; Academic Press Inc.: San Diego, CA, USA, 2007. [Google Scholar]
- Beisl, U.; Woodhouse, N. Correction of atmospheric and bidirectional effects in multispectral ADS40 images for mapping purposes. Internet Intl. Arch. Photogramm. Remote Sens. 2004. [Google Scholar]
- Teillet, P.; Guindon, B.; Goodenough, D. On the Slope-Aspect Correction of Multispectral Scanner Data. Can. J. Remote. Sens. 1982, 8, 84–106. [Google Scholar] [CrossRef] [Green Version]
- Smith, J.A.; Lin, T.L.; Ranson, K.J. The Lambertian assumption and Landsat data. Photogramm. Eng. Remote Sens. 1980, 46, 1183–1189. [Google Scholar]
- Cavayas, F. Modelling and Correction of Topographic Effect Using Multi-Temporal Satellite Images. Can. J. Remote. Sens. 1987, 13, 49–67. [Google Scholar] [CrossRef]
- Soenen, S.A.; Peddle, D.; Coburn, C. SCS+C: A modified Sun-canopy-sensor topographic correction in forested terrain. IEEE Trans. Geosci. Remote. Sens. 2005, 43, 2148–2159. [Google Scholar] [CrossRef]
- Proy, C.; Tanre, D.; Deschamps, P. Evaluation of topographic effects in remotely sensed data. Remote. Sens. Environ. 1989, 30, 21–32. [Google Scholar] [CrossRef]
- Kimes, D.S.; Kirchner, J.A. Modeling the Effects of Various Radiant Transfers in Mountainous Terrain on Sensor Response. IEEE Trans. Geosci. Remote. Sens. 1981, GE-19, 100–108. [Google Scholar] [CrossRef]
- Conese, C.; Gilabert, M.A.; Maselli, F.; Bottai, L. Topographic normalization of TM scenes through the use of an atmospheric correction method and digital terrain models. Photogramm. Eng. Remote Sens. 1993, 59, 1745–1753. [Google Scholar]
- Gu, D.; Gillespie, A. Topographic Normalization of Landsat TM Images of Forest Based on Subpixel Sun–Canopy–Sensor Geometry. Remote. Sens. Environ. 1998, 64, 166–175. [Google Scholar] [CrossRef]
- Minnaert, M. The reciprocity principle in lunar photometry. Astrophys. J. 1941, 93, 403. [Google Scholar] [CrossRef]
- Meyer, P.; Itten, K.I.; Kellenberger, T.; Sandmeier, S.; Sandmeier, R. Radiometric corrections of topographically induced effects on Landsat TM data in an alpine environment. ISPRS J. Photogramm. Remote. Sens. 1993, 48, 17–28. [Google Scholar] [CrossRef]
- Lorenz, S.; Zimmermann, R.; Gloaguen, R. The Need for Accurate Geometric and Radiometric Corrections of Drone-Borne Hyperspectral Data for Mineral Exploration: MEPHySTo—A Toolbox for Pre-Processing Drone-Borne Hyperspectral Data. Remote. Sens. 2017, 9, 88. [Google Scholar]
- Wang, S.; Baum, A.; Zarco-Tejada, P.J.; Dam-Hansen, C.; Thorseth, A.; Bauer-Gottwein, P.; Bandini, F.; Garcia, M. Unmanned Aerial System multispectral mapping for low and variable solar irradiance conditions: Potential of tensor decomposition. ISPRS J. Photogramm. Remote. Sens. 2019, 155, 58–71. [Google Scholar] [CrossRef]
- Wierzbicki, D.; Fryskowska, A.; Kedzierski, M.; Wojtkowska, M.; Deliś, P. Method of radiometric quality assessment of NIR images acquired with a custom sensor mounted on an unmanned aerial vehicle. J. Appl. Remote. Sens. 2018, 12, 1. [Google Scholar] [CrossRef]
- Trimble UAS. Trimble UX5 Aerial Imaging Solution Vegetation Monitoring Frequently Asked Questions. 2013. Available online: http://surveypartners.trimble.com (accessed on 27 December 2019).
- Parrot. Available online: https://www.parrot.com/business-solutions-us/parrot-professional/parrot-sequoia (accessed on 20 December 2019).
- Kelcey, J.; Lucieer, A. Sensor Correction of a 6-Band Multispectral Imaging Sensor for UAV Remote Sensing. Remote. Sens. 2012, 4, 1462–1493. [Google Scholar] [CrossRef] [Green Version]
- Minařík, R.; Langhammer, J.; Hanuš, J. Radiometric and Atmospheric Corrections of Multispectral μMCA Camera for UAV Spectroscopy. Remote. Sens. 2019, 11, 2428. [Google Scholar] [CrossRef] [Green Version]
- Rajendran, P.; Smith, H. Modelling of solar irradiance and daylight duration for solar-powered UAV sizing. Energy Explor. Exploit. 2016, 34, 235–243. [Google Scholar] [CrossRef] [Green Version]
- Hakala, T.; Suomalainen, J.; Peltoniemi, J. Acquisition of Bidirectional Reflectance Factor Dataset Using a Micro Unmanned Aerial Vehicle and a Consumer Camera. Remote. Sens. 2010, 2, 819–832. [Google Scholar] [CrossRef] [Green Version]


| Dataset 1 | Dataset 2 | Dataset 3 | |
|---|---|---|---|
| UAV platform | UX5 | UX5 | Parrot Disco AG |
| Camera | Sony Nex 5T | Sony Nex 5T | Parrot Sequoia |
| Altitude [m] | 75 | 75 | 100 |
| GSD [m] | 0.024 | 0.024 | 0.130 |
| FOV [°] | 110 | 110 | 74 |
| Forward and side overlap [%] | 80 | 80 | 80 |
| Cover area [ha] | 40 | 50 | 1 |
| Flight time [min] | 30 | 20 | 15 |
| 0° | 45° | 90° | 135° |
 |  |  |  |
 |  |  |  |
| 180° | 225° | 270° | 315° |
 |  |  |  |
 |  |  |  |
| Pitch/Roll=5°/1° | Pitch/Roll=5°/2° | Pitch/Roll=5/°3° | Pitch/Roll=5°/4° |
 |  |  |  |
| Pitch/Roll=5°/6° | Pitch/Roll=5°/7° | Pitch/Roll=5°/8° | Pitch/Roll=5°/15° |
 |  |  |  |
| UX5 (Sony Nex 5T) | UX5 (Sony Nex 5T) | Parrot Sequoia | |||||
|---|---|---|---|---|---|---|---|
| Pre Adjustment | Post Adjustment | Pre Adjustment | Post Adjustment | Pre Adjustment | Post Adjustment | ||
| cross section | max | 50° | 39° | 65° | 30° | 53° | 25° |
| min | 0° | 0° | 0° | 0° | 18° | 0° | |
| mean | 16° | 12° | 23° | 10° | 34° | 14° | |
| std | 19° | 14° | 15° | 11° | 16° | 10° | |
| longitudinal section | max | 43° | 17° | 55° | 25° | 36° | 42° |
| min | 0° | 0° | 0° | 0° | 0° | 15° | |
| mean | 18° | 7° | 27° | 10° | 21° | 26° | |
| std | 18° | 8° | 17° | 12° | 16° | 11° | |
| Our Method Sony Nex 5T (Dataset 1) | Our Method Sony Nex 5T (Dataset 2) | Our Method Parrot Sequoia (Dataset 3) | |
|---|---|---|---|
| Time [s] | 2.43 | 2.38 | 3.34 |
© 2020 by the authors. Licensee MDPI, Basel, Switzerland. This article is an open access article distributed under the terms and conditions of the Creative Commons Attribution (CC BY) license (http://creativecommons.org/licenses/by/4.0/).
Share and Cite
Sekrecka, A.; Wierzbicki, D.; Kedzierski, M. Influence of the Sun Position and Platform Orientation on the Quality of Imagery Obtained from Unmanned Aerial Vehicles. Remote Sens. 2020, 12, 1040. https://0-doi-org.brum.beds.ac.uk/10.3390/rs12061040
Sekrecka A, Wierzbicki D, Kedzierski M. Influence of the Sun Position and Platform Orientation on the Quality of Imagery Obtained from Unmanned Aerial Vehicles. Remote Sensing. 2020; 12(6):1040. https://0-doi-org.brum.beds.ac.uk/10.3390/rs12061040
Chicago/Turabian StyleSekrecka, Aleksandra, Damian Wierzbicki, and Michal Kedzierski. 2020. "Influence of the Sun Position and Platform Orientation on the Quality of Imagery Obtained from Unmanned Aerial Vehicles" Remote Sensing 12, no. 6: 1040. https://0-doi-org.brum.beds.ac.uk/10.3390/rs12061040