1. Introduction
The source, composition, and content of atmospheric aerosols have important effects on the atmospheric environment, human health, the social economy, ecology, and climate change. As an important component of tropospheric aerosols, approximately (1–3) × 10
9 t dust aerosol enter the atmosphere every year, accounting for about half of the total tropospheric aerosols. [
1]. Dust can heat the atmosphere by absorbing solar shortwave and longwave radiation from the ground surface and clouds, and cool the atmosphere by scattering longwave and shortwave radiation and therefore influences the earth’s radiation balance, which can affect the climate [
2,
3,
4]. Dust can also indirectly change the microphysical properties of clouds by affecting the cloud condensation nuclei and ice cores, thereby affecting the efficiency of precipitation [
5,
6]. It can also change the albedo of snow and ice surfaces, exerting an indirect influence on the energy budget of the earth [
7,
8].
The dust in east Asia is sourced from China and surrounding areas and the annual emission of dust from this region accounts for about 25% of the global total, making it the second largest source of dust aerosols in the world [
6,
9].The Gobi Desert, the Taklimakan Desert, and the Loess Plateau are the main sources of dust in Asia [
10,
11,
12]. However, the role of dust from the Gobi Desert in the earth’s atmospheric system has been less well studied. Some studies have used the Cloud-Aerosol Lidar and Infrared Pathfinder Satellite Observation (CALIPSO) inversion and ground measurements to show that dust storms are more frequent over the Taklimakan Desert and that suspended dust is retained in the local area, whereas the dust storms in the Gobi Desert are less frequent, but more intense [
11]. The time series of Multi-angle Imaging SpectroRadiometer (MISR) images shows that the Gobi Desert accounts for >75% of the dust emission events in east Asia [
13]. As a result of the long-distance transport of dust particles in the upper atmosphere, dust particles can change the atmospheric conditions at a regional or even global scale [
14,
15,
16]. Dust aerosols from the Taklimakan and Gobi deserts can travel thousands of miles, affecting large areas of China [
9,
17,
18,
19], Korea and Japan [
20], and even the north Pacific and North America [
21,
22].
In terms of the selection of data to analyze dust processes, satellite data are usually observed once a day, which is insufficient to describe the dust transport process and changes in detail. Models provide hourly simulation data, but contain high levels of uncertainty. Reanalysis data, which are available once every one hour or every three hours, can better depict the processes and evolution of dust events and analyze the mechanism of the event more comprehensively.
To explore the accuracy and comprehensiveness of the MERRA-2 dataset in the analysis of dust processes, MERRA-2 reanalysis data were selected to analyze a typical dust event that occurred in east Asia on 2–7 May 2017. The dust process influenced eastern, central, southern, and southeastern China, the east coast of China, including the Shandong peninsula and the Yangtze river delta, and reached Korea and Japan. The southward transport of dust caused high-altitude dust storms and southeastern Russia and the Sea of Okhotsk were affected by the long-distance transport of dust. The dust was sourced from the Taklimakan and Gobi deserts. The Gobi Desert was the main source area of the dust event; a temperate low-pressure system continuously passed through arid and semi-arid areas, intermittently causing dust emission in multiple source areas. The frequency of dust storms in the Gobi Desert was high before 2006, but decreased after 2008 [
23]. Compared with the years before 2010, the number of days on which dust events were detected in Japan also decreased significantly after 2011 and this event was the largest dust storm event in Japan since 21 May 2010 [
24].
We used MERRA-2 reanalysis data to conduct a comprehensive and multi-angle analysis of the dust event: (1) To compare the MERRA-2 reanalysis dataset with satellite remote sensing data, lidar data, and ground-based observational data to verify the accuracy of the MERRA-2 dataset in describing dust processes and the meteorological conditions; (2) to use the MERRA-2 dataset to analyze dust processes accurately and in detail, to study the evolution of the dust event and to test the ability of the MERRA-2 model to characterize the dust process; (3) to use the MERRA-2 reanalysis dataset and data from other sources to analyze the characteristics and causes of spatial and temporal distribution change of dust and the influence of the Gobi Desert on the transport process, the influencing factors and the dust budget in east Asia in this dust event.
2. Data
2.1. MERRA-2 Reanalysis Dataset
MERRA-2 is the latest atmospheric reanalysis dataset provided by NASA’s global simulation and assimilation office [
25]. Using the Goddard Earth Observing System Version 5 (GEOS-5), the Earth system model includes the circulation and composition of the atmosphere, the ocean circulation and land surface processes, and biogeochemistry [
26,
27]. The MERRA-2 dataset contains a large number of data, including the aerosol optical depth (AOD), surface forcing, the aerosol mixing ratio, the carbon monoxide and ozone mixing ratio, and radiation diagnosis.
In addition to assimilating conventional observational meteorological data, MERRA-2 also provides a series of AOD datasets, including the offset-corrected AOD retrieved by the Advanced Very High Resolution Radiometer (AVHRR) and the Moderate Resolution Imaging Spectroradiometer (MODIS) onboard both the Terra and Aqua satellites [
28,
29] and the unbiased corrected AOD obtained from the MISR [
30] on bright surfaces. Ground-based Aerosol Robotic Network (AERONET) observations [
31] were also assimilated by the GEOS-5 Earth system model. Gelaro et al. (2017) provided an overview of the MERRA-2 modeling system and Buchard et al. (2017) gave a more detailed description of the aerosols in the MERRA-2 system [
25,
32].
Compared with the MERRA dataset, the aerosol data in MERRA-2 reduce false trends and the jumps associated with changes in the meteorological observation system. The data in MERRA-2 are rich, easy to obtain, with a long time series, global coverage, and an even distribution. We used the meteorological fields (vertical wind field, 500 and 850 hPa wind fields, potential height, and temperature), aerosol concentrations (AOD550 nm and the dust aerosol mass concentration), and the dust aerosol mixing ratio in six different effective radius datasets (bin-001, 0–0.73 μm; bin-002, 0.73–1.4 μm; bin-003, 1.4–2.4 μm; bin-004, 2.4–4.5 μm; bin-005, 4.5–8.0 μm; bin-all, 0–8.0 μm) at a resolution of 0.625° × 0.5°.
2.2. Satellite Observations
2.2.1. Himawari-8
Himawari-8/9 (
https://www.eorc.jaxa.jp/ptree/index.html) is a new generation of geostationary meteorological satellite in Japan, it carries the most advanced optical sensor, the radiometric, spectral, and spatial resolution is significantly higher than sensors in the geostationary orbit before [
33]. High resolution combined with shorter review times, provide new levels of capacity for the derivation of quantitative products and for the identification and tracking of rapidly changing weather phenomena [
33]. The Advanced Himawari Imager on the Himawari-8 and 9 satellites can provide sub-daily observations of aerosol [
33]. We used daily AOT data of Himawari-8 with spatial resolution of 0.5 km on 2–7 May 2017 to compare with MERRA-2 data.
2.2.2. CALIPSO
CALIPSO (
https://www-calipso.larc.nasa.gov/), developed jointly by the United States and France, was successfully launched on 28 April 2006 to fill in the gaps in observations of aerosol and cloud properties and their global distribution. The main instrument carried on the satellite is the cloud aerosol Lidar CALIOP with cross-polarization, which is the lowest dual-wavelength (532 and 1064 nm) polarization Lidar [
34]. We used the CALIPSO aerosol products (cal_lid_l2_05kmapro-standard-v4-10 and cal_lid_l2_vfm-standard-v4-10) to analyze the transport distance and the range of influence of the dust in the 2017 dust events.
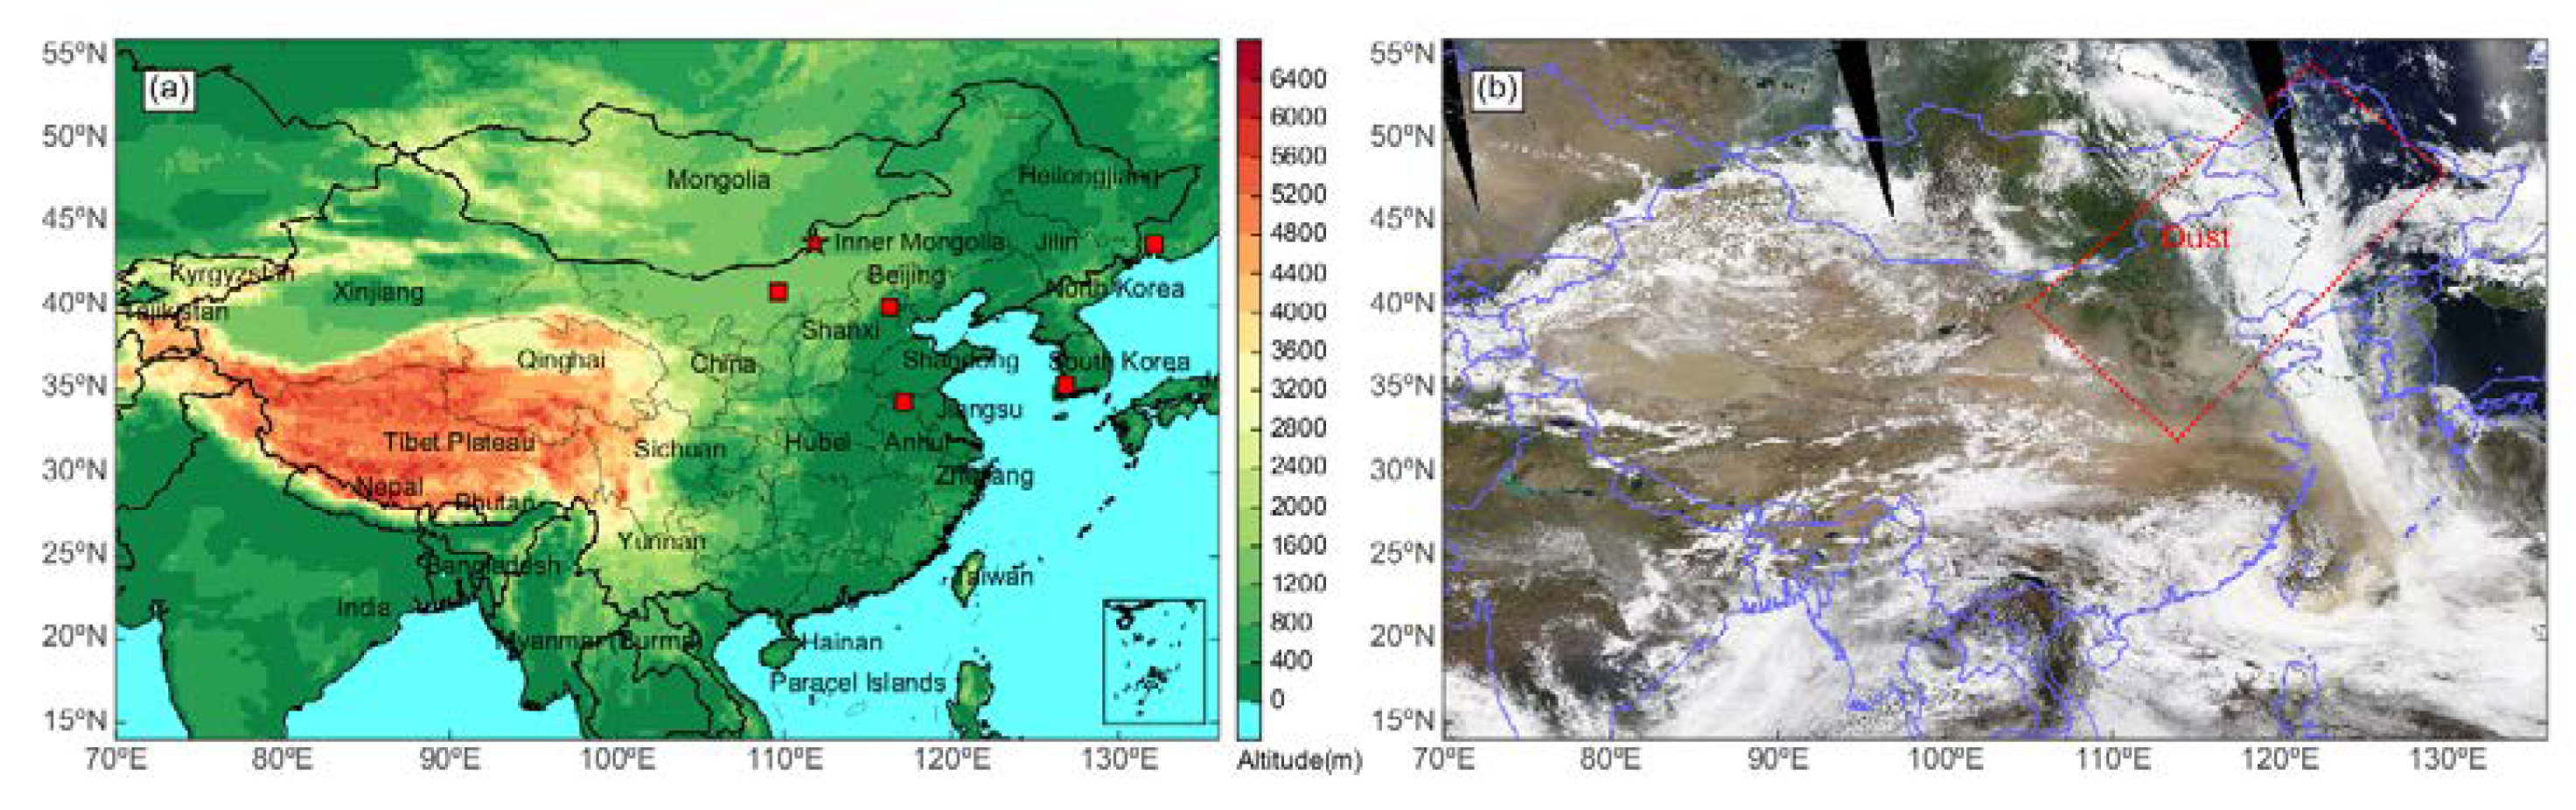
2.3. Ground-Based Observations
Figure 1b shows the true color cloud image of the MODIS-TERRA satellite on 4 May 2017. The cloud image shows that the dust was transported to northern and northeastern China on 4 May 2017 and the areas affected by dust extended from northwestern to northeastern China, covering most of northern China. Based on the transport path of the dust, representative ground observation stations were selected to analyze the transport process and to verify the MERRA-2 data.
2.3.1. AERONET AOD Data
The AERONET (
https://aeronet.gsfc.nasa.gov/) program is an alliance of ground-based remote sensing aerosol networks jointly established by NASA and LOA-PHOTONS (CNRS). The AERONET collaboration provides globally distributed observations of the spectral AOD, inversion products, and precipitable water in diverse aerosol regimes. The network now covers all the major regions of the world and uses the CIMEL Electronique CE318 multiband sun photometer to measure the spectral irradiance of the Sun and the sky radiance [
35]. The AERONET AOD data have a high accuracy and the uncertainty is about 0.01–0.02 [
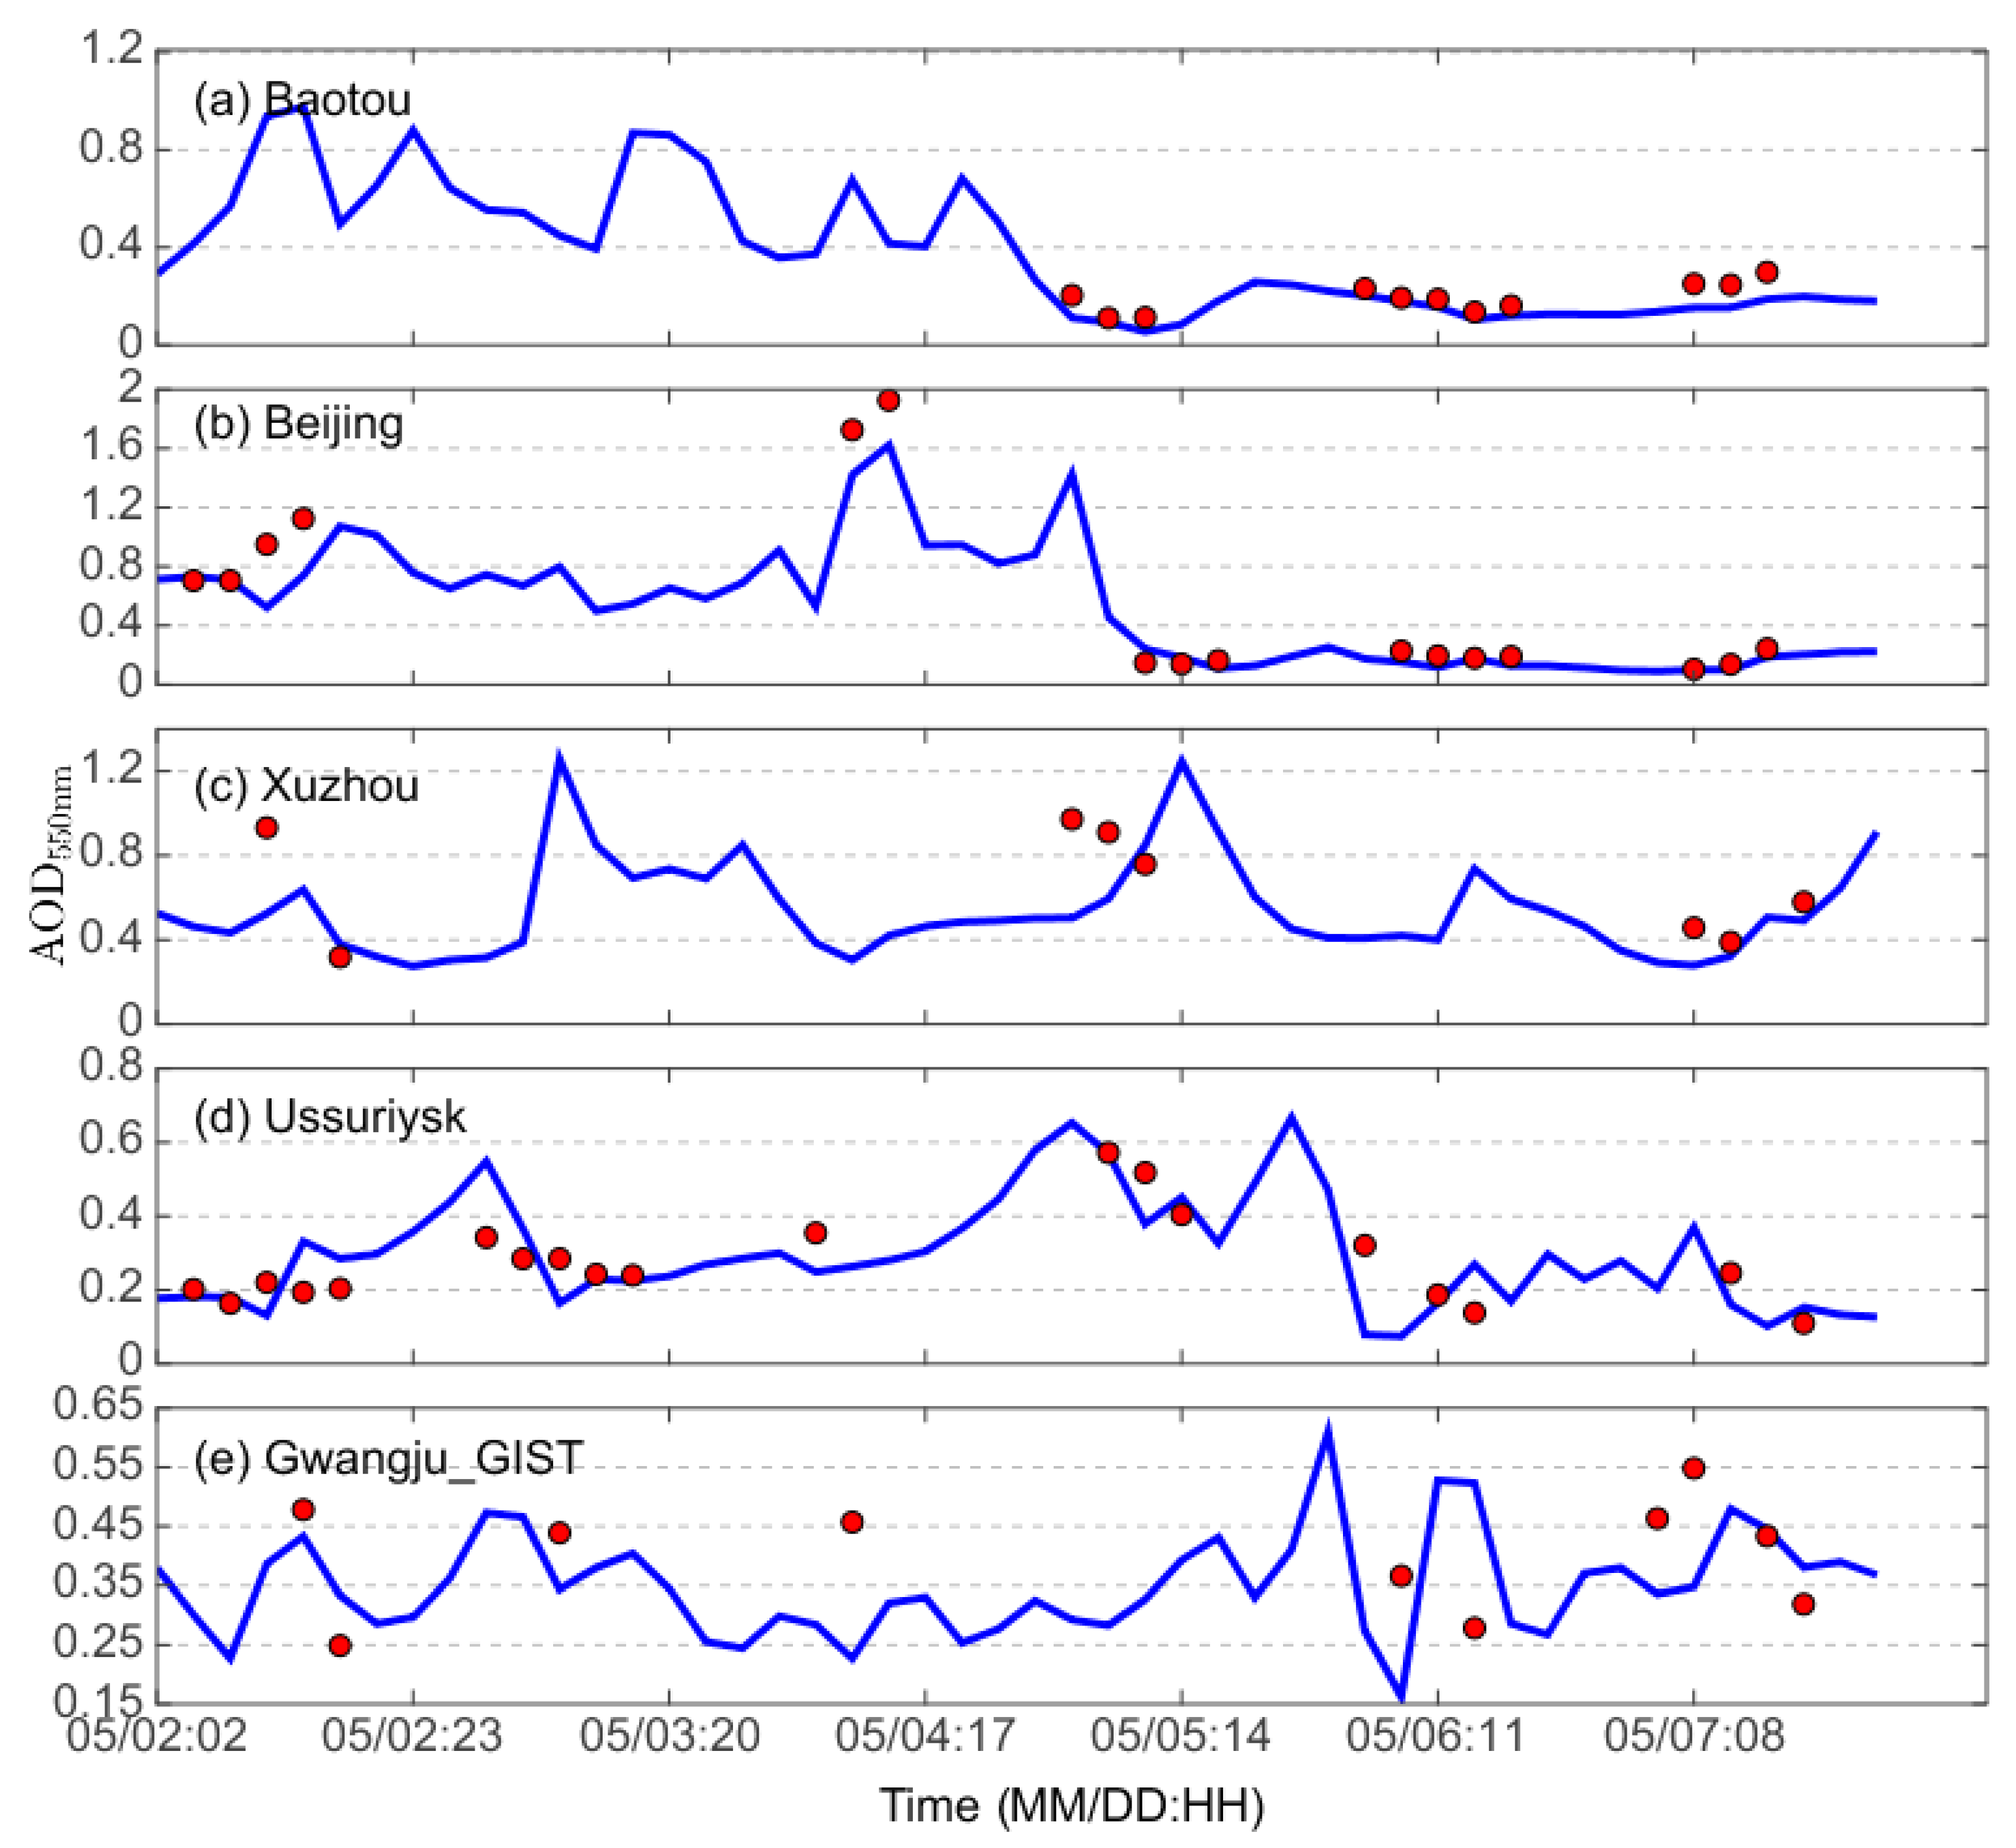
35]. These data play an important part in studies of global aerosol transport, aerosol radiation effects, and in verifying the radiation transmission mode and aerosol results from satellite remote sensing observations. Based on the direction of dust transport, we selected the hourly average AOD from five observation stations (Baotou, Beijing, Xuzhou, Ussuriysk, and Gwangju_GIST) to analyze the processes in this dust event and to verify the MERRA-2 reanalysis data.
2.3.2. Lidar
We selected the observation data from the lidar station in Inner Mongolia (
Figure 1a) to analyze the transport and range of influence of the dust event. The Inner Mongolia Lidar data were obtained from the Asian Dust and Aerosol Lidar Observation Network (AD-Net). AD-Net is a Lidar network for the continuous observation of the vertical distribution of dust and other aerosols in east Asia [
36]. AD-Net contributes to the WMO GAW Program and is the east Asian component of the GAW Aerosol Lidar Observation Network (GALION) [
36].
2.3.3. National Urban Air Quality Real-time Publishing Platform
The National Urban Air Quality Real-time Publishing Platform (
http://106.37.208.233:20035) is a platform for environmental monitoring stations in China to release the national air quality status according to the relevant provisions of the ambient air quality standards and the technical rules of the environmental air quality index (trial). The data are sourced from automatic national air quality monitoring stations (excluding local air quality monitoring stations). The platform is a real-time publishing platform and publishes both hourly and daily data as the reference value for each day. We selected the PM
10 and PM
2.5 data to analyze the dust process and verify the accuracy of the MERRA-2 data.
3. Results and Discussion
3.1. Spatiotemporal Distribution of Dust
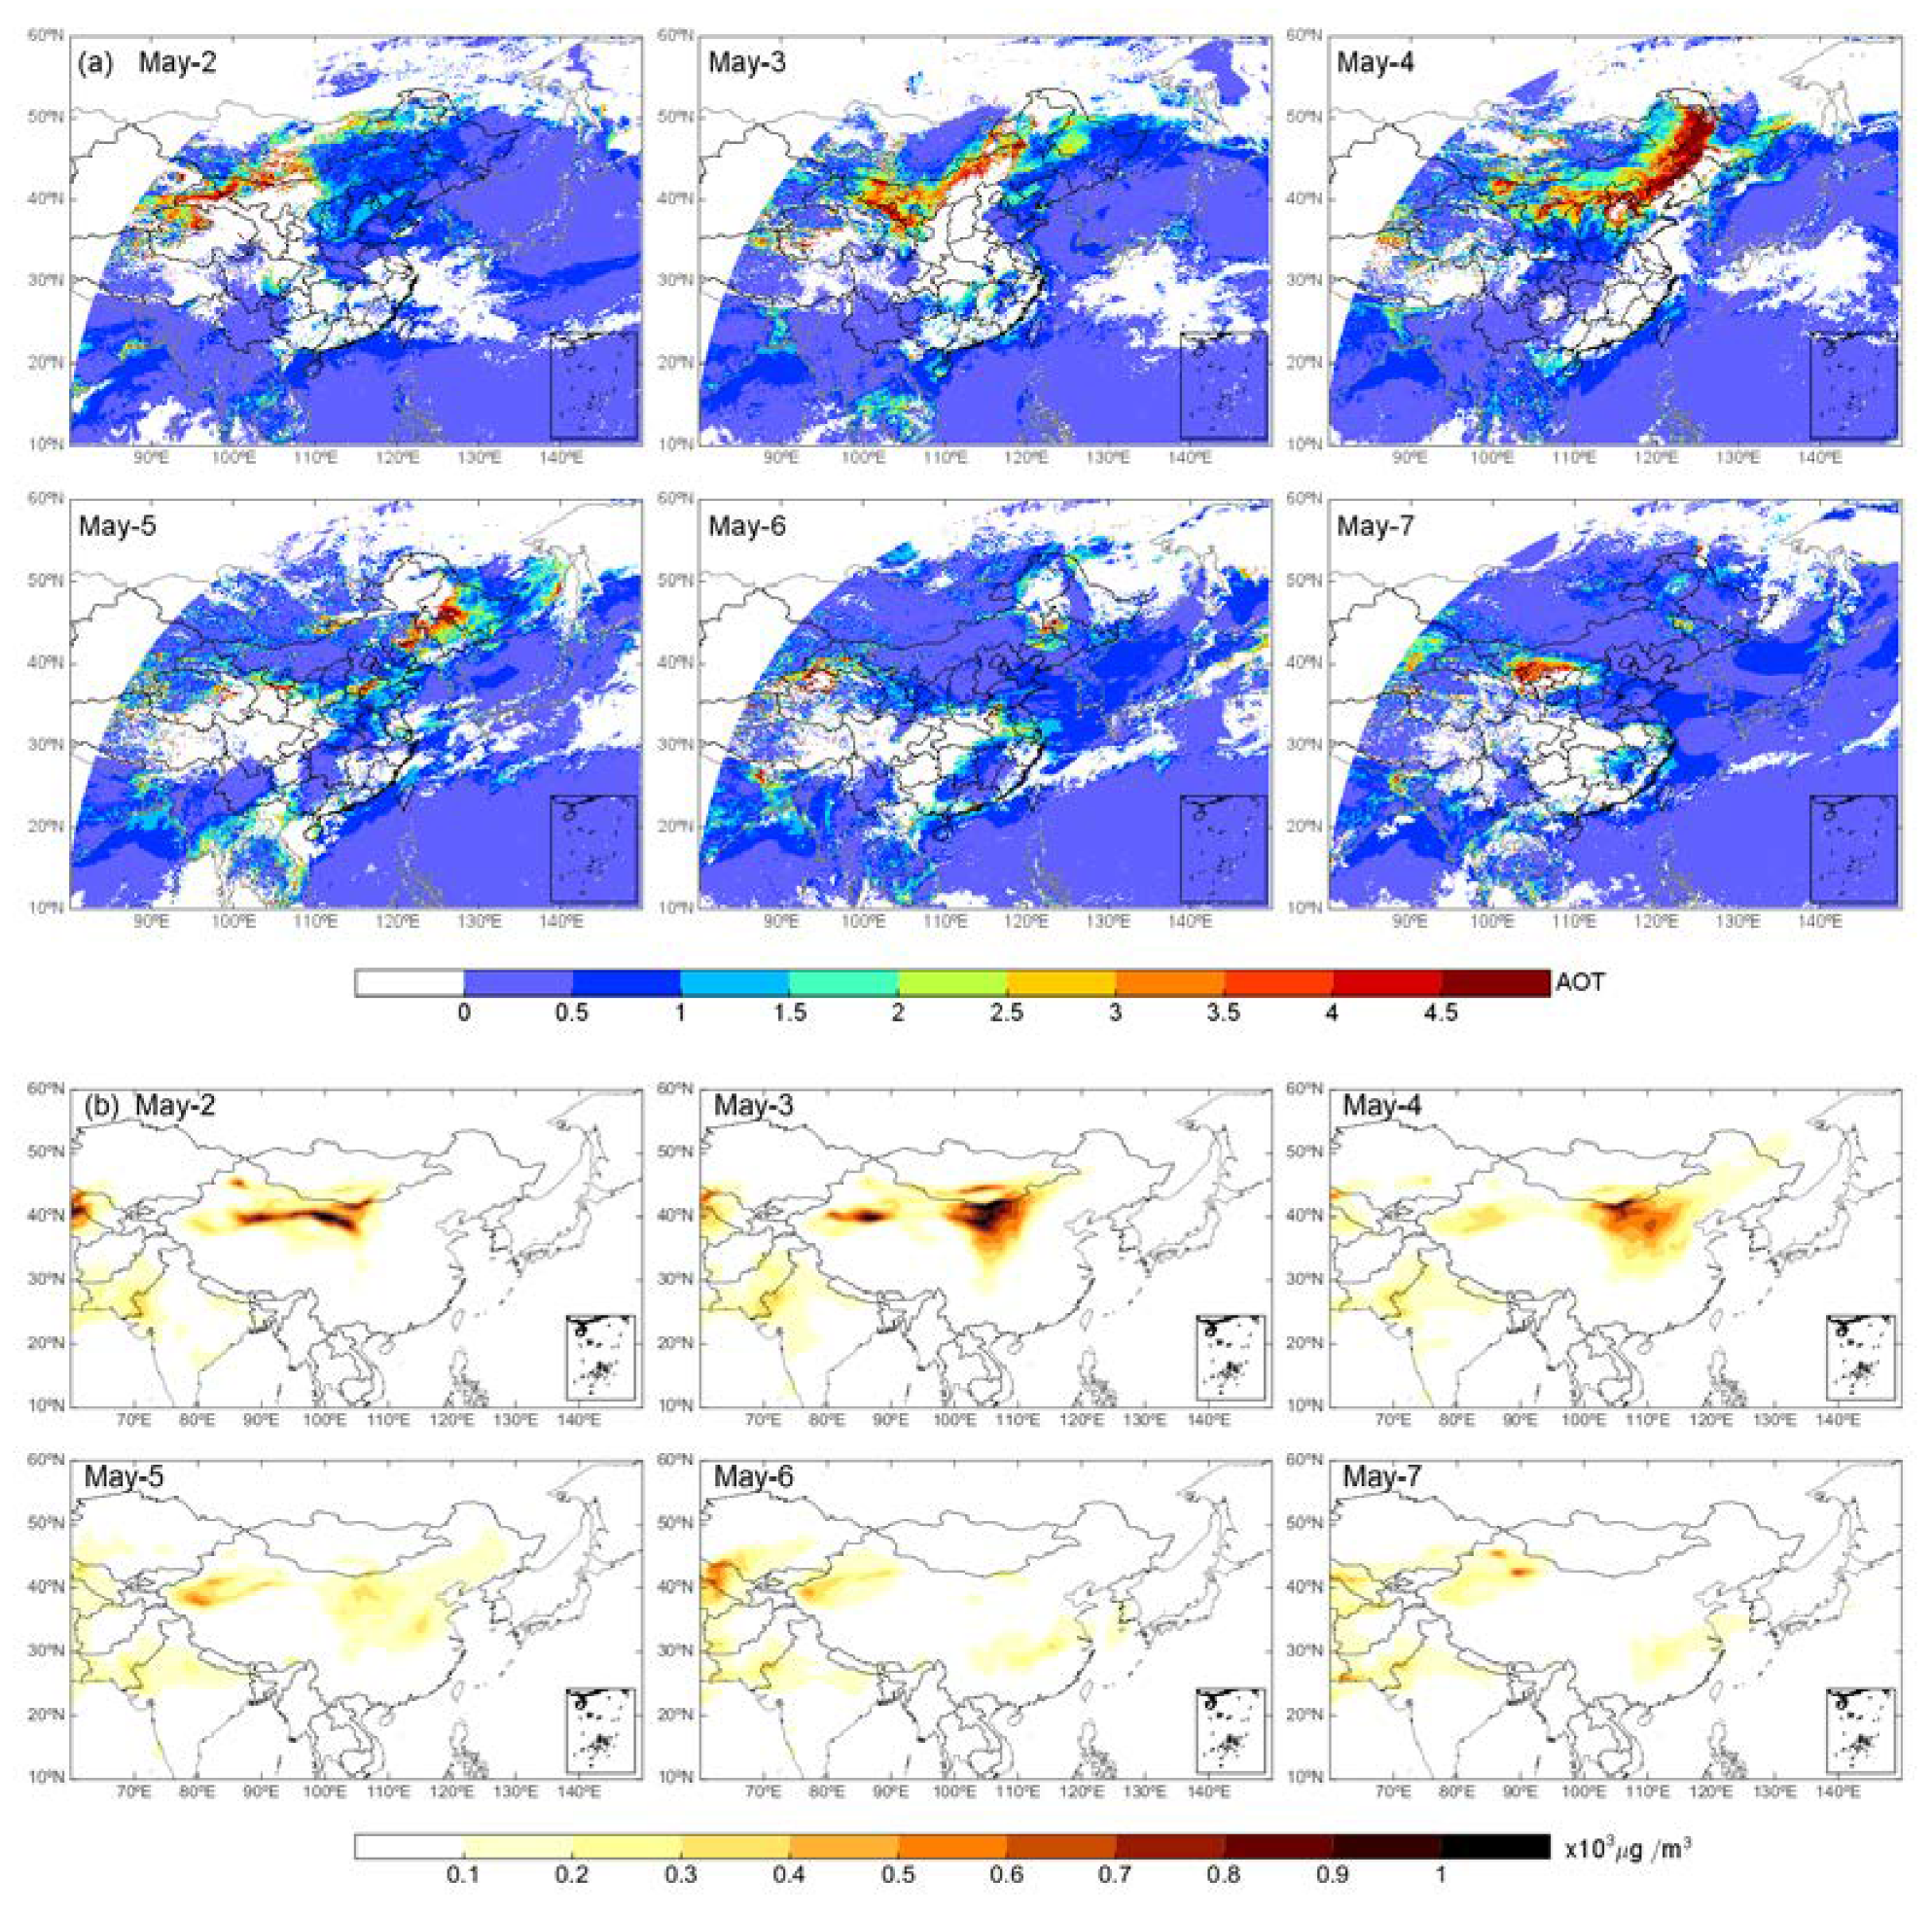
We selected satellite and ground-based observational data and compared these with the MERRA-2 dataset to verify the accuracy of the MERRA-2 data in simulating the spatiotemporal distribution of dust. The comparison of
Figure 2a,b shows that the change in the spatiotemporal distribution described by the MERRA-2 reanalysis dataset is consistent with the change trend of the AOT of Himawari-8 during the dust event. The high values of the two data were different on 7 May, so we compared these data with the ground-based data in the following. The surface mass concentration is smaller than the column mass concentration, indicating that a large amount of dust was lifted high into the atmosphere during the dust event and traveled over long distances (
Figure S1).
There was a dust event in the Taklimakan Desert on 2 May 2017 and the dust traveled eastward, influencing western and central Inner Mongolia and the southern border of Mongolia. A new dust emission occurred in the Gobi Desert on 3 May 2017, increasing the mass concentration of dust. The dust traveled east, north, and south, affecting northern and central China. On 4 May, the dust was transmitted east, northeast, and south, further affecting north, central, east, and northeast China. The dust traveled further on 5 and 7 May and affected the ocean and Japan. Further dust events occurred in the Taklimakan Desert from May 3 to 7 and emitted a large amount of dust, although this only affected the local weather conditions and no long-distance transport occurred (
Figure 2).
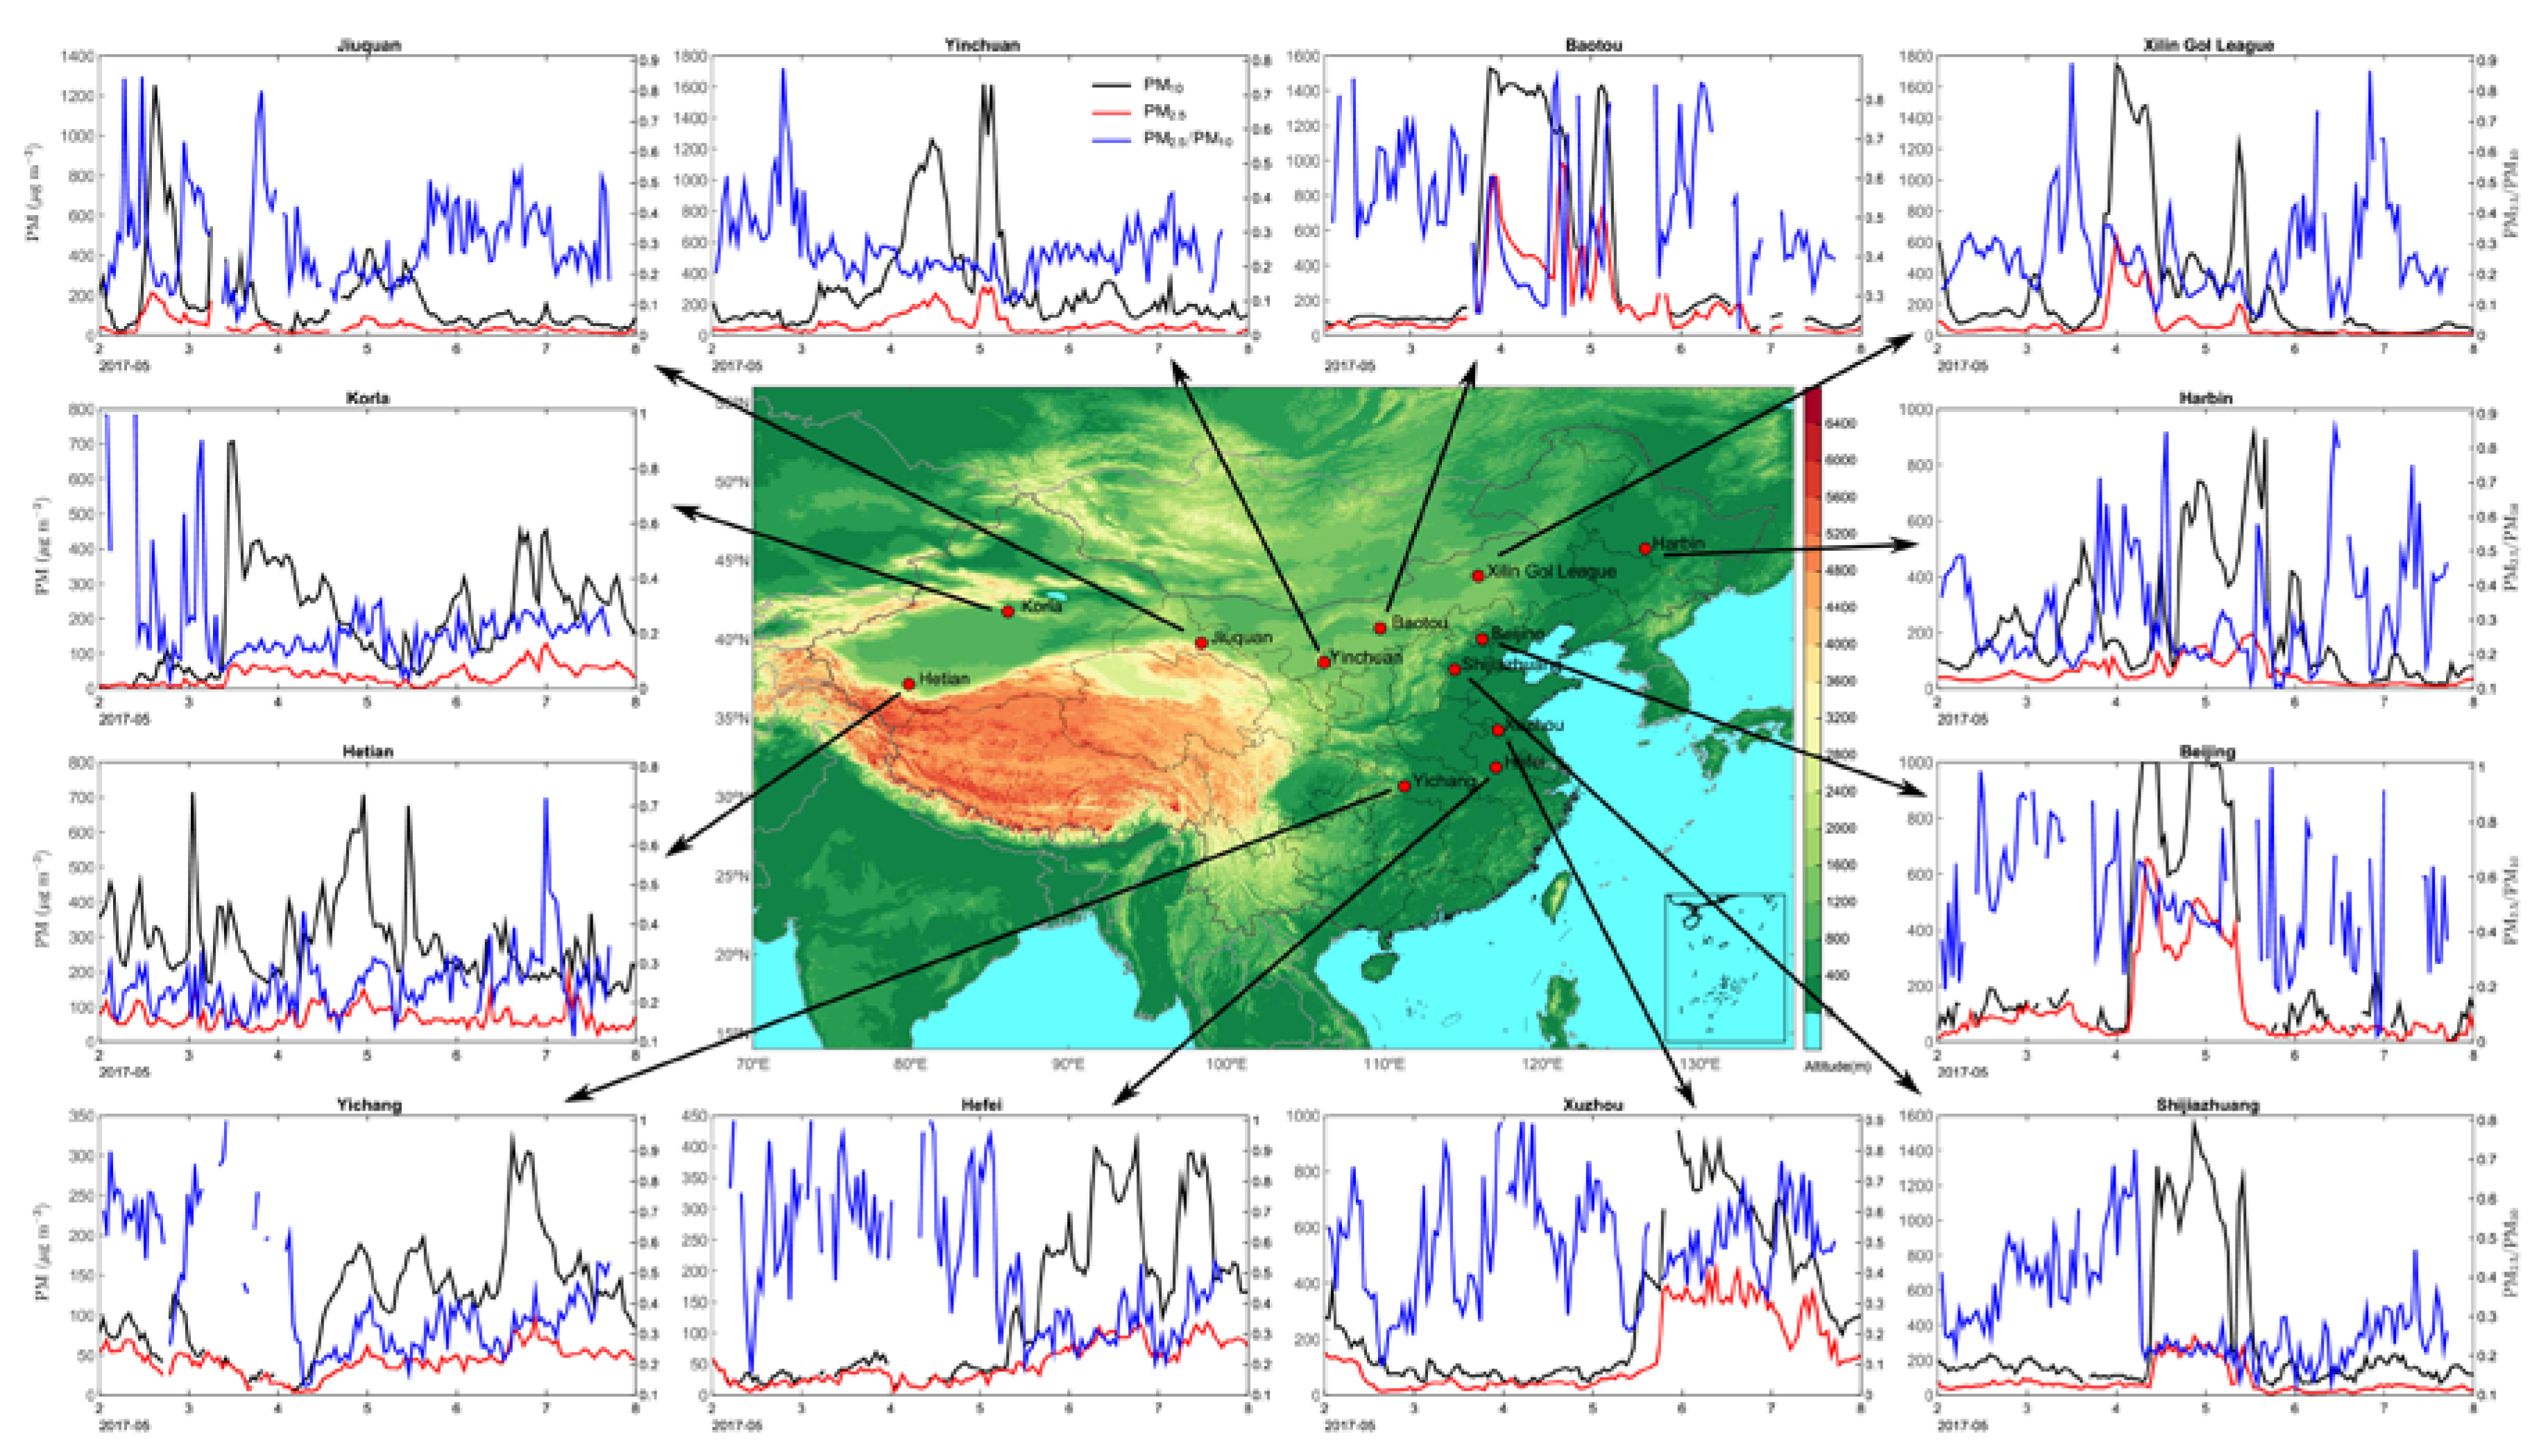
Analysis of the data from representative stations on the dust transport path indicated that the PM
10 concentration of each station fluctuated substantially in the direction of dust transport. This is consistent with the spatiotemporal distribution of the dust described by the MERRA-2 data. The PM
2.5 concentration in some cities fluctuated during the period affected by dust, with significant fluctuations in Baotou and Beijing and significant small fluctuations in Yinchuan and Xilin Gol League. Dust deposition affected the concentration of aerosols in the lower atmosphere. The mixing of dust and aerosols in the lower atmosphere aggravates pollution and the deposition of fine particles in the dust will directly increase the concentration of PM
2.5 (
Figure 3). The concentration of PM
10 in Hetian was affected by the dust event in the Taklimakan Desert and fluctuated on 2–8 May 2017 and there are maximal values on 3–5 May 2017. There were different amplitude fluctuations of PM
10 in Korla on 3–8 May 2017, with the strongest fluctuations on 3 May, followed by the fluctuations on 7 May.
The PM10 concentration at Yinchuan station fluctuated greatly on 4 and 5 May, whereas the PM2.5 concentration only fluctuated slightly. There was a large fluctuation at Baotou station on 3–5 May. The PM2.5 concentration fluctuated almost simultaneously with the PM10 concentration in Baotou, Beijing and Xuzhou, and was slightly less than the PM10 concentration. Beijing station showed a large fluctuation on 4–6 May. Xilin Gol League station showed a large fluctuation in the PM10 concentration on 3–5 May with a maximum of 1800 μg/m3, accompanied by a small fluctuation in the PM2.5 concentration. The concentration of PM10 at Harbin station fluctuated slightly on 3 May and fluctuated greatly on 5 May, but there was little fluctuation in the PM2.5 concentration. There were large fluctuations at Shijiazhuang station on 4 and 5 May, with small, significant fluctuations in PM2.5. Xuzhou station showed a large fluctuation on 5–7 May 2017. There were large fluctuations of PM10 at Hefei station on 5–7 May and small, significant fluctuations in PM2.5. PM10 in Yichang station showed a clear fluctuation from May 4 to 7 and the largest fluctuation on 6 May, the PM2.5 concentration showed a clear small fluctuation.
We selected the hourly average AOD data from Baotou, Beijing, Xuzhou, Ussuriysk, and Gwangju_GIST to verify the accuracy of the MERRA-2 AOD data.
Figure 4 shows that the change trend of the AOD shown by the MERRA-2 and AERONET data were basically consistent. The AOD was greatly affected by coarse mode aerosol particles and the peak of the AOD in Baotou, Beijing, and Xuzhou is clearly distributed before and after the dust event. The AOD in Ussuriysk and Gwangju GIST also fluctuated significantly when dust is transmitted to the local area. The observed values at the stations further confirm the transport direction of the dust from west to east and the distribution of dust obtained based on
Figure 2.
According to this analysis, the transport of dust during this event in the east, south, and northeast directions affected the northwestern China, northern China, central China, northeastern China, and the east coast of China. The spatiotemporal distribution of dust described by the MERRA-2 data is consistent with the data from Himawari-8, AERONET and the national urban air quality publishing platform (
Figures S2 and S3). This indicates that the MERRA-2 data can accurately describe the dust process and capture the variations of dust characteristics.
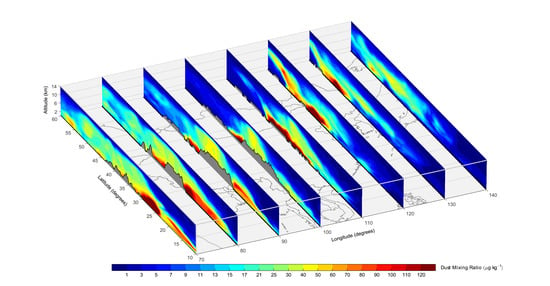
3.2. Vertical Evolution of Dust
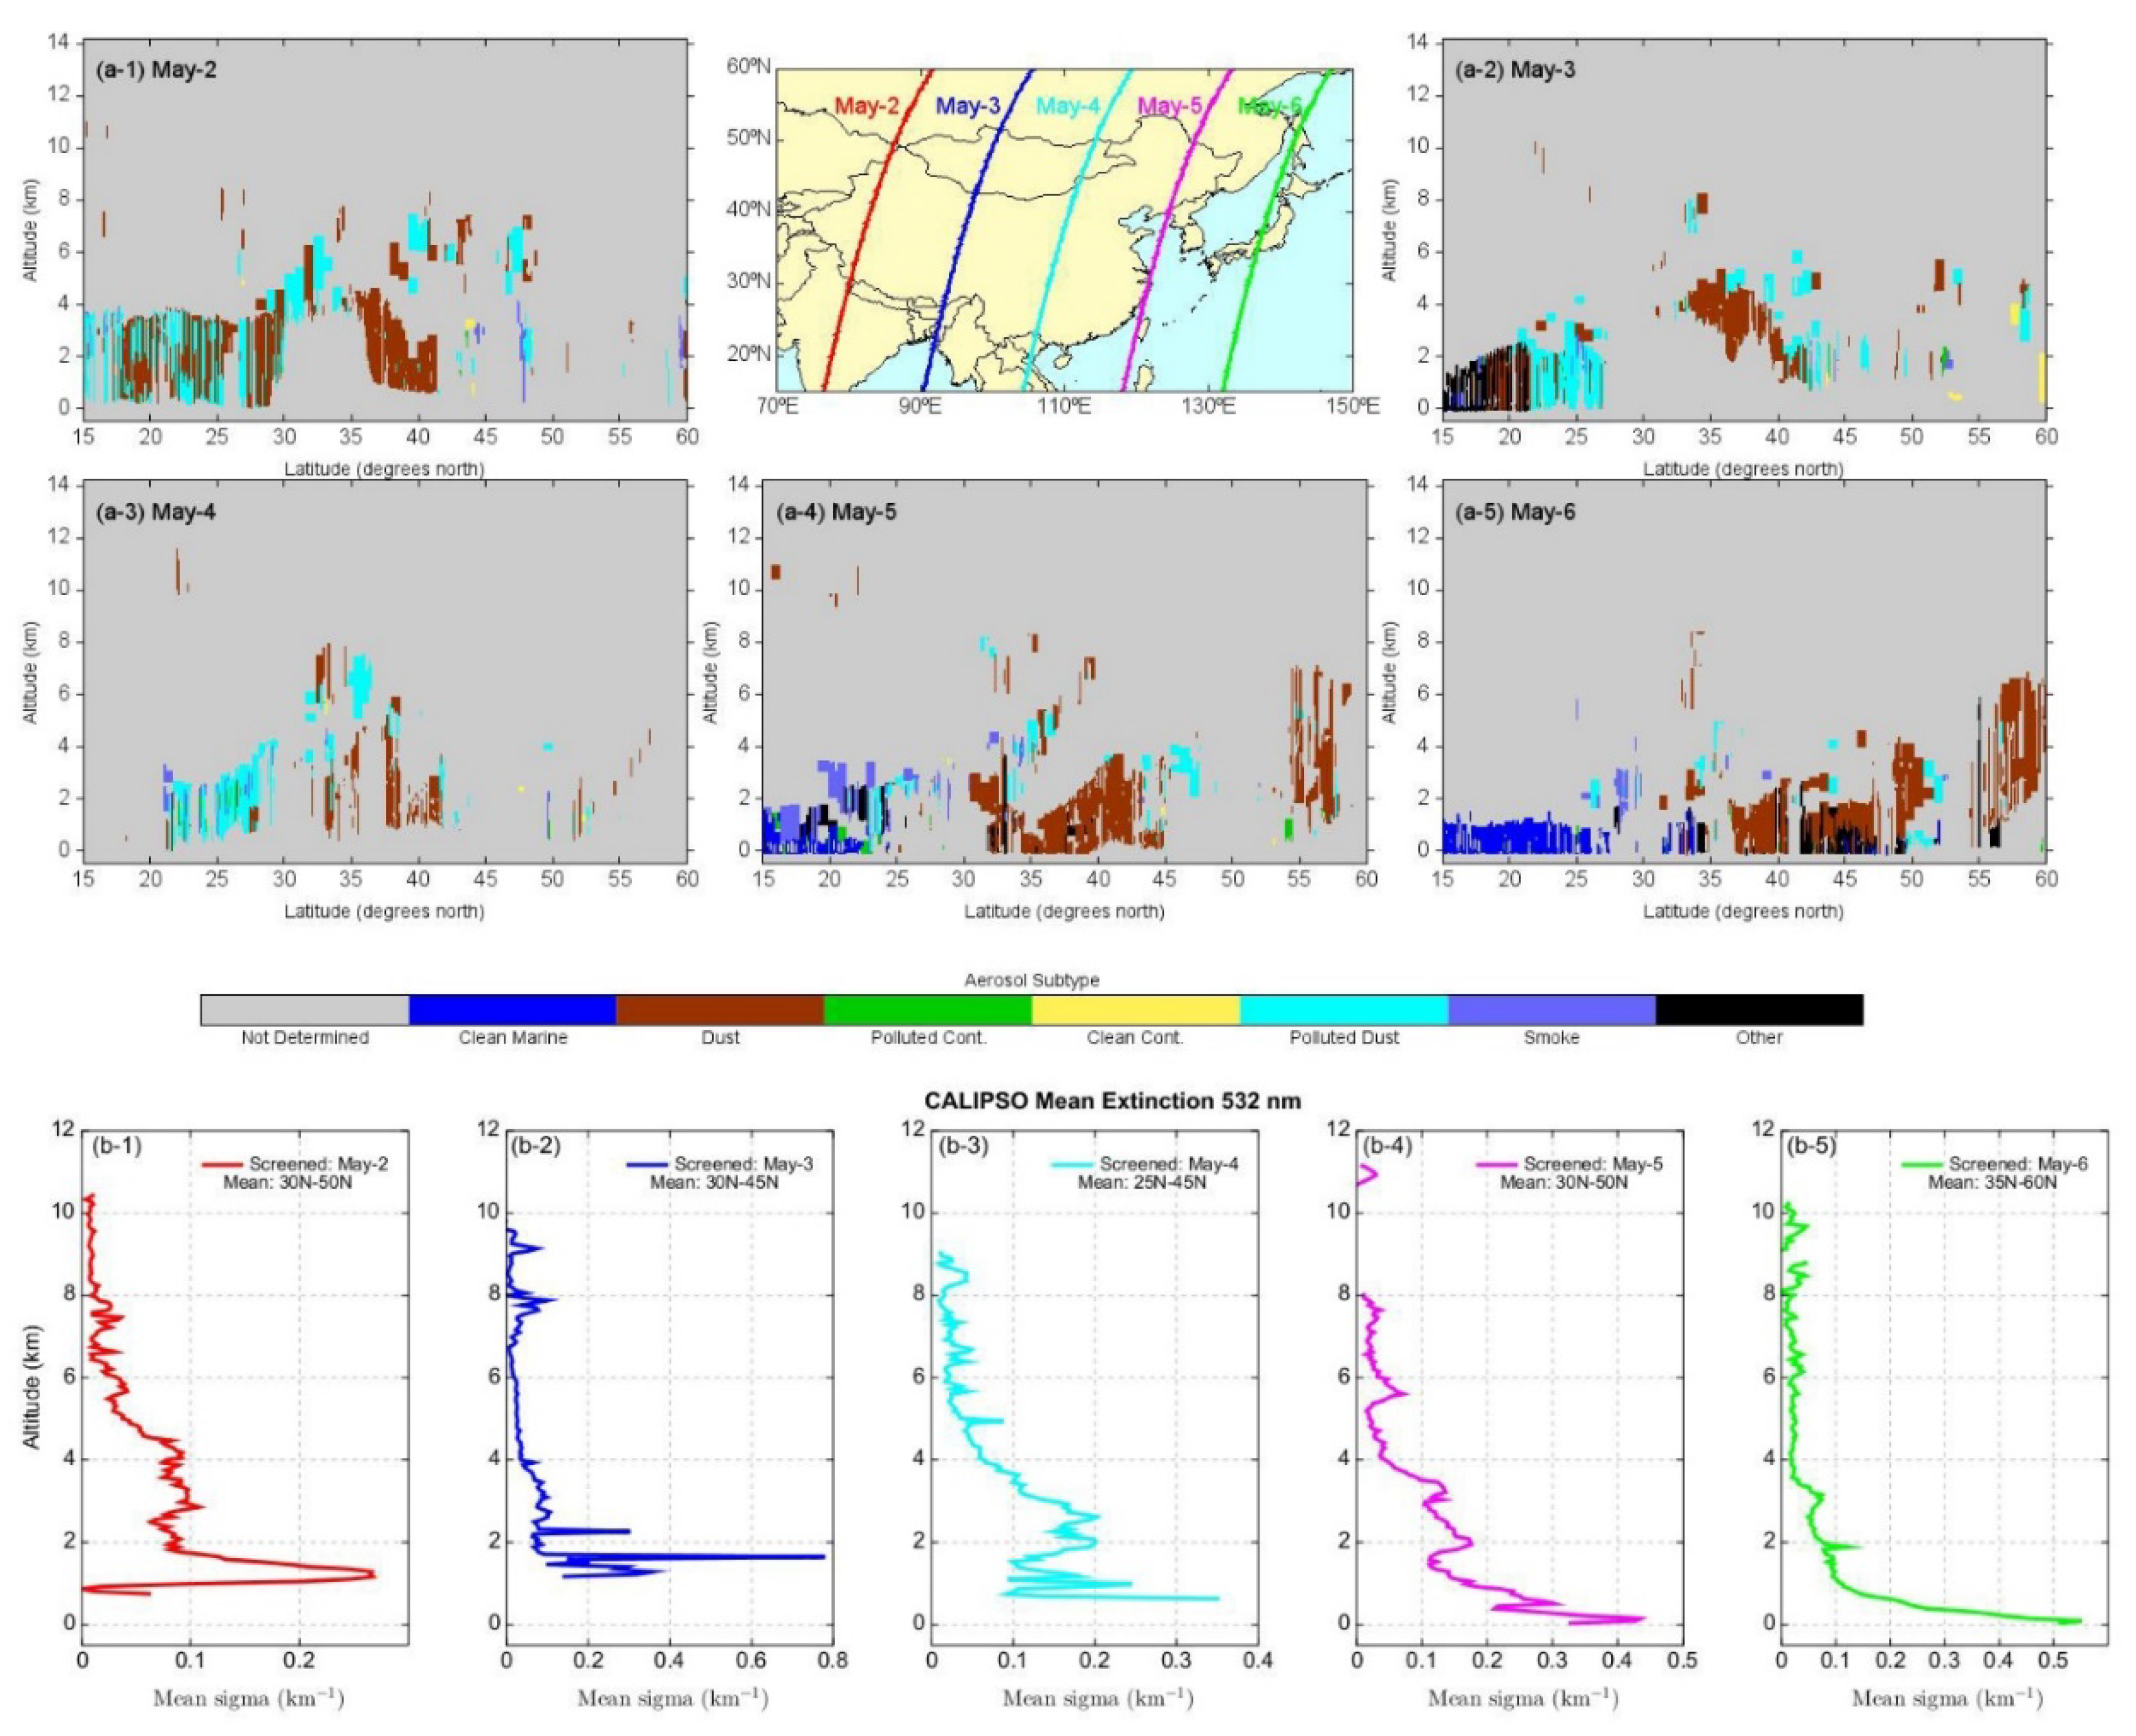
According to our analysis of the aerosol distribution profile on the CALIPSO observation track on 2–7 May 2017 (
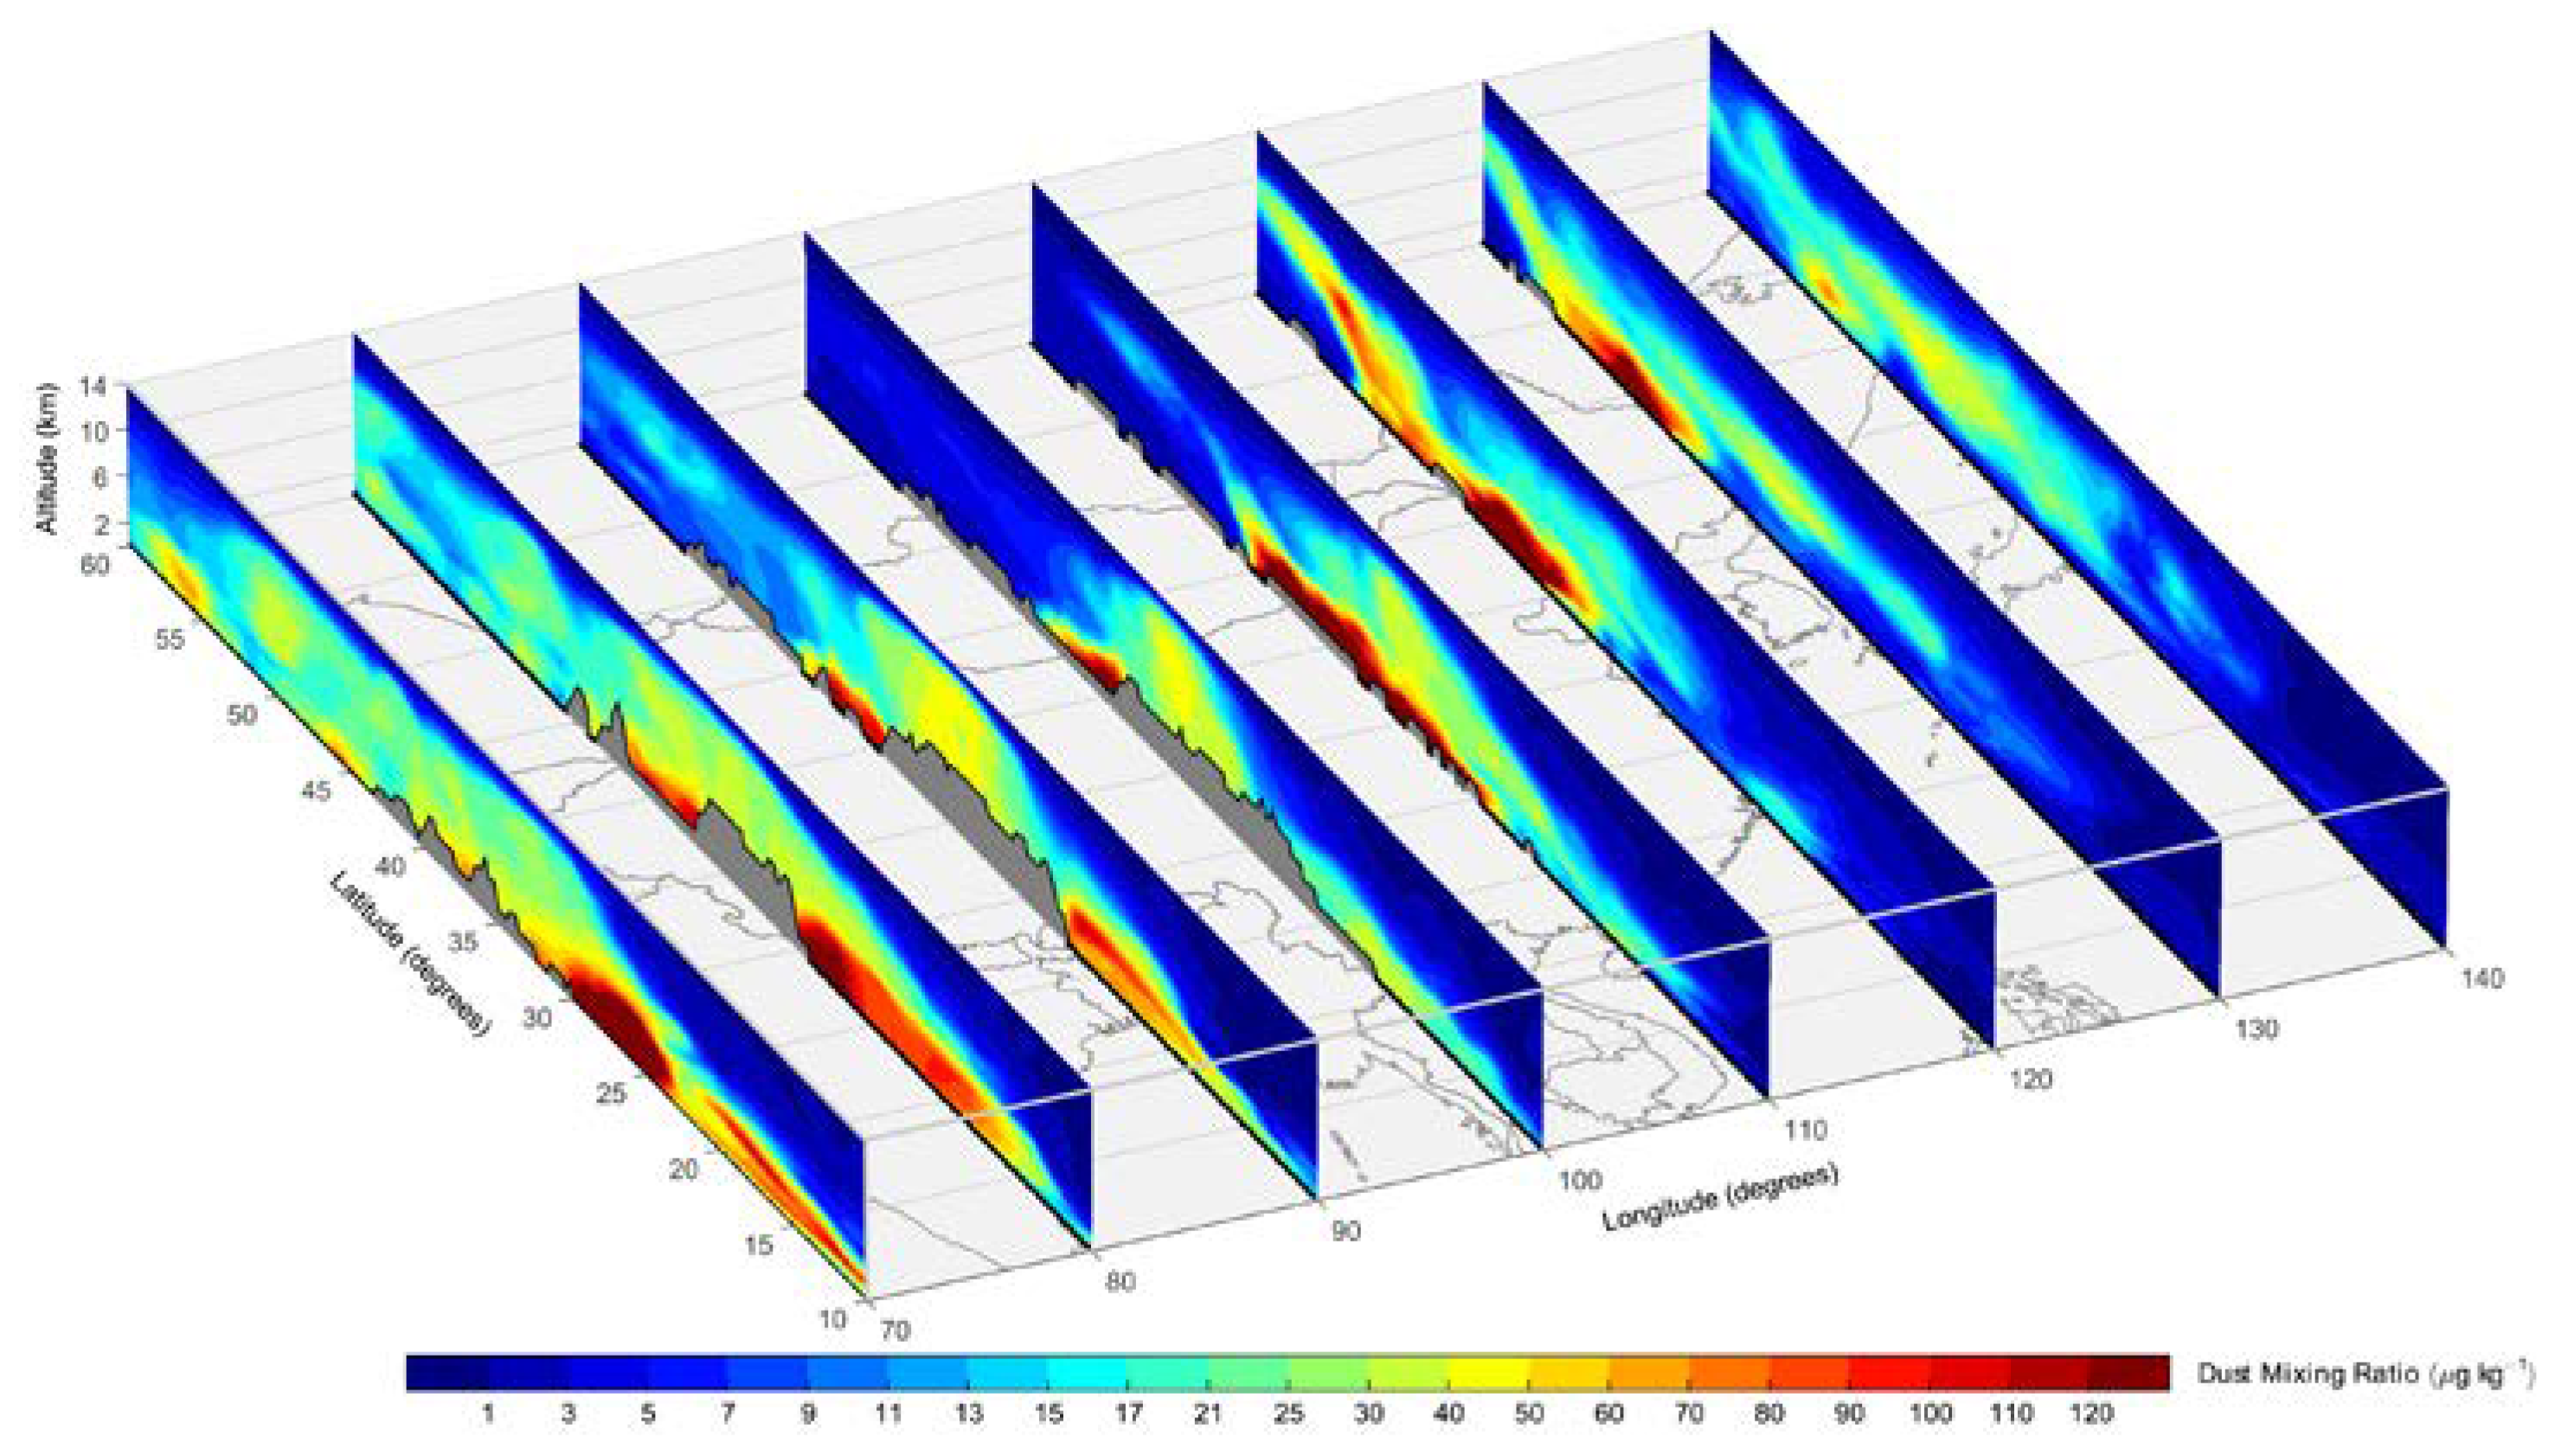
Figure 5a,b), the vertical range of influence of the dust was from 1 to 10 km. The dust event occurred in the Taklimakan Desert on 2 May and the dust spread from east to south and influenced the western region of Inner Mongolia on 3 May and northern and central China on 4 May. Combining with the MERRA-2 data (
Figure 6) to analyze the vertical distribution of dust from a three-dimensional perspective. The vertical area of influence of dust on 4 May reached an altitude of 10 km and affected most of northern China, northwest, north, central, east, and northeast China, and the eastern coastal areas. A small amount of dust was transferred to the ocean and the region of Japan. The dust affected northeast China, east China, southeast China, the Huanghai Sea, and the Bohai Sea on 5 May and spread to the Sea of Japan and the Sea of Okhotsk and affected Japan on 6 May. The vertical aerosol extinction profile in
Figure 5b shows that dust events affected an altitude of about 10 km above surface. The amount of dust fluctuated greatly at 0–2 km, but only slightly at 2–6 km. The amplitude of fluctuation was smaller at greater heights.
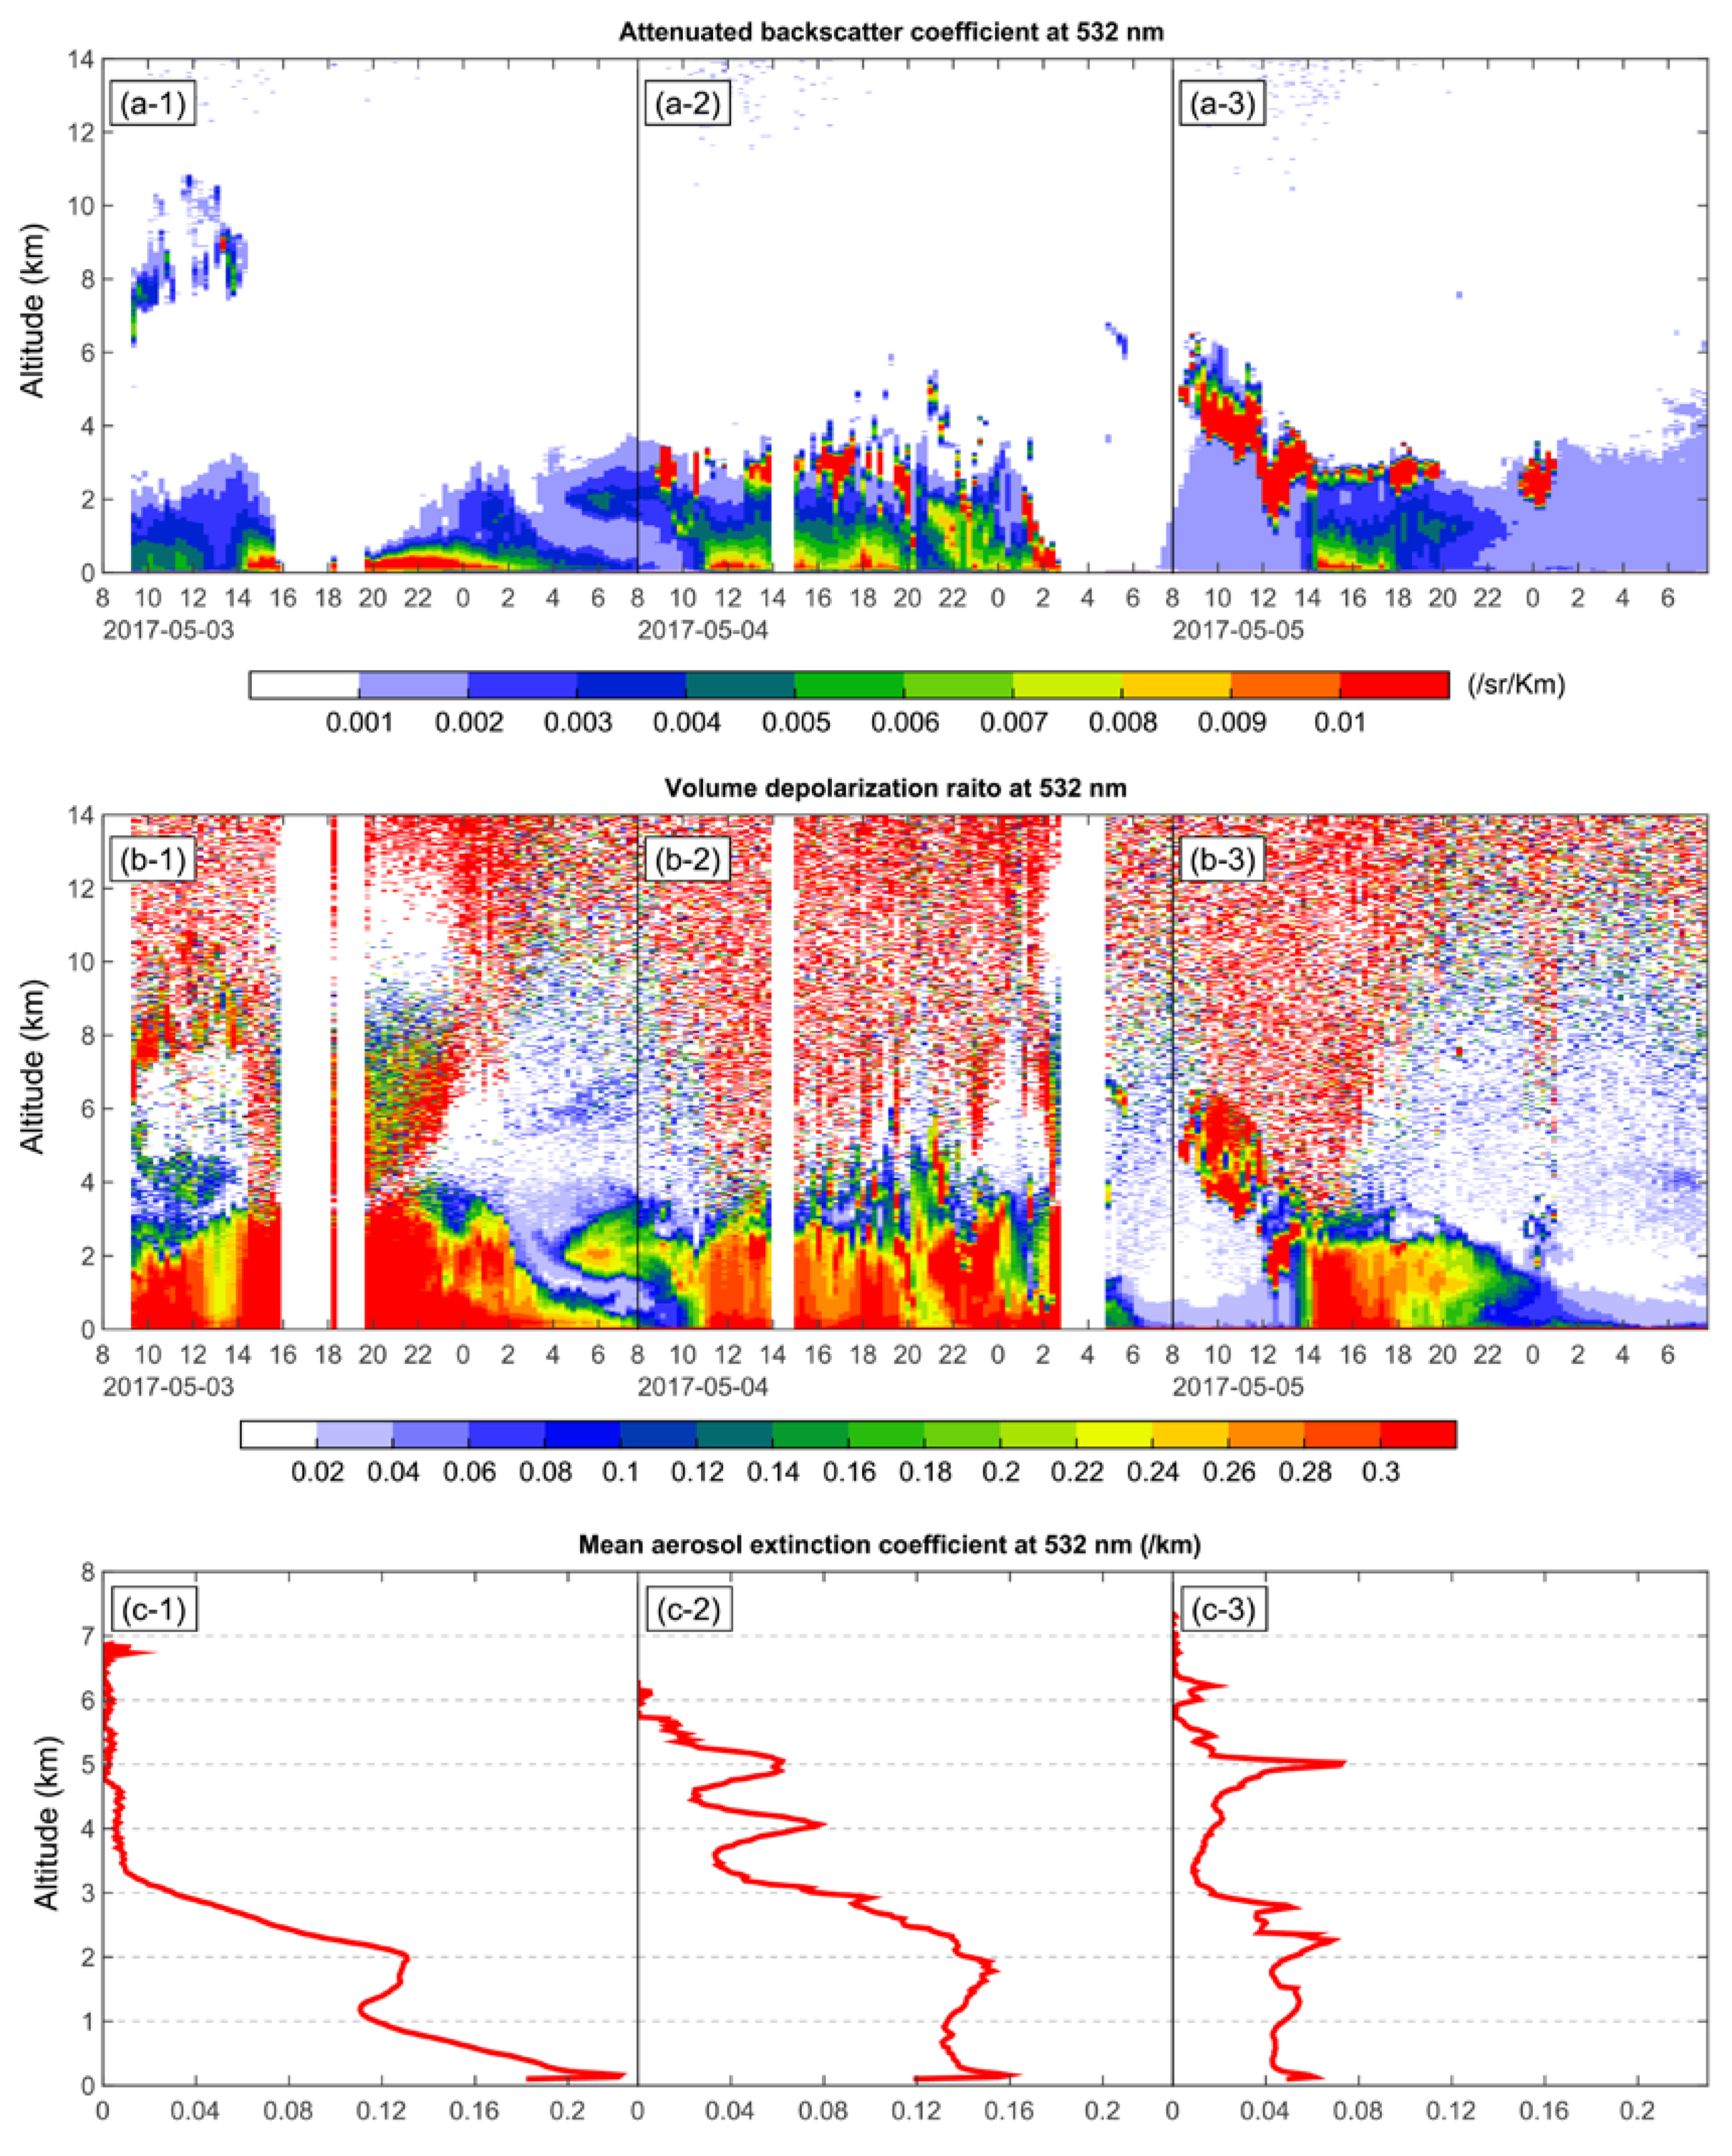
The vertical distribution of dust at typical affected stations was further analyzed using Lidar data (
Figure 7). The lidar stations in Inner Mongolia was affected by dust from 0 to 6 km above the ground on 3–5 May 2017 with a depolarization ratio of up to 0.3 in most time periods. The maximum extinction coefficient was at about 0.1 km with a value of 0.23/km and the maximal value was about 0.13/km at 2 km on 3 May. As a result of the vertical movement of the atmosphere and the transport and deposition of dust, the area of influence of the dust gradually extended to the upper levels on 4–5 May 2017 and the influence at lower levels gradually weakened. On 4 May, the maximum extinction coefficient was about 0.165/km at 0.1 km and the maximal value was about 0.15/km at 1.8 km. On 5 May, the maximum extinction coefficient was about 0.075/km at 5 km with a maximal value of about 0.07/km at 2.3 km. Comparing the results of the analysis of the satellite and lidar data with
Figure 2 and
Figure 6, we found that the description of the distribution of dust by the MERRA-2 data was consistent with the satellite and lidar observational data.
3.3. Meteorological Conditions
Previous studies have shown that the emission and transport of dust are closely related to circulation factor drivers in both observations and models [
15,
37,
38]. Therefore, the MERRA-2 wind field data were selected to analyze the circulation driving factors of dust events.
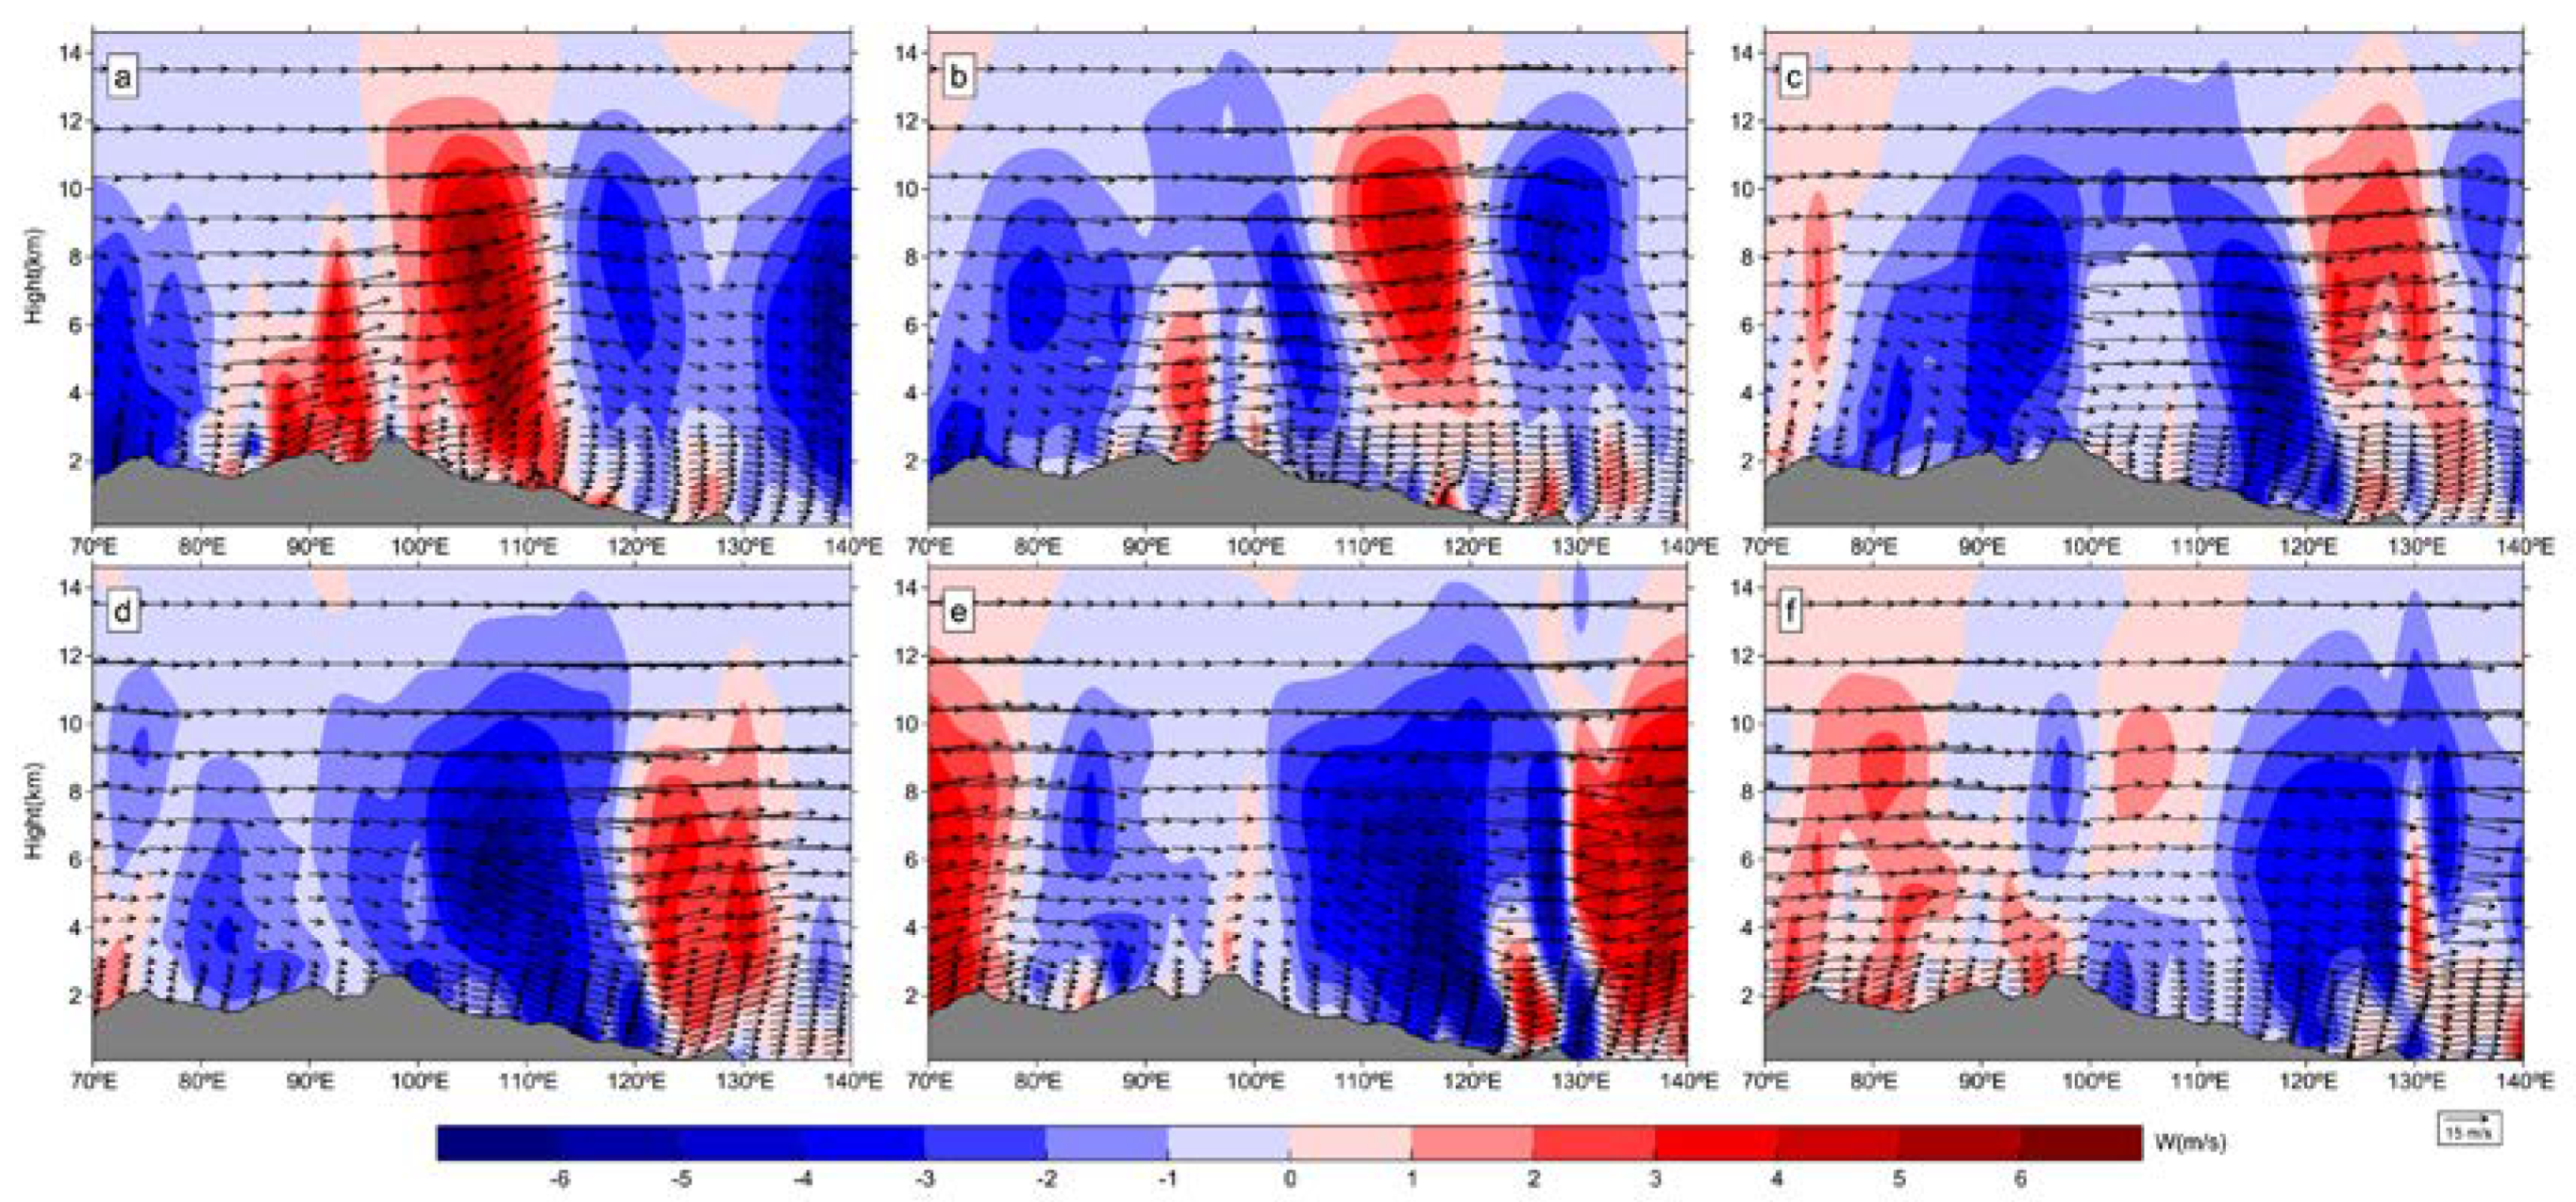
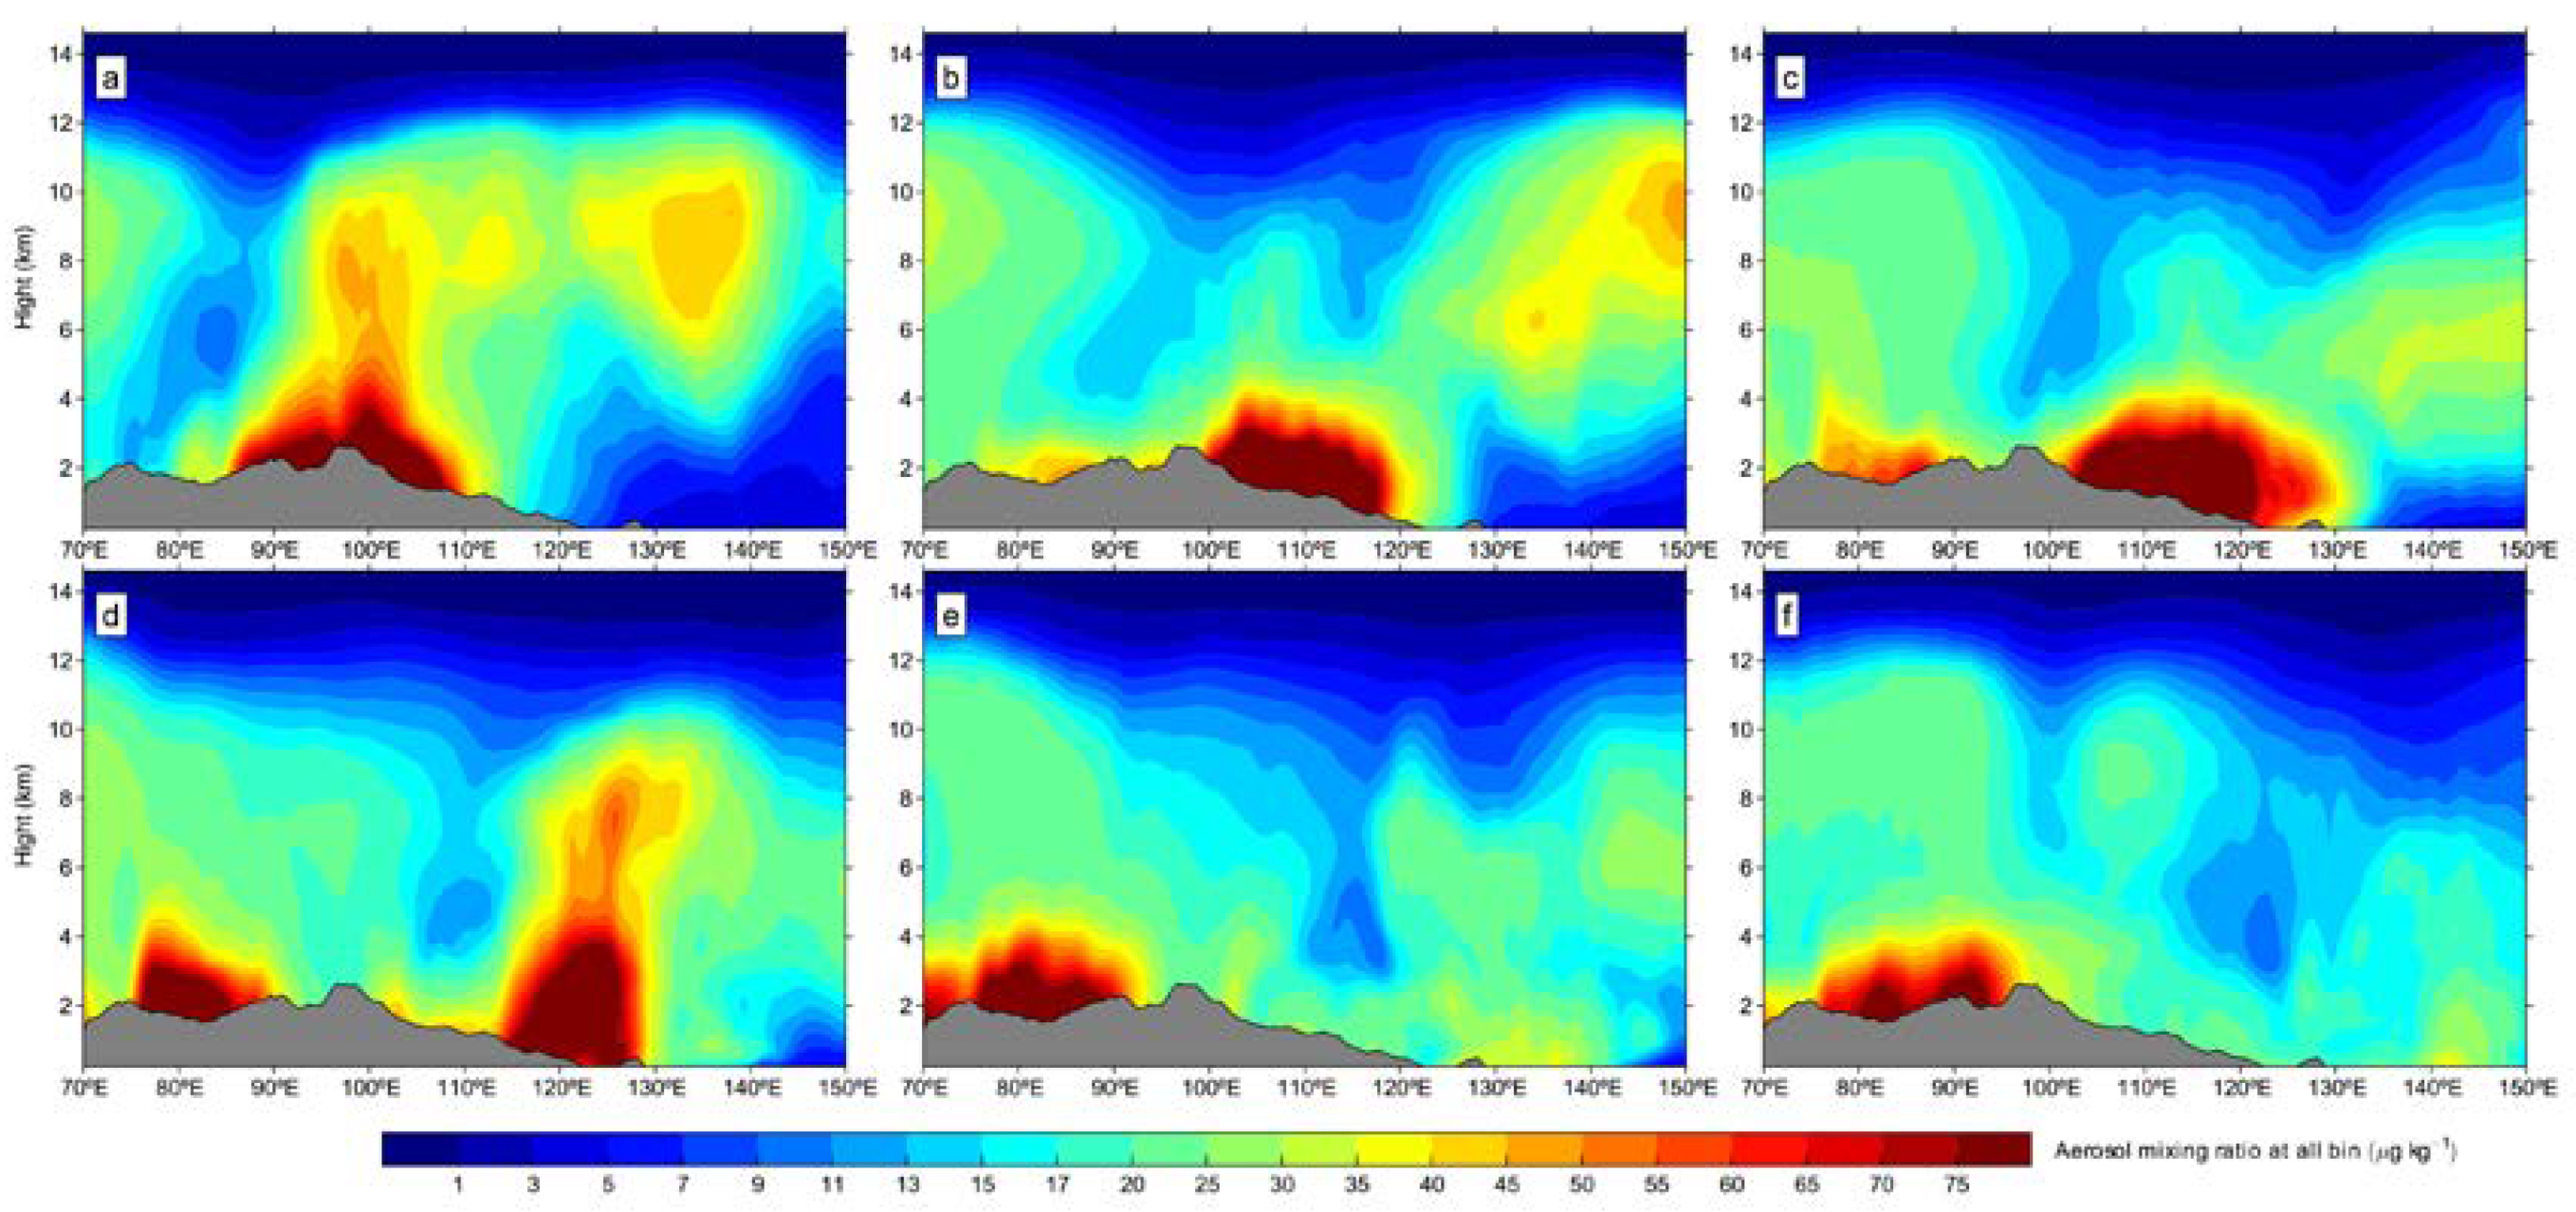
By comparing the vertical motion in the atmosphere during the dust event (
Figure 8) with the mixing ratio of dust aerosols (
Figure 9), it can be seen that the areas affected by dust during the dust event on 2–7 May, especially the areas with a high mixing ratio of dust aerosols, had better vertical transport conditions from the ground to about 10 km above sea-level, which lifted the dust to the upper atmosphere. The high-value zone of the dust aerosol mixing ratio and the high-value zone of rising movement existed simultaneously at 90–110°E on 2 May, between 110 and 120°E on 3 May and between 120 and 130°E on 4 May. There was also a small vertical transport of dust between 130 and 140°E on 6 May. The vertical transport was weak on 7 May. Good vertical transport combined with the high winds near the trough led to the long-distance transport of dust at high altitudes. The sinking motion in other areas favored deposition.
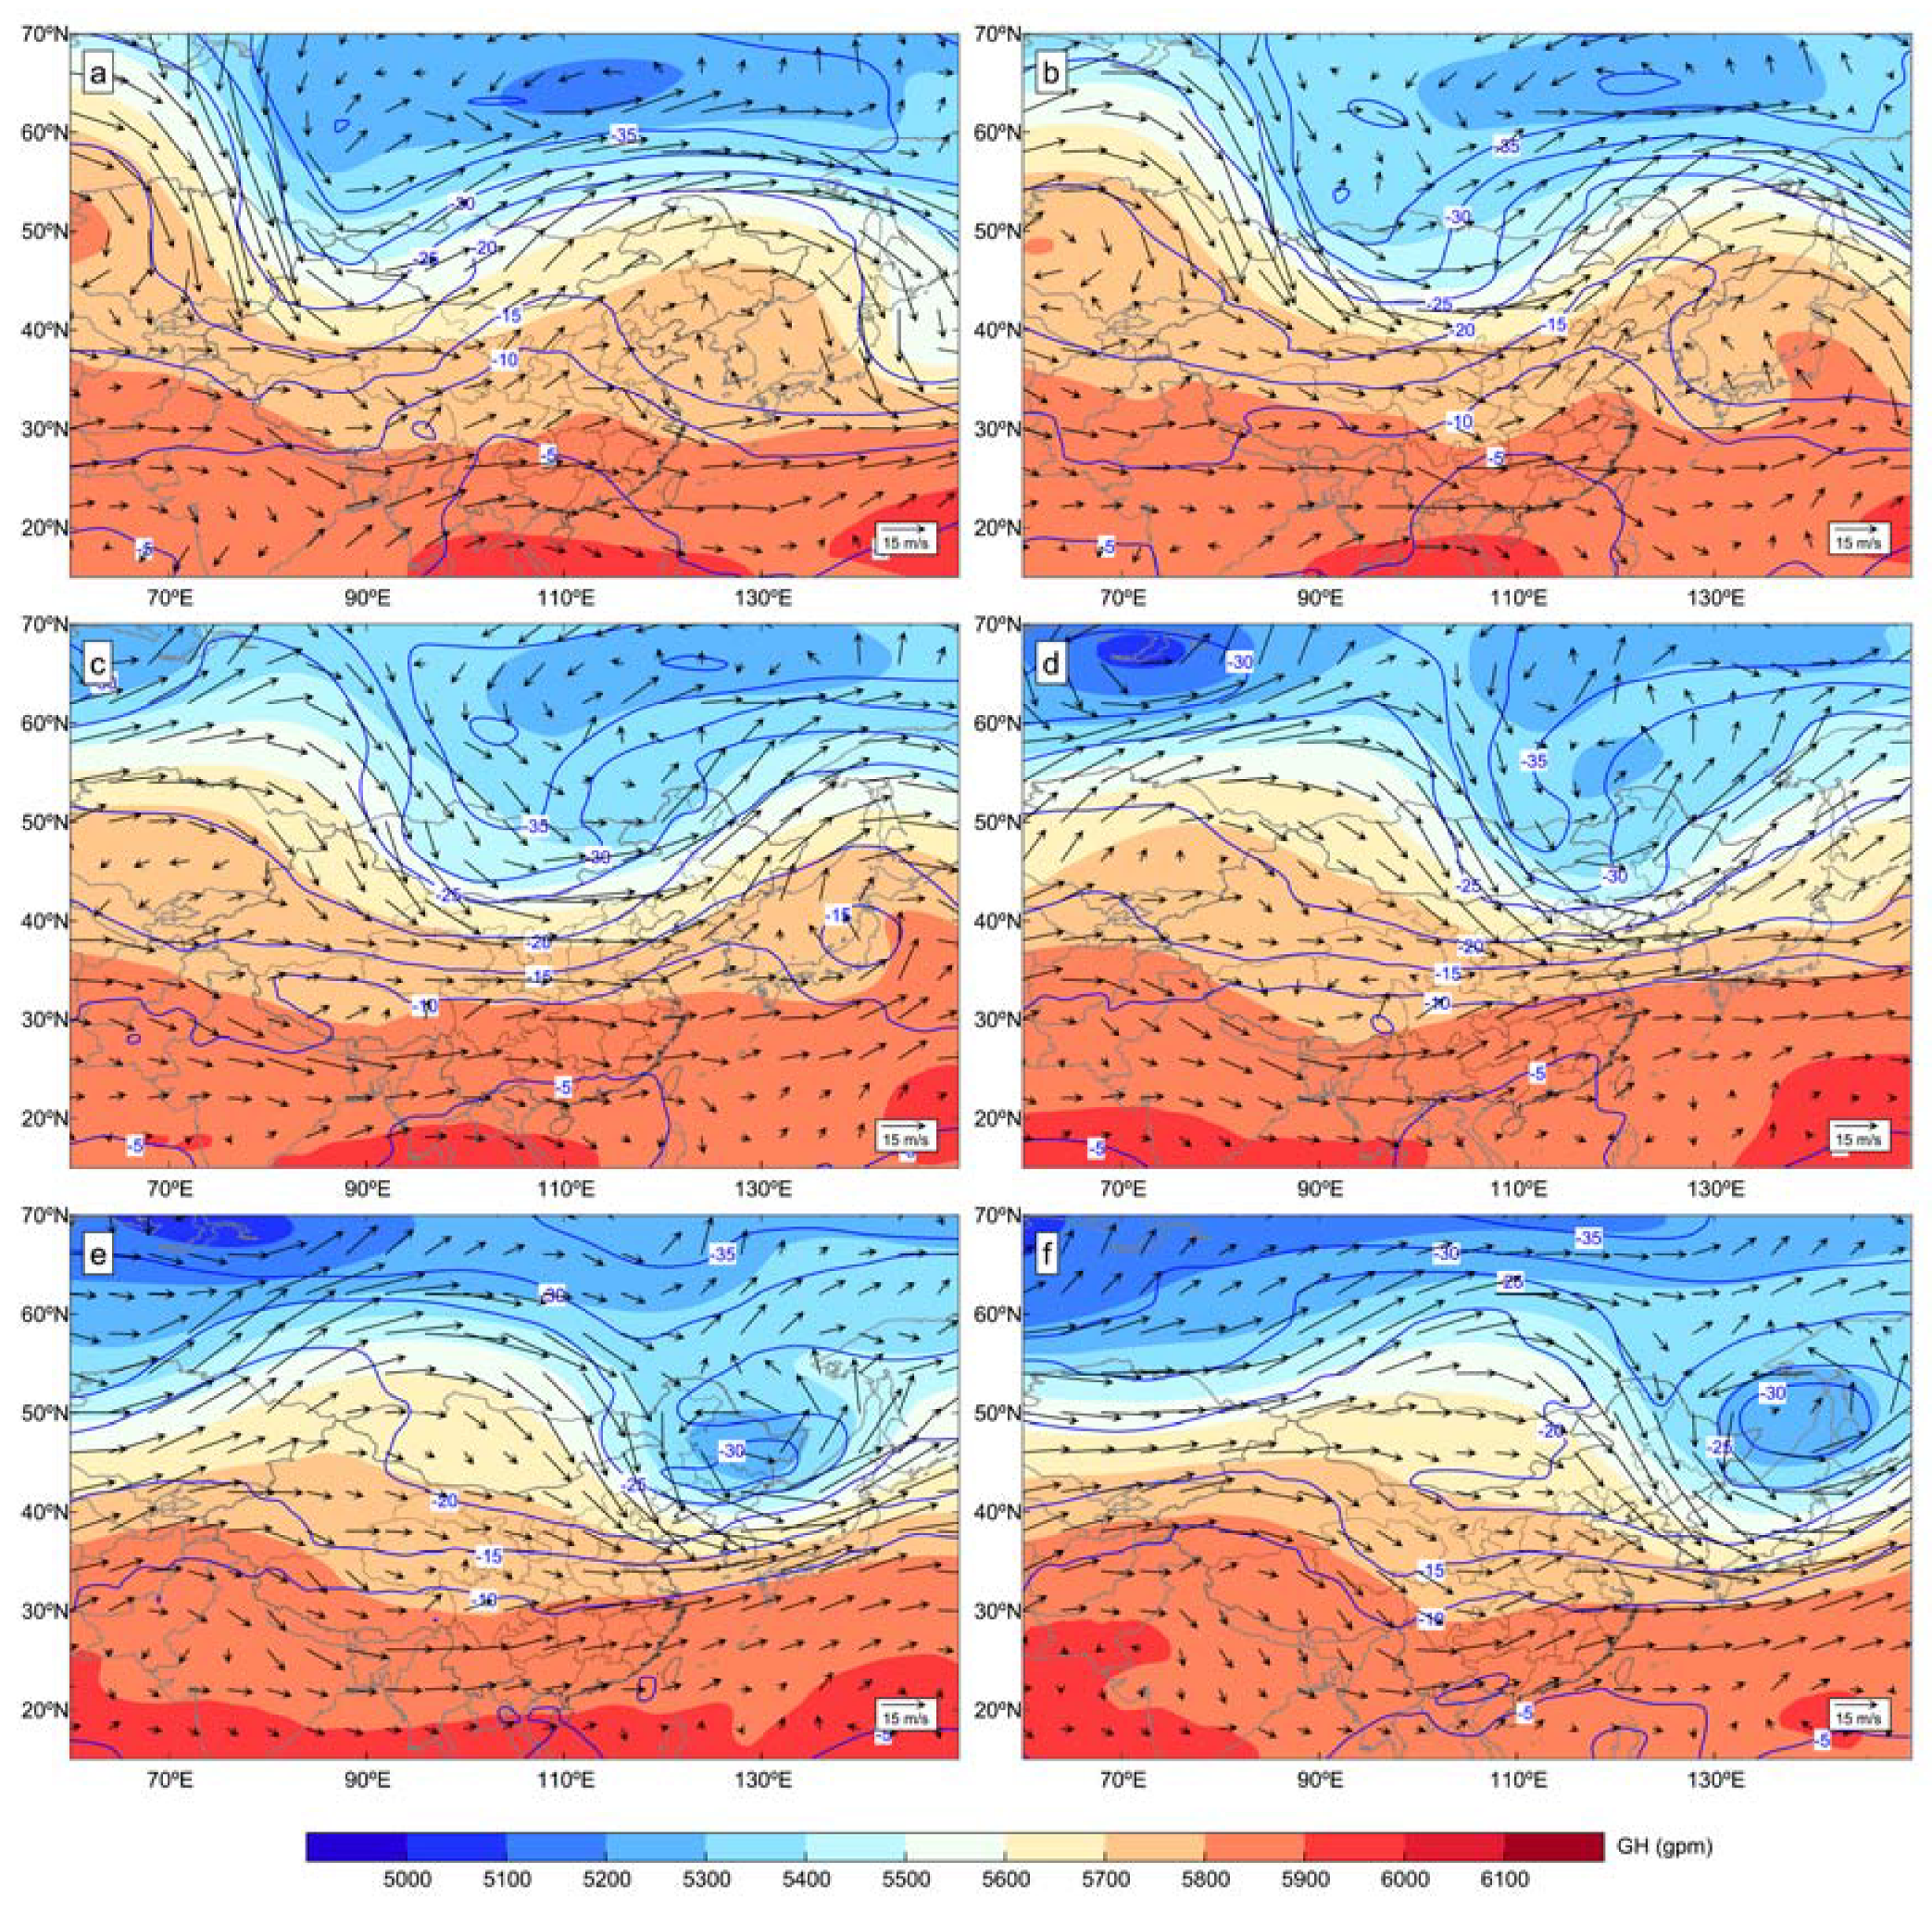
Under the influence of the overall westerly wind direction, the dust always shows a trend of eastward transport. There was a cold low-pressure trough at 500 hPa on 2 May 2017. The bottom of the trough extended to southern Xinjiang and there was a strong northwesterly wind behind the trough and a southwesterly wind in front of the trough. The strong wind in front of the trough drove the dust in the upper air to the east and north, affecting central and western Inner Mongolia and southern Mongolia. The low-pressure trough then developed and moved eastward. The wind in front of the trough affected Inner Mongolia on 3 May, continuing to transport the dust eastward. In combination with the emission and vertical transport of dust in the Gobi Desert on 3 May, this eastward movement further developed the scale of the dust event. The low-pressure trough continued to move east on 4–7 May, driving the transport of dust. The northwesterly wind behind the trough caused the high-altitude dust behind the trough to travel east and south, gradually affecting north, central, and south China. The eastern coastal areas were also affected with the development and movement of the trough and the dust. The southwesterly wind in front of the trough caused the dust to travel northeast, gradually affecting northeast China, Korea, and Japan and the adjacent ocean area (
Figure 10). The cold advection behind the trough was conducive to a sinking motion and deposition, whereas the warm advection in front of the trough was conducive to ascending motion and the uplift of dust.
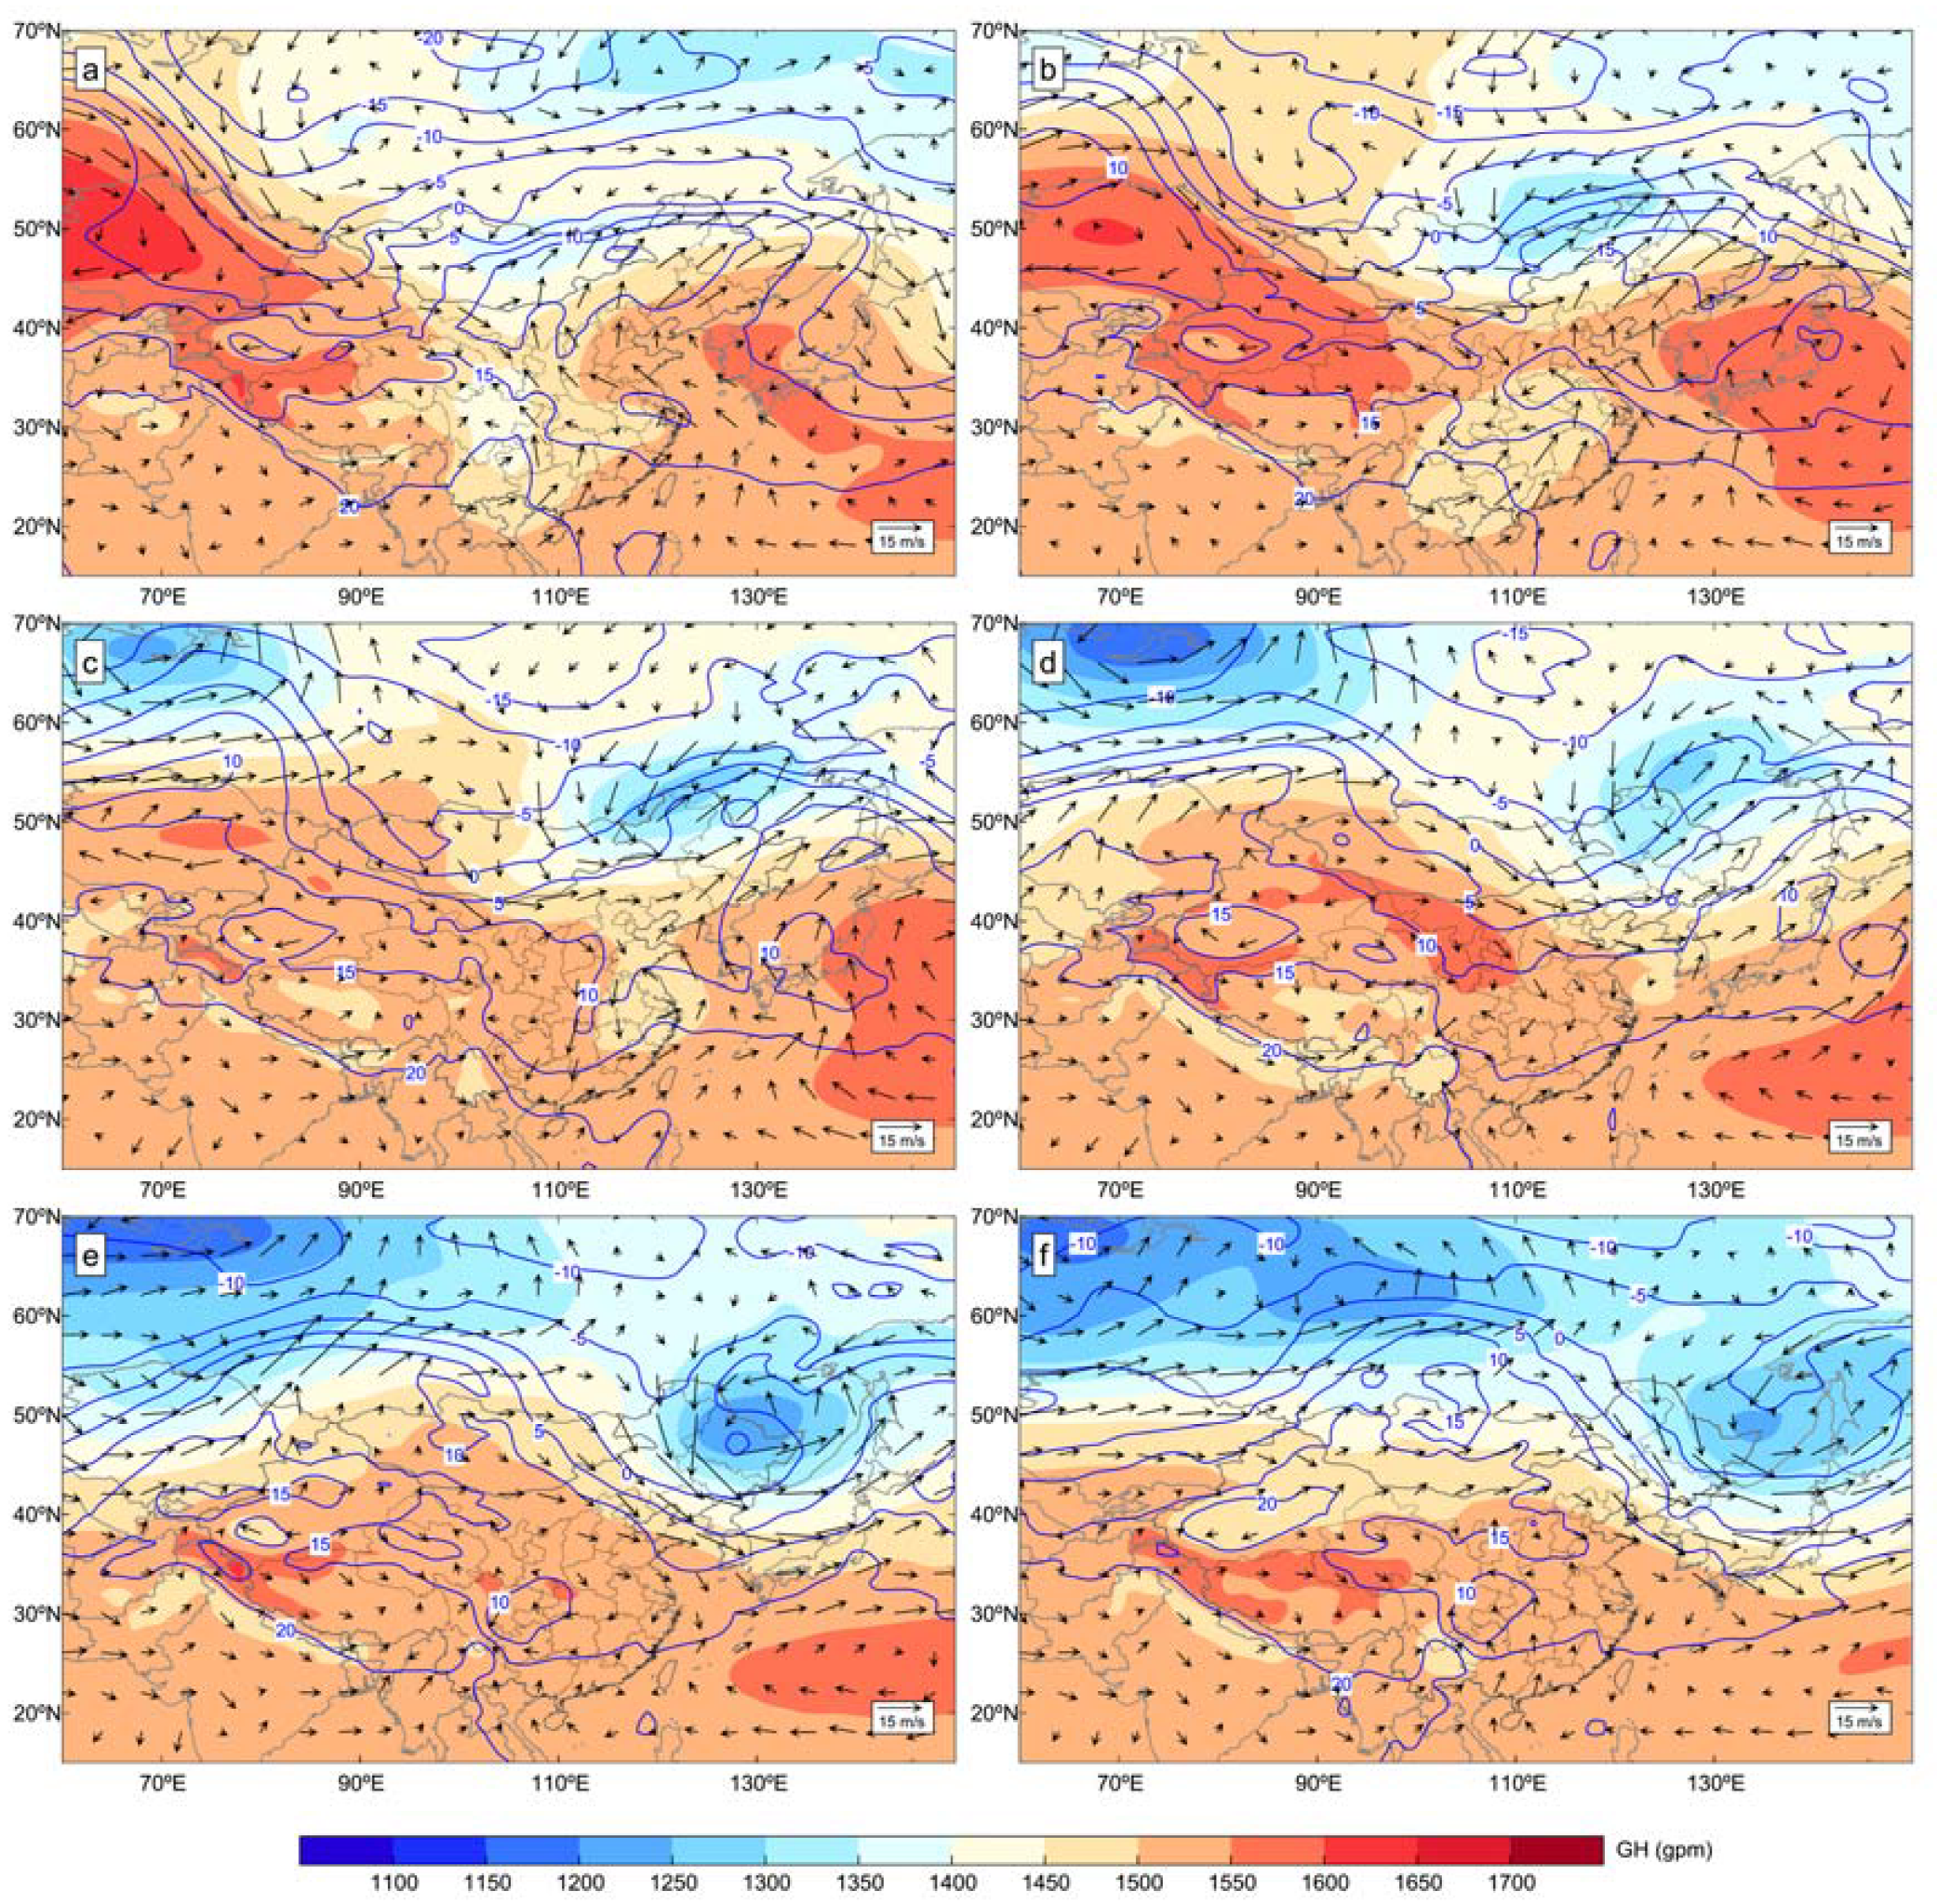
A cold low-pressure trough gradually developed and moved eastward at 850 hPa and the cold air moved southward, developing and strengthening the trough. The northwesterly wind was behind the trough and the southwesterly wind was in front of the trough. The overall wind direction transferred the dust to the east and the wind speed was less than that at 500 hPa. The northwesterly wind behind the trough transported the low-altitude dust from east to south, whereas the southwesterly wind in front of the trough transported the dust to the northeast, which had a great influence on the air quality (
Figure 11).
3.4. Dust Budget Analysis
As a result of the assimilation of various aerosol observations, the MERRA-2 data have many advantages in the estimation and analysis of the dust load, emission and deposition in severe dust events and is an effective tool for the quantitative estimation of the dust balance in extreme dust events [
39,
40,
41]. To understand the dust budget, we used the MERRA-2 reanalysis data to analyze the emission and the dry and wet deposition of dust in this dust event.
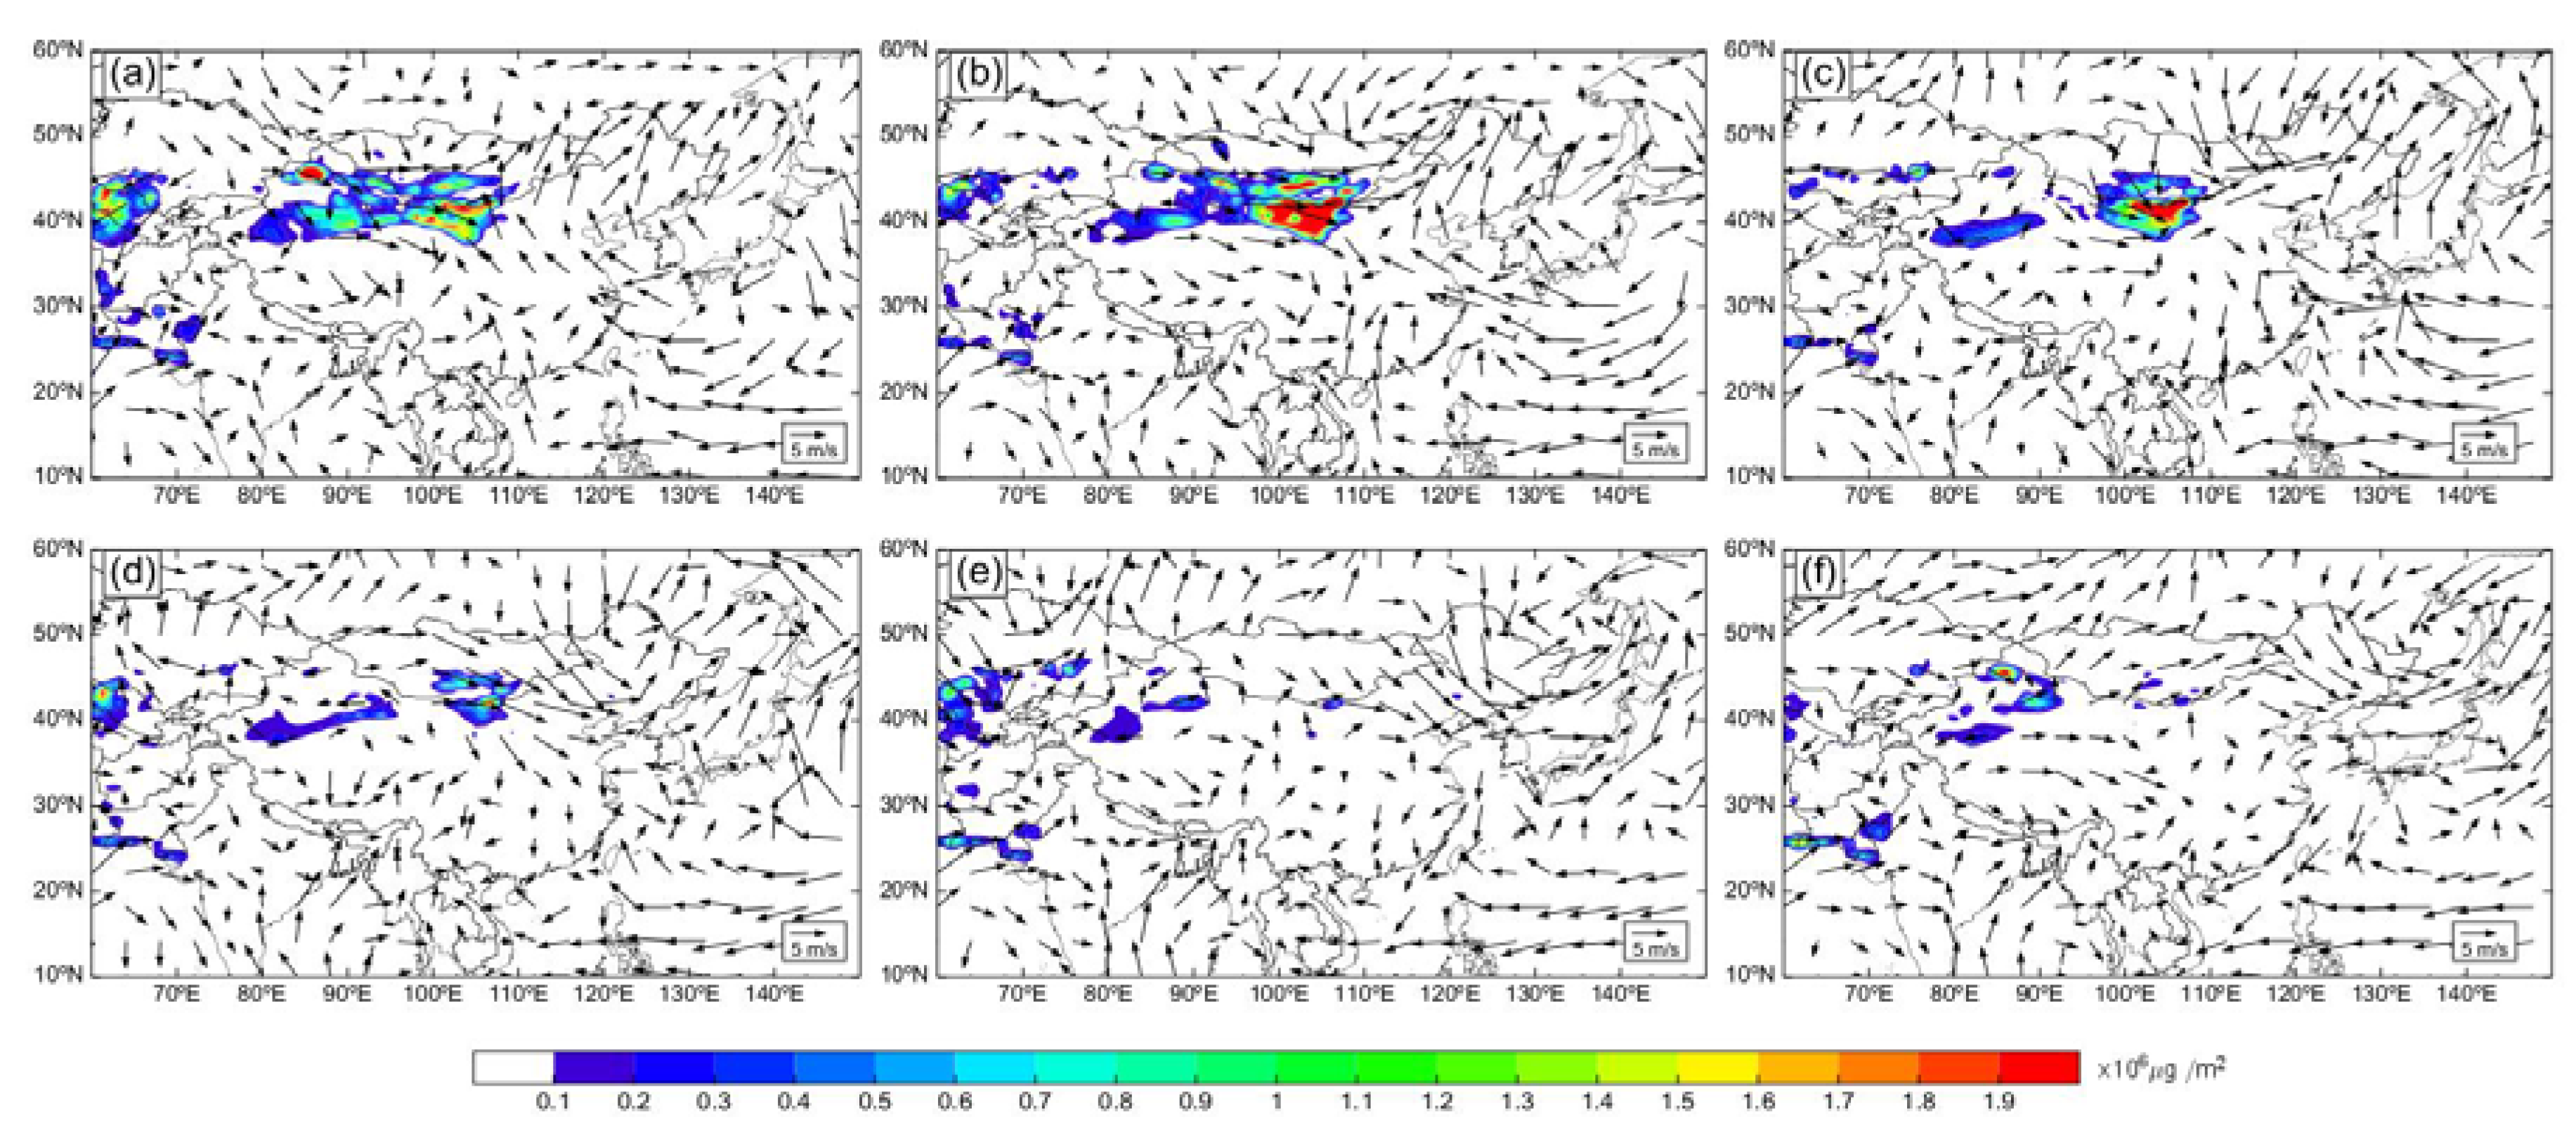
The main emission sources of the dust are the Taklimakan and Gobi deserts. The highest emission of dust was concentrated on 2–4 May and was mainly in the Gobi Desert, with the maximum value reaching 1.9 × 10
6 μg/m
3 (
Figure 12). The emission of dust in the Taklimakan Desert was also high on 2 May, with the maximum value reaching 1.8 × 10
6 μg/m
3. There was a small amount of dust emission from the Gobi Desert on 5 May, which affected the dust event. The Taklimakan Desert released a small amount of dust on 3–6 May, but, as a result of the unfavorable terrain of the basin and the prevailing easterly wind, the emission only affected the surrounding areas and was difficult to transport eastward [
6,
42]. A comparison of the mixing ratios of different particle sizes in the dust process indicated that the effective radius of dust emitted in this process was mainly 1.4–2.4 μm (
Figure S4–S8). Kenji Kai et al. (2019) found the dust emission in the Khorchin sandy land during the dust event by analyzing both the data and Himawari-8 Dust RGB imagery [
24], but the MERRA-2 data did not capture the emission process. Although the MERRA-2 dataset could capture the characteristics of the event, it was still insufficient for the emission of dust.
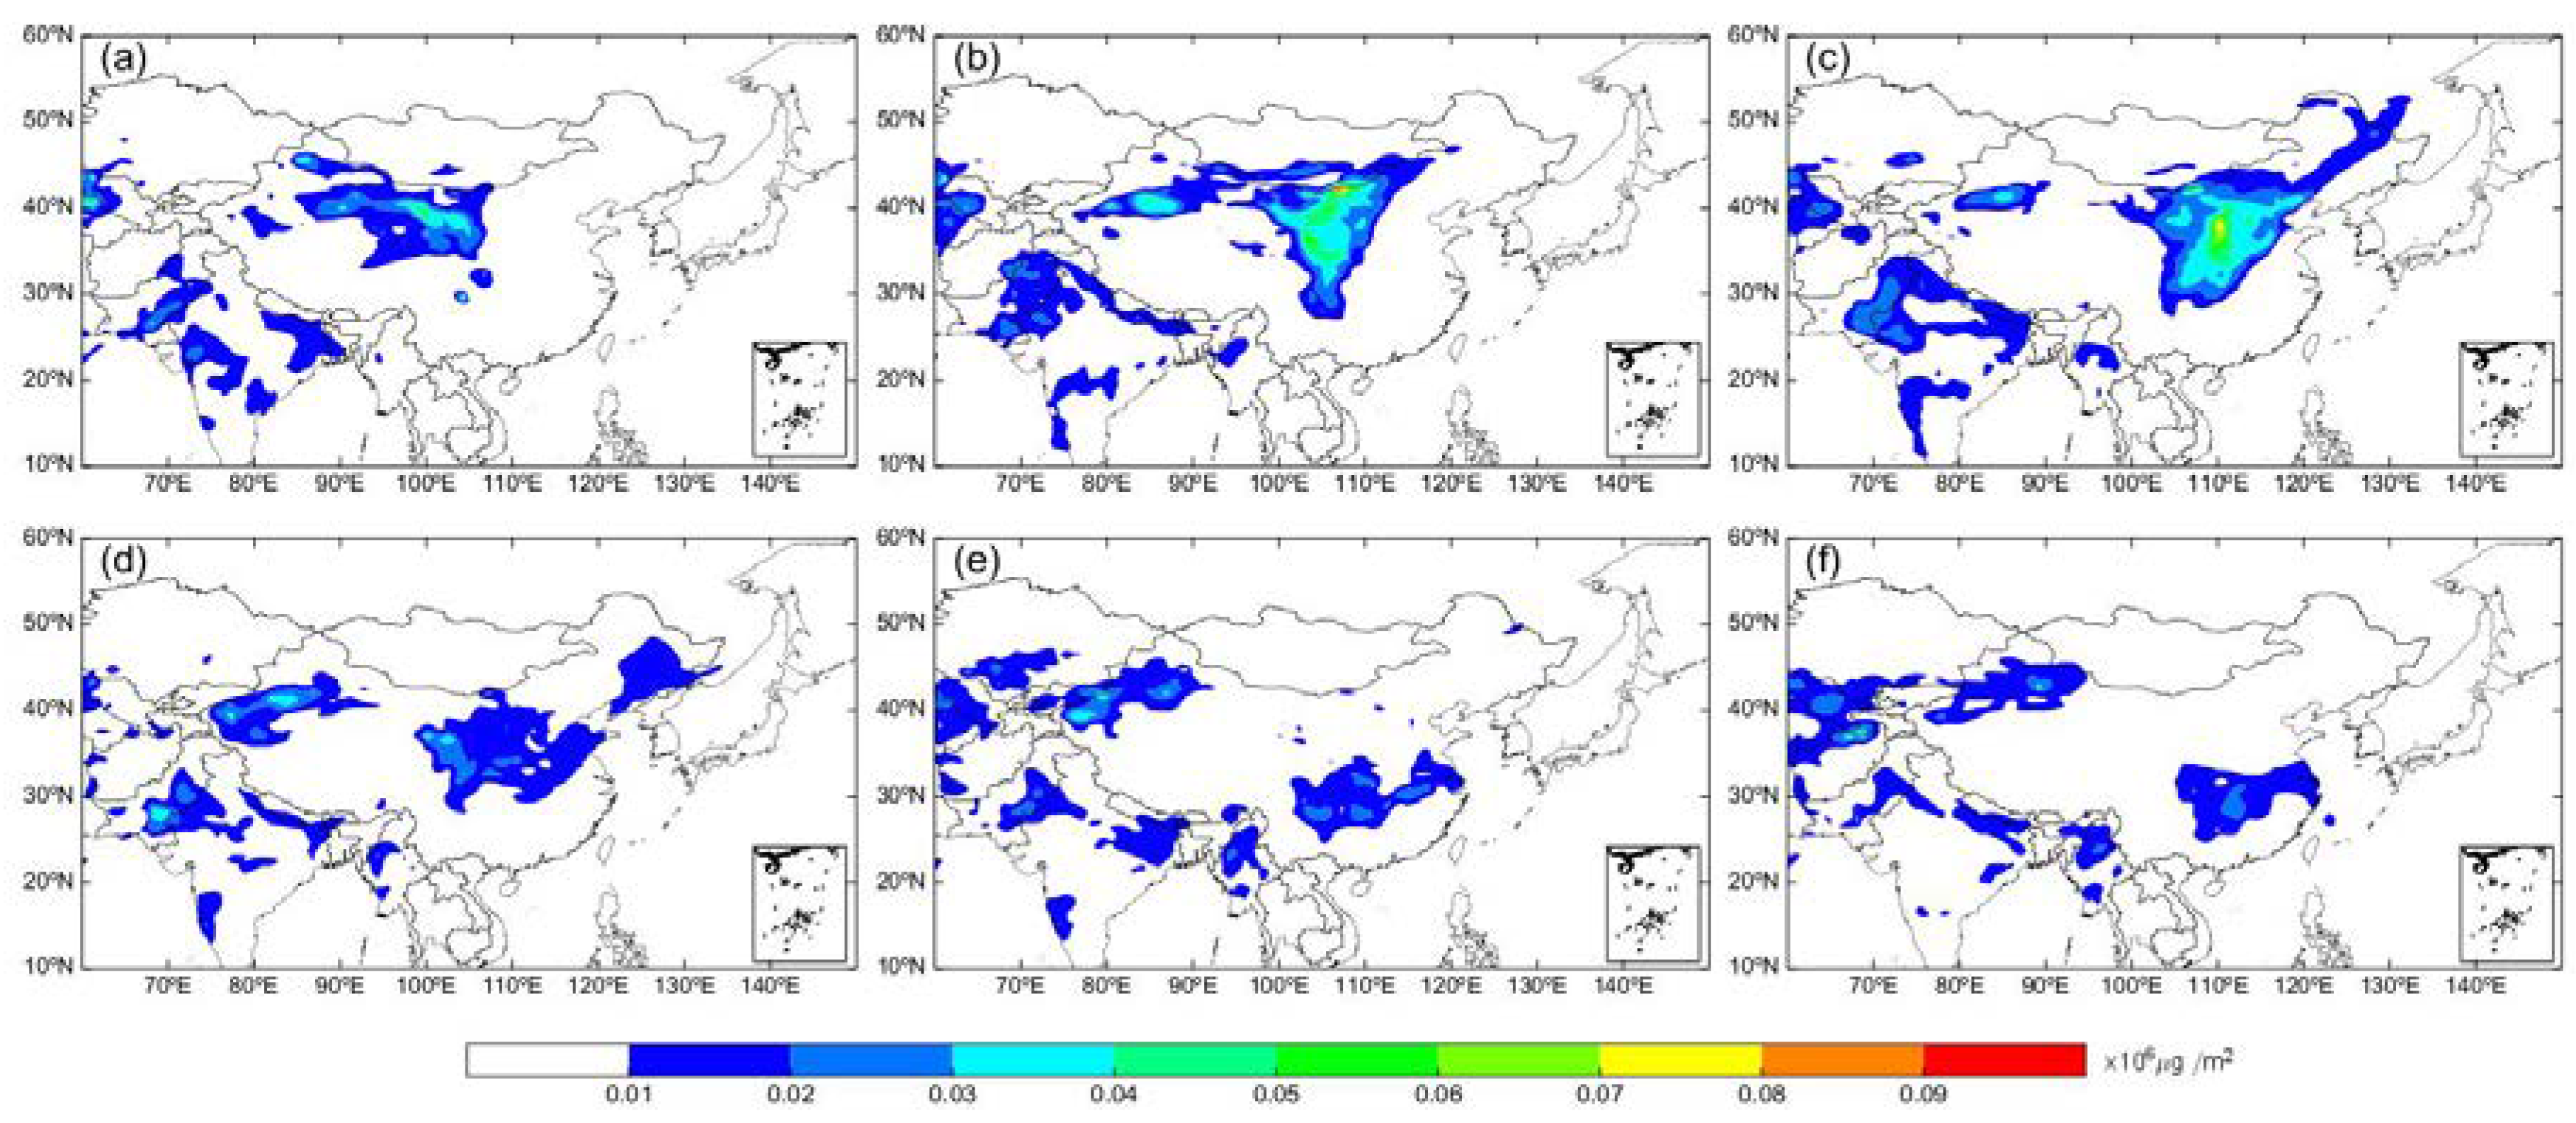
The large-value area of dry deposition of dust is consistent with the transport and area of influence of dust. On 2–5 May, the deposition of dust mainly occurred in the Taklimakan Desert and the western part of Inner Mongolia, the Gobi Desert, north China, central China, south China, northeast and east China, and the eastern coast. There was a maximum deposition of 9 × 10
4 μg/m
3 on 3 and 4 May. Dry deposition on 6 and 7 May mainly occurred in the Taklimakan Desert and south China (
Figure 13).
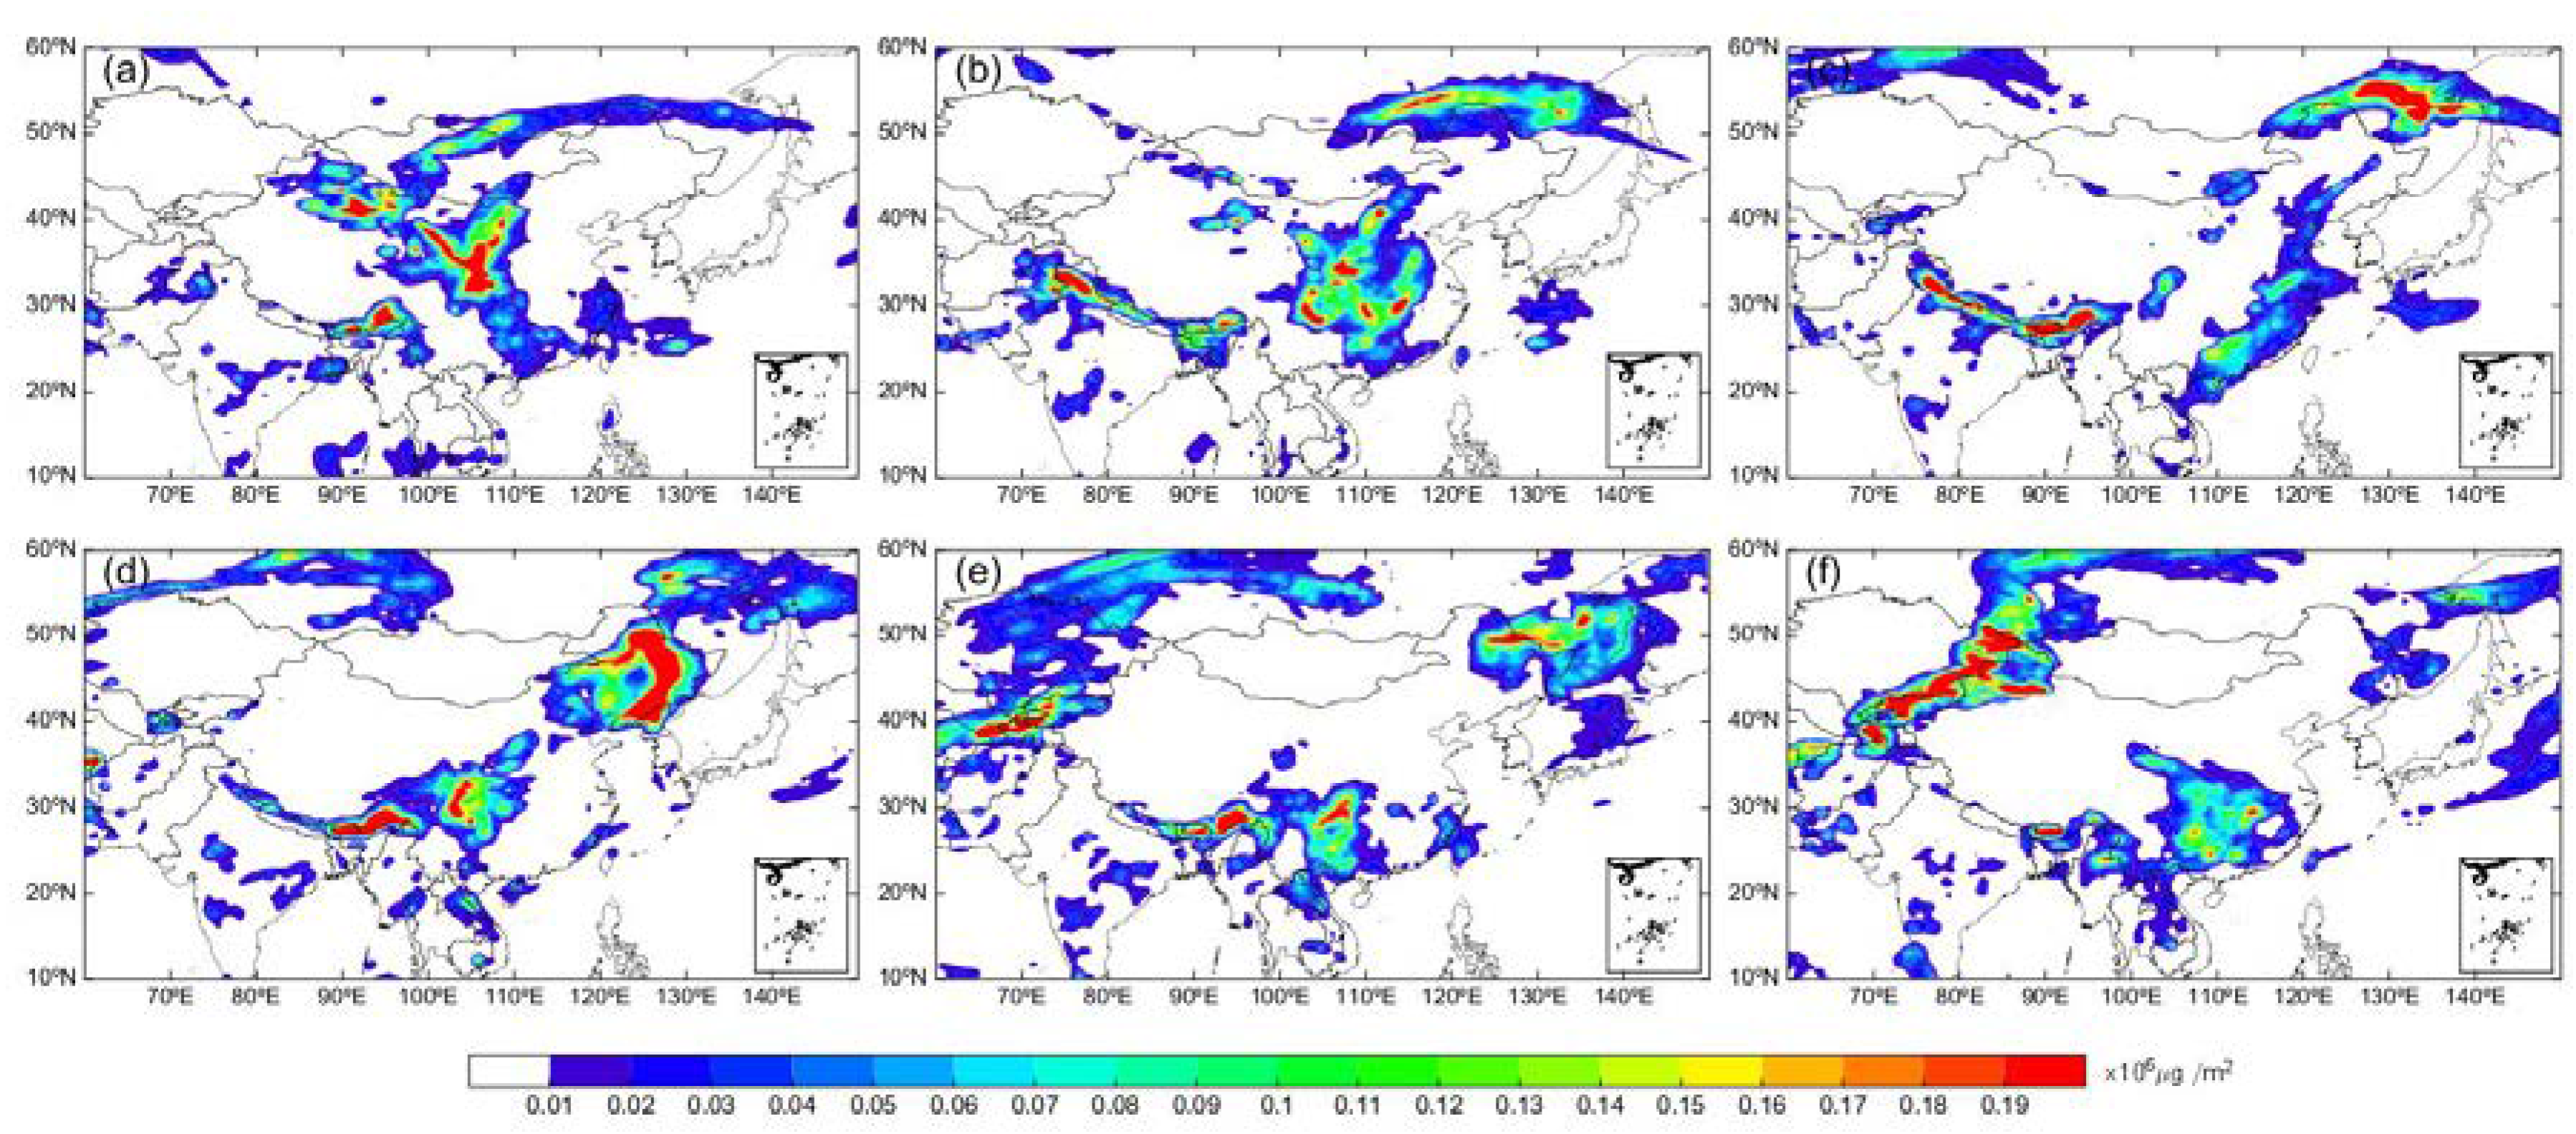
In contrast with the dry deposition, wet deposition was larger in magnitude and occurred in most areas. Wet deposition occurred on 2–7 May in the Taklimakan Desert, western Inner Mongolia, the Gobi Desert, north China, central China, east China, south China, northeast China, the southeast coast, Japan, and the adjacent sea areas. Among the affected areas of this event, the high value areas of high wet deposition are distributed in northwest China, north China, and central China on 2 May. There were high-value areas in central and eastern China on 3 May, a small amount of wet deposition in northeast and central China on 4 May, high-value areas in northeast China on 5 and 6 May, areas of wet deposition in the ocean and Japan on 6 May and a high-value area in the central and southeastern coastal areas on 7 May, with the highest value reaching 2 × 10
5 μg/m
3 (
Figure 14).
4. Conclusions
We used MERRA-2 reanalysis data, ground-based data, and satellite observational data to analyze the strong dust event that occurred in east Asia on 2–7 May 2017. We evaluated the accuracy of the MERRA-2 reanalysis data in the simulation of the dust event, analyzed the spatiotemporal distribution, vertical evolution and background circulation conditions of the dust aerosols, and considered the dust budget.
The Taklimakan and Gobi deserts were the two sources of dust in this event, with the Gobi Desert as the main source area. Although there were multiple emissions from the Taklimakan Desert, the dust was rarely transported and did not affect other areas after 2 May. Most of the dust from the Taklimakan Desert was deposited during transport. The emission of dust from the Gobi Desert on 3–5 May increased the intensity and scale of the dust event, which affected most of China, Korea, Japan and adjacent sea areas, for up to six days. The results of comparison show that the description of the spatiotemporal distribution and evolution of the dust aerosols in the dust event using the MERRA-2 model is consistent with the data of AERONET, National Urban Air Quality Real-time Publishing Platform and Hamawari-8.
Analysis of the atmospheric circulation showed that the transport of dust was mainly affected by the low-pressure trough at 500 and 850 hPa and the vertical movement of the atmosphere. The dust was high-altitude long-distance transported, with a vertical influence range up to 10 km in the upper atmosphere. There were always better conditions for vertical transport in the area affected by dust and the vertical motion of the atmosphere transported dust to altitudes >500 hPa. There was a low-pressure trough at 500 and 850 hPa and this trough continued to develop eastward. The northwesterly wind behind the trough and the southwesterly wind in front of the trough drove the dust behind the trough to move eastward and southward and the dust in front of the trough to move northeast. The dust from the ground to the upper atmosphere continued to travel east, south, and northeast, affected northwest China, north China, northeast China, the southeastern coast, the ocean and Japan in turn.
Dust was deposited in the Taklimakan Desert and western Inner Mongolia, the Gobi Desert, north China, central China, south China, northeast China and east China, as well as on the eastern coast. Dry deposition on 6 and 7 May mainly occurred in the Taklimakan Desert and south China. There was a maximum deposition of 9 × 10⁴ μg/m3 on 3 and 4 May. The wet deposition was larger in magnitude and occurred more widely than the dry deposition. Among the affected areas of this event, the high value areas of high wet deposition are distributed in northwest China, north China, and central China on 2 May. There were high-value areas in central and eastern China on 3 May, a small amount of wet deposition in northeast and central China on 4 May, high-value areas in northeast China on 5 and 6 May, areas of wet deposition in the ocean and Japan on 6 May and a high-value area in the central and southeastern coastal areas on 7 May, with the highest value reaching 2 × 10⁵ μg/m3. The MERRA-2 data did not capture the dust emission in the Khorchin area during this event, which indicates that the emission source of the MERRA-2 model was uncertain and needs to be improved.
The comparison with satellite and ground-based observational data indicates that the MERRA-2 model can accurately reproduce the dust evolution process, including the spatial distribution and three-dimensional vertical distribution of dust aerosols. Although there are a few inadequacies in the accuracy of the data (such as the uncertainty about the dust source) in MERRA-2 reanalysis data, it has a three-dimensional perspective and comprehensive data, which can describe the evolution of dust events, reproduce the dust process. The MERRA-2 data can be used to analyze dust events comprehensively from the three-dimensional spatiotemporal distribution characteristics, circulation driving factors and dust budget. But the accuracy of the MERRA-2 data in simulating the long-term evolution of dust aerosols requires further evaluation.


