A Study of Lunar Microwave Radiation Based on Satellite Observations


1
Cooperative Institute for Satellite Earth System Studies (CISESS), University of Maryland, 5825 University Research Court, Suite 4001, College Park, MD 20740-3823, USA
2
Faculty of Mathematics, Informatics and Natural Sciences, Department of Earth Sciences, Meteorological Institute, Universität Hamburg, Bundesstraße 55, 20146 Hamburg, Germany
*
Author to whom correspondence should be addressed.
Remote Sens. 2020, 12(7), 1129; https://0-doi-org.brum.beds.ac.uk/10.3390/rs12071129
Submission received: 7 February 2020
/
Revised: 19 March 2020
/
Accepted: 26 March 2020
/
Published: 2 April 2020
(This article belongs to the Special Issue The Needs and Path Toward an SI-Traceable Space-based Climate Observing System)
Abstract
:In recent years, the study of microwave radiation from the Moon’s surface has been of interest to the astronomy and remote sensing communities. Due to the stable geophysical properties of the Moon’s surface, microwave lunar radiation is highly predictable and can be accurately modeled, given sufficient observations from reliable instruments. Specifically, for microwave remote sensing study, if International System of Unit (SI) traceable observations of the Moon are available, the Moon can thus be used as an SI traceable calibration reference for microwave instruments to evaluate their calibration accuracies and assess their long-term calibration stabilities. Major challenges of using the Moon as a radiometric source standard for microwave sensors include the uncertainties in antenna pattern measurements, the reliability of measurements of brightness temperature (Tb) in the microwave spectrum of the lunar surface, and knowledge of the lunar phase lag because of penetration depths at different detection frequencies. Most microwave-sounding instruments can collect lunar radiation data from space-view observations during so-called lunar intrusion events that usually occur several days each month. Addressed in this work based on Moon observations from the Advanced Technology Microwave Sounder and the Advanced Microwave Sounding Unit/Microwave Humidity Sounder are two major issues in lunar calibration: the lunar surface microwave Tb spectrum and phase lag. The scientific objective of this study is to present our most recent progress on the study of lunar microwave radiation based on satellite observations. Reported here are the lunar microwave Tb spectrum and phase lag from 23 to 183 GHz based on observations of microwave-sounding instruments onboard different satellite platforms. For current Moon microwave radiation research, this study can help toward better understanding lunar microwave radiation features over a wide spectrum range, laying a solid foundation for future lunar microwave calibration efforts.
1. Introduction
Lunar radiation is highly stable in the microwave spectrum because of the stable geophysical properties of the Moon’s surface. Therefore, the Moon can be used as an International System of Unit SI traceable calibration reference for microwave instruments to evaluate the calibration accuracy and assess the long-term calibration stability. Major challenges of using the Moon as a radiometric standard source for microwave sensors include the reliability of measurements of the microwave brightness temperature (Tb) spectrum of the lunar surface and knowledge of the lunar phase lag because of penetration depths at different detection frequencies.
Recent years have seen extensive research on studying thermal emission from the Moon [1,2,3,4,5,6,7,8]. Observations from the Diviner Lunar Radiometer Experiment (DLRE) instrument onboard the Lunar Reconnaissance Orbiter revealed a strong diurnal variation in the lunar surface temperature ranging from 95 K to 397 K [9]. The lunar surface temperature varies with latitude and phase angle (φ), reaching a maximum at φ = 0° and a minimum at φ = 180°. Microwave radiation can penetrate the lunar sub-surface, so microwave thermal emission in terms of Tb can be different from the skin temperature. Previous studies have shown that due to the special structure of the Moon’s surface and the penetration characteristics of microwave radiation, the maximum microwave emission from the Moon typically lags behind the maximum temperature when the Moon is full. The lag angle depends on the ratio of the physical thickness of the emission layer to the penetration depth [10]. From ground-based microwave radiometer observations made at the 1.25 cm wavelength (24 GHz), Piddington and Minnett [11] observed a 45° phase lag of microwave Tb behind the Moon’s surface temperature. Recent observations from the Chinese Chang’E moon-orbit microwave radiometer (MRM) show a 30° phase lag in 37 GHz Tbs [12]. Observations and experiments after the Apollo missions have revealed that the lunar surface consists of a series of layers of material ejected from individual meteorite craters over a period of time, embedded lava flows, and pyroclastic deposits. By studying Apollo 15 and 17 heat flow experimental data, Montopoli et al. [13,14] reported that there is a big drop in temperature of about 100 K within the upper lunar regolith of a few centimeters. It is now widely accepted that the lunar subsurface composition is composed of three homogeneous media: regolith with depths extending from several meters to tens of meters, and rock and ice located at different depths beneath the surface. For lunar calibration of a microwave instrument, accurate knowledge and modeling of the lunar Tb spectrum covering a wide range of detection frequencies are fundamental and of interest to the microwave radiometer calibration community. In the studies by Montopoli et al. [13,14] and Keihm [15], an incoherent model assumed that the volume scattering contribution was negligible with respect to that due to absorption of simulated lunar microwave emissions. In the equatorial region of the Moon, the near-surface temperature varies greatly from 100 K to 350 K, then stabilizes as the depth increases to over 5 meters [13,14]. In recent years, with the launch of lunar-orbiting satellites, the global distribution of lunar geophysical parameters can be derived from different instruments [16,17]. Hence it is possible to obtain the lunar surface temperature profile by solving the lunar surface heating conduction equation with more realistic model input parameters and boundary conditions, thereby making simulated microwave Tbs more accurate. Based on lunar surface geophysical parameters derived from satellite observations, including the bulk density, thermal and dielectric profiles, and heat conduction, microwave Tbs at millimeter and submillimeter wavelengths were simulated using lunar regolith temperature profiles derived from DLRE lunar surface temperatures by solving the heating conduction equation using the finite-difference time-domain method [18,19]. Their simulation results show that Tbs at 55 GHz vary from a low of 207 K to a high of 275 K at the center of the lunar surface. Tbs at 425 GHz vary from 141 K to 334 K.
Satellite-based lunar observations are valuable because of the high accuracy and stability of spaceborne microwave instruments. Unlike ground-based observations, spaceborne microwave radiometers can cover a wide range of frequencies and experience less contamination from their surroundings. In the most recent studies by Yang et al. [20,21] and Burgdorf et al. [22,23], well-calibrated satellite observations were used to derive the lunar microwave Tb spectrum from 23 GHz to 183 GHz. Their results show that the maximum lunar disk-integrated Tb varies from 270 K at 23 GHz to 300 K at 183 GHz. The phase lag also changes from 40° at 23 GHz to 12° at 183 GHz.
In this paper, studies of satellite-based retrievals of lunar microwave Tb and phase lag are presented based on a review of the most recent research results. Section 2 summarizes satellite observations for the lunar surface microwave Tb spectrum. Section 3 presents retrieval results for the lunar phase lag at microwave frequencies. Section 4 discusses the uncertainties in model-simulated and satellite-observed lunar Tbs. Section 5 gives conclusions and outlines future plans.
2. Lunar Microwave Tb Derived from Satellite Observations
2.1. General Description of Satellite Lunar Microwave Tb Retrieval Algorithms
Direct spaceborne observations with high spatial resolutions, giving the microwave Tbs of the lunar surface, are limited due to the lack of microwave radiometers on lunar orbit. At present, the only available lunar microwave Tb observation dataset is from the Chinese Chang’E MRM, which operates at 3, 7.8, 19.35, and 37 GHz to obtain lunar surface Tbs at a resolution of 25 and 17 km. The calibration accuracy is claimed to be less than 0.5 K over the temperature range of 100 to 350 K [24]. For most climate applications, the detection frequency needs to be extended to as high as 183 GHz, making the observations from Chang’E less useful. In recent years, Yang et al. [20,21] and Burgdorf et al. [22,23] have explored a method of retrieving lunar-disk-integrated microwave Tbs from the space-view observations of microwave-sounding instruments onboard weather satellites. The basic idea is that during lunar intrusion (LI) events, when the Moon appears in the satellite observation field of view, the effective microwave radiance of the Moon’s disk, , can be derived from the receiver output counts difference between the clean space view and the space view with LI [20]:
where G is the instrument calibration gain, and ΔR is the difference between and the cosmic background microwave radiance :
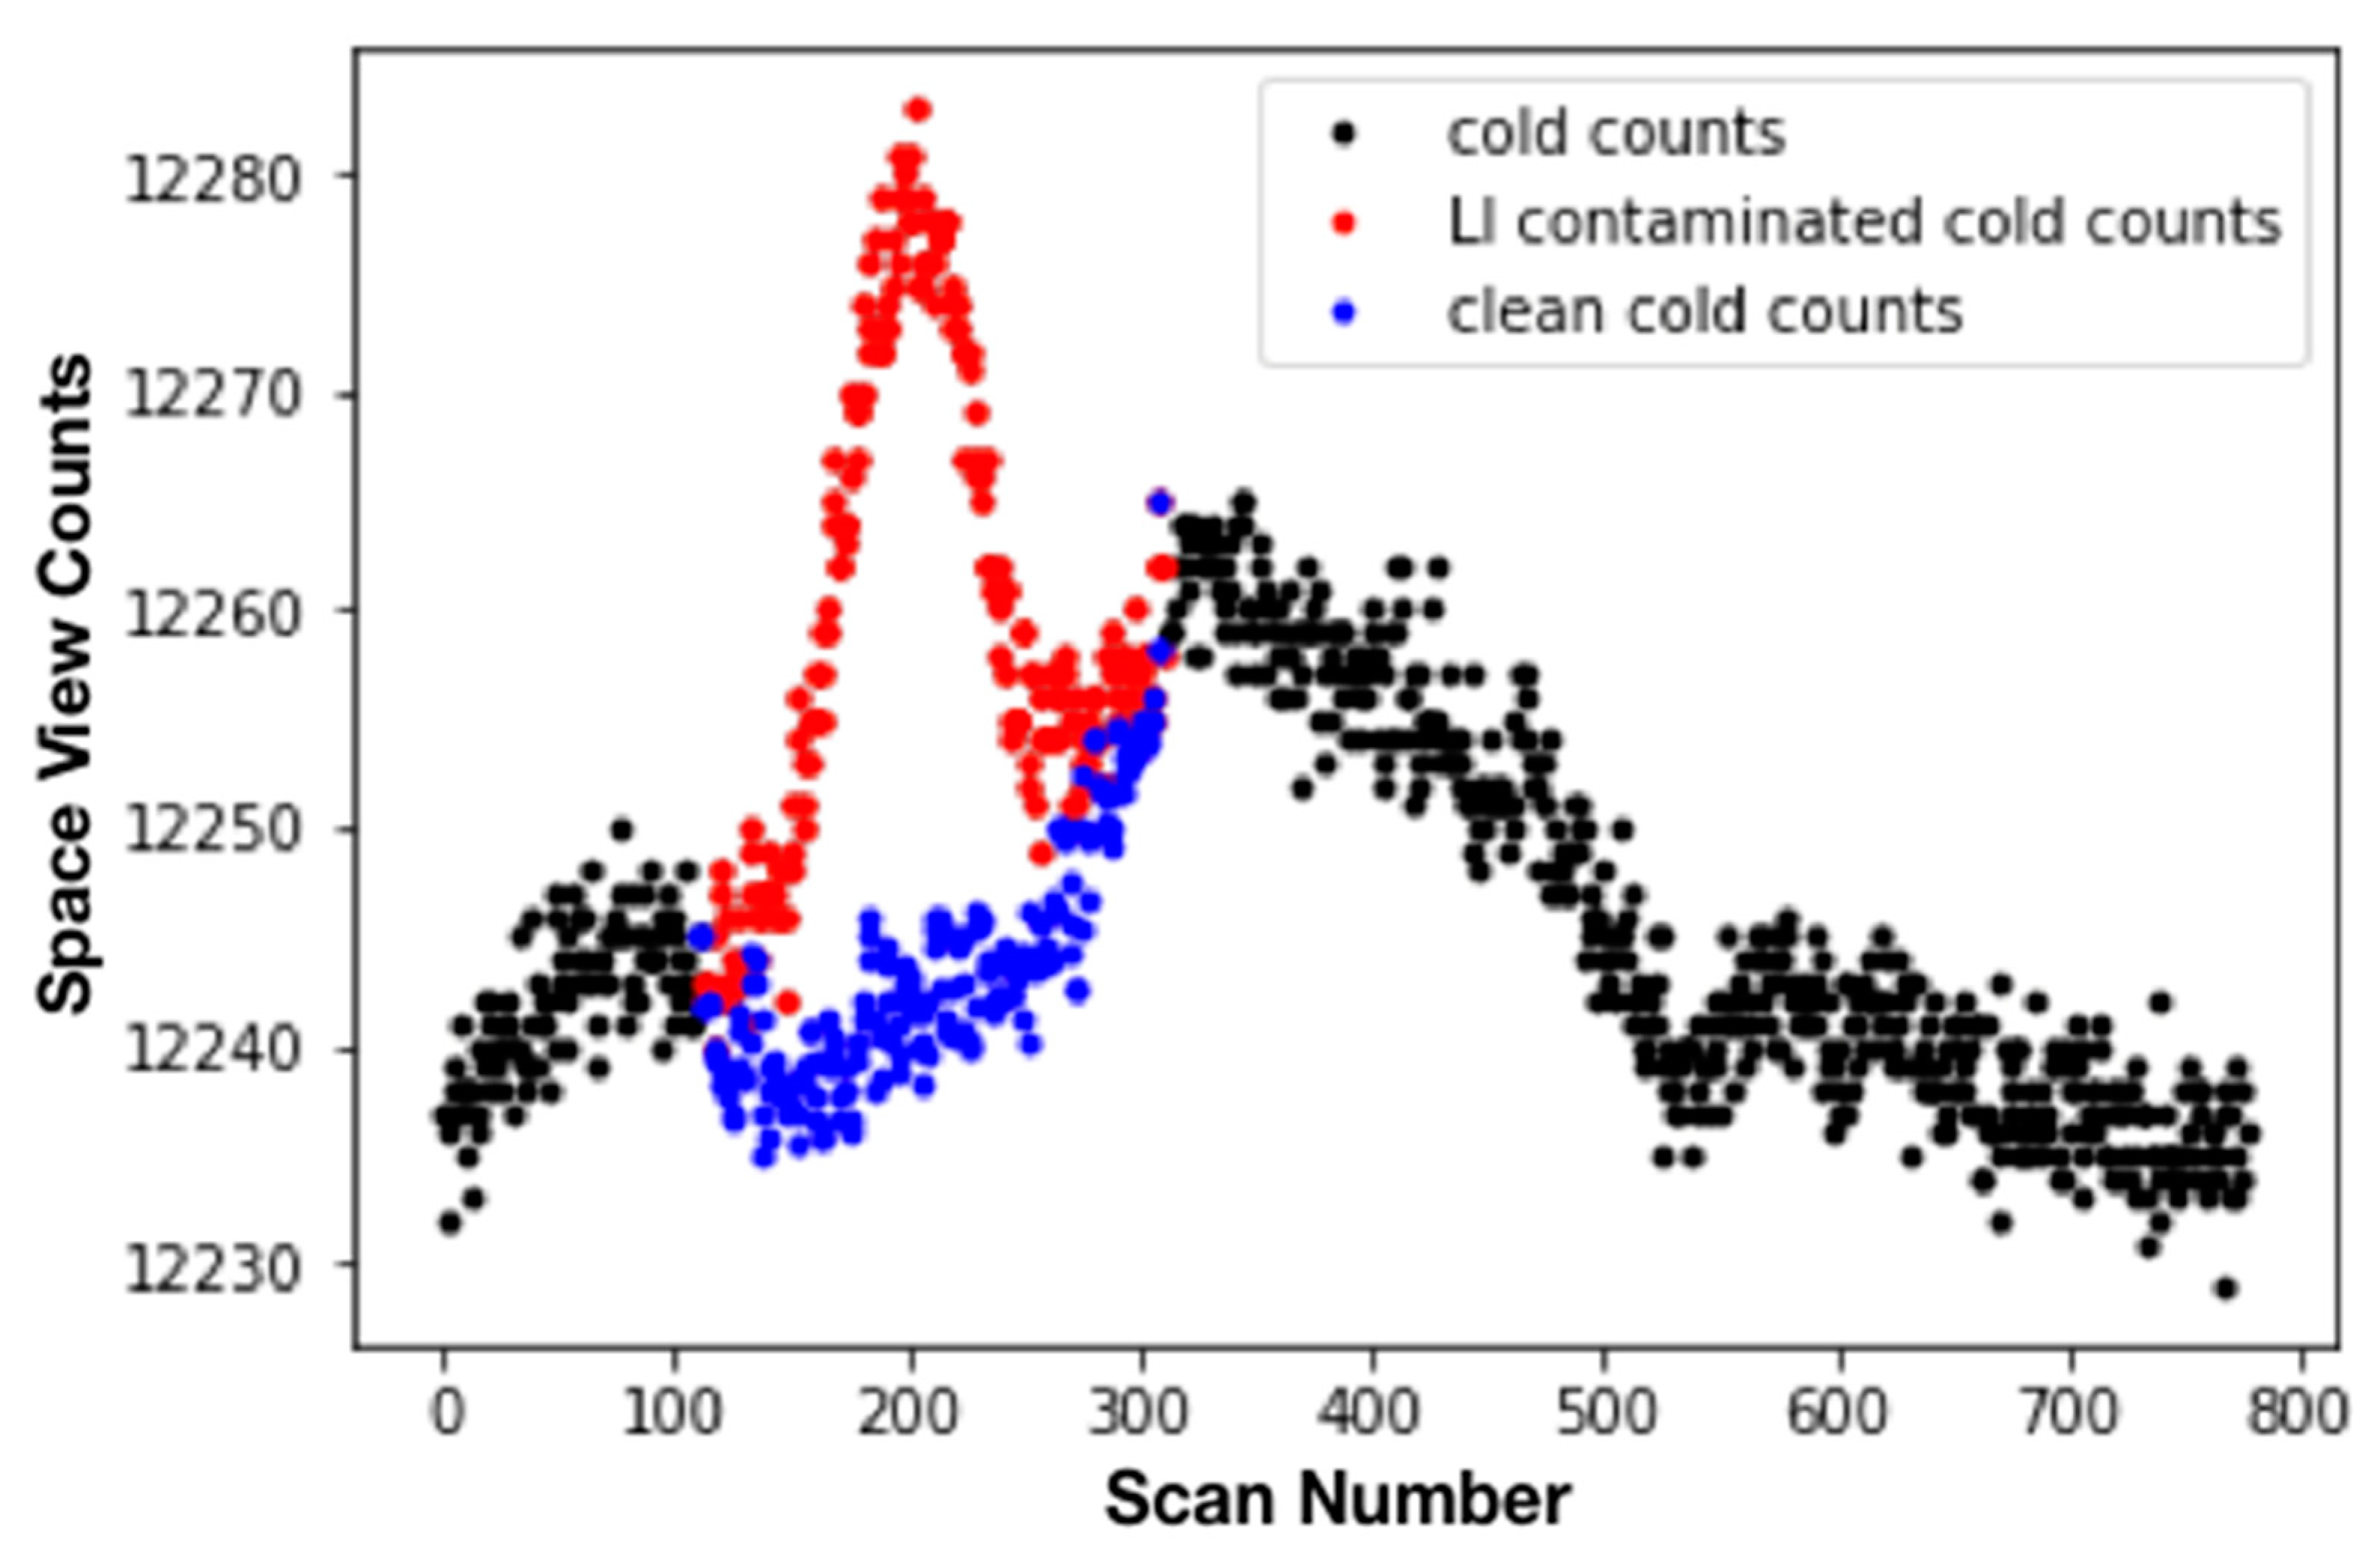
Figure 1 shows a typical case of lunar observation samples identified from space-view counts during an LI event when the Advanced Microwave Sounding Unit-A (AMSU-A) instrument was making deep-space observations. While onboard warm-load and clean cosmic-background observations determine the instrument gain, Equations (1) and (2) can be used to derive . Conversely, if lunar radiance is known, the instrument calibration gain can also be determined from Equation (1).
For most weather satellites with an orbital altitude of ~830 km, the apparent angle of the lunar disk is ~0.55°, which is much smaller than the antenna beam width. In this case, the effective lunar disk radiance can be expressed as a function of the antenna response Gant, the normalized solid angle of the Moon Ωmoon, and the average disk-integrated lunar radiance as follows [20,25]:
The antenna solid angle Ωp and antenna gain term Gant on the right side of Equation (3) are instrument-related parameters that do not change over time after the instrument is in orbit. The lunar solid angle term Ωmoon slightly depends on the position of the satellite in the orbital plane, which is highly predictable. Burgdorf et al. [23] showed that the term could be determined by performing an analytical integration of the Gaussian function over the lunar disk when the Moon passes through the center of the antenna beam, i.e.,
where is the beam efficiency, is the apparent angle of the Moon, and FWHM is the full width at half maximum of the antenna beam (see Appendix A). Therefore, once the effective lunar radiance is known from calibrated lunar observations, the lunar disk-integrated radiance can be determined from Equation (3).
2.2. Retrieval of the Lunar Microwave Tb Spectrum from NOAA-20 ATMS 2D Raster Scans of the Moon’s Disk
NOAA-20 is the follow-on satellite program of the Suomi National Polar-orbiting Partnership (SNPP) operated by National Oceanic and Atmospheric Administration(NOAA), successfully launched on 18 November 2017. The Advanced Technology Microwave Sounder (ATMS) onboard NOAA-20 is a 22 channel passive microwave radiometer with frequencies ranging from 23 GHz to 183 GHz. By combining ground test data and on-orbit maneuver observations, calibration error sources, such as the Earth side lobe correction, reflector emission correction, nonlinearity correction, and the antenna pattern correction, are addressed and corrected during the ATMS calibration process. Calibration error budget analysis results show that the calibration accuracy of the ATMS is better than 0.3 K. Soon after launch, a spacecraft pitch-maneuver operation was carried out, during which a perfect 2D lunar disk in a full-moon phase was captured by the ATMS deep-space scan. Since the ATMS instrument was in normal operational mode during the maneuver and all data collected were of good quality, the collected radiative fluxes of the Moon’s disk were then calibrated using the clean deep-space view (DSV) and the internal warm target, following the ATMS on-orbit calibration process. Also calculated were the positions of the antenna beam and the lunar observation vector using satellite position and attitude measurements. Based on well-calibrated lunar antenna temperature datasets, a physical model can be developed to derive the disk-integrated lunar surface microwave Tb spectrum with frequencies from 23 to 183 GHz. Table 1 lists the microwave Tb retrieval results at the full-moon phase for each ATMS frequency. The retrieved Moon-disk-averaged Tb spectrum shows a strong frequency-dependent feature, i.e., increasing from 270 K at 23 GHz to 300 K at 183 GHz at the full-moon phase.
2.3. Lunar Microwave Tb 23–89-GHz Retrieval Results from AMSU-A
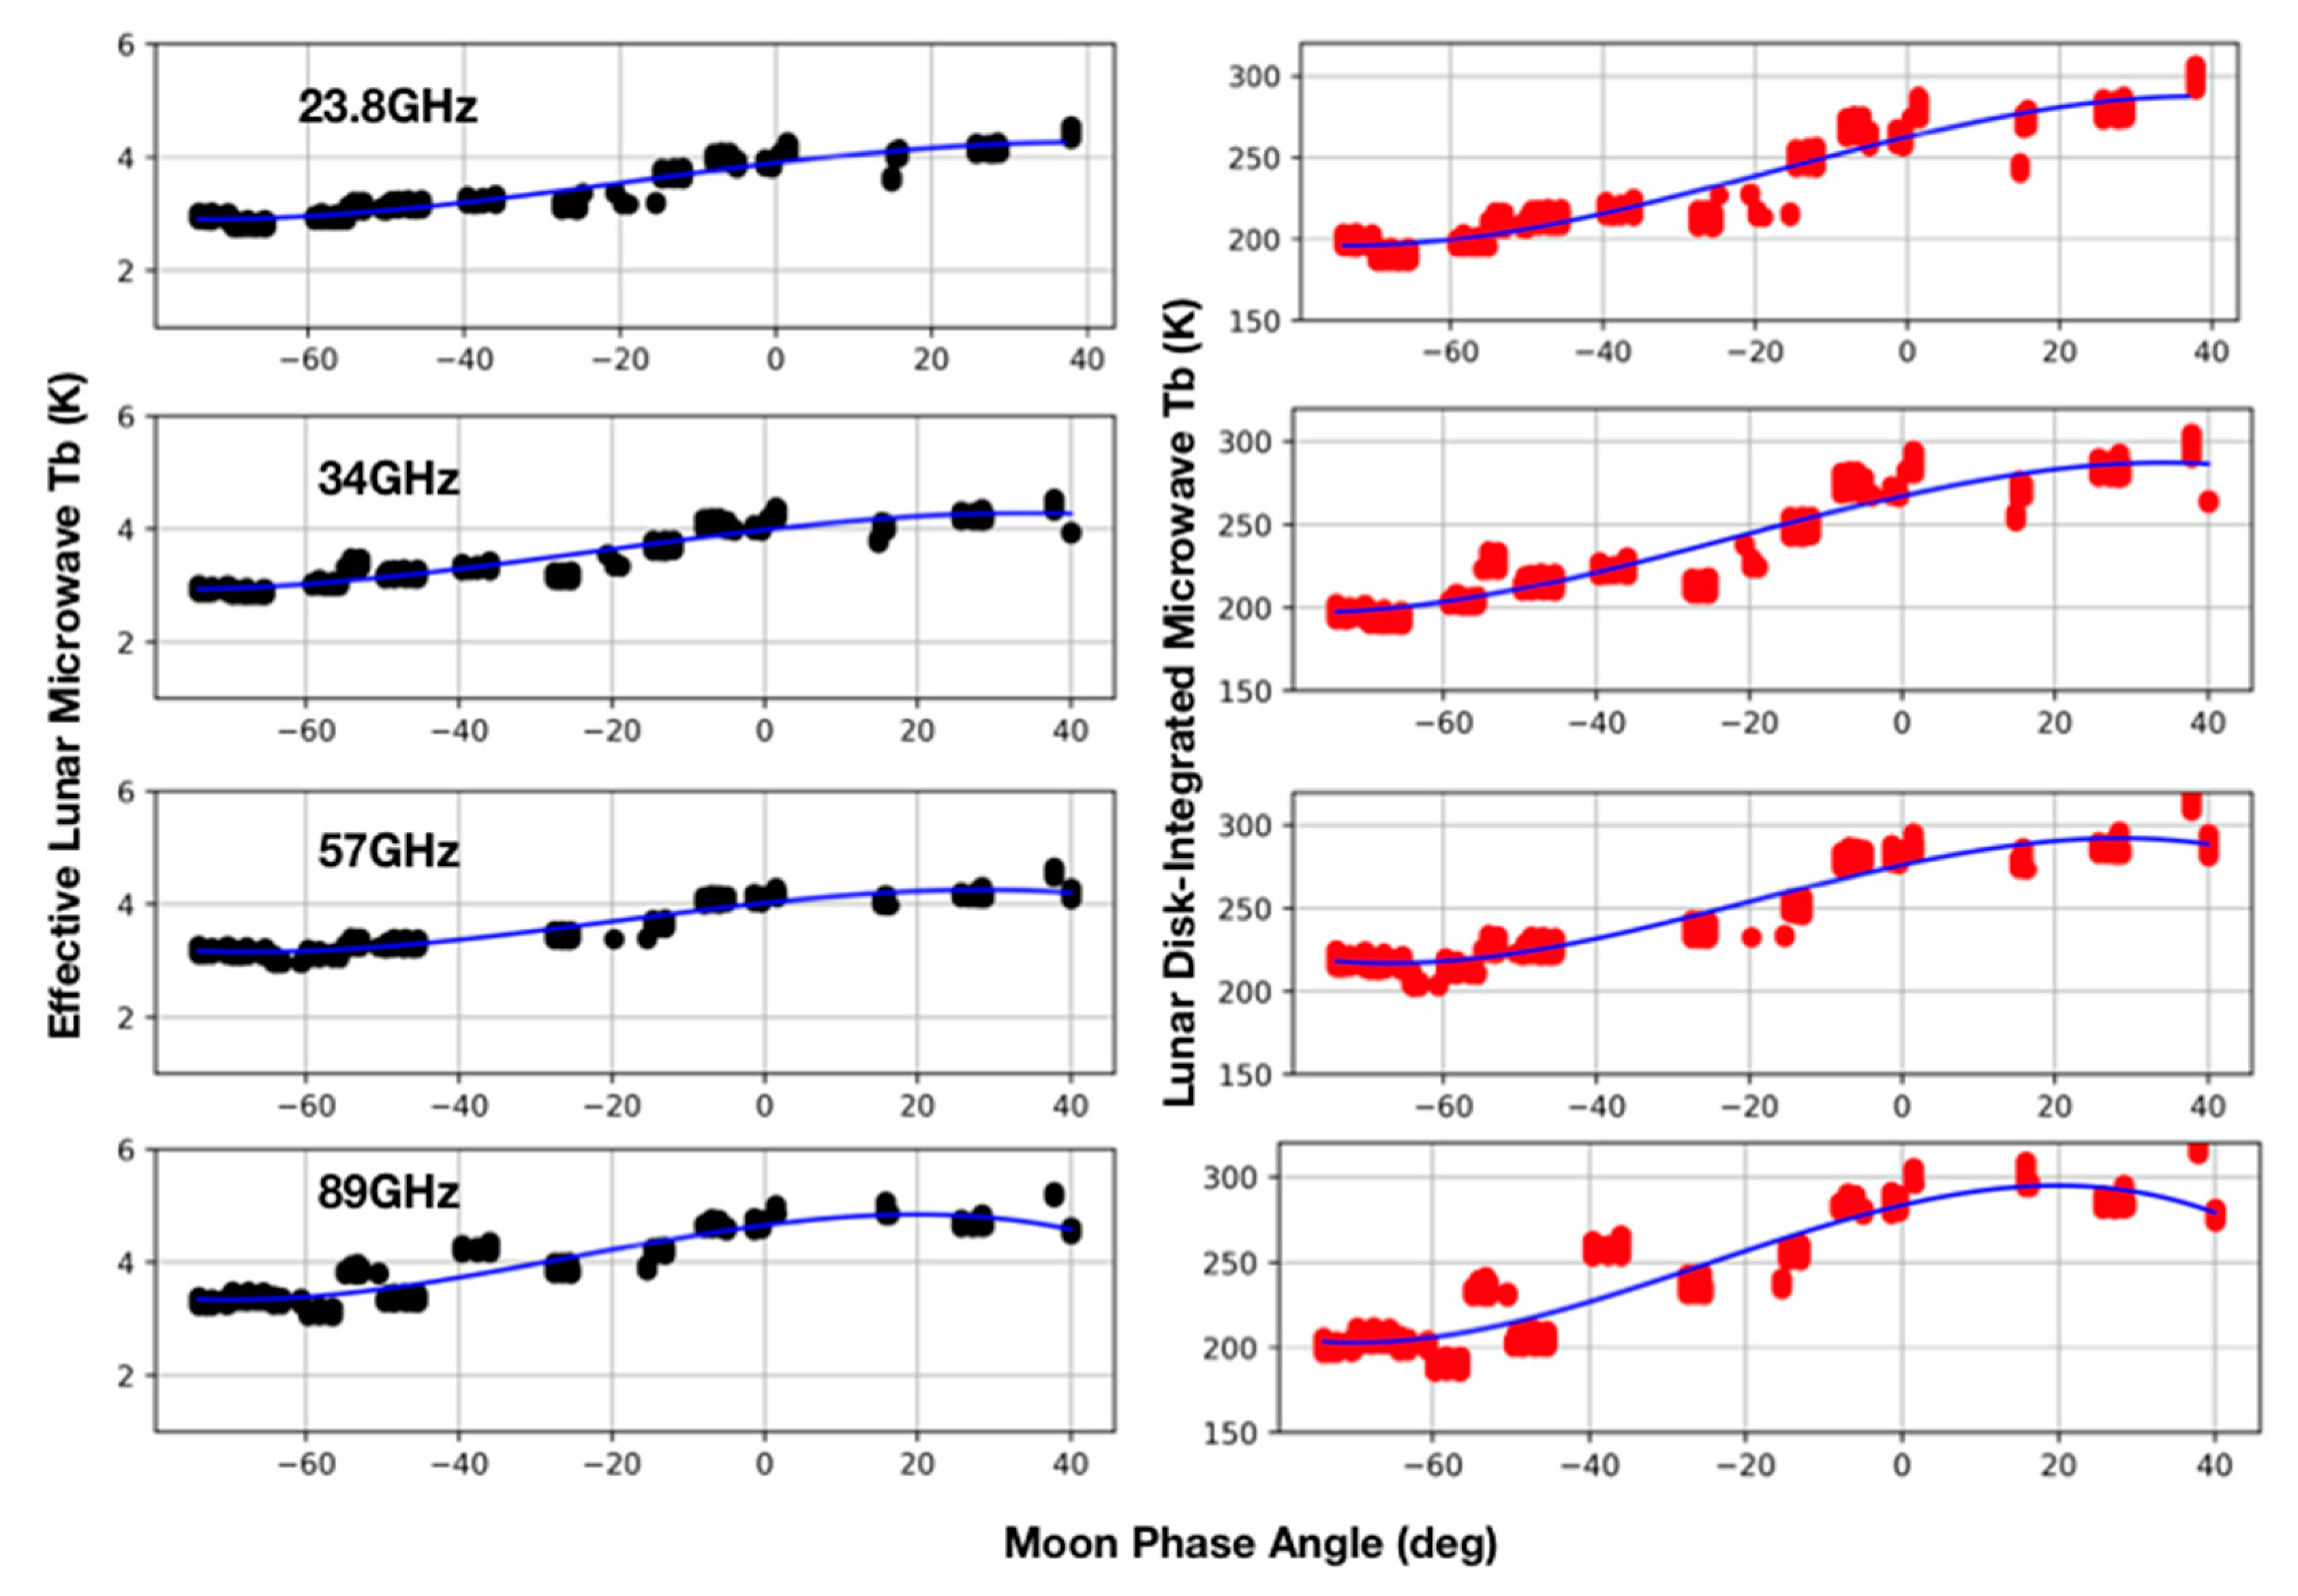
The AMSU-A is part of the Advanced Television InfraRed Operational Satellite(TIROS) Operational Vertical Sounder (ATOVS) sounding instrument suite. Together with the Microwave Humidity Sounder (MHS), it is the precursor of the ATMS onboard NOAA-20 and SNPP. AMSU-A LI samples can be identified from space-view observations by calculating the position of the Moon in the rotation-antenna coordinate system, taking into consideration the satellite attitude, earth rotation axis alignment, and instrument mounting matrix [20,21]. Since there is only one space-view sample available at each AMSU-A scan, searching for “clean” reference calibration counts is challenging because the calibration gain keeps changing during the LI process. Any error in reference cold-calibration counts will make the calibration results for LI samples inaccurate. Here, LI-free clean space views closest to the LI samples were taken as the reference at the starting and ending times of the LI. Then a double successive substitution method was applied to interpolate the reference cold-calibration counts between the start and end reference points, given that the variation of the instrument gain between two consecutive scans (8 s for AMSU-A) is minimal. After reference cold-calibration counts are determined, and together with the internal warm-calibration target, the LI samples can then be calibrated to effective lunar temperatures using Equation (1). To calculate lunar disk-integrated microwave Tbs from effective lunar Tbs, for each LI event, kept were only those LI samples collected when the Moon passed through the antenna beam center. To reduce the calibration difference between different instruments, the lunar Tb spectrum at the 0° Moon phase angle, derived from NOAA-20 ATMS 2D-scan lunar observations, is used as the reference. Equation (3) can then be applied to derive disk-integrated lunar Tbs for each AMSU-A channel at different lunar phase angles. Here, 15 years of NOAA-18 AMSU-A data from 2005 to 2019 were processed, from which lunar microwave Tbs were derived at different lunar phase angles. Figure 2 shows that the calculated effective lunar Tb changes from a low of ~3 K to a maximum of ~4–5 K within the Moon phase angle range of −80° to 45°. Correspondingly, the lunar disk-integrated Tb changes from 200 K to 300 K, and the position of the peak changes with frequency.
2.4. Lunar Microwave Tb 89–183-GHz Retrieval Results from AMSU-B/MHS
AMSU-B and MHS share with AMSU-A the frequency channel at 89 GHz, but they have an additional window channel at a higher frequency and sounding channels for measuring the absorption feature of water vapour at 183 GHz. AMSU-B and MHS are, just like AMSU-A, part of the ATOVS sounding instrument suite. AMSU-B is the precursor of the MHS onboard NOAA-18/19 and the European Space Agency’s MetOp satellites. The central frequencies of the channels of the AMSU-B, MHS, and ATMS instruments differ slightly (Table 2).
The intrusions of the Moon in the deep-space view of AMSU-B and MHS are identified in a similar manner as with AMSU-A, i.e., the software package used for processing the data from this satellite, AAPP (ATOVS and AVHRR Pre-processing Package, [26]), includes a program that can calculate the distance of the Moon from the pointing direction of the DSV. The beam size of AMSU-B and MHS is θ3dB = 1.1°, i.e., only a third of the value for AMSU-A. This, and the fact that the pointing direction of the DSV is further away from the orbital axis of the satellite than with AMSU-A—for MHS on NOAA-18, for example, it is between 15° and 18° off axis—means that an intrusion of the Moon in the DSV lasts only for a few minutes with AMSU-B and MHS. It is therefore straightforward to establish the correct cold calibration counts for the time of the Moon intrusion: It can be done by fitting a second order polynomial to the signal from the DSV before and after the Moon intrusion.
AMSU-B and MHS provide not one, but four space view samples from each scan, which are 1.1° apart from each other [27]. This way they offer information about the exact position of the Moon in two dimensions: In the along-track direction from the “light” curves, i.e., the measured flux density as a function of time, and in the across-track direction from the comparison of the maxima in each of the four DSV positions. It is therefore possible to find those Moon intrusions that come closest to the center of the beam.
AMSU-B and MHS use the same method to measure Tb of the Moon. Processing starts with uncalibrated raw data (level 1b), because the Moon intrusions are not part of the standard processing of the data—quite the opposite, because the presence of the Moon in the DSV corrupts the measurement of the cosmic microwave background, which serves as cold reference. The signal from the four DSV pixels pointing at slightly different positions in space changes significantly when the Moon enters the beam. In this case, the instrument receives the microwave radiation of the Moon on top of the cosmic microwave background. Plotting the signal as a function of the scan number produces a Gaussian-shaped curve. Because DSV signals are recorded in every scan at four different positions, there are four such curves, two or three of which receive enough flux from the Moon to fit a Gaussian with high accuracy. Finally, the amplitude of the Gaussian is converted to the radiance of the Moon with the full width at half maximum (FWHM) and the efficiency of the beam, which are known from ground tests, as described in Section 2.1.
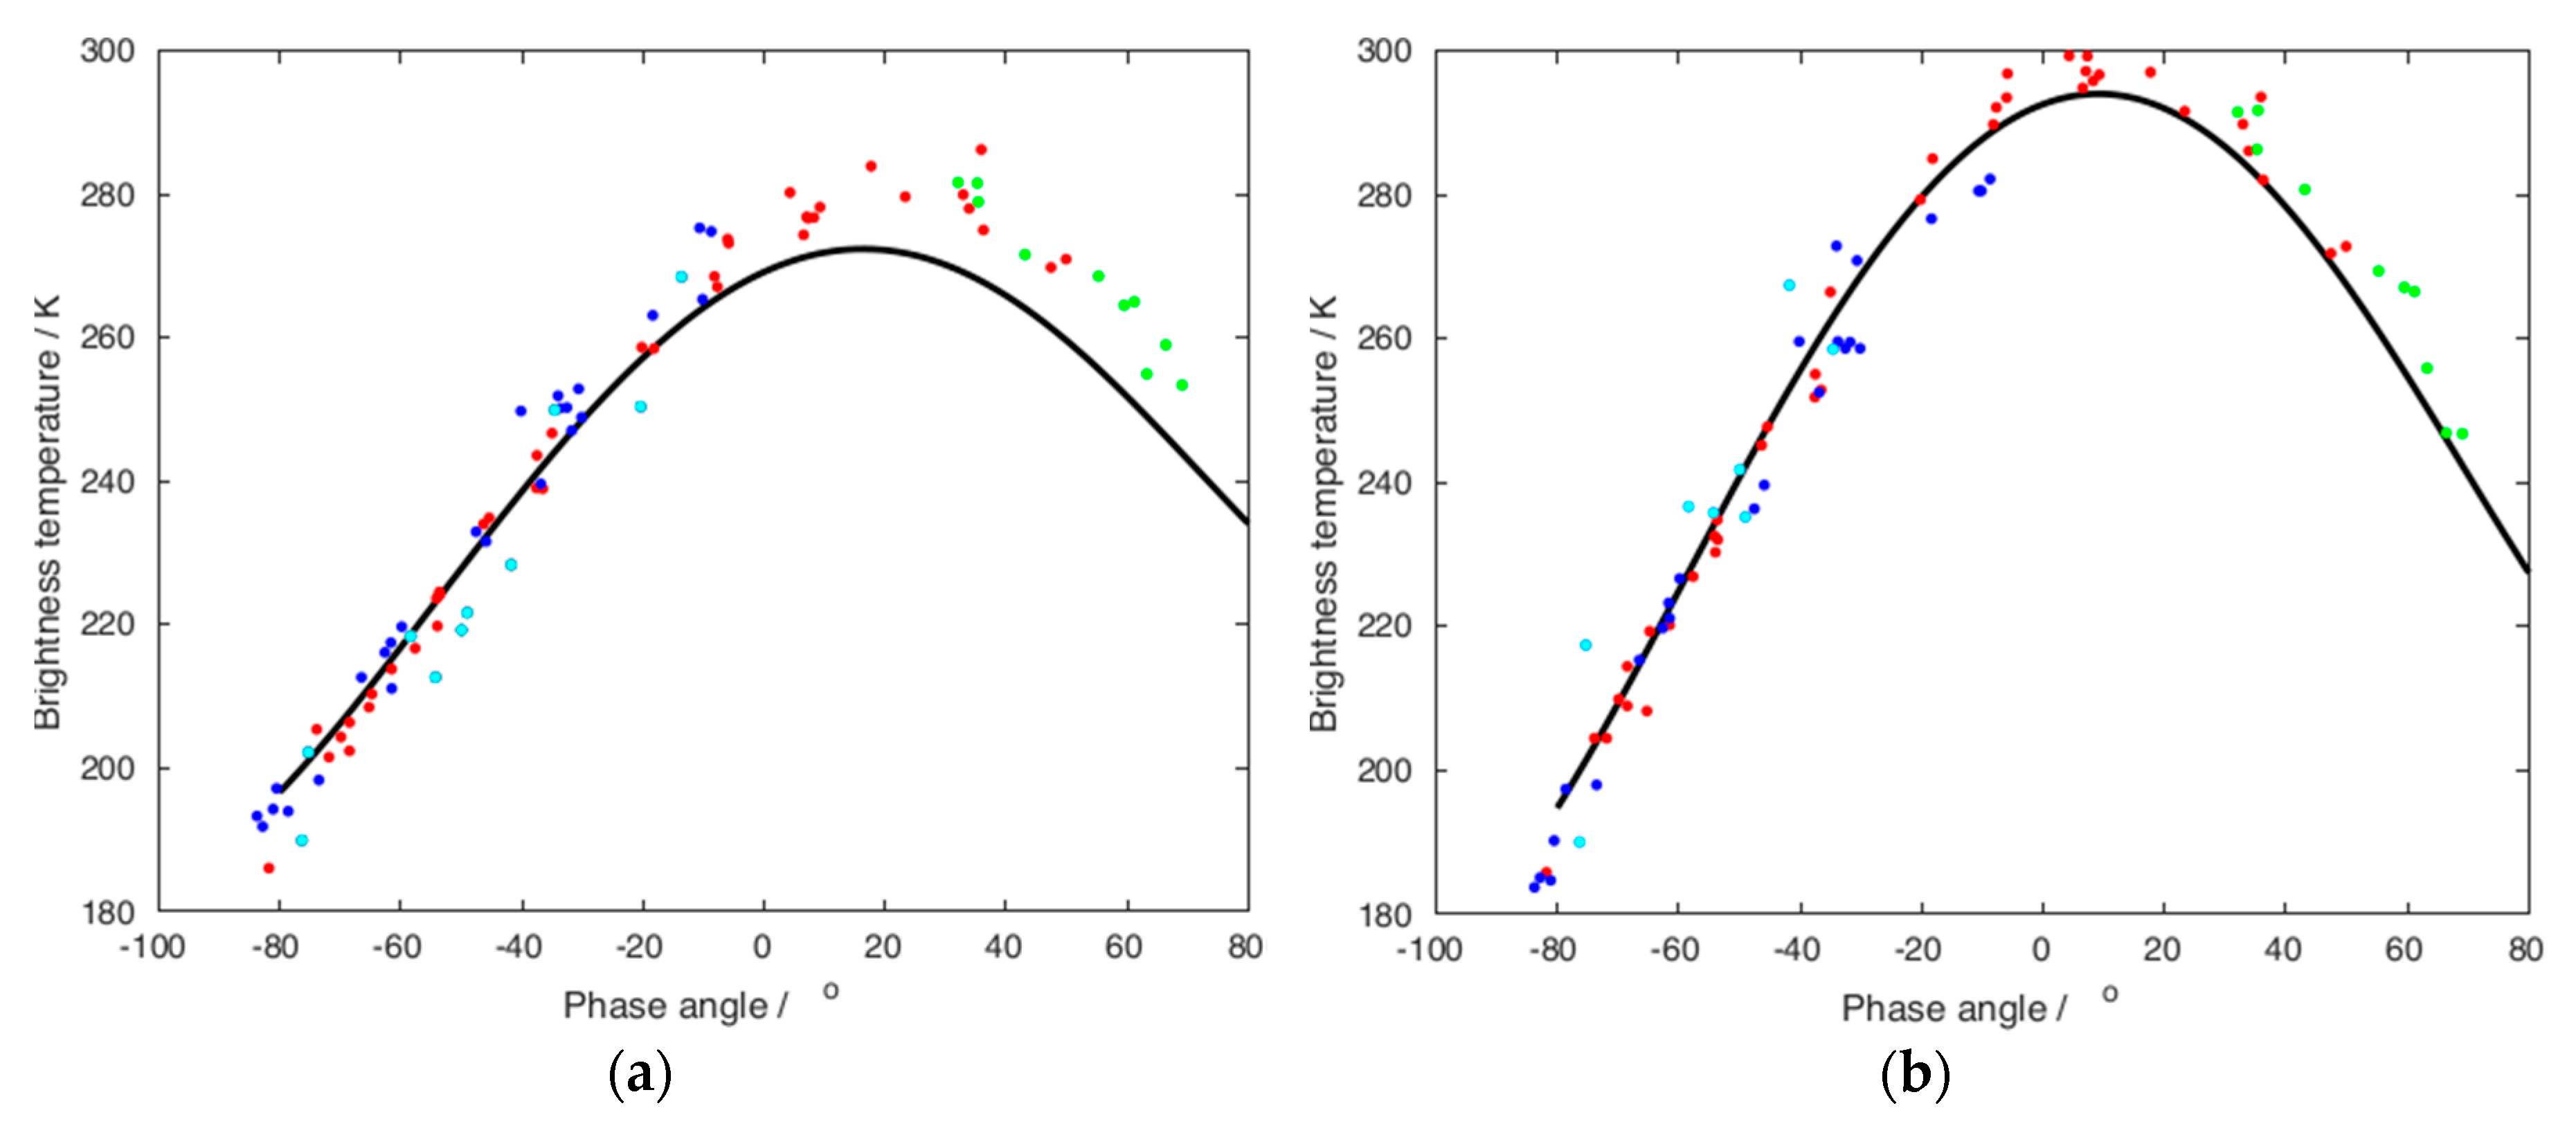
In order to determine the disk-integrated brightness temperature of the Moon for a large range of phase angles, one needs an instrument with high photometric stability over a long operational period. The Fidelity and Uncertainty in Climate data records from Earth Observations (FIDUCEO) and the Global Space-based Inter-Calibration System (GSICS) project consider MHS onboard NOAA-18 a reference instrument, i.e., the biases of microwave sounders refer to the Tbs that MHS onboard NOAA-18 would measure. This instrument was operational from May 2005 through October 2018, so it is particularly well-suited to study the dependence of the lunar microwave radiation from phase angle (see Section 3). In [23], Tbs of the Moon as a function of phase angle for each channel of the MHS onboard NOAA-18 were reported. Here, new measurements from other instruments were added to the plots to extend the range of phase angles and to determine the scatter among data from different instruments. Figure 3 shows results for 89 and 183 GHz.
Measured Tbs were compared with model-simulated [15] disk-integrated Tbs of the Moon. At both frequencies shown here, the values measured with the microwave sounders show a higher maximum temperature and a larger phase lag between the full Moon and the occurrence of this temperature than the model (see Table 3).
3. Moon Phase Lag Angle Observed from the Drifting Orbit of NOAA-18 AMSU/MHS
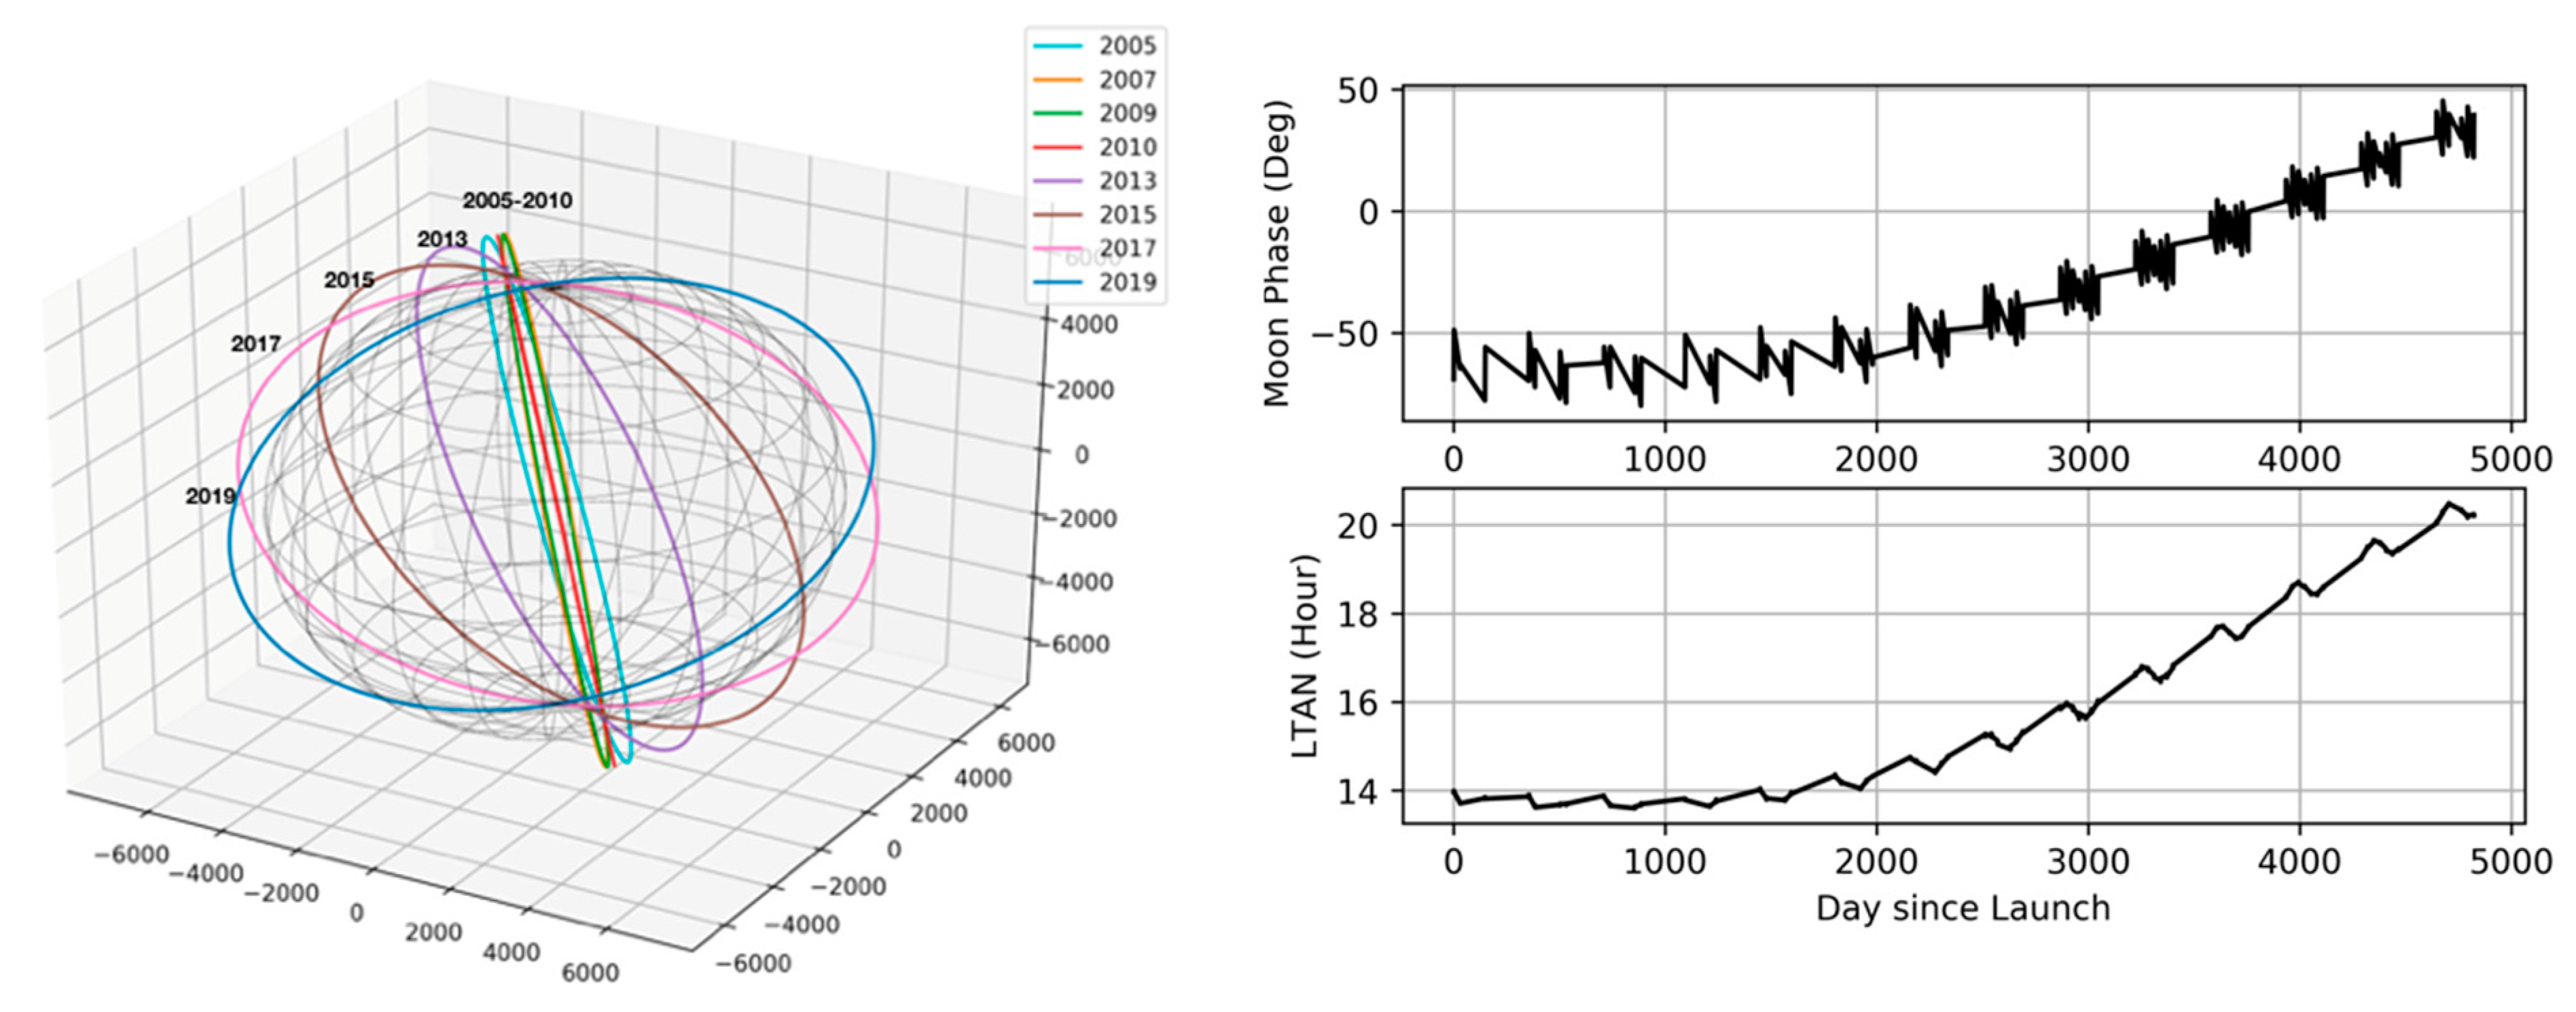
For a sun-synchronous, polar-orbiting Earth satellite, the local time of the ascending node (LTAN), determines the orientation of its orbital plane. For most current cross-track-scanning microwave-sounding instruments, the scan plane of the instrument is perpendicular to the orbital plane. When the orbital LTAN is kept stable, lunar radiation can only be collected within a narrow range of Moon phase angles. When the orbit drifts, however, Moon phase angles collected during LI events of the scanning instruments change consistently with the orbit LTAN. Taking AMSU-A onboard the NOAA-18 satellite as an example, its orbit was unable to be maintained at the original LTAN of 14:00 local standard time and drifted 6 hours westward in 14 years, as shown in Figure 4. As a result, the mean Moon phase angle captured at each LI event changed from around −80° in 2005 to about 45° in 2019. Lunar radiation data samples collected over a large range of Moon phase angles enables the study of phase-angle-dependent features of lunar radiation and, more importantly, increasing knowledge about Moon phase angle lags at microwave frequencies. To obtain information about Moon phase angle lags, collected were all space-view data samples from different satellite orbits. For each LI event, kept were only those LI samples collected when the Moon passed through the antenna beam center. Clean DSV counts were then identified and used to calculate the instrument calibration gain and do the internal warm calibration. Table 4 lists the lunar phase lags at different frequencies from low to high derived from AMSU/MHS.
4. Uncertainty of the Retrievals
The uncertainties of the Tbs of the Moon reported in the previous section fall into two categories: random and systematic. In this section, retrieval results from AMSU-B/MHS will be used as an example for the discussion.
4.1. Random Error in AMSU-B/MHS Retrievals
The random uncertainty of a given channel was estimated from the scatter of the measured Tbs around a fourth-order polynomial fitting the measured Tbs as a function of the phase angle. Table 5 summarizes the results.
Even when scaling the values in Table 5 down to the uncertainties of the antenna temperatures, a comparison with Figure 7 in [29] shows that they are higher than the cold NEΔT by a factor of two. The comparison with the cold NEΔT is appropriate because the Moon fills only a fraction of the beam, making the peak Moon antenna temperature low. The dominant contribution to the random uncertainty of the Tbs of the Moon measured by the AMSU-B and the MHS is the random uncertainty of the amplitude of the Gaussian fit to the light curve. This uncertainty, however, is proportional to the NEΔT of the measurement in each scan.
Another contribution to the random uncertainty of the Tb is the random uncertainty of the gain. It varies with time, channel number, and satellite. As an example, we give the values for two Moon intrusions with AMSU-B onboard NOAA-16. The uncertainty of the gain increased from 0.13% to 0.22% for channel 16, from 0.33% to 0.57% for channel 17, from 0.33% to 1.19% for channel 18, from 0.3% to 1.35% for channel 19, and from 0.46% to 1.5% for channel 20 during the period 4 January 2001 to 2 November 2006 [30].
4.2. Systematic Uncertainties of AMSU-B and MHS Retrievals
To evaluate the retrieval error of the lunar Tb, the explicit form of lunar spectral radiance was derived by performing an analytical Gaussian integration over the lunar disk [23]:
In Equation (5), and are the spectral radiances of the Moon and cosmic background, respectively. BνCMB is much smaller than BνMoon so was not included in Equation (1). is the deviation of counts from the cosmic background when the Moon passes through the beam center, G is the instrument calibration gain, and is the antenna beam efficiency. is the channel-specific dilution factor accounting for the beam unfilling of lunar observations, expressed as:
where is the apparent angle of the Moon, and is the 3-dB antenna beam width. The product Fch⋅η corresponds to in Equation (3). We kept the different variable names for consistency with previous publications of results obtained from different instruments. Appendix A gives the proof of Equation (6).
The following discusses each variable in Equation (5) with respect to systematic effects that can affect the Tb of the Moon.
- Channel frequency ν: BνMoon is a spectral radiance that is converted to a Tb using the Planck function. To do this, one needs to know the effective frequency midpoint of the channel, which depends on the shape of its relative spectral response function (RSRF). The RSRFs were determined on the ground. Tests with the Atmospheric Transfer Radiance Simulator [31] showed that replacing the actual RSRF with a simple step function changes the Tb corresponding to a given spectral radiance by only 0.1 K. Given that the dilution factor scales the flux density from the Moon, we also multiply this uncertainty by a factor of five, obtaining a contribution of 0.5 K from the RSRF to the overall uncertainty.
- Gain G: The gain is the slope of the function that relates counts to scene radiances. It is determined from two points: the cosmic microwave background (CMB) and the internal calibration target (ICT). The temperature of the ICT is measured with five (MHS) or seven (AMSU-B) platinum resistance thermometers, each one with a systematic uncertainty of 0.1 K [32]. This is smaller than the uncertainties of the cold-space and warm-load correction factors. The warm-load correction factor has an uncertainty of 0.16 K [33], and the cold-space correction is in the order of 1 K, so we adopt these values for the uncertainty. Because the radiance of the CMB is very small, its uncertainty has only a small impact on the gain. We estimate that the systematic uncertainty of the gain is less than 0.3%.
- Dilution factor Fch: The dilution factor is the fraction of the beam covered by the Moon, taking into account directivity. We assume that the directivity has the shape of a rotationally symmetric Gaussian, with its center being the pointing direction of the DSV. Hence, a single number, i.e., its FWHM, specifies it. Even though its uncertainty is estimated to be 0.01° [34,35], the values provided during ground tests sometimes differ by more than 0.2° from those found in flight. The FWHM of the beam is determined with the Moon intrusions themselves, using a method similar to the one employed by [37] to measure the pointing alignment of different channels. It relies on the fact that the width of the light curve we get from plotting the number of DSV counts as a function of scan number is proportional to the beam size. With every new scan, the pointing direction shifts slightly in the along-track direction, and by using Equation (A2), one can convert the width of the light curve from scans to angle. The random uncertainty of the FWHM is determined from the scatter of FWHM values obtained from different Moon intrusions. It is typically 0.01° for an average FWHM calculated from a dozen Moon intrusions in the DSV. Because Tb is inversely proportional to the dilution factor, which is more or less inversely proportional to the square of the FWHM of the beam, the systematic uncertainty of Fch is about 2%. This is the dominant contribution to the systematic uncertainty of the measured Tbs of the Moon.
- All contributions combined, we find an overall 1σ uncertainty of the Tb of the Moon when measured with a single instrument, e.g., the MHS onboard NOAA-18, namely, 3% or ~8 K. This means that the values from different instruments in Table 3 are in agreement.
5. Conclusions and Future Work
In this work, the microwave Tb and phase-angle-dependent features of the Moon’s disk are studied based on NOAA-20 ATMS and NOAA-16, -18, and -19, and MetOp AMSU-A and AMSU-B/MHS Moon observations. Presented are retrievals of the Tb spectrum from 23 to 183 GHz. A strong frequency-dependent feature of the Moon’s surface Tb was found. By examining lunar radiation samples collected from the drifting orbits of NOAA/MetOp satellites, the phase lag feature of the Moon’s surface microwave Tb was also studied at different frequencies. Current work shows that based on accurate spaceborne microwave radiometer observations, taking the Moon’s disk as an SI traceable calibration reference is promising, and possible by developing a reliable microwave lunar radiation model. Future work will focus on studying the surface temperature conductivity and microwave emission properties of the Moon’s surface and developing a comprehensive, physically based microwave Tb model for microwave calibration.
Such a model is not only essential for establishing a space-based climate observing system, but it will also be of practical use for astronomical observations at millimeter wavelengths. The Cosmology Large Angular Scale Surveyor, for example, measures the microwave sky at 40, 90, 150, and 220 GHz with a beam diameter of 1.6° [38]. Its antenna temperature calibration is based on Moon observations whose Tb must be known with high accuracy.
Author Contributions
Conceptualization, H.Y.; methodology, H.Y. and M.B.; formal analysis, H.Y. and M.B.; writing—original draft preparation, H.Y.; writing—review and editing, M.B. All authors have read and agreed to the published version of the manuscript.
Funding
This research was funded by NOAA grant NA19NES4320002. MB was supported by the Deutsche Forschungsgemeinschaft (DFG), Projekt MW-Luna, Contract BU 2253/8-1.
Conflicts of Interest
The authors declare no conflict of interest.
Appendix A
It is possible to convert the amplitude of the Gaussian fit to the light curve of the Moon intrusion in the DSV to the radiance of the Moon if the FWHM and the efficiency of the beam are known. The results presented in this article were obtained using the measurement equation in [23], which is derived as follows.
Let f(r) be the signal from any DSV in any channel. Then:
where the amplitude A of this Gaussian is obtained from a fit of f(r) to the light curve, i.e., the digital counts as a function of scan number nscan, and σ is the standard deviation. The scan of closest approach between the DSV and the Moon is set to zero.
The conversion from scan number nscan to r, i.e., the angular distance between the pointing direction and the position of the center of the Moon as seen by the microwave sounder (in degrees), is done with the following formula:
where α is the angular distance between the nadir and the direction of the DSV, P is the orbital period of the satellite in seconds, and 8/3 is the duration of a scan in seconds.
The conversion from A in digital counts to radiance in W m−2 Hz−1 sr−1 has to consider that the Moon fills only a fraction of the beam, unlike the cold- and warm-calibration targets. The DSV and the internal calibration target fill the whole beam, so calculating the flux received from them means calculating the infinite integral over f(r):
Since the Moon fills only part of the sky, one has to calculate the corresponding definite integral from zero to rMoon, i.e., half the equatorial angular width of the Moon’s full disk as seen from the spacecraft at the time of maximum signal:
The Gaussian fit in MATLAB yields values for the variables a, b, and c, where a = A is the amplitude, b = 0 is the position of the Gaussian with the Moon in the middle of the DSV, and c = √2 · σ = FWHM / 2 / √(ln2) gives the width of the Gaussian.
Hence, the flux obtained from the Moon has to be divided by the channel-specific dilution factor:
This allows for the fact that the calibration was carried out with reference sources that covered the beam completely. Here, we assume that a 2D, rotationally symmetric Gaussian with its origin at the center of the Moon for nscan = 0 represents the beam of each channel of AMSU-B and MHS.
Another much smaller correction is needed because the Moon disk blocks the CMB radiation behind it. The final measurement equation is therefore:
where BνMoon/CMB/ICT are the spectral radiances of the Moon, CMB, and internal calibration target, respectively, G is the gain of the instrument in counts per unit of spectral radiance, and η is the beam efficiency as measured on the ground.
References
- Wang, Z.; Li, Y.; Jiang, J.; Li, D. Lunar surface dielectric constant, regolith thickness, and 3He abundance distributions retrieved from the microwave brightness temperatures of CE-1 Lunar Microwave Sounder. Sci. China 2010, 53, 1365–1378. [Google Scholar] [CrossRef]
- Olhoeft, G.R.; Strangway, D.W. Dielectric properties of the first 100 meters of the Moon. Earth Planet. Sc. Lett. 1975, 24, 394–404. [Google Scholar] [CrossRef]
- Anderson, R.C.; Buehler, M.; Seshadri, S.; Kuhlman, G.; Schaap, M. Dielectric constant measurements for characterizing lunar soils. Lunar Planet. Sci. XXXVI 2005. Available online: https://ntrs.nasa.gov/archive/nasa/casi.ntrs.nasa.gov/20050165132.pdf (accessed on 15 December 2019).
- Ryadov, V.Y.; Furashov, N.I.; Sharonov, G.A. Measurements of the Moon’s natural infrared thermal radiation. Sov. Astron. 1964, 8, 82–84. [Google Scholar]
- Sandor, B.J.; Clancy, R.T. Microwave observations and modelling of a lunar eclipse. Icarus 1995, 115, 387–398. [Google Scholar] [CrossRef]
- Hu, G.; Zheng, Y.; Cu, A.; Tang, Z. Microwave brightness temperature of the Moon: The possibility of setting a calibration source of the lunar surface. IEEE Geosci. Remote Sens. Lett. 2016, 13, 182–186. [Google Scholar] [CrossRef]
- Wu, J.; Li, D.; Zhang, X.; Jiang, J.; Altyntesev, A.T.; Lubyshev, B.I. Microwave brightness temperature imaging and dielectric properties of lunar soil. J. Earth Syst. Sci. 2016, 114, 627–632. [Google Scholar]
- Maghrabi, A.H. On the measurements of the moon’s infrared temperature and its relation to the phase angle. Adv. Space Res. 2014, 53, 339–347. [Google Scholar] [CrossRef]
- Williams, J.-P.; Paige, D.A.; Greenhagen, B.T.; Sefton-Nash, E. The global surface temperatures of the Moon as measured by the Diviner Lunar Radiometer Experiment. Icarus 2016, 283, 300–325. [Google Scholar] [CrossRef] [Green Version]
- Krotikov, V.D.; Troitskii, V.S. Radio emission and nature of the Moon. Sov. Phys. Uspekhi 1964, 6, 841–871. [Google Scholar] [CrossRef]
- Piddington, H.; Minnett, H.C. Microwave thermal radiation from the Moon. Aust. J. Sci. Res. Ser. A 1949, 2, 63–77. [Google Scholar] [CrossRef]
- Zheng, Y.C.; Tsang, K.T.; Chan, K.L.; Zou, Y.L.; Zhang, F.; Ouyang, Z.Y. First microwave map of the Moon with ChangE-1 data: The role of local time in global imaging. Icarus 2012, 219, 194–210. [Google Scholar] [CrossRef]
- Montopoli, M.; Carlofelice, A.D.; Cicchinelli, M.; Tognolatti, P.; Marzano, F.S. Lunar microwave brightness temperature: Model interpretation and inversion of spaceborne multifrequency observations by a neural network approach. IEEE Geosci. Remote Sens. 2011, 49, 3350–3358. [Google Scholar] [CrossRef]
- Montopoli, M.; Carlofelice, A.D.; Tognolatti, P.; Marzano, F.S. Remote sensing of the Moon’s subsurface with multifrequency microwave radiometers: A numerical study. Radio Sci. 2011, 46. [Google Scholar] [CrossRef]
- Keihm, S.J. Interpretation of the lunar microwave brightness temperature spectrum. Icarus 1984, 60, 568–589. [Google Scholar] [CrossRef]
- Yu, S.; Fa, W. Thermal conductivity of surficial lunar regolith estimated from Lunar Reconnaissance Orbiter Diviner Radiometer data. Planet. Space Sci. 2016, 124, 48–61. [Google Scholar] [CrossRef]
- Lucey, P.G.; Blewett, D.T.; Jolliff, B.L. Lunar iron and titanium abundance algorithms based on final processing of Clementine ultraviolet-visible images. J. Geophys. Res. Planets 2000, 105. [Google Scholar] [CrossRef]
- Fa, W.; Jin, Y.Q. Simulation of brightness temperature from lunar surface and inversion of regolith-layer thickness. J. Appl. Geophys. 2007, 112. [Google Scholar] [CrossRef] [Green Version]
- Liu, N.; Jin, Y.Q. Calibration of multi-channel millimeter-wave radiometer of FY-4M based on real time brightness temperature along the equator of lunar surface. Chin. Sci. Bull. 2019, in press. [Google Scholar]
- Yang, H.; Weng, F. On-orbit ATMS lunar contamination corrections. IEEE Geosci. Remote Sens. 2016, 54, 1–7. [Google Scholar] [CrossRef]
- Yang, H.; Zhou, J.; Weng, F.; Sun, N.; Anderson, K.; Liu, Q.; Kim, E.J. Developing vicarious calibration for microwave sounding instruments by using lunar radiation. IEEE Geosci. Remote Sens. 2018, 56, 6723–6733. [Google Scholar] [CrossRef]
- Burgdorf, M.J.; Buehler, S.A.; Lang, T.; Michel, S.; Hans, I. The Moon as a photometric calibration standard for microwave sensors. Atmos. Meas. Tech. 2016, 9, 3467–3475. [Google Scholar] [CrossRef] [Green Version]
- Burgdorf, M.J.; Buehler, S.A.; Hans, I.; Prange, M. Disk-integrated lunar brightness temperatures between 89 and 190 GHz. Adv. Astron. 2019, 2019. [Google Scholar] [CrossRef]
- Yang, F.; Xu, Y.; Chan, K.L.; Zhang, X.; Hu, G.; Li, Y. Study of Chang’E-2 microwave radiometer data in the lunar polar region. Adv. Astron. 2019, 2019. [Google Scholar] [CrossRef]
- Kigawa, S.; Mo, T. An Algorithm for Correction of Lunar Contamination in AMSU-A Data. NOAA Technical Report, NESDIS 111. 2002. Available online: https://repository.library.noaa.gov/view/noaa/12824 (accessed on 5 December 2019).
- Labrot, T.; Lavanant, L.; Whyte, K.; Atkinson, N.; Brunel, P. AAPP Documentation Scientific Description. In Satellite Application Facility for Numerical Weather Prediction; NWPSAF-MF-UD-001; European Centre for Medium-Range Weather Forecasts: Reading, UK, 2019. [Google Scholar]
- Robel, J.; Graumann, A. NOAA KLM User’s Guide; National Oceanic and Atmospheric Administration: Silver Spring, MD, USA, 2014.
- Keihm, S.J.; Cutts, J.A. Vertical-structure effects on planetary microwave brightness temperature measurements: Applications to the lunar regolith. Icarus 1981, 48, 201–229. [Google Scholar] [CrossRef]
- Hans, I.; Burgdorf, M.; John, V.O.; Mittaz, J.; Buehler, S.A. Noise performance of microwave humidity sounders over their lifetime. Atmos. Meas. Tech. 2017, 10, 4927–4945. [Google Scholar] [CrossRef] [Green Version]
- Hans, I. Personal Communication; EUMETSAT: Darmstadt, Germany, 2017. [Google Scholar]
- Buehler, S.A.; Mendrok, J.; Eriksson, P.; Perrin, A.; Larsson, R.; Lemke, O. ARTS, the Atmospheric Radiative Transfer Simulator. Geosci. Model Dev. 2018, 11, 1537–1556. [Google Scholar] [CrossRef] [Green Version]
- Hans, I.; Burgdorf, M.; Buehler, S.A.; Prange, M.; Lang, T.; John, V.O. An uncertainty quantified fundamental climate data record for microwave humidity sounders. Remote Sens. 2019, 11, 548. [Google Scholar] [CrossRef] [Green Version]
- Hans, I.; Burgdorf, M.; Woolliams, E. FIDUCEO Product User Guide—Microwave FCDR Release 4.1. 2019. Available online: http://cedadocs.ceda.ac.uk/1415/ (accessed on 5 December 2019).
- Whatling, C.A. Microwave Humidity Sounder Instrument End Item Data Package, 3175-JA291-DPQ, MHS-DP-JA291-MMP; Matra Marconi Space: Toulouse, France, 1999. [Google Scholar]
- Whatling, C.A. Microwave Humidity Sounder Instrument End Item Data Package, 3175-JA292-DPF, MHS-DP-JA292-MMP; Matra Marconi Space: Toulouse, France, 1999. [Google Scholar]
- Hewison, T.J. AMSU-B Antenna Test Results, Met O(RSI) Branch Technical Note No. 2; Met Office (RS) Branch Memorandum 21: Farnborough, UK, 1993.
- Bonsignori, R. In-orbit verification of microwave humidity sounder spectral channels coregistration using the moon. J. Appl. Remote Sens. 2018, 12. [Google Scholar] [CrossRef]
- Appel, J.W.; Xu, Z.; Padilla, I.L.; Harrington, K.; Marquez, B.P.; Ali, A.; Bennett, C.L.; Brewer, M.K.; Bustos, R.; Chan, M.; et al. On-sky performance of the CLASS Q-band telescope. Astrophys. J. 2019, 876, 126. [Google Scholar] [CrossRef]
Figure 1.
A typical case of lunar observation samples identified from space-view counts during a lunar intrusion (LI) event when the Advanced Microwave Sounding Unit-A (AMSU-A) instrument was making deep-space observations. Red dots are the LI-contaminated space-view counts, black dots are the nominal space-view counts, and blue dots are the clean space-view counts free of LI contamination during the LI event.

Figure 2.
Lunar effective Tb (left panels) and disk-integrated Tb (right panels) for AMSU-A channels at different Moon phase angles. Each data point is derived using LI samples with maximum antenna gains when the Moon passed through the center of the antenna beam. Solid lines are the polynomial fitting curves.

Figure 3.
Disk-integrated Tbs of the Moon for different phase angles relative to the full Moon. Cyan: AMSU-B onboard NOAA-16, red: MHS onboard NOAA-18, blue: MHS onboard NOAA-19, green: MHS onboard MetOp-A, black solid line: model by [28]. Frequencies are (a) 89.0 GHz (channel 16 or 1) and (b) 183.31 GHz (average of channels 18–20 or 3–4).

Figure 4.
Evolution of the NOAA-18 drifting orbital plane (left panel) and the Moon phase angle/local time of the ascending node (LTAN) at LI events of AMSU observations (right panel).
Figure 4.
Evolution of the NOAA-18 drifting orbital plane (left panel) and the Moon phase angle/local time of the ascending node (LTAN) at LI events of AMSU observations (right panel).


Table 1.
Microwave Tb retrieval results at the full-moon phase for each Advanced Technology Microwave Sounder (ATMS) frequency.
Table 1.
Microwave Tb retrieval results at the full-moon phase for each Advanced Technology Microwave Sounder (ATMS) frequency.
| Center Frequency (GHz) | Beam Width (°) | |
|---|---|---|
| 23.8 | 5.1 | 267 |
| 31.4 | 4.9 | 278 |
| 50.3–55.5 | 2.2 | 284 |
| 57 | 2.2 | 287 |
| 88.2 | 2.1 | 289 |
| 165.5 | 1.1 | 296 |
| 183.3 | 1.1 | 300 |
Table 2.
Frequencies of the channels of AMSU-B, Microwave Humidity Sounder (MHS), and ATMS in GHz.
| AMSU-B | MHS | ATMS | |
|---|---|---|---|
| Channel 16/1/16 | 89.0 | 89.0 | 89.5 |
| Channel 17/2/17 | 150.0 | 157.0 | 165.5 |
| Channel 18/3/18 | 183.31 ± 1.0 | 183.31 ± 1.0 | 183.31 ± 7.0 |
| Channel 19/4/19 | 183.31 ± 3.0 | 183.31 ± 3.0 | 183.31 ± 4.5 |
| Channel 20/5/20 | 183.31 ± 7.0 | 190.31 | 183.31 ± 3.0 |
| Channel -/-/21 | 183.31 ± 1.8 | ||
| Channel -/-/22 | 183.31 ± 1.0 |
Table 3.
Maximum Tbs of the Moon, phase of its occurrence, and Tb at full Moon for the frequencies of 89 and 183 GHz.
Table 3.
Maximum Tbs of the Moon, phase of its occurrence, and Tb at full Moon for the frequencies of 89 and 183 GHz.
| T89max | T89full | Φ89 | T183max | T183full | Φ183 | |
|---|---|---|---|---|---|---|
| AMSU-B and MHS | 282 K | 276 K | 23° | 297 K | 295 K | 12° |
| AMSU-A or ATMS | 295 K | 289 K | 20° | 300 K | ||
| Keihm [15] | 272 K | 269 K | 16° | 294 K | 293 K | 9° |
Table 4.
Moon phase lag angles and the maximum lunar disk Tb at microwave frequencies.
| Center Frequency (GHz) | Peak Tb (K) | Phase Lag Angle (°) |
|---|---|---|
| 23.8 | 287 | 37 |
| 31.4 | 287 | 34 |
| 50.3–55.5 | 292 | 31 |
| 57 | 294 | 28 |
| 89 | 295 | 20 |
| 183 (MHS) | 297 | 12 |
Table 5.
Examples of random uncertainties of the Tbs measured during a single Moon intrusion in the DSV for 89 and 183 GHz.
Table 5.
Examples of random uncertainties of the Tbs measured during a single Moon intrusion in the DSV for 89 and 183 GHz.
| AMSU-B NOAA-16 | MHS NOAA-18 | MHS NOAA-19 | MHS MetOp-A | |
|---|---|---|---|---|
| 89 GHz | 5.8 K | 2.7 K | 3.5 K | 2.5 K |
| 183 GHz | 5.2 K | 3.3 K | 4.5 K | 3 K |
© 2020 by the authors. Licensee MDPI, Basel, Switzerland. This article is an open access article distributed under the terms and conditions of the Creative Commons Attribution (CC BY) license (http://creativecommons.org/licenses/by/4.0/).
Share and Cite
MDPI and ACS Style
Yang, H.; Burgdorf, M. A Study of Lunar Microwave Radiation Based on Satellite Observations. Remote Sens. 2020, 12, 1129. https://0-doi-org.brum.beds.ac.uk/10.3390/rs12071129
AMA Style
Yang H, Burgdorf M. A Study of Lunar Microwave Radiation Based on Satellite Observations. Remote Sensing. 2020; 12(7):1129. https://0-doi-org.brum.beds.ac.uk/10.3390/rs12071129
Chicago/Turabian StyleYang, Hu, and Martin Burgdorf. 2020. "A Study of Lunar Microwave Radiation Based on Satellite Observations" Remote Sensing 12, no. 7: 1129. https://0-doi-org.brum.beds.ac.uk/10.3390/rs12071129
Note that from the first issue of 2016, this journal uses article numbers instead of page numbers. See further details here.