Article

Integration of Selective Dimensionality Reduction Techniques for Mineral Exploration Using ASTER Satellite Data

1
School of Mining Engineering, College of Engineering, University of Tehran, Tehran 143995-7131, Iran
2
Department of Mining Engineering, Amirkabir University of Technology (Tehran Polytechnic), Tehran 159163-4311, Iran
3
Institute of Oceanography and Environment (INOS), University Malaysia Terengganu (UMT), Kuala Nerus 21030, Terengganu, Malaysia
4
EarthByte Group, School of Geosciences, University of Sydney, Sydney, NSW 2006, Australia
5
School of Mathematics and Statistics, University of New South Wales, Sydney, NSW 2052, Australia
*
Author to whom correspondence should be addressed.
Submission received: 12 March 2020 / Revised: 8 April 2020 / Accepted: 14 April 2020 / Published: 16 April 2020

Abstract

:
There are a significant number of image processing methods that have been developed during the past decades for detecting anomalous areas, such as hydrothermal alteration zones, using satellite images. Among these methods, dimensionality reduction or transformation techniques are known to be a robust type of methods, which are helpful, as they reduce the extent of a study area at the initial stage of mineral exploration. Principal component analysis (PCA), independent component analysis (ICA), and minimum noise fraction (MNF) are the dimensionality reduction techniques known as multivariate statistical methods that convert a set of observed and correlated input variables into uncorrelated or independent components. In this study, these techniques were comprehensively compared and integrated, to show how they could be jointly applied in remote sensing data analysis for mapping hydrothermal alteration zones associated with epithermal Cu–Au deposits in the Toroud-Chahshirin range, Central Iran. These techniques were applied on specific subsets of the advanced spaceborne thermal emission and reflection radiometer (ASTER) spectral bands for mapping gossans and hydrothermal alteration zones, such as argillic, propylitic, and phyllic zones. The fuzzy logic model was used for integrating the most rational thematic layers derived from the transformation techniques, which led to an efficient remote sensing evidential layer for mineral prospectivity mapping. The results showed that ICA was a more robust technique for generating hydrothermal alteration thematic layers, compared to the other dimensionality reduction techniques. The capabilities of this technique in separating source signals from noise led to improved enhancement of geological features, such as specific alteration zones. In this investigation, several previously unmapped prospective zones were detected using the integrated hydrothermal alteration map and most of the known hydrothermal mineral occurrences showed a high prospectivity value. Fieldwork and laboratory analysis were conducted to validate the results and to verify new prospective zones in the study area, which indicated a good consistency with the remote sensing output. This study demonstrated that the integration of remote sensing-based alteration thematic layers derived from the transformation techniques is a reliable and low-cost approach for mineral prospectivity mapping in metallogenic provinces, at the reconnaissance stage of mineral exploration.

Graphical Abstract

1. Introduction

The interaction of hydrothermal fluids and wall rocks during the uprising process through conduits (e.g., faults and fractures), which results in the alteration of mineralogy and chemical composition of rocks, can lead to the generation of polymetallic epithermal and porphyry deposits [1,2,3,4]. The footprints of various types of hydrothermal alteration on the surface are key indicators through the exploration of outcropping or deep-seated deposits [5,6,7,8]. Each alteration type shows a specific spectral behavior due to different mineral assemblages. Exploration geologists use these spectral characteristics as diagnostic features for detecting and discriminating between different alteration types, using remote sensing data [9,10,11]. Detailed spectral information on the mineralogy and geochemistry of rock types comprising the Earth’s surface are provided by multispectral and hyperspectral remote sensing instruments, and this technology has been used for decades to map rocks, mineral assemblages, and weathering characteristics in different regions [9,10,12,13,14,15,16,17,18]. Mapping prospective zones of various types of the hydrothermal alteration minerals is one of the most important applications of remote sensing in the field of mineral exploration [11,18,19,20,21,22].
The spectral and spatial resolution provided by the advanced spaceborne thermal emission and reflection radiometer (ASTER) sensor makes the identification of specific alteration assemblages feasible. The ASTER spectral subsets, including visible and near infrared, short-wave infrared, and thermal infrared wavelength regions provide complementary data for lithologic mapping and mineral exploration. The ASTER remote sensing data have been extensively used for alteration and lithological mapping [16,23,24,25]. Image processing approaches such as dimensionality reduction or transformation techniques are considered as efficient tools in identifying hydrothermal alteration zones in metallogenic provinces [10,15,16,26,27,28,29]. Transformation techniques such as principal component analysis (PCA), independent component analysis (ICA), and minimum noise fraction (MNF) are powerful statistical techniques that can be used for suppressing irradiance effects that dominate all bands, therefore, enhancing the spectral reflectance features of geological materials [30,31]. These techniques can be applied to multivariate data sets, such as multispectral satellite images, to extract specific spectral responses, as in the case of hydrothermal alteration minerals.
PCA has been used to transform remote sensing data in the form of image to uncover the most important features [32,33], by extracting a smaller set of variables with less redundancy from high-dimensional data sets [34,35]. This technique has been widely used for mapping lithological features and hydrothermal alteration zones, using different types of remote sensing data [23,36,37,38]. ICA has less been considered to be a common technique in image processing, although it has a wide range of applications in signal processing [39]. The lack of a comprehensive understanding of the underlying theory and foundations of ICA is one of the main reasons that ICA has not been applied commonly in geosciences, particularly, for multi- or hyper-spectral image-processing. There are only a few studies focused on the application of ICA in alteration mapping [40,41]. MNF is used to determine the inherent dimensionality of image data, segregate noise in the data, and reduce the computational requirements for subsequent processing [42,43]. This transformation can identify spectral signatures of spectral anomalies. MNF is of interest to exploration geologists because spectral anomalies are often indicative of hydrothermal alteration zones and has been applied on different data types for detecting such anomalies [44,45,46].
The integration and comparison of the dimensionality reduction techniques provide comprehensive information for creating the most informative thematic layers and generating a remote sensing evidential layer. In this study, we used the PCA, ICA, and MNF for mapping hydrothermal alteration zones, using ASTER remote sensing data in the Toroud-Chahshirin range, Central Iran (Figure 1). This region is mostly known for several epithermal polymetallic vein-type mineral occurrences, and anomalous Cu and Au concentration values have been reported to be associated with altered dacite, dacite-andesite, and volcaniclastics rocks. The presence of several mineral occurrences associated with widespread alteration zones suggests that the Toroud-Chahshirin range is a prospective zone for high-grade gold veins and base metal epithermal deposits [47]. There is no regional prospectivity map available for the study area. Accordingly, the main objectives of this study are: (1) to compare the PCA, ICA, and MNF techniques for mapping gossans and hydrothermal alteration zones, including argillic, phyllic, and propylitic, using selected spectral subsets of the ASTER data; (2) to select the most informative thematic layers for detecting gossans, argillic, phyllic, and propylitic zones, using statistical analyses; (3) to integrate the most informative thematic layers for generating a remote sensing evidential layer using fuzzy logic; and (4) to verify the prospective zones through detailed fieldwork and laboratory analysis.

2. Geological Setting

The magmatic arc of Toroud-Chahshirin located in Central Iran, lies between the Anjilow and Toroud faults (Figure 1) [48]. The rock outcrops of the study area are composed of Eocene volcano-pyroclastic rocks with an intermediate composition (andesite), which have been affected by Oligo-Miocene intrusive bodies. The magmatic activities commenced in the first and second geological eras along with tectonic events, gradually. The peak of magmatic activities occurred from middle to upper Eocene, which constitute the heights of the Toroud-Chahshirin region. Most of the magmatic products are made of andesite and basalt, which have an acidic or trachytic state. On the other hand, some magmatic products are basic in terms of composition and have changed into andesite lavas, breccias, and tuffs, at the end of Eocene. The volcanic rocks of the study area have been cut by multiple intrusive bodies aged Oligo-Miocene, which are known to be one of the key factors of mineralization. These rocks include granite, micro-granite, granodiorite, micro-granodiorite, micro-quartz monzonite, micro-monzonite, micro-monzodiorite, and micro-quartz monzodiorite. The major constituent minerals include quartz, alkali-feldspar, plagioclase, biotite, amphibole, pyroxene, apatite, titanite, zircon, tourmaline, magnetite, and ilmenite. The volcanic rocks are mainly from magmatic, subalkaline, and alkaline series [47]. The Toroud-Chahshirin range is the largest known gold and base metal province of Iran [47,49]. In this province, the Northern Iranian region hosts five gold and base metal deposits. Other types of deposits in this range include placer gold, an underground mine for turquoise at Baghu, skarn deposits, and Pb-Zn deposits in carbonate rocks.

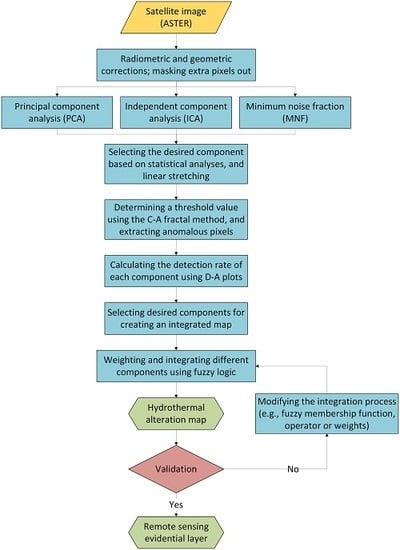
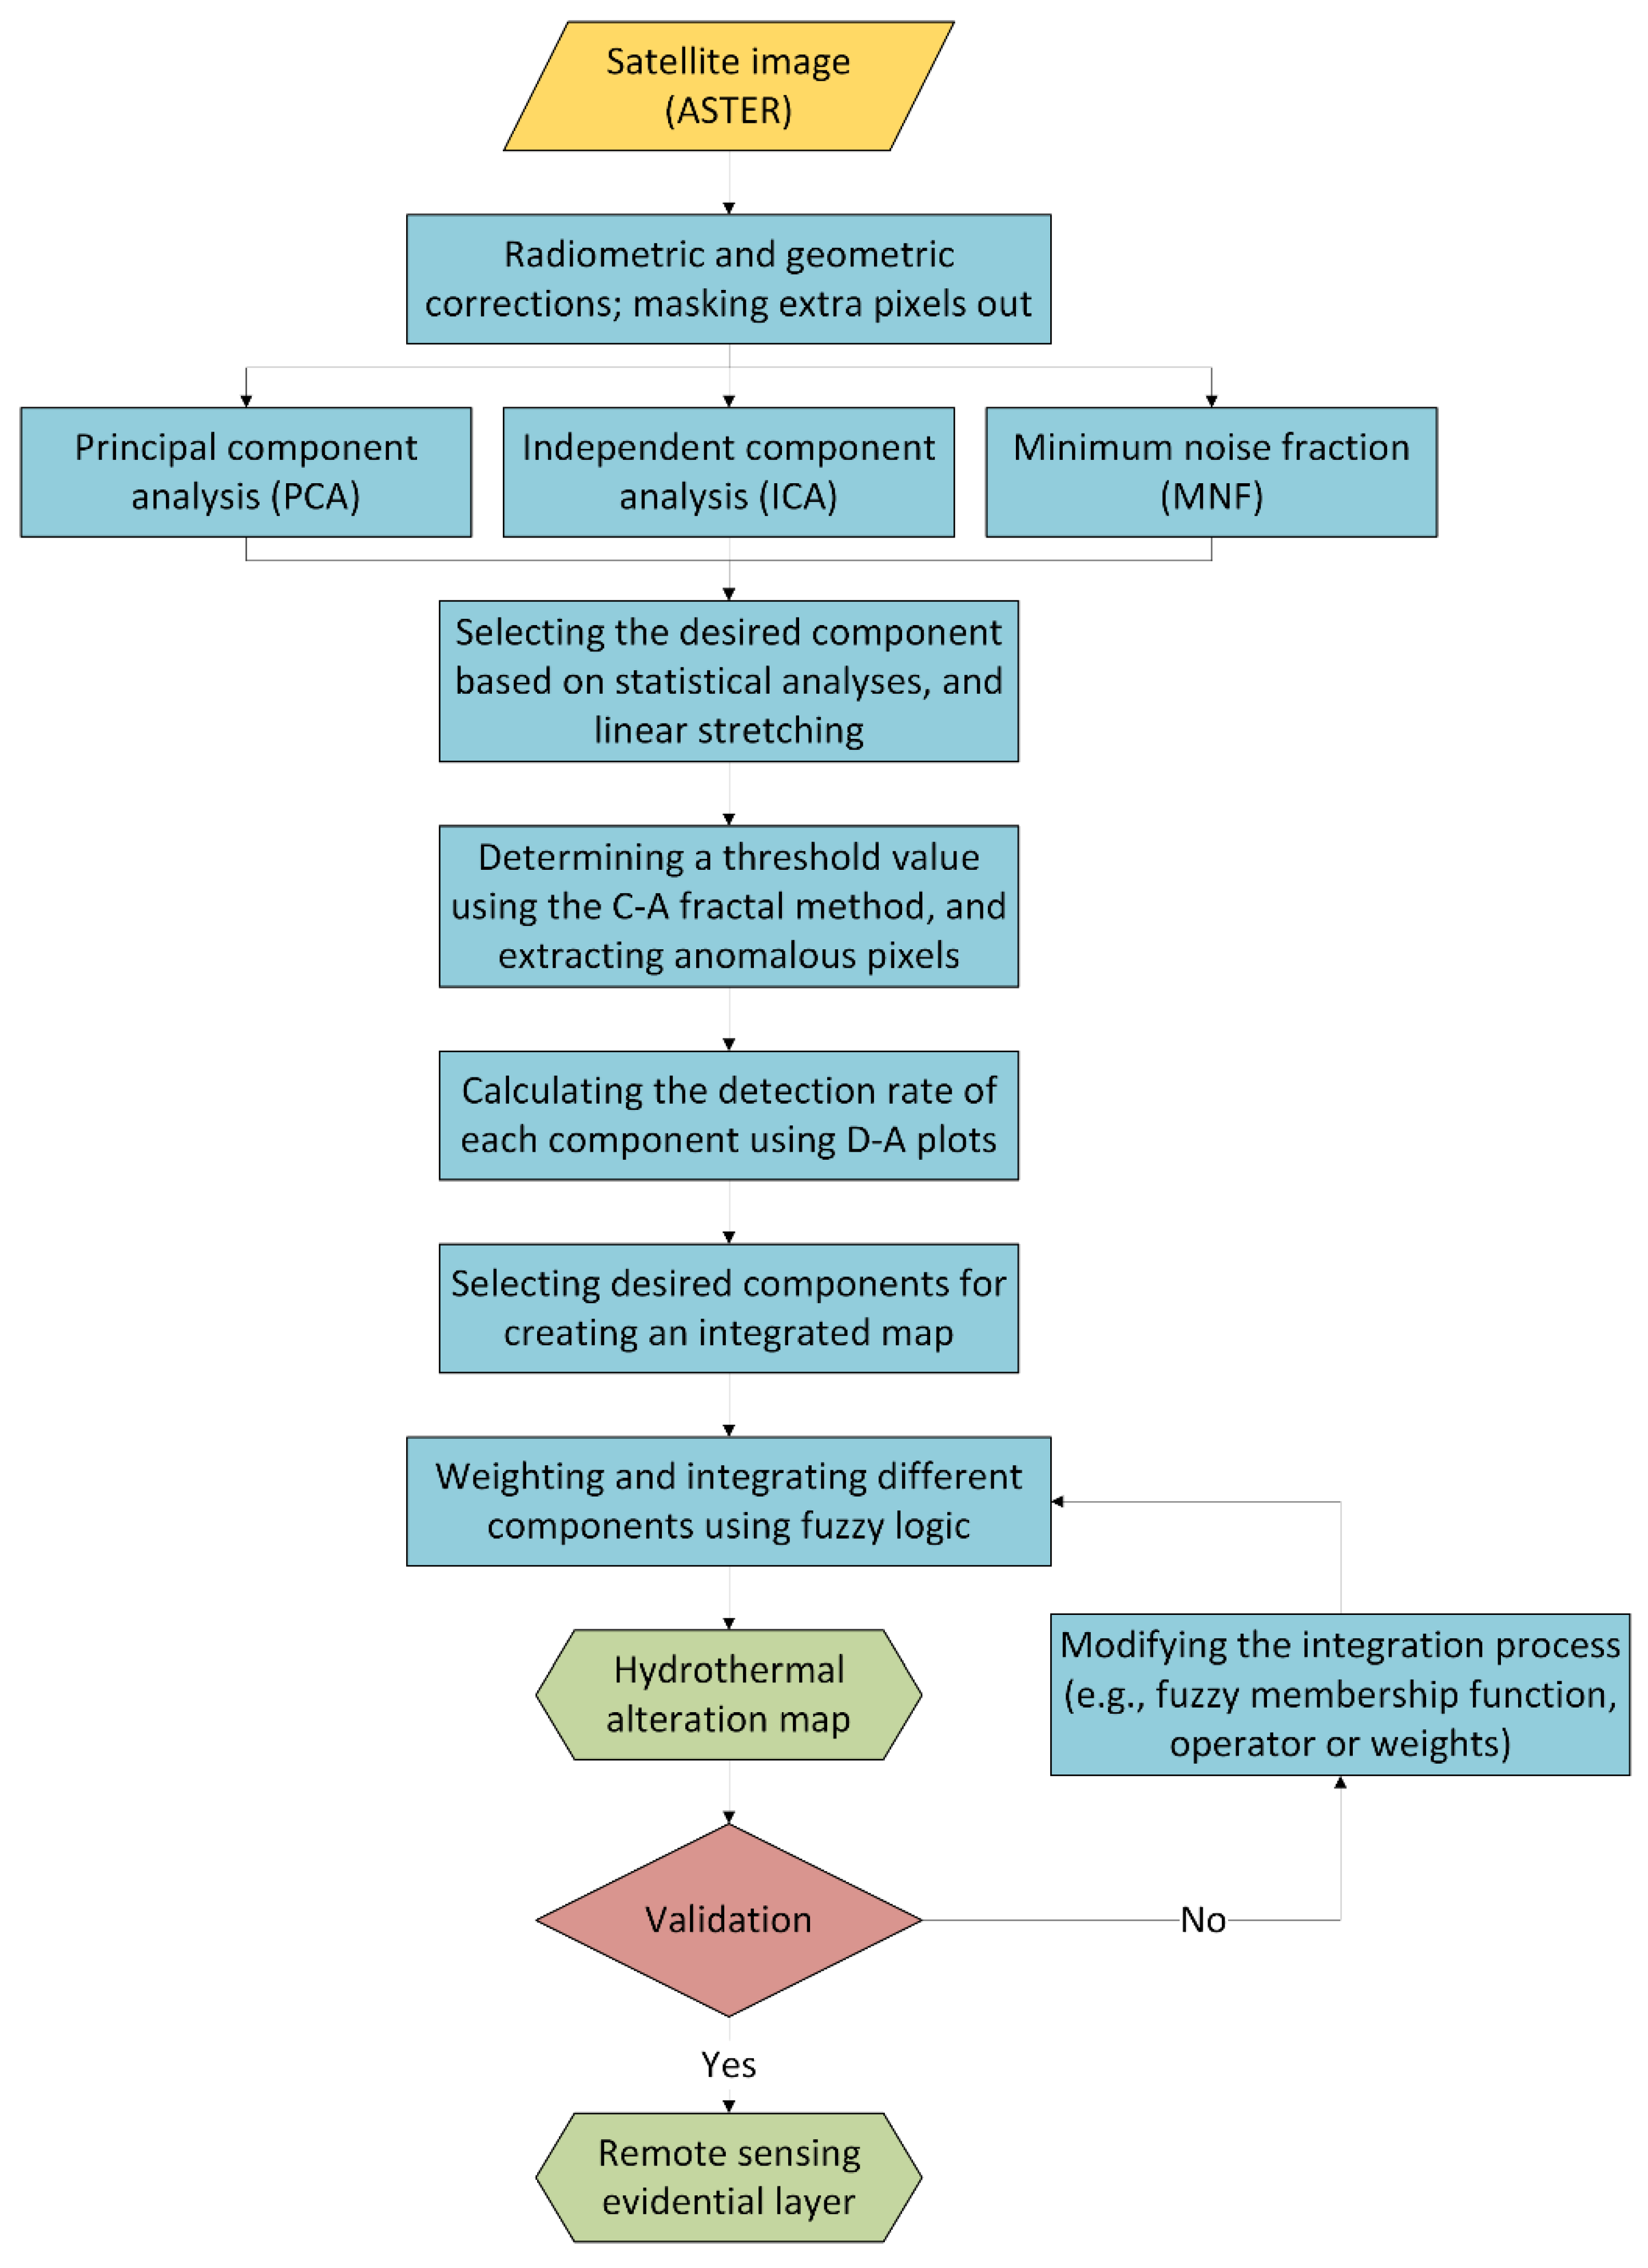
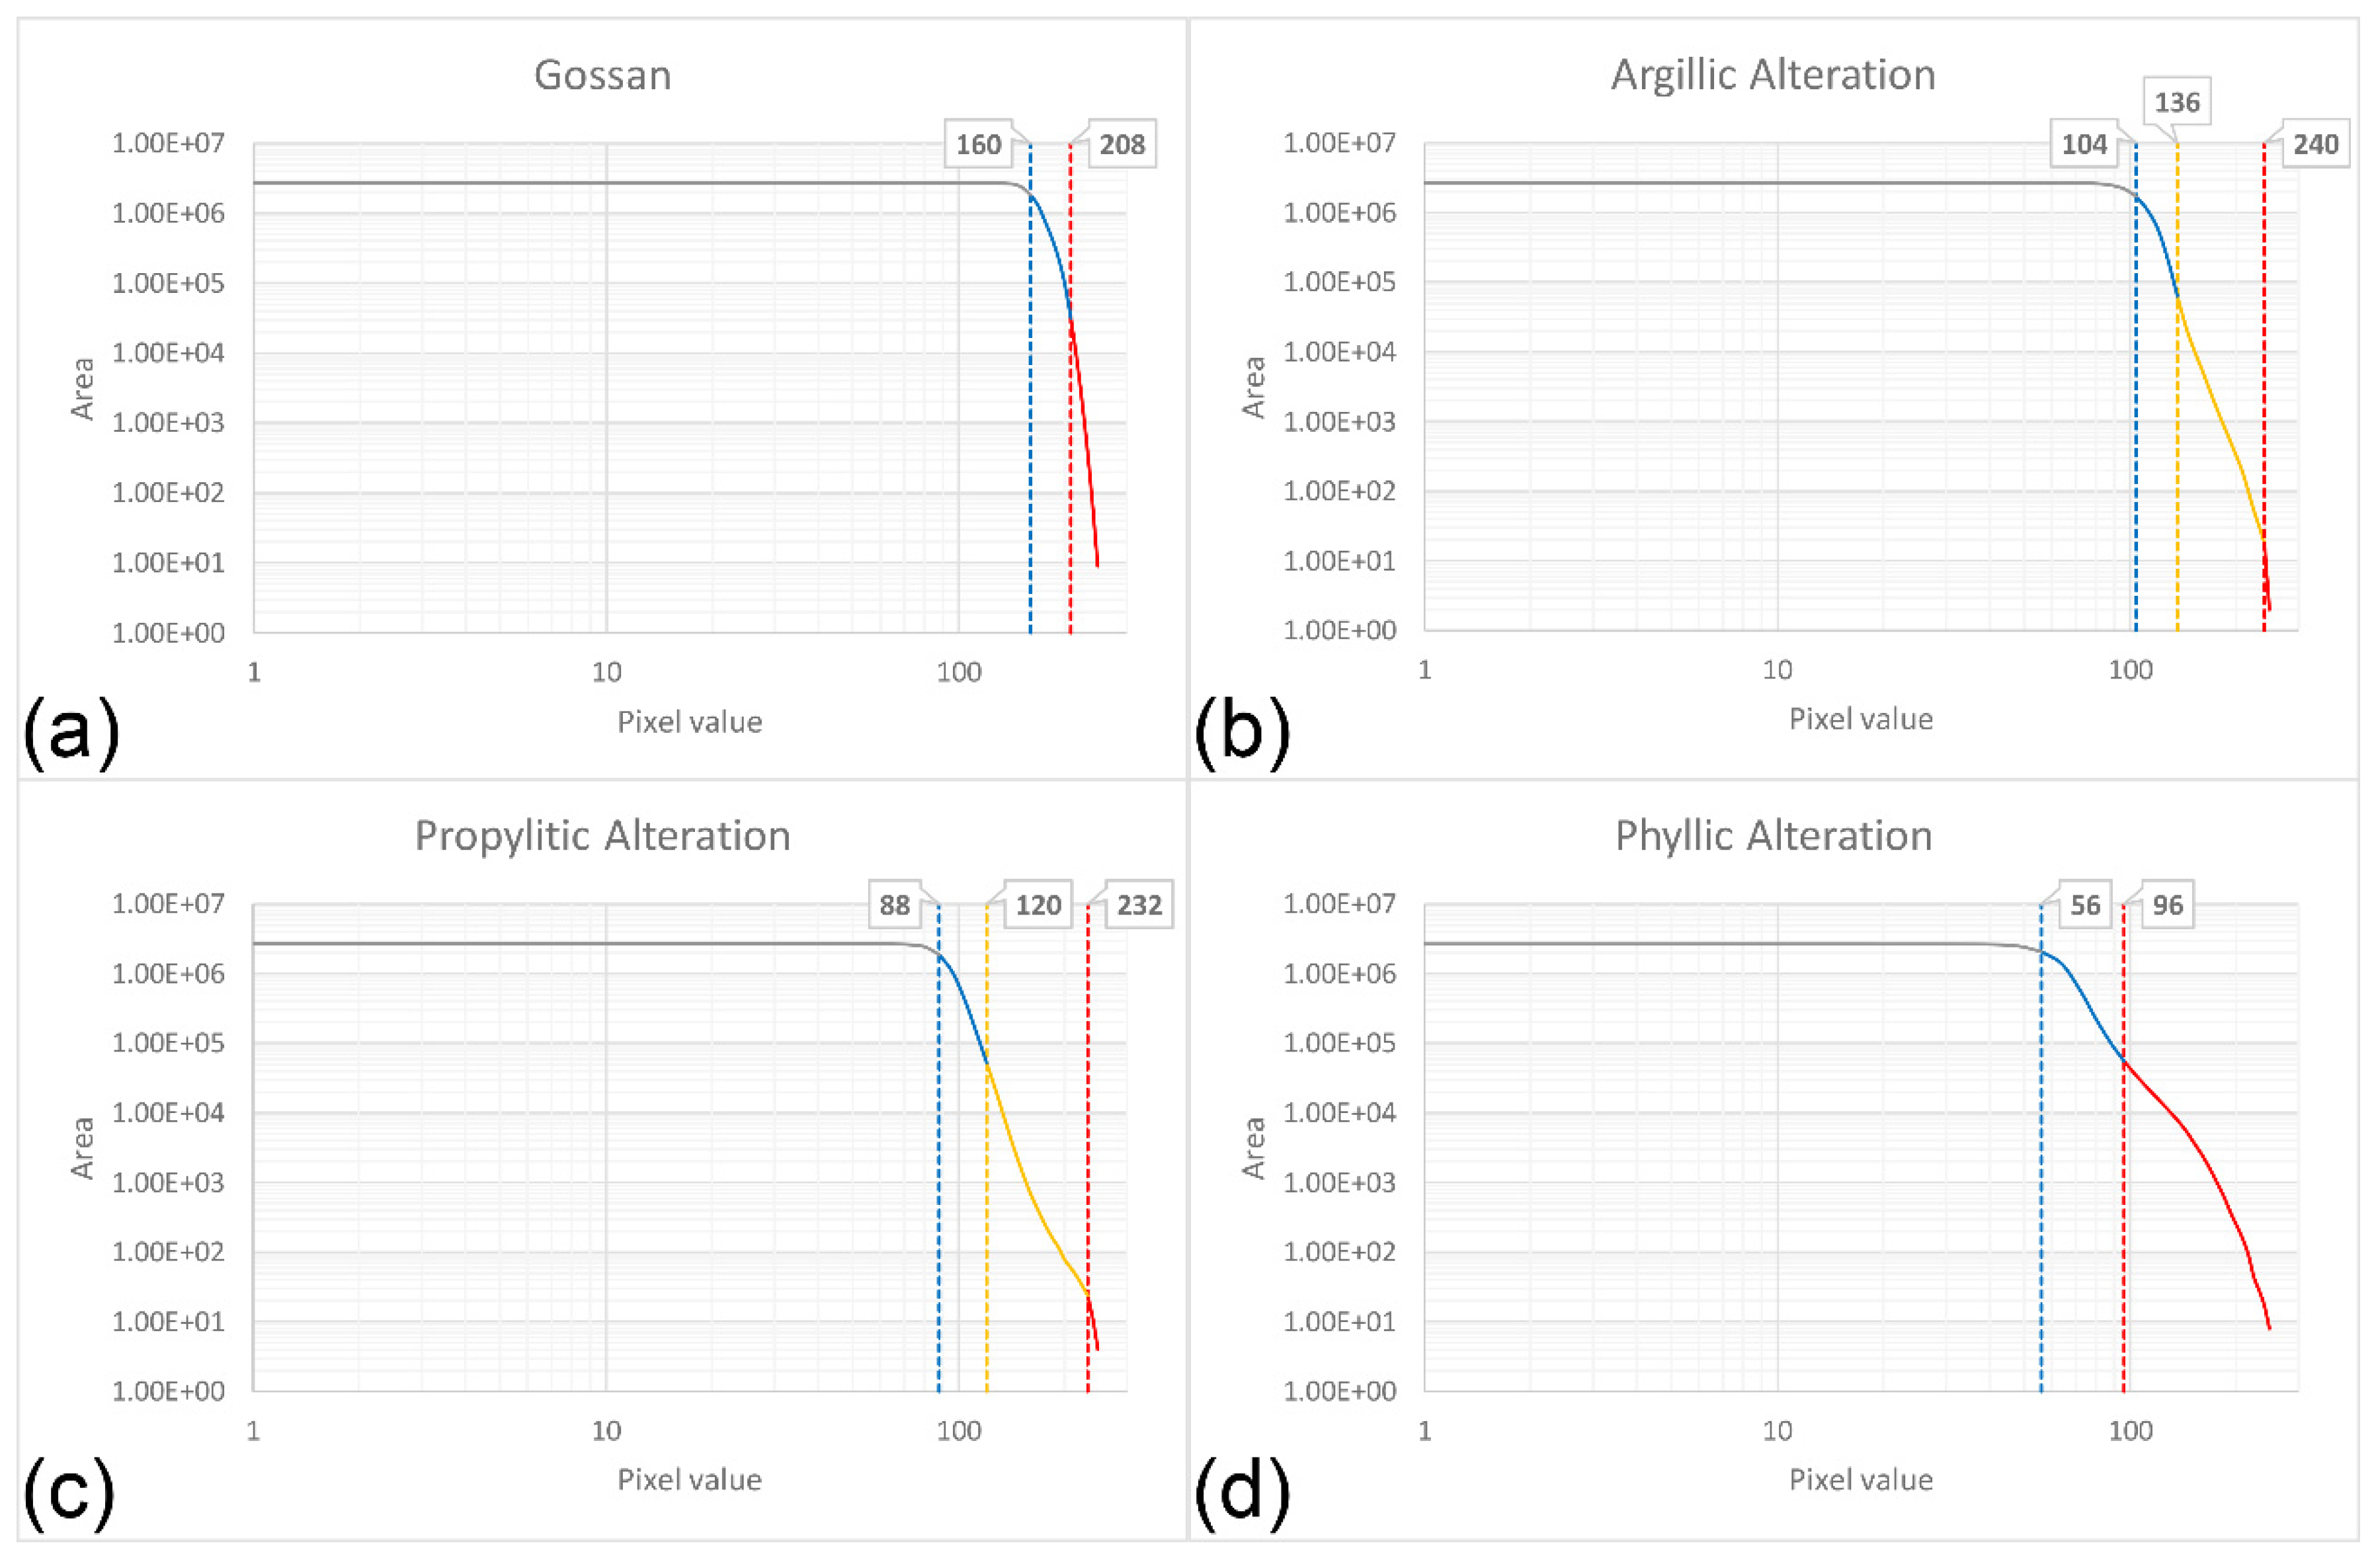
3. Materials and Methods

3.1. ASTER Data Characteristics and Pre-Processing

The ASTER remote sensing data are the result of a joint plan between the United States and Japan, with a strong focus on geological and mineral exploration applications [51]. This sensor, which is aboard the Earth observing system (EOS) Terra platform, records solar radiation in 14 spectral bands [14,52]. It measures the reflected radiation in three subsets, including visible and near infrared (VNIR), short-wave infrared (SWIR), and thermal infrared (TIR). The VNIR consists of three bands between 0.52 and 0.86 micrometers (μm), the SWIR includes six bands from 1.6 to 2.43 μm, and emitted radiation in five bands in the 8.125–11.65 μm wavelength region constitute the TIR. The resolution of VNIR, SWIR, and TIR is 15 meters (m), 30 m, and 90 m, respectively [53]. Many clay and carbonate minerals show diagnostic spectral features in the short-wave infrared range, where the ASTER sensor provides six spectral bands [54]. According to the geological setting and metallogenetic characteristics of the study area, and different types of the hydrothermal alteration associated with epithermal mineral deposits [55,56,57,58], we used the ASTER data for mapping the hydrothermal alteration zones.
We used two cloud-free level 1 precision terrain corrected and registered at-sensor radiance (AST_L1T) ASTER scenes in this study. These scenes downloaded from the US Geological Survey Earth Explorer [59], were both acquired on October 3, 2004. The ASTER AST_L1T data was calibrated at-sensor radiance, which corresponded to ASTER Level 1B (AST_L1B); which was geometrically corrected, and rotated to a north-up universal transverse Mercator projection [60]. The ASTER scenes used in this study were pre-georeferenced to the UTM zone 40 North. The QUAC module within the ENVI software package [61], which works with the visible and near-infrared to short-wave infrared (VNIR–SWIR) wavelength range, was used to provide an atmospheric-corrected surface reflectance image of the study area. Moreover, this module was a quick solution for converting radiance-calibrated data to apparent reflectance. Eventually, the SWIR bands were resampled to the spatial resolution of VNIR using the nearest neighbor technique.

3.2. Image Processing

3.2.1. Principal Component Analysis

Principal component analysis aims at finding a set of linearly uncorrelated components called principal components, which can be considered to be projections from the original data [62,63,64]. In other words, the principal components are the projection of input data onto the principal axes or eigenvectors. The output components are arranged on the basis of the variance, in descending order. The first principal component has the largest variance and the next component has the next highest variance. There is a constraint that each component has to be orthogonal to the preceding components [65,66]. In PCA, the same number of output principal components as input spectral bands can be generated. Although, a small number of principal components often involve the majority of the variance in the data and provide most of the information about the structure of the data [67,68]. In this study, we assumed a normal data distribution and used the covariance matrix for calculating the principal components. The principal component with the loadings, which shows a similar trend to the spectral characteristics of the target alteration minerals, is considered to be the appropriate component for enhancing the target zones. The selected principal component image contains a unique contribution of eigenvector loadings in terms of magnitude and sign, for the absorption and reflection bands of an alteration mineral or mineral group. This feature helps by enhancing the target alteration zone.

3.2.2. Independent Component Analysis

Independent component analysis is known to be an efficient statistical signal processing technique for decomposing a set of multivariate signals into statistically independent streams, without losing much information [69]. ICA is able to reveal hidden features that underlie sets of random signals and attempts to make the separated signals as independent as possible. The independent components and the mixture signals are always assumed to have a zero mean and a unit variance, in order to simplify the model without a loss of generality. This assumption leads to no variance ranking of the independent components. There are many mature algorithms available for implementing ICA using various estimators of independence. In this study, we choose the fast ICA that uses a fixed-point algorithm for an approximation of negentropy as a measurement of independence, for data processing, due to its computing efficiency, flexible parameters, and robustness [70]. In information theory and statistics, negentropy is used as a measure of distance to normality [71]. Unlike the PCA, which is based on the assumptions of uncorrelation and normality, ICA is rooted in the assumption of statistical independence. PCA only requires the second-order statistics, while ICA looks for statistically independent components, a much stronger condition than being uncorrelated. In addition, ICA components are not necessarily geometrical orthogonal. The most important difference is that ICA needs a linear model to describe data while PCA does not. Therefore, ICA cannot be considered as a generalization of PCA [72].

3.2.3. Minimum Noise Fraction

Minimum noise fraction is known to be an efficient technique for reducing the dimensions of a large dataset into a smaller number of components that involve the majority of information [42]. This technique was similar to the PCA, but the resulting components were not necessarily orthogonal and were arranged according to the signal-to-noise ratio, in descending order. MNF is applied for discriminating between noise and signal in a dataset. Moreover, this technique is able to determine the inherent dimensionality of an image [28]. The MNF transform implemented in this study involved two cascaded PCA transformations. The first transformation is called noise-whitening and is based on an estimated noise covariance matrix that aims at decorrelating and rescaling the noise in the data. The second step is a standard PCA transformation of the noise-reduced data. The number of output components can be as many as the input bands, with a decreasing overall variance of the dataset from the first component to the last. Similar to other transformation techniques, only a small number of components were often required to describe most of the information for the entire dataset. The contribution of each component to the overall information in a multivariate dataset, such as multispectral or hyperspectral images, is measured by an eigenvalue. The output components can be divided into two parts, including the part associated with large eigenvalues and the other with near-unity eigenvalues and noise-dominated images. The part with large eigenvalues separates the noise from the data, and improves spectral results [42]. The contribution of each band to each component is measured by an eigenvector, which can be interpreted akin to a correlation coefficient [73]. The dimensionality reduction techniques used in this study, were executed using the ENVI software package [61].

3.2.4. Hydrothermal Alteration Mapping by the PCA, ICA, and MNF Techniques

In this study, the PCA, ICA, and MNF techniques were applied to specific subsets of the ASTER spectral bands. The subsets were selected according to the characteristic spectral features of key alteration minerals in the VNIR and SWIR ranges of the electromagnetic spectrum. The selected spectral bands involved absorption and reflection diagnostic features of the indicative minerals in each alteration zone. In this study, we targeted the detection of gossans and different types of hydrothermal alterations, including argillic, propylitic, and phyllic, which were mainly related to the epithermal ore deposits. The laboratory spectra of these types of alteration minerals are available in Figure 2, which were resampled to the ASTER spectral bands [74]. Gossans are important guides to buried metallic ore deposits and are usually found in the upper and exposed part of an ore deposit or mineral vein, which involves intensely oxidized and weathered rocks [75]. Iron oxide and hydroxide minerals such as goethite, hematite, jarosite, and limonite are known to be indicative minerals of a gossan [75]. According to Figure 2a, these minerals showed an absorption feature in bands 1–3, located in the VNIR portion of the electromagnetic spectrum due to electronic transitions, and a reflectance feature in band 4 (1.65 μm). Therefore, we selected bands 1–4 as the input to the PCA, ICA, and MNF techniques for mapping gossans.
The indicative minerals that were considered for each hydrothermal alteration zone included alunite, illite, kaolinite, and montmorillonite for argillic; calcite, chlorite, and epidote for propylitic; and illite and muscovite for the phyllic alteration zones. As shown in Figure 2b, the clay minerals that constituted the major part of argillic alteration and usually exhibited aluminum hydroxide spectral features caused by vibrational processes, showed an absolute and relative reflectance feature in bands 4 (1.65 μm) and 7 (2.26 μm), respectively. Moreover, there was an absolute absorption in band 5 (2.165 μm). Therefore, we selected bands 1, 4, 5, and 7 as a spectral subset for enhancing the argillic alteration zones. According to Figure 2c, the indicative minerals of propylitic alteration, particularly chlorite and epidote showed an absolute and relative reflection in bands 5 (2.165 μm) and 4 (1.65 μm). Additionally, there was an absolute absorption in band 8 (2.33 μm) that was attributed to the vibrations of OH groups bound to the Fe and Mg cations. Therefore, we selected bands 1, 4, 5, and 8 as a spectral subset for enhancing propylitic alteration zones. According to the field observation, illite and muscovite minerals constituted most of the phyllic alteration zones in the study area. As shown in Figure 2d, there was an absolute and relative reflectance in bands 4 (1.65 μm) and 7 (2.26 μm), respectively. Additionally, there was an absolute absorption in band 6 (2.205 μm), due to the presence of aluminum hydroxide compound. Therefore, we selected bands 1, 4, 6, and 7 as a spectral subset for enhancing the phyllic alteration zones.
We used statistical analyses for selecting the meaningful component for enhancing each alteration type, derived from different transformation techniques. The concentration-area (C-A) fractal method was applied for determining an appropriate threshold for discriminating between the anomaly population and the background in each selected component [76]. The number of correctly classified rock samples was used to assess the accuracy of each selected component in terms of consistency with field observations, and to help us find the appropriate transformation technique for mapping each alteration type [77].

3.3. Integration of Hydrothermal Alteration Thematic Layers Using Fuzzy Logic

We used a logistic function for scaling input components to the integration process between 0 and 1 [78]. These components were integrated using a knowledge-driven approach based on fuzzy logic. The components were weighted from 1 to 10, using a subjective judgement based on the metallogenic models presented for hydrothermal mineralization and expert knowledge [79,80,81]. The more favorable the alteration type, the higher weight it took. The phyllic alteration is known to be highly associated with hydrothermal mineralization and is usually found close to the center of a mineralization system [82,83]. This alteration type is given the highest weight equal to 9. The argillic alteration and gossans are considered to be exploration guides and are usually not associated with target hydrothermal mineralization [84]. They are usually found in the surrounding regions of mineralization and were weighted 7. The propylitic alteration usually constitute the outermost ring of hydrothermal mineralization on the ground surface [85] and was given the lowest weight equal to 3. We applied the fuzzy gamma operator for integrating input components. The fuzzy gamma operator allowed a judicious choice of gamma, leading to an output that ensured a flexible compromise between the increasing trend of fuzzy algebraic sum and the decreasing effect of fuzzy algebraic product [86]. In this study, the fuzzy gamma operator was experimented with changing gamma values in the range of 0 and 1. The most satisfying map was obtained when the gamma equaled 0.9, which yielded the highest prediction rate based on the prediction-area (P-A) plots. We used the prediction-area plots in order to quantitatively validate the remote sensing evidential layers derived from the integration of transformation techniques, using different gamma values [87]. Moreover, we investigated the spatial association of anomalous zones and known hydrothermal mineral occurrences. The detailed methodology flowchart of this study is presented in Figure 3.

3.4. Field Survey

A field survey was planned for collecting samples from the detected hydrothermal alteration zones and verifying the results. We used a handheld global positioning system navigator (Garmin eTrex 10), with an accuracy of less than 15 m, for recording the coordinates of the samples. Overall, 55 rock samples were collected from different alteration zones and lithological units, for the microscopic studies and X-ray diffraction (XRD) analysis. The XRD analysis was carried out using Bruker AXS D8 Advance at the University of Tehran. The field data were used for selecting the appropriate transformation technique for enhancing each alteration type.

4. Results

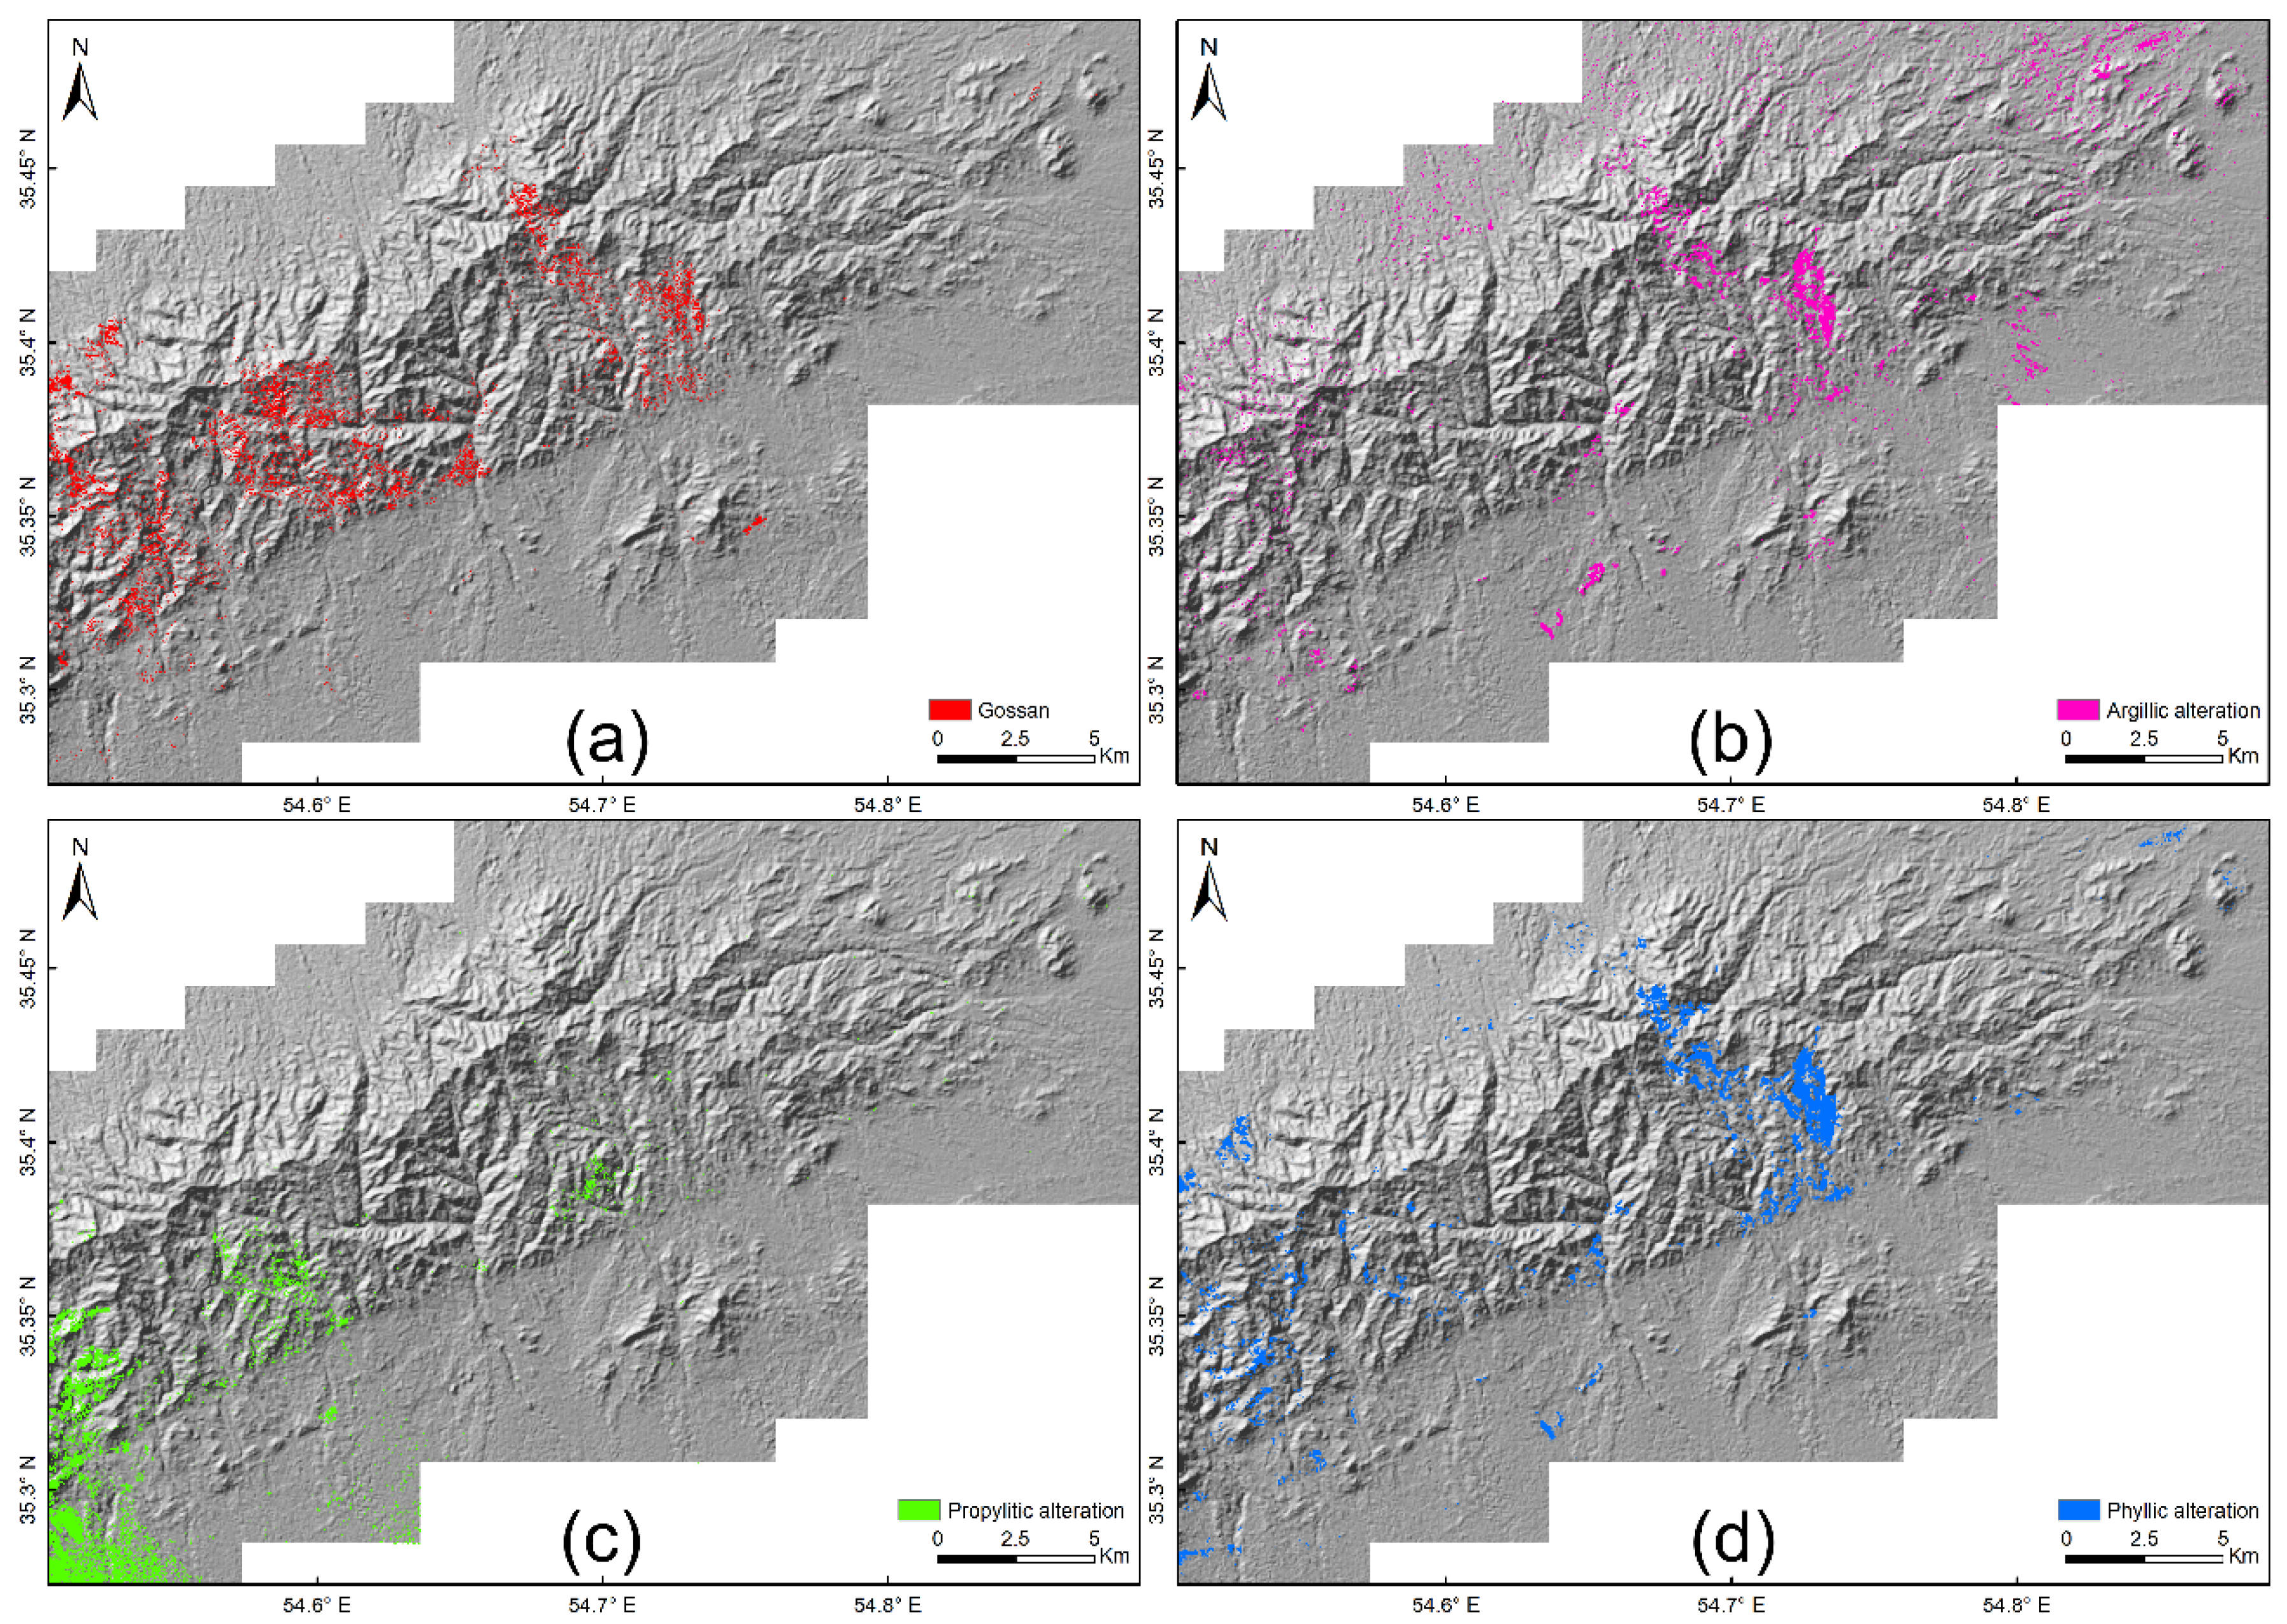
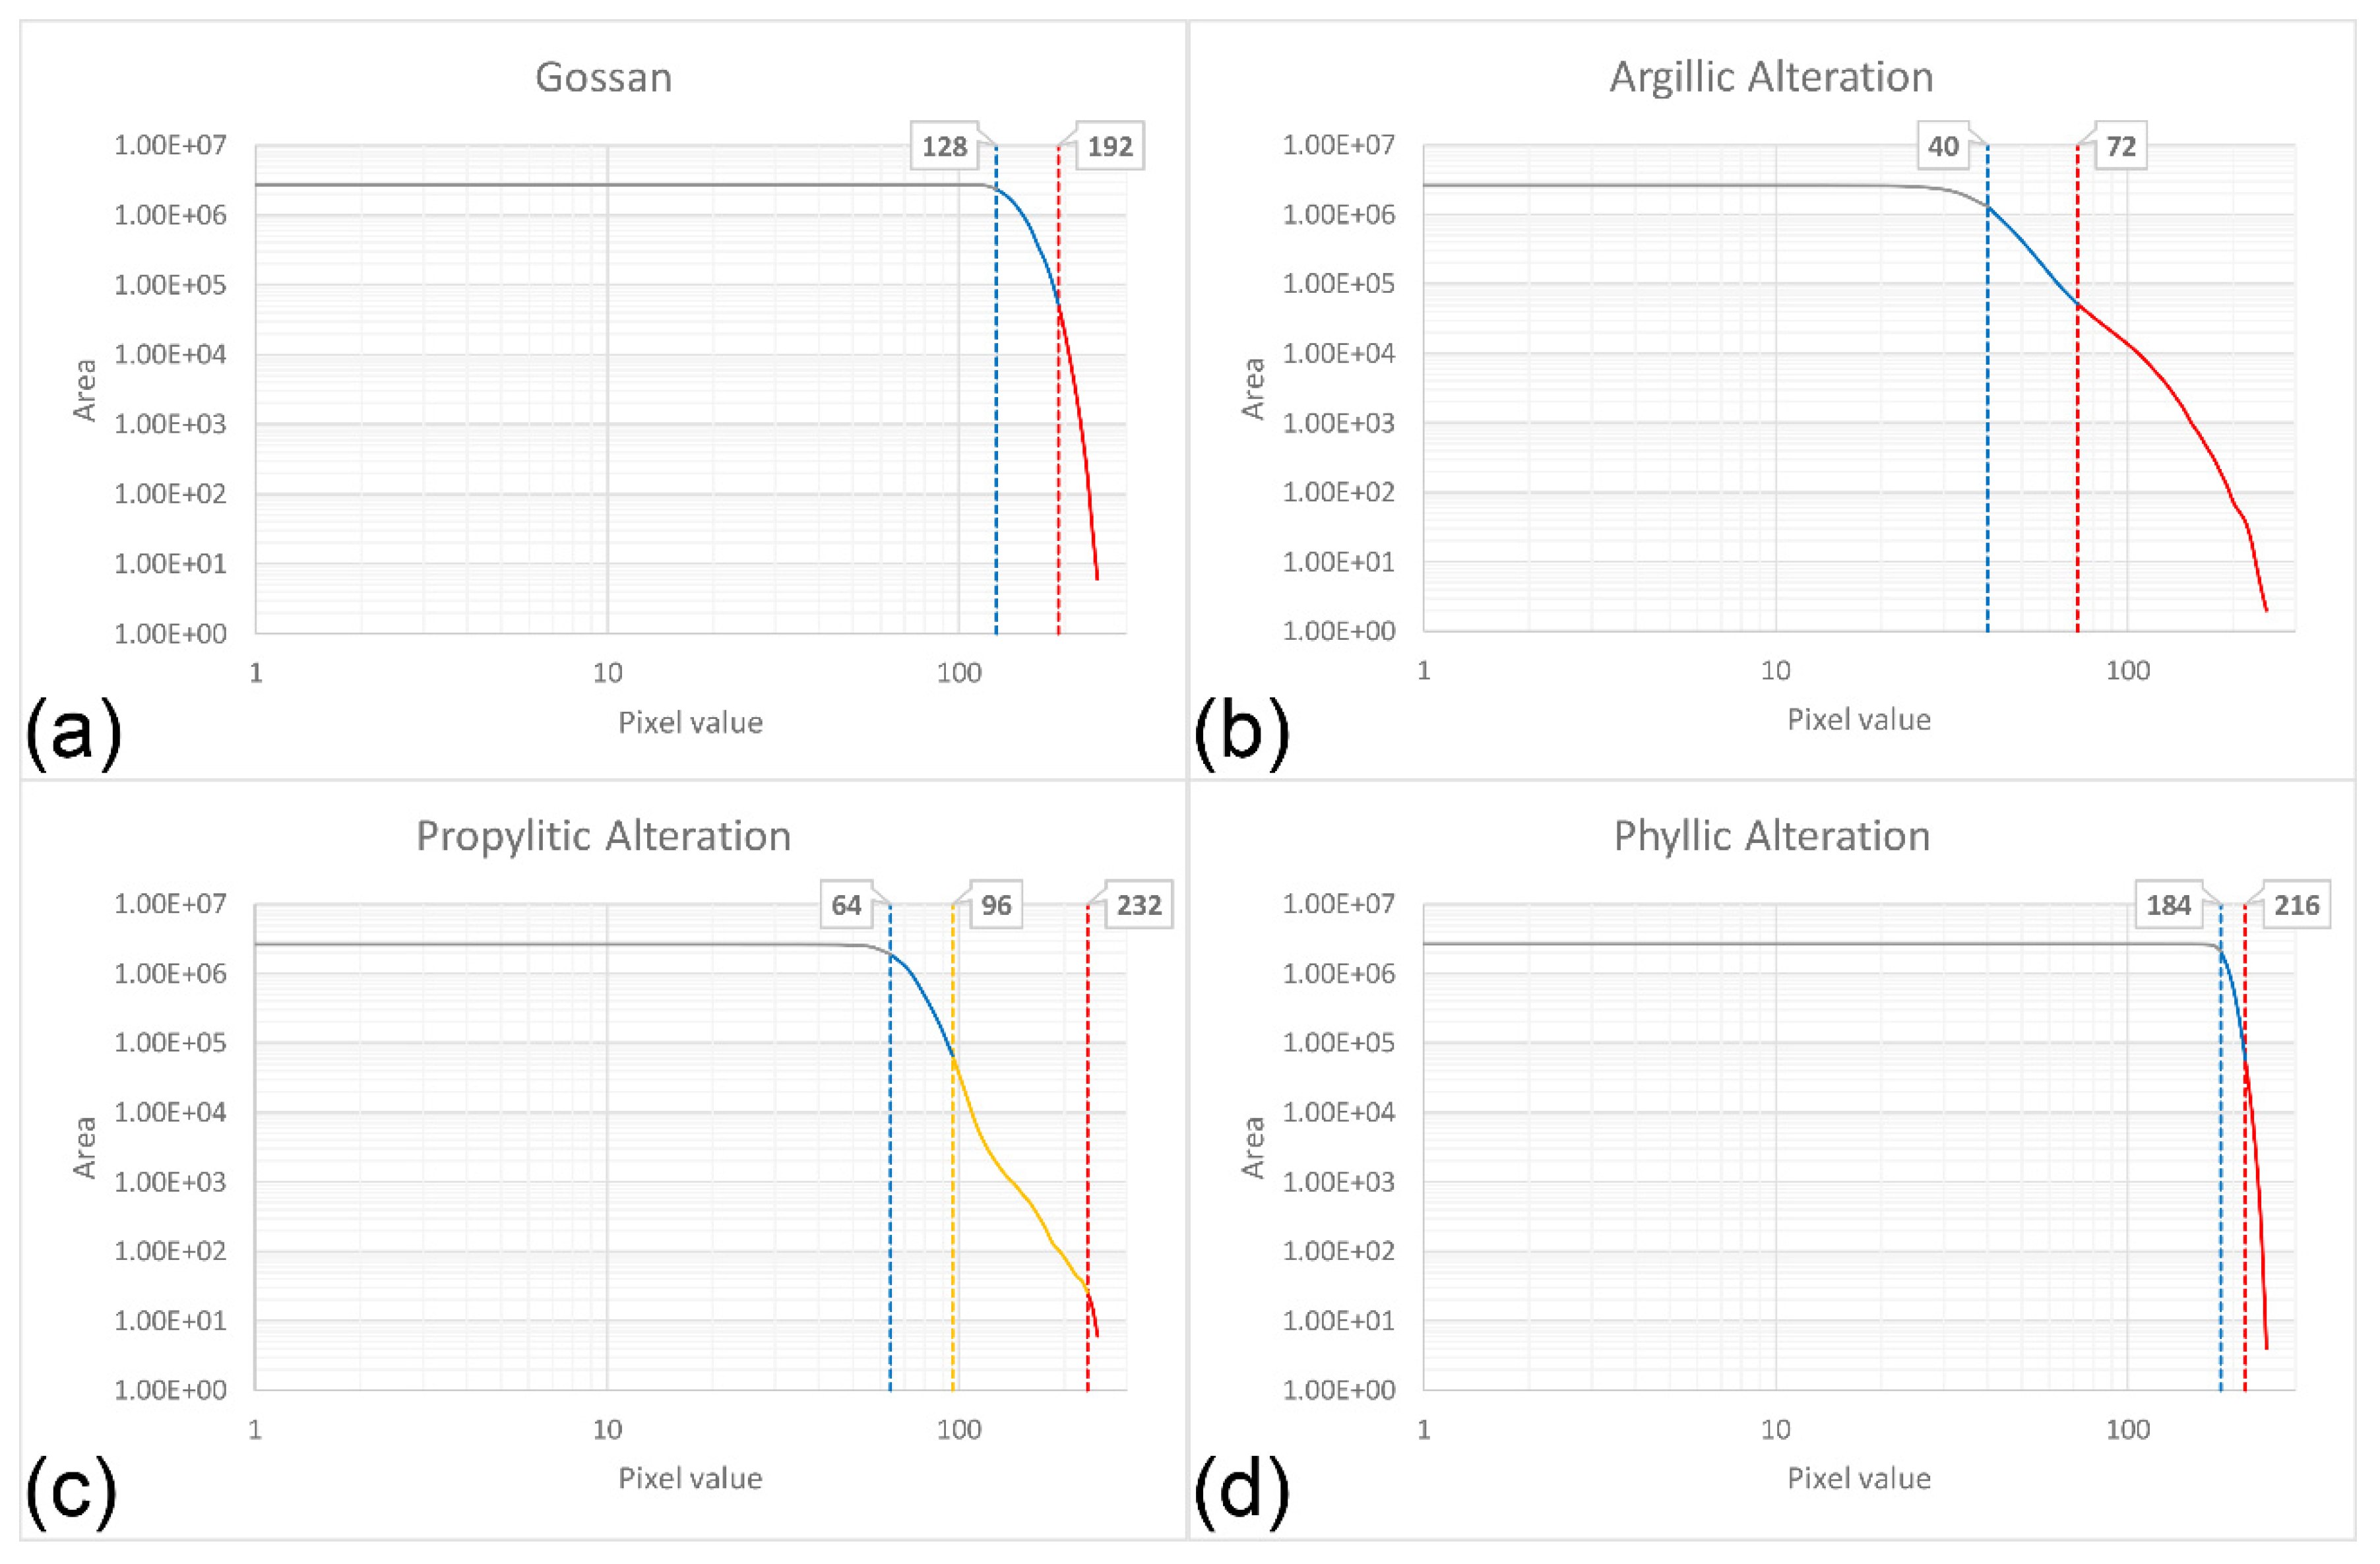
4.1. Hydrothermal Alteration Mapping Using PCA

The eigenvectors of each selective principal component analysis used for enhancing the gossans, argillic, propylitic, and phyllic alteration zones presented in Table 1, Table 2, Table 3 and Table 4, respectively. The eigenvectors of each selective PCA are plotted in Figure 4. According to the spectral characteristics of the indicative minerals in the gossans shown in Figure 2a and the graphs presented in Figure 4a, negated PC 2 in PCA (1234) was considered for enhancing the gossans. This principal component showed a high negative loading in band 4 and an average constant and positive loading in bands 1–3. The relevant eigenvector showed a similar, but reverse trend, compared to the spectral graphs of the indicative minerals in gossans, such as jarosite. Therefore, the target areas appear in dark pixels in the original component, which had to be negated.
According to Table 2 and Figure 4b, the negated PC 4 in PCA (1457) was considered to be the component that could be used for enhancing the argillic alteration zones. In the relevant eigenvector, there was a large difference between the loadings in bands 5 and 7, and they showed opposite signs. This large difference was consistent with the spectral behavior of the indicative minerals in argillic alteration zones, such as alunite and kaolinite. The target areas appeared as dark pixels due to the reverse trend of the relevant eigenvector, compared to the target spectral behavior, thus the negated component was used for mapping the anomalous pixels. Based on the results presented in Table 3 and Figure 4c, the negated PC 4 in PCA (1458) enhanced the propylitic alteration zones. The relevant eigenvector to this PC showed a large difference between the loadings in bands 5 and 8, with opposite signs. This was similar to the spectral behavior of the indicative minerals in the propylitic alteration zones, such as chlorite and epidote. Similar to the reason mentioned above for the argillic alteration zones, the target zone in this component also appeared in dark pixels, and the negated component was used for enhancing the phyllic alteration zones.
According to Table 4 and Figure 4d, PC 3 in PCA (1467) was considered to be the component that could be used for enhancing the phyllic alteration zones. The relevant eigenvector showed a large difference between the loadings in bands 6 and 7, with opposite signs. Although PC 4 showed a larger difference, only the relevant eigenvector to PC 3 followed a similar trend to the spectral graphs of the indicative minerals in the phyllic alteration zones, such as muscovite. The anomalous areas in this component are displayed in bright pixels.
The principal components obtained were in the form of grayscale images and needed to be converted into binary images, through mapping alteration zones. Based on the pixel values, C-A plots were generated on a logarithmic scale for each principal component selected, to enhance the different alteration zones. These plots are presented in Figure 5. The inflection points in these plots were considered to be the appropriate thresholds for separating the different populations, including background and anomaly. In Figure 6, we present the enhanced alteration zones, using PCA based on the C-A fractal method. The alteration zones were overlaid on the hillshade of the study area created by the ASTER digital elevation model.

4.2. Hydrothermal Alteration Mapping Using ICA

We applied the same spectral subsets used in PCA for independent component analysis and for enhancing the target alteration zones. Before performing the independent component forward calculation, we used the principal component rotation for data whitening with the same eigenvectors, as presented in Table 1, Table 2, Table 3 and Table 4. Two main discrepancies for extracting components using ICA were: (i) There was no order of magnitude associated with each component in ICA. This meant that no better or worse component could be selected and other criteria such as two-dimensional (2D) spatial coherence might be considered by the user. (ii) The extracted components were invariant to the sign of the sources [88]. There are different ways to determine the most suitable IC for enhancing a target alteration zone. One way is to compare the spectral profile of both anomalous bright and dark pixels of each IC with the reference spectra. The other is to compare anomalous pixels of each IC with known criteria, such as the known color of each alteration zone, in specific false color composite images. For instance, argillic, propylitic, and phyllic alteration zones are displayed in pink, light green, and dark magenta, in the false color composite image created using bands 4, 6, and 8 of the ASTER data in red, green, and blue channels, respectively.
In this study, the independent components were sorted, based on the 2D spatial coherence, which is the average of the two correlation coefficients. One correlation coefficient was calculated between each spectral band and a version of itself, offset by one line. The other correlation coefficient was calculated between each spectral band and a version of itself, offset by one sample. Using the 2D spatial coherence sorting, independent components that contained the spatial structure and most of the information, appeared first, and those that contained little spatial structure and more noise appeared last. Based on these results, negated IC 2, IC 3, negated IC 2, and negated IC 3 were recognized as the most suitable components for enhancing gossans, argillic, propylitic, and phyllic alteration zones, respectively. As shown in Figure 7, the appropriate threshold for separating the anomalous pixels of the selected ICs were determined using the C-A fractal plots. The enhanced alteration zones using the ICA and based on the C-A fractal plots are presented in Figure 8.

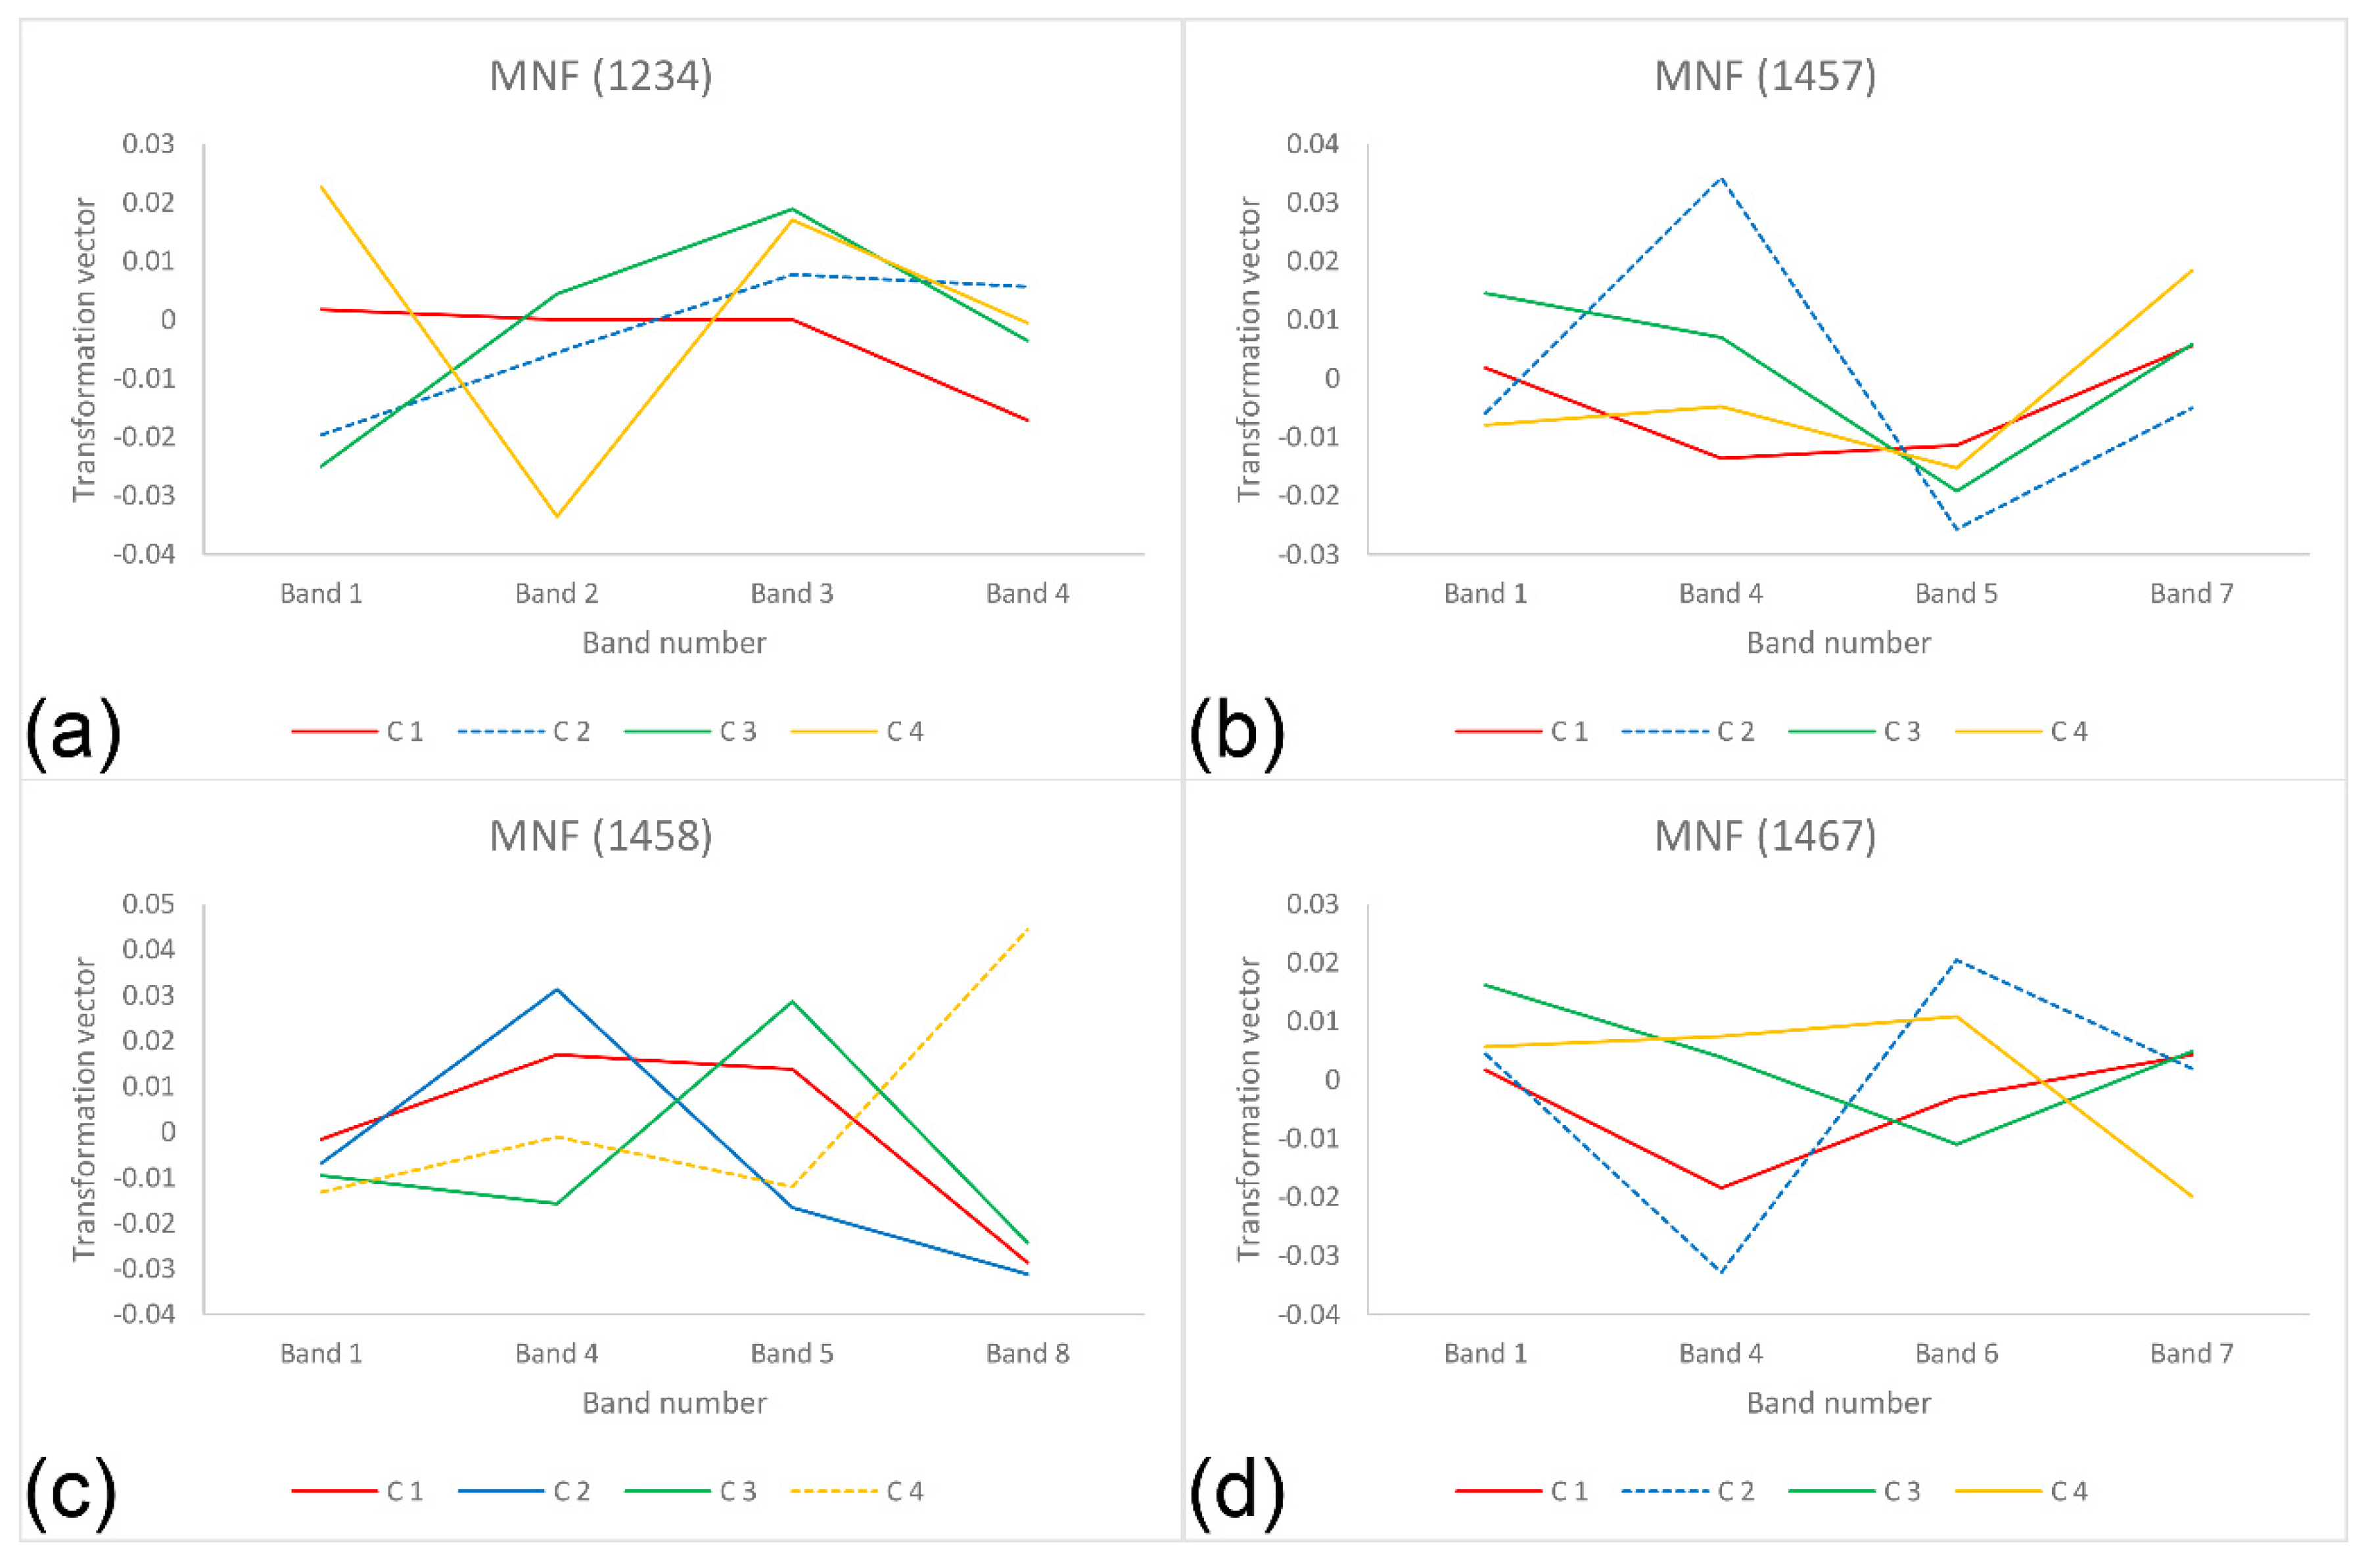
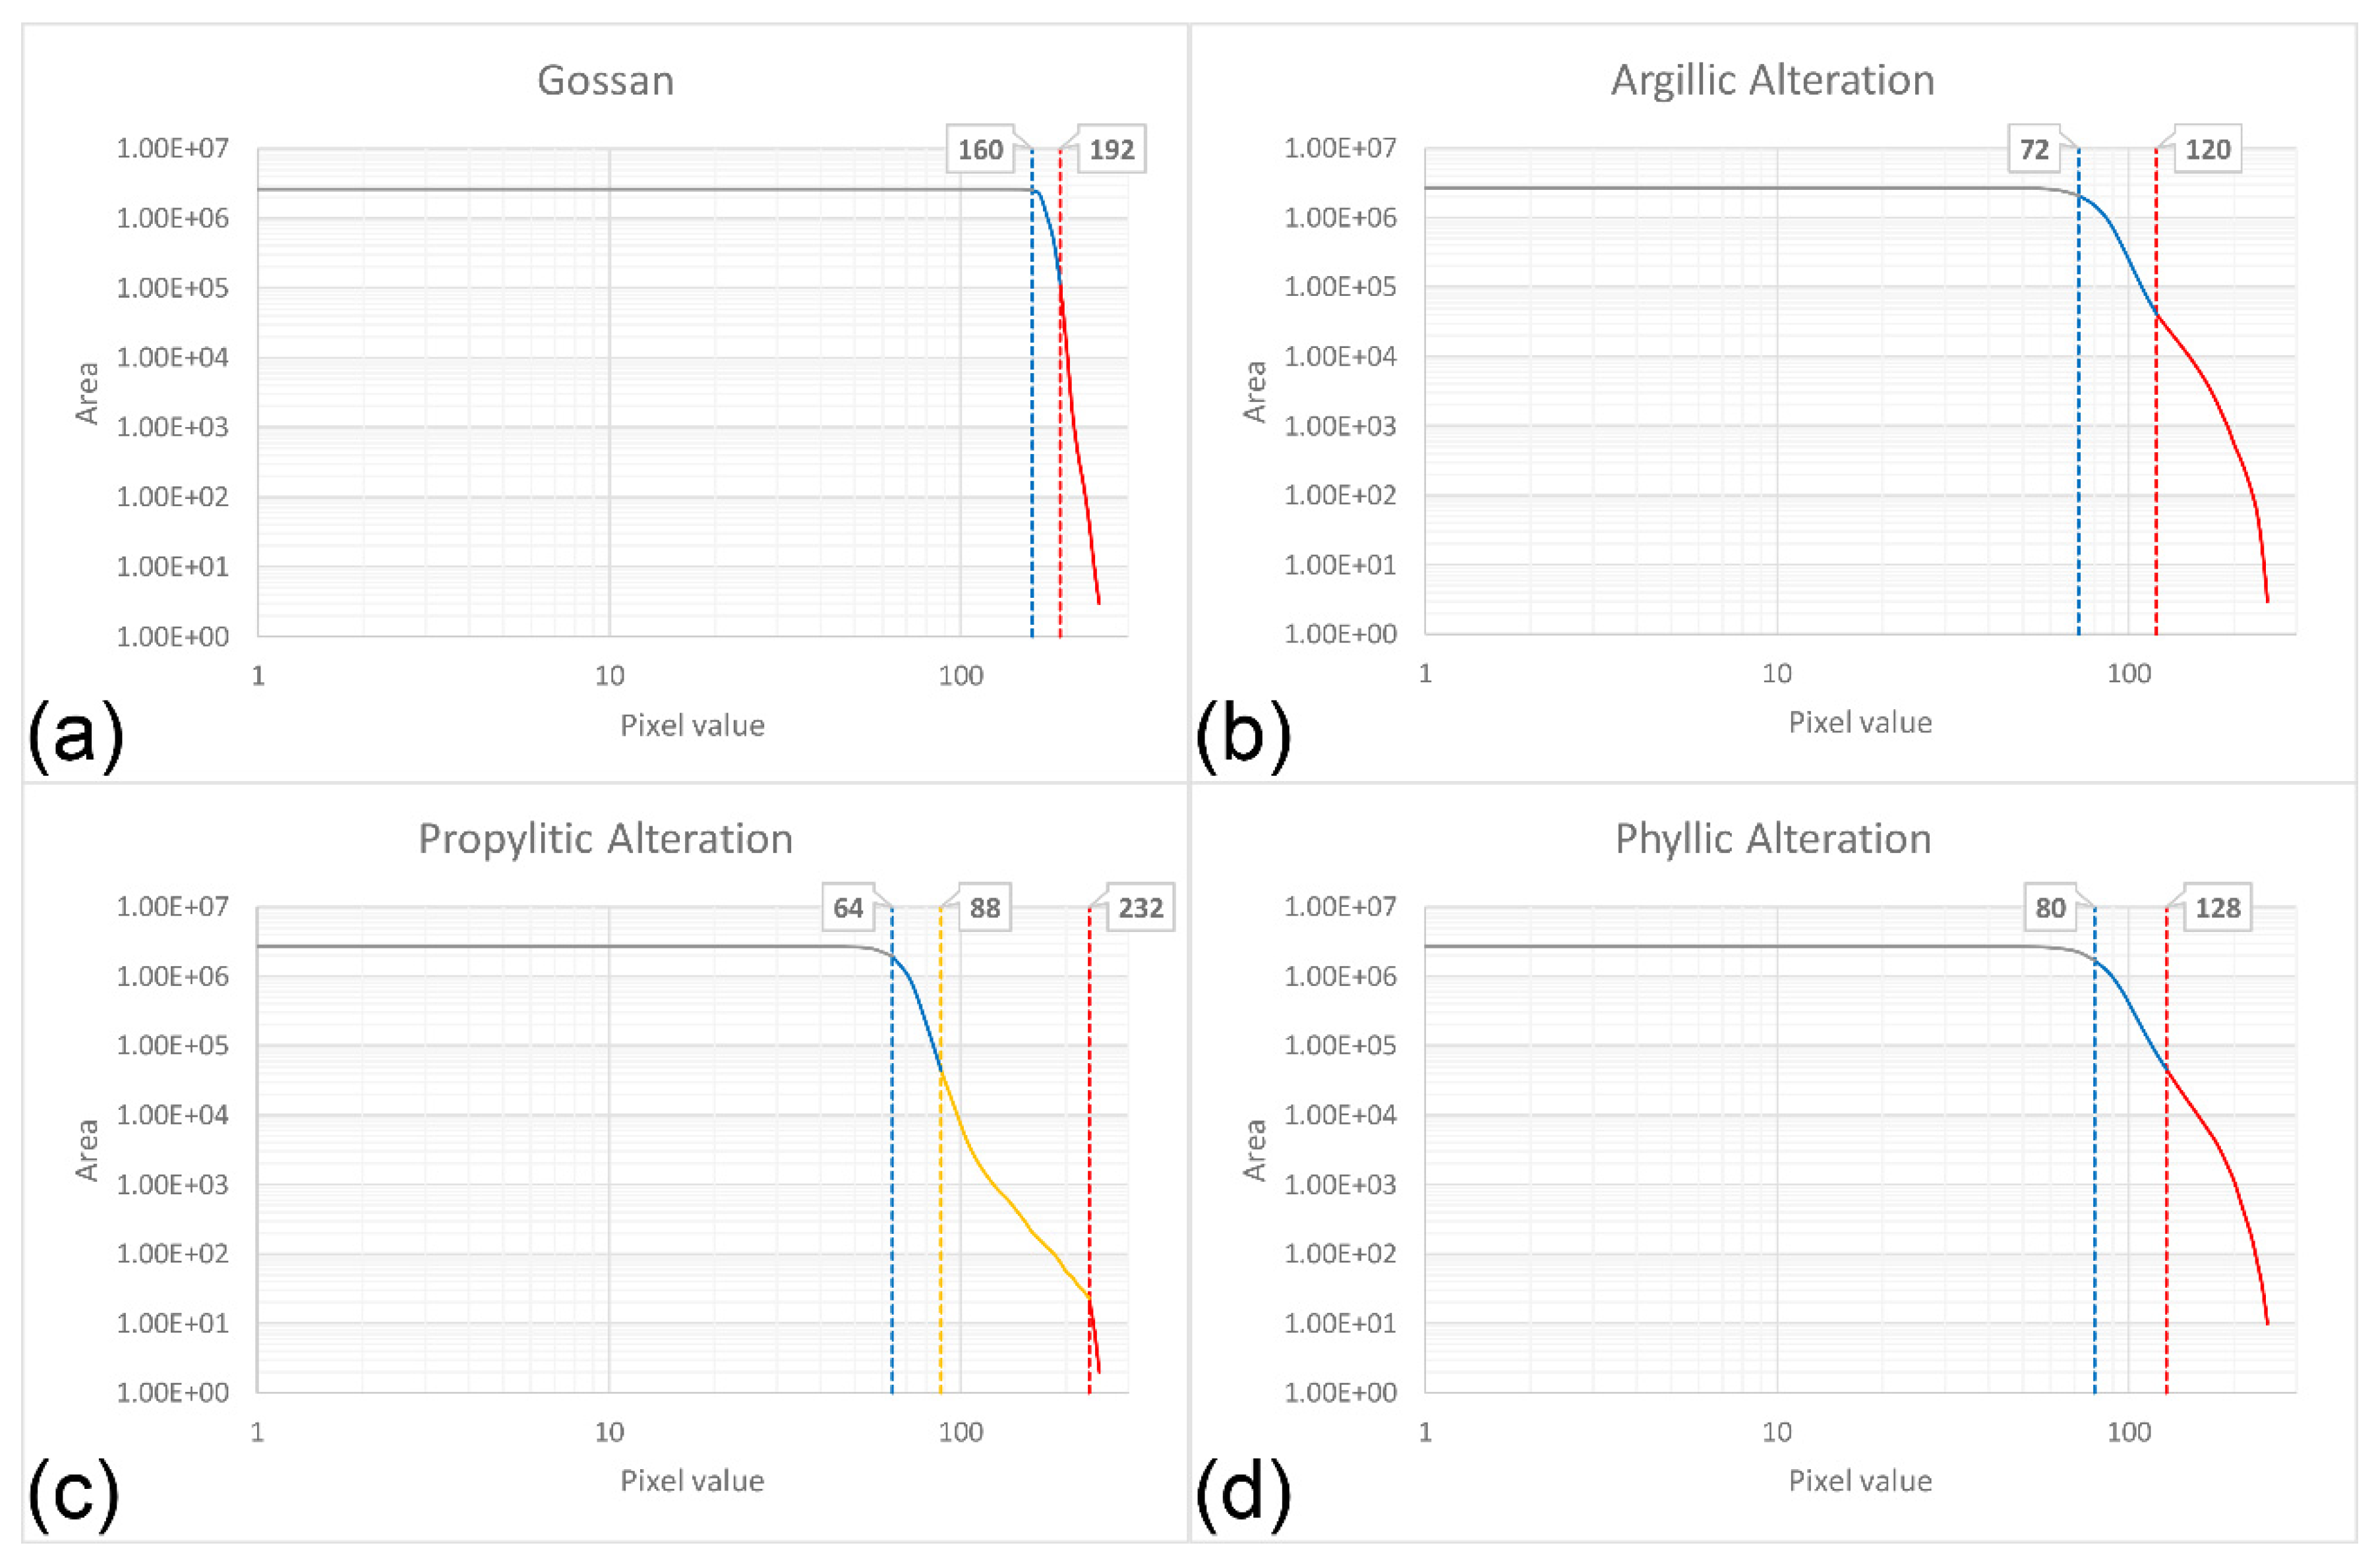
4.3. Hydrothermal Alteration Mapping Using MNF

We used identical spectral subsets to the PCA and ICA as input to this technique. We presented the transformation vectors of each selective MNF analysis used for enhancing the gossans, argillic, propylitic, and phyllic alteration zones in Table 5, Table 6, Table 7 and Table 8, respectively. The transformation vectors of each analysis are shown in Figure 9. According to the spectral characteristics of the indicative minerals in gossans (shown in Figure 2a and Figure 9a), the second component (C 2) in MNF (1234) was considered for enhancing gossans. This component showed a relatively similar trend to the spectral graphs of the indicative minerals in gossans. Therefore, the target areas appeared in bright pixels in this component.
According to Table 6 and Figure 9b, we considered C 2 in MNF (1457) as the appropriate component for enhancing argillic alteration zones. In the relevant transformation vector, there was a relatively high difference between the loadings in bands 5 and 7. This difference was consistent with the spectral behavior of the indicative minerals in the argillic alteration zones, such as alunite and kaolinite. The target areas appeared in bright pixels in this component. Based on the results in Table 7 and Figure 9c, negated C 4 in MNF (1458) enhanced the propylitic alteration zones. The relevant transformation vector to this component showed a relatively high difference between the loadings in bands 5 and 8, with opposite signs. This was similar to the spectral behavior of the indicative minerals in propylitic alteration zones, such as chlorite and epidote. The target zone in this component appeared in dark pixels, and the negated component was used for enhancing the phyllic alteration zones.
According to Table 8 and Figure 9d, we considered negated C 2 in MNF (1467) as the component that could be used for enhancing the phyllic alteration zones. The relevant transformation vector showed a relatively large difference between the loadings in bands 6 and 7, with opposite signs. Although C 4 showed a higher difference, only the relevant transformation vector to C 2 followed a similar trend to the spectral graphs of the indicative minerals of phyllic alteration zones, such as muscovite. The anomalous areas in this component are displayed in dark pixels.
As shown in Figure 10, we determined the appropriate thresholds for separating anomalous pixels of the selected MNF components, using the C-A fractal method. We present the enhanced alteration zones using the MNF analysis based on the C-A fractal method in Figure 11.

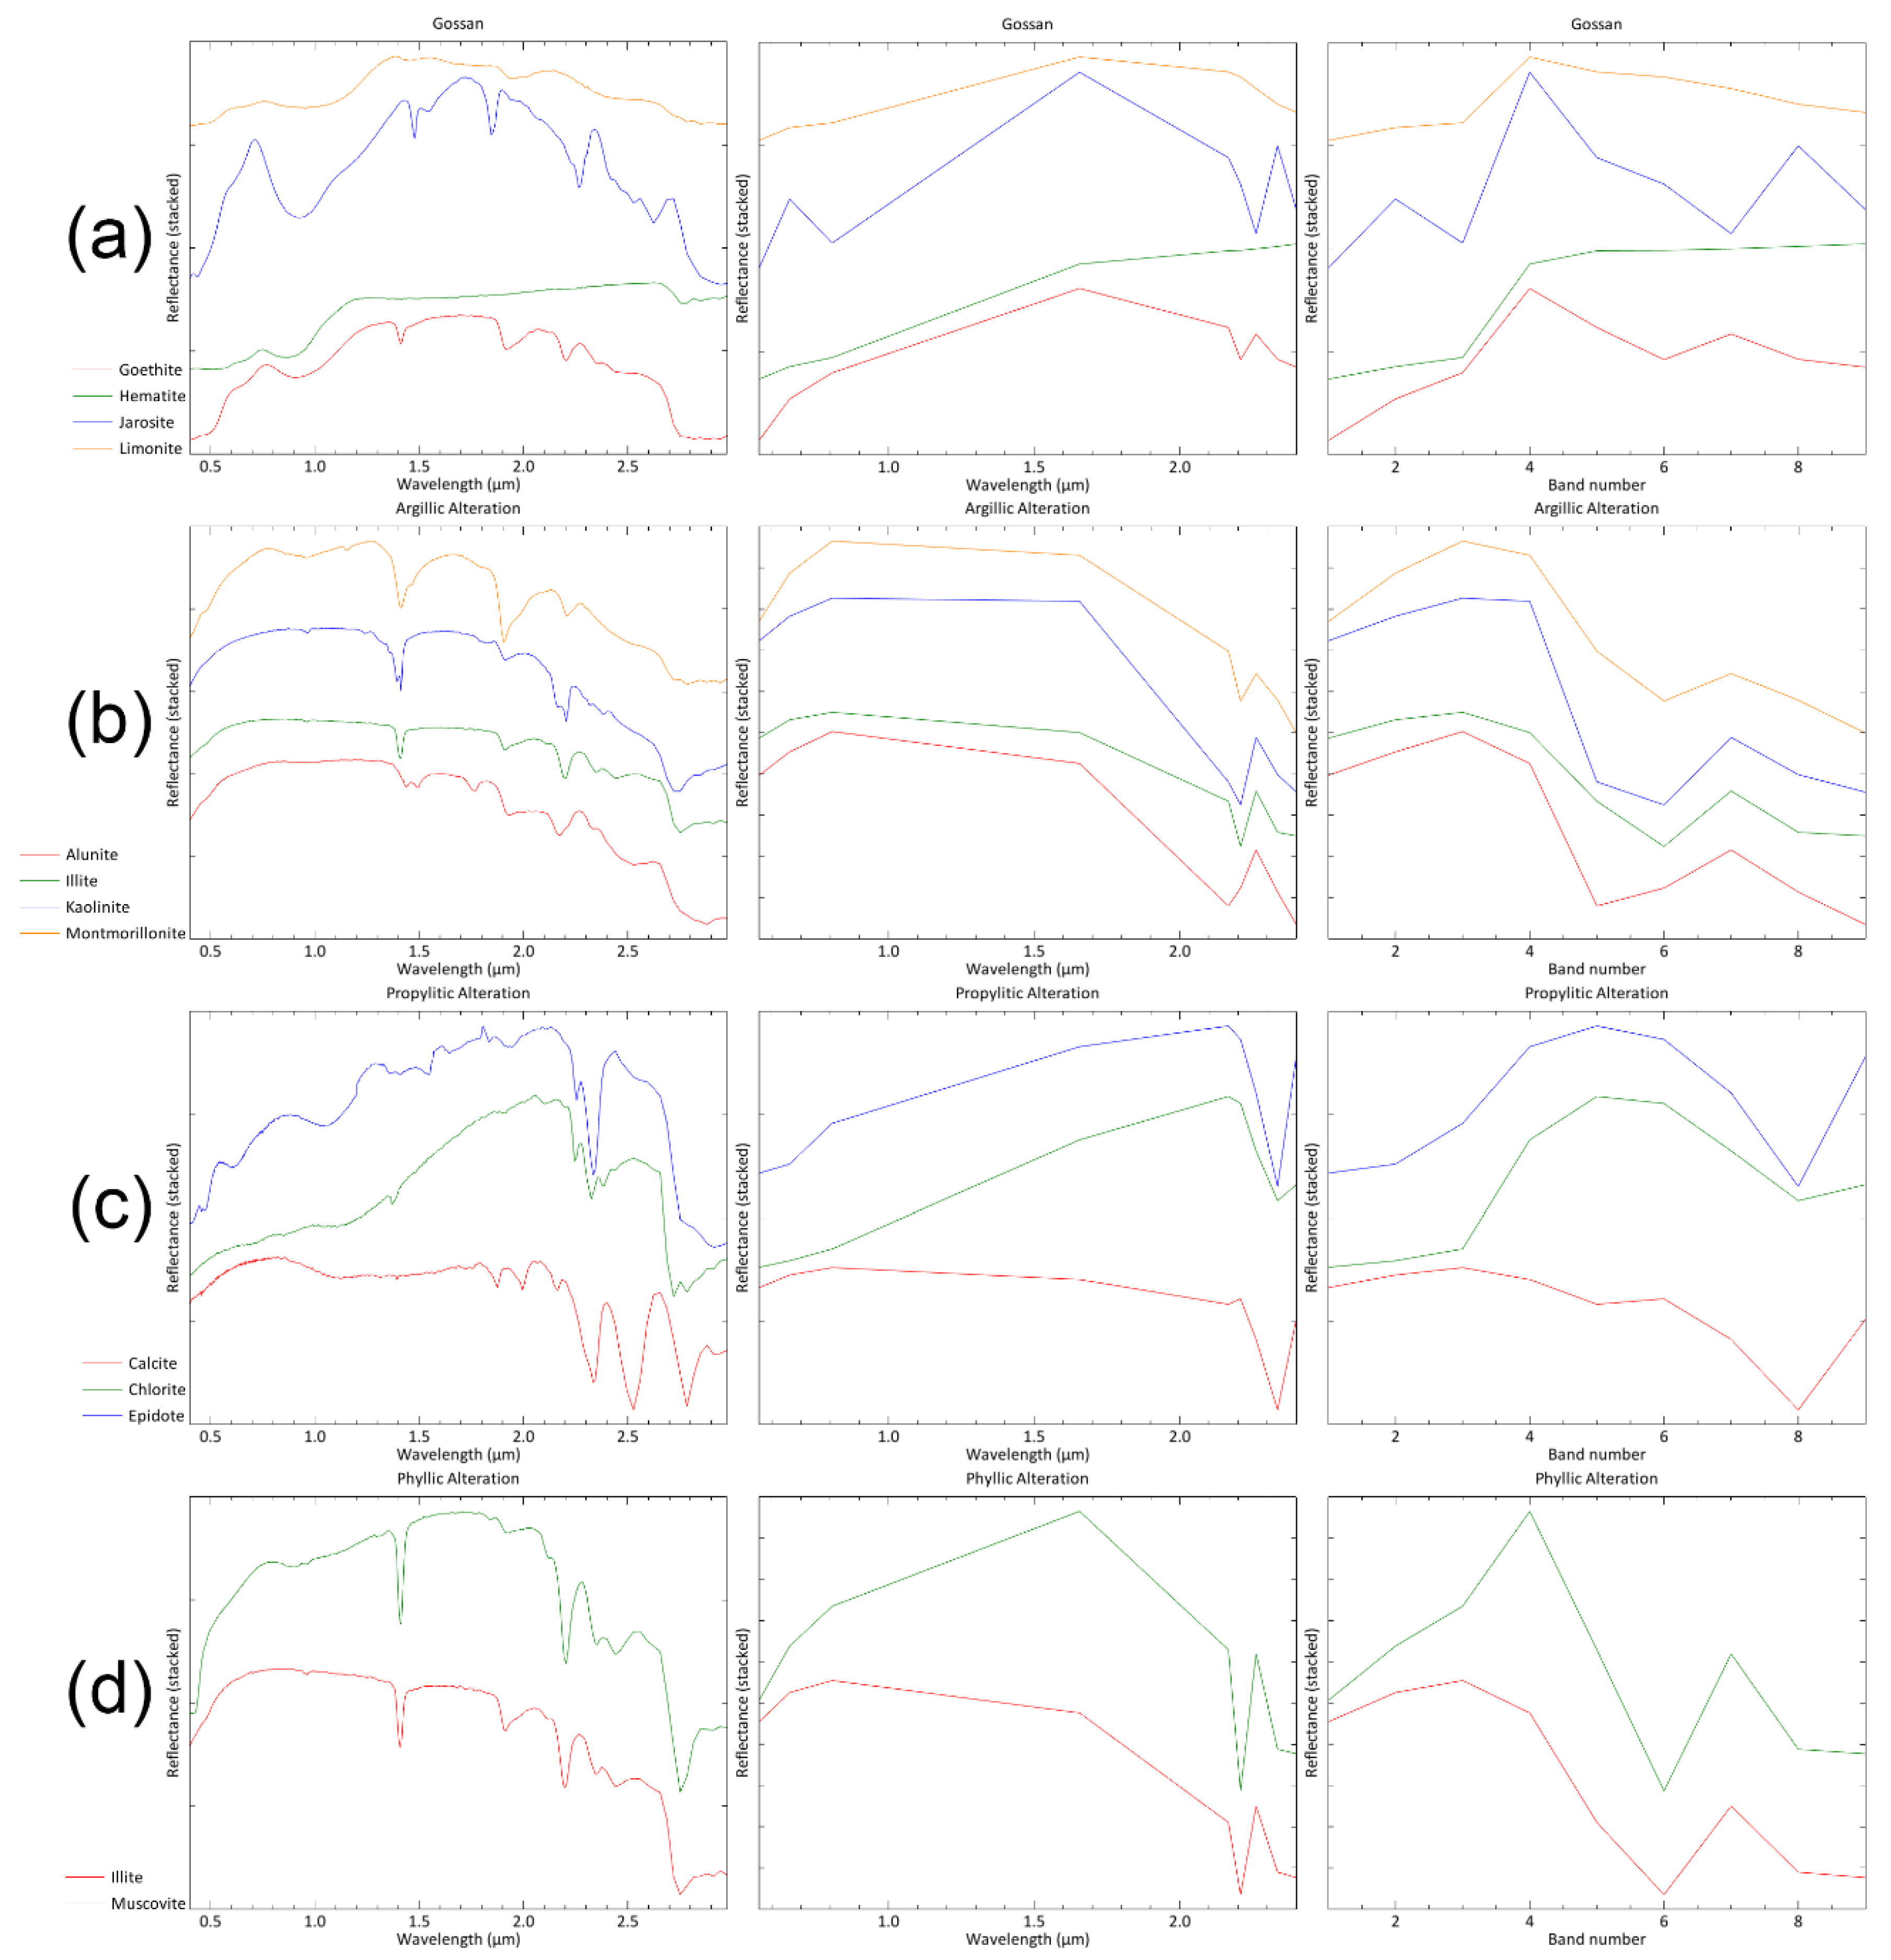
4.4. Field Data and Laboratory Analysis

A comprehensive geological fieldwork was carried out in the study area, particularly in the alteration zones detected using the applied transformation techniques. The photos taken from different alteration types, such as phyllic, argillic, propylitic, and gossan are presented in Figure 12. We collected 55 rock samples from the prospects and used some of them for creating thin sections and the rest were sent for the XRD analysis (Figure 15). We carried out petrographic studies on the thin sections shown in Figure 13, which indicated the transformation of primary silicate minerals (feldspars) such as plagioclase to secondary altered minerals (calcite, clay minerals, epidote, and sericite). The opaque minerals constituted a notable part of the thin sections created using the rock samples collected from argillic and phyllic alteration zones. In the propylitic zone, the original minerals were fully replaced with secondary minerals (calcite and epidote). The minerals identified using the XRD analysis shown in Figure 14, included montmorillonite, illite, goethite, hematite, muscovite, albite, orthoclase, and quartz in the argillic zone; epidote, calcite, chlorite, albite, anorthite, and quartz in the propylitic zone; muscovite, illite, hematite, magnetite, albite, epidote, calcite, montmorillonite, and quartz in the phyllic zone; and goethite, hematite, kaolinite, muscovite, illite, and quartz in gossans.
The results using the XRD analysis indicated that most of the diagnostic spectral features in the argillic alteration zones were due to the presence of montmorillonite and illite; in the propylitic zone these were associated with chlorite, epidote, and calcite; in the phyllic zone these were derived from muscovite; and in gossans these were related to goethite and hematite. Moreover, we found that iron oxide or hydroxide minerals were associated with the alteration mineral assemblages in the argillic, propylitic, and phyllic alteration zones.

4.5. Integration of Selected Components

Fifty-five rock samples that were collected from the study area (shown in Figure 15) were used to generate the confusion matrix of each transformation technique (Table 9). The component with the highest number of correctly classified samples was selected for enhancing each alteration type. These components were integrated by generating the remote sensing evidential layer. Moreover, the overall accuracy of each transformation technique is presented in Table 9, which was the ratio of the total number of correctly classified samples in each confusion matrix to the total number of samples. The overall accuracy was used to assess the accuracy of each transformation technique. This ratio had a clear meaning and was simple to estimate [89].
We experimented with different gamma values for integrating the weighted components selected for enhancing different alteration types. Based on the prediction rates obtained by the P-A plots, gamma 0.9 was used for generating the remote sensing evidential layer. Using a P-A plot, we showed the cumulative percentage of predicted mineral occurrences and the corresponding cumulative occupied area, with respect to the total area, against the pixel values. Therefore, the prediction ability of the integrated map and its ability to delimit the exploration area for further investigation was evaluated in a scheme. The P-A plot showed a curve of the percentage (prediction rate) of known mineralization and a curve of the percentage of the occupied area corresponding to the classes of a map [90]. When an intersection point of the two curves was at a higher place, it portrayed a small area containing a large number of known mineral occurrences. The prediction rate in the P-A plots helped analyze the efficiency and association of a map in predicting target mineralization. We presented the P-A plot of the integrated map obtained using gamma 0.9 in Figure 16, which showed a higher prediction rate compared to other gamma values. According to the plot, the integrated map was able to predict 70% of the mineral occurrences in 30% of the study area. It is noteworthy that for assigning probabilistic values to the map, in terms of prospecting for the hydrothermal mineralization and distribution of the pixel values between 0 and 1, these were transformed to a fuzzy space using a linear function. We used the C-A fractal plot for classifying the integrated map and separating the anomaly population; shown in Figure 17. The classified integrated map which was suggested to be used as the remote sensing evidential layer, was presented in Figure 18a. The red-colored class could be considered to be the certain anomaly population. Moreover, we presented another map classified using the Jenks Natural Breaks [91] in Figure 18b, to provide a higher number of classes.

5. Discussion

In this study, we applied different dimensionality reduction or transformation techniques on the ASTER data for mapping the gossans and hydrothermal alteration zones in a mineral-rich range located in Central Iran called Toroud-Chahshirin. It is thought that subpopulation samples, such as hydrothermal alteration zones, are more distinguishable using the components derived from the transformation techniques, such as PCA, ICA, and MNF. Thus, these components might provide clear geological meanings for interpretation. However, principal and independent components do not genetically correspond to distinct geological features, due to the intimate mixing of geological units or alteration types. The transformation techniques provided exploratory tools to view data from another perspective. We used this type of techniques to provide useful information, based on the knowledge of actual geological problems.
Principal component analysis is an orthogonal decomposition and we used it based on covariance matrix analysis and the Gaussian assumption, while independent component analysis is based on a non-Gaussian assumption of independent sources. The PCA and MNF use only second-order statistics, while the ICA uses higher-order statistics. Higher-order statistics is a stronger statistical assumption that reveals interesting features in the usually non-Gaussian datasets. If the feature of interest, such as a hydrothermal alteration zone only occupies a small portion of all pixels, it makes an insignificant contribution to the covariance matrix. In the PCA, the feature of interest would be probably buried in the noisy bands, while in ICA and MNF, the features are distinguished from the noisy bands. Based on the spectral characteristics of the indicative minerals of each hydrothermal alteration zone, we selected four spectral bands with diagnostic absorption and reflection characteristics as the input to the transformation techniques. The selective approach was preferred to the standard approach, due to the ease of interpreting the results based on the characteristic spectral behavior of each target zone. In PCA and MNF, we used the eigenvectors and transformation vectors for determining the appropriate component for detecting each alteration zone. In the ICA, we determined the target components based on the spectral behavior of known alteration zones.
We used the C-A plots for discriminating between the anomalous pixels and the background in each component were determined to be appropriate for enhancing the target zones. The maps created using the PCA and ICA for enhancing the gossans, showed a similar pattern, along with the number of correctly classified samples, whereas the ICA component showed a less noisy pattern. The MNF technique yielded a less accurate map and interference of vegetation and iron oxide/hydroxide-bearing pixels could be observed. The PCA failed to provide an acceptable map for enhancing the argillic alteration zones and the relevant component showed a noisy pattern and a low number of correctly classified samples. The ICA and MNF components showed a relatively similar pattern for the argillic alteration zones, whereas the ICA provided a less noisy pattern. The respective transformations applied in this study, showed a relatively similar number of correctly classified samples and pattern for the propylitic alteration zones. However, the MNF component was noisier compared to the other components. The ICA and MNF components provided a similar map for enhancing the phyllic alteration zones, while the PCA yielded a noisy map. Nevertheless, the number of correctly classified samples for all components was almost the same.
According to the field observations and Table 9, the applied techniques and to a greater extent, ICA, efficiently revealed the alteration halos. The components derived from the ICA showed the highest overall accuracy. The results indicated that the ICA has a great ability for providing comprehensive and significant exploration information at a regional scale. In general, the study area was dominantly covered by advanced argillic, argillic, and phyllic alteration zones. Additionally, gossans and propylitic alteration zones covered large parts of the study area. The argillic and phyllic alteration zones, along with gossans were mostly focused in the central and western portions of the study area. The propylitic alteration zone was located in the southwestern portion of the study area. Typically, gossans and phyllic alteration zones showed the closest spatial relationship in many parts of the study area with the hydrothermal mineralization. According to the results, there were a number of pixels which showed anomalous values for different alteration zones. This confirmed the presence of alteration minerals and their spatial distribution at the subpixel level in the study area.
According to the geological map presented in Figure 1, the gossans detected using the ICA were correlated with andesitic and dacitic units. The argillic alteration zones were associated with andesitic and dacitic units in central and northwestern, and the rhyolitic units in the southwestern portions of the study area. The propylitic alteration zones located mostly in the southwest of the study area were related to andesitic and rhyolitic units. The phyllic alteration zones in the central portion of the study area were associated with the andesitic and dacitic units, and were correlated with the dioritic units in the western portion.
Based on the number of correctly classified samples presented in Table 9, we selected the appropriate technique for enhancing each alteration type. The PCA components were selected for enhancing the gossans and propylitic alteration, and we considered the ICA and MNF components for enhancing phyllic and argillic alteration, respectively. The integrated map generated by combining the weighted selected components using the fuzzy gamma operator (see Figure 18) showed an acceptable prediction rate, based on the relevant P-A plot (see Figure 16). The results of fieldwork and XRD analysis verified the presence of gossan, argillic, phyllic, and propylitic zones in the study area. Distinctive spectral features related to montmorillonite, illite, chlorite, epidote, calcite, muscovite, goethite, and hematite were found in the alteration zones. Moreover, new prospective areas were detected in the western portions of the study area, along with the ring structures in northeast. The central portion of the study area was a high-altered zone associated with different metallic ore deposits. This map could be used as an efficient evidential layer through mineral prospectivity mapping of the study area. This methodology could be extrapolated to the unexplored regions for identifying new prospects of high-potential base metal mineralization zones in Central Iran and other arid or semi-arid regions on earth.

6. Conclusions

This study compared the efficiency of different dimensionality reduction or transformation techniques in terms of enhancing various types of the hydrothermal alteration in the Toroud-Chahshirin range located in Central Iran, using ASTER satellite data. Moreover, a framework was proposed for selecting and integrating the appropriate techniques through enhancing each alteration type, which led to generating a reliable remote sensing evidential layer. In this framework, a selective approach was used for implementing the transformation techniques based on the spectral characteristics of the indicative minerals in each alteration zone. Based on the field observations, we used the number of correctly classified rock samples for investigating the accuracy of each component in detecting different types of hydrothermal alteration zones. In parts of the study area, different alteration types were collocated and the results confirmed the presence of alteration minerals and their spatial distribution at the subpixel level. In general, ICA provided more accurate and less noisy maps, compared to the other techniques. We selected the components with the highest number of correctly classified samples for the integration process by providing a remote sensing evidential layer. The fuzzy gamma operator was used for generating an integrated map based on the components derived from the transformation techniques. The integrated map showed a high prediction rate that implied the efficiency of the proposed framework. Moreover, this map was consistent with the results of petrographic and XRD analysis. Using the integrated map, high potential zones of the hydrothermal mineralization were identified in the study area, particularly in the western and northeastern portions, which could be considered for future systematic exploration programs. The methodology used in this study could be applied for mapping hydrothermal alteration zones in other metallogenic provinces in the arid and semi-arid regions around the world.

Author Contributions

H.S. and E.F. writing—original draft preparation, software, analysis, validation; A.B.P. writing, reconstructing—review, R.D.M. and R.C. editing and supervision; A.M.M. supervision. All authors have read and agreed to the published version of the manuscript.

Funding

Publication fees are not claimed by Remote Sensing because A.B.P is one of the Editorial Board of Remote Sensing (Section of Environmental Remote Sensing). He has the right to publish one paper per year free of charge as he serves the Journal.

Acknowledgments

The authors would like to acknowledge the School of Mining Engineering at the University of Tehran for providing required field and laboratory data for this investigation. We appreciate the Department of Mining Engineering at the Amirkabir University of Technology for logistics support. Also, we are grateful to the Institute of Oceanography and Environment (INOS) and the University Malaysia Terengganu (UMT) for the assigned time and providing required facilities during writing–editing and reconstructing the manuscript.

Conflicts of Interest

The authors declare no conflict of interest.

References

  1. Cooke, D.R.; Deyell, C.L.; Waters, P.J.; Gonzales, R.I.; Zaw, K. Evidence for magmatic-hydrothermal fluids and ore-forming processes in epithermal and porphyry deposits of the Baguio District, Philippines. Econ. Geol. 2011, 106, 1399–1424. [Google Scholar] [CrossRef]
  2. Koděra, P.; Lexa, J.; Fallick, A.E.; Wälle, M.; Biroň, A. Hydrothermal fluids in epithermal and porphyry Au deposits in the Central Slovakia Volcanic Field. Geol. Soc. London Spec. Publ. 2014, 402, 177–206. [Google Scholar] [CrossRef] [Green Version]
  3. Smith, D.J.; Naden, J.; Jenkin, G.R.T.; Keith, M. Hydrothermal alteration and fluid pH in alkaline-hosted epithermal systems. Ore. Geol. Rev. 2017, 89, 772–779. [Google Scholar] [CrossRef] [Green Version]
  4. Takahashi, R.; Tagiri, R.; Blamey, N.J.F.; Imai, A.; Watanabe, Y.; Takeuchi, A. Characteristics and behavior of hydrothermal fluids for gold mineralization at the Hishikari Deposits, Kyushu, Japan. Resour. Geol. 2017, 67, 279–299. [Google Scholar] [CrossRef]
  5. Bérubé, C.L.; Olivo, G.R.; Chouteau, M.; Perrouty, S.; Shamsipour, P.; Enkin, R.J.; Morris, W.A.; Feltrin, L.; Thiémonge, R. Predicting rock type and detecting hydrothermal alteration using machine learning and petrophysical properties of the Canadian Malartic ore and host rocks, Pontiac Subprovince, Québec, Canada. Ore Geol. Rev. 2018, 96, 130–145. [Google Scholar] [CrossRef]
  6. Mathieu, L. Quantifying hydrothermal alteration: A review of methods. Geosciences 2018, 8, 245. [Google Scholar] [CrossRef] [Green Version]
  7. Perrouty, S.; Linnen, R.L.; Lesher, C.M.; Olivo, G.R.; Piercey, S.J.; Gaillard, N.; Clark, J.R.; Enkin, R.J. Expanding the size of multi-parameter metasomatic footprints in gold exploration: Utilization of mafic dykes in the Canadian Malartic district, Québec, Canada. Miner. Depos. 2019, 54, 761–786. [Google Scholar] [CrossRef]
  8. Simpson, M.P.; Christie, A.B. Hydrothermal alteration mineralogical footprints for New Zealand epithermal Au-Ag deposits. N. Z. J. Geol. Geophys. 2019, 62, 483–512. [Google Scholar] [CrossRef]
  9. Rowan, L.C.; Hook, S.J.; Abrams, M.J.; Mars, J.C. Mapping hydrothermally altered rocks at Cuprite, Nevada, using the Advanced Spaceborne Thermal Emission and Reflection Radiometer (ASTER), a new satellite-imaging system. Econ. Geol. 2003, 98, 1019–1027. [Google Scholar] [CrossRef]
  10. Van der Meer, F.D.; van der Werff, H.M.A.; van Ruitenbeek, F.J.A.; Hecker, C.A.; Bakker, W.H.; Noomen, M.F.; van der Meijde, M.; Carranza, E.J.M.; de Smeth, J.B.; Woldai, T. Multi- and hyperspectral geologic remote sensing: A review. Int. J. Appl. Earth Obs. Geoinf. 2012, 14, 112–128. [Google Scholar] [CrossRef]
  11. Beiranvand Pour, A.; S Park, T.-Y.; Park, Y.; Hong, J.K.; M Muslim, A.; Läufer, A.; Crispini, L.; Pradhan, B.; Zoheir, B.; Rahmani, O. Landsat-8, advanced spaceborne thermal emission and reflection radiometer, and WorldView-3 multispectral satellite imagery for prospecting copper-gold mineralization in the Northeastern Inglefield Mobile Belt (IMB), Northwest Greenland. Remote Sens. 2019, 11, 2430. [Google Scholar] [CrossRef] [Green Version]
  12. Abrams, M.J.; Ashley, R.P.; Rowan, L.C.; Goetz, A.F.H.; Kahle, A.B. Mapping of hydrothermal alteration in the Cuprite mining district, Nevada, using aircraft scanner images for the spectral region 0.46 to 2.36 µm. Geology 1977, 5, 713–718. [Google Scholar] [CrossRef]
  13. Abrams, M.J.; Brown, D.; Lepley, L.; Sadowski, R. Remote sensing for porphyry copper deposits in southern Arizona. Econ. Geol. 1983, 78, 591–604. [Google Scholar] [CrossRef]
  14. Rowan, L.C.; Mars, J.C. Lithologic mapping in the Mountain Pass, California area using Advanced Spaceborne Thermal Emission and Reflection Radiometer (ASTER) data. Remote Sens. Environ. 2003, 84, 350–366. [Google Scholar] [CrossRef]
  15. Perry, S.L. Spaceborne and airborne remote sensing systems for mineral exploration-case histories using infrared spectroscopy. Infrared Spectrosc. Geochem. Explor. Geochem. Remote Sens. 2004, 33, 227–240. [Google Scholar]
  16. Mars, J.C.; Rowan, L.C. Regional mapping of phyllic- and argillic-altered rocks in the Zagros magmatic arc, Iran, using advanced spaceborne thermal emission and reflection radiometer (ASTER) data and logical operator algorithms. Geosphere 2006, 2, 161–186. [Google Scholar] [CrossRef]
  17. Di Tommaso, I.; Rubinstein, N. Hydrothermal alteration mapping using ASTER data in the Infiernillo porphyry deposit, Argentina. Ore Geol. Rev. 2007, 32, 275–290. [Google Scholar] [CrossRef]
  18. Beiranvand Pour, A.; Hashim, M.; Hong, J.K.; Park, Y. Lithological and alteration mineral mapping in poorly exposed lithologies using Landsat-8 and ASTER satellite data: North-eastern Graham Land, Antarctic Peninsula. Ore Geol. Rev. 2019, 108, 112–133. [Google Scholar] [CrossRef]
  19. Ahmadirouhani, R.; Karimpour, M.-H.; Rahimi, B.; Malekzadeh-Shafaroudi, A.; Pour, A.B.; Pradhan, B. Integration of SPOT-5 and ASTER satellite data for structural tracing and hydrothermal alteration mineral mapping: Implications for Cu–Au prospecting. Int. J. Image Data Fusion 2018, 9, 237–262. [Google Scholar] [CrossRef]
  20. Sheikhrahimi, A.; Pour, A.B.; Pradhan, B.; Zoheir, B. Mapping hydrothermal alteration zones and lineaments associated with orogenic gold mineralization using ASTER data: A case study from the Sanandaj-Sirjan Zone, Iran. Adv. Sp. Res. 2019, 63, 3315–3332. [Google Scholar] [CrossRef]
  21. Beiranvand Pour, A.; Park, Y.; Crispini, L.; Läufer, A.; Kuk Hong, J.; Park, T.-Y.S.; Zoheir, B.; Pradhan, B.; Muslim, A.M.; Hossain, M.S. Mapping listvenite occurrences in the damage zones of Northern Victoria Land, Antarctica using ASTER satellite remote sensing data. Remote Sens. 2019, 11, 1408. [Google Scholar] [CrossRef] [Green Version]
  22. Bolouki, S.M.; Ramazi, H.R.; Maghsoudi, A.; Beiranvand Pour, A.; Sohrabi, G. A remote sensing-based application of Bayesian networks for epithermal gold potential mapping in Ahar-Arasbaran area, NW Iran. Remote Sens. 2020, 12, 105. [Google Scholar] [CrossRef] [Green Version]
  23. Crósta, A.P.; De Souza Filho, C.R.; Azevedo, F.; Brodie, C. Targeting key alteration minerals in epithermal deposits in Patagonia, Argentina, using ASTER imagery and principal component analysis. Int. J. Remote Sens. 2003, 24, 4233–4240. [Google Scholar] [CrossRef]
  24. Beiranvand Pour, A.; Hashim, M. Application of advanced spaceborne thermal emission and reflection radiometer (ASTER) data in geological mapping. Int. J. Phys. Sci. 2011, 6, 7657–7668. [Google Scholar]
  25. Farahbakhsh, E.; Shirmard, H.; Bahroudi, A.; Eslamkish, T. Fusing ASTER and QuickBird-2 satellite data for detailed investigation of porphyry copper deposits using PCA; case study of Naysian deposit, Iran. J. Indian Soc. Remote Sens. 2016, 44, 525–537. [Google Scholar] [CrossRef]
  26. Rowan, L.; Goetz, A.; Ashley, R. Discrimination of hydrothermally altered and unaltered rocks in visible and near infrared multispectral images. Geophysics 1977, 42, 522–535. [Google Scholar] [CrossRef]
  27. Goetz, A.F.H.; Rock, B.N.; Rowan, L.C. Remote sensing for exploration; an overview. Econ. Geol. 1983, 78, 573–590. [Google Scholar] [CrossRef]
  28. Boardman, J.W.; Kruse, F.A. Automated spectral analysis: A geological example using AVIRIS data, north Grapevine Mountains, Nevada. In Proceedings of the 10th Thematic Conference on Geologic Remote Sensing; Environmental Research Institute of Michigan: Ann Arbor, MI, USA, 1994; pp. 1407–1418. [Google Scholar]
  29. Kruse, F.A.; Boardman, J.W.; Huntington, J.F. Comparison of airborne hyperspectral data and EO-1 Hyperion for mineral mapping. IEEE Trans. Geosci. Remote Sens. 2003, 41, 1388–1400. [Google Scholar] [CrossRef] [Green Version]
  30. Serkan Öztan, N.; Lütfi Süzen, M. Mapping evaporate minerals by ASTER. Int. J. Remote Sens. 2011, 32, 1651–1673. [Google Scholar] [CrossRef]
  31. Testa, F.J.; Villanueva, C.; Cooke, D.R.; Zhang, L. Lithological and hydrothermal alteration mapping of epithermal, porphyry and tourmaline breccia districts in the Argentine Andes using ASTER imagery. Remote Sens. 2018, 10, 203. [Google Scholar] [CrossRef] [Green Version]
  32. Singh, A.; Harrison, A. Standardized principal components. Int. J. Remote Sens. 1985, 6, 883–896. [Google Scholar] [CrossRef]
  33. Maćkiewicz, A.; Ratajczak, W. Principal components analysis (PCA). Comput. Geosci. 1993, 19, 303–342. [Google Scholar] [CrossRef]
  34. Eklundh, L.; Singh, A. A comparative analysis of standardised and unstandardised Principal Components Analysis in remote sensing. Int. J. Remote Sens. 1993, 14, 1359–1370. [Google Scholar] [CrossRef]
  35. Liu, J.G.; Mason, P.J. Essential Image Processing and GIS for Remote Sensing; John Wiley & Sons: Hoboken, NJ, USA, 2009; ISBN 1118724186. [Google Scholar]
  36. Loughlin, W.P. Principal component analysis for alteration mapping. Photogramm. Eng. Remote Sens. 1991, 57, 1163–1169. [Google Scholar]
  37. Zhang, X.; Pazner, M.; Duke, N. Lithologic and mineral information extraction for gold exploration using ASTER data in the south Chocolate Mountains (California). ISPRS J. Photogramm. Remote Sens. 2007, 62, 271–282. [Google Scholar] [CrossRef]
  38. Pour, A.B.; Hashim, M. The application of ASTER remote sensing data to porphyry copper and epithermal gold deposits. Ore Geol. Rev. 2012, 44, 1–9. [Google Scholar] [CrossRef] [Green Version]
  39. Benlin, X.; Fangfang, L.; Xigliang, M.; Huazhong, J. Study on independent component analysis’ application in classification and change detection of multispectral images. Int. Arch. Photogramm. Remote Sens. Spat. Inf. Sci. 2008, 37, 871–876. [Google Scholar]
  40. Beiranvand Pour, A.; Park, Y.; Park, T.-Y.S.; Hong, J.K.; Hashim, M.; Woo, J.; Ayoobi, I. Evaluation of ICA and CEM algorithms with Landsat-8/ASTER data for geological mapping in inaccessible regions. Geocarto Int. 2019, 34, 785–816. [Google Scholar] [CrossRef]
  41. Beiranvand Pour, A.; Park, T.S.; Park, Y.; Hong, J.K.; Pradhan, B. Fusion of DPCA and ICA algorithms for mineral detection using Landsat-8 spectral bands. In Proceedings of the IEEE International Geoscience and Remote Sensing Symposium, Yokohama, Japan, 28 July–2 August 2019; pp. 6067–6070. [Google Scholar]
  42. Green, A.A.; Berman, M.; Switzer, P.; Craig, M.D. A transformation for ordering multispectral data in terms of image quality with implications for noise removal. IEEE Trans. Geosci. Remote Sens. 1988, 26, 65–74. [Google Scholar] [CrossRef] [Green Version]
  43. Boardman, J.W.; Kruse, F.A.; Green, R.O. Mapping target signatures via partial unmixing of AVIRIS data. Summ. 5 Annu. JPL Airborne Geosci. Work. 1995, 1, 23–26. [Google Scholar]
  44. Ferrier, G.; White, K.; Griffiths, G.; Bryant, R.; Stefouli, M. The mapping of hydrothermal alteration zones on the island of Lesvos, Greece using an integrated remote sensing dataset. Int. J. Remote Sens. 2002, 23, 341–356. [Google Scholar] [CrossRef]
  45. Poormirzaee, R.; Oskouei, M.M. Use of spectral analysis for detection of alterations in ETM data, Yazd, Iran. Appl. Geomatics 2010, 2, 147–154. [Google Scholar] [CrossRef] [Green Version]
  46. Pazand, K.; Sarvestani, J.F.; Ravasan, M.R.S. Hydrothermal alteration mapping using ASTER data for reconnaissance porphyry copper mineralization in the Ahar area, NW Iran. J. Indian Soc. Remote Sens. 2013, 41, 379–389. [Google Scholar] [CrossRef]
  47. Shamanian, G.H.; Hedenquist, J.W.; Hattori, K.H.; Hassanzadeh, J. The Gandy and Abolhassani epithermal prospects in the Alborz magmatic arc, Semnan province, Northern Iran. Econ. Geol. 2004, 99, 691–712. [Google Scholar] [CrossRef]
  48. Alavi, M. Tectonostratigraphic synthesis and structural style of the Alborz mountain system in Northern Iran. J. Geodyn. 1996, 21, 1–33. [Google Scholar] [CrossRef]
  49. Safonov, Y.G. Hydrothermal gold deposits: Distribution, geological-genetic types, and productivity of ore-forming systems. Geol. Ore Depos. 1997, 39, 20–32. [Google Scholar]
  50. Eshraghi, S.A.; Jalali, A. Moaleman (1:100,000) Geological Map; Geological Survey of Iran: Tehran, Iran, 2006. [Google Scholar]
  51. Ramachandran, B.; Justice, C.O.; Abrams, M.J. Land Remote Sensing and Global Environmental Change: NASA’s Earth Observing System and the Science of ASTER and MODIS; Springer Science & Business Media: Berlin/Heidelberg, Germany, 2010; Volume 11, ISBN 1441967494. [Google Scholar]
  52. Rowan, L.C.; Mars, J.C.; Simpson, C.J. Lithologic mapping of the Mordor, NT, Australia ultramafic complex by using the Advanced Spaceborne Thermal Emission and Reflection Radiometer (ASTER). Remote Sens. Environ. 2005, 99, 105–126. [Google Scholar] [CrossRef]
  53. Fujisada, H. Design and performance of ASTER instrument. In Proceedings of the Advanced and Next-Generation Satellites, Paris, France, 15 December 1995; Volume 2583, pp. 16–25. [Google Scholar]
  54. Abrams, M. The Advanced Spaceborne Thermal Emission and Reflection Radiometer (ASTER): Data products for the high spatial resolution imager on NASA’s Terra platform. Int. J. Remote Sens. 2000, 21, 847–859. [Google Scholar] [CrossRef]
  55. Schwartz, G.M. Hydrothermal alteration in the “porphyry copper” deposits. Econ. Geol. 1947, 42, 319–352. [Google Scholar] [CrossRef]
  56. Gemmell, J.B. Exploration implications of hydrothermal alteration associated with epithermal Au-Ag deposits. ASEG Ext. Abstr. 2006, 2006, 1–5. [Google Scholar] [CrossRef]
  57. Simpson, M.P.; Mauk, J.L. Hydrothermal alteration and veins at the epithermal Au-Ag deposits and prospects of the Waitekauri Area, Hauraki Goldfield, New Zealand. Econ. Geol. 2011, 106, 945–973. [Google Scholar] [CrossRef]
  58. Alizadeh Sevari, B.; Hezarkhani, A. Fluid evolution of the magmatic hydrothermal porphyry copper deposit based on fluid inclusion and stable isotope studies at Darrehzar, Iran. ISRN Geol. 2014. [Google Scholar] [CrossRef] [Green Version]
  59. US Geological Survey EarthExplorer. Available online: https://earthexplorer.usgs.gov (accessed on 17 October 2019).
  60. Duda, K.; Daucsavage, J. ASTER Level 1T User Guide. 2015. Available online: https://lpdaac.usgs.gov/documents/262/ASTER_User_Handbook_v2.pdf (accessed on 17 October 2019).
  61. L3Harris Geospatial ENVI v5.3.1. Available online: https://www.harrisgeospatial.com/Software-Technology/ENVI (accessed on 9 November 2019).
  62. Pearson, K. On lines and planes of closest fit to systems of points in space. Philos. Mag. Ser. 6 1901, 2, 559–572. [Google Scholar] [CrossRef] [Green Version]
  63. Hotelling, H. Analysis of a complex of statistical variables into principal components. J. Educ. Psychol. 1933, 24, 417–441. [Google Scholar] [CrossRef]
  64. Jolliffe, I.T. Principal Component Analysis, 2nd ed.; Springer: New York, NY, USA, 2002. [Google Scholar]
  65. Yang, J.; Cheng, Q. A comparative study of independent component analysis with principal component analysis in geological objects identification, Part I: Simulations. J. Geochemical Explor. 2015, 149, 127–135. [Google Scholar] [CrossRef]
  66. Farahbakhsh, E.; Chandra, R.; Olierook, H.K.H.; Scalzo, R.; Clark, C.; Reddy, S.M.; Müller, R.D. Computer vision-based framework for extracting tectonic lineaments from optical remote sensing data. Int. J. Remote Sens. 2020, 41, 1760–1787. [Google Scholar] [CrossRef]
  67. Hall, D.L.; Llinas, J. An introduction to multisensor data fusion. In Proceedings of the IEEE; IEEE: Piscataway, NJ, USA, 1997; Volume 85, pp. 6–23. [Google Scholar]
  68. Tobin, D.C.; Antonelli, P.; Revercomb, H.E.; Dutcher, S.; Turner, D.D.; Taylor, J.K.; Knuteson, R.O.; Vinson, K. Hyperspectral data noise characterization using principle component analysis: Application to the atmospheric infrared sounder. J. Appl. Remote Sens. 2007, 1, 013515. [Google Scholar] [CrossRef]
  69. Fiori, S. Overview of independent component analysis technique with an application to synthetic aperture radar (SAR) imagery processing. Neural Networks 2003, 16, 453–467. [Google Scholar] [CrossRef]
  70. Hyvärinen, A. Fast and robust fixed-point algorithms for independent component analysis. IEEE Trans. Neural Networks 1999, 10, 626–634. [Google Scholar] [CrossRef] [Green Version]
  71. Novey, M.; Adali, T. Complex ICA by Negentropy Maximization. IEEE Trans. Neural Networks 2008, 19, 596–609. [Google Scholar] [CrossRef]
  72. Chiang, S.S.; Chang, C.I.; Ginsberg, I.W. Unsupervised hyperspectral image analysis using independent component analysis. In Proceedings of the IEEE International Geoscience and Remote Sensing Symposium, Honolulu, HI, USA, 24–28 July 2000; pp. 3136–3138. [Google Scholar]
  73. Harris, J.R.; Rogge, D.; Hitchcock, R.; Ijewliw, O.; Wright, D. Mapping lithology in Canada’s Arctic: Application of hyperspectral data using the minimum noise fraction transformation and matched filtering. Can. J. Earth Sci. 2005, 42, 2173–2193. [Google Scholar] [CrossRef]
  74. Clark, R.N.; Swayze, G.A.; Wise, R.; Livo, E.; Hoefen, T.; Kokaly, R.; Sutley, S.J. USGS Digital Spectral Library splib06a; US Geological Survey, Digital Data Series: Reston, VA, USA, 2007.
  75. Ozdemir, A.; Sahinoglu, A. Important of gossans in mineral exploration: A case study in Northern Turkey. Int. J. Earth Sci. Geophys. 2018, 4, 1–20. [Google Scholar]
  76. Cheng, Q.; Agterberg, F.P.; Ballantyne, S.B. The separation of geochemical anomalies from background by fractal methods. J. Geochemical Explor. 1994, 51, 109–130. [Google Scholar] [CrossRef]
  77. Landis, J.R.; Koch, G.G. The measurement of observer agreement for categorical data. Biometrics 1977, 33, 159–174. [Google Scholar] [CrossRef] [Green Version]
  78. Yousefi, M.; Nykänen, V. Data-driven logistic-based weighting of geochemical and geological evidence layers in mineral prospectivity mapping. J. Geochem. Explor. 2016, 164, 94–106. [Google Scholar] [CrossRef]
  79. D’Ercole, C.; Groves, D.I.; Knox-Robinson, C.M. Using fuzzy logic in a geographic information system environment to enhance conceptually based prospectivity analysis of Mississippi Valley-type mineralisation. Aust. J. Earth Sci. 2000, 47, 913–927. [Google Scholar] [CrossRef]
  80. Moradi, M.; Basiri, S.; Kananian, A.; Kabiri, K. Fuzzy logic modeling for hydrothermal gold mineralization mapping using geochemical, geological, ASTER imageries and other geo-data, a case study in Central Alborz, Iran. Earth Sci. Informatics 2015, 8, 197–205. [Google Scholar] [CrossRef]
  81. Zhang, N.; Zhou, K.; Du, X. Application of fuzzy logic and fuzzy AHP to mineral prospectivity mapping of porphyry and hydrothermal vein copper deposits in the Dananhu-Tousuquan island arc, Xinjiang, NW China. J. African Earth Sci. 2017, 128, 84–96. [Google Scholar] [CrossRef]
  82. Esmaeily, D.; Afshooni, S.Z.; Mirnejad, H.; Rashidnejad-e-Omran, N. Mass changes during hydrothermal alteration associated with gold mineralization in the Astaneh granitoid rocks, western Iran. Geochem. Explor. Environ. Anal. 2012, 12, 161–175. [Google Scholar] [CrossRef]
  83. Zhang, Y.; Gao, J.-F.; Ma, D.; Pan, J. The role of hydrothermal alteration in tungsten mineralization at the Dahutang tungsten deposit, South China. Ore Geol. Rev. 2018, 95, 1008–1027. [Google Scholar] [CrossRef]
  84. Pollard, P.J. An intrusion-related origin for Cu–Au mineralization in iron oxide–copper–gold (IOCG) provinces. Miner. Depos. 2006, 41, 179. [Google Scholar] [CrossRef]
  85. Xiao, B.; Chen, H.; Hollings, P.; Wang, Y.; Yang, J.; Wang, F. Element transport and enrichment during propylitic alteration in Paleozoic porphyry Cu mineralization systems: Insights from chlorite chemistry. Ore Geol. Rev. 2018, 102, 437–448. [Google Scholar] [CrossRef]
  86. Bonham-Carter, G.F. Geographic Information Systems for Geoscientists: Modeling with GIS. Comput. Methods Geosci. 1994, 13, 398. [Google Scholar]
  87. Yousefi, M.; Carranza, E.J.M. Prediction-area (P-A) plot and C-A fractal analysis to classify and evaluate evidential maps for mineral prospectivity modeling. Comput. Geosci. 2015, 79, 69–81. [Google Scholar] [CrossRef]
  88. Langlois, D.; Chartier, S.; Gosselin, D. An introduction to independent component analysis: InfoMax and FastICA algorithms. Tutor. Quant. Methods Psychol. 2010, 6, 31–38. [Google Scholar] [CrossRef] [Green Version]
  89. Foody, G.M. Explaining the unsuitability of the kappa coefficient in the assessment and comparison of the accuracy of thematic maps obtained by image classification. Remote Sens. Environ. 2020, 239, 111630. [Google Scholar] [CrossRef]
  90. Shokouh Saljoughi, B.; Hezarkhani, A.; Farahbakhsh, E. A comparison between knowledge-driven fuzzy and data-driven artificial neural network approaches for prospecting porphyry Cu mineralization; A case study of Shahr-e-Babak area, Kerman Province, SE Iran. J. Min. Environ. 2018, 9, 917–940. [Google Scholar]
  91. De Smith, M.J.; Goodchild, M.F.; Longley, P. Geospatial Analysis: A Comprehensive Guide to Principles, Techniques and Software Tools; Troubador Publishing Ltd.: Leicester, UK, 2007; ISBN 1905886608. [Google Scholar]
Figure 1. (a) Simplified tectonic scheme of Iran; and (b) geological map of the Toroud-Chahshirin range located in Central Iran [50].
Remotesensing 12 01261 g001
Figure 2. Laboratory spectra of the indicative minerals in (a) gossans, (b) argillic, (c) propylitic, and (d) phyllic hydrothermal alteration zones. These spectra were resampled to the advanced spaceborne thermal emission and reflection radiometer (ASTER) spectral bands and are shown against wavelength and band numbers in the second and third columns, respectively [74].
Remotesensing 12 01261 g002
Figure 3. Methodology flowchart for generating a remote sensing evidential layer. We used ASTER remote sensing data as the input to this flowchart, which can be replaced with other types of satellite images.
Remotesensing 12 01261 g003
Figure 4. Trends of eigenvectors related to the selective principal component analysis on the ASTER spectral bands presented in Table 1, Table 2, Table 3 and Table 4, are shown in (ad), respectively.
Remotesensing 12 01261 g004
Figure 5. Logarithmic scaled plots of area versus the pixel values for the selected principal components for enhancing the (a) gossans, (b) argillic, (c) propylitic, and (d) the phyllic alteration zones.
Remotesensing 12 01261 g005
Figure 6. Anomalous pixels of different principal components determined using the C-A plots for enhancing (a) gossans, (b) argillic, (c) propylitic, and (d) phyllic alteration zones, overlaid on the hillshade of the study area.
Remotesensing 12 01261 g006
Figure 7. Logarithmic scaled plots of area versus pixel values for the selected independent components for enhancing the (a) gossans, (b) argillic, (c) propylitic, and (d) phyllic alteration zones.
Remotesensing 12 01261 g007
Figure 8. Anomalous pixels of different independent components determined using the C-A plots for enhancing the (a) gossans, (b) argillic, (c) propylitic, and (d) phyllic alteration zones, overlaid on the hillshade of the study area.
Remotesensing 12 01261 g008
Figure 9. Trends of transformation vectors related to the selective MNF analysis on the ASTER spectral bands presented in Table 5, Table 6, Table 7 and Table 8, are shown in (ad), respectively.
Remotesensing 12 01261 g009
Figure 10. Logarithmic scaled plots of area versus pixel values for the selected MNF components for enhancing the (a) gossans, (b) argillic, (c) propylitic, and (d) phyllic alteration zones.
Remotesensing 12 01261 g010
Figure 11. Anomalous pixels of different MNF components determined using the C-A plots for enhancing the (a) gossans, (b) argillic, (c) propylitic, and (d) phyllic alteration zones, overlaid on the hillshade of the study area.
Remotesensing 12 01261 g011
Figure 12. Photos taken from different alteration types including (a) phyllic alteration, (b) phyllic alteration associated with clay minerals known as the indicators of argillic alteration, (c) phyllic alteration associated with iron oxide and hydroxide minerals, (d) propylitic alteration, and (e) gossan. (f) Close view of a vein-type mineralization hosted by a silicified rock.
Remotesensing 12 01261 g012
Figure 13. Thin sections of different types of alteration mineralogy. Microphotographs of (a,b) argillic alteration zone—plagioclase replaced with sericite and clay mineral groups; (c,d) phyllic zone—opaque minerals and plagioclase replaced with clay mineral groups and quartz; and (e,f) propylitic zone—completely replaced original mineralogy by calcite, epidote, chlorite, and quartz.
Remotesensing 12 01261 g013
Figure 14. Results of the XRD analysis showing the indicative minerals of the representative samples collected from (a) argillic zone; (b) propylitic zone; (c) phyllic zone; and (d) gossans.
Remotesensing 12 01261 g014
Figure 15. Samples collected from different alteration zones overlaid on the hillshade of the study area.
Remotesensing 12 01261 g015
Figure 16. P-A plot of the integrated map obtained using fuzzy gamma operator (gamma = 0.9).
Remotesensing 12 01261 g016
Figure 17. C-A plot of the integrated map used for classifying and separating the anomaly population.
Remotesensing 12 01261 g017
Figure 18. Known hydrothermal mineral occurrences overlaid on the classified integrated maps by (a) the C-A plot, and (b) Natural Jenks Breaks, generated by integrating the weighted-selected components.
Remotesensing 12 01261 g018
Table 1. Eigenvectors of the principal component analysis on a spectral subset of the ASTER data for detecting the gossans in the study area.
EigenvectorsBand 1Band 2Band 3Band 4
PC 10.3419970.4726480.4992620.640608
PC 20.3216810.4137720.371346−0.76643
PC 3−0.680078−0.191080.706279−0.046394
PC 40.563075−0.7542440.337652−0.007266
Table 2. Eigenvectors of the principal component analysis on a spectral subset of the ASTER data for detecting the argillic alteration zones in the study area.
EigenvectorsBand 1Band 4Band 5Band 7
PC 10.2072350.5055040.513440.66174
PC 20.947905−0.240599−0.2038490.045107
PC 30.2021740.78474−0.113303−0.574867
PC 40.132878−0.2660110.825825−0.47916
Table 3. Eigenvectors of the principal component analysis on a spectral subset of the ASTER data for detecting the propylitic alteration zones in the study area.
EigenvectorsBand 1Band 4Band 5Band 8
PC 1−0.264923−0.649083−0.657148−0.276883
PC 2−0.9530770.225220.19047−0.068121
PC 3−0.050172−0.7251650.6661350.166981
PC 4−0.13763−0.045865−0.2968860.943829
Table 4. Eigenvectors of the principal component analysis on a spectral subset of the ASTER data for detecting the phyllic alteration zones in the study area.
EigenvectorsBand 1Band 4Band 6Band 7
PC 10.182460.4424980.6574350.581965
PC 20.961565−0.24002−0.1303250.028251
PC 30.1202620.801479−0.5856270.014461
PC 4−0.166245−0.322827−0.4558890.812595
Table 5. Transformation vectors of minimum noise fraction (MNF) analysis on a spectral subset of the ASTER data for detecting gossans in the study area.
Transformation VectorsBand 1Band 2Band 3Band 4
C 10.001754−0.000020.000029−0.01711
C 2−0.01966−0.005570.0077380.005621
C 3−0.0249870.0044260.018885−0.00362
C 40.022636−0.0335690.017022−0.000533
Table 6. Transformation vectors of MNF analysis on a spectral subset of the ASTER data for detecting the argillic alteration zones in the study area.
Transformation VectorsBand 1Band 2Band 3Band 4
C 10.001734−0.013649−0.0113890.005532
C 2−0.0058710.034231−0.025712−0.005107
C 30.0145240.007016−0.0192290.005719
C 4−0.008015−0.004828−0.0152790.018378
Table 7. Transformation vectors of MNF analysis on a spectral subset of the ASTER data for detecting the propylitic alteration zones in the study area.
Transformation VectorsBand 1Band 2Band 3Band 4
C 1−0.0015560.0169580.013699−0.028643
C 2−0.0068480.031257−0.016662−0.03121
C 3−0.009486−0.0157550.028617−0.024276
C 4−0.013196−0.00112−0.0120470.044362
Table 8. Transformation vectors of MNF analysis on a spectral subset of the ASTER data for detecting the phyllic alteration zones in the study area.
Transformation VectorsBand 1Band 2Band 3Band 4
C 10.001676−0.01846−0.0030350.004273
C 20.004374−0.0328690.0204120.001996
C 30.0161310.003897−0.0109920.004757
C 40.0056220.0073790.010819−0.019848
Table 9. Confusion matrices of the transformation techniques used for enhancing different alteration types.
Ground Truth
PCAGossanArgillicPropyliticPhyllic
Gossan14100
Argillic11103
Propylitic1090
Phyllic02013
Overall accuracy0.85
ICA
Gossan13101
Argillic01302
Propylitic2080
Phyllic01014
Overall accuracy0.87
MNF
Gossan12201
Argillic01401
Propylitic3070
Phyllic03012
Overall accuracy0.81

