Wideband Waveform Generation Using MDDS and Phase Compensation for X-Band SAR


Department of Electrical and Computer Engineering, Ajou University, Suwon 16499, Korea
*
Author to whom correspondence should be addressed.
Remote Sens. 2020, 12(9), 1431; https://0-doi-org.brum.beds.ac.uk/10.3390/rs12091431
Submission received: 23 March 2020
/
Revised: 27 April 2020
/
Accepted: 30 April 2020
/
Published: 1 May 2020
(This article belongs to the Section Engineering Remote Sensing)
Abstract
:This study investigated wideband waveform generation using a field programmable gate array (FPGA) for X-band high-resolution synthetic aperture radar (SAR). Due to the range resolution determined by the bandwidth, we focused on wide bandwidth generation while preserving spectrum quality. The proposed method can generate wide bandwidth using a relatively low system clock. The new approach was designed in Simulink and implemented by very-high-speed-integrated-circuits hardware description language (VHDL). We also proposed a hardware structure in accordance with the proposed method. Signal connections of FPGA and digital analog converter (DAC) are described in the design of the proposed hardware structure. The developed X-band waveform generator using the proposed method output the desired pulse waveform. For the reduction of phase error and improvement of spectrum quality at the X-band, phase error compensation and pre-distortion were applied to the waveform generator. The results of the simulation and the hardware output demonstrate that the variation and standard deviation of the phase error were improved within the frequency spectrum. Accordingly, the proposed method and the developed waveform generator have the potential to produce a high-resolution image of the area of interest.
1. Introduction
Synthetic aperture radar (SAR) transmits and receives microwaves during mission operation. Microwaves have a property of passing through matter and the atmosphere, such as clouds and rain, depending on the wavelength. Thus, SAR can observe all-weather conditions. Based on these advantages, SAR is widely used for Earth observation, environment monitoring, and military surveillance [1,2,3,4]. The research fields of SAR are divided into SAR system development, SAR observations by onboard satellites, unmanned aerial vehicles (UAV) or cars, image processing, and image applications for enemy surveillance or natural disaster monitoring. One system that has been developed was completed in a project led by the national institute, i.e., Korea aerospace research institute (KARI) and the defense industry, because of the enormous money and time requirements. Even though these organizations developed independently, they use commercial, off-the-shelf equipment or design their own test equipment [5,6,7,8]. Thus, most universities and industries are focused on algorithm-based image processing and applications. However, image data are expensive for student researchers. We have been developing a ground-based SAR system for many years to manage our own system. Instead of a direct digital synthesizer (DDS) chip and arbitrary waveform generator (AWG), we designed and developed a system for generating the waveform.
Resolution is the ability to distinguish and separate two objects. Image resolution is an index determining image quality and utility value. It is especially important for military purposes for enemy classification. Resolution consists of two dimensions in a SAR image [9]. First, the azimuth resolution represents the resolution along the platform (satellite and UAV) flight path and is determined by the antenna length in the azimuth direction. The antenna beamwidth is inversely proportional to the antenna length [10]. Second, the range resolution is the resolution where the beam is being emitted. Thus, the waveform characteristic affects the range resolution [11,12]. The waveform imbalance (e.g., amplitude, phase, and delay) was calibrated for a very high resolution with three sub-band frequencies [11]. In [12], a new equation was derived based on wavenumbers. The ground-range resolution was derived by the wavenumber, platform velocity, and locations. There are further studies using nonlinear frequency modulation for improvement of the signal-to-noise ratio [13,14,15]. Nonlinear frequency modulation can suppress the sidelobes and save transmitting power without losing the signal-to-noise ratio. In the radar system, the shorter the pulse, the smaller is the target that can be discriminated [16]. However, because the implementation of a very short pulse has a system limitation, SAR adopted a chirp waveform [17]. In a SAR system, the wider the bandwidth, the higher the resolution that can be acquired. In the case of the L-band SAR, which is relatively low in frequency and has a narrow band, the range resolution is tens of meters, even though the system has a large antenna. In contrast, the X-band SAR using a relatively small antenna can have high-resolution capability due to the wideband waveform [9,16,17,18]. Generation of the wide bandwidth depends on the signal generation clock. However, high-speed systems, such as field programmable gate array (FPGA) and digital analog converter (DAC), cost a lot of money. Thus, we propose a high-speed system scheme using a relatively low system load for generation of a wide bandwidth waveform.
A waveform generator generates a specific waveform using a commercial product or the desired waveform based on the environment using an FPGA. Conventional SAR studies used commercial chips or test equipment for efficiency with the experiments. The equipment is limited due to its unchangeable characteristics, making it challenging to use experimental parameters, such as wide bandwidth and different shapes of the waveform. In the case of a study using a DDS chip, the researchers used the multiplier or reference source to expand the bandwidth [14,19]. The multiplier can output multiple bandwidths without an FPGA burden, but the distortion in the frequency also expands such that spectrum quality is decreased. The other problem in conventional systems is the radio frequency (RF) imbalance. RF imbalance and nonlinearity cause waveform distortion and image degradation. The RF linearity analysis and digital pre-distortion produced by a high-power amplifier were compensated for in [20,21].
In this study, we describe a wideband waveform generation method and demonstrate the results using a developed waveform generator. We modified the conventional multi-DDS (MDDS) method to compensate for the phase center error generated at the baseband. Pre-distortion was also applied to improve X-band spectrum quality. The waveform generator was designed based on an MDDS structure that can generate a wide bandwidth without a system clock burden. Moreover, the developed waveform generator can output the desired waveform based on the environment because we programed the FPGA accordingly. Finally, the compensated phase center and the pre-distorted phase are verified by the experimental results.
The main contributions of this study include:
- Proposal for an improved MDDS method: We propose an improved MDDS method for wideband waveform generation to satisfy the desired clock cost and reduce the phase error.
- Development and verification of the waveform generator for wideband: For a high-speed and low-cost system, we propose a hardware structure in accordance with the improved MDDS method. The developed waveform generator was measured to verify the wideband generation method and decrement of phase error varying time.
2. Materials and Methods
2.1. Study Area
2.1.1. Chirp Pulse Waveform
In the radar system, the wider the bandwidth, the smaller is the object that can be detected. However, implementation of the wider bandwidth is a burden to the system, and the development costs increase due to expensive hardware. To solve this problem, the chirp pulse has been widely used in SAR systems. The chirp pulse for linear frequency modulation (LFM) has a very large time bandwidth product (TBP) characteristic. The other advantage of using chirp is its correlation property [17], which can acquire received signals, omitting noise and other unwanted reflections.
The radar emits the signal and acquires two-dimensional data: azimuth and range direction. The resolution of the radar can be expressed as:
where is the azimuth resolution, is the antenna length, is the speed of the light, is the range resolution, and is the pulse width without modulation. Instead of using the short pulse in Equation (2), SAR increases the bandwidth using chirp for better resolution. The range resolution using chirp modulation is given by:
where is the bandwidth, is the last frequency, and is the initial frequency. The wide bandwidth is easily implemented by the frequency variation. The chirp pulse is a rectangular shape and contains amplitude and phase terms:
where is amplitude modulation, is the phase modulation, is the time, is the pulse width, and is the chirp rate, which is the increment of the frequency over time. Baseband chirp signal is implemented using Equation (4).
There are two types of digital chirp generation methods: memory-map-based waveform generator and algorithm-based waveform generator.
2.1.2. Memory-Map-Based Waveform Generator
The memory-map-based waveform generator is one of the digital methods to generate a waveform. This method has the advantage that the output signal is stable and easy to implement because the stored data is loaded in the memory (FPGA programmable read-only memory (PROM), or read-only memory (ROM)). However, due to the increasing demands of various data types for SAR, more memory capacity is needed. Furthermore, in the case of memory capacity limitations or damage due to external factors, SAR may not function properly and cannot acquire the images. To overcome these problems, the use of DDS has been increasing recently [17].
2.1.3. DDS-Based Waveform Generator
The most used method for a digital chirp waveform generator is DDS. Compared to the memory-map method, the DDS method has more usability because it can synthesize the desired signal by using the initial parameter such as chirp rate, reference clock, and length of the phase accumulator. Because the initial parameter occupies relatively low memory, the DDS method has minimal dependence on memory. Thus, the SAR system can be miniaturized by reducing the components. However, when the DDS method outputs the signal, the quality of the signal depends on a system clock and bit resolution. If the output signal has low bit resolution, truncation and phase errors can occur. Phase errors cause distortion or ambiguity in the SAR image [12]. These problems result in a failure to meet SAR development goals. Consequently, it is important to generate and transmit accurate signals because SAR uses the transmission chirp waveform as a reference signal for image processing.
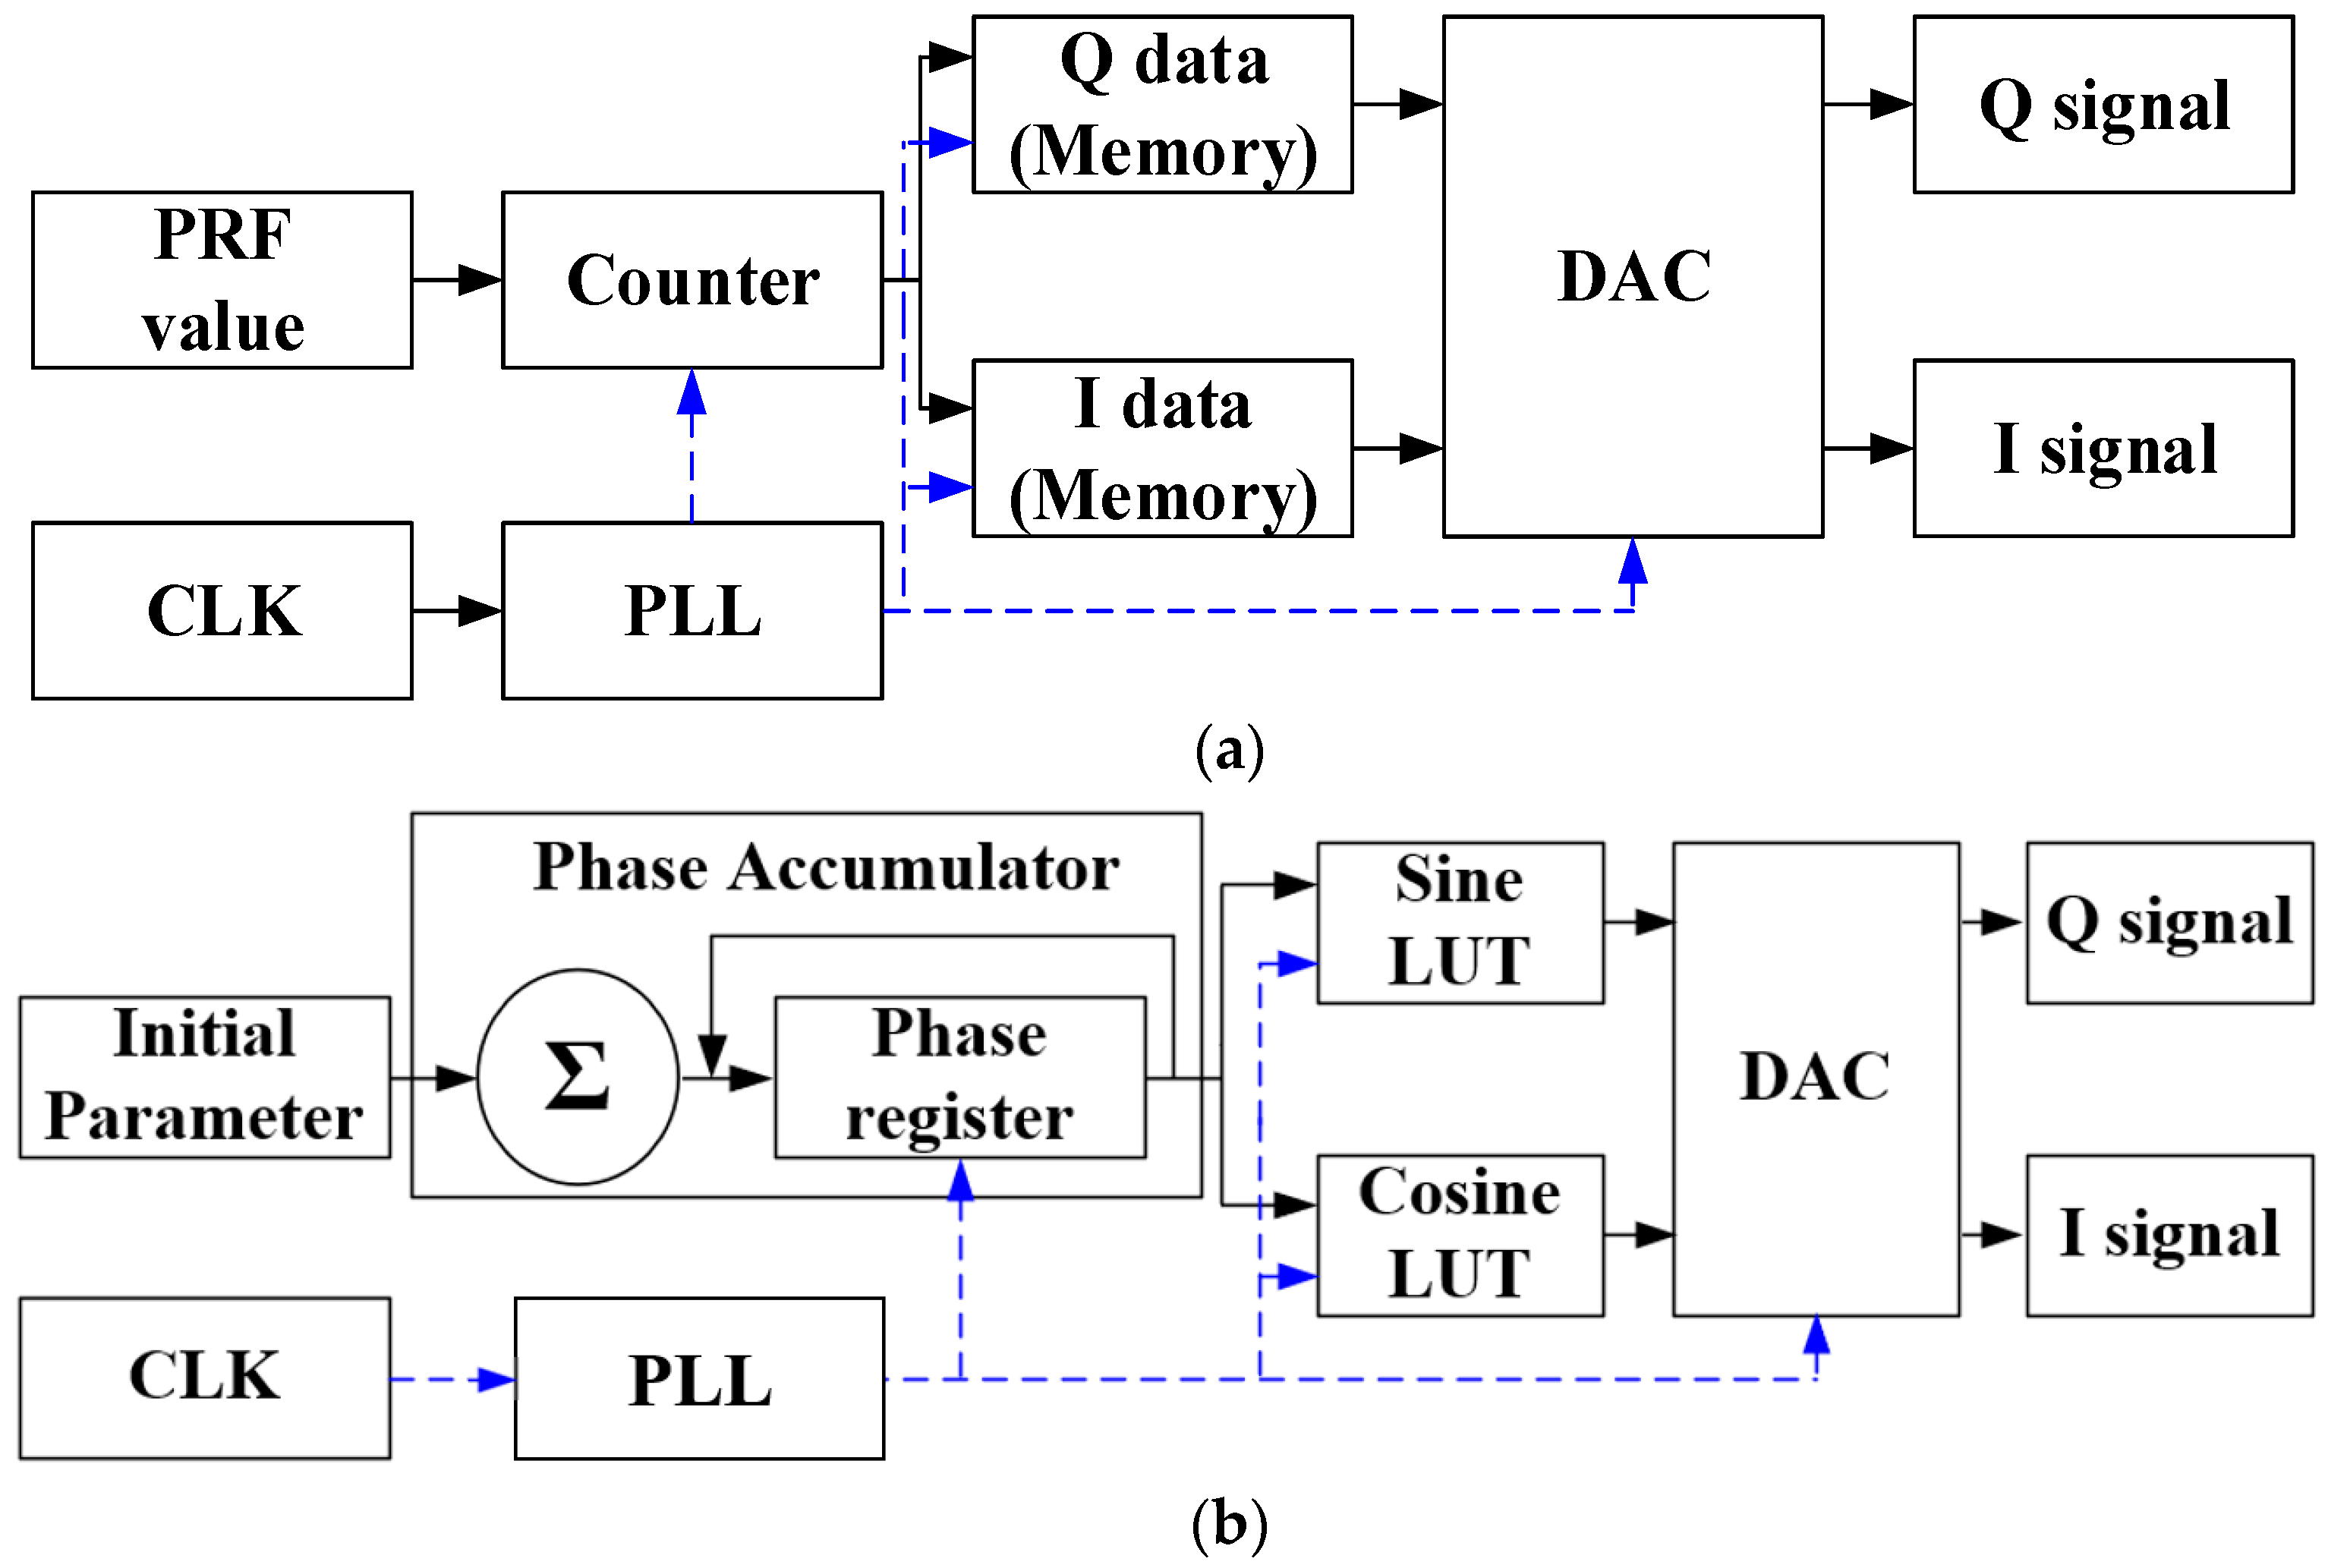
A block diagram of the digital chirp waveform generator is depicted in Figure 1. The memory-map-based chirp generator, illustrated in Figure 1a, loads the data according to the pulse repetition frequency (PRF), whereas the DDS-based chirp generator loads the values corresponding to the accumulated phase from the look-up table (LUT).
Because most chirp waveform generators adopting digital methods have mechanical issues, we used the MDDS method, considering the hardware specifications for a high-speed, low-cost waveform generator. In this study, we considered two aspects of the MDDS: low-cost wideband waveform and distortion compensation. Furthermore, we developed the waveform generator by applying an improved MDDS method to verify the proposed method.
2.2. Proposed Improved MDDS Method
This section introduces the MDDS, including phase compensation and pre-distortion for the MDDS. Although conventional MDDS has a strong advantage in the generation of wideband, the primary drawback is phase center error. The phase compensation compensates for the phase center error that occurs when mixing the DDS signals. The purpose of the pre-distortion is to apply the distortion in advance to compensate for the random error caused by RF conversion. In this section, we describe a block diagram, equation, and method for phase error compensation and pre-distortion. The phase error was measured using 89600 VSA software and was shown to be constant at several measurements.
2.2.1. Improved MDDS
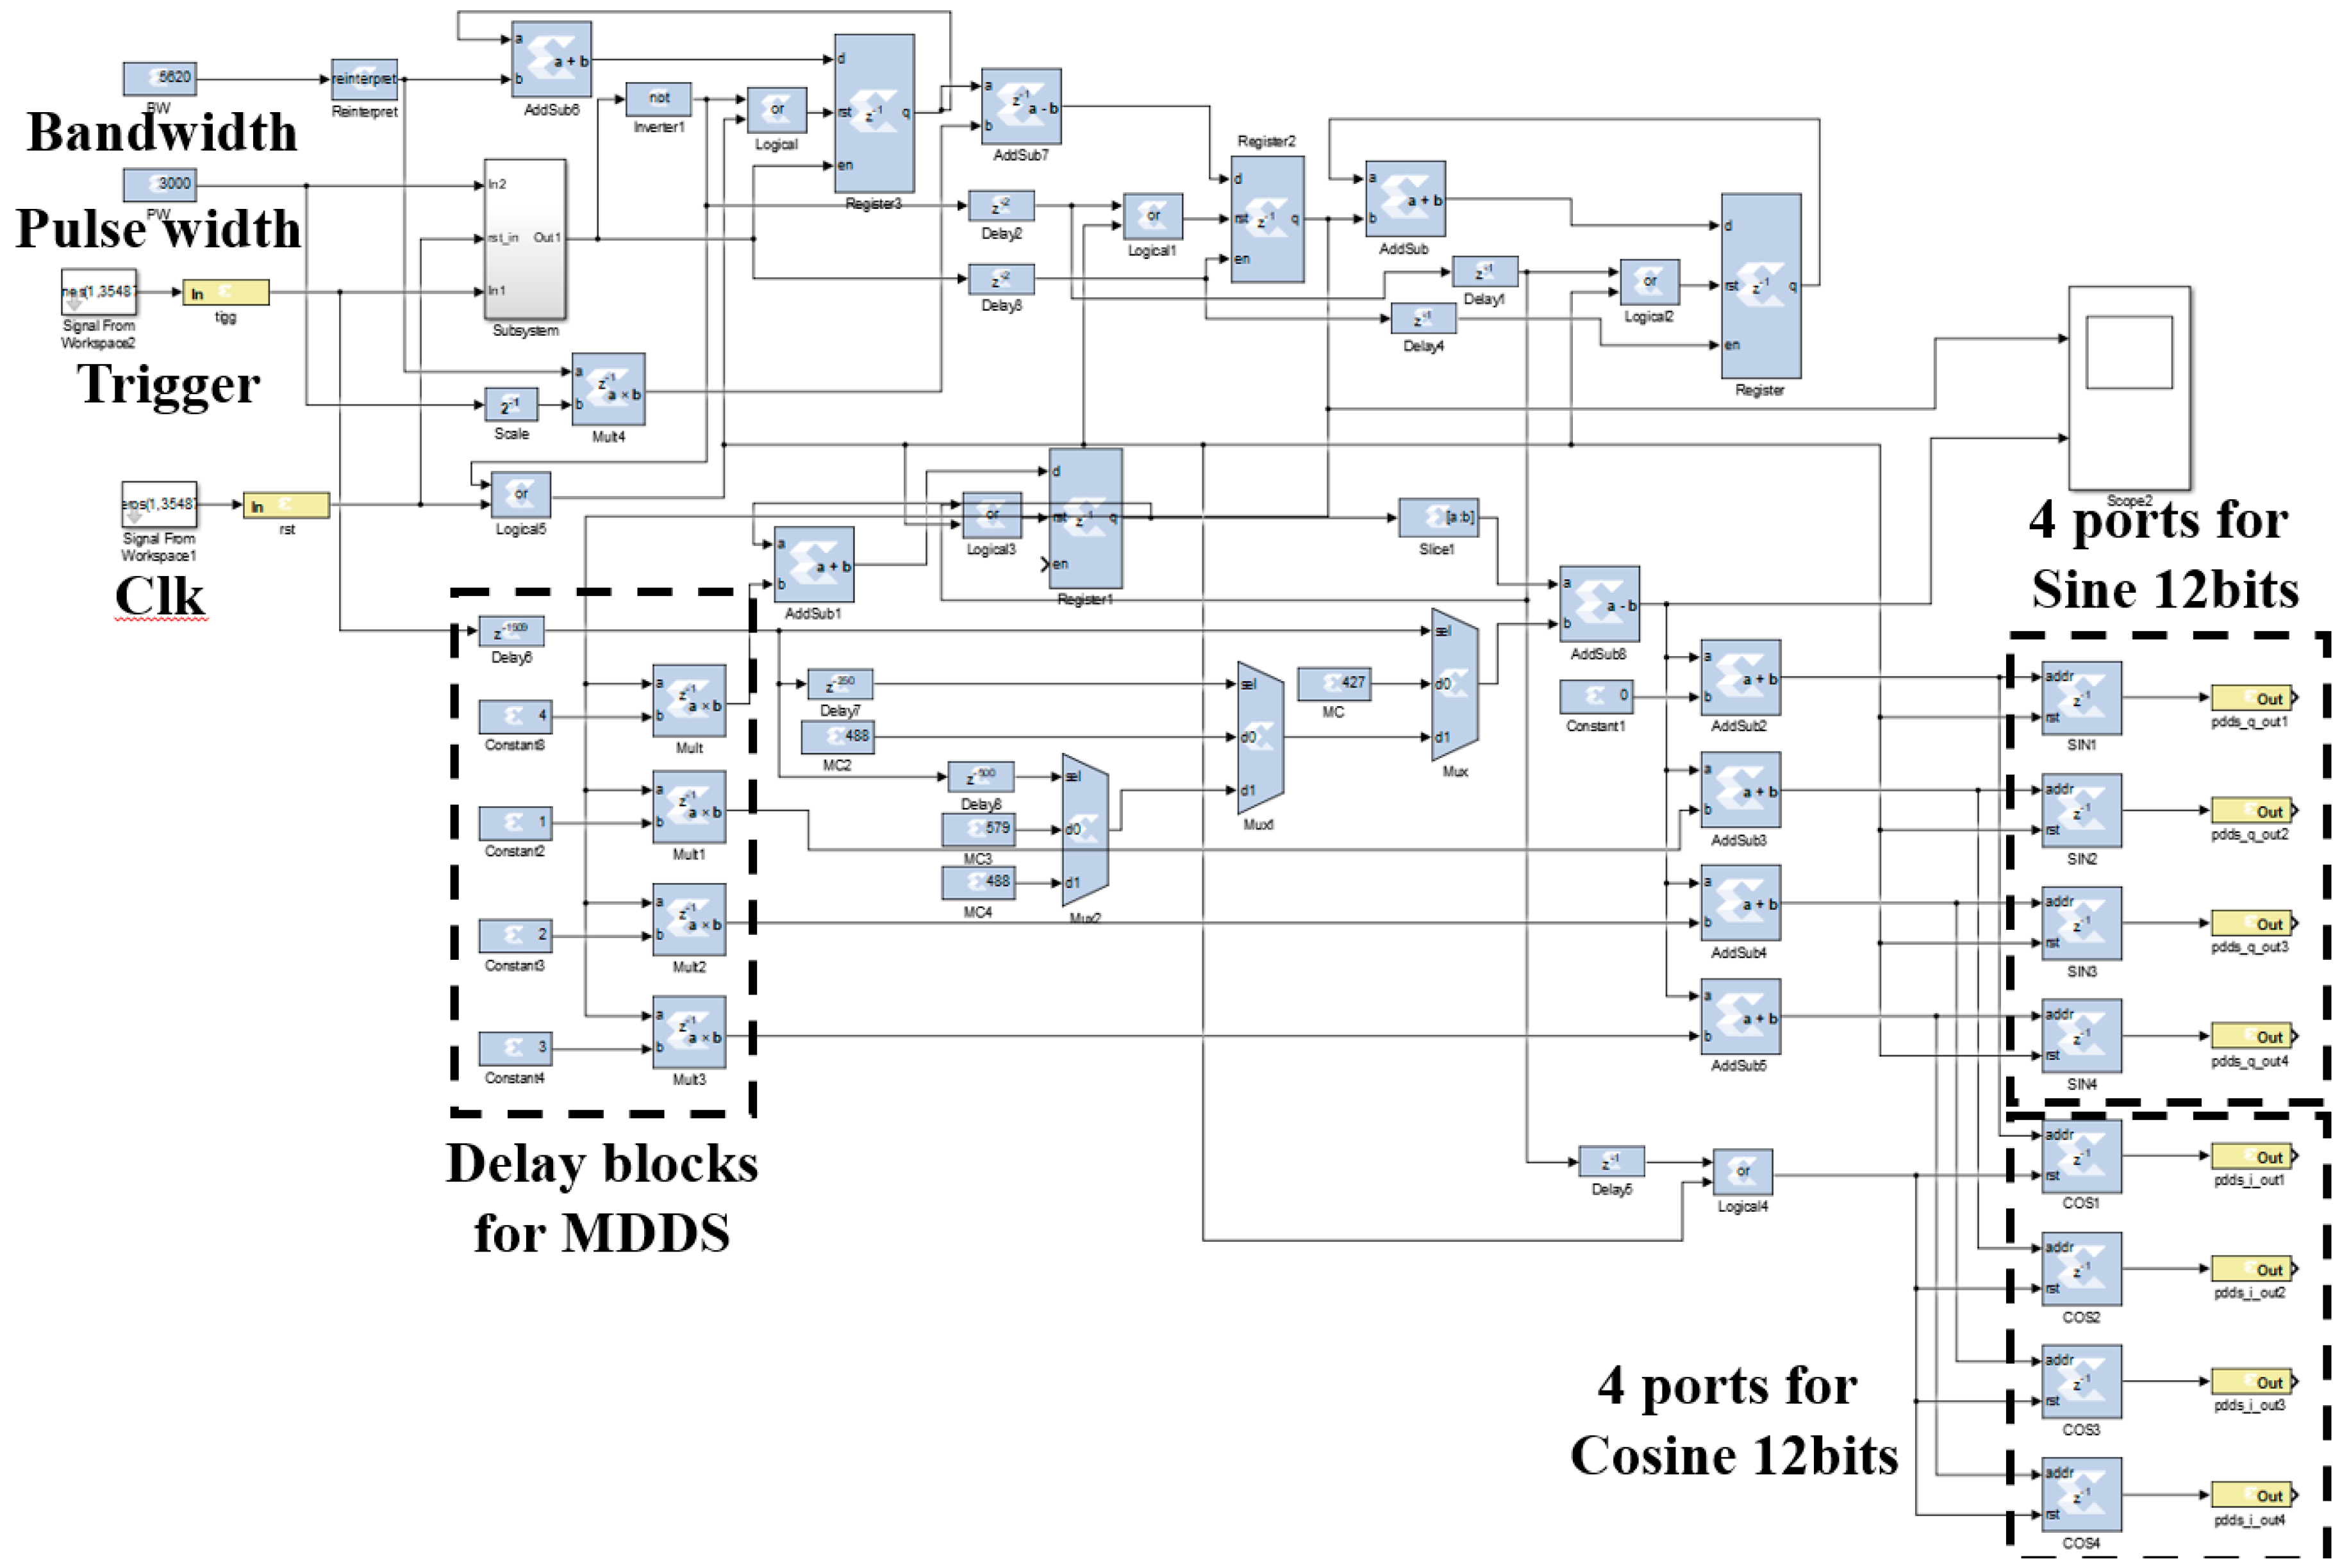
We designed a Simulink block diagram to simulate chirp pulse generation and for the pre-configuration of the FPGA. Figure 2 illustrates the block diagram for the MDDS, including a reference clock for FPGA operation, trigger, reset, and chirp waveform generation blocks. We added the delay blocks of 0, 1, 2, and 3 to multiplex four different 1/4-length signals.
The proposed improved MDDS method has four ports for sine and four ports for cosine. Sine and cosine waveform in the Simulink represent 12 bit resolution as follows:
The four signals are mixed (one signal per clock) by the multiplexer in the hardware and converted to an analog signal. Therefore, it is possible to output a four-times-faster signal in one clock. This method has the advantages of decreasing the load on the FPGA and reducing hardware costs.
2.2.2. Proposed Phase Error Compensation and Pre-Distortion
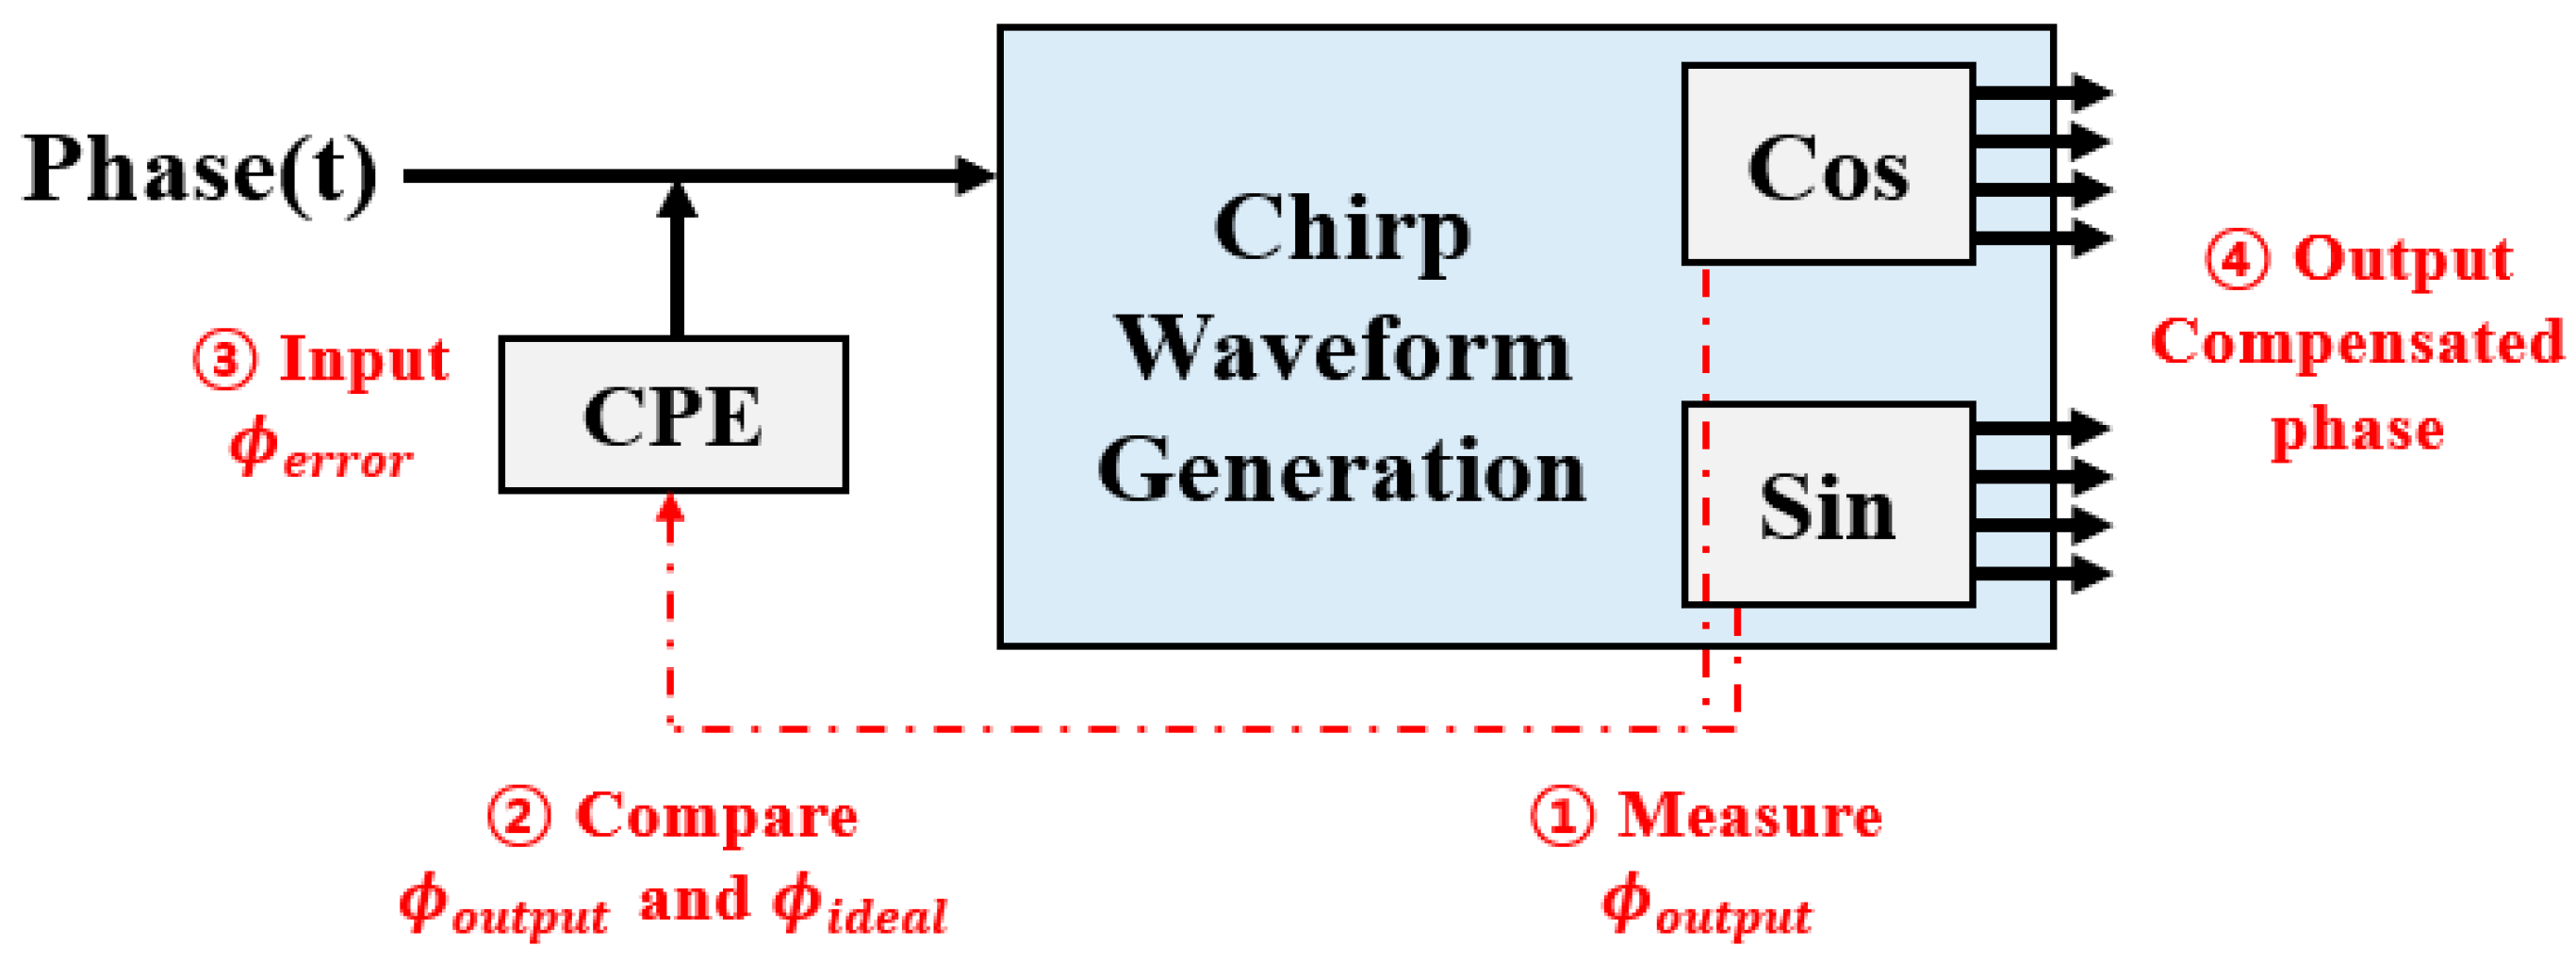
In this study, we propose an additional block diagram to compensate for the phase error caused by MDDS generation. The additional block diagram, referred to as the compensation phase error (CPE), is depicted in Figure 3 and calculated as follows:
where is the phase value varying time and , , and are chirp rate, initial frequency, and initial phase, respectively. will be changed by calculating the phase error. is the phase error, is the output of Simulink, and is the calculated phase value [22]. We simulated the MDDS and compared the output with the ideal value, which was derived from a formula. The difference between the two values, the phase error, was input to the CPE block. The ideal output was obtained by compensating for the phase center. The practical hardware output was different from the simulated ideal output due to the hardware characteristics distortion and circuit loss. A pre-distortion method was also applied to Simulink because the developed waveform generator could not be modified.
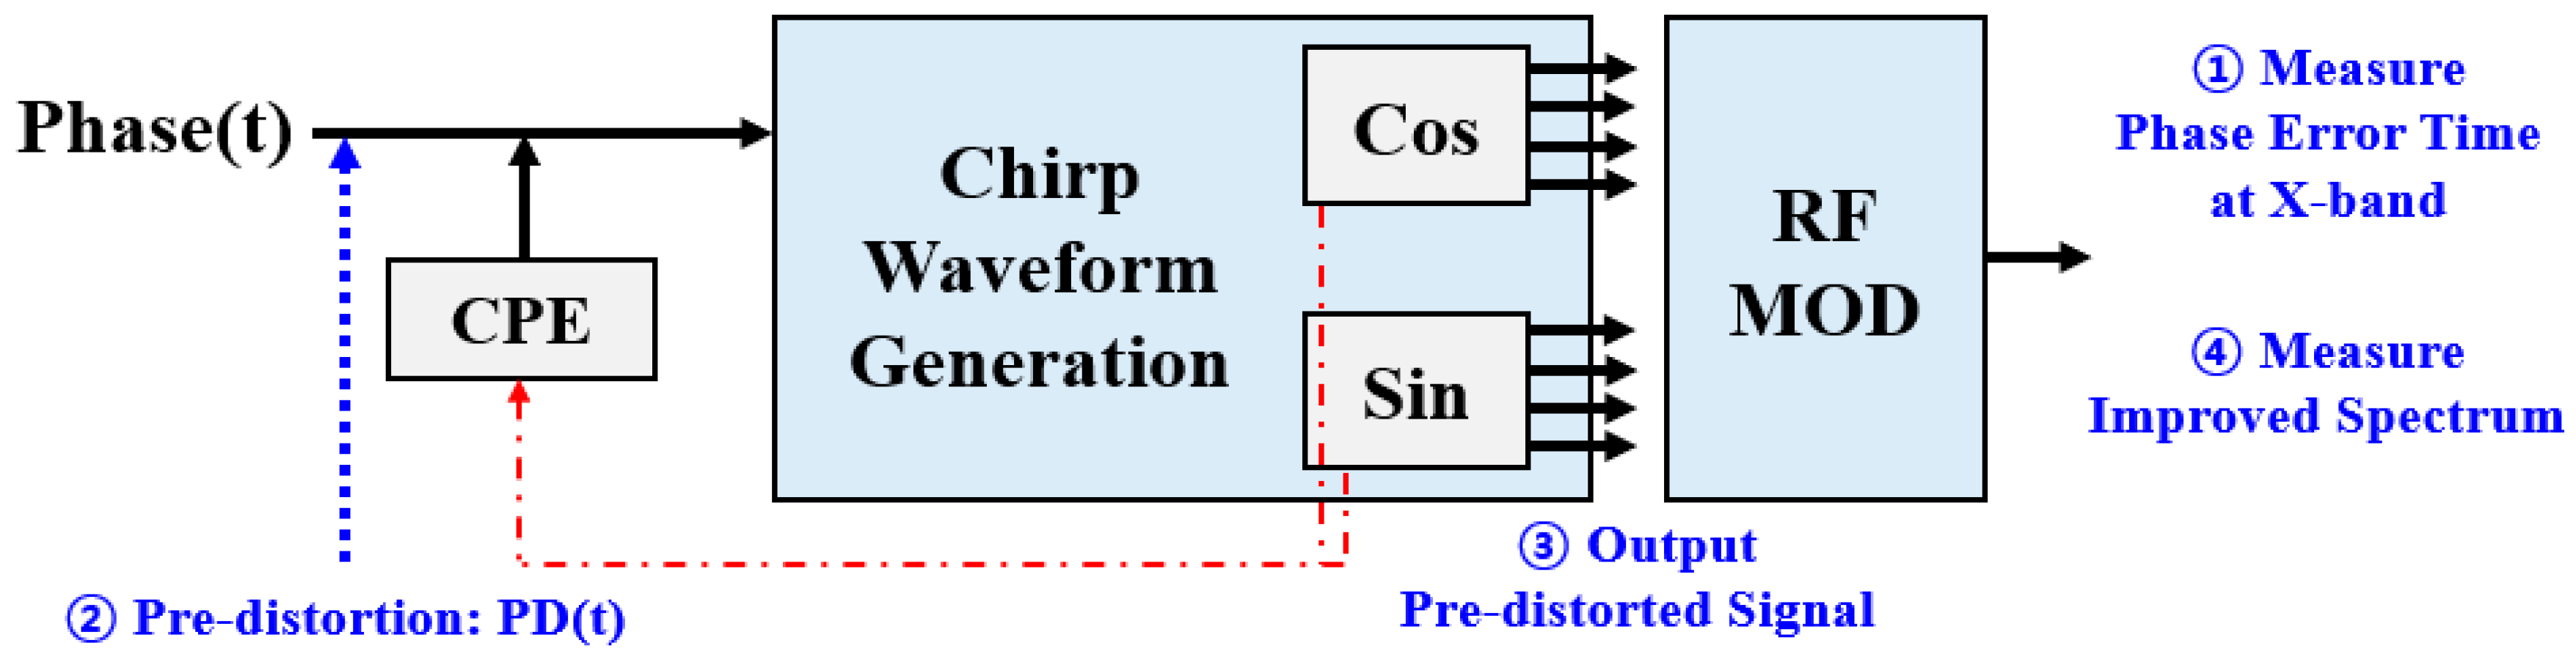
Figure 4 illustrates the pre-distortion process to compensate for the phase error varying time in the X-band frequency spectrum. First, we measured the phase error varying time in the X-band spectrum. We then selected the pre-distortion section, which has a relatively large phase error. The number of sections and the section lengths were determined by considering compensation gain and hardware efficiency.
2.3. MDDS Waveform Generator
2.3.1. Design of the MDDS Waveform Generator
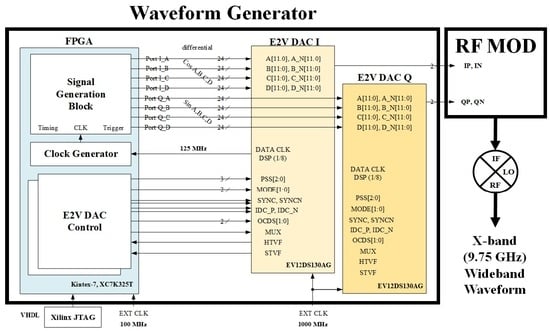
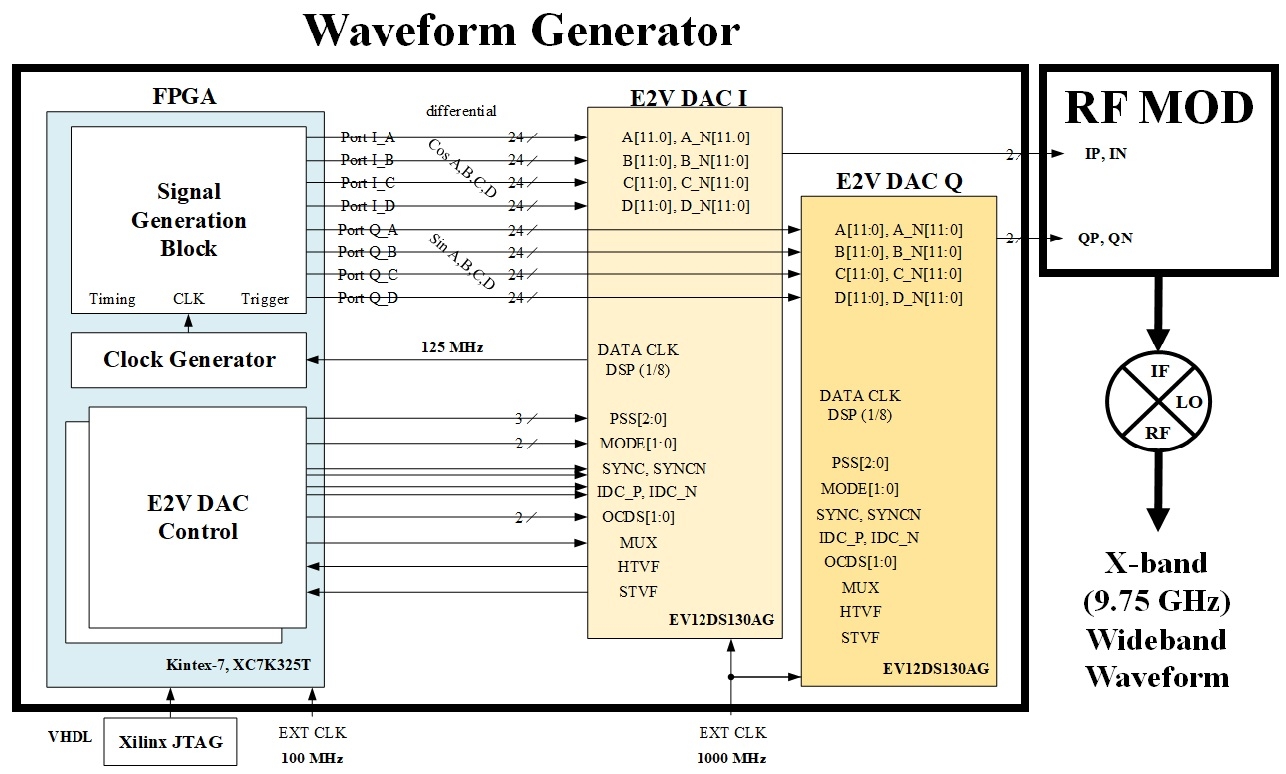
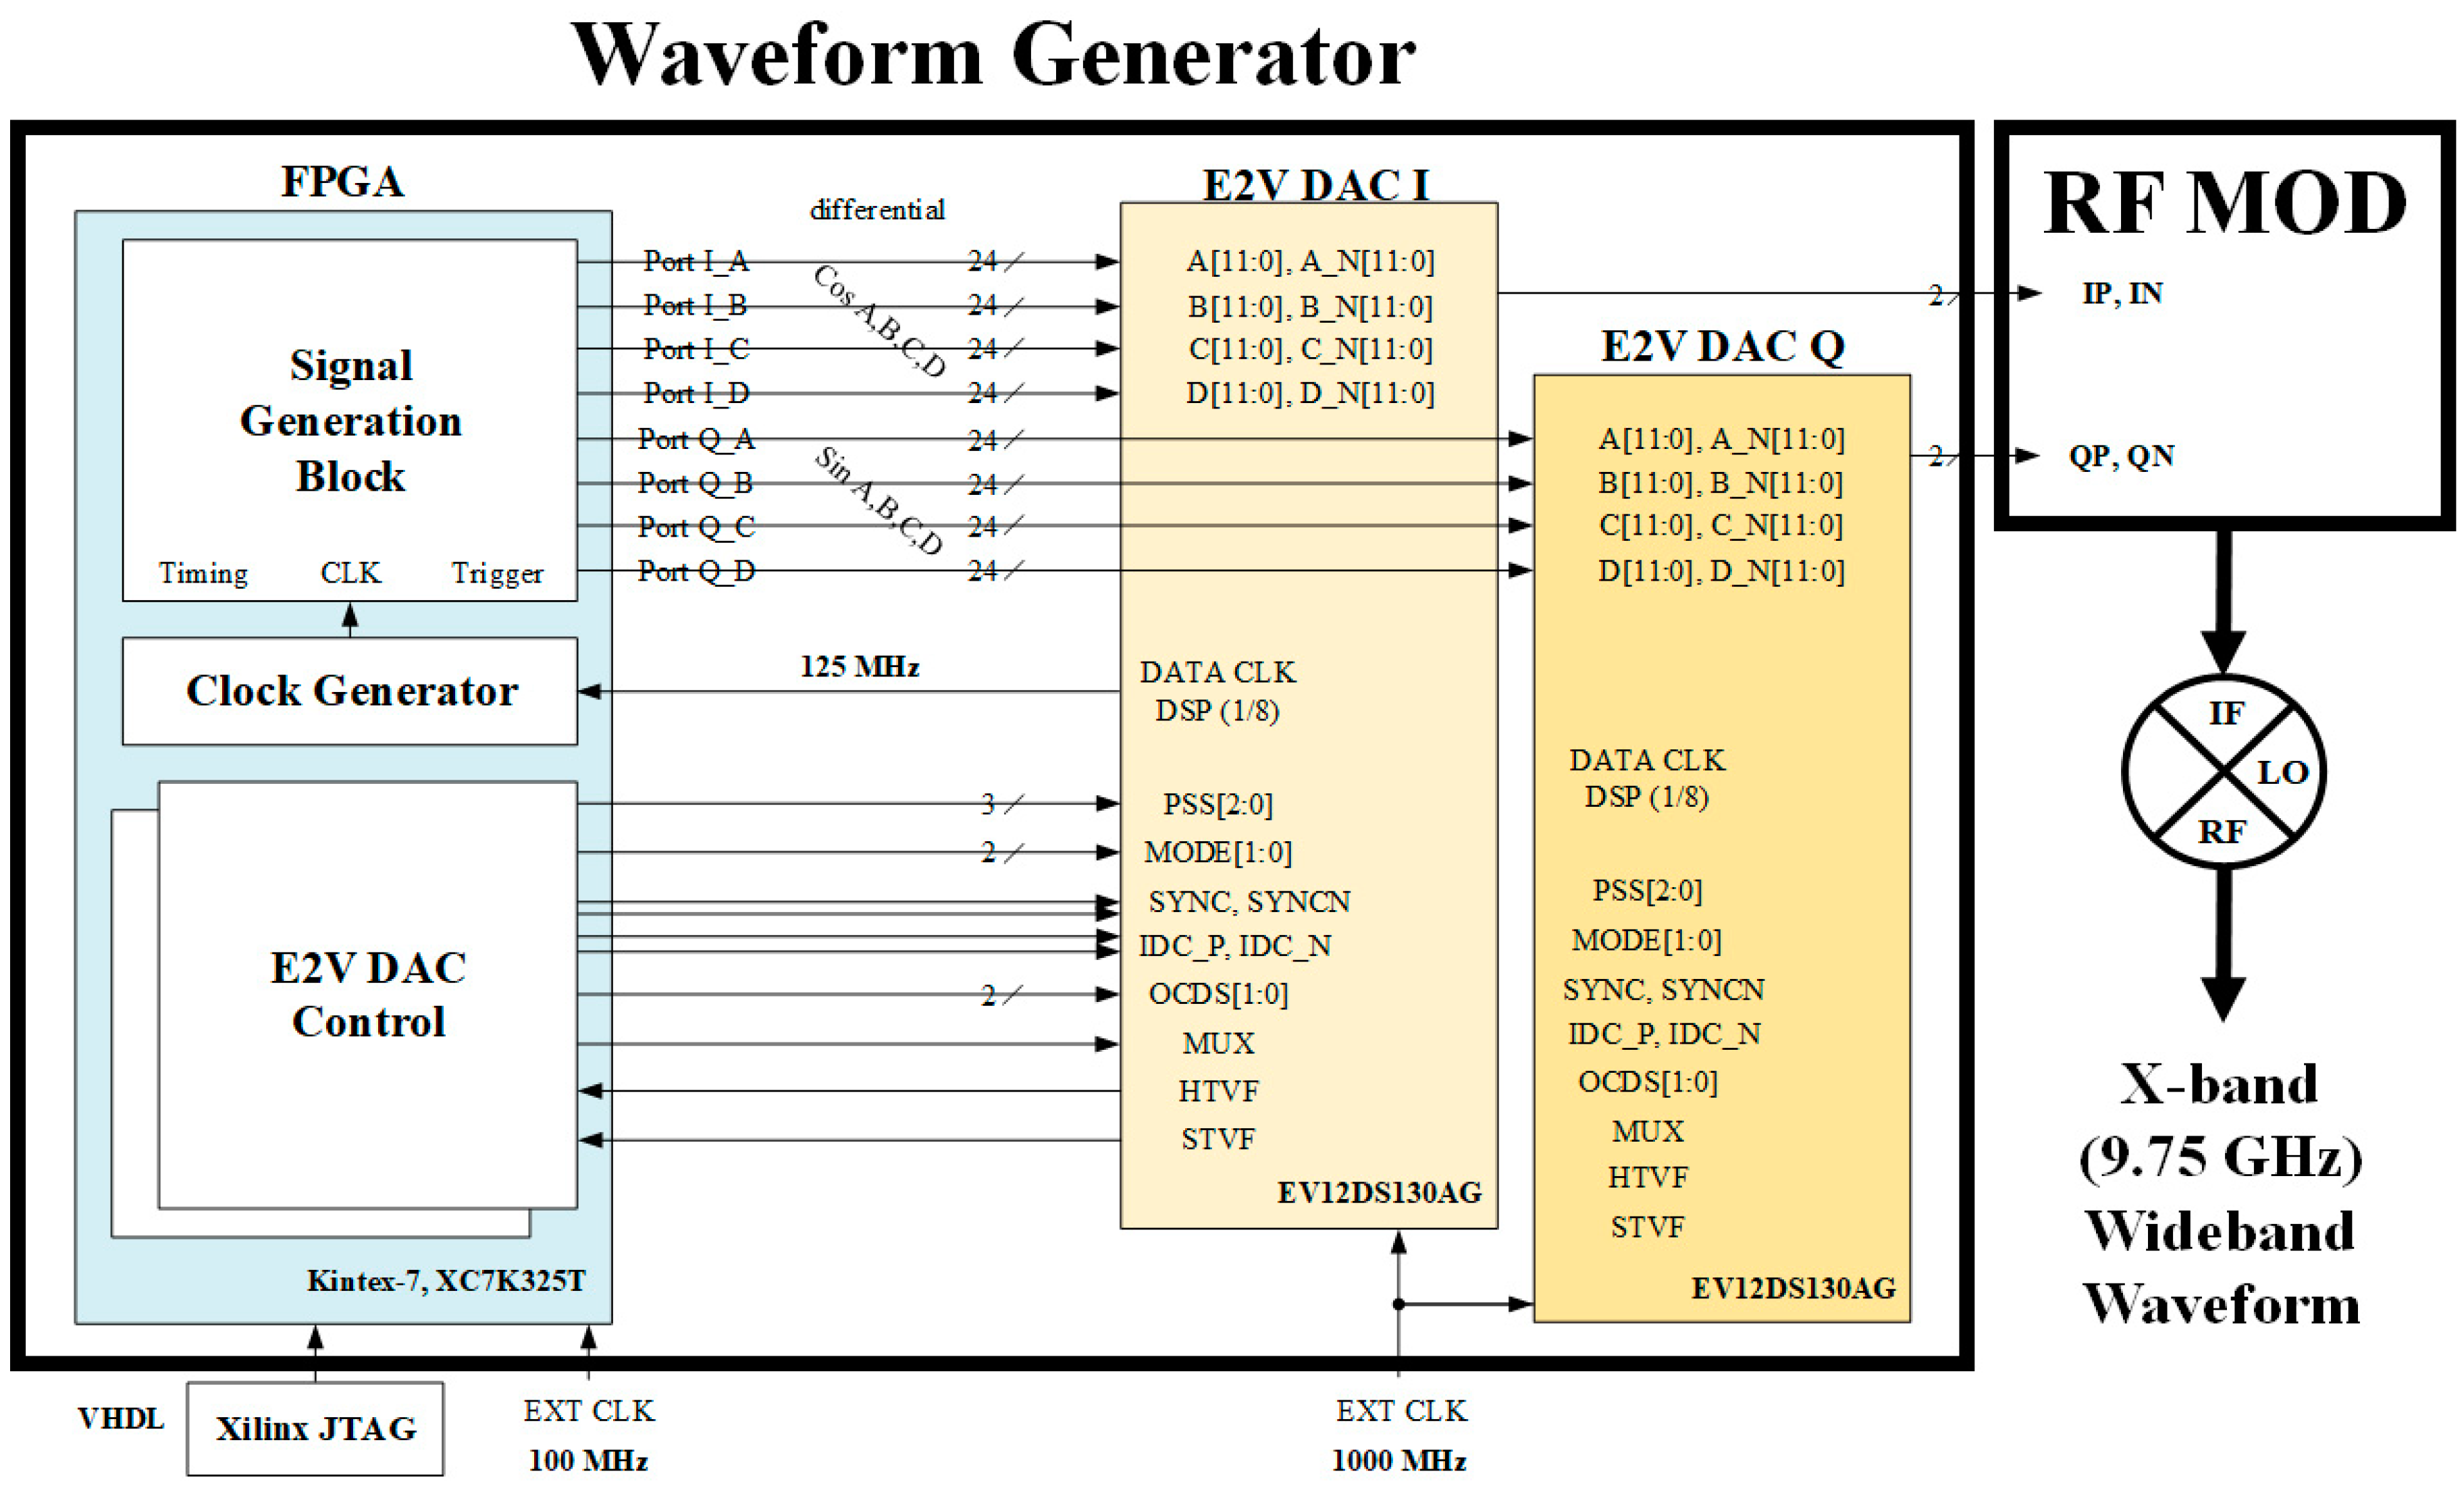
To generate the wideband waveform and satisfy the requirement, it was important to select the core component (e.g., FPGA or DAC). In this study, we selected the component considering the trade-off between the requirement and the development costs. In the proposed structure, the multiplexer (MUX) and DAC were selected based on the requirement to mix signals four-times faster. The hardware design, considering the proposed architecture, is depicted in Figure 5.
We included a signal generation block, a clock generator, and a DAC control block in the FPGA. The signal generation block was designed for a four-times-faster signal. The FPGA outputs eight signals, which consist of cosine and sine, for two DACs. The output signals are input to each DAC and mixed to four-times-faster signals in the MUX. The clock generator creates an internal clock using an external clock for signal generation. The FPGA and DACs operate at 100 MHz and 1000 MHz of the external clock, respectively. First, the FPGA start DACs using then 100 MHz clock. Then, the DAC outputs the digital signal processing clock, which is divided by the 1000 MHz clock, to FPGA. We modified the external clock to generate the desired signal. The DAC control block controls two DACs using several parameters. The parameters decide the phase shift, form of signal output, signal timing, and clock dividing value. The phase shift select (PSS) shifts a phase from 0 to 7 clocks. This can slightly adjust the phase so that the PSS is unsuitable for phase compensation. We propose a Simulink block structure for phase compensation because the phase error is larger than tens of clocks and randomly appears during RF modulation. The output clock division select (OCDS) controls the clock by dividing by 2, 4, or 8. We used the OCDS to produce a 125 MHz data clock from a 1000 MHz external clock. We used the OCDS for producing a 125 MHz data clock from a 1000 MHz external clock. Since the DAC is manufactured to use data input from a quarter of an internal clock in a 4:1 multiplex ratio, the data is read every two clock cycles. The MUX selects the multiplex rate. The MUX is set to four into one in accordance with the proposed structure. We programed the software porting between FPGA and DACs using very-high-speed-integrated-circuits hardware description language (VHDL). FPGA outputs (I of 96 pins and Q of 96 pins) are connected with DAC input pins. DAC function pins are also connected with the FPGA, so that we can control the DAC by modifying VHDL code.
One advantage of the MDDS is that the waveform generator can output a wide bandwidth waveform using a relatively small clock at the FPGA. We used a 125 MHz clock to generate the waveform in the FPGA, although the final output has 500 MHz of bandwidth, which is a four-times-faster performance.
2.3.2. Development of the MDDS Waveform Generator
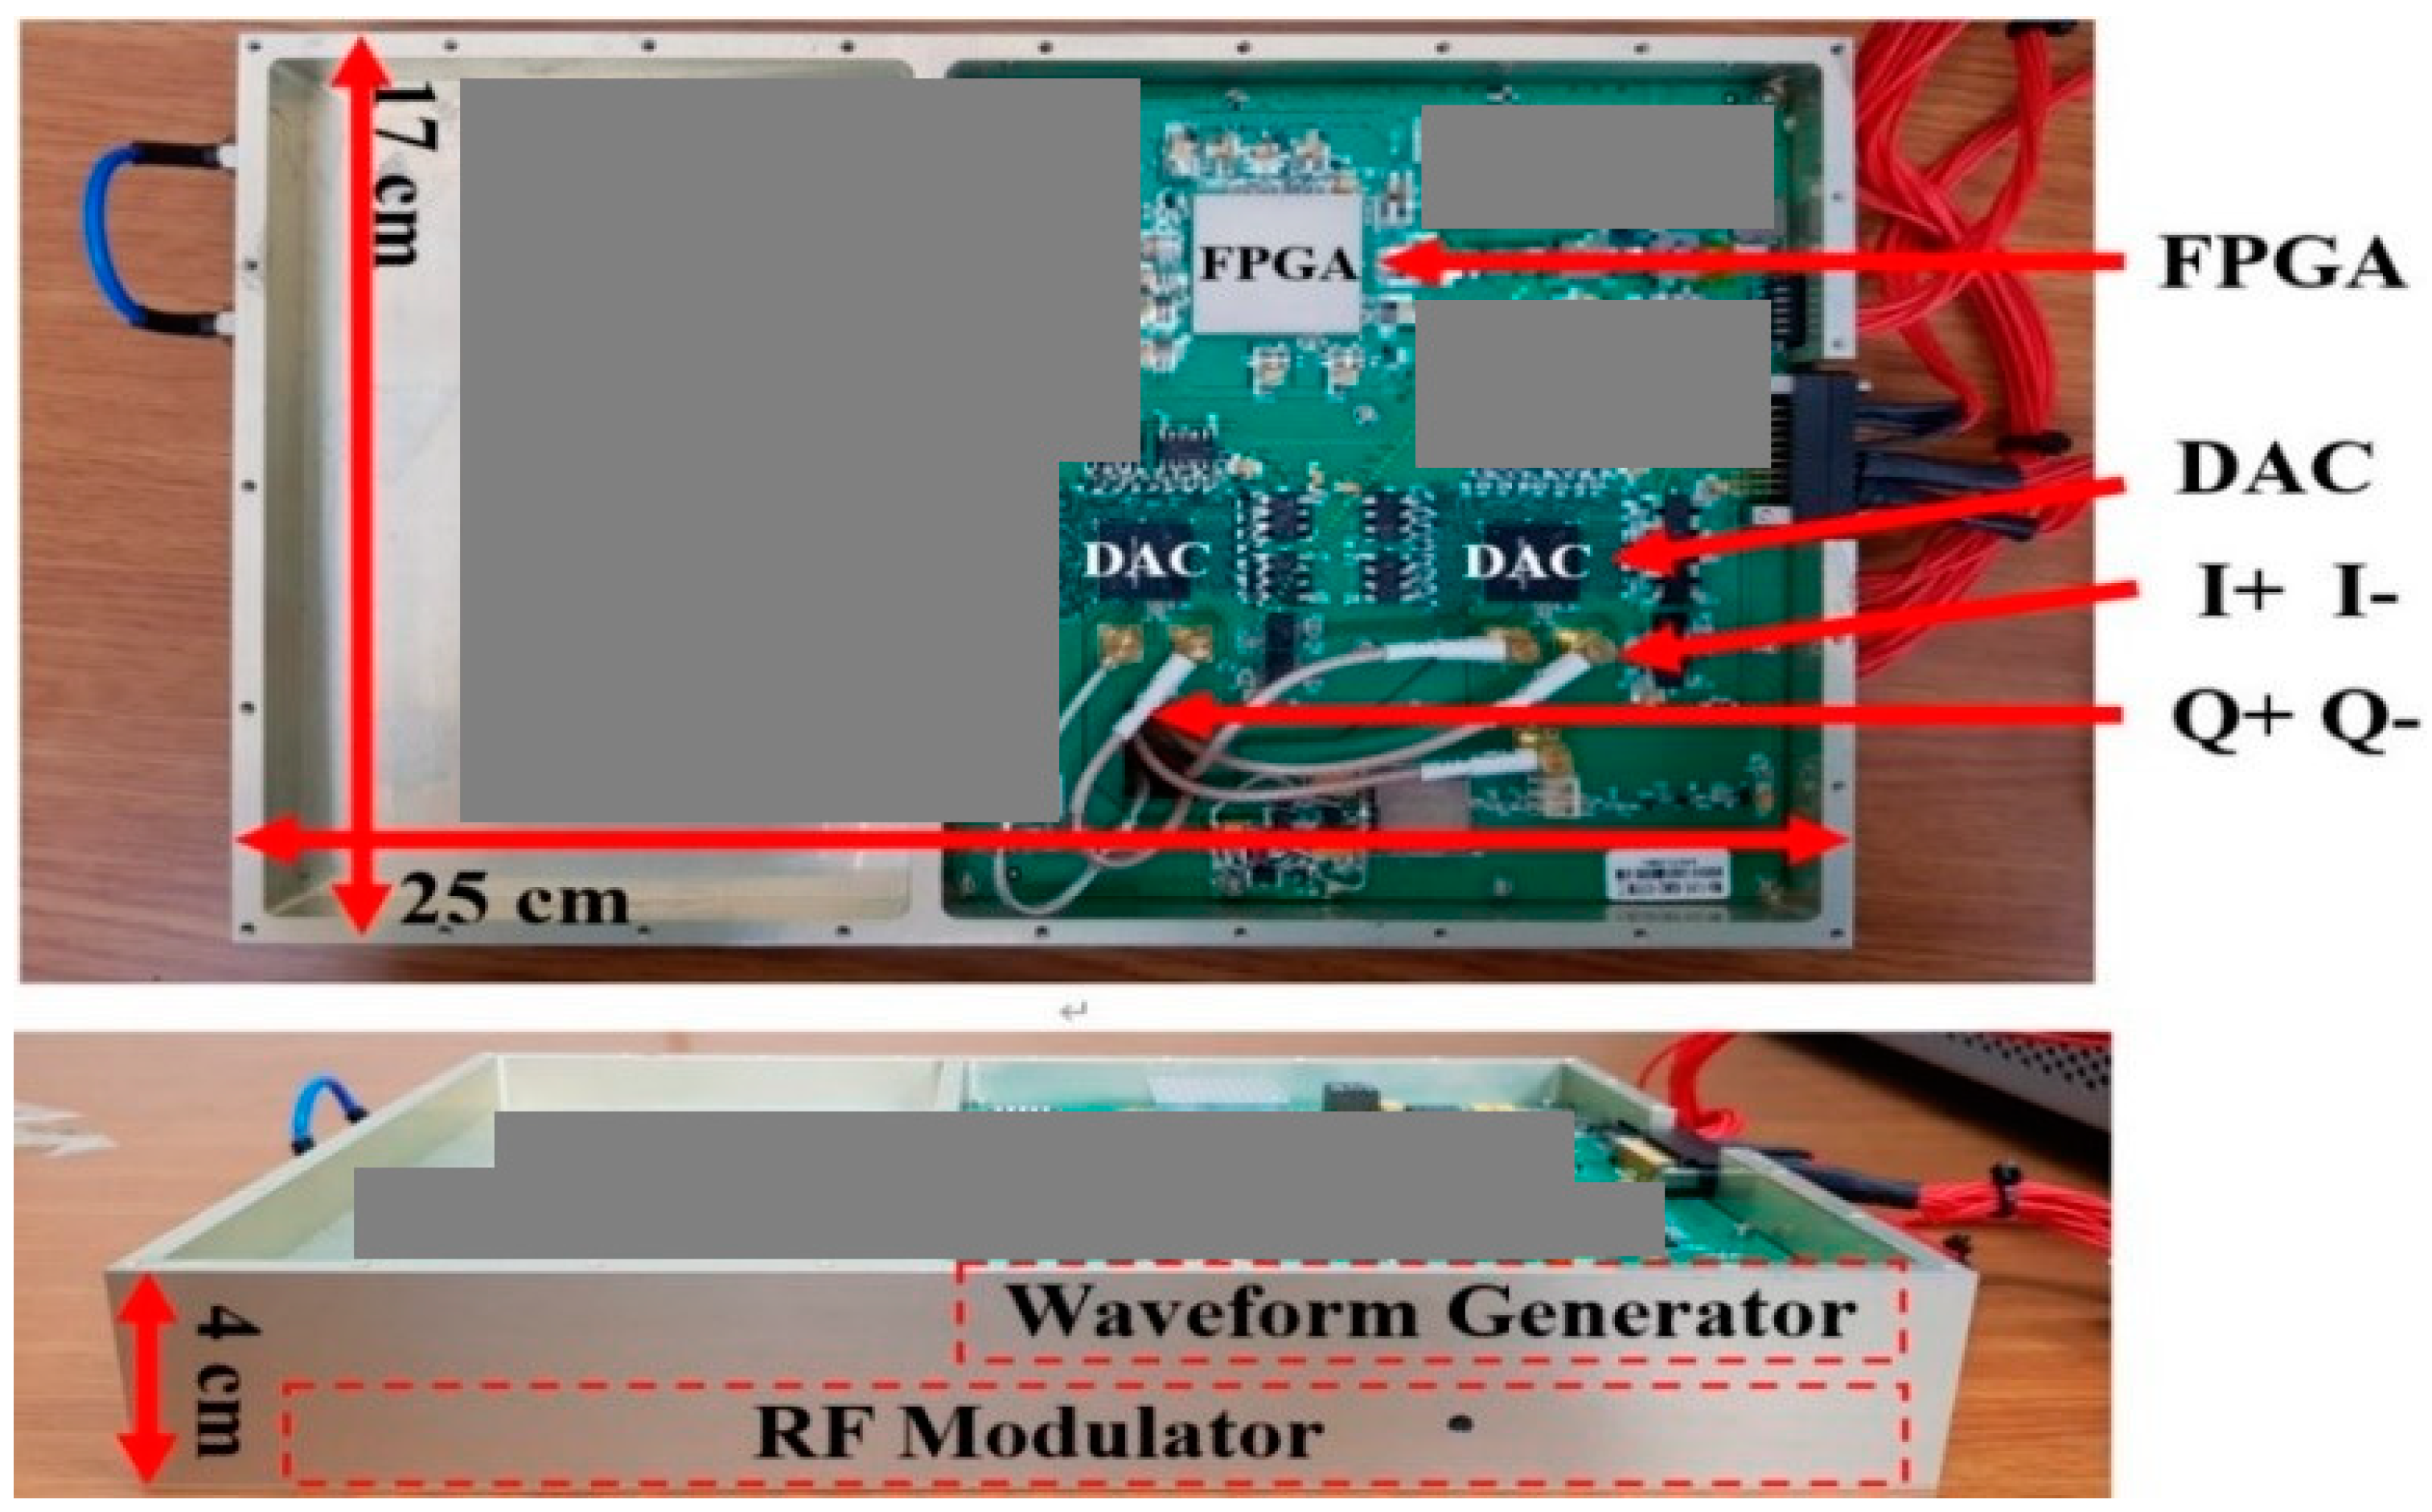
The developed waveform generator based on the improved MDDS is depicted in Figure 6. The width, length, and height of the waveform generator are 25, 17, and 4 cm, respectively. The weight of the entire system containing the RF modulator is less than 4 kg. The waveform generator and the RF modulator are separated into two layers to prevent signal inflow to each other. The developed system improves the gain of spectral regrowth by more than 20 dB compared to the previous RF module manufactured without shielding. The ripple decreases from more than 3 dB before to less than 1 dB after shielding.
The four signals (I+, I−, Q+, Q−) output from the two DACs are mixed with a local oscillator (LO) in the quadrature modulator. The signal with an intermediate frequency is amplified once more to the X-band (9.75 GHz). Frequency error, spectrum quality degradation, and high-power amplifier (HPA) distortion are generated in this process. We compensated for the errors using pre-distortion in the digital components.
3. Results
3.1. Simulation Results
Figure 7, Figure 8 and Figure 9 illustrate the simulation results. Requirements of the pulse width and bandwidth were 12 µs and 500 MHz, respectively. Figure 7 illustrates the simulation results using conventional MDDS. Figure 7a is the output signal, and Figure 7b is the phase value. The chirp waveform center illustrates a non-central axis due to the phase error depicted in Figure 7b. The phase error is produced when the MDDS is used because the phase timing of conventional DDS has been changed. To compensate for the phase error, we added the CPE block, which can produce the ideal output.
The output of MDDS with the compensated phase error is depicted in Figure 8. We confirmed that the phase error is compensated for when comparing Figure 7a and Figure 8a. In Figure 7b, the phase center is above the centerline, but the phase center in Figure 8b fits the centerline. This enables MDDS to produce the ideal output, and the center of the chirp waveform has the ideal value. Although the ideal chirp waveform is applied to the hardware, the final waveform is changed due to distortion, such as that caused by hardware characteristics and RF.
Figure 9 is an example of pre-distortion. The pre-distorted waveform is not ideal, but it can minimize the phase error of the RF-modulated signal. We applied pre-distortion in nanosecond units to the FPGA.
3.2. Hardware Output
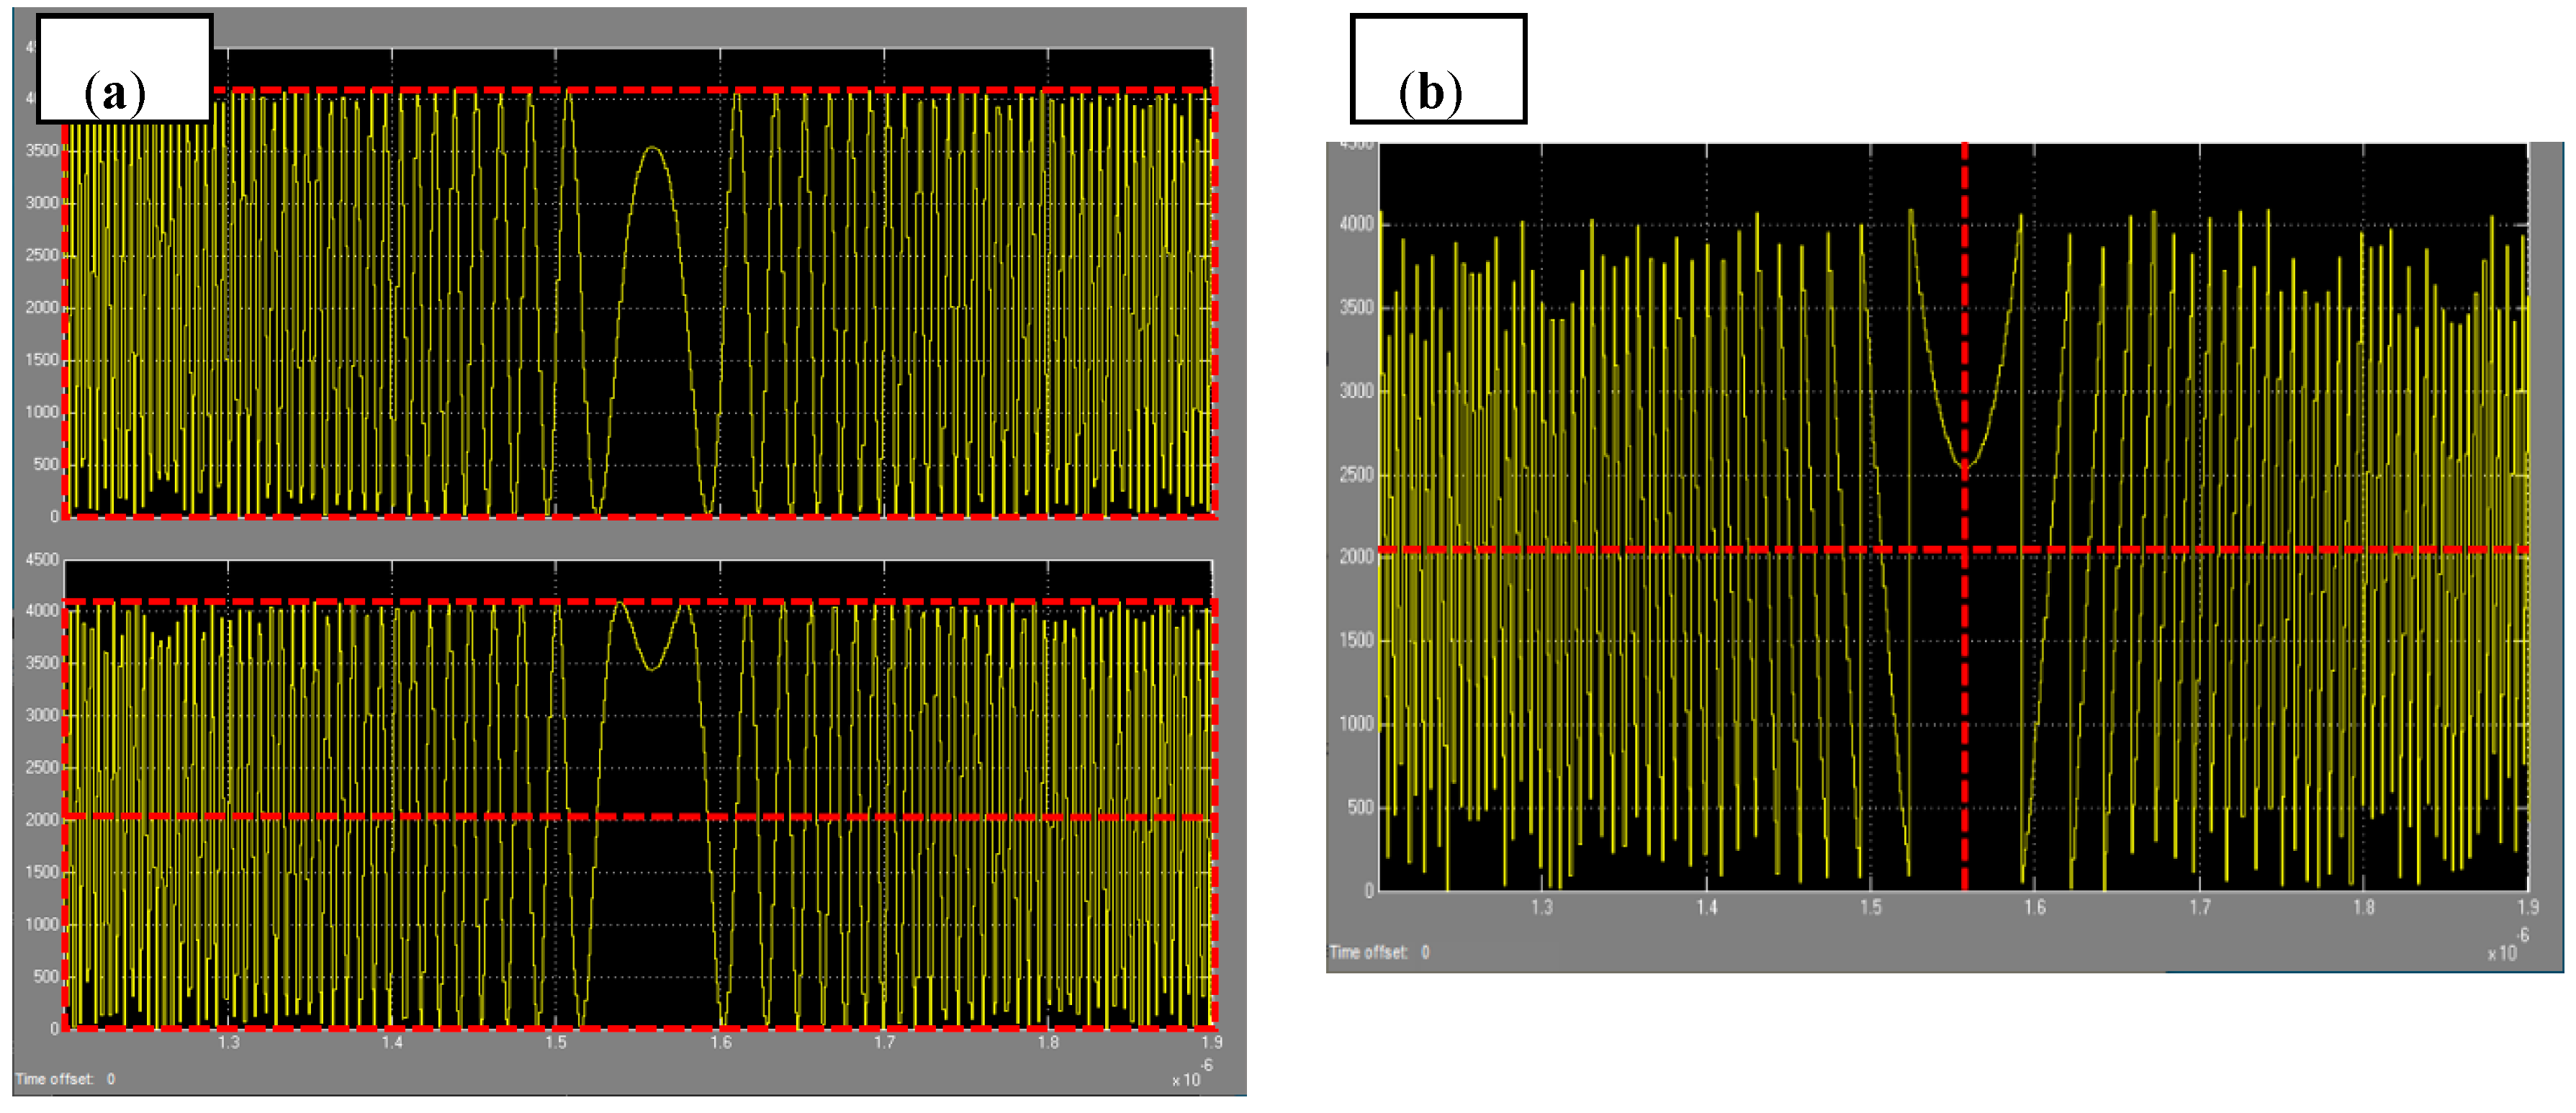
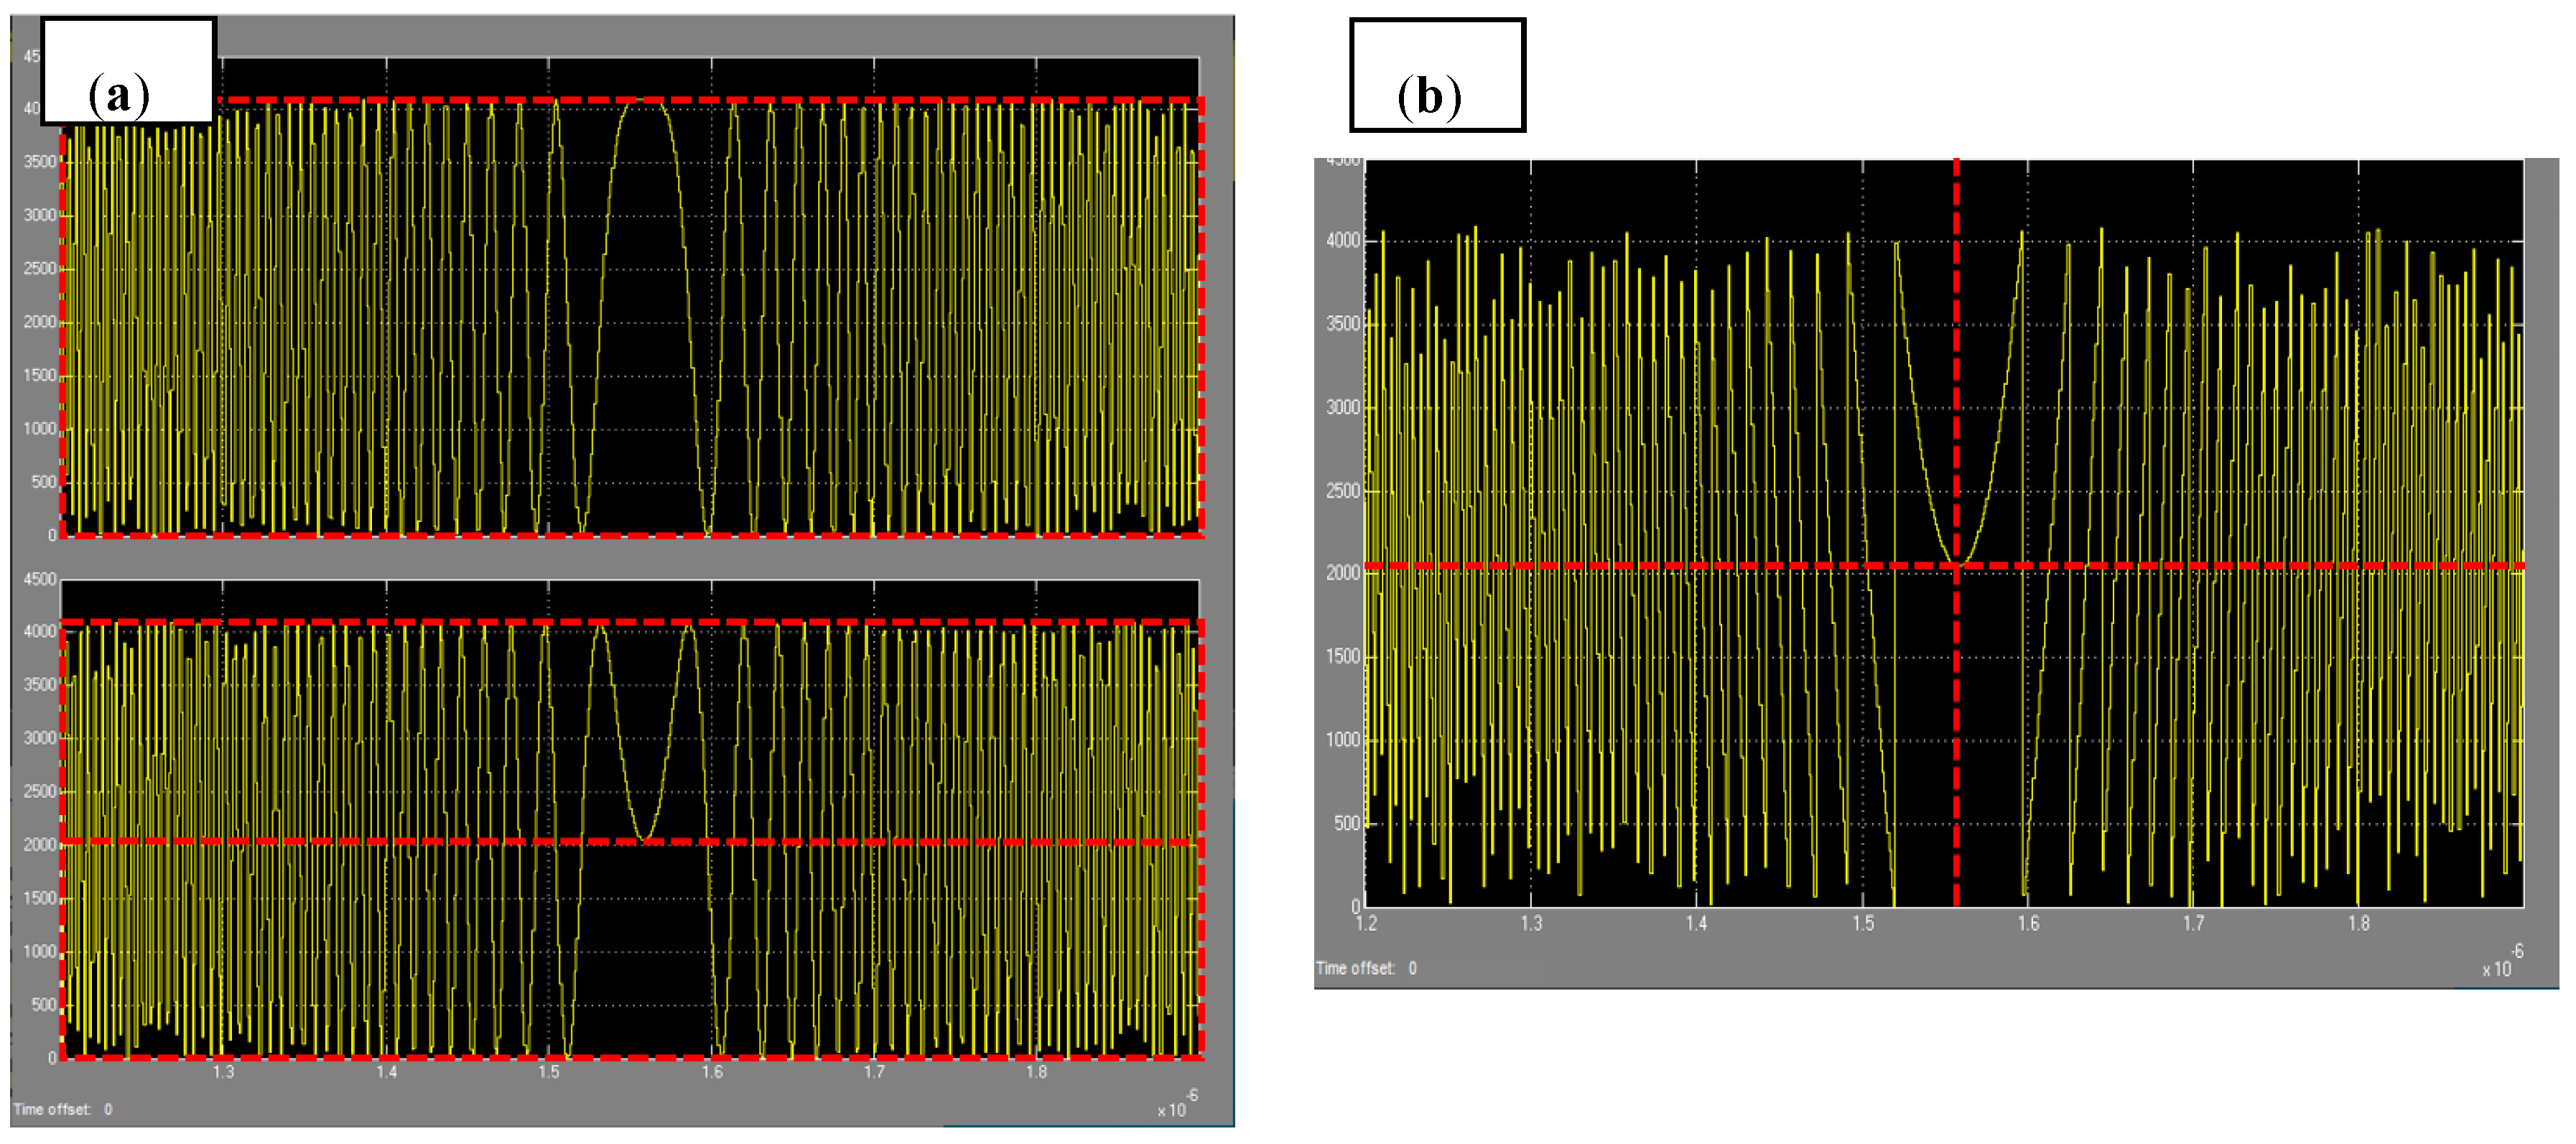
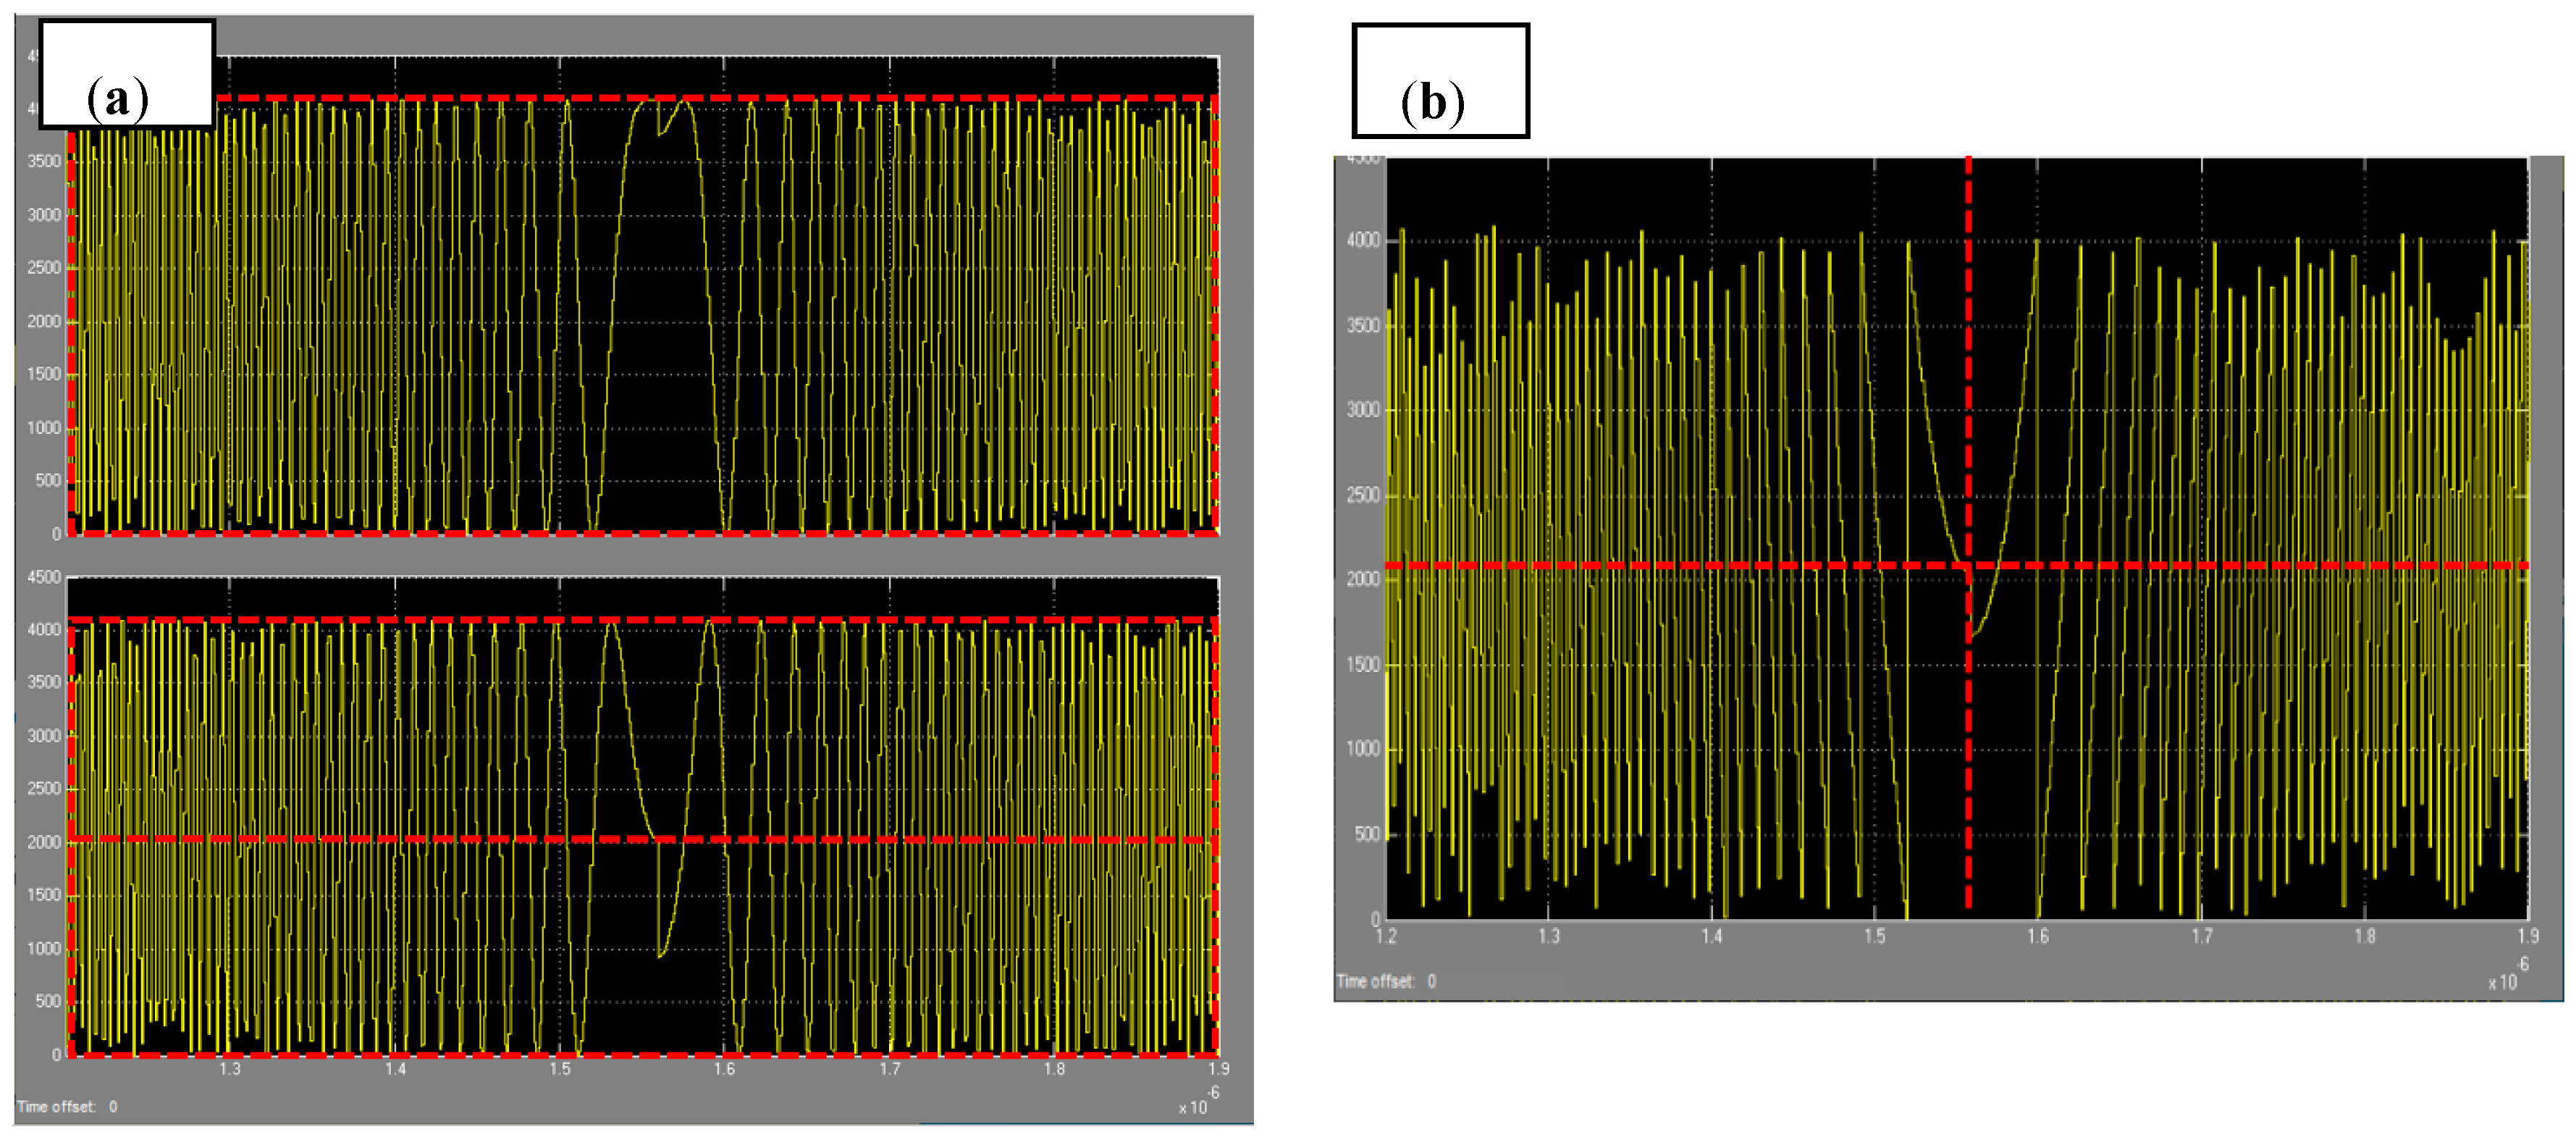
Figure 10 illustrates the hardware output. An MSOX4104A (oscilloscope), which can measure a bandwidth of up to 1 GHz and maximum 5 GSa/s, was used to accurately measure the time and frequency of the waveform. Figure 10a–c correspond with Figure 7a, Figure 8a, and Figure 9a. The left side of each figure is the I+ signal, and the right side is the baseband one-side bandwidth (0–250 MHz). The bandwidth measurements illustrate that compensation of phase error and pre-distortion do not affect the bandwidth quality because they only change the phase value, but do not affect the frequency. Each result is the input to the RF modulator, as depicted in Figure 6, up-converted to the X-band (9.75 GHz).
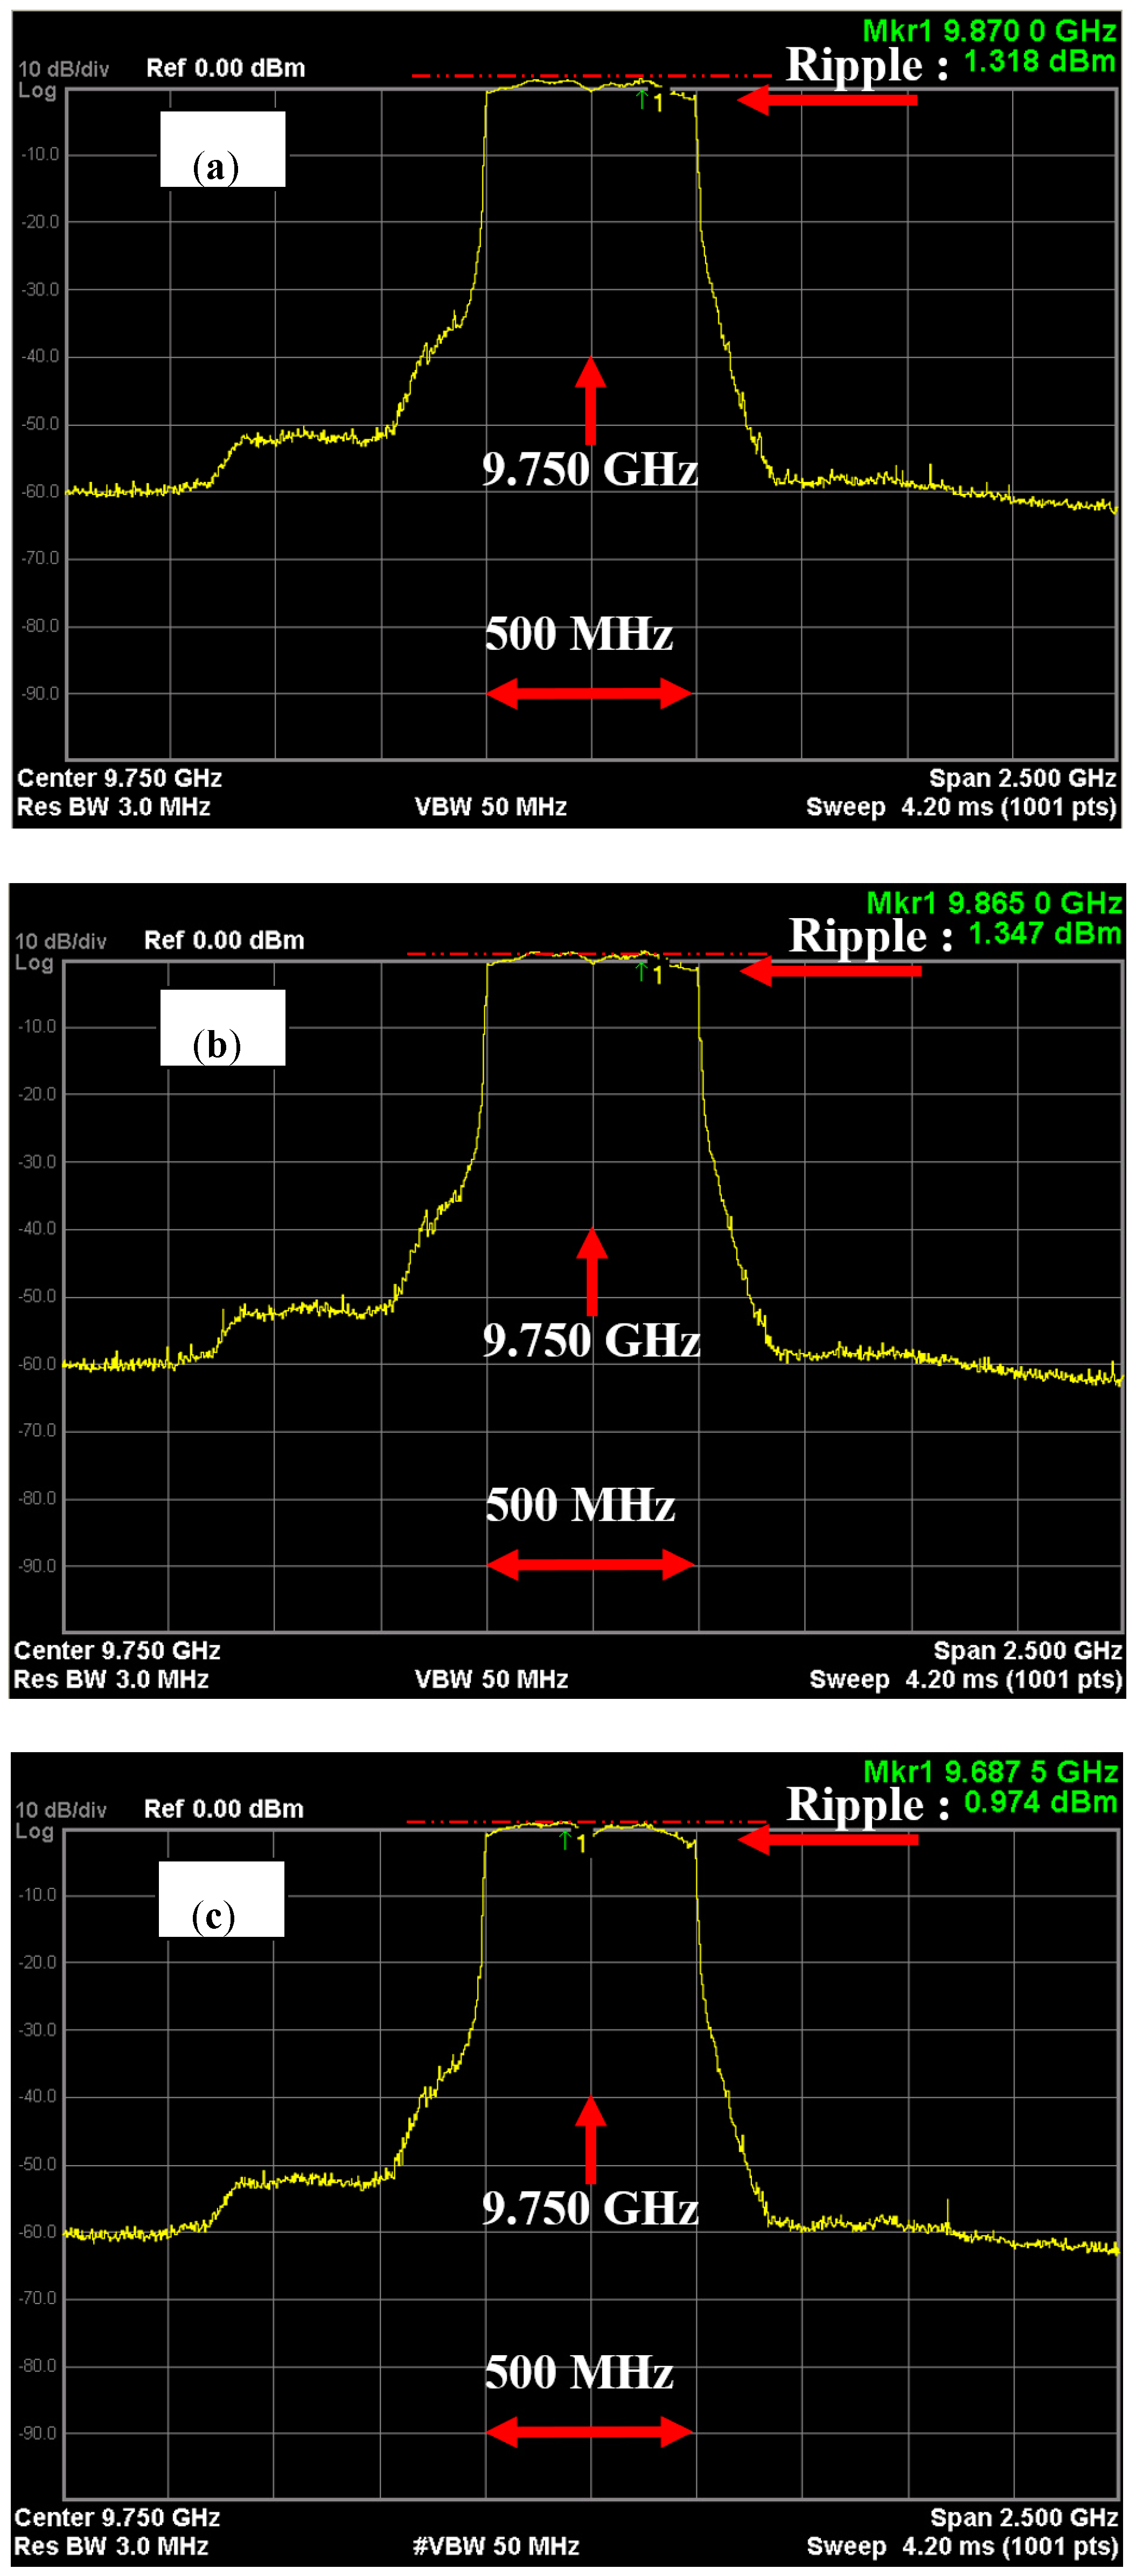
Figure 11 is the X-band (9.5–10 GHz) bandwidth measurement using an N9020A (spectrum analyzer). Figure 11a–c correspond with Figure 10a–c. Figure 11a, which depicts the phase error, and Figure 11b, which depicts the compensated phase center, shows 1.318 and 1.347 dBm of ripple, respectively. Figure 11c, which depicts applying the pre-distortion, reveals a slightly improved ripple to 0.974 dBm (red dotted line).
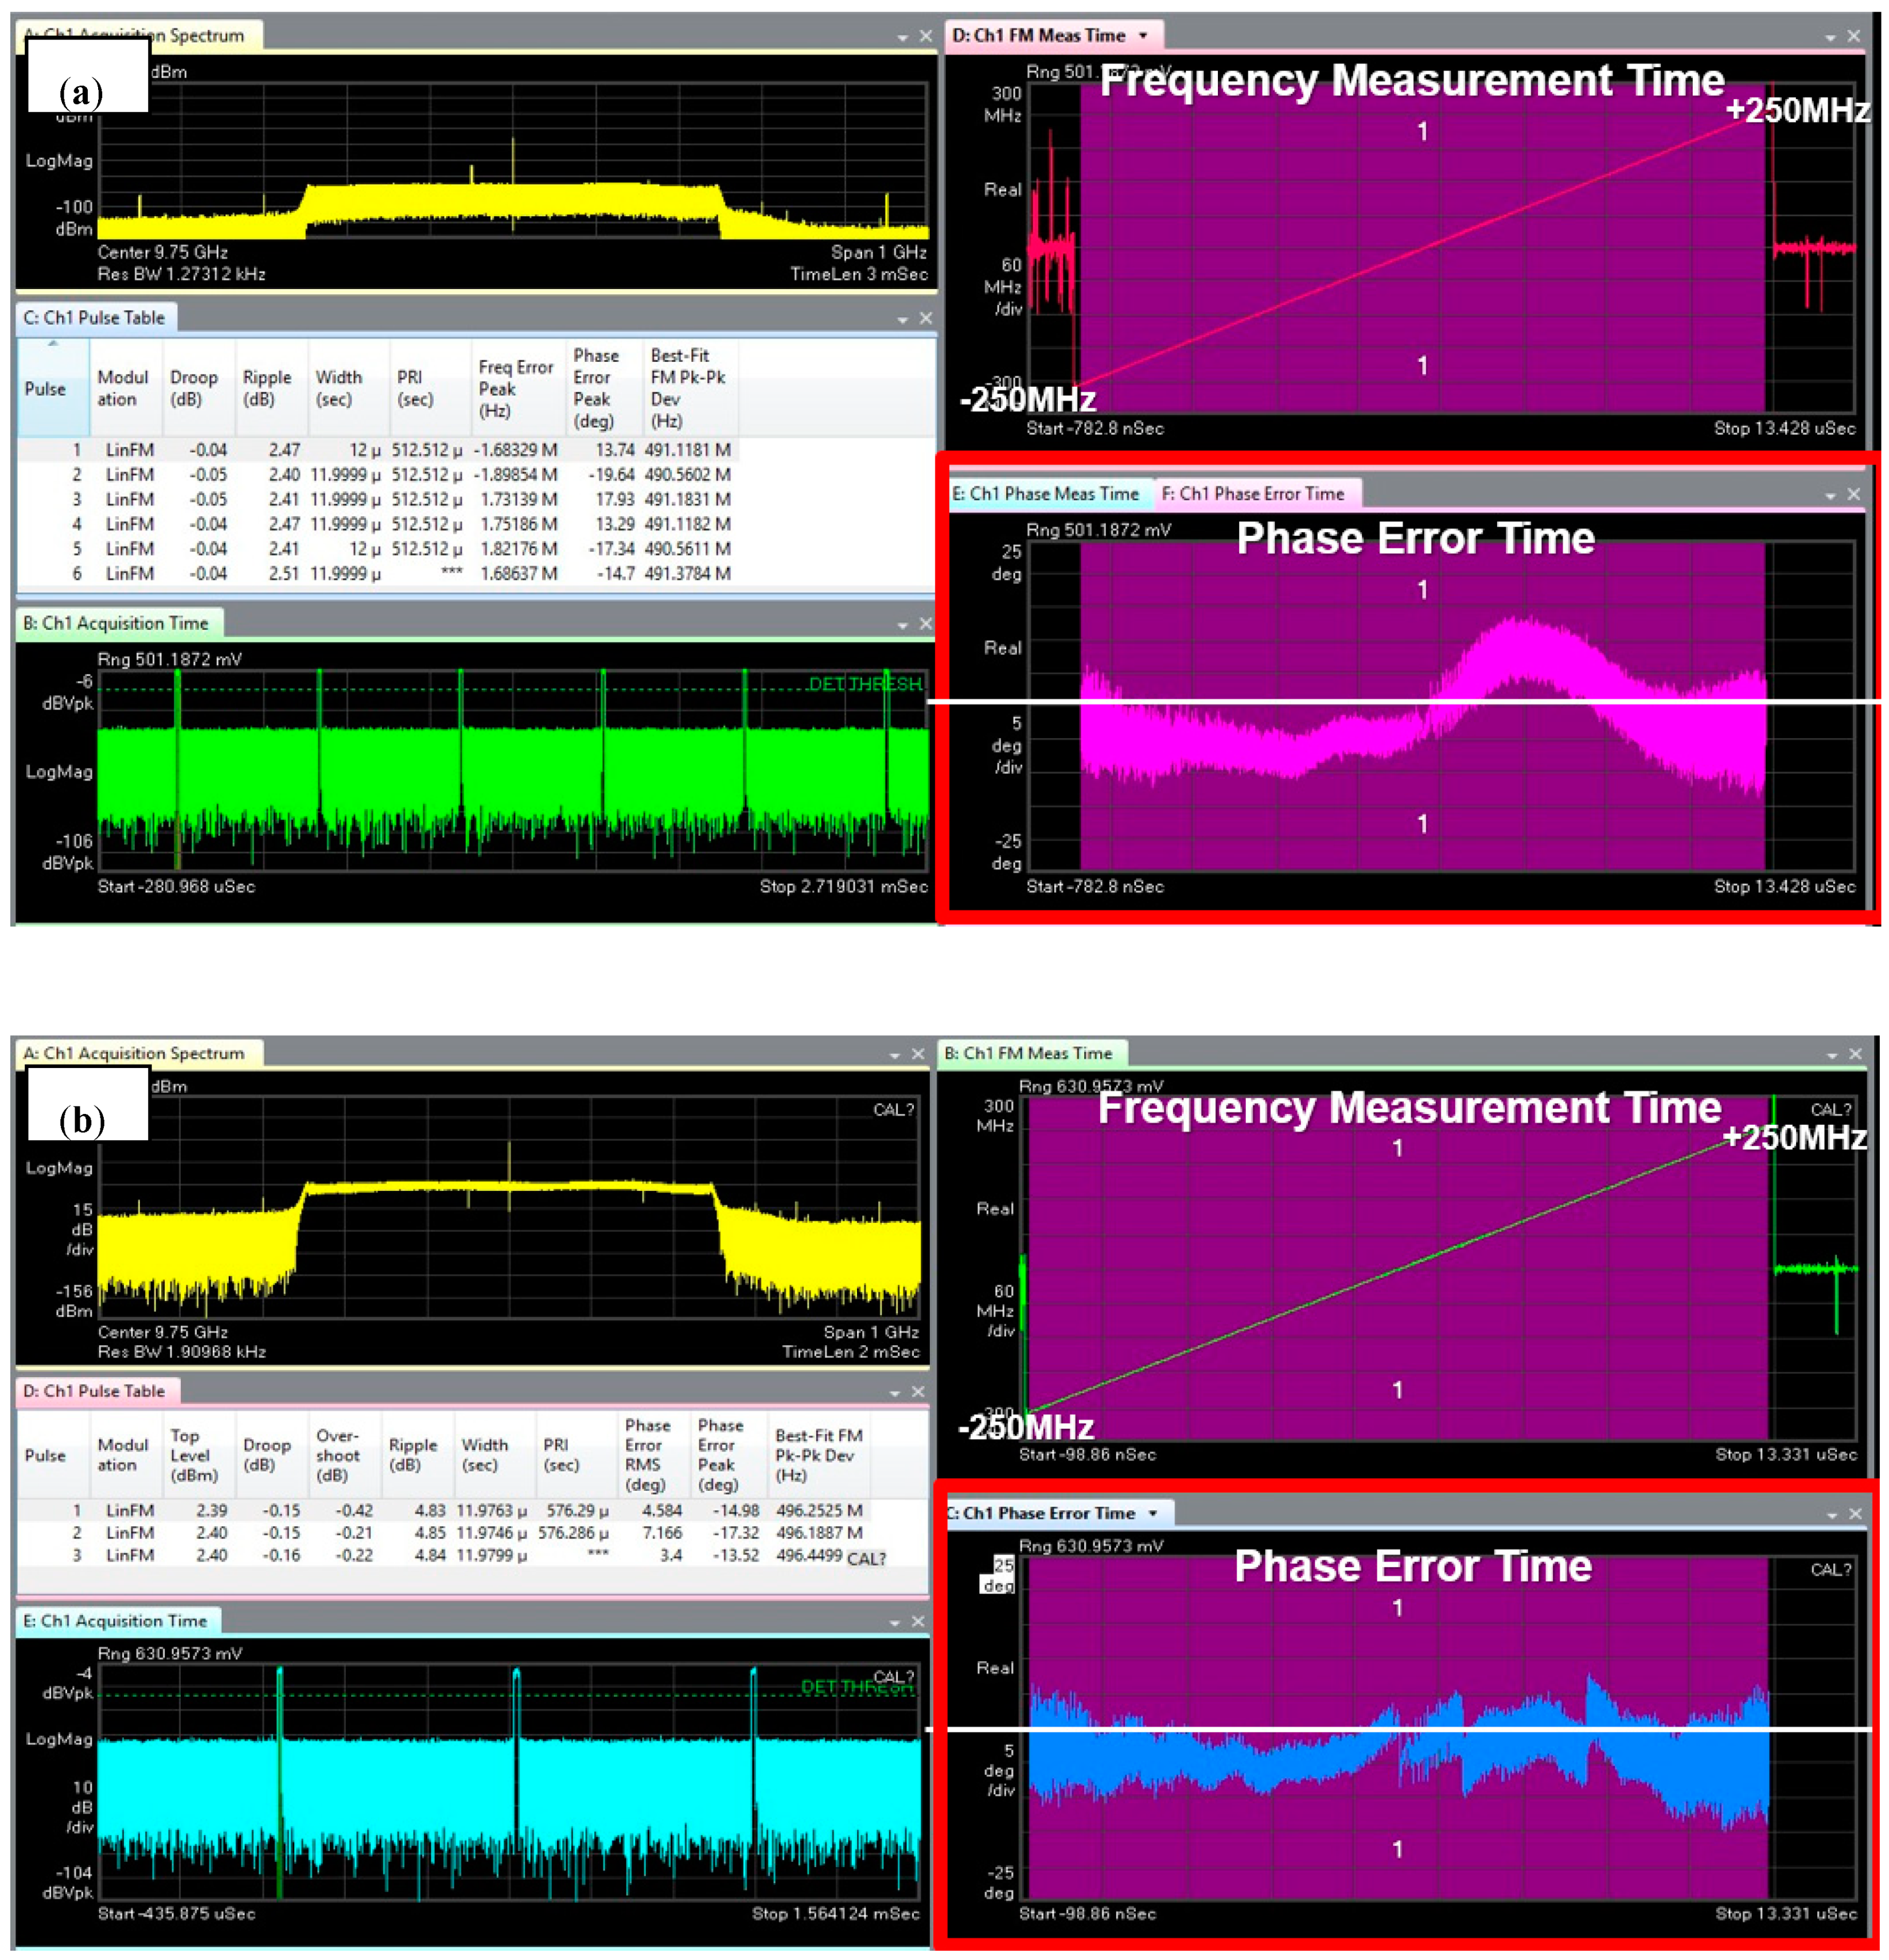
The 89600 VSA software was used to precisely measure the phase error time. The phase compensated waveform and pre-distorted waveform are depicted in Figure 12a,b. The bottom right of Figure 12a,b depict the phase error varying time (PET). Ranges for predistortion were selected by analysis of the PET (Figure 12a). The 89600 VSA was set to measure 95% of the bandwidth of the pulse. Start and end of the spectrum was excepted, so the ripple was not accurate in this software.
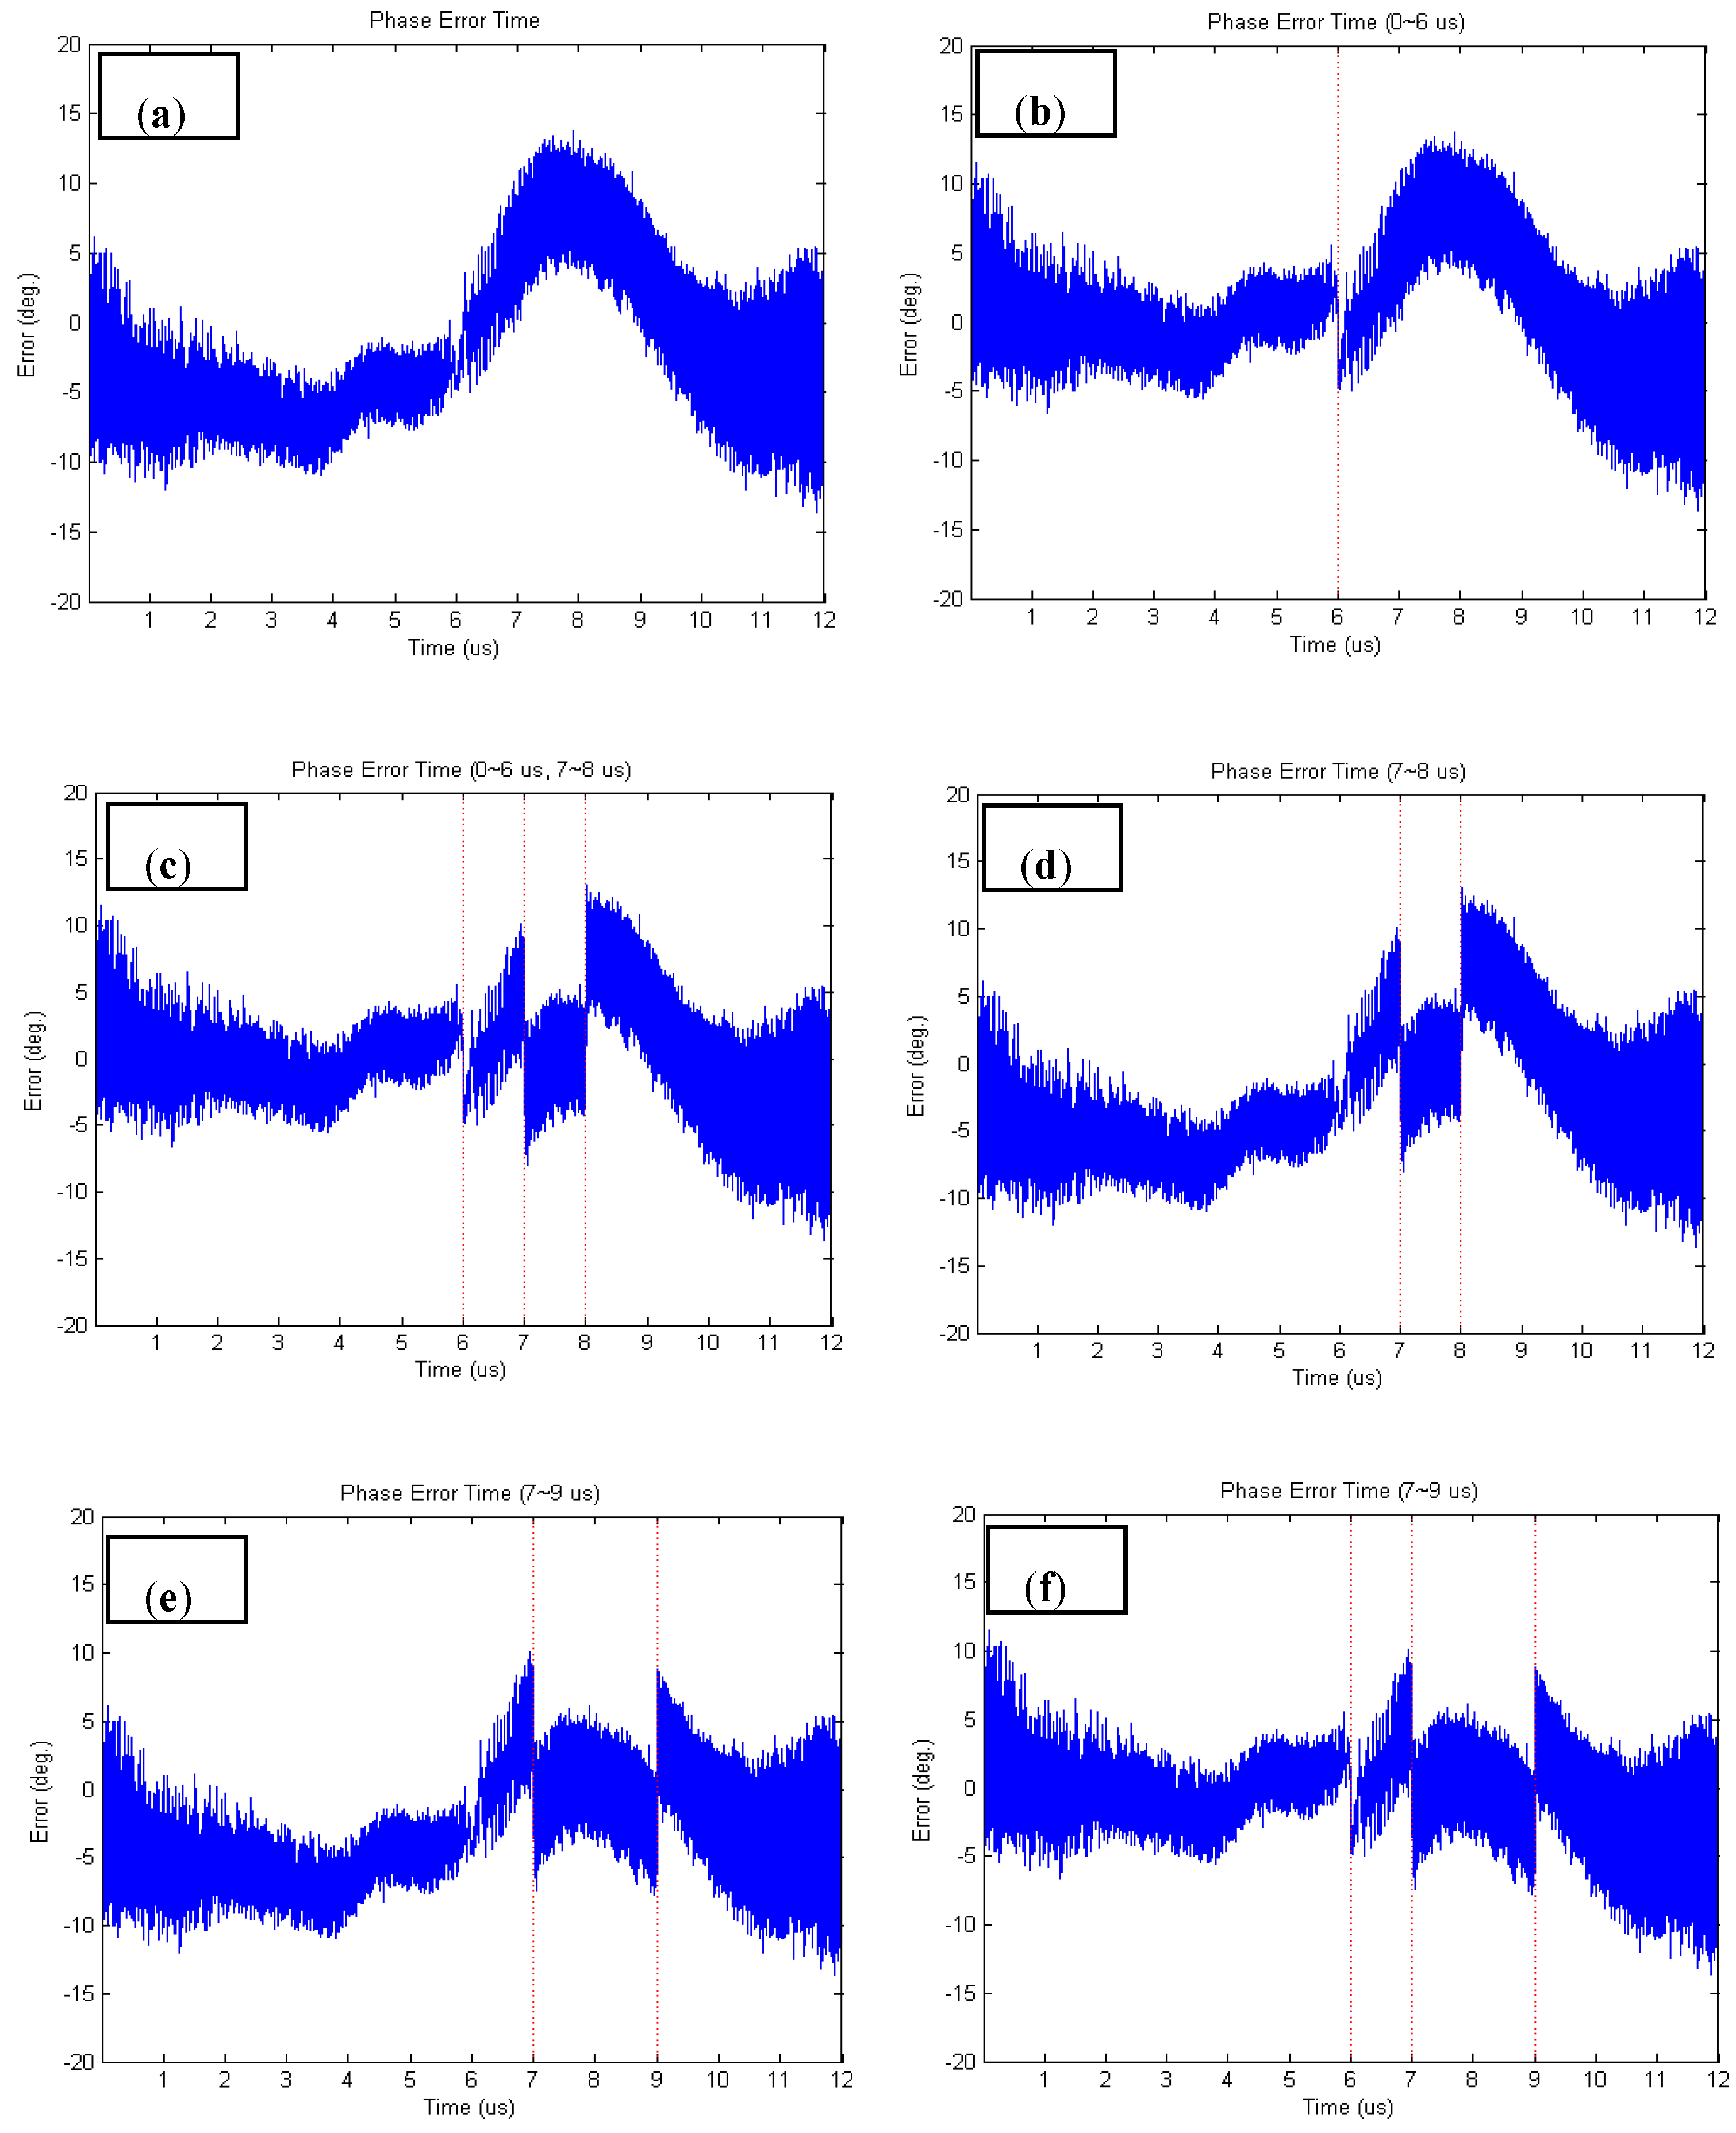
Although the pre-distortion can be applied with several sections, the greater the number of sections, the greater is the code complexity. Table 1 and Figure 13 are various ranges of the pre-distortion and analysis results. The minimum, maximum, and mean results can change with the trigger timing of the capture point. Variation and standard deviation were significantly improved in the pre-distortion result. Table 1a (Figure 13a) represents phase error before applying the pre-distortion shown as Figure 10b. Although Figure 10b is close to the ideal waveform at the baseband, it has a wide fluctuation in phase measurement at the X-band. We applied the pre-distortion to reduce this fluctuation. Since, the range of the pre-distortion is limited due to its implementation, we focused on decreasing the maximum phase error and increasing the minimum phase error. Table 1b–f (Figure 13b–f) are the results of phase error compensation according to the pre-distortion range. Figure 13b (Table 1f) shows that the range of 0~6 was compensated. Since wide range was selected, it is effective to reduce the variation. Figure 13c (Table 1c) and Figure 13f (Table 1f) show the additional compensation for Figure 13b (Table 1b), i.e., the multiple range compensation. Compared with Figure 13d and Figure 13e (a single range compensation), the number of range and the compensated value are not proportional. In particular, in Table 1, row f, the variation and standard deviation are decreased to 34.0% and 58.4%, respectively.
4. Discussion
This study began with a challenge to develop a discriminative SAR system that compares with conventional memory-based or DDS-based waveform generators. Previously, a multiplier was used to generate broadband, but this study illustrates that the waveform generator can generate a stable wideband waveform at baseband with a varied shape by applying the proposed method. When the baseband is up-converted to a high frequency, RF linearity is distorted and may cause spectrum and phase noise. Several studies have been performed using RF linearity analysis of high-power amplifiers in SAR and telemetry systems [21,23,24,25]. The use of the multiplier may amplify the various errors generated at intermediate frequencies, but the proposed method in this study can directly generate a high-performance wide bandwidth waveform. Furthermore, the proposed method should be able to acquire high-resolution images of less than 30 cm by generating 500 MHz of bandwidth. Concerning the direct coding of the FPGA, variables for many locations and observation environments can be used and verified.
In addition to verifying the reliability of the waveform generator, a pulse-to-pulse correlation analysis was performed. Generating a coherent waveform can reduce azimuth distortion and increase the reliability of the reference signal [26,27]. Signals with phase error, signals with compensated error, and pre-distorted signals were correlated, with the results demonstrating that a difference of 0.4% exists in 90 signal samples.
Based on the results of this study, further studies are expected to develop and experiment with RF demodulators, X-band ground-based SAR, and high-resolution images using UAV SAR.
5. Conclusions
Most SAR studies focus on SAR image application. However, it is difficult for researchers to maintain their own SAR systems, and purchasing SAR images is cost-prohibitive. For commercial data, it costs more than 2,000 USD for a standard strip-map image. If researchers have their own SAR systems, they can easily obtain data for the region of interest. Although system development requires significant time and cost, it is more efficient to have in-house development technology and study the results. We have spent many years conducting research with the help of the national project. L-band ground-based SAR, which has a bandwidth of 20 MHz at 1.27 GHz, was developed and tested in [28,29]. A UAV with onboard X-band SAR was investigated and validated in this study.
The range resolution of SAR is determined by the bandwidth of the waveform. We generated a wide bandwidth waveform using an improved MDDS and demonstrated that the proposed method can decrease phase error and improve spectrum quality. We developed a waveform generator in accordance with the proposed structure. Simulation results and hardware outputs were presented for the procedure and compared to verify the developed system. The phase error produced in an ideal waveform was divided into 1-µs units. We selected specific sections that have large phase errors for the pre-distortion. However, there was a limit to dividing the number of sections because of a trade-off between compensation gain and hardware efficiency. For future work, we will increase the compensation gain and eliminate the vibration of the hardware to increase spectrum quality.
Author Contributions
Conceptualization, J.-H.K.; Data curation, K.-R.K.; Formal analysis, K.-R.K.; Funding acquisition, J.-H.K.; Investigation, K.-R.K.; Methodology, K.-R.K.; Project administration, J.-H.K.; Resources, J.-H.K.; Software, K.-R.K.; Supervision, J.-H.K.; Validation, K.-R.K.; Visualization, K.-R.K.; Writing—original draft, K.-R.K.; Writing—review and editing, J.-H.K. All authors have read and agreed to the published version of the manuscript.
Funding
This research was funded by the Ministry of Science and ICT, Korea, under the ITRC support program (2020–2018–0-01424) supervised by the IITP.
Conflicts of Interest
The authors declare no conflict of interest.
References
- Shao, W.; Zhang, Z.; Li, X.; Li, H. Ocean wave parameters retrieval from Sentinel-1 SAR imagery. Remote Sens. 2016, 8, 707. [Google Scholar] [CrossRef] [Green Version]
- Santoro, M.; Cartus, O. Research Pathways of Forest Above-Ground Biomass Estimation Based on SAR Backscatter and Interferometric SAR Observations. Remote Sens. 2018, 10, 608. [Google Scholar] [CrossRef] [Green Version]
- El Moussawi, I.; Ho Tong Minh, D.; Baghdadi, N.; Abdallah, C.; Jomaah, J.; Strauss, O.; Lavalle, M.; Ngo, Y.-N. Monitoring Tropical Forest Structure Using SAR Tomography at L- and P-Band. Remote Sens. 2019, 11, 1934. [Google Scholar] [CrossRef] [Green Version]
- Dechesne, C.; Lefèvre, S.; Vadaine, R.; Hajduch, G.; Fablet, R. Ship Identification and Characterization in Sentinel-1 SAR Images with Multi-Task Deep Learning. Remote Sens. 2019, 11, 2997. [Google Scholar] [CrossRef] [Green Version]
- Faisal, M.; Chowdhury, M.A.H.; Bhuyan, M.A.I.; Bhuyan, N.H.M.; Matin, A. Development of a polarimetric & interferometric GB-SAR and perform measurement for a fixed target. In Proceedings of the 2017 International Conference on Electrical, Computer and Communication Engineering (ECCE), Cox’s Bazar, Bangladesh, 16–18 February 2017; pp. 285–289. [Google Scholar]
- Lee, Y.C.; Koo, V.C.; Chan, Y.K. Design and development of FPGA-based FFT co-processor for synthetic aperture radar (SAR). In Proceedings of the 2017 Progress in Electromagnetics Research Symposium–Fall (PIERS–FALL), Singapore, 19–22 November 2017; pp. 1760–1766. [Google Scholar]
- Zhang, X.; Shao, Z.; Ren, J.; Li, Y.; Jiang, J. Development and preliminary results of small-size UAV-borne FMCW SAR. In Proceedings of the 2018 IEEE International Geoscience and Remote Sensing Symposium (IGARSS), Valencia, Spain, 22–27 July 2018; pp. 7825–7828. [Google Scholar]
- Chua, M.Y.; Sumantyo, J.T.S.; Santosa, C.E.; Panggabean, G.F.; Ji, Y.Q.; Parulian, S.P.; Nasucha, M. An PC-based airborne SAR baseband system. In Proceedings of the 2018 Progress In Electromagnetics Research Symposium (PIERS–Toyama), Toyama, Japan, 1–4 August 2018; pp. 882–888. [Google Scholar]
- Curlander, J.C.; McDonough, R.N. Synthetic Aperture Radar; John Wiley & Sons: New York, NY, USA, 1991. [Google Scholar]
- Wang, C.; Xu, J.; Liao, G.; Xu, X.; Zhang, Y. A range ambiguity resolution approach for high-resolution and wide-swath SAR imaging using frequency diverse array. IEEE J. Sel. Top. Appl. Earth Obs. Remote Sens. 2017, 11, 336–346. [Google Scholar] [CrossRef]
- Wang, X.; Wang, R.; Deng, Y.; Wang, P.; Li, N.; Yu, W.; Wang, W. Precise calibration of channel imbalance for very high resolution SAR with stepped frequency. IEEE Trans. Geosci. Remote Sens. 2017, 55, 4252–4261. [Google Scholar] [CrossRef]
- Vu, V.T.; Pettersson, M.I. Derivation of bistatic SAR resolution equations based on backprojection. IEEE Geosci. Remote Sens. Lett. 2018, 15, 694–698. [Google Scholar] [CrossRef]
- Jin, G.; Deng, Y.; Wang, R.; Wang, W.; Wang, P.; Long, Y.; Zhang, Z.; Zhang, Y. An advanced nonlinear frequency modulation waveform for radar imaging with low sidelobe. IEEE Trans. Geosci. Remote Sens. 2019, 57, 6155–6168. [Google Scholar] [CrossRef]
- Jin, G.; Liu, K.; Deng, Y.; Sha, Y.; Wang, R.; Liu, D.; Wang, W.; Long, Y.; Zhang, Y. Nonlinear Frequency Modulation Signal Generator in LT-1. IEEE Geosci. Remote Sens. Lett. 2019, 16, 1570–1574. [Google Scholar] [CrossRef]
- Jun, G.; Deng, Y.; Wang, R.; Wang, W.; Zhang, Y.; Long, Y.; Liang, D. Mitigating Range Ambiguities With Advanced Nonlinear Frequency Modulation Waveform. IEEE Geosci. Remote Sens. Lett. 2019, 16, 1230–1234. [Google Scholar] [CrossRef]
- Moreira, A.; Prats-Iraola, P.; Younis, M.; Krieger, G.; Hajnsek, I.; Papathanassiou, K.P. A tutorial on synthetic aperture radar. IEEE Geosci. Remote Sens. Mag. 2013, 1, 6–43. [Google Scholar] [CrossRef] [Green Version]
- Chua, M.Y.; Koo, V.C. FPGA-based chirp generator for high resolution UAV SAR. Prog. Electromagn. Res. 2009, 99, 71–88. [Google Scholar] [CrossRef] [Green Version]
- Tomiyasu, K. Tutorial review of synthetic-aperture radar (sar) with applications to imaging of the ocean surface. Proc. IEEE 1978, 66, 563–583. [Google Scholar] [CrossRef]
- Mostajeran, A.; Naghavi, S.M.H.; Emadi, M.; Samala, S.; Ginsburg, B.P.; Asseri, M.; Afshari, E. A high-resolution 220-GHz ultra-wideband fully integrated ISAR imaging system. IEEE Trans. Microw. Theory Technol. 2013, 67, 429–442. [Google Scholar] [CrossRef]
- Xia, J.; Ng, E.; Boumaiza, S. Wideband Compensation of RF vector multiplier for RF predistortion systems. IEEE Trans. Circuits Syst. II Exp. Briefs 2016, 63, 1084–1088. [Google Scholar] [CrossRef]
- Dunn, Z.; Yeary, M.; Fulton, C.; Goodman, N. Wideband digital predistortion of solid-state radar amplifiers. IEEE Trans. Aerosp. Electron. Syst. 2016, 52, 2452–2466. [Google Scholar] [CrossRef]
- An, J.H.; Jung, H.W.; Yang, H.I.; Ryu, S.B.; Lee, H.C.; Lee, S.G.; Yong, S.S.; Kim, J.H. Development of chirp signal generator for micro satellite on-board synthetic aperture radar. In Proceedings of the 2015 IEEE International Geoscience and Remote Sensing Symposium (IGARSS), Milan, Italy, 26–31 July 2015; pp. 3663–3666. [Google Scholar]
- Dunn, Z.; Yeary, M.; Fulton, C. Frequency-dependent power amplifier modeling and correction for distortion in wideband radar transmissions. In Proceedings of the 2014 IEEE 57th International Midwest Symposium on Circuits and Systems (MWSCAS), College Station, TX, USA, 3–6 August 2014; pp. 61–64. [Google Scholar]
- Aliparast, P. Design and implementation of a high efficiency RF power amplifier for S-band telemetry subsystems. Int. J. Electron. Commun. 2016, 70, 1311–1320. [Google Scholar] [CrossRef]
- Tripathi, G.C.; Rawat, M. RFin–RFout Linearizer System Design for Satellite Communication. IEEE Trans. Electron. Devices 2018, 65, 2378–2384. [Google Scholar] [CrossRef]
- Zhang, L.; Gao, Y.; Liu, X. Adaptive reconstruction for azimuth signal of multichannel HRWS SAR imaging system. EURASIP J. Adv. Signal Process. 2018, 2018, 1–19. [Google Scholar] [CrossRef]
- Liu, B.; He, Y.; Li, Y.; Duan, H.; Song, X. A new azimuth ambiguity suppression algorithm for surface current measurement in coastal waters and rivers with along-track InSAR. IEEE Trans. Geosci. Remote Sens. 2019, 57, 3148–3165. [Google Scholar] [CrossRef]
- Kim, K.R.; Kim, J.H. Experiment and Analysis of L-band SAR for target range detection. In Proceedings of the Symposium of the Korean institute of communications and information sciences, Gangwon-do, Korea, 17–19 January 2018; pp. 1270–1271. [Google Scholar]
- Kim, K.R.; Ryu, S.B.; Lee, H.C.; Lee, S.G.; Kim, J.H. Development and experiment of L-band SAR for ranging and imaging target. In Proceedings of the 2018 IEEE International Geoscience and Remote Sensing Symposium, Valencia, Spain, 22–27 July 2018; pp. 7821–7824. [Google Scholar]
Figure 1.
Block diagram of a digital chirp waveform generator. (a) Memory-map-based chirp waveform generator; (b) direct digital synthesizer (DDS)-based chirp waveform generator.
Figure 1.
Block diagram of a digital chirp waveform generator. (a) Memory-map-based chirp waveform generator; (b) direct digital synthesizer (DDS)-based chirp waveform generator.

Figure 2.
Block diagram for multi-DDS (MDDS). Each output is merged into a multiplexer (MUX).

Figure 3.
Phase error compensation block (compensation phase error, CPE).

Figure 4.
Pre-distortion process.

Figure 5.
Proposed hardware architecture. The waveform generator consisted of one field programmable gate array (FPGA), two digital analog convertors (DACs), a filter, etc. Xilinx ISE was used to code very-high-speed-integrated-circuits hardware description language (VHDL), and the program was uploaded to the FPGA using joint test action group (JTAG). A radio frequency (RF) modulator converted to intermediate frequency (IF). We used an additional local oscillator (LO) to up-convert the X-band.

Figure 6.
Developed MDDS waveform generator.

Figure 7.
Simulation results with phase error using conventional MDDS. (a) MDDS output signal; (b) phase value over time.
Figure 7.
Simulation results with phase error using conventional MDDS. (a) MDDS output signal; (b) phase value over time.

Figure 8.
Simulation results of MDDS with phase error compensation. (a) MDDS output signal; (b) phase value over time.
Figure 8.
Simulation results of MDDS with phase error compensation. (a) MDDS output signal; (b) phase value over time.

Figure 9.
Simulation results of MDDS with pre-distortion. (a) MDDS output signal; (b) phase value over time.
Figure 9.
Simulation results of MDDS with pre-distortion. (a) MDDS output signal; (b) phase value over time.

Figure 10.
Waveform generator output applying MDDS (a) before phase error compensation, (b) with phase error compensation, and (c) with pre-distortion.
Figure 10.
Waveform generator output applying MDDS (a) before phase error compensation, (b) with phase error compensation, and (c) with pre-distortion.

Figure 11.
The X-band (9.75 GHz) frequency spectrum (a) before phase error compensation, (b) with phase error compensation, and (c) with pre-distortion.
Figure 11.
The X-band (9.75 GHz) frequency spectrum (a) before phase error compensation, (b) with phase error compensation, and (c) with pre-distortion.

Figure 12.
Detailed measurement for phase error analysis. (a) Phase compensation waveform; (b) pre-distortion waveform in Figure 13f. Top left is the frequency spectrum at the X-band (9.75 GHz), middle left is the detailed pulse table, and bottom left illustrates acquisition time (pulse repetition interval was 576 µs). Upper right illustrates the frequency measurement over time from 9.5 to 10 GHz (bandwidth of 500 MHz), and lower right illustrates the phase error varying time (pulse width of 12 µs).

Figure 13.
Results of pre-distortion for each section.


Table 1.
Range of pre-distortion (PD) and analysis.
| Range | Minimum (degree) | Maximum (degree) | Mean (degree) | Variation (degree) | Standard Deviation (degree) | |
|---|---|---|---|---|---|---|
| (a) | No PD | −13.58 | 13.73 | −1.80 | 29.79 | 5.45 |
| (b) | 0–6 | −16.85 | 9.28 | −3.66 | 19.17 | 4.37 |
| (c) | 0–6 + 7–8 | −14.18 | 12.36 | −1.66 | 15.47 | 3.93 |
| (d) | 7–8 | −16.75 | 12.35 | −3.09 | 22.20 | 4.71 |
| (e) | 7–9 | −11.61 | 14.00 | 1.75 | 14.79 | 3.84 |
| (f) | 0–6 + 7–9 | −14.98 | 8.01 | −3.12 | 10.13 | 3.18 |
© 2020 by the authors. Licensee MDPI, Basel, Switzerland. This article is an open access article distributed under the terms and conditions of the Creative Commons Attribution (CC BY) license (http://creativecommons.org/licenses/by/4.0/).
Share and Cite
MDPI and ACS Style
Kim, K.-R.; Kim, J.-H. Wideband Waveform Generation Using MDDS and Phase Compensation for X-Band SAR. Remote Sens. 2020, 12, 1431. https://0-doi-org.brum.beds.ac.uk/10.3390/rs12091431
AMA Style
Kim K-R, Kim J-H. Wideband Waveform Generation Using MDDS and Phase Compensation for X-Band SAR. Remote Sensing. 2020; 12(9):1431. https://0-doi-org.brum.beds.ac.uk/10.3390/rs12091431
Chicago/Turabian StyleKim, Kyeong-Rok, and Jae-Hyun Kim. 2020. "Wideband Waveform Generation Using MDDS and Phase Compensation for X-Band SAR" Remote Sensing 12, no. 9: 1431. https://0-doi-org.brum.beds.ac.uk/10.3390/rs12091431
Note that from the first issue of 2016, this journal uses article numbers instead of page numbers. See further details here.